Meredith, NH Map & Demographics
Meredith Map
Meredith Overview
$36,997
PER CAPITA INCOME
$82,727
AVG FAMILY INCOME
$46,850
AVG HOUSEHOLD INCOME
17.1%
WAGE / INCOME GAP [ % ]
82.9¢/ $1
WAGE / INCOME GAP [ $ ]
0.46
INEQUALITY / GINI INDEX
2,758
TOTAL POPULATION
1,488
MALE POPULATION
1,270
FEMALE POPULATION
117.17
MALES / 100 FEMALES
85.35
FEMALES / 100 MALES
50.8
MEDIAN AGE
3.0
AVG FAMILY SIZE
2.1
AVG HOUSEHOLD SIZE
1,252
LABOR FORCE [ PEOPLE ]
52.2%
PERCENT IN LABOR FORCE
6.5%
UNEMPLOYMENT RATE
Meredith Zip Codes
Meredith Area Codes
Income in Meredith
Income Overview in Meredith
Per Capita Income in Meredith is $36,997, while median incomes of families and households are $82,727 and $46,850 respectively.
| Characteristic | Number | Measure |
| Per Capita Income | 2,758 | $36,997 |
| Median Family Income | 612 | $82,727 |
| Mean Family Income | 612 | $105,527 |
| Median Household Income | 1,319 | $46,850 |
| Mean Household Income | 1,319 | $75,763 |
| Income Deficit | 612 | $0 |
| Wage / Income Gap (%) | 2,758 | 17.06% |
| Wage / Income Gap ($) | 2,758 | 82.94¢ per $1 |
| Gini / Inequality Index | 2,758 | 0.46 |
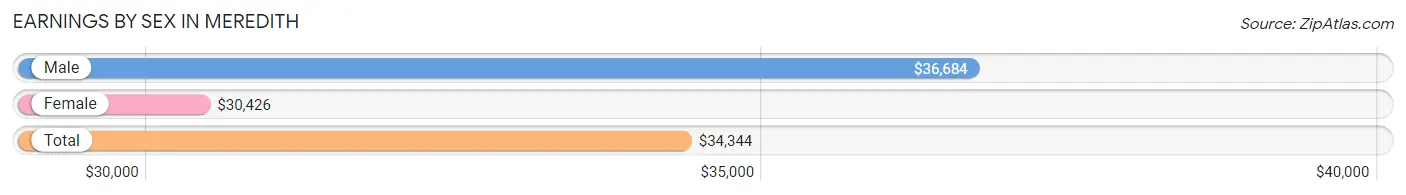
Earnings by Sex in Meredith
Average Earnings in Meredith are $34,344, $36,684 for men and $30,426 for women, a difference of 17.1%.
| Sex | Number | Average Earnings |
| Male | 790 (56.9%) | $36,684 |
| Female | 599 (43.1%) | $30,426 |
| Total | 1,389 (100.0%) | $34,344 |
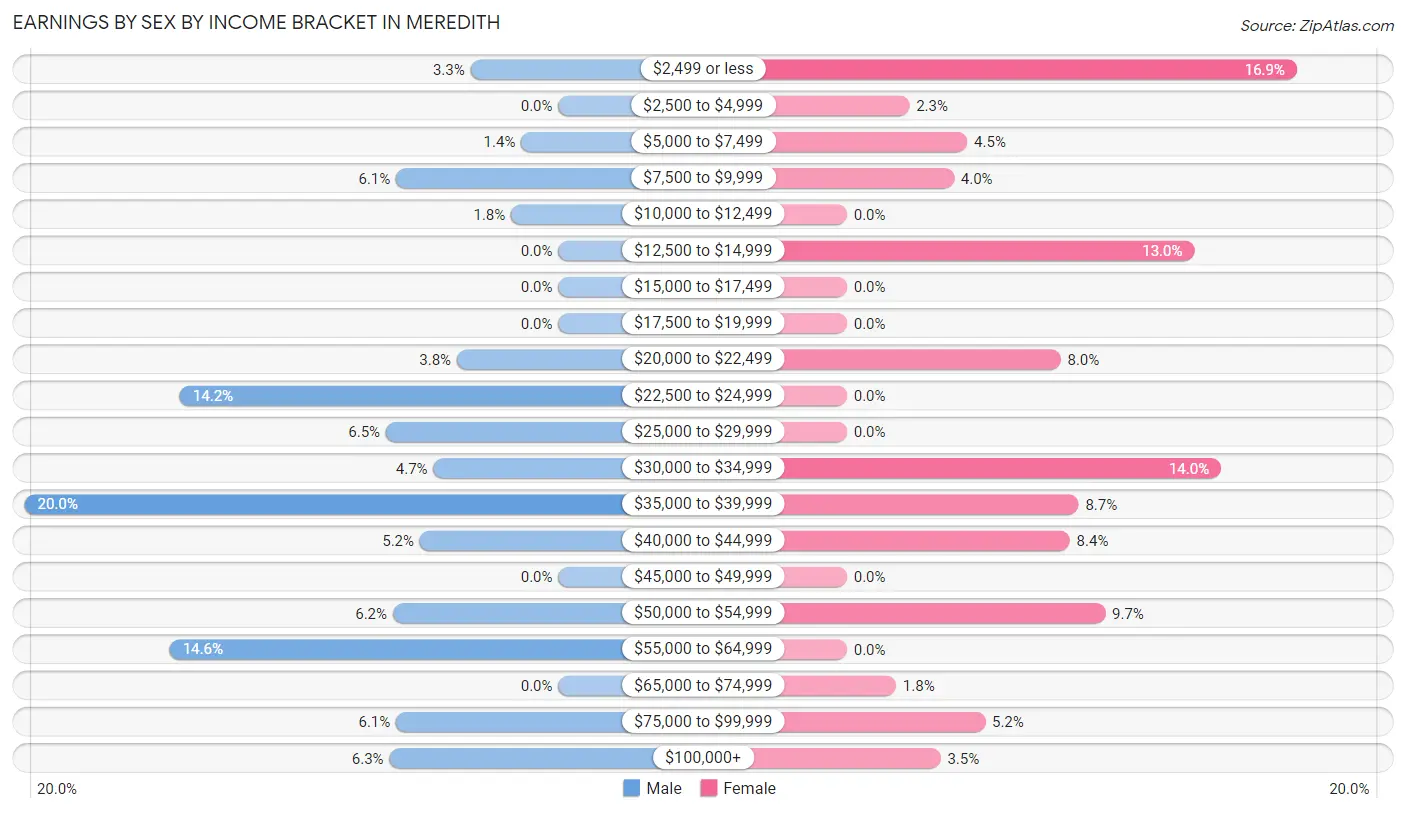
Earnings by Sex by Income Bracket in Meredith
The most common earnings brackets in Meredith are $35,000 to $39,999 for men (158 | 20.0%) and $2,499 or less for women (101 | 16.9%).
| Income | Male | Female |
| $2,499 or less | 26 (3.3%) | 101 (16.9%) |
| $2,500 to $4,999 | 0 (0.0%) | 14 (2.3%) |
| $5,000 to $7,499 | 11 (1.4%) | 27 (4.5%) |
| $7,500 to $9,999 | 48 (6.1%) | 24 (4.0%) |
| $10,000 to $12,499 | 14 (1.8%) | 0 (0.0%) |
| $12,500 to $14,999 | 0 (0.0%) | 78 (13.0%) |
| $15,000 to $17,499 | 0 (0.0%) | 0 (0.0%) |
| $17,500 to $19,999 | 0 (0.0%) | 0 (0.0%) |
| $20,000 to $22,499 | 30 (3.8%) | 48 (8.0%) |
| $22,500 to $24,999 | 112 (14.2%) | 0 (0.0%) |
| $25,000 to $29,999 | 51 (6.5%) | 0 (0.0%) |
| $30,000 to $34,999 | 37 (4.7%) | 84 (14.0%) |
| $35,000 to $39,999 | 158 (20.0%) | 52 (8.7%) |
| $40,000 to $44,999 | 41 (5.2%) | 50 (8.4%) |
| $45,000 to $49,999 | 0 (0.0%) | 0 (0.0%) |
| $50,000 to $54,999 | 49 (6.2%) | 58 (9.7%) |
| $55,000 to $64,999 | 115 (14.6%) | 0 (0.0%) |
| $65,000 to $74,999 | 0 (0.0%) | 11 (1.8%) |
| $75,000 to $99,999 | 48 (6.1%) | 31 (5.2%) |
| $100,000+ | 50 (6.3%) | 21 (3.5%) |
| Total | 790 (100.0%) | 599 (100.0%) |
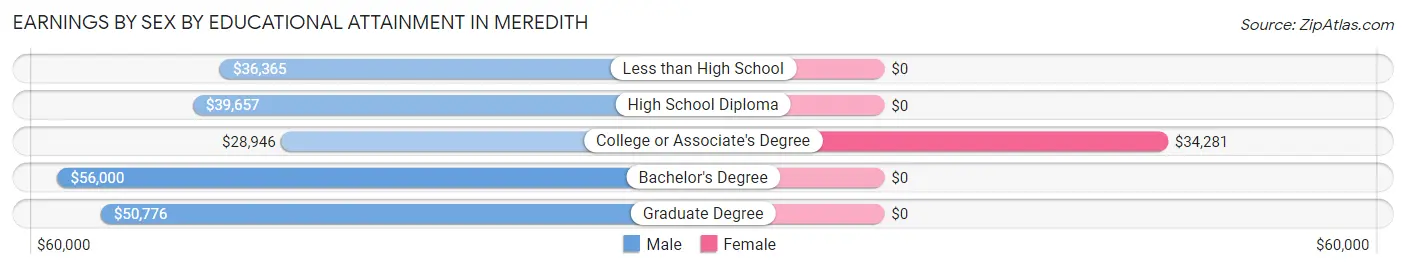
Earnings by Sex by Educational Attainment in Meredith
Average earnings in Meredith are $39,208 for men and $36,394 for women, a difference of 7.2%. Men with an educational attainment of bachelor's degree enjoy the highest average annual earnings of $56,000, while those with college or associate's degree education earn the least with $28,946. Women with an educational attainment of college or associate's degree earn the most with the average annual earnings of $34,281, while those with college or associate's degree education have the smallest earnings of $34,281.
| Educational Attainment | Male Income | Female Income |
| Less than High School | $36,365 | $0 |
| High School Diploma | $39,657 | $0 |
| College or Associate's Degree | $28,946 | $34,281 |
| Bachelor's Degree | $56,000 | $0 |
| Graduate Degree | $50,776 | $0 |
| Total | $39,208 | $36,394 |
Family Income in Meredith
Family Income Brackets in Meredith
According to the Meredith family income data, there are 142 families falling into the $50,000 to $74,999 income range, which is the most common income bracket and makes up 23.2% of all families.
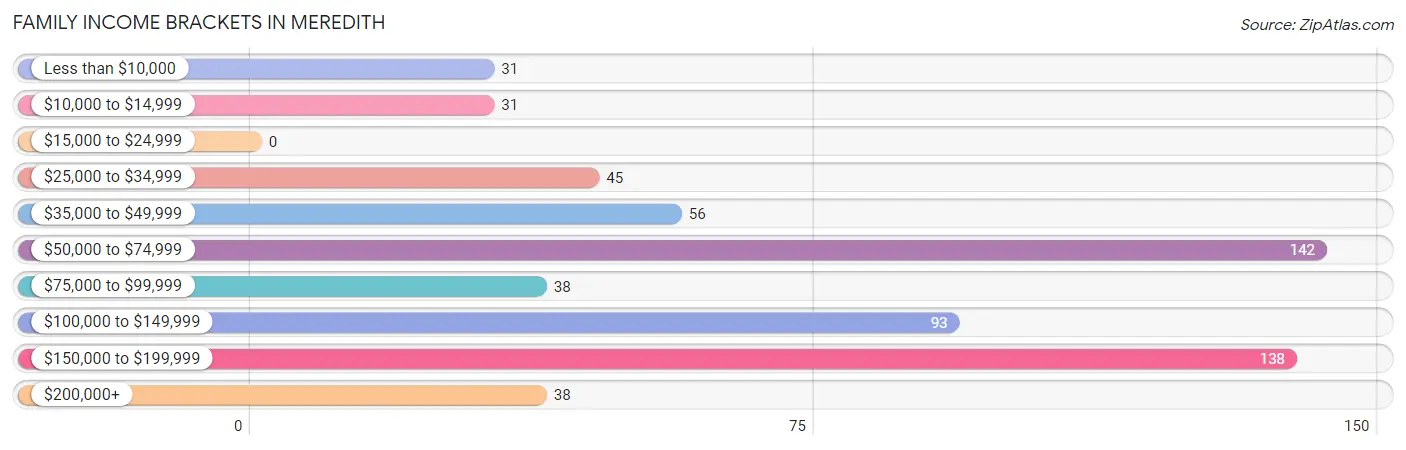
| Income Bracket | # Families | % Families |
| Less than $10,000 | 31 | 5.1% |
| $10,000 to $14,999 | 31 | 5.1% |
| $15,000 to $24,999 | 0 | 0.0% |
| $25,000 to $34,999 | 45 | 7.4% |
| $35,000 to $49,999 | 56 | 9.2% |
| $50,000 to $74,999 | 142 | 23.2% |
| $75,000 to $99,999 | 38 | 6.2% |
| $100,000 to $149,999 | 93 | 15.2% |
| $150,000 to $199,999 | 138 | 22.5% |
| $200,000+ | 38 | 6.2% |
Family Income by Famaliy Size in Meredith
3-person families (122 | 19.9%) account for the highest median family income in Meredith with $100,114 per family, while 2-person families (358 | 58.5%) have the highest median income of $33,604 per family member.
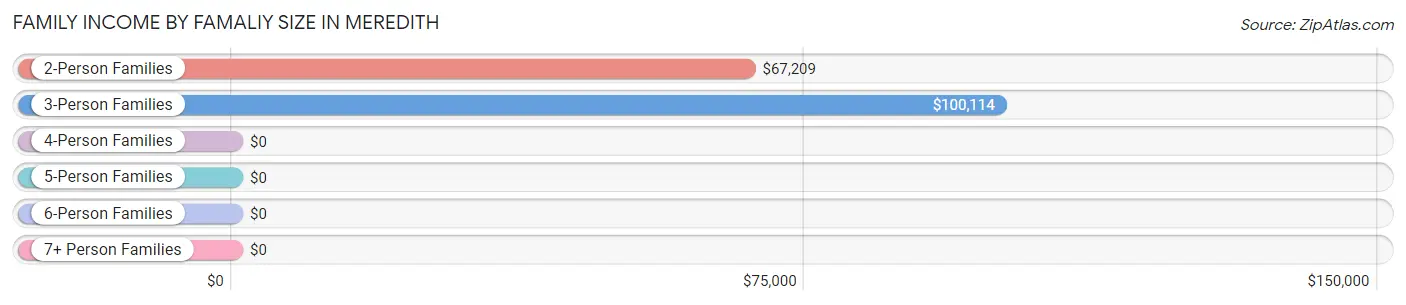
| Income Bracket | # Families | Median Income |
| 2-Person Families | 358 (58.5%) | $67,209 |
| 3-Person Families | 122 (19.9%) | $100,114 |
| 4-Person Families | 70 (11.4%) | $0 |
| 5-Person Families | 27 (4.4%) | $0 |
| 6-Person Families | 35 (5.7%) | $0 |
| 7+ Person Families | 0 (0.0%) | $0 |
| Total | 612 (100.0%) | $82,727 |
Family Income by Number of Earners in Meredith
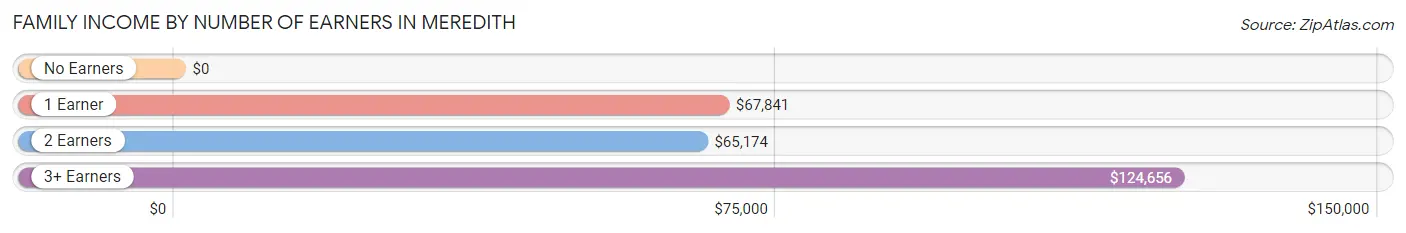
| Number of Earners | # Families | Median Income |
| No Earners | 164 (26.8%) | $0 |
| 1 Earner | 171 (27.9%) | $67,841 |
| 2 Earners | 142 (23.2%) | $65,174 |
| 3+ Earners | 135 (22.1%) | $124,656 |
| Total | 612 (100.0%) | $82,727 |
Household Income in Meredith
Household Income Brackets in Meredith
With 262 households falling in the category, the $35,000 to $49,999 income range is the most frequent in Meredith, accounting for 19.9% of all households. In contrast, only 20 households (1.5%) fall into the less than $10,000 income bracket, making it the least populous group.
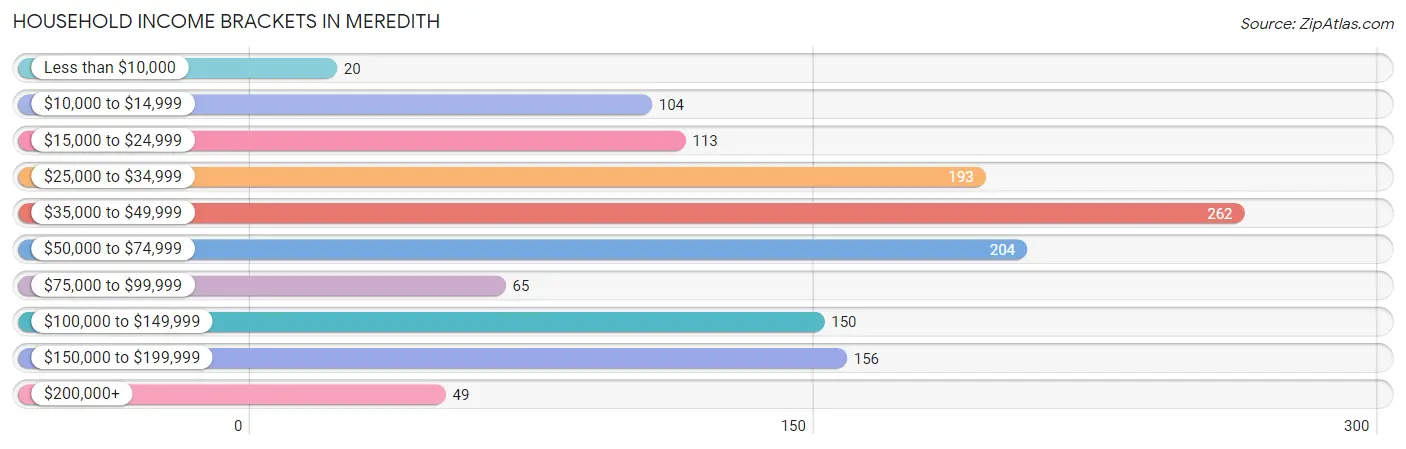
| Income Bracket | # Households | % Households |
| Less than $10,000 | 20 | 1.5% |
| $10,000 to $14,999 | 104 | 7.9% |
| $15,000 to $24,999 | 113 | 8.6% |
| $25,000 to $34,999 | 193 | 14.6% |
| $35,000 to $49,999 | 262 | 19.9% |
| $50,000 to $74,999 | 204 | 15.5% |
| $75,000 to $99,999 | 65 | 4.9% |
| $100,000 to $149,999 | 150 | 11.4% |
| $150,000 to $199,999 | 156 | 11.8% |
| $200,000+ | 49 | 3.7% |
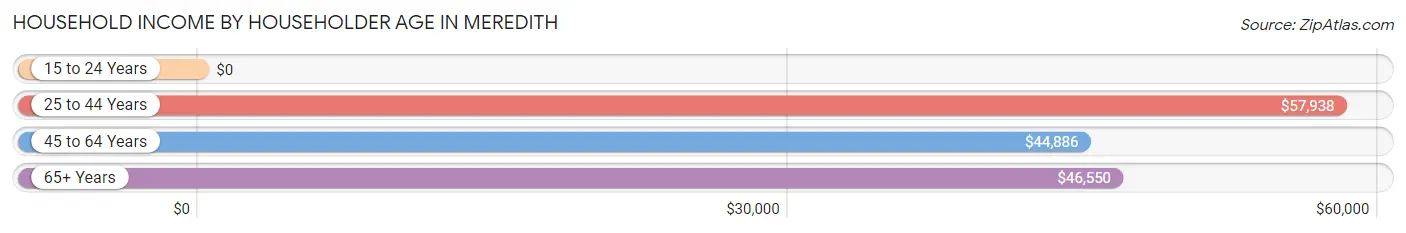
Household Income by Householder Age in Meredith
The median household income in Meredith is $46,850, with the highest median household income of $57,938 found in the 25 to 44 years age bracket for the primary householder. A total of 283 households (21.5%) fall into this category.
| Income Bracket | # Households | Median Income |
| 15 to 24 Years | 0 (0.0%) | $0 |
| 25 to 44 Years | 283 (21.5%) | $57,938 |
| 45 to 64 Years | 489 (37.1%) | $44,886 |
| 65+ Years | 547 (41.5%) | $46,550 |
| Total | 1,319 (100.0%) | $46,850 |
Poverty in Meredith
Income Below Poverty by Sex and Age in Meredith
With 12.3% poverty level for males and 10.9% for females among the residents of Meredith, 6 to 11 year old males and 6 to 11 year old females are the most vulnerable to poverty, with 38 males (86.4%) and 27 females (42.2%) in their respective age groups living below the poverty level.
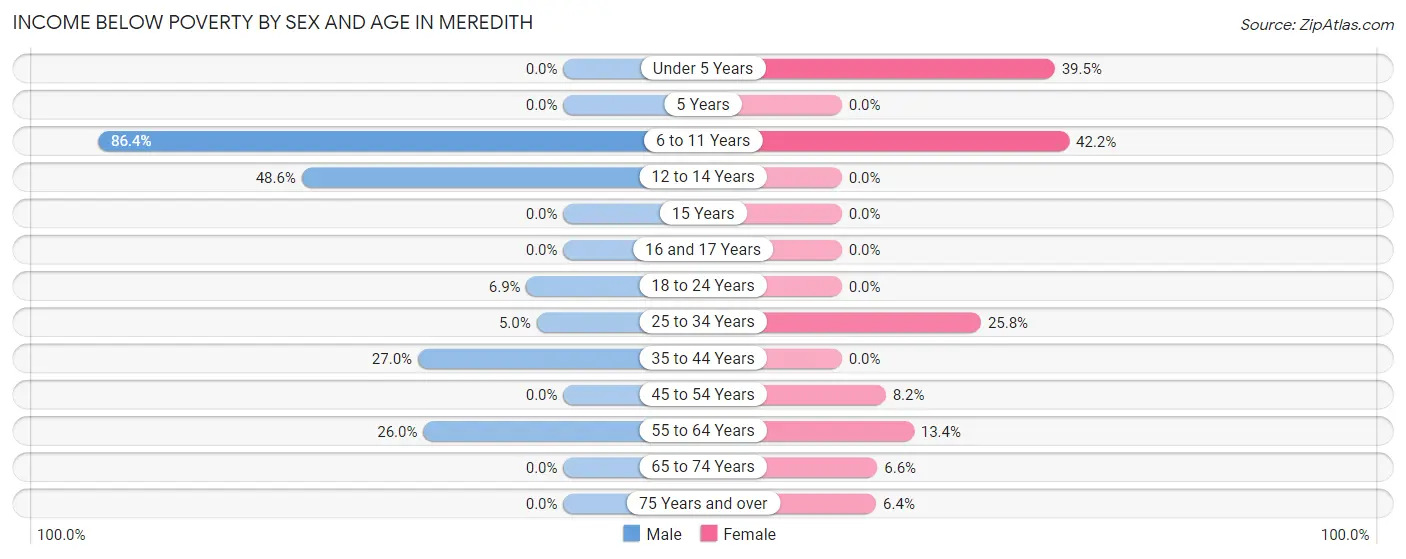
| Age Bracket | Male | Female |
| Under 5 Years | 0 (0.0%) | 17 (39.5%) |
| 5 Years | 0 (0.0%) | 0 (0.0%) |
| 6 to 11 Years | 38 (86.4%) | 27 (42.2%) |
| 12 to 14 Years | 17 (48.6%) | 0 (0.0%) |
| 15 Years | 0 (0.0%) | 0 (0.0%) |
| 16 and 17 Years | 0 (0.0%) | 0 (0.0%) |
| 18 to 24 Years | 10 (6.9%) | 0 (0.0%) |
| 25 to 34 Years | 12 (5.0%) | 31 (25.8%) |
| 35 to 44 Years | 27 (27.0%) | 0 (0.0%) |
| 45 to 54 Years | 0 (0.0%) | 15 (8.2%) |
| 55 to 64 Years | 78 (26.0%) | 23 (13.4%) |
| 65 to 74 Years | 0 (0.0%) | 13 (6.6%) |
| 75 Years and over | 0 (0.0%) | 9 (6.4%) |
| Total | 182 (12.3%) | 135 (10.9%) |
Income Above Poverty by Sex and Age in Meredith
According to the poverty statistics in Meredith, males aged 5 years and females aged 12 to 14 years are the age groups that are most secure financially, with 100.0% of males and 100.0% of females in these age groups living above the poverty line.
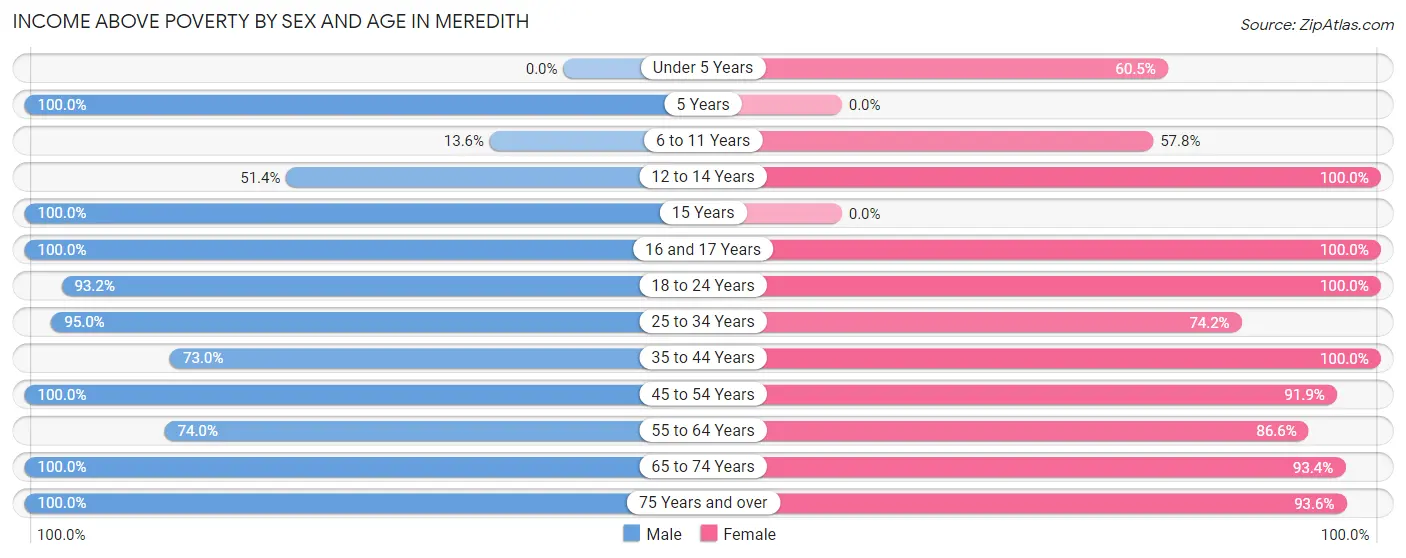
| Age Bracket | Male | Female |
| Under 5 Years | 0 (0.0%) | 26 (60.5%) |
| 5 Years | 23 (100.0%) | 0 (0.0%) |
| 6 to 11 Years | 6 (13.6%) | 37 (57.8%) |
| 12 to 14 Years | 18 (51.4%) | 72 (100.0%) |
| 15 Years | 78 (100.0%) | 0 (0.0%) |
| 16 and 17 Years | 15 (100.0%) | 66 (100.0%) |
| 18 to 24 Years | 136 (93.1%) | 155 (100.0%) |
| 25 to 34 Years | 229 (95.0%) | 89 (74.2%) |
| 35 to 44 Years | 73 (73.0%) | 29 (100.0%) |
| 45 to 54 Years | 85 (100.0%) | 169 (91.8%) |
| 55 to 64 Years | 222 (74.0%) | 149 (86.6%) |
| 65 to 74 Years | 217 (100.0%) | 184 (93.4%) |
| 75 Years and over | 190 (100.0%) | 132 (93.6%) |
| Total | 1,292 (87.6%) | 1,108 (89.1%) |
Income Below Poverty Among Married-Couple Families in Meredith
The poverty statistics for married-couple families in Meredith show that 2.4% or 11 of the total 465 families live below the poverty line. Families with no children have the highest poverty rate of 3.1%, comprising of 11 families. On the other hand, families with 1 or 2 children have the lowest poverty rate of 0.0%, which includes 0 families.
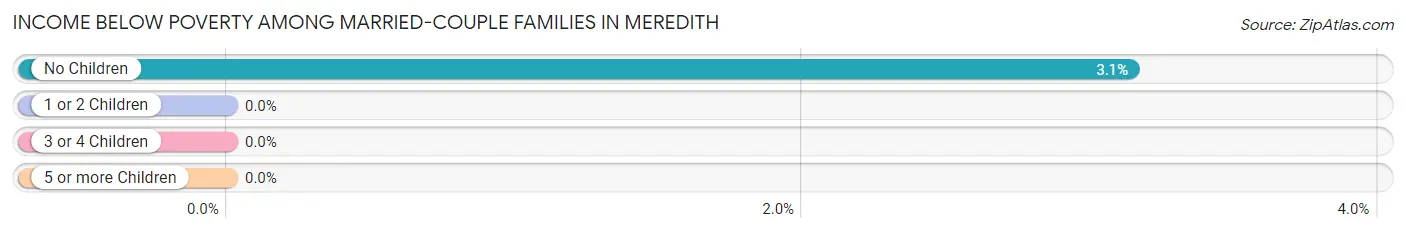
| Children | Above Poverty | Below Poverty |
| No Children | 339 (96.9%) | 11 (3.1%) |
| 1 or 2 Children | 115 (100.0%) | 0 (0.0%) |
| 3 or 4 Children | 0 (0.0%) | 0 (0.0%) |
| 5 or more Children | 0 (0.0%) | 0 (0.0%) |
| Total | 454 (97.6%) | 11 (2.4%) |
Income Below Poverty Among Single-Parent Households in Meredith
According to the poverty data in Meredith, 23.2% or 16 single-father households and 44.9% or 35 single-mother households are living below the poverty line. Among single-father households, those with 1 or 2 children have the highest poverty rate, with 16 households (23.2%) experiencing poverty. Likewise, among single-mother households, those with 3 or 4 children have the highest poverty rate, with 20 households (100.0%) falling below the poverty line.
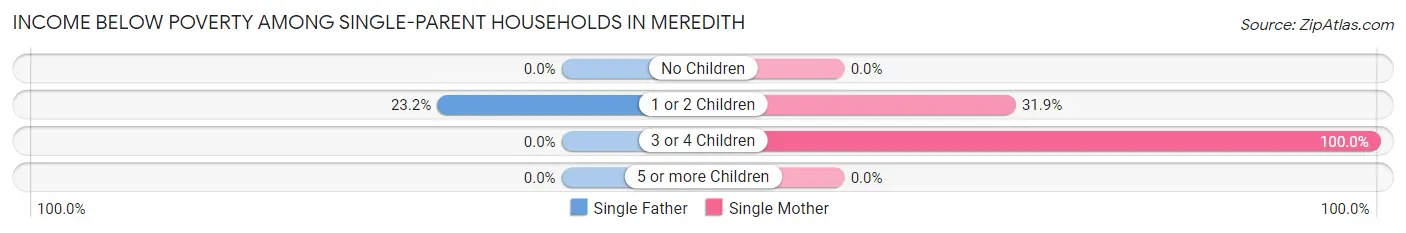
| Children | Single Father | Single Mother |
| No Children | 0 (0.0%) | 0 (0.0%) |
| 1 or 2 Children | 16 (23.2%) | 15 (31.9%) |
| 3 or 4 Children | 0 (0.0%) | 20 (100.0%) |
| 5 or more Children | 0 (0.0%) | 0 (0.0%) |
| Total | 16 (23.2%) | 35 (44.9%) |
Income Below Poverty Among Married-Couple vs Single-Parent Households in Meredith
The poverty data for Meredith shows that 11 of the married-couple family households (2.4%) and 51 of the single-parent households (34.7%) are living below the poverty level. Within the married-couple family households, those with no children have the highest poverty rate, with 11 households (3.1%) falling below the poverty line. Among the single-parent households, those with 3 or 4 children have the highest poverty rate, with 20 household (100.0%) living below poverty.
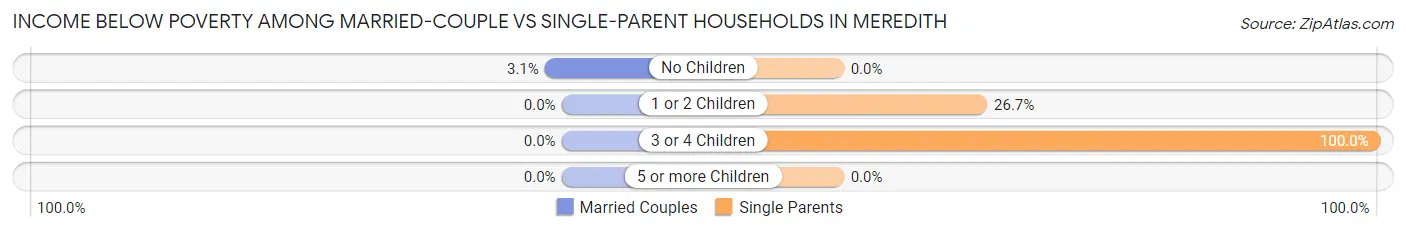
| Children | Married-Couple Families | Single-Parent Households |
| No Children | 11 (3.1%) | 0 (0.0%) |
| 1 or 2 Children | 0 (0.0%) | 31 (26.7%) |
| 3 or 4 Children | 0 (0.0%) | 20 (100.0%) |
| 5 or more Children | 0 (0.0%) | 0 (0.0%) |
| Total | 11 (2.4%) | 51 (34.7%) |
Race in Meredith
The most populous races in Meredith are White / Caucasian (2,728 | 98.9%), Hispanic or Latino (30 | 1.1%), and Native / Alaskan (20 | 0.7%).
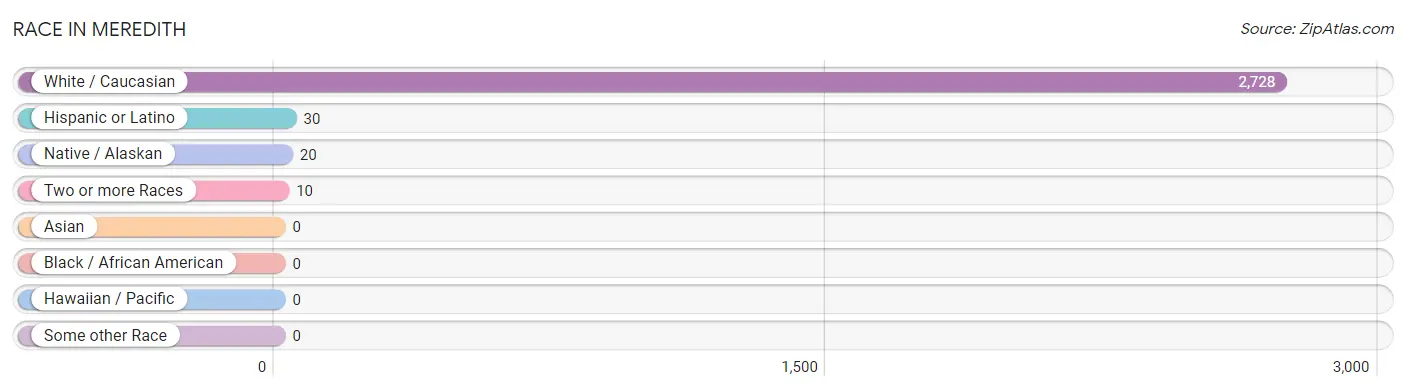
| Race | # Population | % Population |
| Asian | 0 | 0.0% |
| Black / African American | 0 | 0.0% |
| Hawaiian / Pacific | 0 | 0.0% |
| Hispanic or Latino | 30 | 1.1% |
| Native / Alaskan | 20 | 0.7% |
| White / Caucasian | 2,728 | 98.9% |
| Two or more Races | 10 | 0.4% |
| Some other Race | 0 | 0.0% |
| Total | 2,758 | 100.0% |
Ancestry in Meredith
The most populous ancestries reported in Meredith are Irish (866 | 31.4%), English (516 | 18.7%), Italian (391 | 14.2%), German (360 | 13.1%), and French Canadian (245 | 8.9%), together accounting for 86.2% of all Meredith residents.
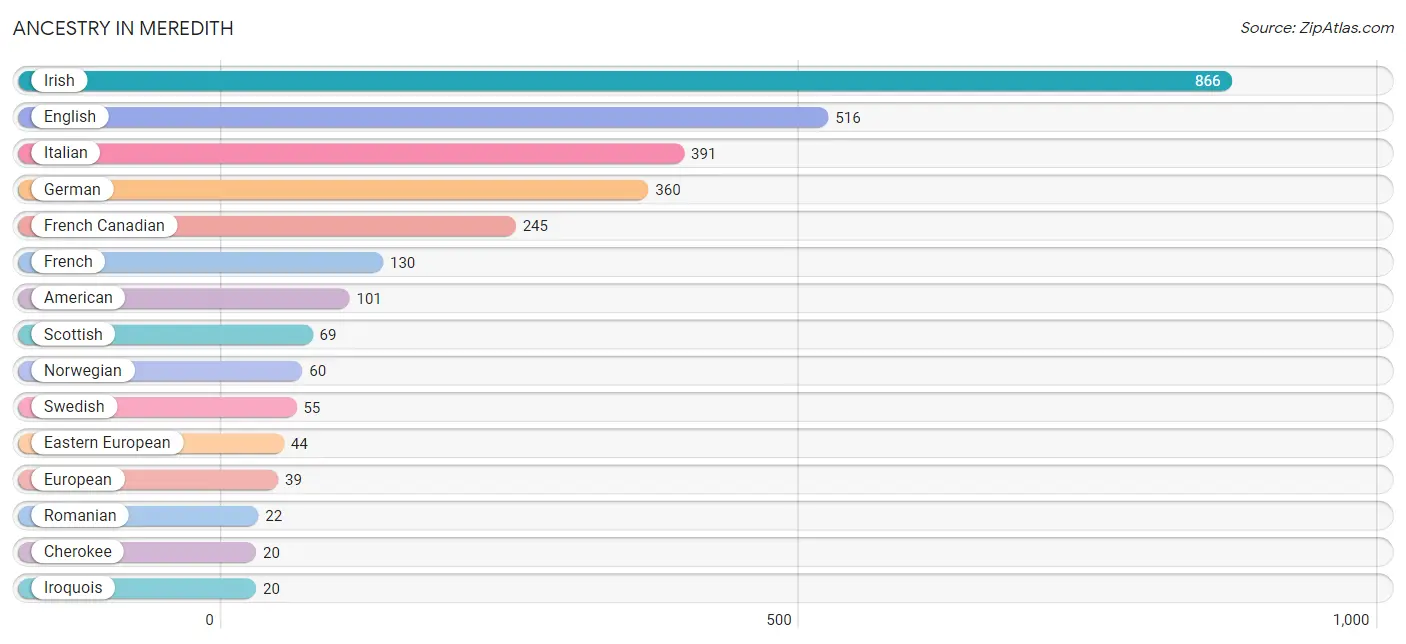
| Ancestry | # Population | % Population |
| American | 101 | 3.7% |
| Arab | 11 | 0.4% |
| Armenian | 9 | 0.3% |
| Canadian | 11 | 0.4% |
| Cherokee | 20 | 0.7% |
| Dutch | 10 | 0.4% |
| Eastern European | 44 | 1.6% |
| English | 516 | 18.7% |
| European | 39 | 1.4% |
| French | 130 | 4.7% |
| French Canadian | 245 | 8.9% |
| German | 360 | 13.1% |
| Irish | 866 | 31.4% |
| Iroquois | 20 | 0.7% |
| Italian | 391 | 14.2% |
| Korean | 6 | 0.2% |
| Lebanese | 11 | 0.4% |
| Mexican | 20 | 0.7% |
| Norwegian | 60 | 2.2% |
| Polish | 9 | 0.3% |
| Romanian | 22 | 0.8% |
| Russian | 11 | 0.4% |
| Scottish | 69 | 2.5% |
| Spaniard | 10 | 0.4% |
| Swedish | 55 | 2.0% | View All 25 Rows |
Immigrants in Meredith
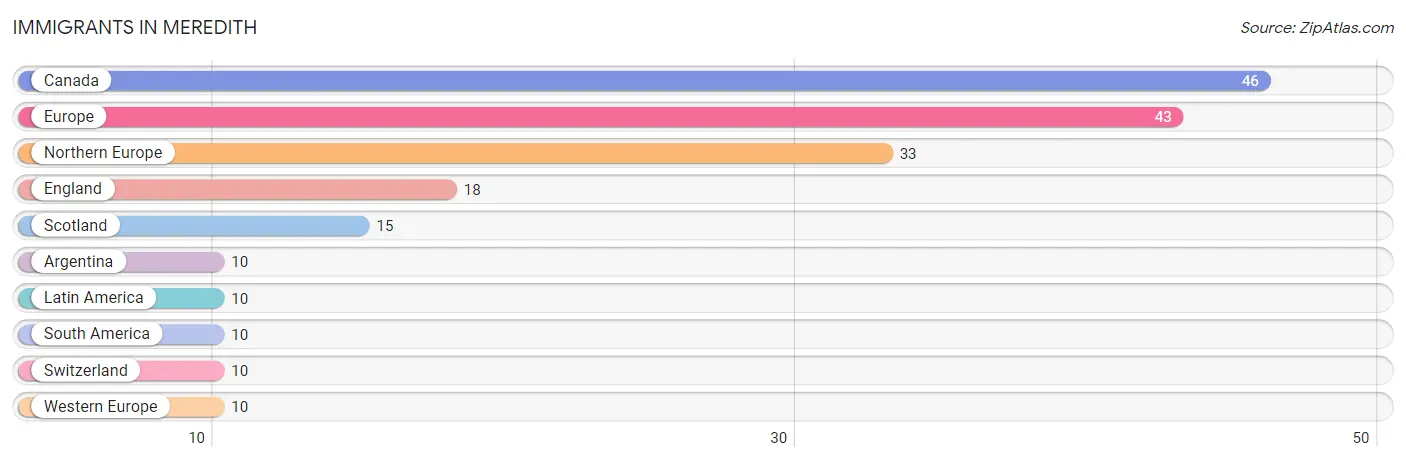
The most numerous immigrant groups reported in Meredith came from Canada (46 | 1.7%), Europe (43 | 1.6%), Northern Europe (33 | 1.2%), England (18 | 0.6%), and Scotland (15 | 0.5%), together accounting for 5.6% of all Meredith residents.
| Immigration Origin | # Population | % Population |
| Argentina | 10 | 0.4% |
| Canada | 46 | 1.7% |
| England | 18 | 0.6% |
| Europe | 43 | 1.6% |
| Latin America | 10 | 0.4% |
| Northern Europe | 33 | 1.2% |
| Scotland | 15 | 0.5% |
| South America | 10 | 0.4% |
| Switzerland | 10 | 0.4% |
| Western Europe | 10 | 0.4% | View All 10 Rows |
Sex and Age in Meredith
Sex and Age in Meredith
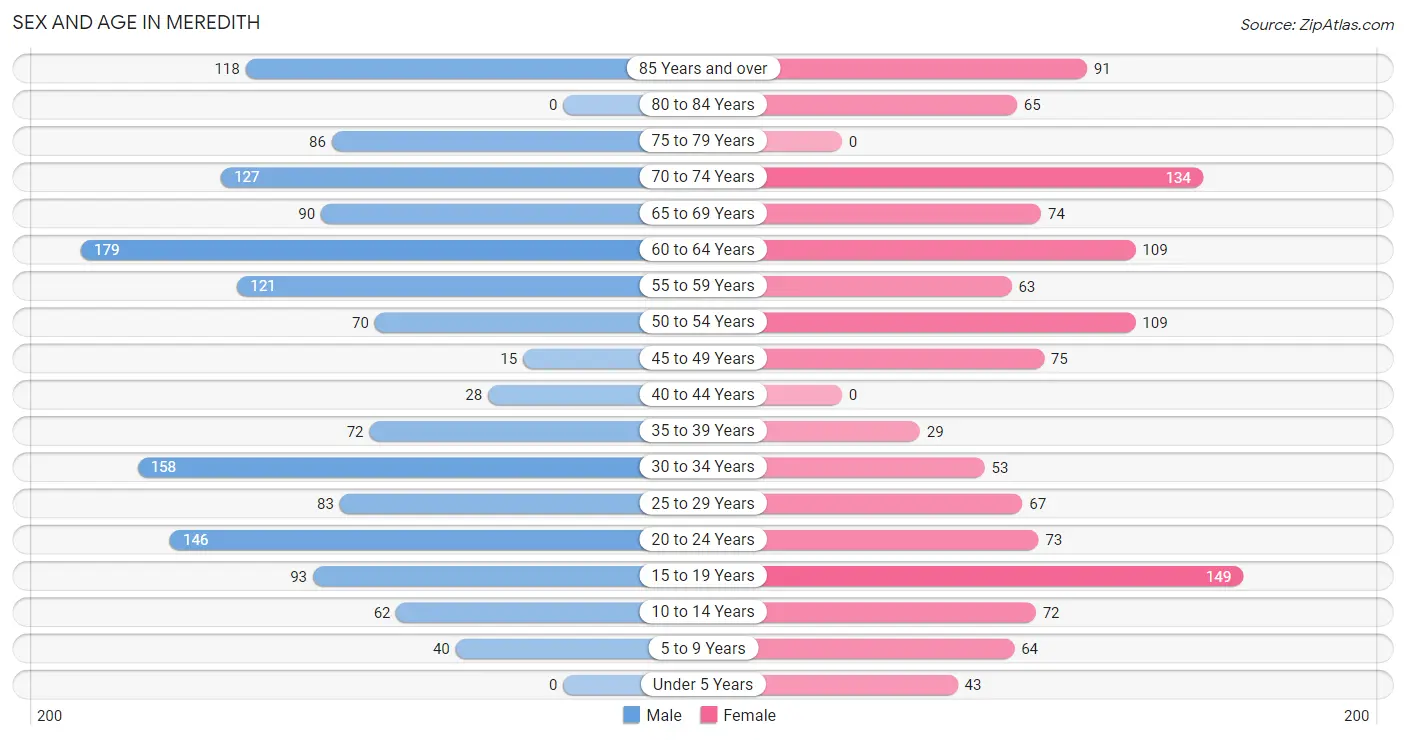
The most populous age groups in Meredith are 60 to 64 Years (179 | 12.0%) for men and 15 to 19 Years (149 | 11.7%) for women.
| Age Bracket | Male | Female |
| Under 5 Years | 0 (0.0%) | 43 (3.4%) |
| 5 to 9 Years | 40 (2.7%) | 64 (5.0%) |
| 10 to 14 Years | 62 (4.2%) | 72 (5.7%) |
| 15 to 19 Years | 93 (6.2%) | 149 (11.7%) |
| 20 to 24 Years | 146 (9.8%) | 73 (5.8%) |
| 25 to 29 Years | 83 (5.6%) | 67 (5.3%) |
| 30 to 34 Years | 158 (10.6%) | 53 (4.2%) |
| 35 to 39 Years | 72 (4.8%) | 29 (2.3%) |
| 40 to 44 Years | 28 (1.9%) | 0 (0.0%) |
| 45 to 49 Years | 15 (1.0%) | 75 (5.9%) |
| 50 to 54 Years | 70 (4.7%) | 109 (8.6%) |
| 55 to 59 Years | 121 (8.1%) | 63 (5.0%) |
| 60 to 64 Years | 179 (12.0%) | 109 (8.6%) |
| 65 to 69 Years | 90 (6.0%) | 74 (5.8%) |
| 70 to 74 Years | 127 (8.5%) | 134 (10.5%) |
| 75 to 79 Years | 86 (5.8%) | 0 (0.0%) |
| 80 to 84 Years | 0 (0.0%) | 65 (5.1%) |
| 85 Years and over | 118 (7.9%) | 91 (7.2%) |
| Total | 1,488 (100.0%) | 1,270 (100.0%) |
Families and Households in Meredith
Median Family Size in Meredith
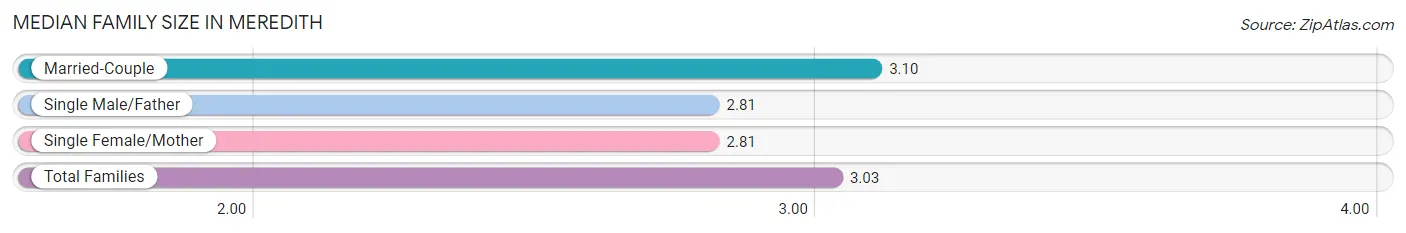
The median family size in Meredith is 3.03 persons per family, with married-couple families (465 | 76.0%) accounting for the largest median family size of 3.1 persons per family. On the other hand, single male/father families (69 | 11.3%) represent the smallest median family size with 2.81 persons per family.
| Family Type | # Families | Family Size |
| Married-Couple | 465 (76.0%) | 3.10 |
| Single Male/Father | 69 (11.3%) | 2.81 |
| Single Female/Mother | 78 (12.8%) | 2.81 |
| Total Families | 612 (100.0%) | 3.03 |
Median Household Size in Meredith
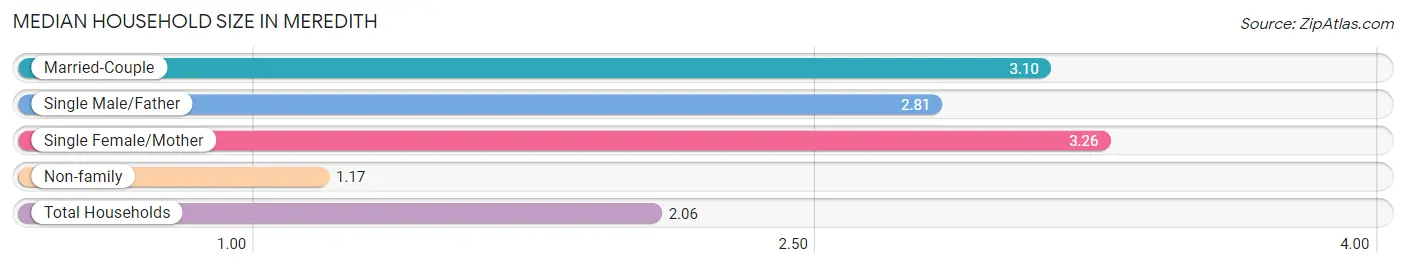
The median household size in Meredith is 2.06 persons per household, with single female/mother households (78 | 5.9%) accounting for the largest median household size of 3.26 persons per household. non-family households (707 | 53.6%) represent the smallest median household size with 1.17 persons per household.
| Household Type | # Households | Household Size |
| Married-Couple | 465 (35.2%) | 3.10 |
| Single Male/Father | 69 (5.2%) | 2.81 |
| Single Female/Mother | 78 (5.9%) | 3.26 |
| Non-family | 707 (53.6%) | 1.17 |
| Total Households | 1,319 (100.0%) | 2.06 |
Household Size by Marriage Status in Meredith
Out of a total of 1,319 households in Meredith, 612 (46.4%) are family households, while 707 (53.6%) are nonfamily households. The most numerous type of family households are 2-person households, comprising 347, and the most common type of nonfamily households are 1-person households, comprising 623.
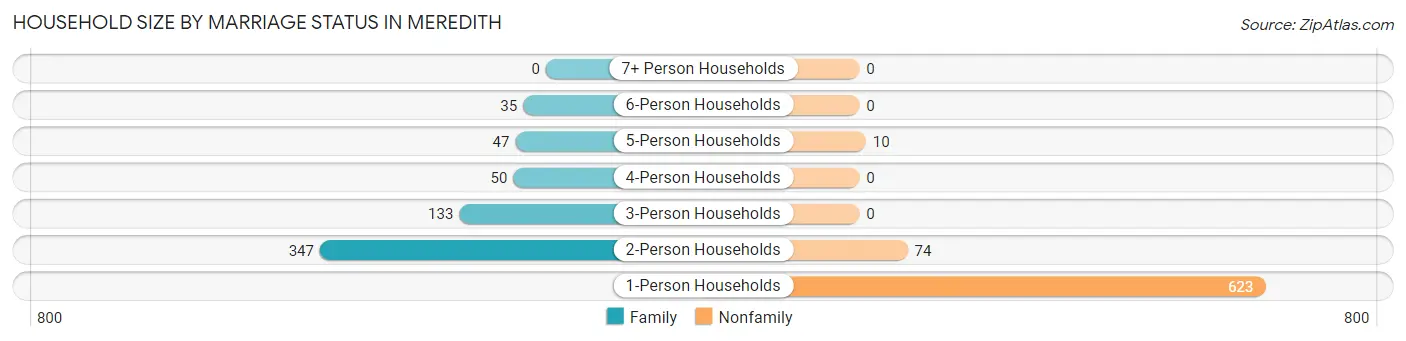
| Household Size | Family Households | Nonfamily Households |
| 1-Person Households | - | 623 (47.2%) |
| 2-Person Households | 347 (26.3%) | 74 (5.6%) |
| 3-Person Households | 133 (10.1%) | 0 (0.0%) |
| 4-Person Households | 50 (3.8%) | 0 (0.0%) |
| 5-Person Households | 47 (3.6%) | 10 (0.8%) |
| 6-Person Households | 35 (2.6%) | 0 (0.0%) |
| 7+ Person Households | 0 (0.0%) | 0 (0.0%) |
| Total | 612 (46.4%) | 707 (53.6%) |
Female Fertility in Meredith
Fertility by Age in Meredith
| Age Bracket | Women with Births | Births / 1,000 Women |
| 15 to 19 years | 0 (0.0%) | 0.0 |
| 20 to 34 years | 0 (0.0%) | 0.0 |
| 35 to 50 years | 0 (0.0%) | 0.0 |
| Total | 0 (0.0%) | 0.0 |
Fertility by Age by Marriage Status in Meredith
| Age Bracket | Married | Unmarried |
| 15 to 19 years | 0 (0.0%) | 0 (0.0%) |
| 20 to 34 years | 0 (0.0%) | 0 (0.0%) |
| 35 to 50 years | 0 (0.0%) | 0 (0.0%) |
| Total | 0 (0.0%) | 0 (0.0%) |
Fertility by Education in Meredith
| Educational Attainment | Women with Births | Births / 1,000 Women |
| Less than High School | 0 (0.0%) | 0.0 |
| High School Diploma | 0 (0.0%) | 0.0 |
| College or Associate's Degree | 0 (0.0%) | 0.0 |
| Bachelor's Degree | 0 (0.0%) | 0.0 |
| Graduate Degree | 0 (0.0%) | 0.0 |
| Total | 0 (0.0%) | 0.0 |
Fertility by Education by Marriage Status in Meredith
| Educational Attainment | Married | Unmarried |
| Less than High School | 0 (0.0%) | 0 (0.0%) |
| High School Diploma | 0 (0.0%) | 0 (0.0%) |
| College or Associate's Degree | 0 (0.0%) | 0 (0.0%) |
| Bachelor's Degree | 0 (0.0%) | 0 (0.0%) |
| Graduate Degree | 0 (0.0%) | 0 (0.0%) |
| Total | 0 (0.0%) | 0 (0.0%) |
Employment Characteristics in Meredith
Employment by Class of Employer in Meredith
Among the 1,158 employed individuals in Meredith, private company employees (626 | 54.1%), local government employees (191 | 16.5%), and not-for-profit organizations (123 | 10.6%) make up the most common classes of employment.
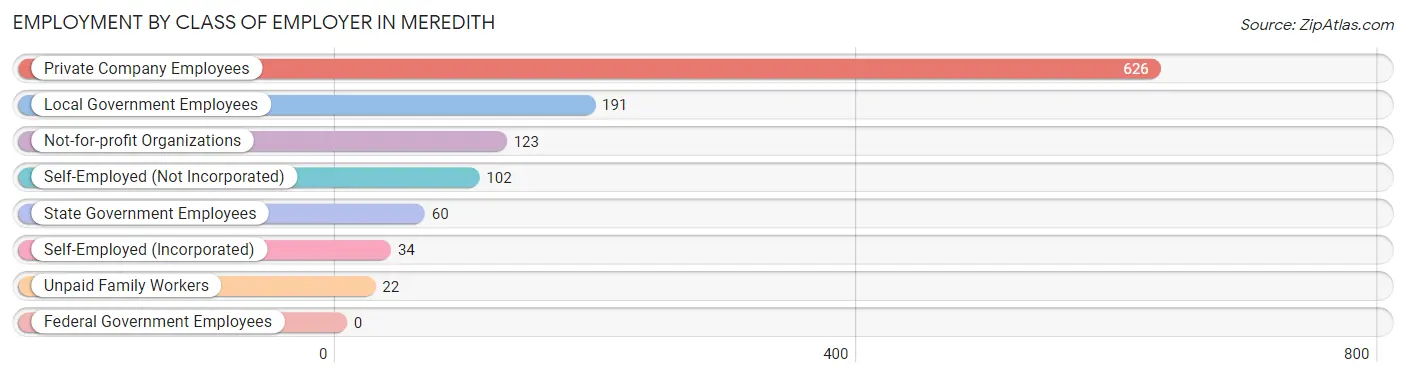
| Employer Class | # Employees | % Employees |
| Private Company Employees | 626 | 54.1% |
| Self-Employed (Incorporated) | 34 | 2.9% |
| Self-Employed (Not Incorporated) | 102 | 8.8% |
| Not-for-profit Organizations | 123 | 10.6% |
| Local Government Employees | 191 | 16.5% |
| State Government Employees | 60 | 5.2% |
| Federal Government Employees | 0 | 0.0% |
| Unpaid Family Workers | 22 | 1.9% |
| Total | 1,158 | 100.0% |
Employment Status by Age in Meredith
According to the labor force statistics for Meredith, out of the total population over 16 years of age (2,399), 52.2% or 1,252 individuals are in the labor force, with 6.5% or 81 of them unemployed. The age group with the highest labor force participation rate is 20 to 24 years, with 93.6% or 205 individuals in the labor force. Within the labor force, the 20 to 24 years age range has the highest percentage of unemployed individuals, with 40.0% or 82 of them being unemployed.
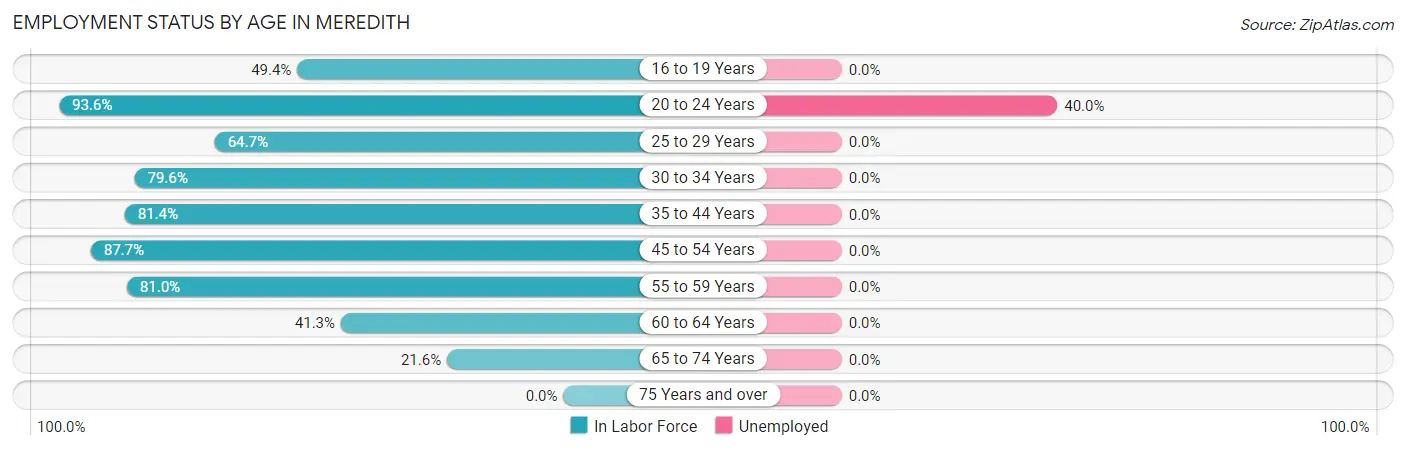
| Age Bracket | In Labor Force | Unemployed |
| 16 to 19 Years | 81 (49.4%) | 0 (0.0%) |
| 20 to 24 Years | 205 (93.6%) | 82 (40.0%) |
| 25 to 29 Years | 97 (64.7%) | 0 (0.0%) |
| 30 to 34 Years | 168 (79.6%) | 0 (0.0%) |
| 35 to 44 Years | 105 (81.4%) | 0 (0.0%) |
| 45 to 54 Years | 236 (87.7%) | 0 (0.0%) |
| 55 to 59 Years | 149 (81.0%) | 0 (0.0%) |
| 60 to 64 Years | 119 (41.3%) | 0 (0.0%) |
| 65 to 74 Years | 92 (21.6%) | 0 (0.0%) |
| 75 Years and over | 0 (0.0%) | 0 (0.0%) |
| Total | 1,252 (52.2%) | 81 (6.5%) |
Employment Status by Educational Attainment in Meredith
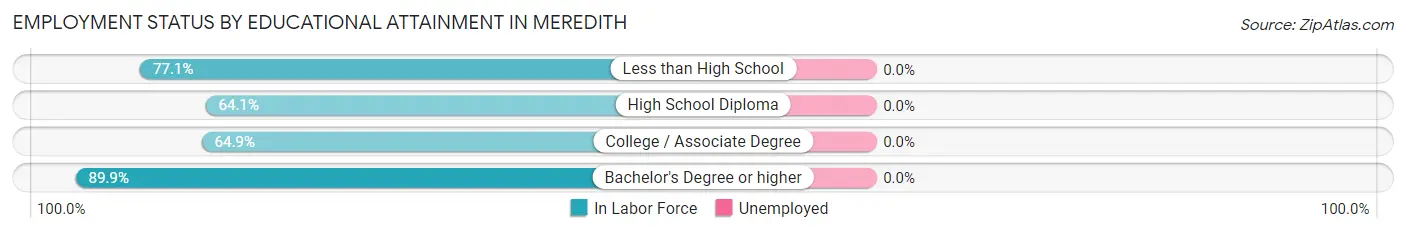
| Educational Attainment | In Labor Force | Unemployed |
| Less than High School | 74 (77.1%) | 0 (0.0%) |
| High School Diploma | 293 (64.1%) | 0 (0.0%) |
| College / Associate Degree | 266 (64.9%) | 0 (0.0%) |
| Bachelor's Degree or higher | 241 (89.9%) | 0 (0.0%) |
| Total | 874 (71.0%) | 0 (0.0%) |
Employment Occupations by Sex in Meredith
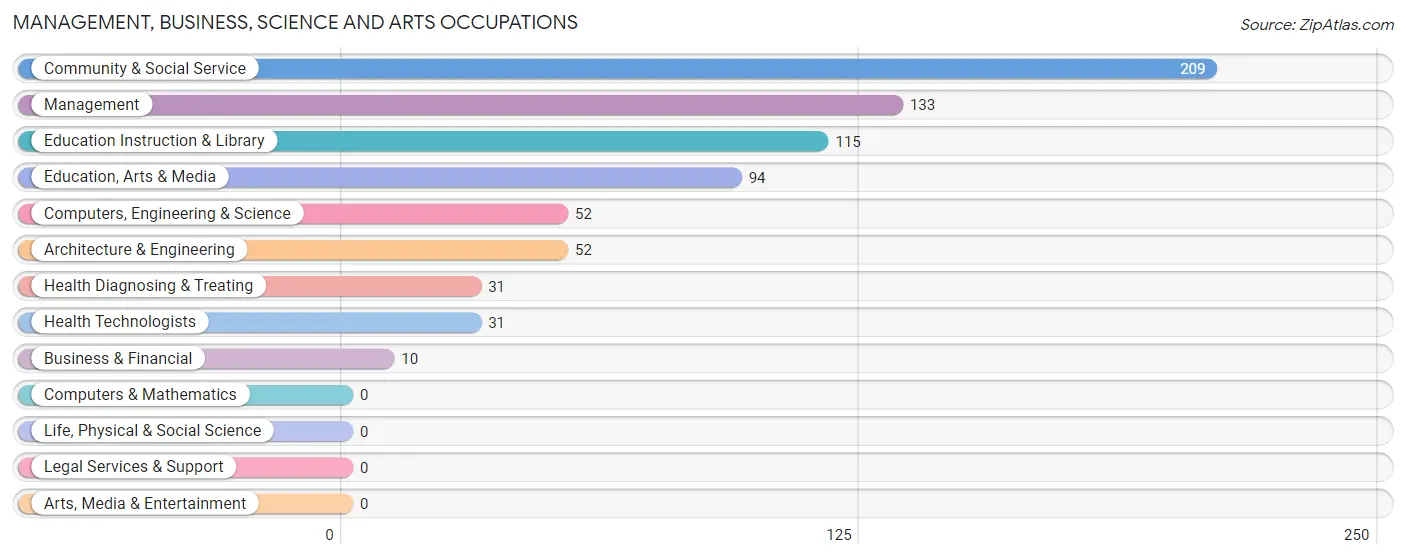
Management, Business, Science and Arts Occupations
The most common Management, Business, Science and Arts occupations in Meredith are Community & Social Service (209 | 17.9%), Management (133 | 11.4%), Education Instruction & Library (115 | 9.8%), Education, Arts & Media (94 | 8.0%), and Computers, Engineering & Science (52 | 4.4%).
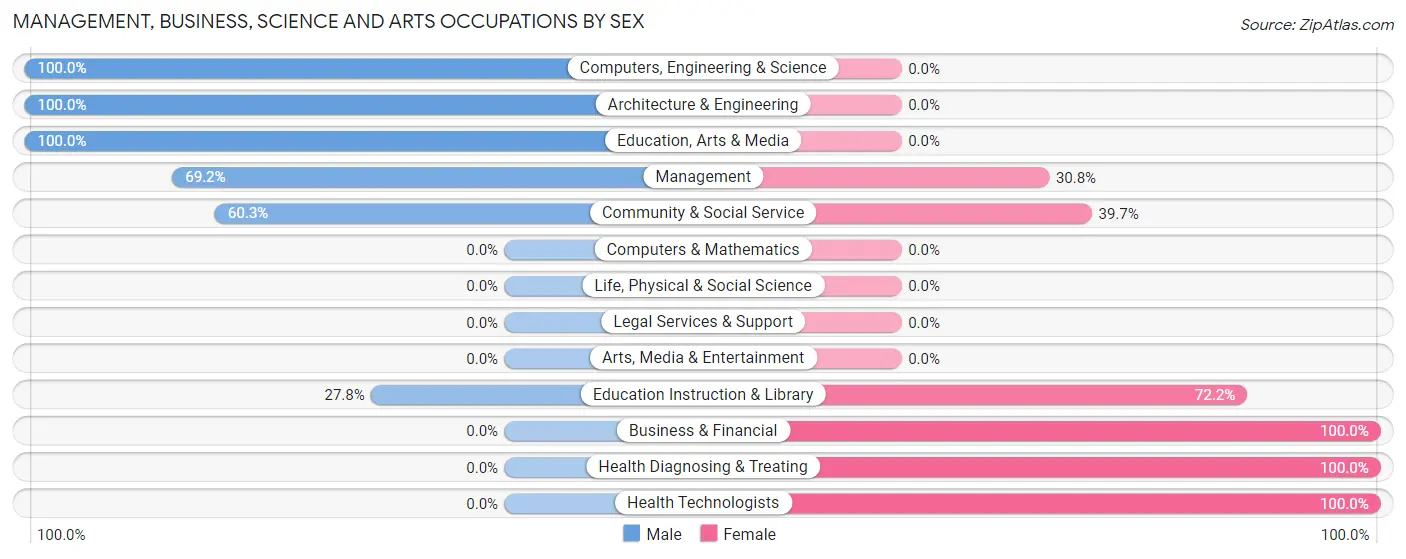
Management, Business, Science and Arts Occupations by Sex
Within the Management, Business, Science and Arts occupations in Meredith, the most male-oriented occupations are Computers, Engineering & Science (100.0%), Architecture & Engineering (100.0%), and Education, Arts & Media (100.0%), while the most female-oriented occupations are Business & Financial (100.0%), Health Diagnosing & Treating (100.0%), and Health Technologists (100.0%).
| Occupation | Male | Female |
| Management | 92 (69.2%) | 41 (30.8%) |
| Business & Financial | 0 (0.0%) | 10 (100.0%) |
| Computers, Engineering & Science | 52 (100.0%) | 0 (0.0%) |
| Computers & Mathematics | 0 (0.0%) | 0 (0.0%) |
| Architecture & Engineering | 52 (100.0%) | 0 (0.0%) |
| Life, Physical & Social Science | 0 (0.0%) | 0 (0.0%) |
| Community & Social Service | 126 (60.3%) | 83 (39.7%) |
| Education, Arts & Media | 94 (100.0%) | 0 (0.0%) |
| Legal Services & Support | 0 (0.0%) | 0 (0.0%) |
| Education Instruction & Library | 32 (27.8%) | 83 (72.2%) |
| Arts, Media & Entertainment | 0 (0.0%) | 0 (0.0%) |
| Health Diagnosing & Treating | 0 (0.0%) | 31 (100.0%) |
| Health Technologists | 0 (0.0%) | 31 (100.0%) |
| Total (Category) | 270 (62.1%) | 165 (37.9%) |
| Total (Overall) | 667 (57.0%) | 503 (43.0%) |
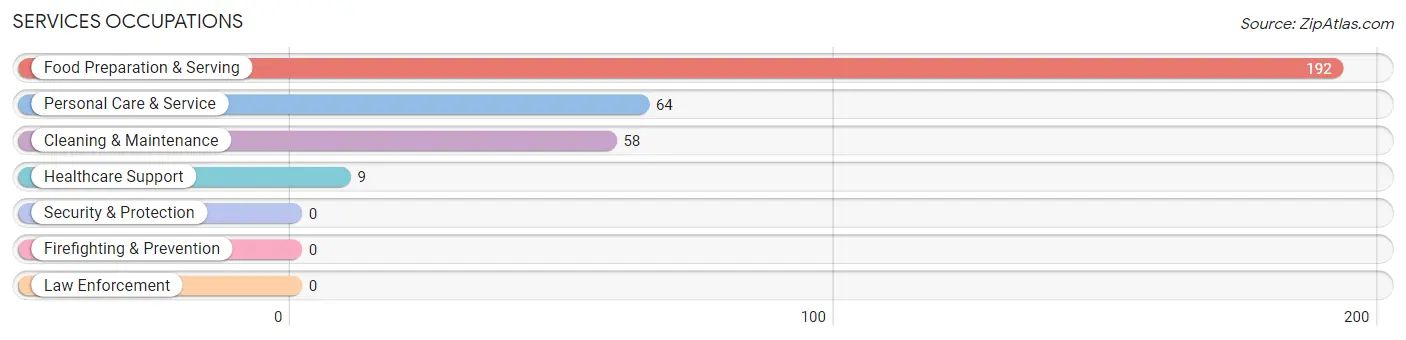
Services Occupations
The most common Services occupations in Meredith are Food Preparation & Serving (192 | 16.4%), Personal Care & Service (64 | 5.5%), Cleaning & Maintenance (58 | 5.0%), and Healthcare Support (9 | 0.8%).
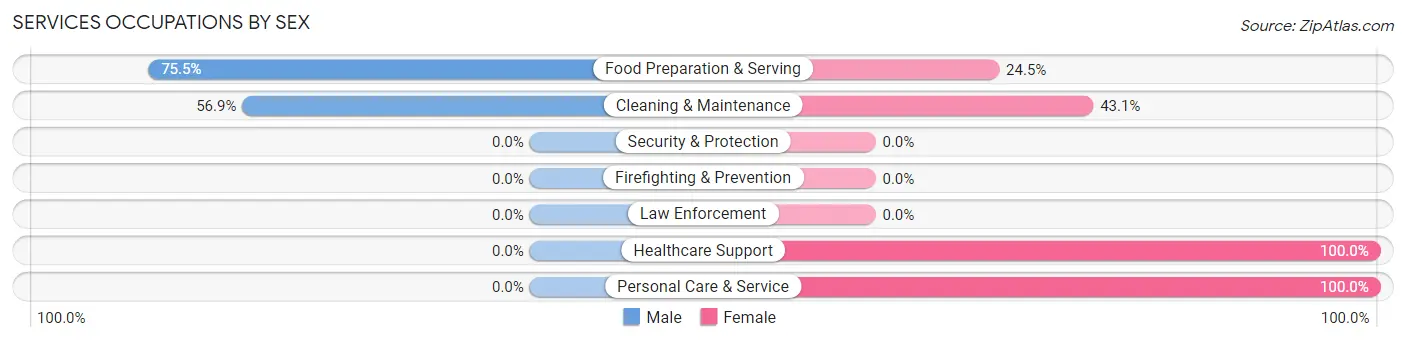
Services Occupations by Sex
Within the Services occupations in Meredith, the most male-oriented occupations are Food Preparation & Serving (75.5%), and Cleaning & Maintenance (56.9%), while the most female-oriented occupations are Healthcare Support (100.0%), Personal Care & Service (100.0%), and Cleaning & Maintenance (43.1%).
| Occupation | Male | Female |
| Healthcare Support | 0 (0.0%) | 9 (100.0%) |
| Security & Protection | 0 (0.0%) | 0 (0.0%) |
| Firefighting & Prevention | 0 (0.0%) | 0 (0.0%) |
| Law Enforcement | 0 (0.0%) | 0 (0.0%) |
| Food Preparation & Serving | 145 (75.5%) | 47 (24.5%) |
| Cleaning & Maintenance | 33 (56.9%) | 25 (43.1%) |
| Personal Care & Service | 0 (0.0%) | 64 (100.0%) |
| Total (Category) | 178 (55.1%) | 145 (44.9%) |
| Total (Overall) | 667 (57.0%) | 503 (43.0%) |
Sales and Office Occupations
The most common Sales and Office occupations in Meredith are Sales & Related (102 | 8.7%), and Office & Administration (93 | 8.0%).
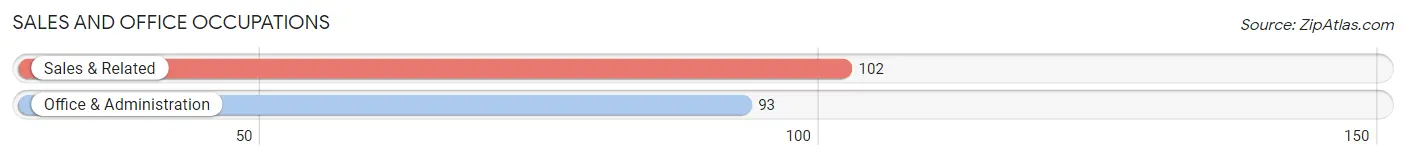
Sales and Office Occupations by Sex
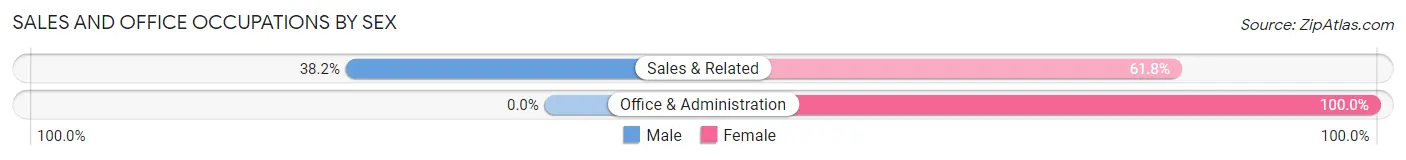
| Occupation | Male | Female |
| Sales & Related | 39 (38.2%) | 63 (61.8%) |
| Office & Administration | 0 (0.0%) | 93 (100.0%) |
| Total (Category) | 39 (20.0%) | 156 (80.0%) |
| Total (Overall) | 667 (57.0%) | 503 (43.0%) |
Natural Resources, Construction and Maintenance Occupations
The most common Natural Resources, Construction and Maintenance occupations in Meredith are Construction & Extraction (84 | 7.2%), and Installation, Maintenance & Repair (34 | 2.9%).
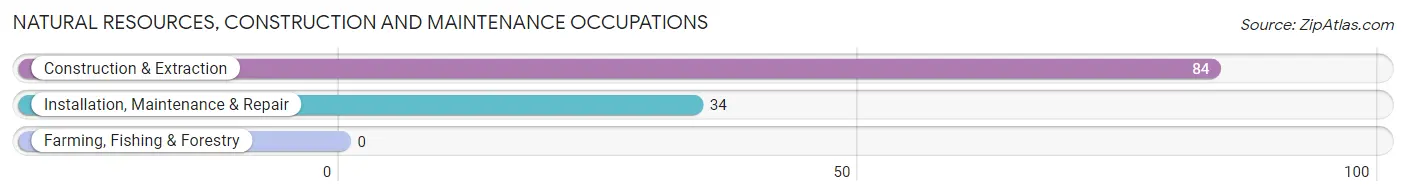
Natural Resources, Construction and Maintenance Occupations by Sex
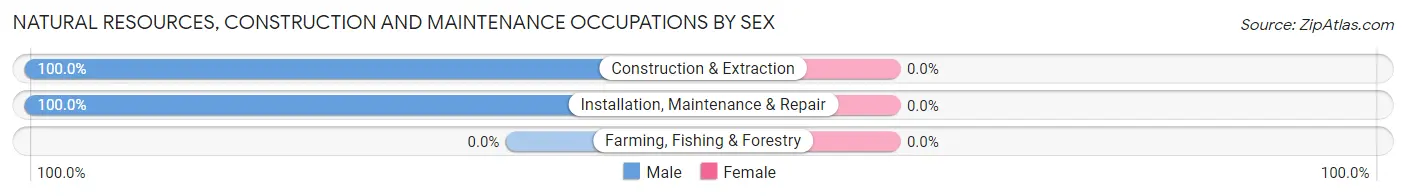
| Occupation | Male | Female |
| Farming, Fishing & Forestry | 0 (0.0%) | 0 (0.0%) |
| Construction & Extraction | 84 (100.0%) | 0 (0.0%) |
| Installation, Maintenance & Repair | 34 (100.0%) | 0 (0.0%) |
| Total (Category) | 118 (100.0%) | 0 (0.0%) |
| Total (Overall) | 667 (57.0%) | 503 (43.0%) |
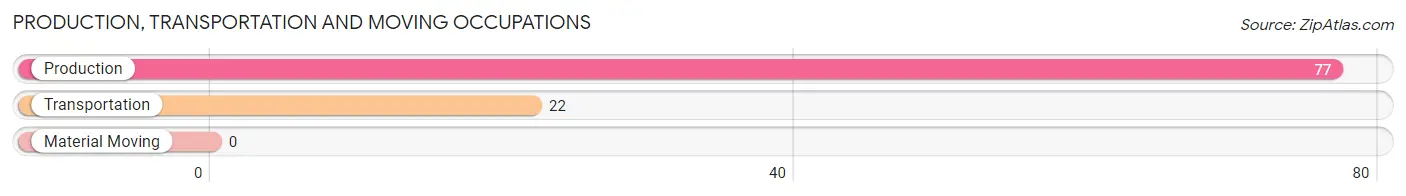
Production, Transportation and Moving Occupations
The most common Production, Transportation and Moving occupations in Meredith are Production (77 | 6.6%), and Transportation (22 | 1.9%).
Production, Transportation and Moving Occupations by Sex
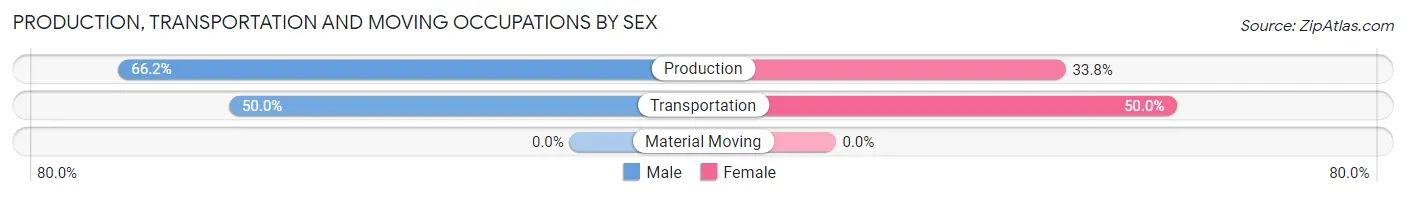
| Occupation | Male | Female |
| Production | 51 (66.2%) | 26 (33.8%) |
| Transportation | 11 (50.0%) | 11 (50.0%) |
| Material Moving | 0 (0.0%) | 0 (0.0%) |
| Total (Category) | 62 (62.6%) | 37 (37.4%) |
| Total (Overall) | 667 (57.0%) | 503 (43.0%) |
Employment Industries by Sex in Meredith
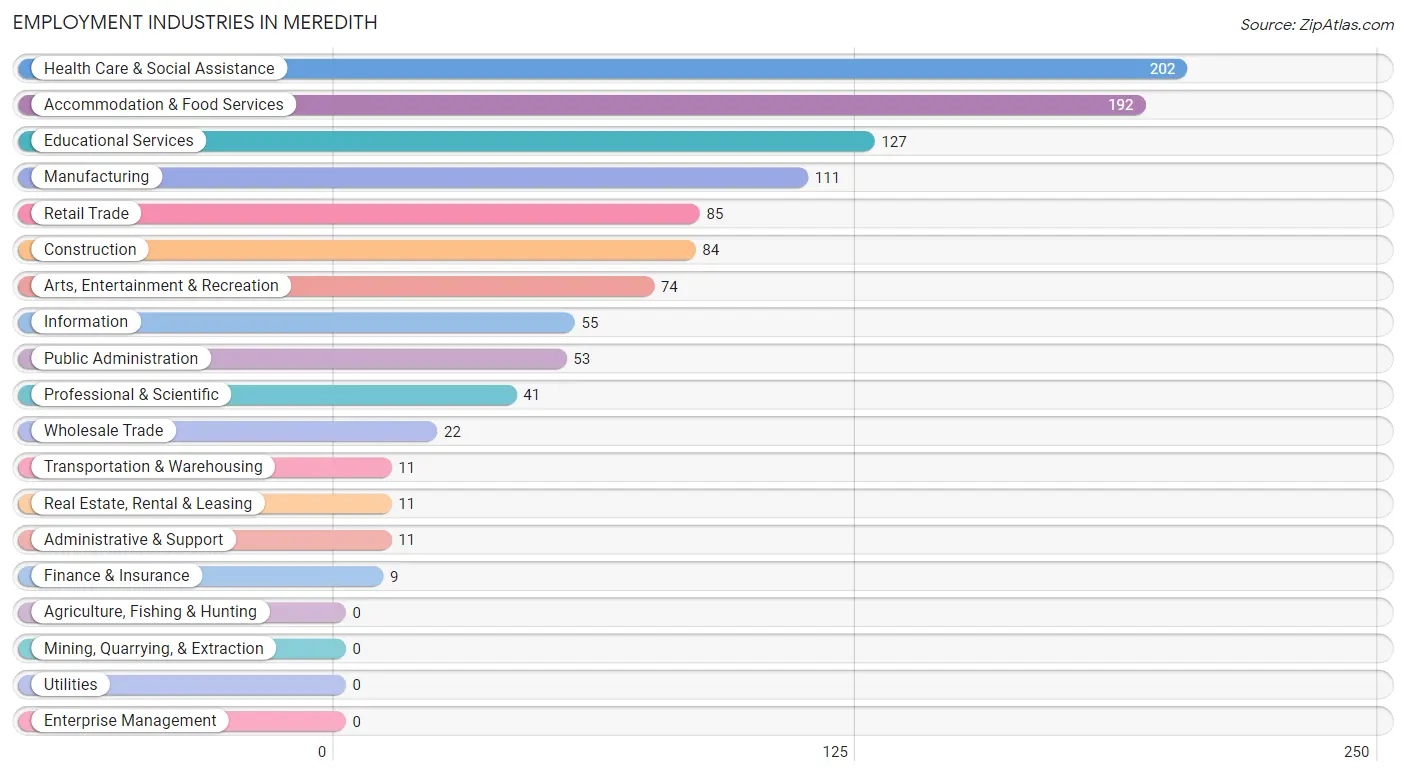
Employment Industries in Meredith
The major employment industries in Meredith include Health Care & Social Assistance (202 | 17.3%), Accommodation & Food Services (192 | 16.4%), Educational Services (127 | 10.8%), Manufacturing (111 | 9.5%), and Retail Trade (85 | 7.3%).
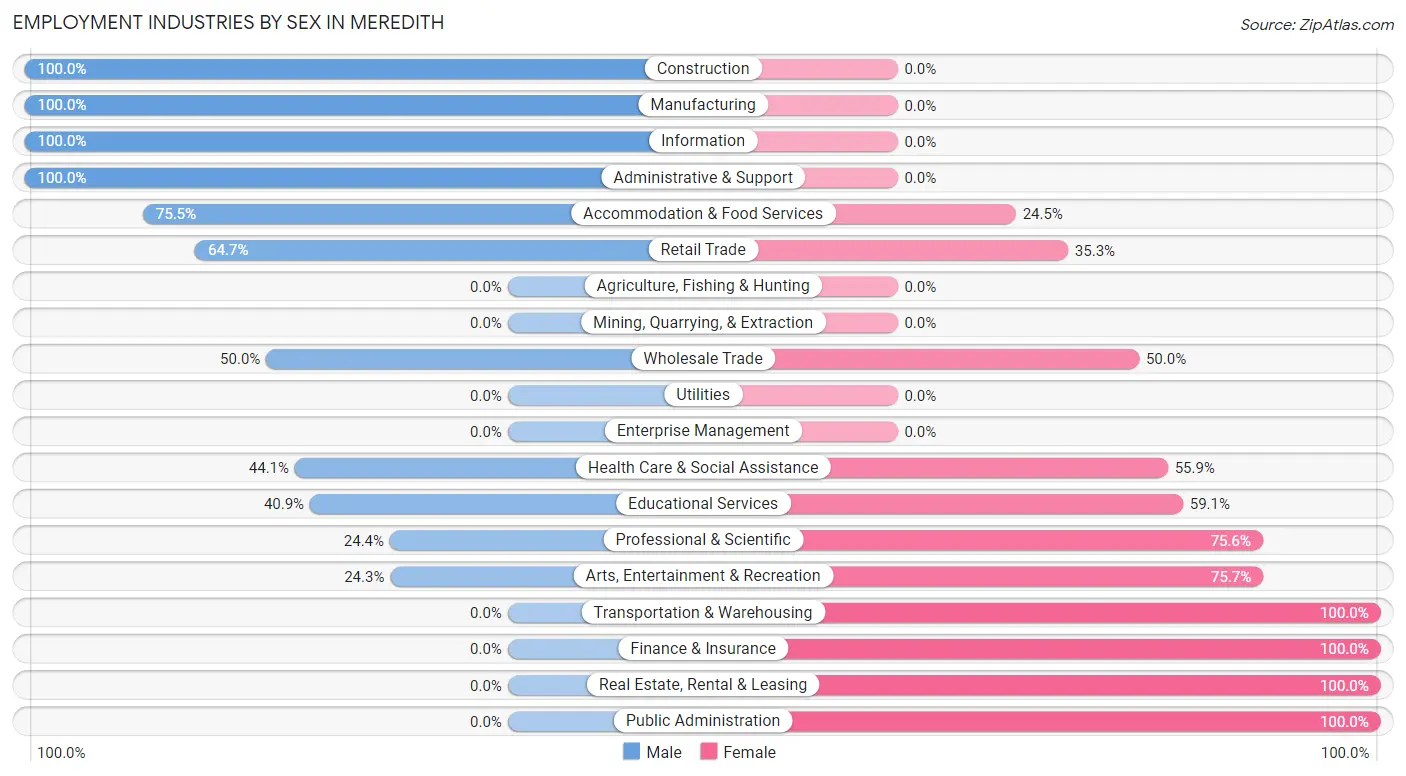
Employment Industries by Sex in Meredith
The Meredith industries that see more men than women are Construction (100.0%), Manufacturing (100.0%), and Information (100.0%), whereas the industries that tend to have a higher number of women are Transportation & Warehousing (100.0%), Finance & Insurance (100.0%), and Real Estate, Rental & Leasing (100.0%).
| Industry | Male | Female |
| Agriculture, Fishing & Hunting | 0 (0.0%) | 0 (0.0%) |
| Mining, Quarrying, & Extraction | 0 (0.0%) | 0 (0.0%) |
| Construction | 84 (100.0%) | 0 (0.0%) |
| Manufacturing | 111 (100.0%) | 0 (0.0%) |
| Wholesale Trade | 11 (50.0%) | 11 (50.0%) |
| Retail Trade | 55 (64.7%) | 30 (35.3%) |
| Transportation & Warehousing | 0 (0.0%) | 11 (100.0%) |
| Utilities | 0 (0.0%) | 0 (0.0%) |
| Information | 55 (100.0%) | 0 (0.0%) |
| Finance & Insurance | 0 (0.0%) | 9 (100.0%) |
| Real Estate, Rental & Leasing | 0 (0.0%) | 11 (100.0%) |
| Professional & Scientific | 10 (24.4%) | 31 (75.6%) |
| Enterprise Management | 0 (0.0%) | 0 (0.0%) |
| Administrative & Support | 11 (100.0%) | 0 (0.0%) |
| Educational Services | 52 (40.9%) | 75 (59.1%) |
| Health Care & Social Assistance | 89 (44.1%) | 113 (55.9%) |
| Arts, Entertainment & Recreation | 18 (24.3%) | 56 (75.7%) |
| Accommodation & Food Services | 145 (75.5%) | 47 (24.5%) |
| Public Administration | 0 (0.0%) | 53 (100.0%) |
| Total | 667 (57.0%) | 503 (43.0%) |
Education in Meredith
School Enrollment in Meredith
The most common levels of schooling among the 466 students in Meredith are high school (278 | 59.7%), elementary school (75 | 16.1%), and middle school (41 | 8.8%).
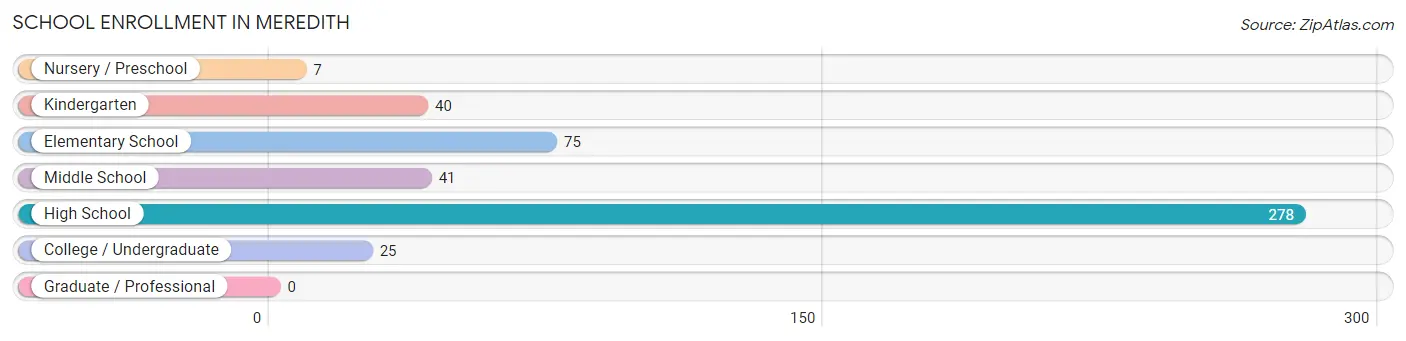
| School Level | # Students | % Students |
| Nursery / Preschool | 7 | 1.5% |
| Kindergarten | 40 | 8.6% |
| Elementary School | 75 | 16.1% |
| Middle School | 41 | 8.8% |
| High School | 278 | 59.7% |
| College / Undergraduate | 25 | 5.4% |
| Graduate / Professional | 0 | 0.0% |
| Total | 466 | 100.0% |
School Enrollment by Age by Funding Source in Meredith
Out of a total of 466 students who are enrolled in schools in Meredith, 84 (18.0%) attend a private institution, while the remaining 382 (82.0%) are enrolled in public schools. The age group of 20 to 24 year olds has the highest likelihood of being enrolled in private schools, with 15 (60.0% in the age bracket) enrolled. Conversely, the age group of 3 to 4 year olds has the lowest likelihood of being enrolled in a private school, with 24 (100.0% in the age bracket) attending a public institution.
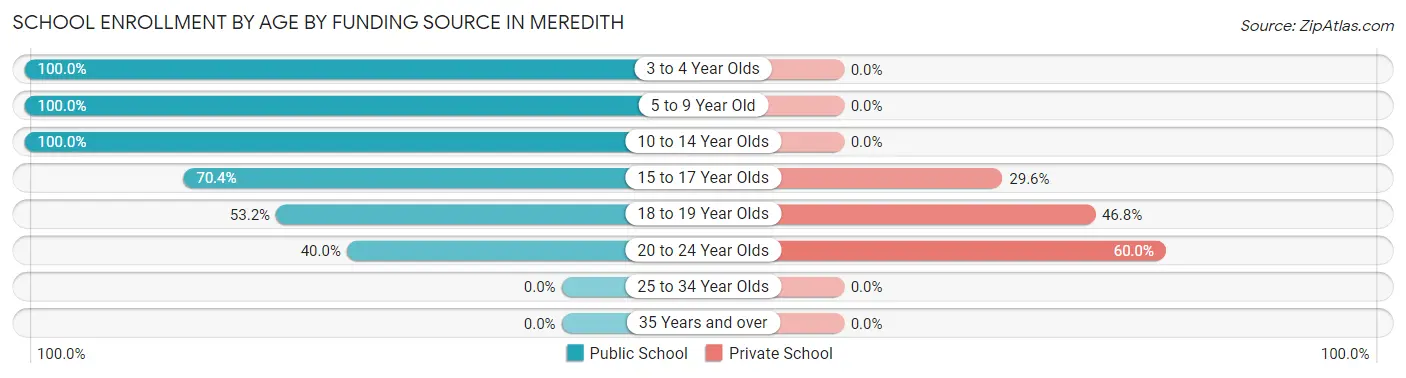
| Age Bracket | Public School | Private School |
| 3 to 4 Year Olds | 24 (100.0%) | 0 (0.0%) |
| 5 to 9 Year Old | 77 (100.0%) | 0 (0.0%) |
| 10 to 14 Year Olds | 134 (100.0%) | 0 (0.0%) |
| 15 to 17 Year Olds | 112 (70.4%) | 47 (29.6%) |
| 18 to 19 Year Olds | 25 (53.2%) | 22 (46.8%) |
| 20 to 24 Year Olds | 10 (40.0%) | 15 (60.0%) |
| 25 to 34 Year Olds | 0 (0.0%) | 0 (0.0%) |
| 35 Years and over | 0 (0.0%) | 0 (0.0%) |
| Total | 382 (82.0%) | 84 (18.0%) |
Educational Attainment by Field of Study in Meredith
Liberal arts & history (126 | 20.2%), business (117 | 18.8%), social sciences (72 | 11.5%), visual & performing arts (69 | 11.1%), and education (65 | 10.4%) are the most common fields of study among 624 individuals in Meredith who have obtained a bachelor's degree or higher.
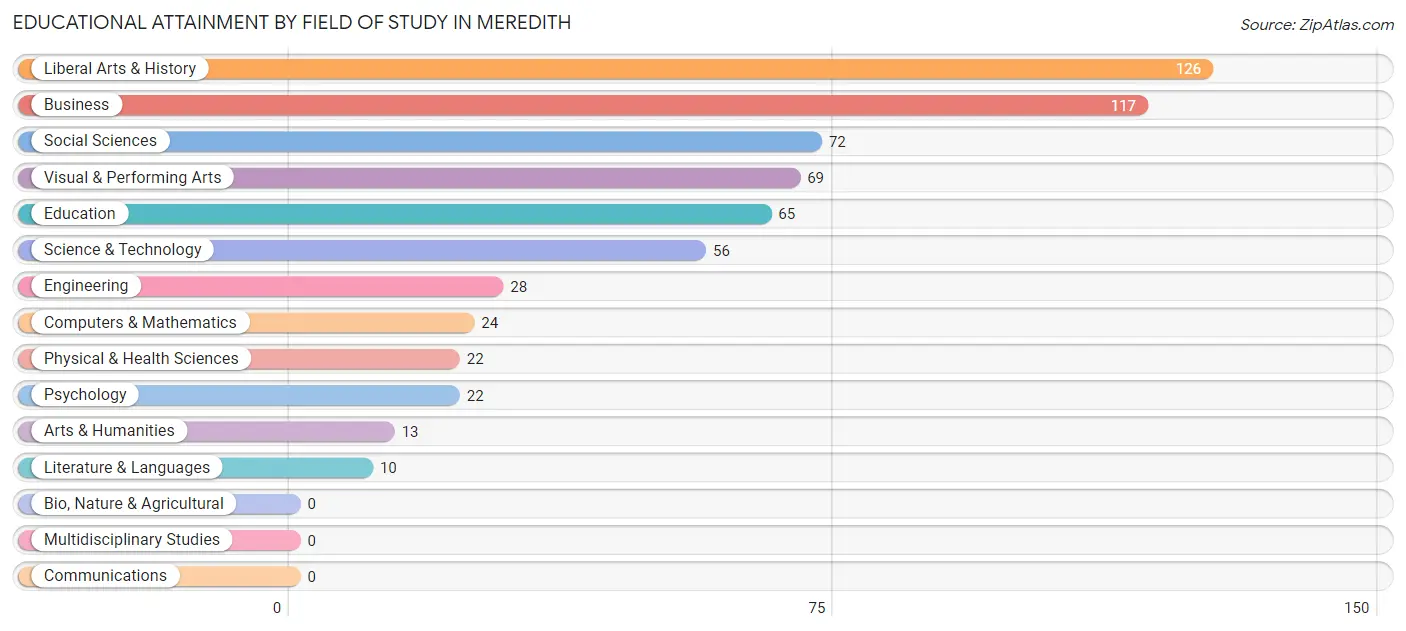
| Field of Study | # Graduates | % Graduates |
| Computers & Mathematics | 24 | 3.8% |
| Bio, Nature & Agricultural | 0 | 0.0% |
| Physical & Health Sciences | 22 | 3.5% |
| Psychology | 22 | 3.5% |
| Social Sciences | 72 | 11.5% |
| Engineering | 28 | 4.5% |
| Multidisciplinary Studies | 0 | 0.0% |
| Science & Technology | 56 | 9.0% |
| Business | 117 | 18.8% |
| Education | 65 | 10.4% |
| Literature & Languages | 10 | 1.6% |
| Liberal Arts & History | 126 | 20.2% |
| Visual & Performing Arts | 69 | 11.1% |
| Communications | 0 | 0.0% |
| Arts & Humanities | 13 | 2.1% |
| Total | 624 | 100.0% |
Transportation & Commute in Meredith
Vehicle Availability by Sex in Meredith
The most prevalent vehicle ownership categories in Meredith are males with 2 vehicles (213, accounting for 31.9%) and females with 2 vehicles (145, making up 43.4%).
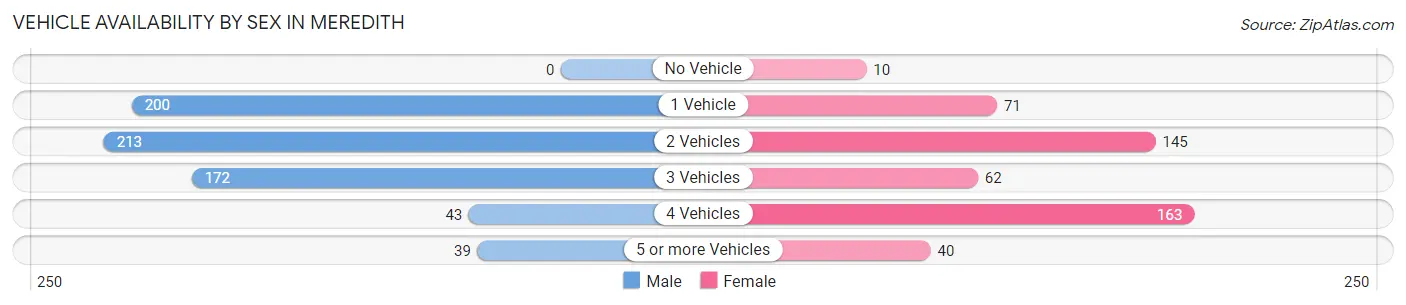
| Vehicles Available | Male | Female |
| No Vehicle | 0 (0.0%) | 10 (2.0%) |
| 1 Vehicle | 200 (30.0%) | 71 (14.5%) |
| 2 Vehicles | 213 (31.9%) | 145 (29.5%) |
| 3 Vehicles | 172 (25.8%) | 62 (12.6%) |
| 4 Vehicles | 43 (6.5%) | 163 (33.2%) |
| 5 or more Vehicles | 39 (5.9%) | 40 (8.2%) |
| Total | 667 (100.0%) | 491 (100.0%) |
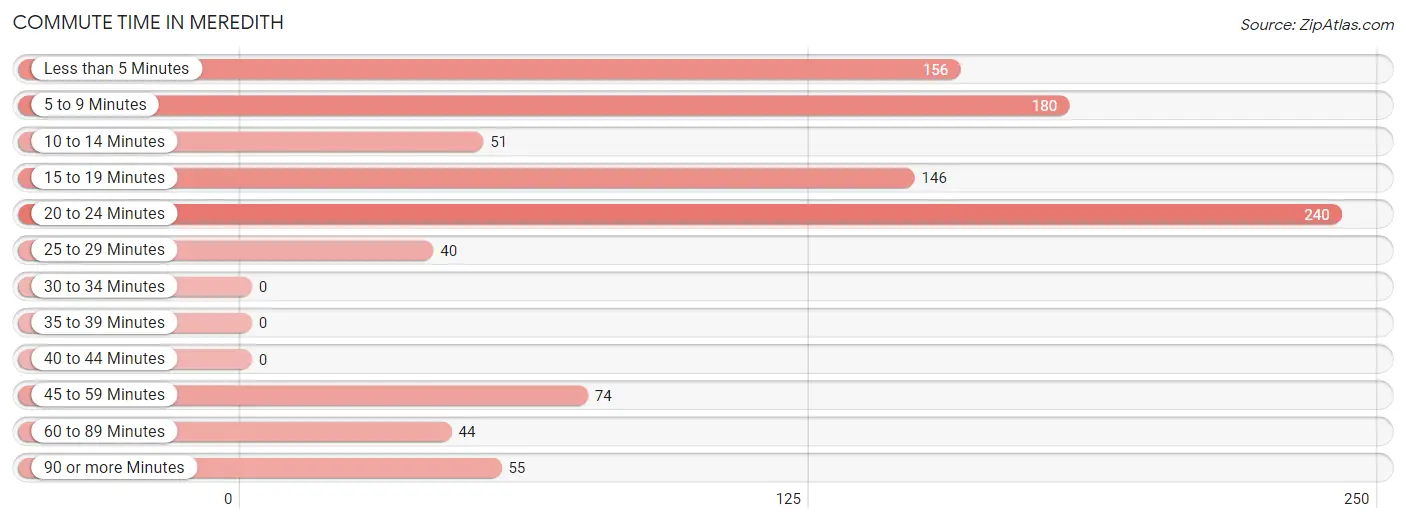
Commute Time in Meredith
The most frequently occuring commute durations in Meredith are 20 to 24 minutes (240 commuters, 24.3%), 5 to 9 minutes (180 commuters, 18.3%), and less than 5 minutes (156 commuters, 15.8%).
| Commute Time | # Commuters | % Commuters |
| Less than 5 Minutes | 156 | 15.8% |
| 5 to 9 Minutes | 180 | 18.3% |
| 10 to 14 Minutes | 51 | 5.2% |
| 15 to 19 Minutes | 146 | 14.8% |
| 20 to 24 Minutes | 240 | 24.3% |
| 25 to 29 Minutes | 40 | 4.1% |
| 30 to 34 Minutes | 0 | 0.0% |
| 35 to 39 Minutes | 0 | 0.0% |
| 40 to 44 Minutes | 0 | 0.0% |
| 45 to 59 Minutes | 74 | 7.5% |
| 60 to 89 Minutes | 44 | 4.5% |
| 90 or more Minutes | 55 | 5.6% |
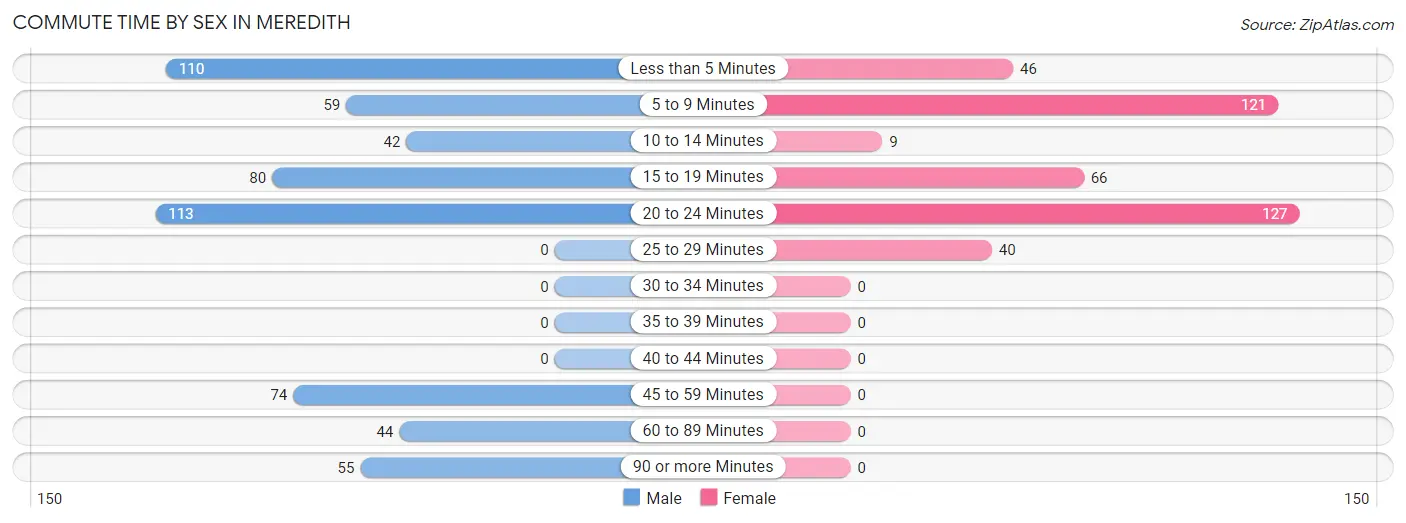
Commute Time by Sex in Meredith
The most common commute times in Meredith are 20 to 24 minutes (113 commuters, 19.6%) for males and 20 to 24 minutes (127 commuters, 31.0%) for females.
| Commute Time | Male | Female |
| Less than 5 Minutes | 110 (19.1%) | 46 (11.3%) |
| 5 to 9 Minutes | 59 (10.2%) | 121 (29.6%) |
| 10 to 14 Minutes | 42 (7.3%) | 9 (2.2%) |
| 15 to 19 Minutes | 80 (13.9%) | 66 (16.1%) |
| 20 to 24 Minutes | 113 (19.6%) | 127 (31.0%) |
| 25 to 29 Minutes | 0 (0.0%) | 40 (9.8%) |
| 30 to 34 Minutes | 0 (0.0%) | 0 (0.0%) |
| 35 to 39 Minutes | 0 (0.0%) | 0 (0.0%) |
| 40 to 44 Minutes | 0 (0.0%) | 0 (0.0%) |
| 45 to 59 Minutes | 74 (12.8%) | 0 (0.0%) |
| 60 to 89 Minutes | 44 (7.6%) | 0 (0.0%) |
| 90 or more Minutes | 55 (9.5%) | 0 (0.0%) |
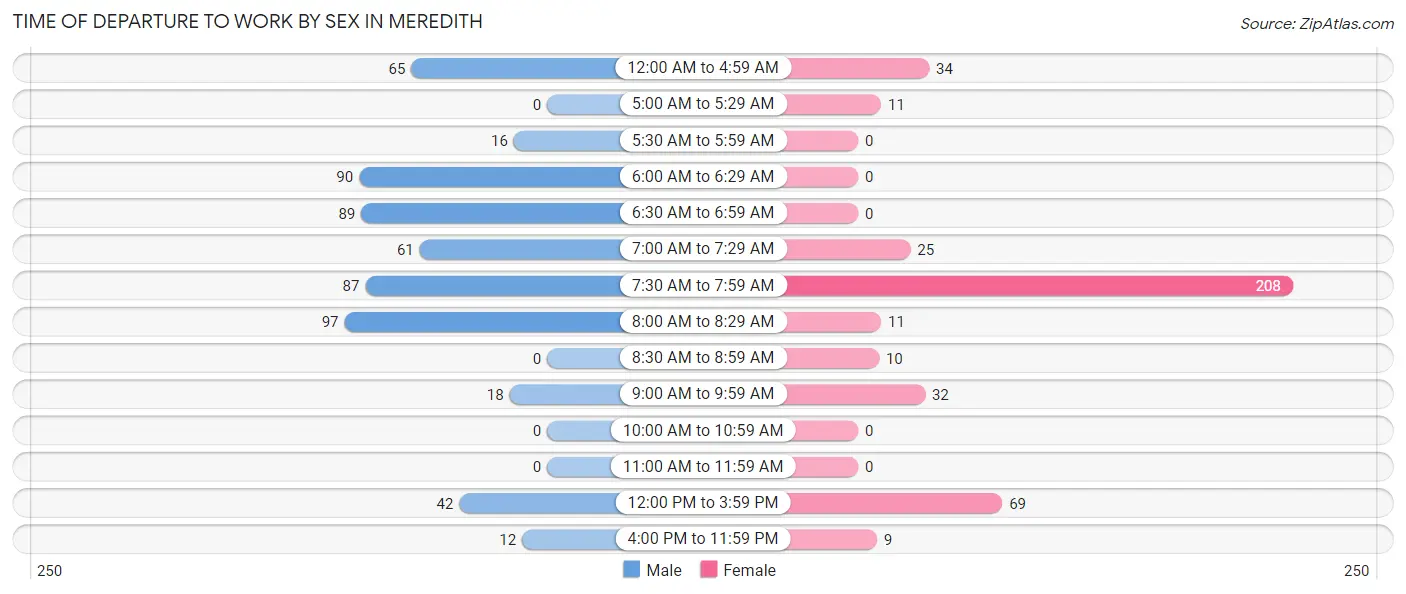
Time of Departure to Work by Sex in Meredith
The most frequent times of departure to work in Meredith are 8:00 AM to 8:29 AM (97, 16.8%) for males and 7:30 AM to 7:59 AM (208, 50.9%) for females.
| Time of Departure | Male | Female |
| 12:00 AM to 4:59 AM | 65 (11.3%) | 34 (8.3%) |
| 5:00 AM to 5:29 AM | 0 (0.0%) | 11 (2.7%) |
| 5:30 AM to 5:59 AM | 16 (2.8%) | 0 (0.0%) |
| 6:00 AM to 6:29 AM | 90 (15.6%) | 0 (0.0%) |
| 6:30 AM to 6:59 AM | 89 (15.4%) | 0 (0.0%) |
| 7:00 AM to 7:29 AM | 61 (10.6%) | 25 (6.1%) |
| 7:30 AM to 7:59 AM | 87 (15.1%) | 208 (50.9%) |
| 8:00 AM to 8:29 AM | 97 (16.8%) | 11 (2.7%) |
| 8:30 AM to 8:59 AM | 0 (0.0%) | 10 (2.4%) |
| 9:00 AM to 9:59 AM | 18 (3.1%) | 32 (7.8%) |
| 10:00 AM to 10:59 AM | 0 (0.0%) | 0 (0.0%) |
| 11:00 AM to 11:59 AM | 0 (0.0%) | 0 (0.0%) |
| 12:00 PM to 3:59 PM | 42 (7.3%) | 69 (16.9%) |
| 4:00 PM to 11:59 PM | 12 (2.1%) | 9 (2.2%) |
| Total | 577 (100.0%) | 409 (100.0%) |
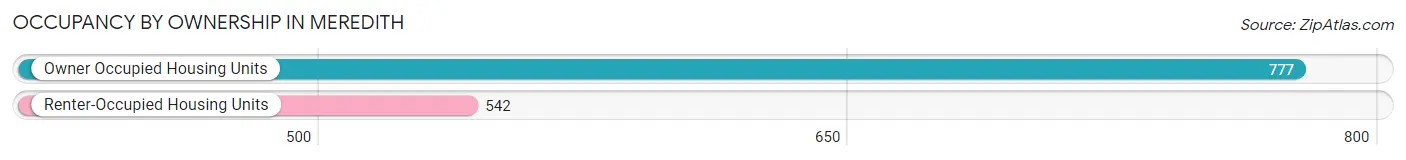
Housing Occupancy in Meredith
Occupancy by Ownership in Meredith
Of the total 1,319 dwellings in Meredith, owner-occupied units account for 777 (58.9%), while renter-occupied units make up 542 (41.1%).
| Occupancy | # Housing Units | % Housing Units |
| Owner Occupied Housing Units | 777 | 58.9% |
| Renter-Occupied Housing Units | 542 | 41.1% |
| Total Occupied Housing Units | 1,319 | 100.0% |
Occupancy by Household Size in Meredith
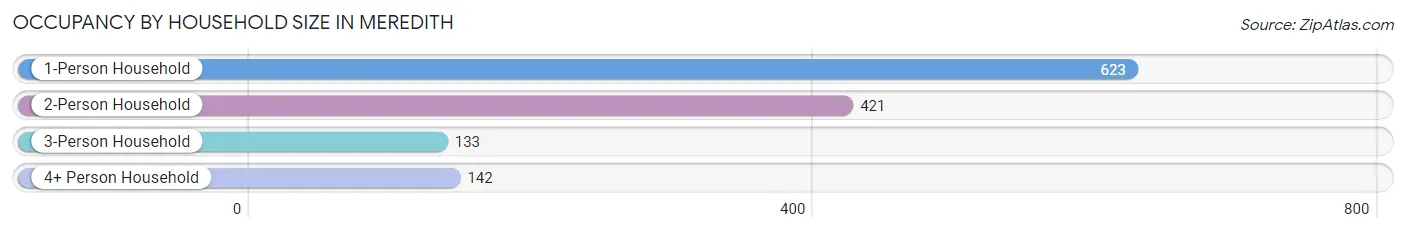
| Household Size | # Housing Units | % Housing Units |
| 1-Person Household | 623 | 47.2% |
| 2-Person Household | 421 | 31.9% |
| 3-Person Household | 133 | 10.1% |
| 4+ Person Household | 142 | 10.8% |
| Total Housing Units | 1,319 | 100.0% |
Occupancy by Ownership by Household Size in Meredith
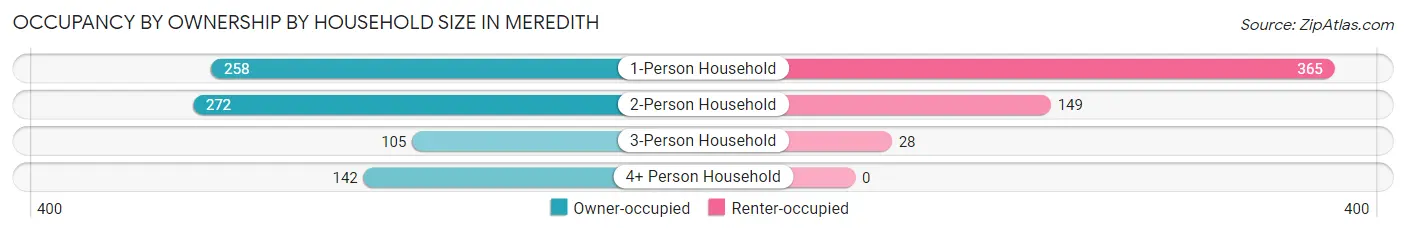
| Household Size | Owner-occupied | Renter-occupied |
| 1-Person Household | 258 (41.4%) | 365 (58.6%) |
| 2-Person Household | 272 (64.6%) | 149 (35.4%) |
| 3-Person Household | 105 (78.9%) | 28 (21.0%) |
| 4+ Person Household | 142 (100.0%) | 0 (0.0%) |
| Total Housing Units | 777 (58.9%) | 542 (41.1%) |
Occupancy by Educational Attainment in Meredith
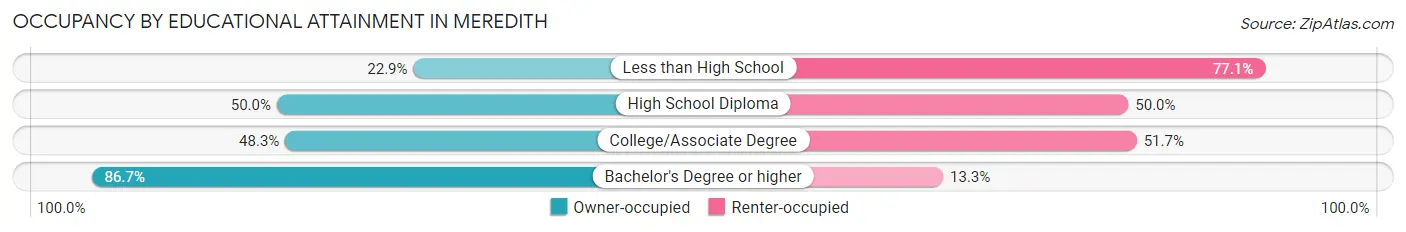
| Household Size | Owner-occupied | Renter-occupied |
| Less than High School | 22 (22.9%) | 74 (77.1%) |
| High School Diploma | 227 (50.0%) | 227 (50.0%) |
| College/Associate Degree | 175 (48.3%) | 187 (51.7%) |
| Bachelor's Degree or higher | 353 (86.7%) | 54 (13.3%) |
Occupancy by Age of Householder in Meredith
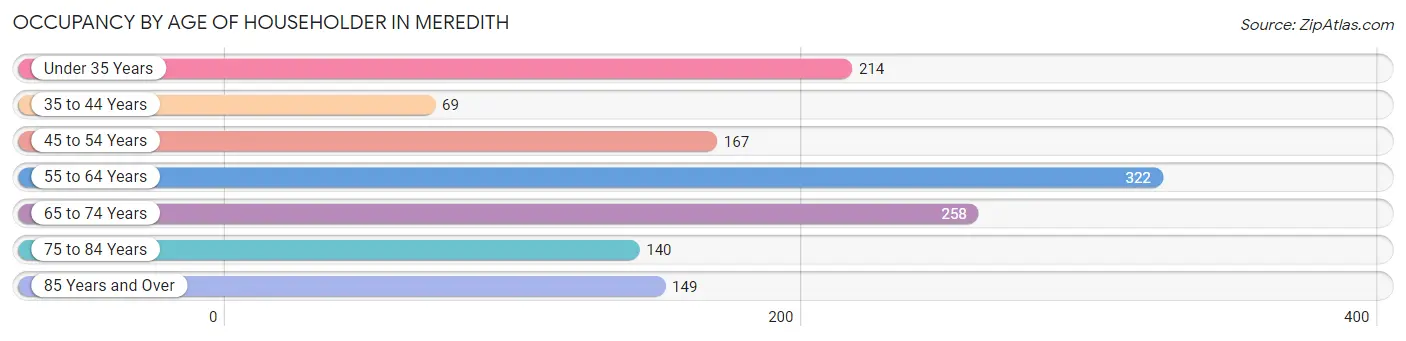
| Age Bracket | # Households | % Households |
| Under 35 Years | 214 | 16.2% |
| 35 to 44 Years | 69 | 5.2% |
| 45 to 54 Years | 167 | 12.7% |
| 55 to 64 Years | 322 | 24.4% |
| 65 to 74 Years | 258 | 19.6% |
| 75 to 84 Years | 140 | 10.6% |
| 85 Years and Over | 149 | 11.3% |
| Total | 1,319 | 100.0% |
Housing Finances in Meredith
Median Income by Occupancy in Meredith
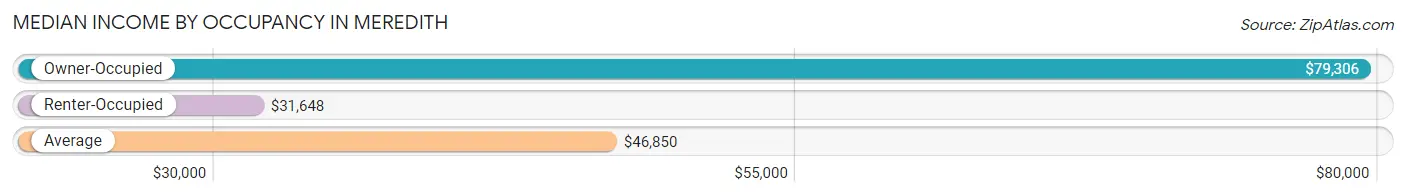
| Occupancy Type | # Households | Median Income |
| Owner-Occupied | 777 (58.9%) | $79,306 |
| Renter-Occupied | 542 (41.1%) | $31,648 |
| Average | 1,319 (100.0%) | $46,850 |
Occupancy by Householder Income Bracket in Meredith
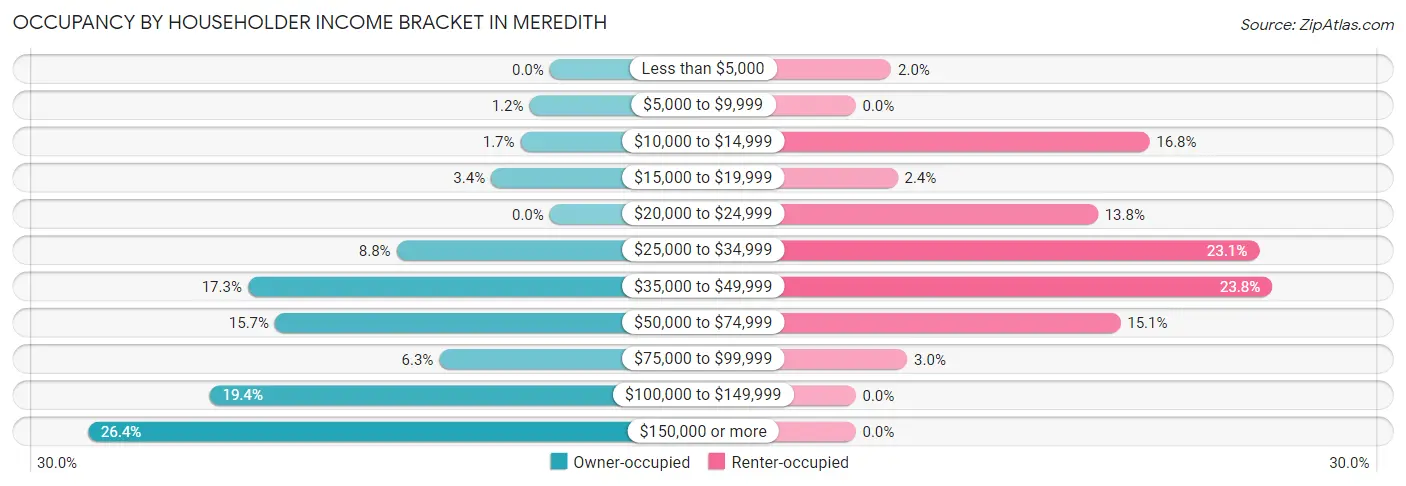
| Income Bracket | Owner-occupied | Renter-occupied |
| Less than $5,000 | 0 (0.0%) | 11 (2.0%) |
| $5,000 to $9,999 | 9 (1.2%) | 0 (0.0%) |
| $10,000 to $14,999 | 13 (1.7%) | 91 (16.8%) |
| $15,000 to $19,999 | 26 (3.4%) | 13 (2.4%) |
| $20,000 to $24,999 | 0 (0.0%) | 75 (13.8%) |
| $25,000 to $34,999 | 68 (8.7%) | 125 (23.1%) |
| $35,000 to $49,999 | 134 (17.2%) | 129 (23.8%) |
| $50,000 to $74,999 | 122 (15.7%) | 82 (15.1%) |
| $75,000 to $99,999 | 49 (6.3%) | 16 (2.9%) |
| $100,000 to $149,999 | 151 (19.4%) | 0 (0.0%) |
| $150,000 or more | 205 (26.4%) | 0 (0.0%) |
| Total | 777 (100.0%) | 542 (100.0%) |
Monthly Housing Cost Tiers in Meredith
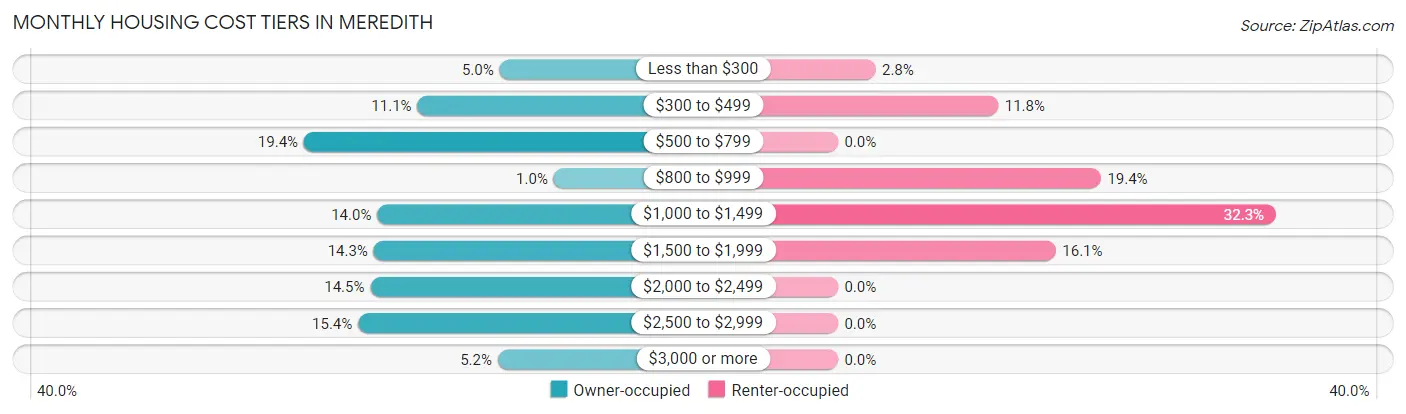
| Monthly Cost | Owner-occupied | Renter-occupied |
| Less than $300 | 39 (5.0%) | 15 (2.8%) |
| $300 to $499 | 86 (11.1%) | 64 (11.8%) |
| $500 to $799 | 151 (19.4%) | 0 (0.0%) |
| $800 to $999 | 8 (1.0%) | 105 (19.4%) |
| $1,000 to $1,499 | 109 (14.0%) | 175 (32.3%) |
| $1,500 to $1,999 | 111 (14.3%) | 87 (16.1%) |
| $2,000 to $2,499 | 113 (14.5%) | 0 (0.0%) |
| $2,500 to $2,999 | 120 (15.4%) | 0 (0.0%) |
| $3,000 or more | 40 (5.1%) | 0 (0.0%) |
| Total | 777 (100.0%) | 542 (100.0%) |
Physical Housing Characteristics in Meredith
Housing Structures in Meredith
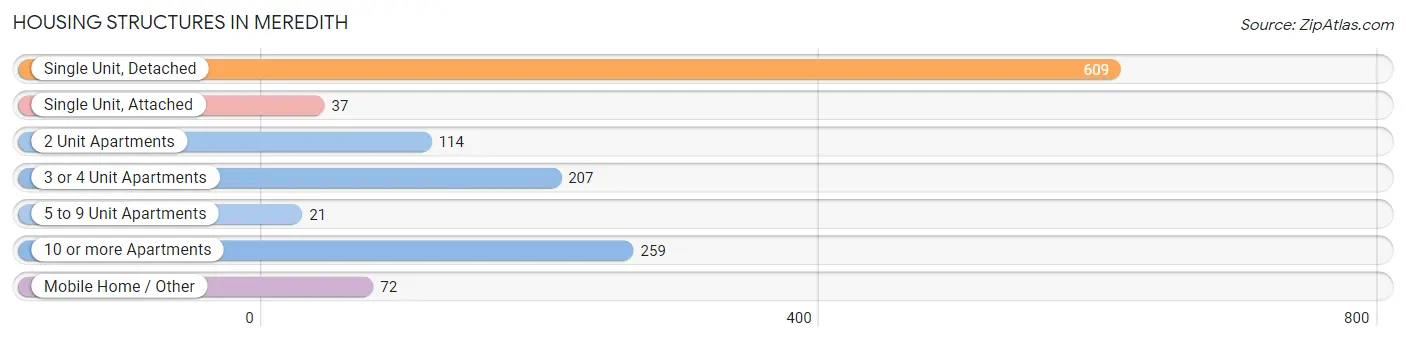
| Structure Type | # Housing Units | % Housing Units |
| Single Unit, Detached | 609 | 46.2% |
| Single Unit, Attached | 37 | 2.8% |
| 2 Unit Apartments | 114 | 8.6% |
| 3 or 4 Unit Apartments | 207 | 15.7% |
| 5 to 9 Unit Apartments | 21 | 1.6% |
| 10 or more Apartments | 259 | 19.6% |
| Mobile Home / Other | 72 | 5.5% |
| Total | 1,319 | 100.0% |
Housing Structures by Occupancy in Meredith
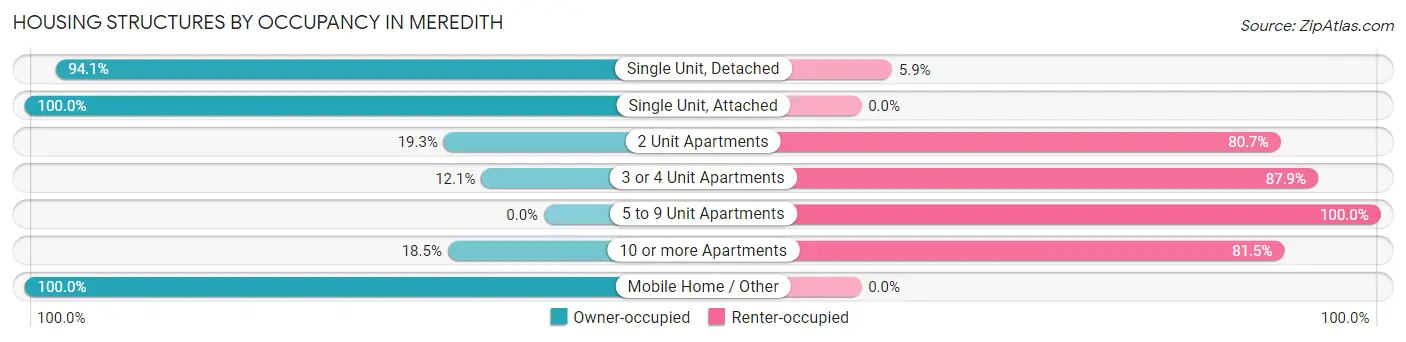
| Structure Type | Owner-occupied | Renter-occupied |
| Single Unit, Detached | 573 (94.1%) | 36 (5.9%) |
| Single Unit, Attached | 37 (100.0%) | 0 (0.0%) |
| 2 Unit Apartments | 22 (19.3%) | 92 (80.7%) |
| 3 or 4 Unit Apartments | 25 (12.1%) | 182 (87.9%) |
| 5 to 9 Unit Apartments | 0 (0.0%) | 21 (100.0%) |
| 10 or more Apartments | 48 (18.5%) | 211 (81.5%) |
| Mobile Home / Other | 72 (100.0%) | 0 (0.0%) |
| Total | 777 (58.9%) | 542 (41.1%) |
Housing Structures by Number of Rooms in Meredith
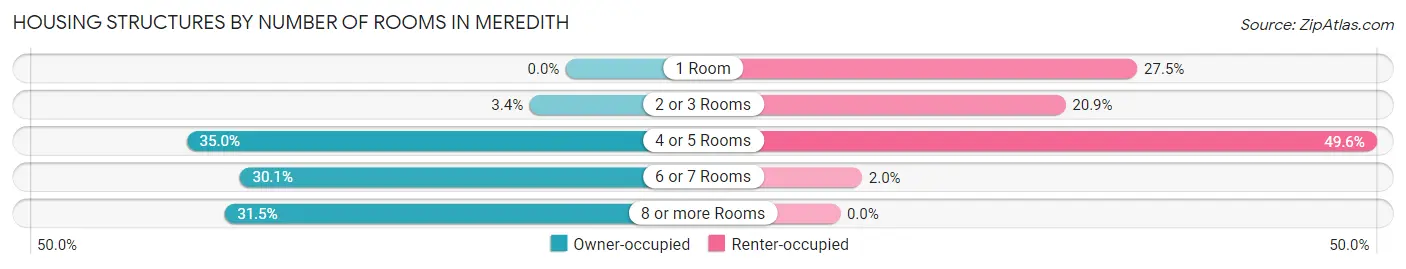
| Number of Rooms | Owner-occupied | Renter-occupied |
| 1 Room | 0 (0.0%) | 149 (27.5%) |
| 2 or 3 Rooms | 26 (3.4%) | 113 (20.8%) |
| 4 or 5 Rooms | 272 (35.0%) | 269 (49.6%) |
| 6 or 7 Rooms | 234 (30.1%) | 11 (2.0%) |
| 8 or more Rooms | 245 (31.5%) | 0 (0.0%) |
| Total | 777 (100.0%) | 542 (100.0%) |
Housing Structure by Heating Type in Meredith
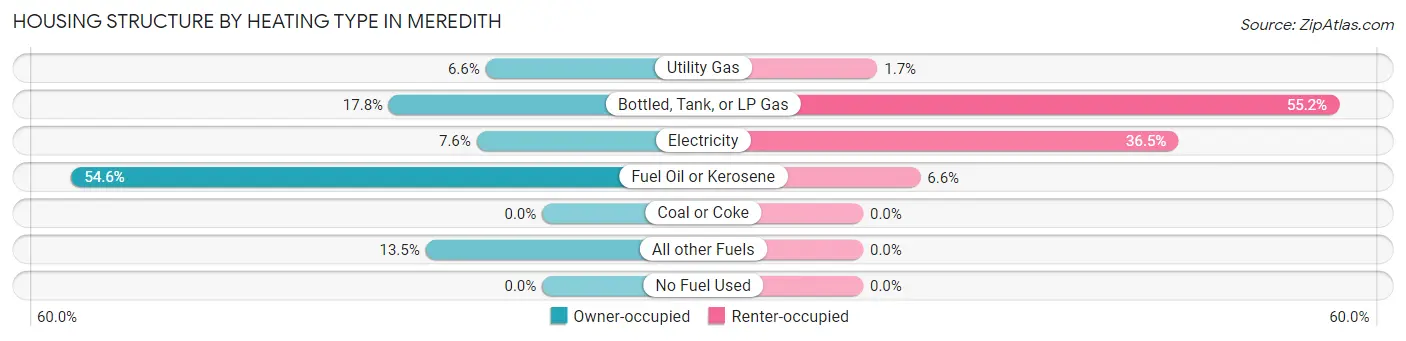
| Heating Type | Owner-occupied | Renter-occupied |
| Utility Gas | 51 (6.6%) | 9 (1.7%) |
| Bottled, Tank, or LP Gas | 138 (17.8%) | 299 (55.2%) |
| Electricity | 59 (7.6%) | 198 (36.5%) |
| Fuel Oil or Kerosene | 424 (54.6%) | 36 (6.6%) |
| Coal or Coke | 0 (0.0%) | 0 (0.0%) |
| All other Fuels | 105 (13.5%) | 0 (0.0%) |
| No Fuel Used | 0 (0.0%) | 0 (0.0%) |
| Total | 777 (100.0%) | 542 (100.0%) |
Household Vehicle Usage in Meredith
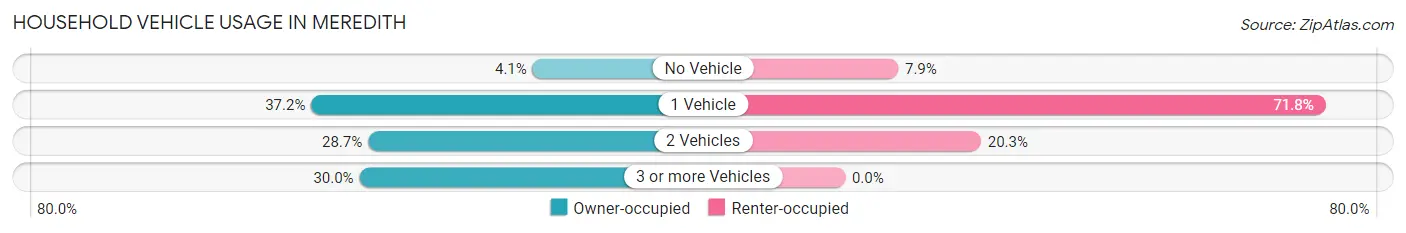
| Vehicles per Household | Owner-occupied | Renter-occupied |
| No Vehicle | 32 (4.1%) | 43 (7.9%) |
| 1 Vehicle | 289 (37.2%) | 389 (71.8%) |
| 2 Vehicles | 223 (28.7%) | 110 (20.3%) |
| 3 or more Vehicles | 233 (30.0%) | 0 (0.0%) |
| Total | 777 (100.0%) | 542 (100.0%) |
Real Estate & Mortgages in Meredith
Real Estate and Mortgage Overview in Meredith
| Characteristic | Without Mortgage | With Mortgage |
| Housing Units | 378 | 399 |
| Median Property Value | $348,100 | $420,400 |
| Median Household Income | $54,063 | $164 |
| Monthly Housing Costs | $725 | $30 |
| Real Estate Taxes | $3,452 | $0 |
Property Value by Mortgage Status in Meredith
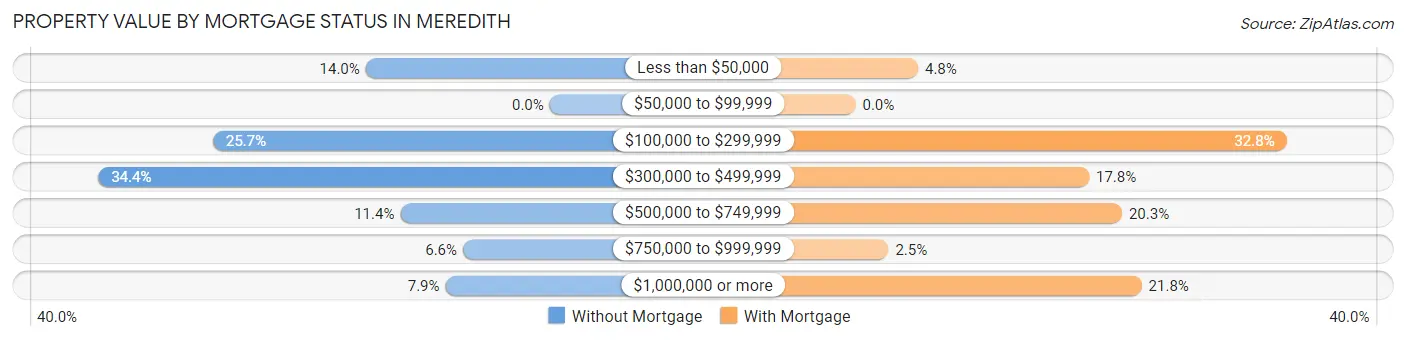
| Property Value | Without Mortgage | With Mortgage |
| Less than $50,000 | 53 (14.0%) | 19 (4.8%) |
| $50,000 to $99,999 | 0 (0.0%) | 0 (0.0%) |
| $100,000 to $299,999 | 97 (25.7%) | 131 (32.8%) |
| $300,000 to $499,999 | 130 (34.4%) | 71 (17.8%) |
| $500,000 to $749,999 | 43 (11.4%) | 81 (20.3%) |
| $750,000 to $999,999 | 25 (6.6%) | 10 (2.5%) |
| $1,000,000 or more | 30 (7.9%) | 87 (21.8%) |
| Total | 378 (100.0%) | 399 (100.0%) |
Household Income by Mortgage Status in Meredith
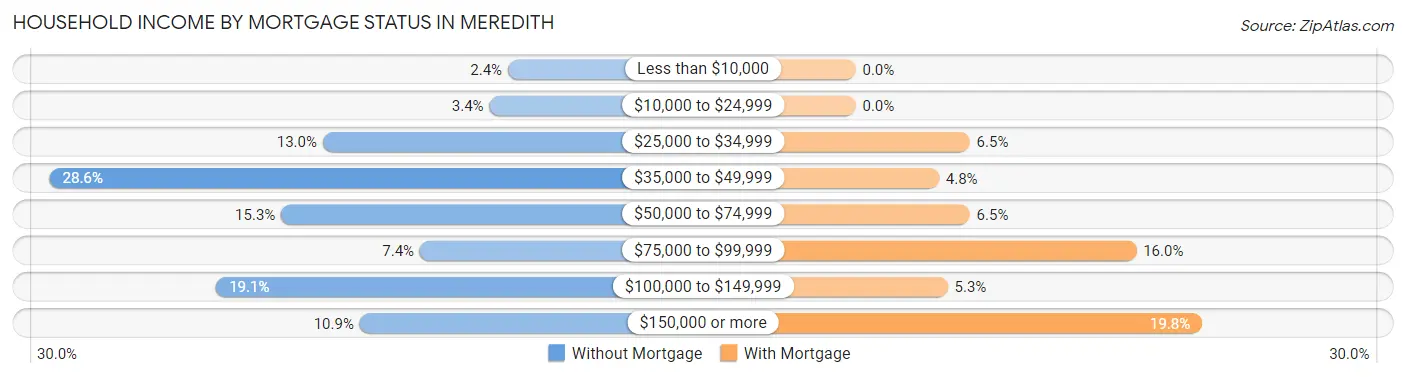
| Household Income | Without Mortgage | With Mortgage |
| Less than $10,000 | 9 (2.4%) | 0 (0.0%) |
| $10,000 to $24,999 | 13 (3.4%) | 0 (0.0%) |
| $25,000 to $34,999 | 49 (13.0%) | 26 (6.5%) |
| $35,000 to $49,999 | 108 (28.6%) | 19 (4.8%) |
| $50,000 to $74,999 | 58 (15.3%) | 26 (6.5%) |
| $75,000 to $99,999 | 28 (7.4%) | 64 (16.0%) |
| $100,000 to $149,999 | 72 (19.1%) | 21 (5.3%) |
| $150,000 or more | 41 (10.8%) | 79 (19.8%) |
| Total | 378 (100.0%) | 399 (100.0%) |
Property Value to Household Income Ratio in Meredith
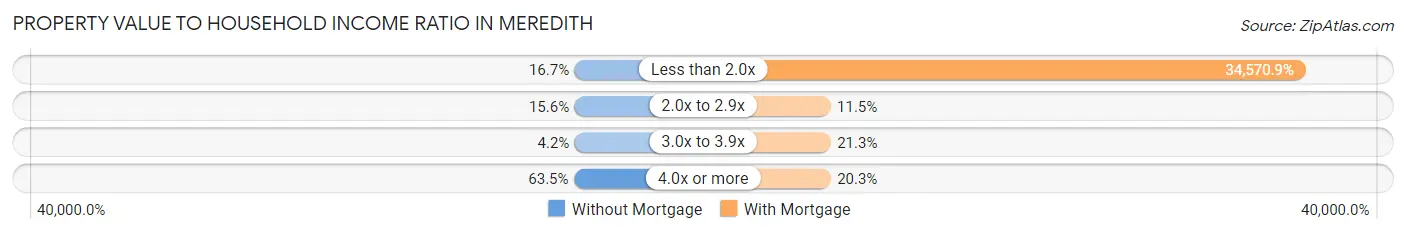
| Value-to-Income Ratio | Without Mortgage | With Mortgage |
| Less than 2.0x | 63 (16.7%) | 137,938 (34,570.9%) |
| 2.0x to 2.9x | 59 (15.6%) | 46 (11.5%) |
| 3.0x to 3.9x | 16 (4.2%) | 85 (21.3%) |
| 4.0x or more | 240 (63.5%) | 81 (20.3%) |
| Total | 378 (100.0%) | 399 (100.0%) |
Real Estate Taxes by Mortgage Status in Meredith
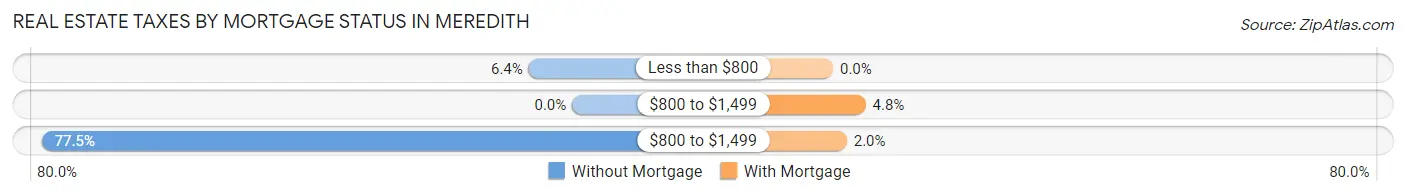
| Property Taxes | Without Mortgage | With Mortgage |
| Less than $800 | 24 (6.4%) | 0 (0.0%) |
| $800 to $1,499 | 0 (0.0%) | 19 (4.8%) |
| $800 to $1,499 | 293 (77.5%) | 8 (2.0%) |
| Total | 378 (100.0%) | 399 (100.0%) |
Health & Disability in Meredith
Health Insurance Coverage by Age in Meredith
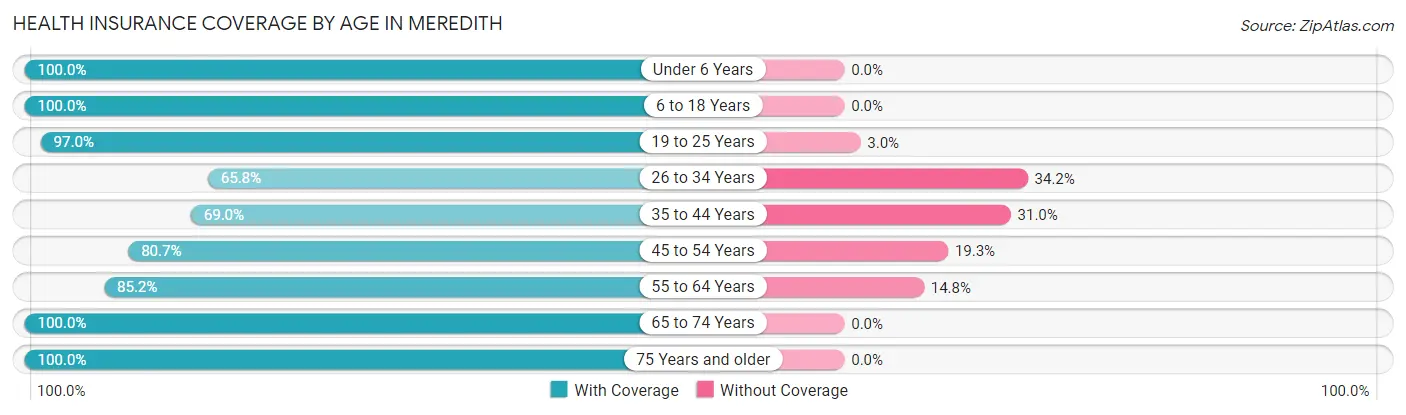
| Age Bracket | With Coverage | Without Coverage |
| Under 6 Years | 66 (100.0%) | 0 (0.0%) |
| 6 to 18 Years | 421 (100.0%) | 0 (0.0%) |
| 19 to 25 Years | 291 (97.0%) | 9 (3.0%) |
| 26 to 34 Years | 208 (65.8%) | 108 (34.2%) |
| 35 to 44 Years | 89 (69.0%) | 40 (31.0%) |
| 45 to 54 Years | 217 (80.7%) | 52 (19.3%) |
| 55 to 64 Years | 402 (85.2%) | 70 (14.8%) |
| 65 to 74 Years | 414 (100.0%) | 0 (0.0%) |
| 75 Years and older | 331 (100.0%) | 0 (0.0%) |
| Total | 2,439 (89.7%) | 279 (10.3%) |
Health Insurance Coverage by Citizenship Status in Meredith
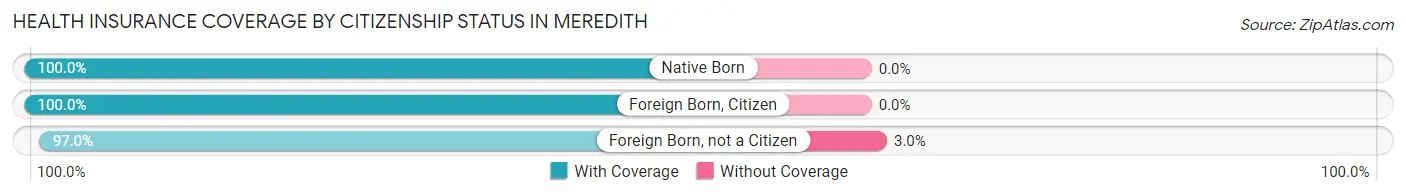
| Citizenship Status | With Coverage | Without Coverage |
| Native Born | 66 (100.0%) | 0 (0.0%) |
| Foreign Born, Citizen | 421 (100.0%) | 0 (0.0%) |
| Foreign Born, not a Citizen | 291 (97.0%) | 9 (3.0%) |
Health Insurance Coverage by Household Income in Meredith
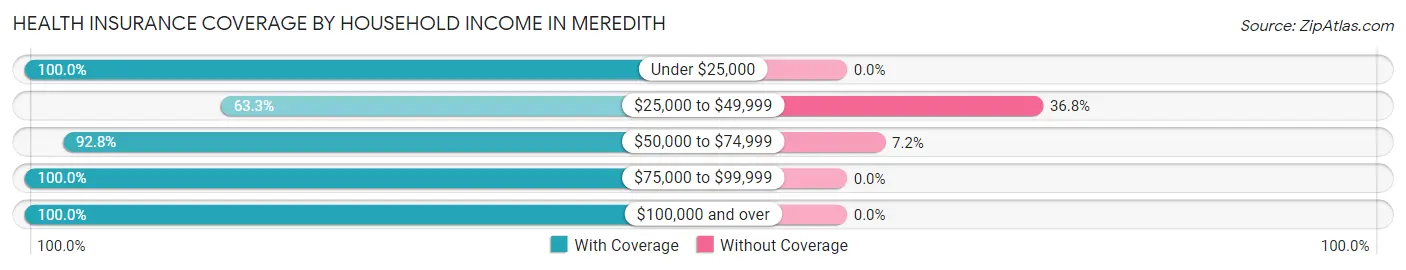
| Household Income | With Coverage | Without Coverage |
| Under $25,000 | 283 (100.0%) | 0 (0.0%) |
| $25,000 to $49,999 | 413 (63.2%) | 240 (36.7%) |
| $50,000 to $74,999 | 504 (92.8%) | 39 (7.2%) |
| $75,000 to $99,999 | 105 (100.0%) | 0 (0.0%) |
| $100,000 and over | 1,133 (100.0%) | 0 (0.0%) |
Public vs Private Health Insurance Coverage by Age in Meredith
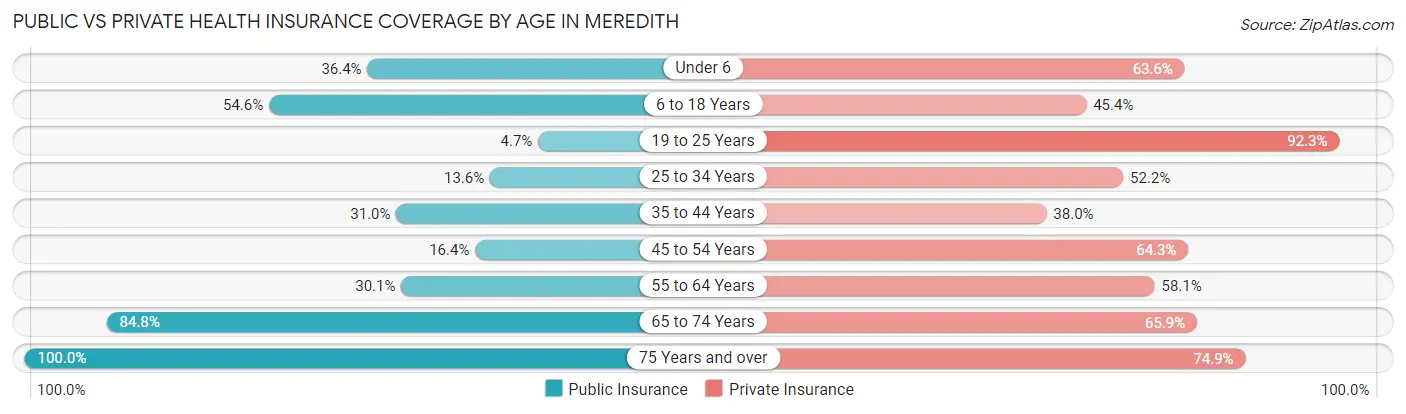
| Age Bracket | Public Insurance | Private Insurance |
| Under 6 | 24 (36.4%) | 42 (63.6%) |
| 6 to 18 Years | 230 (54.6%) | 191 (45.4%) |
| 19 to 25 Years | 14 (4.7%) | 277 (92.3%) |
| 25 to 34 Years | 43 (13.6%) | 165 (52.2%) |
| 35 to 44 Years | 40 (31.0%) | 49 (38.0%) |
| 45 to 54 Years | 44 (16.4%) | 173 (64.3%) |
| 55 to 64 Years | 142 (30.1%) | 274 (58.1%) |
| 65 to 74 Years | 351 (84.8%) | 273 (65.9%) |
| 75 Years and over | 331 (100.0%) | 248 (74.9%) |
| Total | 1,219 (44.9%) | 1,692 (62.3%) |
Disability Status by Sex by Age in Meredith
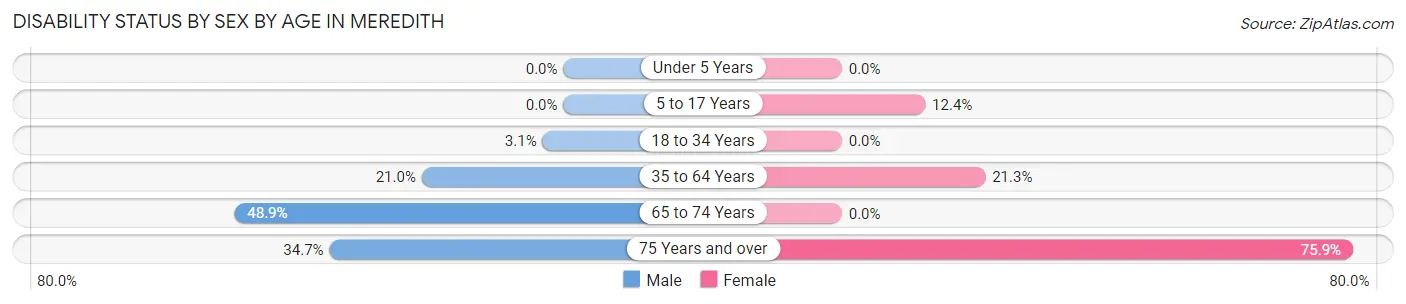
| Age Bracket | Male | Female |
| Under 5 Years | 0 (0.0%) | 0 (0.0%) |
| 5 to 17 Years | 0 (0.0%) | 25 (12.4%) |
| 18 to 34 Years | 12 (3.1%) | 0 (0.0%) |
| 35 to 64 Years | 102 (21.0%) | 82 (21.3%) |
| 65 to 74 Years | 106 (48.8%) | 0 (0.0%) |
| 75 Years and over | 66 (34.7%) | 107 (75.9%) |
Disability Class by Sex by Age in Meredith
Disability Class: Hearing Difficulty
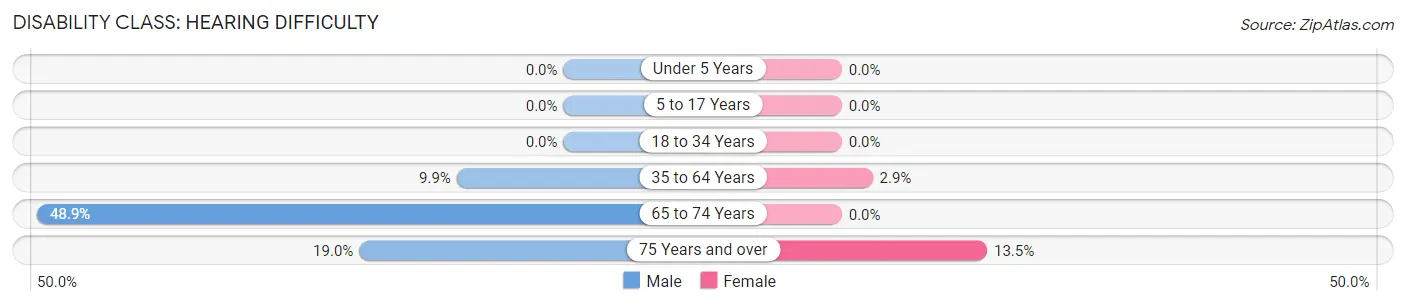
| Age Bracket | Male | Female |
| Under 5 Years | 0 (0.0%) | 0 (0.0%) |
| 5 to 17 Years | 0 (0.0%) | 0 (0.0%) |
| 18 to 34 Years | 0 (0.0%) | 0 (0.0%) |
| 35 to 64 Years | 48 (9.9%) | 11 (2.9%) |
| 65 to 74 Years | 106 (48.8%) | 0 (0.0%) |
| 75 Years and over | 36 (19.0%) | 19 (13.5%) |
Disability Class: Vision Difficulty
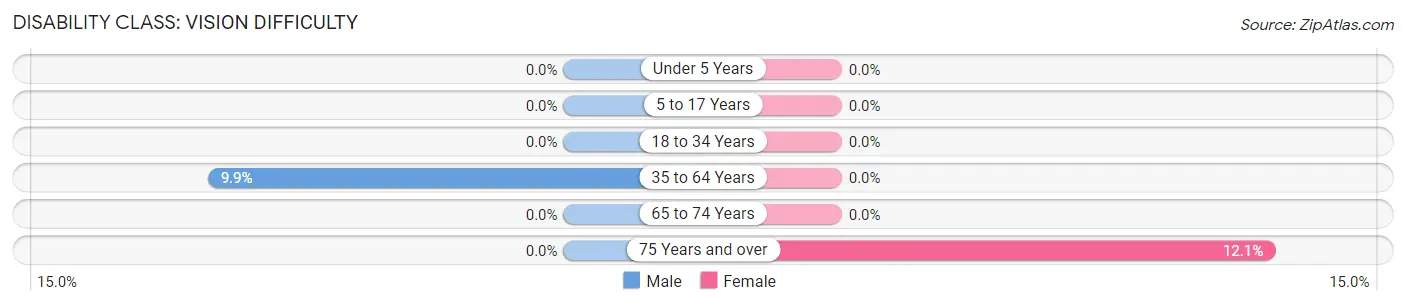
| Age Bracket | Male | Female |
| Under 5 Years | 0 (0.0%) | 0 (0.0%) |
| 5 to 17 Years | 0 (0.0%) | 0 (0.0%) |
| 18 to 34 Years | 0 (0.0%) | 0 (0.0%) |
| 35 to 64 Years | 48 (9.9%) | 0 (0.0%) |
| 65 to 74 Years | 0 (0.0%) | 0 (0.0%) |
| 75 Years and over | 0 (0.0%) | 17 (12.1%) |
Disability Class: Cognitive Difficulty
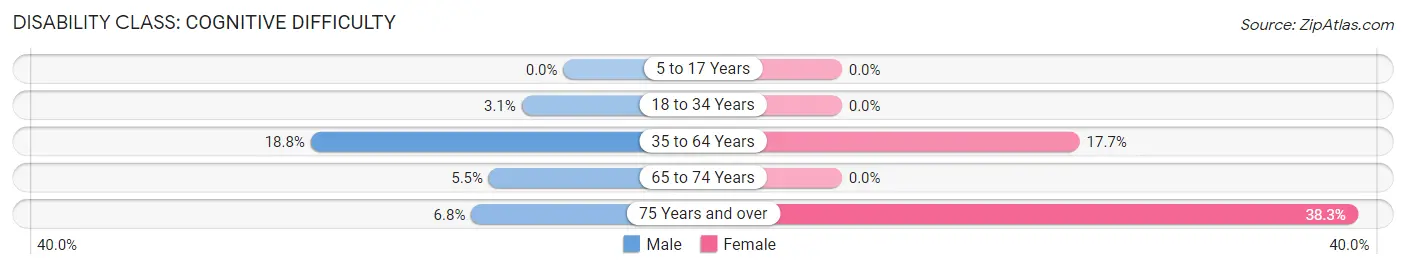
| Age Bracket | Male | Female |
| 5 to 17 Years | 0 (0.0%) | 0 (0.0%) |
| 18 to 34 Years | 12 (3.1%) | 0 (0.0%) |
| 35 to 64 Years | 91 (18.8%) | 68 (17.7%) |
| 65 to 74 Years | 12 (5.5%) | 0 (0.0%) |
| 75 Years and over | 13 (6.8%) | 54 (38.3%) |
Disability Class: Ambulatory Difficulty
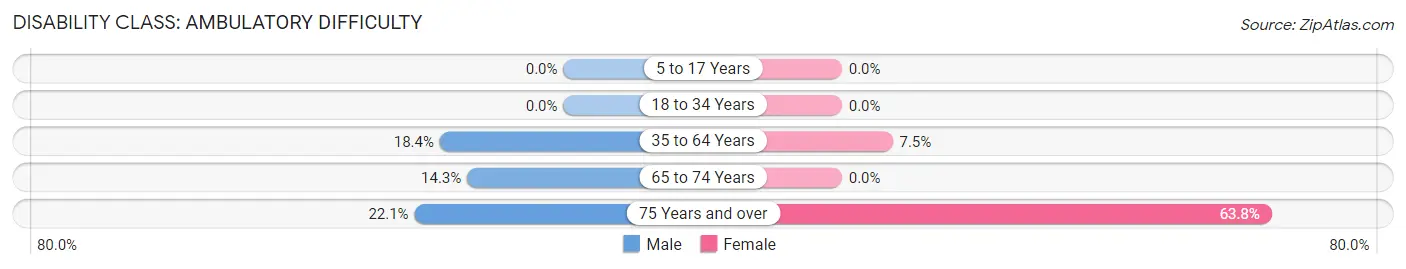
| Age Bracket | Male | Female |
| 5 to 17 Years | 0 (0.0%) | 0 (0.0%) |
| 18 to 34 Years | 0 (0.0%) | 0 (0.0%) |
| 35 to 64 Years | 89 (18.3%) | 29 (7.5%) |
| 65 to 74 Years | 31 (14.3%) | 0 (0.0%) |
| 75 Years and over | 42 (22.1%) | 90 (63.8%) |
Disability Class: Self-Care Difficulty
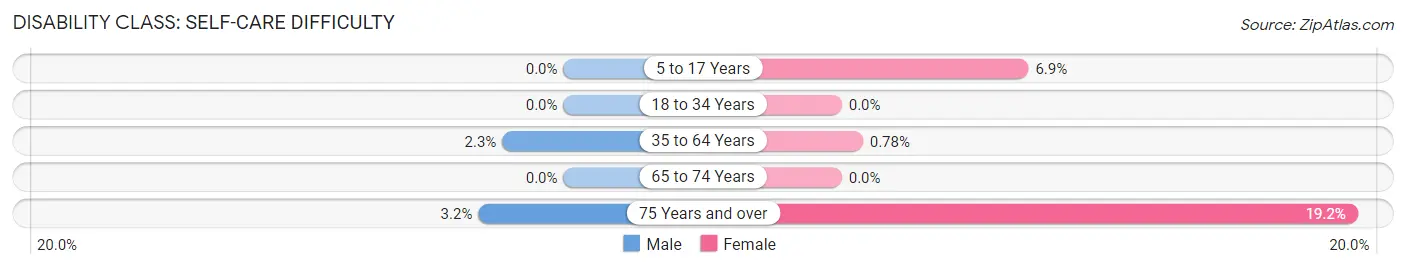
| Age Bracket | Male | Female |
| 5 to 17 Years | 0 (0.0%) | 14 (6.9%) |
| 18 to 34 Years | 0 (0.0%) | 0 (0.0%) |
| 35 to 64 Years | 11 (2.3%) | 3 (0.8%) |
| 65 to 74 Years | 0 (0.0%) | 0 (0.0%) |
| 75 Years and over | 6 (3.2%) | 27 (19.2%) |
Technology Access in Meredith
Computing Device Access in Meredith
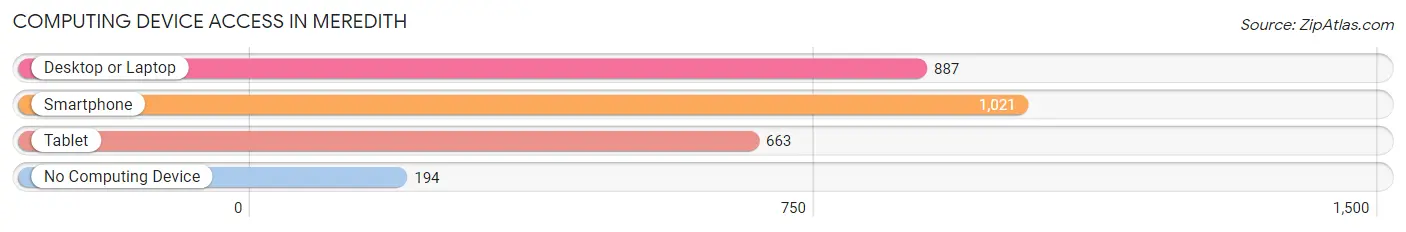
| Device Type | # Households | % Households |
| Desktop or Laptop | 887 | 67.2% |
| Smartphone | 1,021 | 77.4% |
| Tablet | 663 | 50.3% |
| No Computing Device | 194 | 14.7% |
| Total | 1,319 | 100.0% |
Internet Access in Meredith
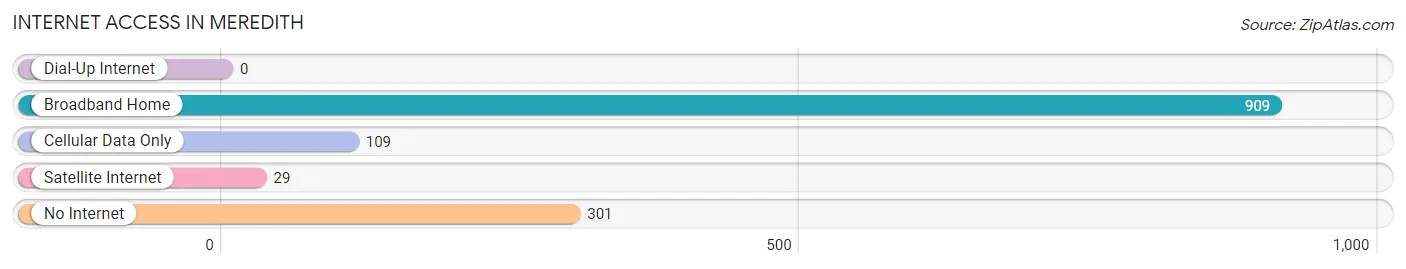
| Internet Type | # Households | % Households |
| Dial-Up Internet | 0 | 0.0% |
| Broadband Home | 909 | 68.9% |
| Cellular Data Only | 109 | 8.3% |
| Satellite Internet | 29 | 2.2% |
| No Internet | 301 | 22.8% |
| Total | 1,319 | 100.0% |
Meredith Summary
Meredith is a town located in Belknap County, New Hampshire, United States. The town is situated in the Lakes Region of the state, and is bordered by the towns of Center Harbor, Holderness, New Hampton, and Sandwich. As of the 2010 census, Meredith had a population of 6,241.
Geography
Meredith is located in the Lakes Region of New Hampshire, and is situated in the northern part of Belknap County. The town is bordered by Center Harbor to the north, Holderness to the east, New Hampton to the south, and Sandwich to the west. The town is located on the western shore of Lake Winnipesaukee, and is home to several smaller lakes, including Lake Waukewan, Lake Winnisquam, and Silver Lake. The town is also home to several mountains, including Mount Major, which has an elevation of 2,250 feet.
The town of Meredith has a total area of 33.2 square miles, of which 30.2 square miles is land and 3.0 square miles is water. The highest point in the town is the summit of Mount Major, which has an elevation of 2,250 feet.
Demographics
As of the 2010 census, there were 6,241 people, 2,717 households, and 1,845 families residing in the town. The population density was 206.7 people per square mile. There were 3,845 housing units, of which 2,717 were occupied. The racial makeup of the town was 97.3% White, 0.4% African American, 0.3% Native American, 0.6% Asian, 0.1% Pacific Islander, 0.3% from other races, and 1.0% from two or more races. Hispanic or Latino of any race were 1.2% of the population.
Economy
Meredith is home to several businesses, including several restaurants, retail stores, and a variety of other services. The town is also home to several marinas, which provide access to Lake Winnipesaukee and the surrounding lakes. The town is also home to several resorts, which provide lodging and recreational activities for visitors.
The town is also home to several manufacturing companies, including a paper mill, a plastics manufacturer, and a metal fabrication company. The town is also home to several farms, which produce a variety of products, including dairy, beef, and vegetables.
The town is also home to several tourist attractions, including the Winnipesaukee Scenic Railroad, the Meredith Historical Society, and the Meredith Children's Museum. The town is also home to several parks, including the Meredith Town Beach, which provides access to Lake Winnipesaukee.
Conclusion
Meredith is a town located in Belknap County, New Hampshire, United States. The town is situated in the Lakes Region of the state, and is bordered by the towns of Center Harbor, Holderness, New Hampton, and Sandwich. As of the 2010 census, Meredith had a population of 6,241. The town is located on the western shore of Lake Winnipesaukee, and is home to several smaller lakes, including Lake Waukewan, Lake Winnisquam, and Silver Lake. The town is also home to several businesses, including several restaurants, retail stores, and a variety of other services. The town is also home to several marinas, resorts, manufacturing companies, farms, and tourist attractions.
Common Questions
What is Per Capita Income in Meredith?
Per Capita income in Meredith is $36,997.
What is the Median Family Income in Meredith?
Median Family Income in Meredith is $82,727.
What is the Median Household income in Meredith?
Median Household Income in Meredith is $46,850.
What is Income or Wage Gap in Meredith?
Income or Wage Gap in Meredith is 17.1%.
Women in Meredith earn 82.9 cents for every dollar earned by a man.
What is Inequality or Gini Index in Meredith?
Inequality or Gini Index in Meredith is 0.46.
What is the Total Population of Meredith?
Total Population of Meredith is 2,758.
What is the Total Male Population of Meredith?
Total Male Population of Meredith is 1,488.
What is the Total Female Population of Meredith?
Total Female Population of Meredith is 1,270.
What is the Ratio of Males per 100 Females in Meredith?
There are 117.17 Males per 100 Females in Meredith.
What is the Ratio of Females per 100 Males in Meredith?
There are 85.35 Females per 100 Males in Meredith.
What is the Median Population Age in Meredith?
Median Population Age in Meredith is 50.8 Years.
What is the Average Family Size in Meredith
Average Family Size in Meredith is 3.0 People.
What is the Average Household Size in Meredith
Average Household Size in Meredith is 2.1 People.
How Large is the Labor Force in Meredith?
There are 1,252 People in the Labor Forcein in Meredith.
What is the Percentage of People in the Labor Force in Meredith?
52.2% of People are in the Labor Force in Meredith.
What is the Unemployment Rate in Meredith?
Unemployment Rate in Meredith is 6.5%.