Ashland, NH Map & Demographics
Ashland Map
Ashland Overview
$25,740
PER CAPITA INCOME
$58,269
AVG FAMILY INCOME
$40,559
AVG HOUSEHOLD INCOME
6.7%
WAGE / INCOME GAP [ % ]
93.3¢/ $1
WAGE / INCOME GAP [ $ ]
0.47
INEQUALITY / GINI INDEX
1,520
TOTAL POPULATION
783
MALE POPULATION
737
FEMALE POPULATION
106.24
MALES / 100 FEMALES
94.13
FEMALES / 100 MALES
29.1
MEDIAN AGE
3.1
AVG FAMILY SIZE
2.2
AVG HOUSEHOLD SIZE
720
LABOR FORCE [ PEOPLE ]
65.1%
PERCENT IN LABOR FORCE
2.6%
UNEMPLOYMENT RATE
Ashland Zip Codes
Ashland Area Codes
Income in Ashland
Income Overview in Ashland
Per Capita Income in Ashland is $25,740, while median incomes of families and households are $58,269 and $40,559 respectively.
| Characteristic | Number | Measure |
| Per Capita Income | 1,520 | $25,740 |
| Median Family Income | 346 | $58,269 |
| Mean Family Income | 346 | $70,741 |
| Median Household Income | 681 | $40,559 |
| Mean Household Income | 681 | $56,016 |
| Income Deficit | 346 | $0 |
| Wage / Income Gap (%) | 1,520 | 6.70% |
| Wage / Income Gap ($) | 1,520 | 93.30¢ per $1 |
| Gini / Inequality Index | 1,520 | 0.47 |
Earnings by Sex in Ashland
Average Earnings in Ashland are $34,493, $35,588 for men and $33,203 for women, a difference of 6.7%.
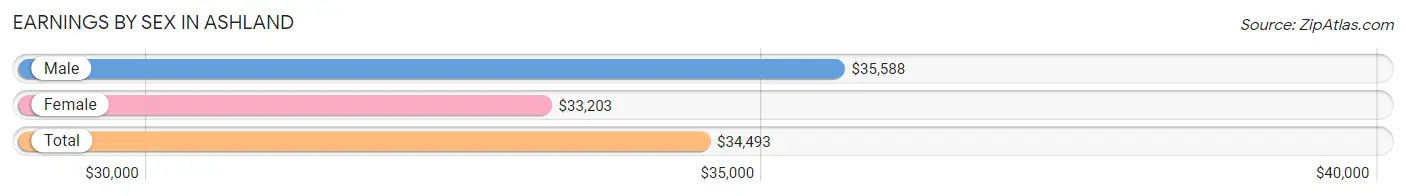
| Sex | Number | Average Earnings |
| Male | 374 (46.3%) | $35,588 |
| Female | 433 (53.7%) | $33,203 |
| Total | 807 (100.0%) | $34,493 |
Earnings by Sex by Income Bracket in Ashland
The most common earnings brackets in Ashland are $30,000 to $34,999 for men (54 | 14.4%) and $40,000 to $44,999 for women (71 | 16.4%).
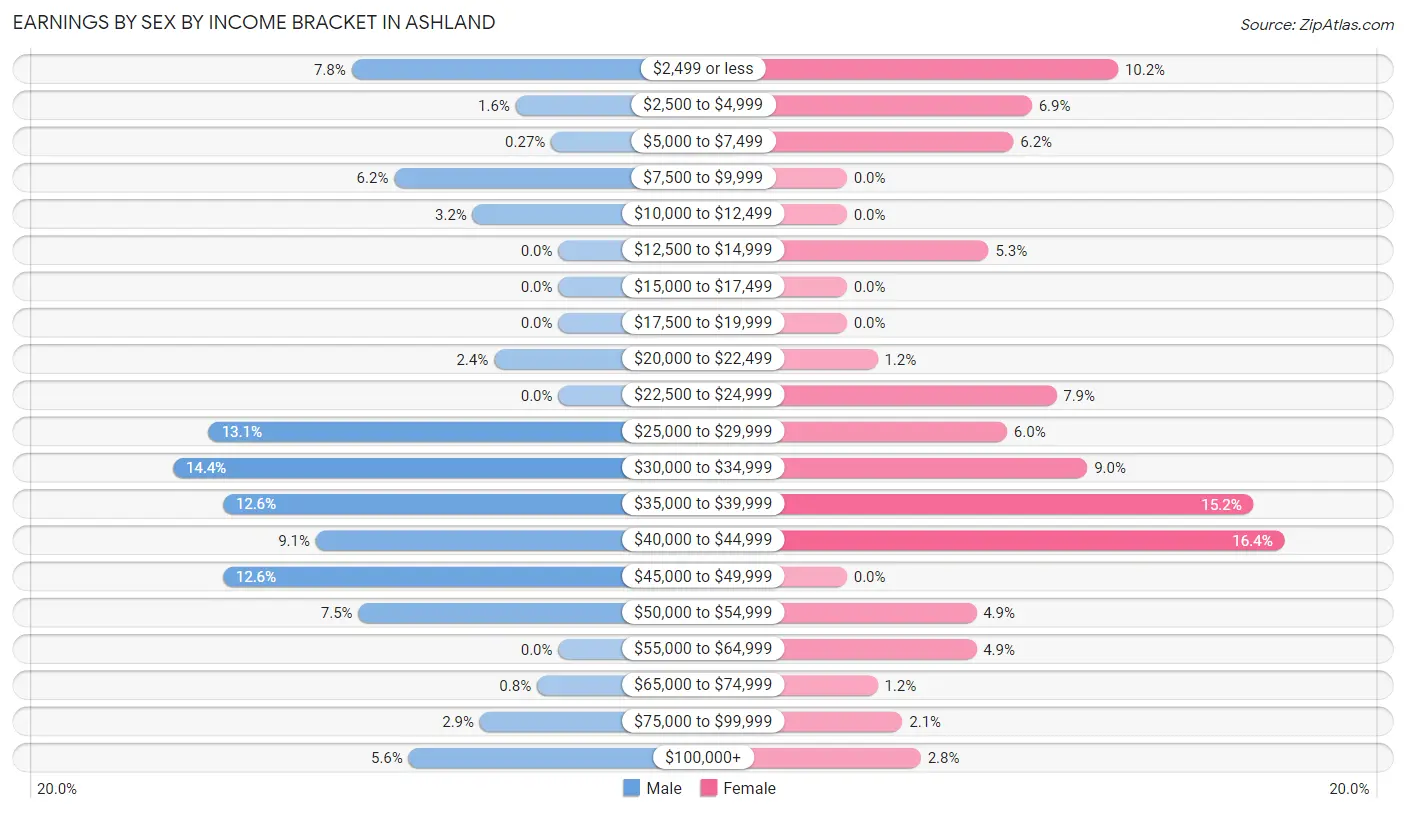
| Income | Male | Female |
| $2,499 or less | 29 (7.7%) | 44 (10.2%) |
| $2,500 to $4,999 | 6 (1.6%) | 30 (6.9%) |
| $5,000 to $7,499 | 1 (0.3%) | 27 (6.2%) |
| $7,500 to $9,999 | 23 (6.1%) | 0 (0.0%) |
| $10,000 to $12,499 | 12 (3.2%) | 0 (0.0%) |
| $12,500 to $14,999 | 0 (0.0%) | 23 (5.3%) |
| $15,000 to $17,499 | 0 (0.0%) | 0 (0.0%) |
| $17,500 to $19,999 | 0 (0.0%) | 0 (0.0%) |
| $20,000 to $22,499 | 9 (2.4%) | 5 (1.1%) |
| $22,500 to $24,999 | 0 (0.0%) | 34 (7.9%) |
| $25,000 to $29,999 | 49 (13.1%) | 26 (6.0%) |
| $30,000 to $34,999 | 54 (14.4%) | 39 (9.0%) |
| $35,000 to $39,999 | 47 (12.6%) | 66 (15.2%) |
| $40,000 to $44,999 | 34 (9.1%) | 71 (16.4%) |
| $45,000 to $49,999 | 47 (12.6%) | 0 (0.0%) |
| $50,000 to $54,999 | 28 (7.5%) | 21 (4.9%) |
| $55,000 to $64,999 | 0 (0.0%) | 21 (4.9%) |
| $65,000 to $74,999 | 3 (0.8%) | 5 (1.1%) |
| $75,000 to $99,999 | 11 (2.9%) | 9 (2.1%) |
| $100,000+ | 21 (5.6%) | 12 (2.8%) |
| Total | 374 (100.0%) | 433 (100.0%) |
Earnings by Sex by Educational Attainment in Ashland
Average earnings in Ashland are $37,833 for men and $38,824 for women, a difference of 2.5%. Men with an educational attainment of graduate degree enjoy the highest average annual earnings of $39,100, while those with high school diploma education earn the least with $32,462. Women with an educational attainment of college or associate's degree earn the most with the average annual earnings of $40,758, while those with bachelor's degree education have the smallest earnings of $2,499.
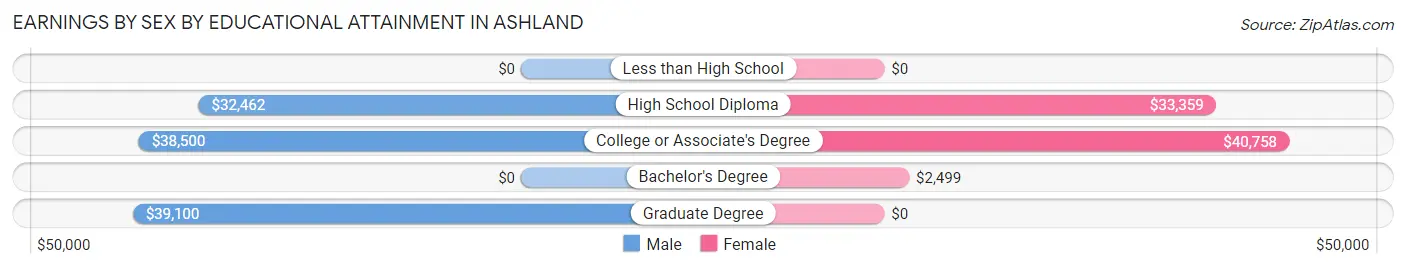
| Educational Attainment | Male Income | Female Income |
| Less than High School | - | - |
| High School Diploma | $32,462 | $33,359 |
| College or Associate's Degree | $38,500 | $40,758 |
| Bachelor's Degree | - | - |
| Graduate Degree | $39,100 | $0 |
| Total | $37,833 | $38,824 |
Family Income in Ashland
Family Income Brackets in Ashland
According to the Ashland family income data, there are 79 families falling into the $50,000 to $74,999 income range, which is the most common income bracket and makes up 22.8% of all families. Conversely, the $10,000 to $14,999 income bracket is the least frequent group with only 6 families (1.7%) belonging to this category.
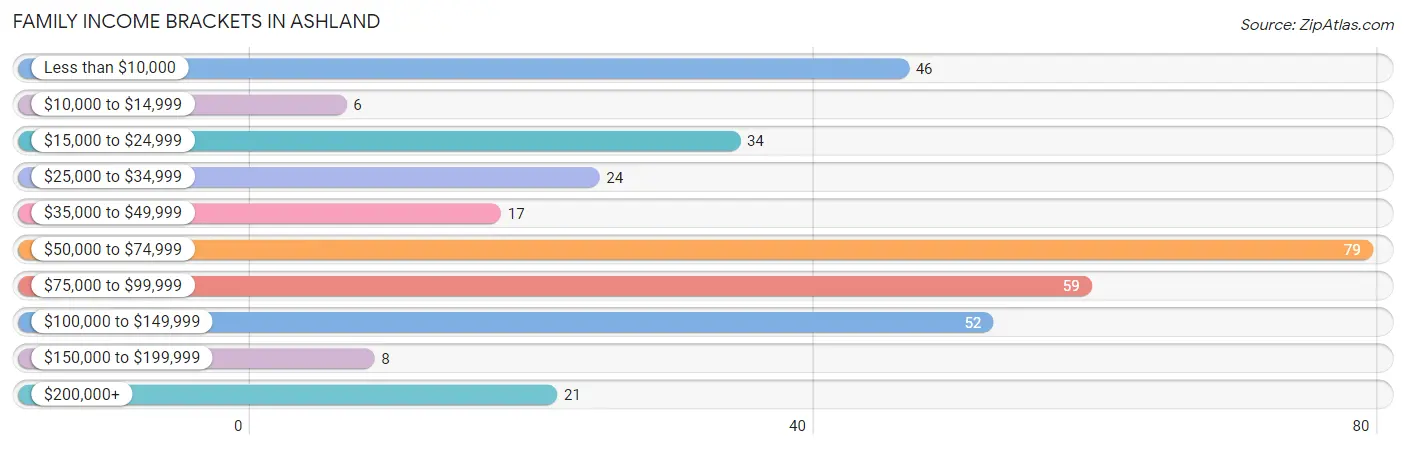
| Income Bracket | # Families | % Families |
| Less than $10,000 | 46 | 13.3% |
| $10,000 to $14,999 | 6 | 1.7% |
| $15,000 to $24,999 | 34 | 9.8% |
| $25,000 to $34,999 | 24 | 6.9% |
| $35,000 to $49,999 | 17 | 4.9% |
| $50,000 to $74,999 | 79 | 22.8% |
| $75,000 to $99,999 | 59 | 17.1% |
| $100,000 to $149,999 | 52 | 15.0% |
| $150,000 to $199,999 | 8 | 2.3% |
| $200,000+ | 21 | 6.1% |
Family Income by Famaliy Size in Ashland
2-person families (175 | 50.6%) account for the highest median family income in Ashland with $80,720 per family, while 2-person families (175 | 50.6%) have the highest median income of $40,360 per family member.
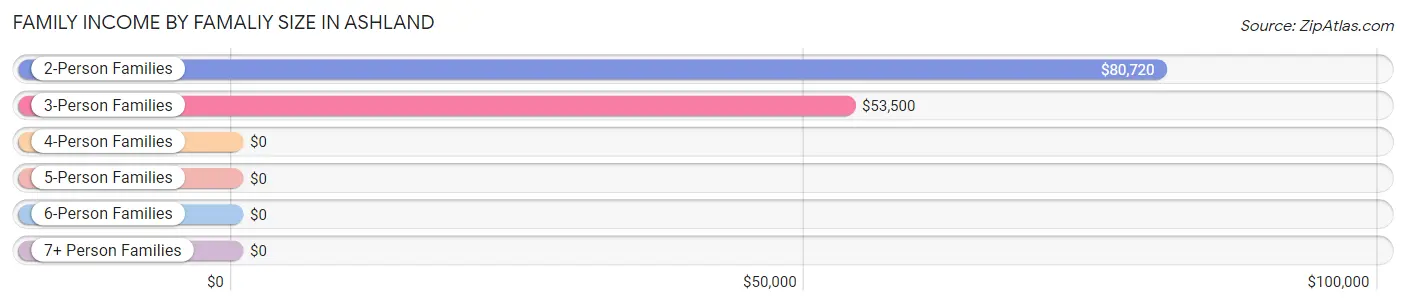
| Income Bracket | # Families | Median Income |
| 2-Person Families | 175 (50.6%) | $80,720 |
| 3-Person Families | 52 (15.0%) | $53,500 |
| 4-Person Families | 103 (29.8%) | $0 |
| 5-Person Families | 0 (0.0%) | $0 |
| 6-Person Families | 6 (1.7%) | $0 |
| 7+ Person Families | 10 (2.9%) | $0 |
| Total | 346 (100.0%) | $58,269 |
Family Income by Number of Earners in Ashland
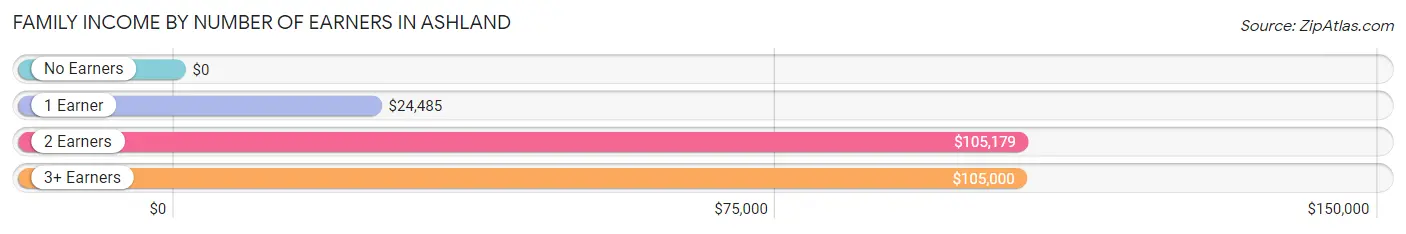
| Number of Earners | # Families | Median Income |
| No Earners | 38 (11.0%) | $0 |
| 1 Earner | 148 (42.8%) | $24,485 |
| 2 Earners | 128 (37.0%) | $105,179 |
| 3+ Earners | 32 (9.2%) | $105,000 |
| Total | 346 (100.0%) | $58,269 |
Household Income in Ashland
Household Income Brackets in Ashland
With 113 households falling in the category, the $50,000 to $74,999 income range is the most frequent in Ashland, accounting for 16.6% of all households. In contrast, only 19 households (2.8%) fall into the $10,000 to $14,999 income bracket, making it the least populous group.
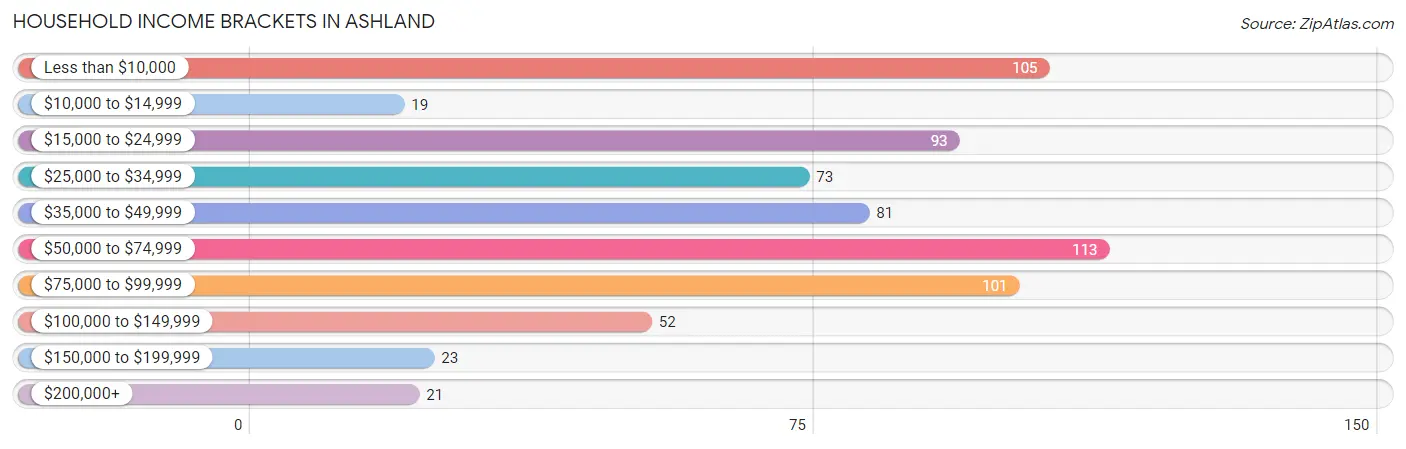
| Income Bracket | # Households | % Households |
| Less than $10,000 | 105 | 15.4% |
| $10,000 to $14,999 | 19 | 2.8% |
| $15,000 to $24,999 | 93 | 13.7% |
| $25,000 to $34,999 | 73 | 10.7% |
| $35,000 to $49,999 | 81 | 11.9% |
| $50,000 to $74,999 | 113 | 16.6% |
| $75,000 to $99,999 | 101 | 14.8% |
| $100,000 to $149,999 | 52 | 7.6% |
| $150,000 to $199,999 | 23 | 3.4% |
| $200,000+ | 21 | 3.1% |
Household Income by Householder Age in Ashland
The median household income in Ashland is $40,559, with the highest median household income of $50,833 found in the 45 to 64 years age bracket for the primary householder. A total of 180 households (26.4%) fall into this category. Meanwhile, the 25 to 44 years age bracket for the primary householder has the lowest median household income of $0, with 190 households (27.9%) in this group.

| Income Bracket | # Households | Median Income |
| 15 to 24 Years | 88 (12.9%) | $23,529 |
| 25 to 44 Years | 190 (27.9%) | $0 |
| 45 to 64 Years | 180 (26.4%) | $50,833 |
| 65+ Years | 223 (32.8%) | $41,016 |
| Total | 681 (100.0%) | $40,559 |
Poverty in Ashland
Income Below Poverty by Sex and Age in Ashland
With 37.2% poverty level for males and 27.5% for females among the residents of Ashland, 5 year old males and under 5 year old females are the most vulnerable to poverty, with 43 males (100.0%) and 31 females (73.8%) in their respective age groups living below the poverty level.
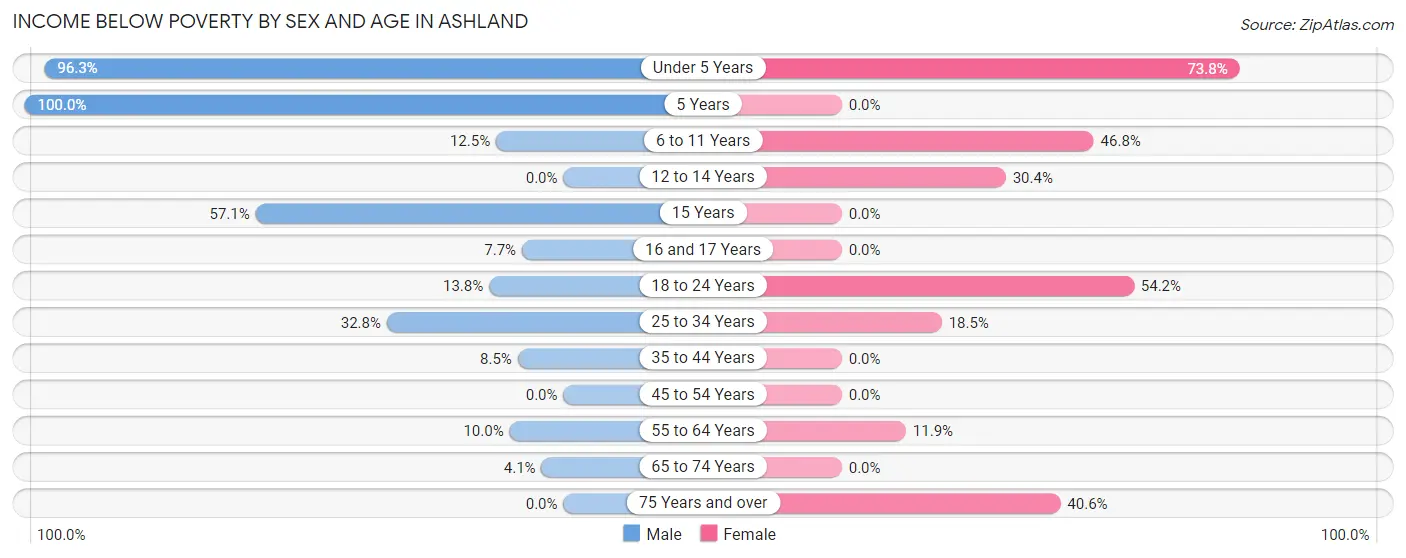
| Age Bracket | Male | Female |
| Under 5 Years | 157 (96.3%) | 31 (73.8%) |
| 5 Years | 43 (100.0%) | 0 (0.0%) |
| 6 to 11 Years | 5 (12.5%) | 36 (46.8%) |
| 12 to 14 Years | 0 (0.0%) | 7 (30.4%) |
| 15 Years | 8 (57.1%) | 0 (0.0%) |
| 16 and 17 Years | 1 (7.7%) | 0 (0.0%) |
| 18 to 24 Years | 4 (13.8%) | 58 (54.2%) |
| 25 to 34 Years | 58 (32.8%) | 28 (18.5%) |
| 35 to 44 Years | 5 (8.5%) | 0 (0.0%) |
| 45 to 54 Years | 0 (0.0%) | 0 (0.0%) |
| 55 to 64 Years | 5 (10.0%) | 15 (11.9%) |
| 65 to 74 Years | 5 (4.1%) | 0 (0.0%) |
| 75 Years and over | 0 (0.0%) | 28 (40.6%) |
| Total | 291 (37.2%) | 203 (27.5%) |
Income Above Poverty by Sex and Age in Ashland
According to the poverty statistics in Ashland, males aged 12 to 14 years and females aged 16 and 17 years are the age groups that are most secure financially, with 100.0% of males and 100.0% of females in these age groups living above the poverty line.
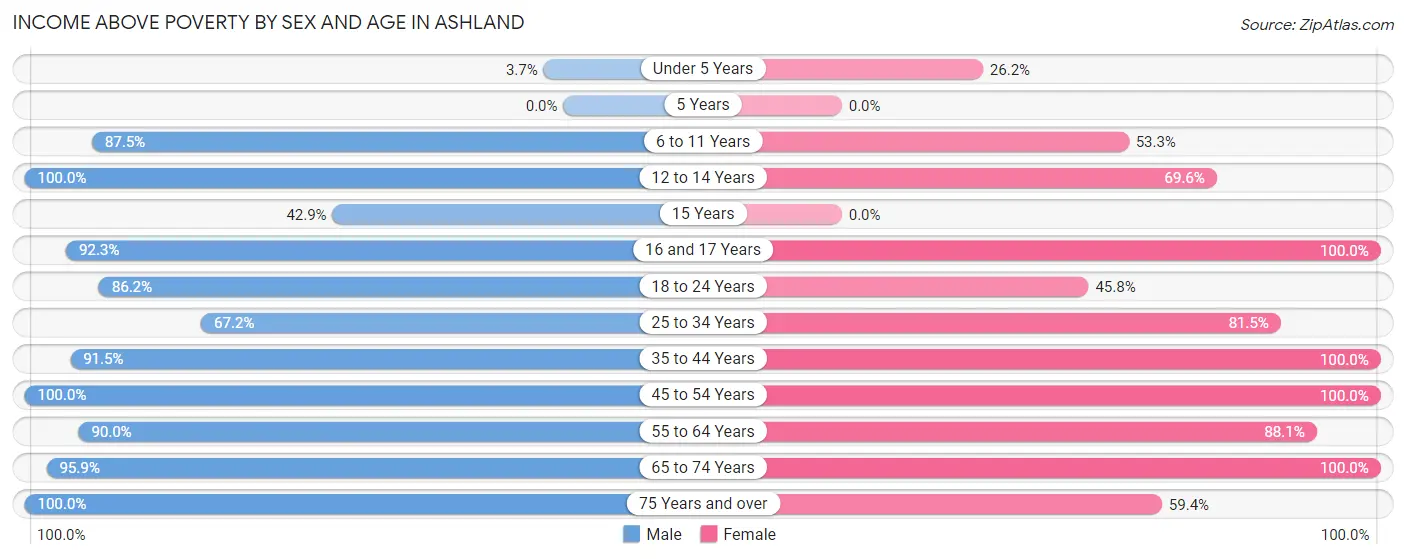
| Age Bracket | Male | Female |
| Under 5 Years | 6 (3.7%) | 11 (26.2%) |
| 5 Years | 0 (0.0%) | 0 (0.0%) |
| 6 to 11 Years | 35 (87.5%) | 41 (53.2%) |
| 12 to 14 Years | 12 (100.0%) | 16 (69.6%) |
| 15 Years | 6 (42.9%) | 0 (0.0%) |
| 16 and 17 Years | 12 (92.3%) | 16 (100.0%) |
| 18 to 24 Years | 25 (86.2%) | 49 (45.8%) |
| 25 to 34 Years | 119 (67.2%) | 123 (81.5%) |
| 35 to 44 Years | 54 (91.5%) | 17 (100.0%) |
| 45 to 54 Years | 59 (100.0%) | 32 (100.0%) |
| 55 to 64 Years | 45 (90.0%) | 111 (88.1%) |
| 65 to 74 Years | 118 (95.9%) | 77 (100.0%) |
| 75 Years and over | 1 (100.0%) | 41 (59.4%) |
| Total | 492 (62.8%) | 534 (72.5%) |
Income Below Poverty Among Married-Couple Families in Ashland
The poverty statistics for married-couple families in Ashland show that 16.4% or 40 of the total 244 families live below the poverty line. Families with 3 or 4 children have the highest poverty rate of 100.0%, comprising of 6 families. On the other hand, families with no children have the lowest poverty rate of 0.0%, which includes 0 families.
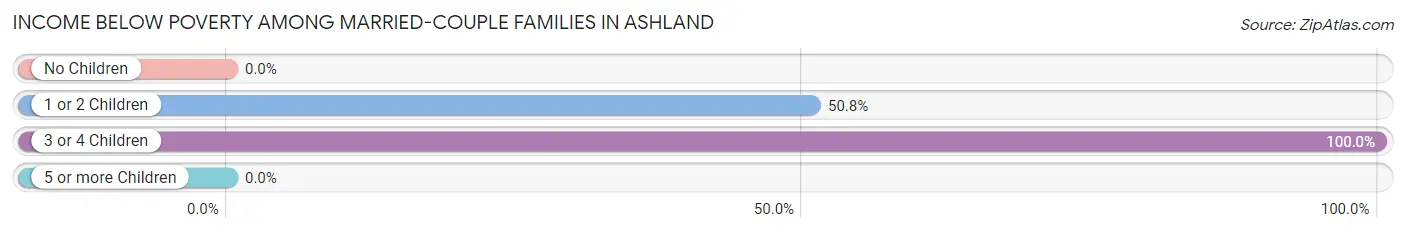
| Children | Above Poverty | Below Poverty |
| No Children | 161 (100.0%) | 0 (0.0%) |
| 1 or 2 Children | 33 (49.2%) | 34 (50.7%) |
| 3 or 4 Children | 0 (0.0%) | 6 (100.0%) |
| 5 or more Children | 10 (100.0%) | 0 (0.0%) |
| Total | 204 (83.6%) | 40 (16.4%) |
Income Below Poverty Among Single-Parent Households in Ashland
According to the poverty data in Ashland, 26.1% or 6 single-father households and 50.6% or 40 single-mother households are living below the poverty line. Among single-father households, those with 3 or 4 children have the highest poverty rate, with 1 households (100.0%) experiencing poverty. Likewise, among single-mother households, those with 3 or 4 children have the highest poverty rate, with 40 households (100.0%) falling below the poverty line.
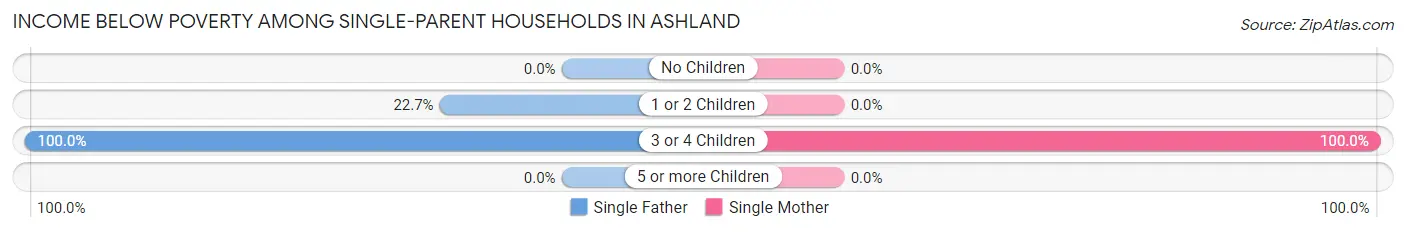
| Children | Single Father | Single Mother |
| No Children | 0 (0.0%) | 0 (0.0%) |
| 1 or 2 Children | 5 (22.7%) | 0 (0.0%) |
| 3 or 4 Children | 1 (100.0%) | 40 (100.0%) |
| 5 or more Children | 0 (0.0%) | 0 (0.0%) |
| Total | 6 (26.1%) | 40 (50.6%) |
Income Below Poverty Among Married-Couple vs Single-Parent Households in Ashland
The poverty data for Ashland shows that 40 of the married-couple family households (16.4%) and 46 of the single-parent households (45.1%) are living below the poverty level. Within the married-couple family households, those with 3 or 4 children have the highest poverty rate, with 6 households (100.0%) falling below the poverty line. Among the single-parent households, those with 3 or 4 children have the highest poverty rate, with 41 household (100.0%) living below poverty.
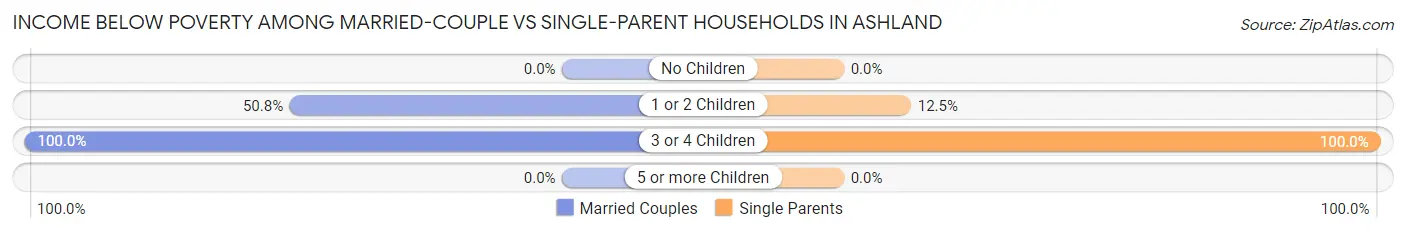
| Children | Married-Couple Families | Single-Parent Households |
| No Children | 0 (0.0%) | 0 (0.0%) |
| 1 or 2 Children | 34 (50.7%) | 5 (12.5%) |
| 3 or 4 Children | 6 (100.0%) | 41 (100.0%) |
| 5 or more Children | 0 (0.0%) | 0 (0.0%) |
| Total | 40 (16.4%) | 46 (45.1%) |
Race in Ashland
The most populous races in Ashland are White / Caucasian (1,261 | 83.0%), Two or more Races (218 | 14.3%), and Hispanic or Latino (37 | 2.4%).
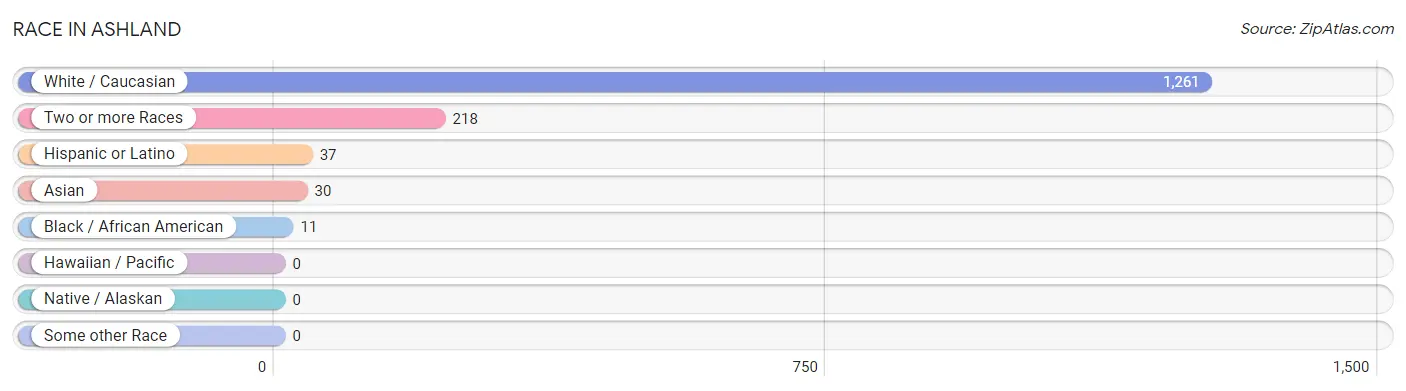
| Race | # Population | % Population |
| Asian | 30 | 2.0% |
| Black / African American | 11 | 0.7% |
| Hawaiian / Pacific | 0 | 0.0% |
| Hispanic or Latino | 37 | 2.4% |
| Native / Alaskan | 0 | 0.0% |
| White / Caucasian | 1,261 | 83.0% |
| Two or more Races | 218 | 14.3% |
| Some other Race | 0 | 0.0% |
| Total | 1,520 | 100.0% |
Ancestry in Ashland
The most populous ancestries reported in Ashland are Irish (306 | 20.1%), English (273 | 18.0%), French (137 | 9.0%), German (127 | 8.4%), and French Canadian (96 | 6.3%), together accounting for 61.8% of all Ashland residents.
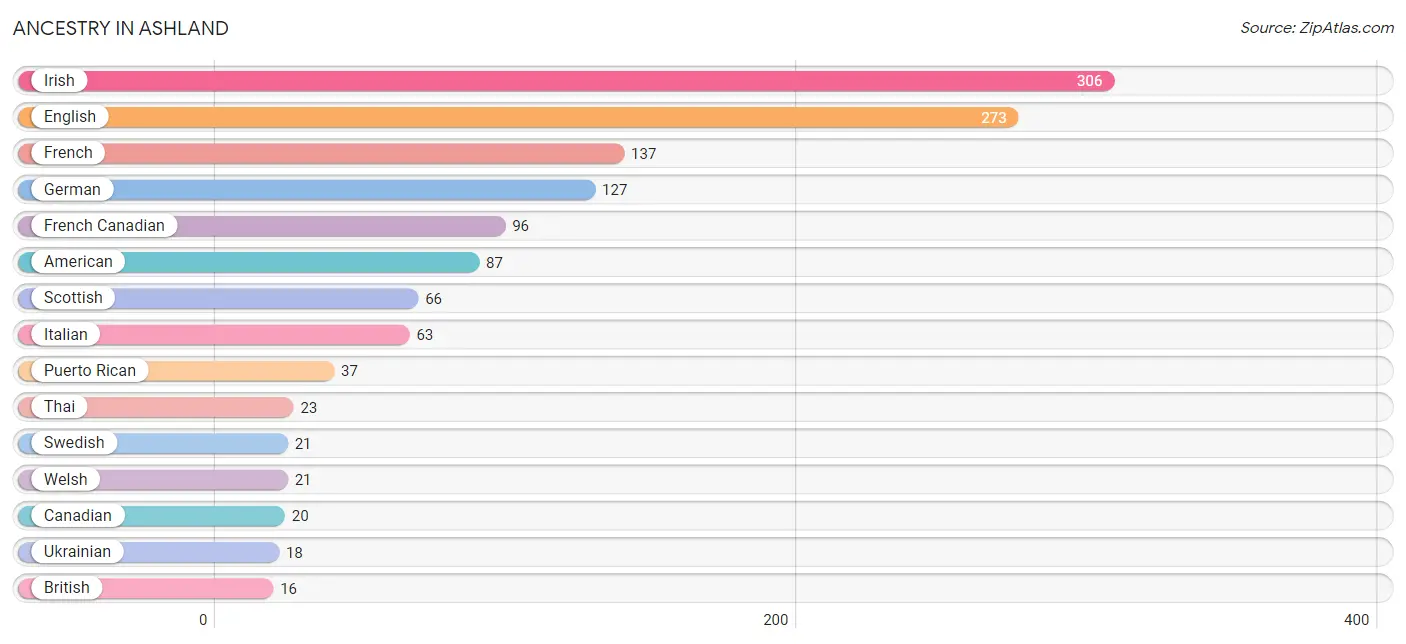
| Ancestry | # Population | % Population |
| American | 87 | 5.7% |
| Arab | 4 | 0.3% |
| Belgian | 4 | 0.3% |
| British | 16 | 1.1% |
| Canadian | 20 | 1.3% |
| Cherokee | 13 | 0.9% |
| English | 273 | 18.0% |
| French | 137 | 9.0% |
| French Canadian | 96 | 6.3% |
| German | 127 | 8.4% |
| Greek | 4 | 0.3% |
| Irish | 306 | 20.1% |
| Italian | 63 | 4.1% |
| Malaysian | 7 | 0.5% |
| Polish | 13 | 0.9% |
| Portuguese | 13 | 0.9% |
| Puerto Rican | 37 | 2.4% |
| Russian | 3 | 0.2% |
| Scotch-Irish | 8 | 0.5% |
| Scottish | 66 | 4.3% |
| Swedish | 21 | 1.4% |
| Thai | 23 | 1.5% |
| Ukrainian | 18 | 1.2% |
| Welsh | 21 | 1.4% | View All 24 Rows |
Immigrants in Ashland
The most numerous immigrant groups reported in Ashland came from Asia (23 | 1.5%), India (23 | 1.5%), South Central Asia (23 | 1.5%), Europe (8 | 0.5%), and Northern Europe (8 | 0.5%), together accounting for 5.6% of all Ashland residents.
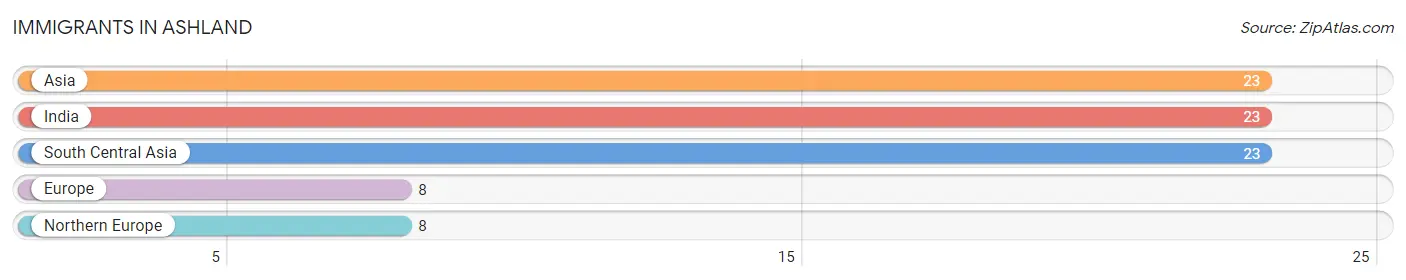
| Immigration Origin | # Population | % Population |
| Asia | 23 | 1.5% |
| Europe | 8 | 0.5% |
| India | 23 | 1.5% |
| Northern Europe | 8 | 0.5% |
| South Central Asia | 23 | 1.5% | View All 5 Rows |
Sex and Age in Ashland
Sex and Age in Ashland
The most populous age groups in Ashland are Under 5 Years (163 | 20.8%) for men and 25 to 29 Years (100 | 13.6%) for women.
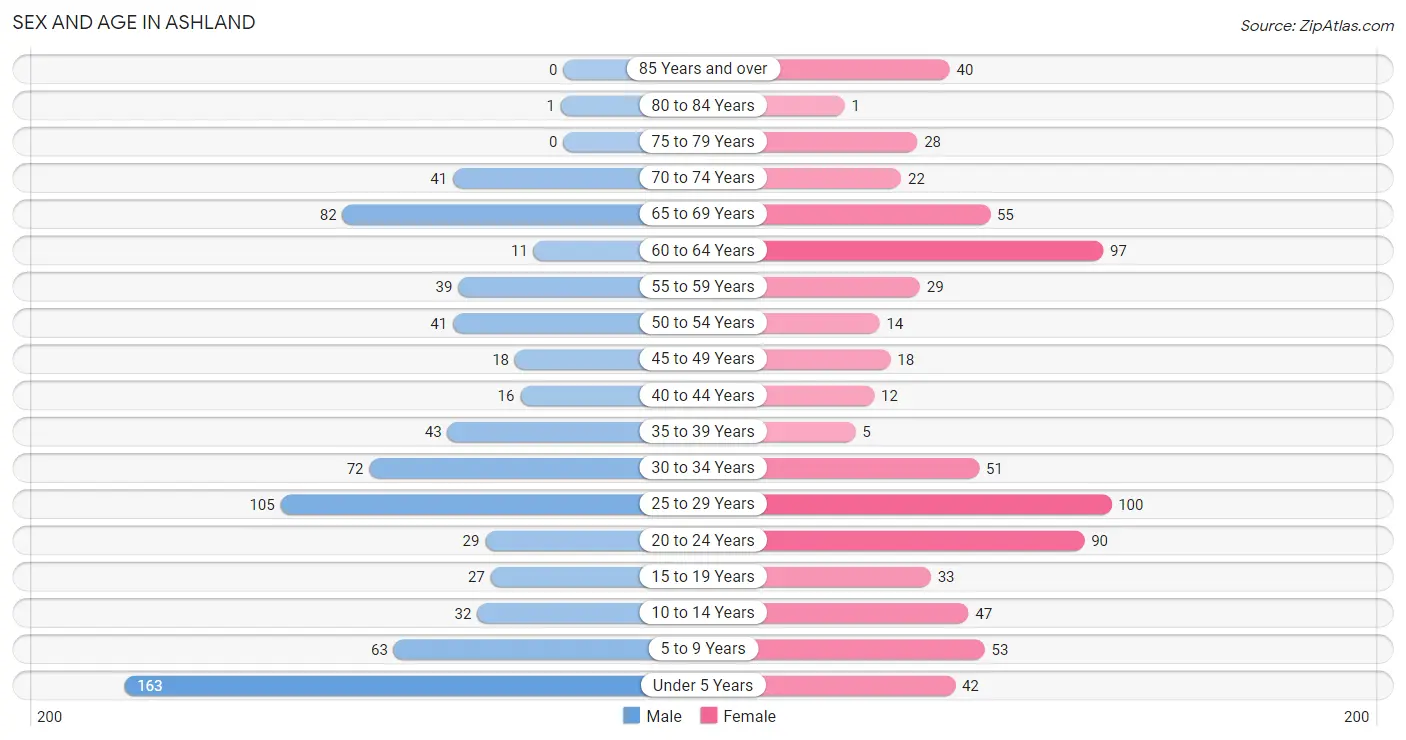
| Age Bracket | Male | Female |
| Under 5 Years | 163 (20.8%) | 42 (5.7%) |
| 5 to 9 Years | 63 (8.1%) | 53 (7.2%) |
| 10 to 14 Years | 32 (4.1%) | 47 (6.4%) |
| 15 to 19 Years | 27 (3.5%) | 33 (4.5%) |
| 20 to 24 Years | 29 (3.7%) | 90 (12.2%) |
| 25 to 29 Years | 105 (13.4%) | 100 (13.6%) |
| 30 to 34 Years | 72 (9.2%) | 51 (6.9%) |
| 35 to 39 Years | 43 (5.5%) | 5 (0.7%) |
| 40 to 44 Years | 16 (2.0%) | 12 (1.6%) |
| 45 to 49 Years | 18 (2.3%) | 18 (2.4%) |
| 50 to 54 Years | 41 (5.2%) | 14 (1.9%) |
| 55 to 59 Years | 39 (5.0%) | 29 (3.9%) |
| 60 to 64 Years | 11 (1.4%) | 97 (13.2%) |
| 65 to 69 Years | 82 (10.5%) | 55 (7.5%) |
| 70 to 74 Years | 41 (5.2%) | 22 (3.0%) |
| 75 to 79 Years | 0 (0.0%) | 28 (3.8%) |
| 80 to 84 Years | 1 (0.1%) | 1 (0.1%) |
| 85 Years and over | 0 (0.0%) | 40 (5.4%) |
| Total | 783 (100.0%) | 737 (100.0%) |
Families and Households in Ashland
Median Family Size in Ashland
The median family size in Ashland is 3.13 persons per family, with single female/mother families (79 | 22.8%) accounting for the largest median family size of 4.16 persons per family. On the other hand, single male/father families (23 | 6.7%) represent the smallest median family size with 2.30 persons per family.
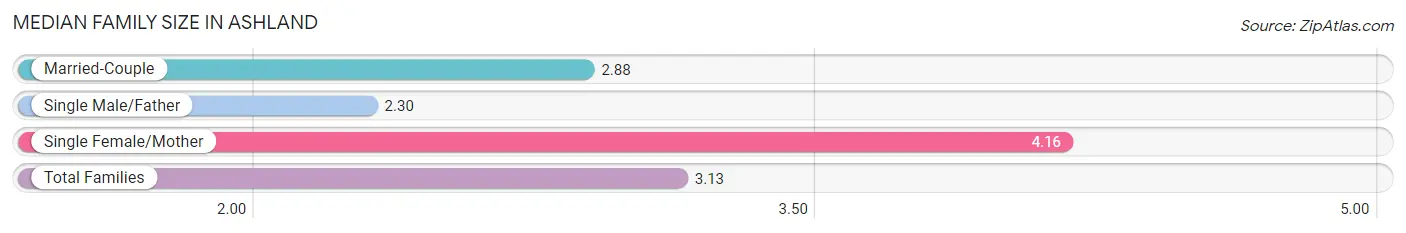
| Family Type | # Families | Family Size |
| Married-Couple | 244 (70.5%) | 2.88 |
| Single Male/Father | 23 (6.7%) | 2.30 |
| Single Female/Mother | 79 (22.8%) | 4.16 |
| Total Families | 346 (100.0%) | 3.13 |
Median Household Size in Ashland
The median household size in Ashland is 2.23 persons per household, with single female/mother households (79 | 11.6%) accounting for the largest median household size of 4.27 persons per household. non-family households (335 | 49.2%) represent the smallest median household size with 1.28 persons per household.
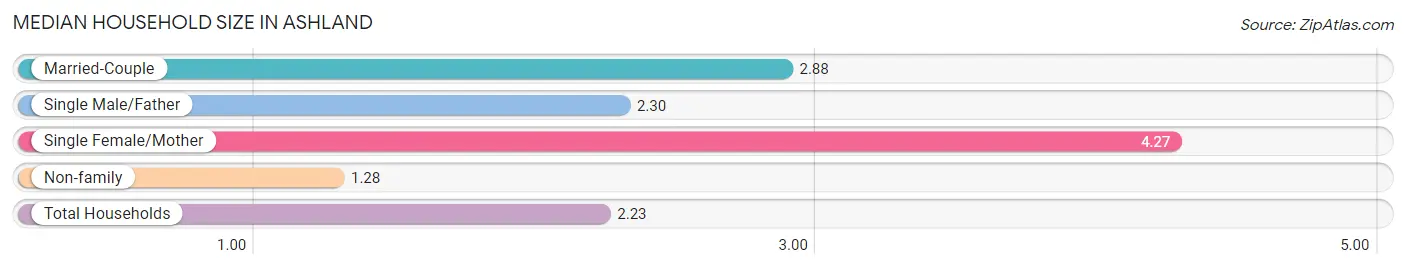
| Household Type | # Households | Household Size |
| Married-Couple | 244 (35.8%) | 2.88 |
| Single Male/Father | 23 (3.4%) | 2.30 |
| Single Female/Mother | 79 (11.6%) | 4.27 |
| Non-family | 335 (49.2%) | 1.28 |
| Total Households | 681 (100.0%) | 2.23 |
Household Size by Marriage Status in Ashland
Out of a total of 681 households in Ashland, 346 (50.8%) are family households, while 335 (49.2%) are nonfamily households. The most numerous type of family households are 2-person households, comprising 175, and the most common type of nonfamily households are 1-person households, comprising 273.
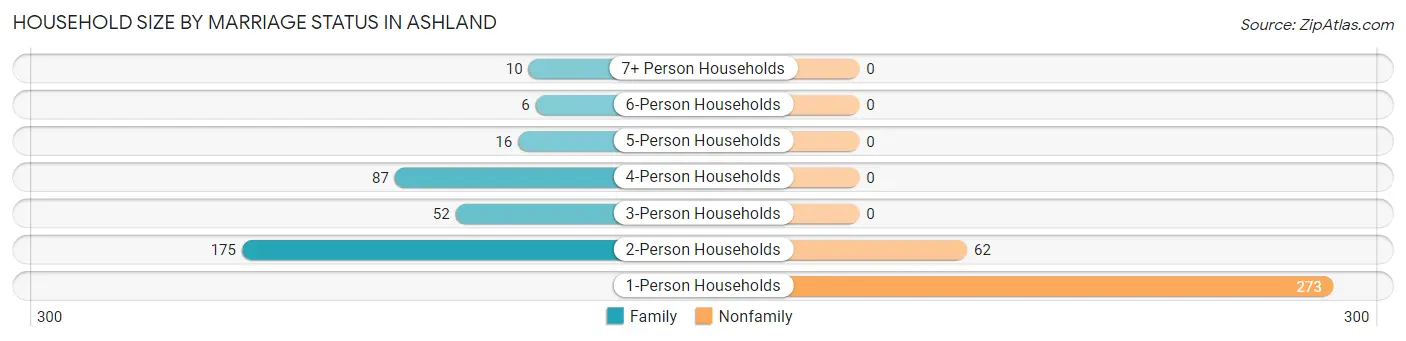
| Household Size | Family Households | Nonfamily Households |
| 1-Person Households | - | 273 (40.1%) |
| 2-Person Households | 175 (25.7%) | 62 (9.1%) |
| 3-Person Households | 52 (7.6%) | 0 (0.0%) |
| 4-Person Households | 87 (12.8%) | 0 (0.0%) |
| 5-Person Households | 16 (2.4%) | 0 (0.0%) |
| 6-Person Households | 6 (0.9%) | 0 (0.0%) |
| 7+ Person Households | 10 (1.5%) | 0 (0.0%) |
| Total | 346 (50.8%) | 335 (49.2%) |
Female Fertility in Ashland
Fertility by Age in Ashland
Average fertility rate in Ashland is 110.0 births per 1,000 women. Women in the age bracket of 20 to 34 years have the highest fertility rate with 141.0 births per 1,000 women. Women in the age bracket of 20 to 34 years acount for 100.0% of all women with births.
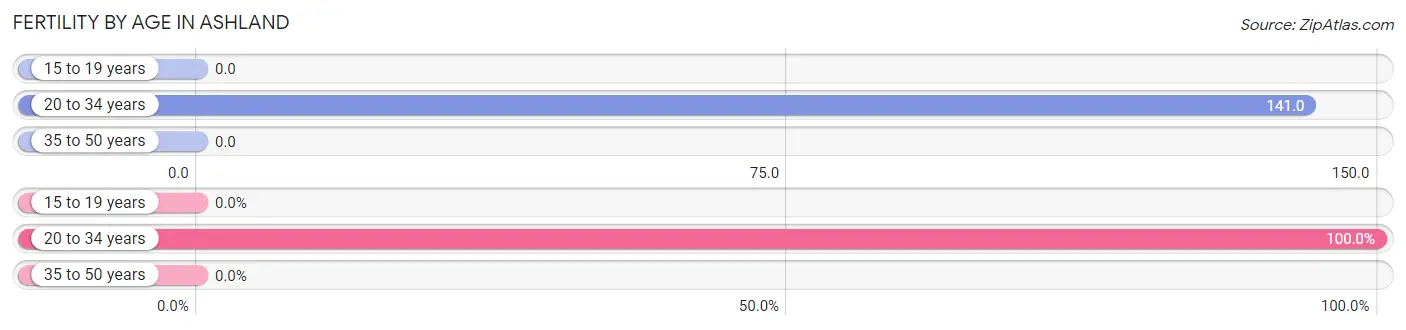
| Age Bracket | Women with Births | Births / 1,000 Women |
| 15 to 19 years | 0 (0.0%) | 0.0 |
| 20 to 34 years | 34 (100.0%) | 141.0 |
| 35 to 50 years | 0 (0.0%) | 0.0 |
| Total | 34 (100.0%) | 110.0 |
Fertility by Age by Marriage Status in Ashland
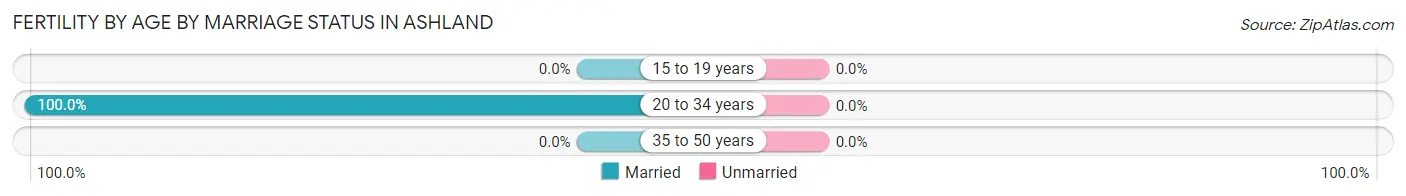
| Age Bracket | Married | Unmarried |
| 15 to 19 years | 0 (0.0%) | 0 (0.0%) |
| 20 to 34 years | 34 (100.0%) | 0 (0.0%) |
| 35 to 50 years | 0 (0.0%) | 0 (0.0%) |
| Total | 34 (100.0%) | 0 (0.0%) |
Fertility by Education in Ashland

| Educational Attainment | Women with Births | Births / 1,000 Women |
| Less than High School | 0 (0.0%) | 0.0 |
| High School Diploma | 34 (100.0%) | 272.0 |
| College or Associate's Degree | 0 (0.0%) | 0.0 |
| Bachelor's Degree | 0 (0.0%) | 0.0 |
| Graduate Degree | 0 (0.0%) | 0.0 |
| Total | 34 (100.0%) | 110.0 |
Fertility by Education by Marriage Status in Ashland
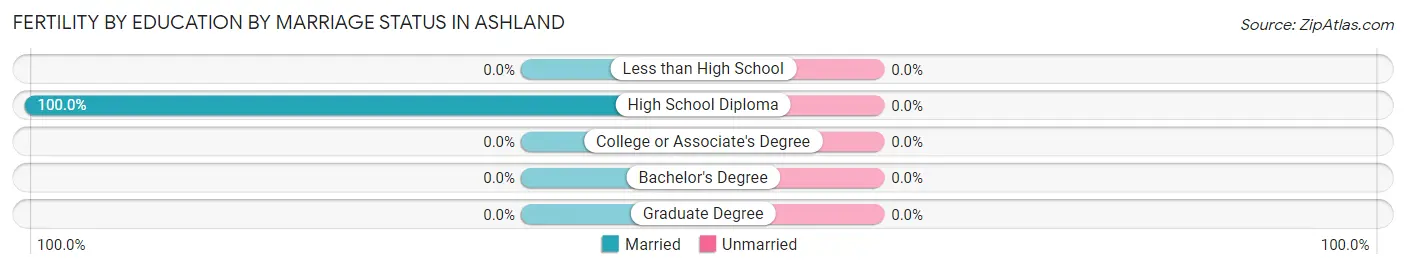
| Educational Attainment | Married | Unmarried |
| Less than High School | 0 (0.0%) | 0 (0.0%) |
| High School Diploma | 34 (100.0%) | 0 (0.0%) |
| College or Associate's Degree | 0 (0.0%) | 0 (0.0%) |
| Bachelor's Degree | 0 (0.0%) | 0 (0.0%) |
| Graduate Degree | 0 (0.0%) | 0 (0.0%) |
| Total | 34 (100.0%) | 0 (0.0%) |
Employment Characteristics in Ashland
Employment by Class of Employer in Ashland
Among the 696 employed individuals in Ashland, private company employees (509 | 73.1%), not-for-profit organizations (76 | 10.9%), and federal government employees (33 | 4.7%) make up the most common classes of employment.
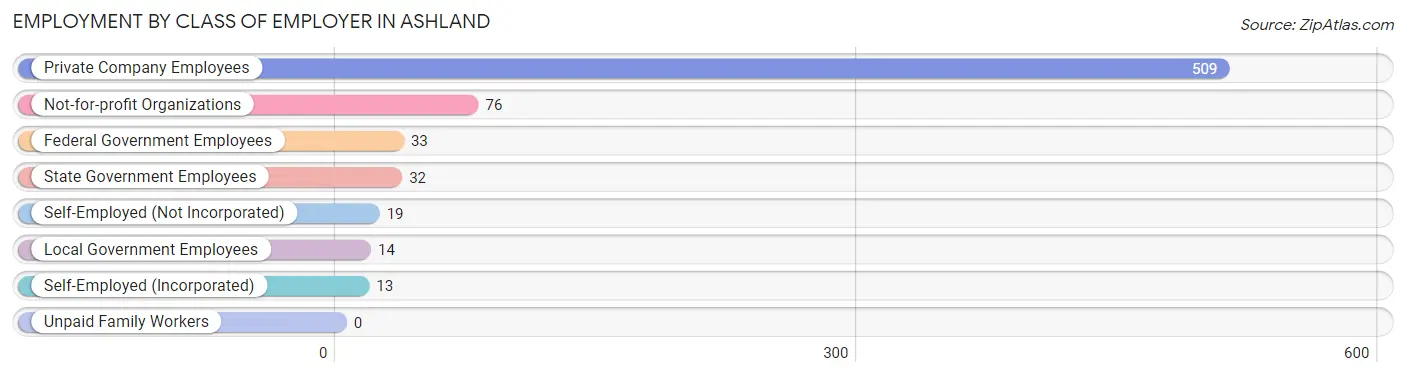
| Employer Class | # Employees | % Employees |
| Private Company Employees | 509 | 73.1% |
| Self-Employed (Incorporated) | 13 | 1.9% |
| Self-Employed (Not Incorporated) | 19 | 2.7% |
| Not-for-profit Organizations | 76 | 10.9% |
| Local Government Employees | 14 | 2.0% |
| State Government Employees | 32 | 4.6% |
| Federal Government Employees | 33 | 4.7% |
| Unpaid Family Workers | 0 | 0.0% |
| Total | 696 | 100.0% |
Employment Status by Age in Ashland
According to the labor force statistics for Ashland, out of the total population over 16 years of age (1,106), 65.1% or 720 individuals are in the labor force, with 2.6% or 19 of them unemployed. The age group with the highest labor force participation rate is 45 to 54 years, with 100.0% or 91 individuals in the labor force. Within the labor force, the 45 to 54 years age range has the highest percentage of unemployed individuals, with 8.8% or 8 of them being unemployed.
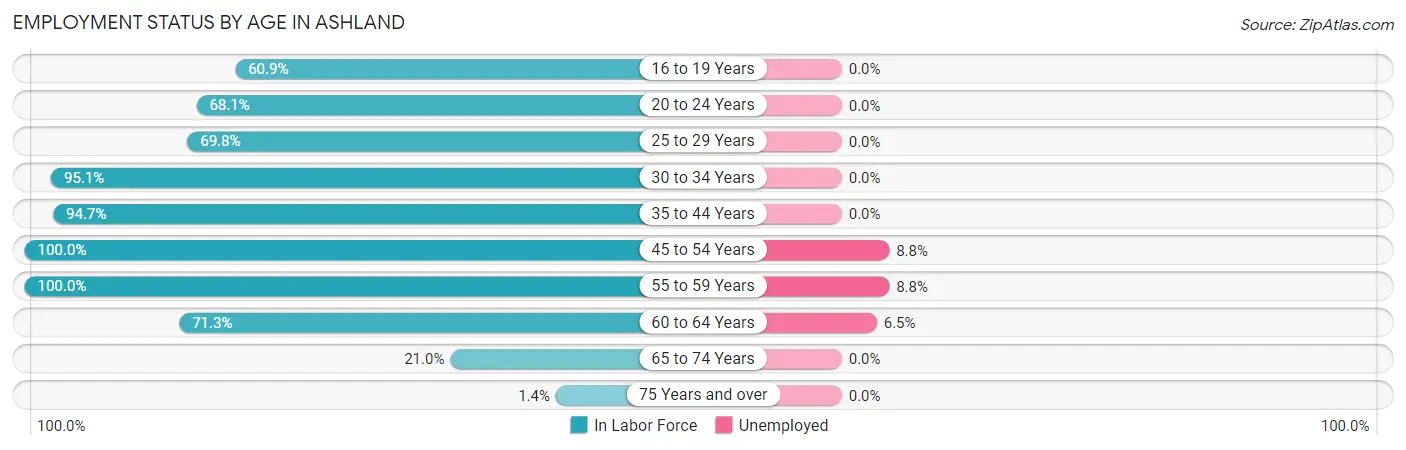
| Age Bracket | In Labor Force | Unemployed |
| 16 to 19 Years | 28 (60.9%) | 0 (0.0%) |
| 20 to 24 Years | 81 (68.1%) | 0 (0.0%) |
| 25 to 29 Years | 143 (69.8%) | 0 (0.0%) |
| 30 to 34 Years | 117 (95.1%) | 0 (0.0%) |
| 35 to 44 Years | 72 (94.7%) | 0 (0.0%) |
| 45 to 54 Years | 91 (100.0%) | 8 (8.8%) |
| 55 to 59 Years | 68 (100.0%) | 6 (8.8%) |
| 60 to 64 Years | 77 (71.3%) | 5 (6.5%) |
| 65 to 74 Years | 42 (21.0%) | 0 (0.0%) |
| 75 Years and over | 1 (1.4%) | 0 (0.0%) |
| Total | 720 (65.1%) | 19 (2.6%) |
Employment Status by Educational Attainment in Ashland
According to labor force statistics for Ashland, 84.6% of individuals (568) out of the total population between 25 and 64 years of age (671) are in the labor force, with 3.3% or 19 of them being unemployed. The group with the highest labor force participation rate are those with the educational attainment of bachelor's degree or higher, with 97.0% or 130 individuals in the labor force. Within the labor force, individuals with high school diploma education have the highest percentage of unemployment, with 6.0% or 13 of them being unemployed.
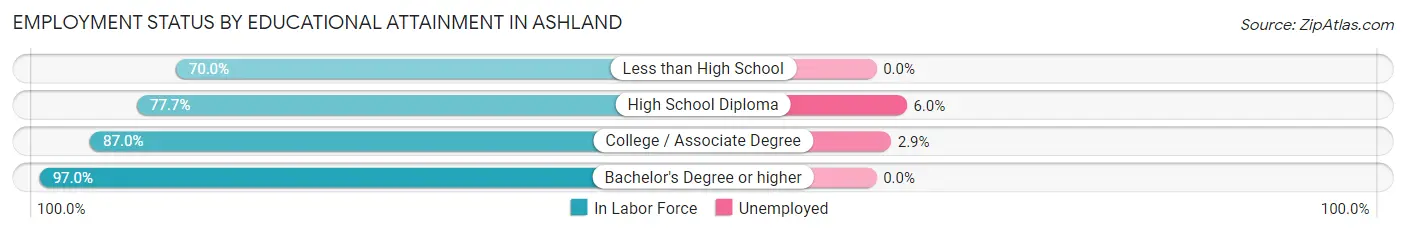
| Educational Attainment | In Labor Force | Unemployed |
| Less than High School | 14 (70.0%) | 0 (0.0%) |
| High School Diploma | 216 (77.7%) | 17 (6.0%) |
| College / Associate Degree | 208 (87.0%) | 7 (2.9%) |
| Bachelor's Degree or higher | 130 (97.0%) | 0 (0.0%) |
| Total | 568 (84.6%) | 22 (3.3%) |
Employment Occupations by Sex in Ashland
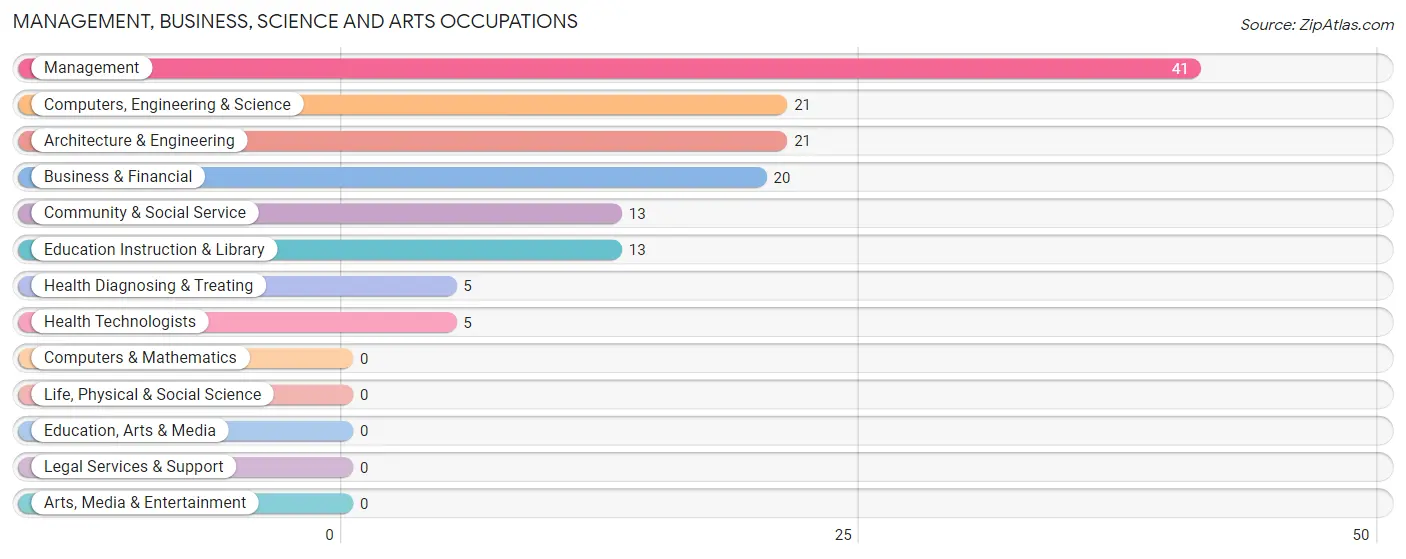
Management, Business, Science and Arts Occupations
The most common Management, Business, Science and Arts occupations in Ashland are Management (41 | 5.9%), Computers, Engineering & Science (21 | 3.0%), Architecture & Engineering (21 | 3.0%), Business & Financial (20 | 2.9%), and Community & Social Service (13 | 1.8%).
Management, Business, Science and Arts Occupations by Sex
Within the Management, Business, Science and Arts occupations in Ashland, the most male-oriented occupations are Computers, Engineering & Science (100.0%), Architecture & Engineering (100.0%), and Health Diagnosing & Treating (100.0%), while the most female-oriented occupations are Business & Financial (100.0%), Community & Social Service (100.0%), and Education Instruction & Library (100.0%).
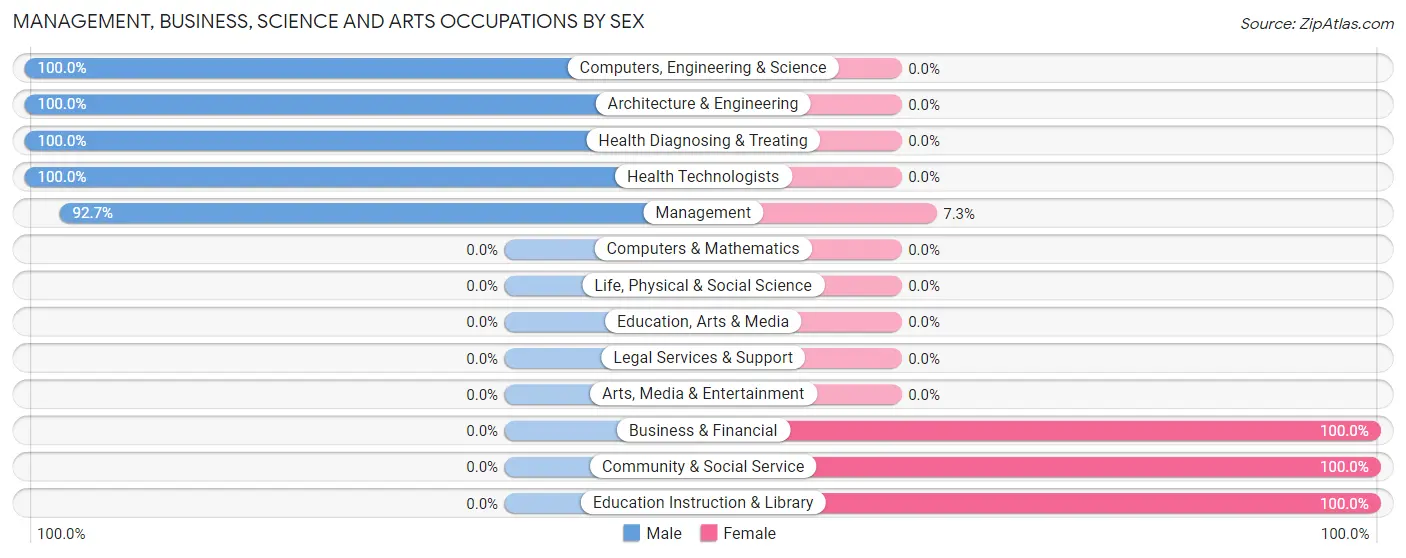
| Occupation | Male | Female |
| Management | 38 (92.7%) | 3 (7.3%) |
| Business & Financial | 0 (0.0%) | 20 (100.0%) |
| Computers, Engineering & Science | 21 (100.0%) | 0 (0.0%) |
| Computers & Mathematics | 0 (0.0%) | 0 (0.0%) |
| Architecture & Engineering | 21 (100.0%) | 0 (0.0%) |
| Life, Physical & Social Science | 0 (0.0%) | 0 (0.0%) |
| Community & Social Service | 0 (0.0%) | 13 (100.0%) |
| Education, Arts & Media | 0 (0.0%) | 0 (0.0%) |
| Legal Services & Support | 0 (0.0%) | 0 (0.0%) |
| Education Instruction & Library | 0 (0.0%) | 13 (100.0%) |
| Arts, Media & Entertainment | 0 (0.0%) | 0 (0.0%) |
| Health Diagnosing & Treating | 5 (100.0%) | 0 (0.0%) |
| Health Technologists | 5 (100.0%) | 0 (0.0%) |
| Total (Category) | 64 (64.0%) | 36 (36.0%) |
| Total (Overall) | 336 (47.9%) | 365 (52.1%) |
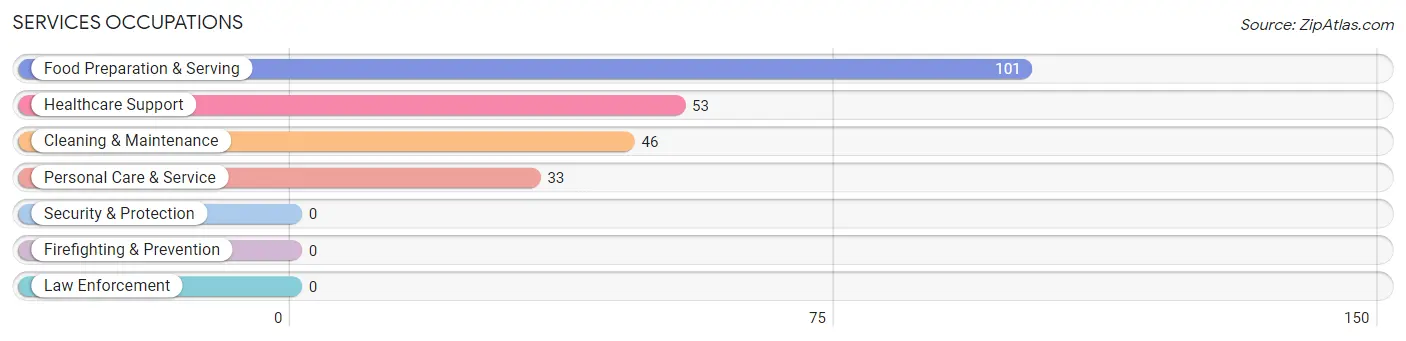
Services Occupations
The most common Services occupations in Ashland are Food Preparation & Serving (101 | 14.4%), Healthcare Support (53 | 7.6%), Cleaning & Maintenance (46 | 6.6%), and Personal Care & Service (33 | 4.7%).
Services Occupations by Sex
Within the Services occupations in Ashland, the most male-oriented occupations are Cleaning & Maintenance (47.8%), and Food Preparation & Serving (34.6%), while the most female-oriented occupations are Healthcare Support (100.0%), Personal Care & Service (100.0%), and Food Preparation & Serving (65.3%).
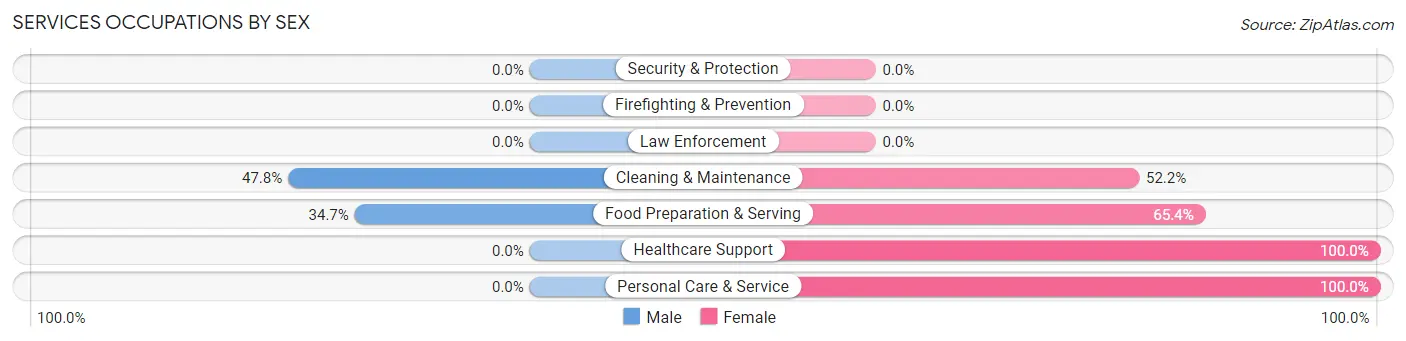
| Occupation | Male | Female |
| Healthcare Support | 0 (0.0%) | 53 (100.0%) |
| Security & Protection | 0 (0.0%) | 0 (0.0%) |
| Firefighting & Prevention | 0 (0.0%) | 0 (0.0%) |
| Law Enforcement | 0 (0.0%) | 0 (0.0%) |
| Food Preparation & Serving | 35 (34.6%) | 66 (65.3%) |
| Cleaning & Maintenance | 22 (47.8%) | 24 (52.2%) |
| Personal Care & Service | 0 (0.0%) | 33 (100.0%) |
| Total (Category) | 57 (24.5%) | 176 (75.5%) |
| Total (Overall) | 336 (47.9%) | 365 (52.1%) |
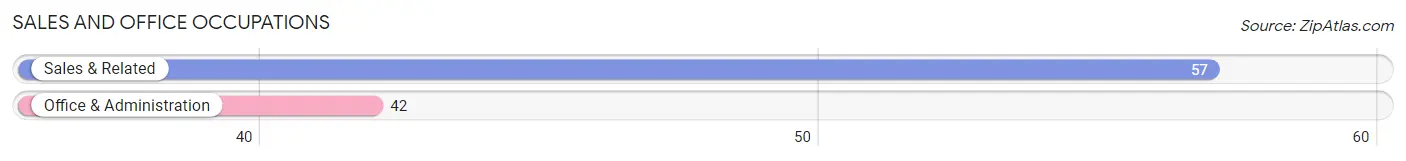
Sales and Office Occupations
The most common Sales and Office occupations in Ashland are Sales & Related (57 | 8.1%), and Office & Administration (42 | 6.0%).
Sales and Office Occupations by Sex
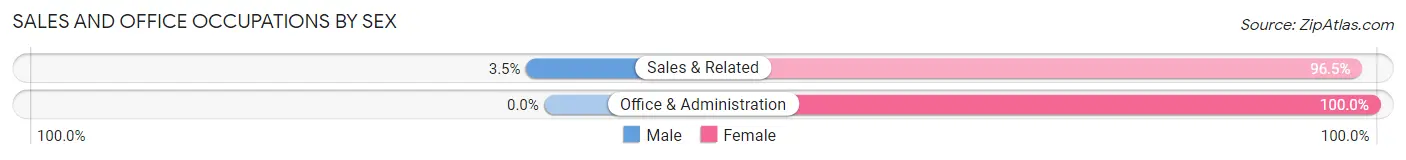
| Occupation | Male | Female |
| Sales & Related | 2 (3.5%) | 55 (96.5%) |
| Office & Administration | 0 (0.0%) | 42 (100.0%) |
| Total (Category) | 2 (2.0%) | 97 (98.0%) |
| Total (Overall) | 336 (47.9%) | 365 (52.1%) |
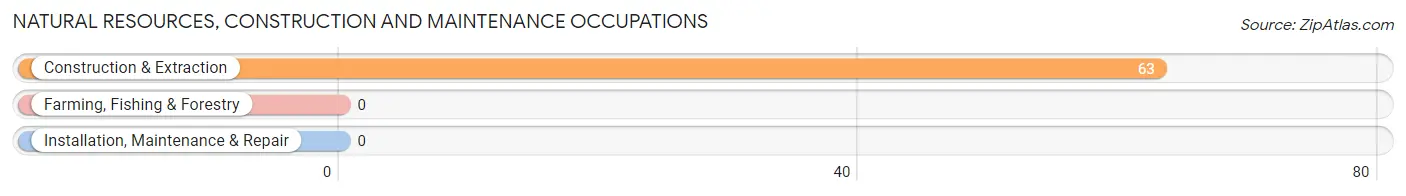
Natural Resources, Construction and Maintenance Occupations
The most common Natural Resources, Construction and Maintenance occupations in Ashland are , and Construction & Extraction (63 | 9.0%).
Natural Resources, Construction and Maintenance Occupations by Sex
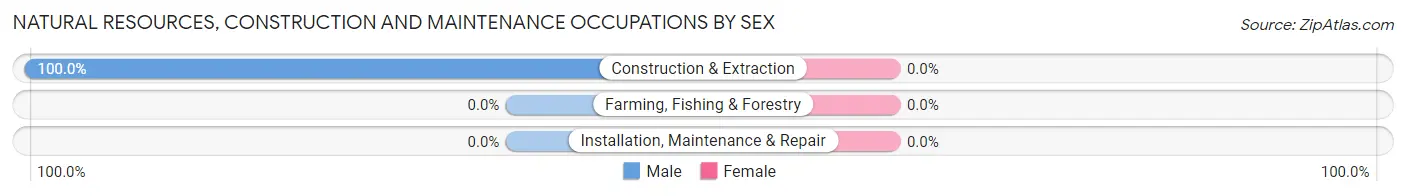
| Occupation | Male | Female |
| Farming, Fishing & Forestry | 0 (0.0%) | 0 (0.0%) |
| Construction & Extraction | 63 (100.0%) | 0 (0.0%) |
| Installation, Maintenance & Repair | 0 (0.0%) | 0 (0.0%) |
| Total (Category) | 63 (100.0%) | 0 (0.0%) |
| Total (Overall) | 336 (47.9%) | 365 (52.1%) |
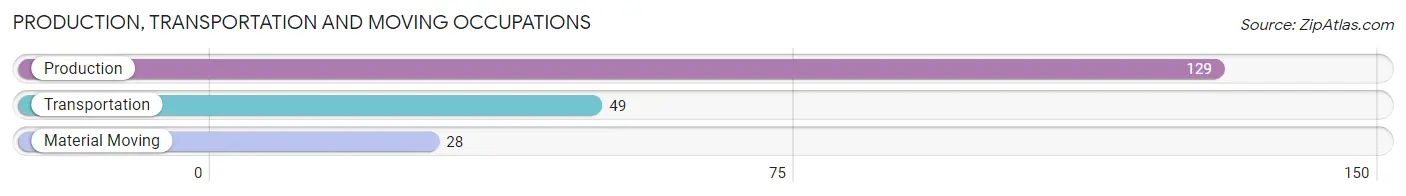
Production, Transportation and Moving Occupations
The most common Production, Transportation and Moving occupations in Ashland are Production (129 | 18.4%), Transportation (49 | 7.0%), and Material Moving (28 | 4.0%).
Production, Transportation and Moving Occupations by Sex
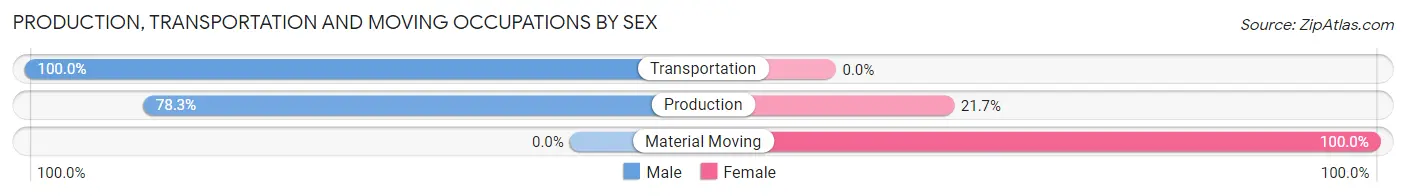
| Occupation | Male | Female |
| Production | 101 (78.3%) | 28 (21.7%) |
| Transportation | 49 (100.0%) | 0 (0.0%) |
| Material Moving | 0 (0.0%) | 28 (100.0%) |
| Total (Category) | 150 (72.8%) | 56 (27.2%) |
| Total (Overall) | 336 (47.9%) | 365 (52.1%) |
Employment Industries by Sex in Ashland
Employment Industries in Ashland
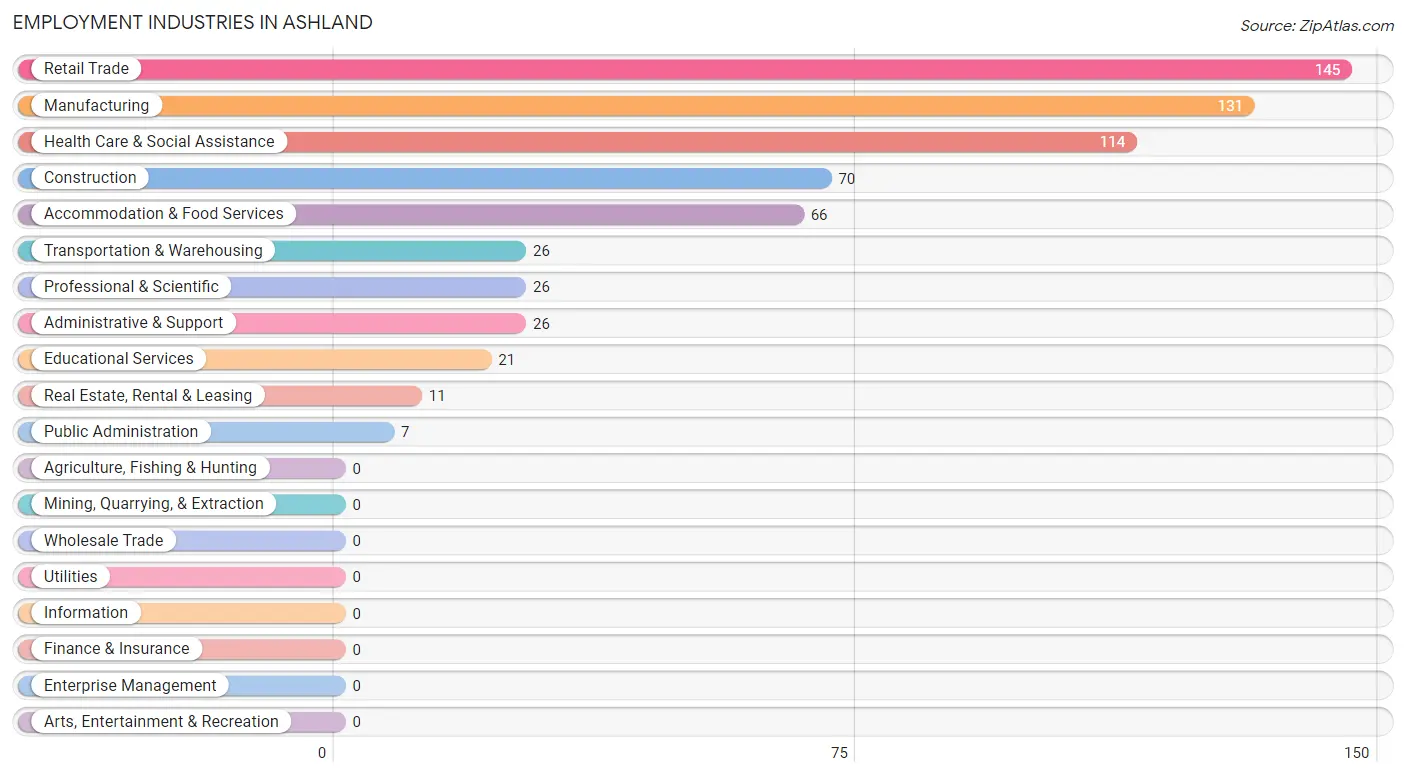
The major employment industries in Ashland include Retail Trade (145 | 20.7%), Manufacturing (131 | 18.7%), Health Care & Social Assistance (114 | 16.3%), Construction (70 | 10.0%), and Accommodation & Food Services (66 | 9.4%).
Employment Industries by Sex in Ashland
The Ashland industries that see more men than women are Construction (100.0%), Administrative & Support (100.0%), and Professional & Scientific (80.8%), whereas the industries that tend to have a higher number of women are Transportation & Warehousing (100.0%), Public Administration (100.0%), and Accommodation & Food Services (78.8%).
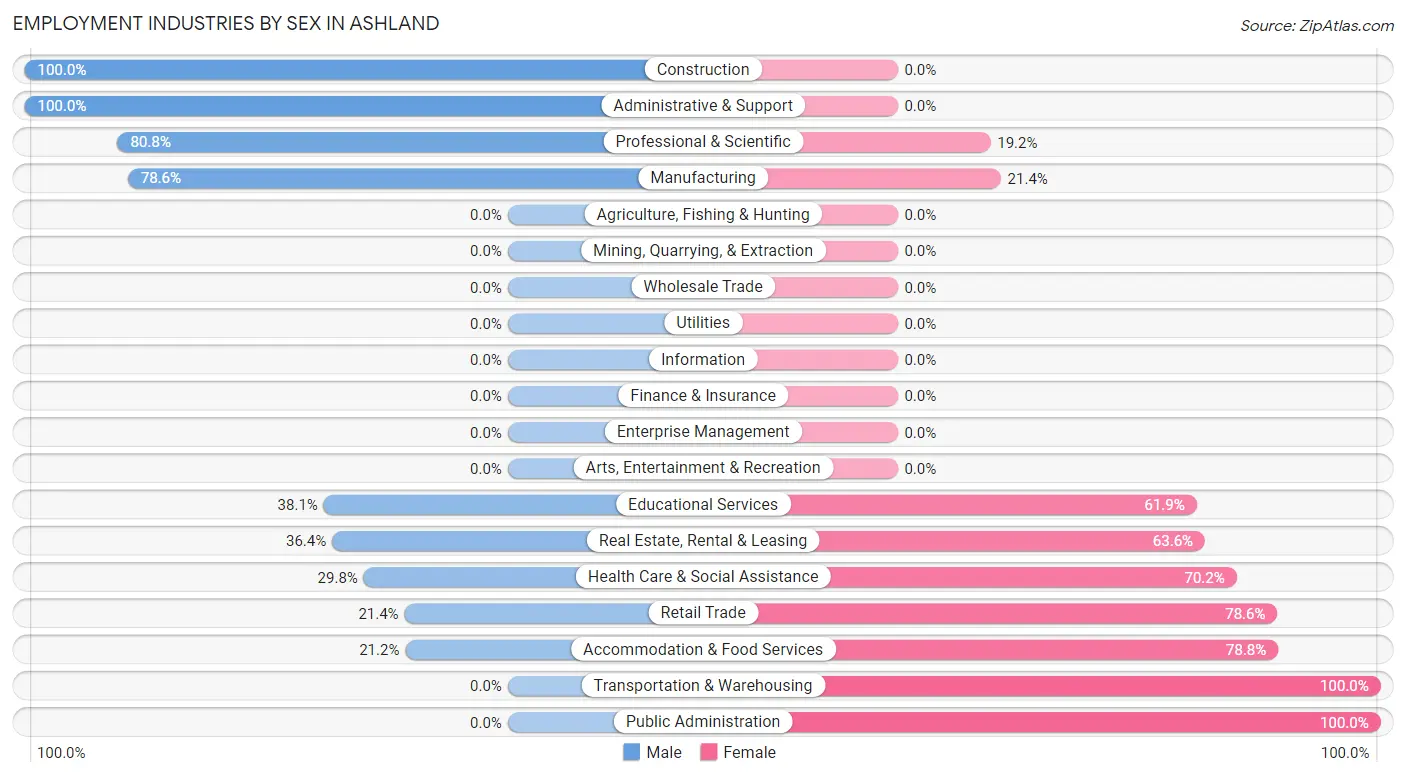
| Industry | Male | Female |
| Agriculture, Fishing & Hunting | 0 (0.0%) | 0 (0.0%) |
| Mining, Quarrying, & Extraction | 0 (0.0%) | 0 (0.0%) |
| Construction | 70 (100.0%) | 0 (0.0%) |
| Manufacturing | 103 (78.6%) | 28 (21.4%) |
| Wholesale Trade | 0 (0.0%) | 0 (0.0%) |
| Retail Trade | 31 (21.4%) | 114 (78.6%) |
| Transportation & Warehousing | 0 (0.0%) | 26 (100.0%) |
| Utilities | 0 (0.0%) | 0 (0.0%) |
| Information | 0 (0.0%) | 0 (0.0%) |
| Finance & Insurance | 0 (0.0%) | 0 (0.0%) |
| Real Estate, Rental & Leasing | 4 (36.4%) | 7 (63.6%) |
| Professional & Scientific | 21 (80.8%) | 5 (19.2%) |
| Enterprise Management | 0 (0.0%) | 0 (0.0%) |
| Administrative & Support | 26 (100.0%) | 0 (0.0%) |
| Educational Services | 8 (38.1%) | 13 (61.9%) |
| Health Care & Social Assistance | 34 (29.8%) | 80 (70.2%) |
| Arts, Entertainment & Recreation | 0 (0.0%) | 0 (0.0%) |
| Accommodation & Food Services | 14 (21.2%) | 52 (78.8%) |
| Public Administration | 0 (0.0%) | 7 (100.0%) |
| Total | 336 (47.9%) | 365 (52.1%) |
Education in Ashland
School Enrollment in Ashland
The most common levels of schooling among the 295 students in Ashland are kindergarten (75 | 25.4%), elementary school (56 | 19.0%), and middle school (55 | 18.6%).
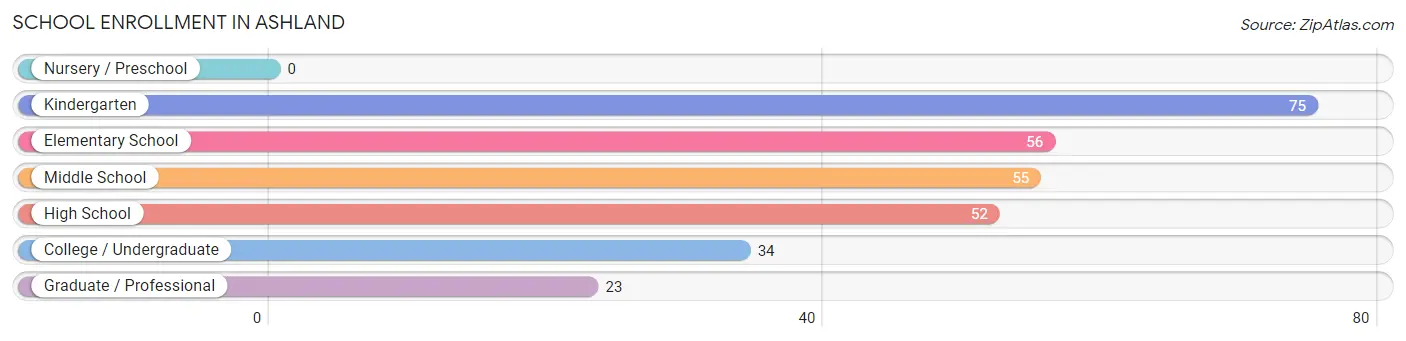
| School Level | # Students | % Students |
| Nursery / Preschool | 0 | 0.0% |
| Kindergarten | 75 | 25.4% |
| Elementary School | 56 | 19.0% |
| Middle School | 55 | 18.6% |
| High School | 52 | 17.6% |
| College / Undergraduate | 34 | 11.5% |
| Graduate / Professional | 23 | 7.8% |
| Total | 295 | 100.0% |
School Enrollment by Age by Funding Source in Ashland
Out of a total of 295 students who are enrolled in schools in Ashland, 35 (11.9%) attend a private institution, while the remaining 260 (88.1%) are enrolled in public schools. The age group of 25 to 34 year olds has the highest likelihood of being enrolled in private schools, with 35 (85.4% in the age bracket) enrolled. Conversely, the age group of 5 to 9 year old has the lowest likelihood of being enrolled in a private school, with 116 (100.0% in the age bracket) attending a public institution.
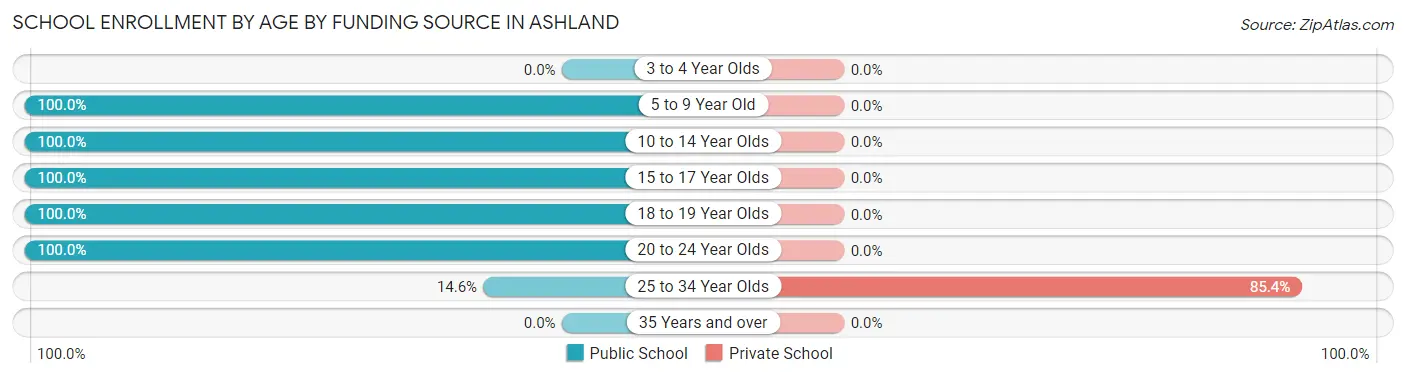
| Age Bracket | Public School | Private School |
| 3 to 4 Year Olds | 0 (0.0%) | 0 (0.0%) |
| 5 to 9 Year Old | 116 (100.0%) | 0 (0.0%) |
| 10 to 14 Year Olds | 79 (100.0%) | 0 (0.0%) |
| 15 to 17 Year Olds | 43 (100.0%) | 0 (0.0%) |
| 18 to 19 Year Olds | 11 (100.0%) | 0 (0.0%) |
| 20 to 24 Year Olds | 5 (100.0%) | 0 (0.0%) |
| 25 to 34 Year Olds | 6 (14.6%) | 35 (85.4%) |
| 35 Years and over | 0 (0.0%) | 0 (0.0%) |
| Total | 260 (88.1%) | 35 (11.9%) |
Educational Attainment by Field of Study in Ashland
Bio, nature & agricultural (56 | 27.6%), education (53 | 26.1%), computers & mathematics (27 | 13.3%), literature & languages (18 | 8.9%), and liberal arts & history (11 | 5.4%) are the most common fields of study among 203 individuals in Ashland who have obtained a bachelor's degree or higher.
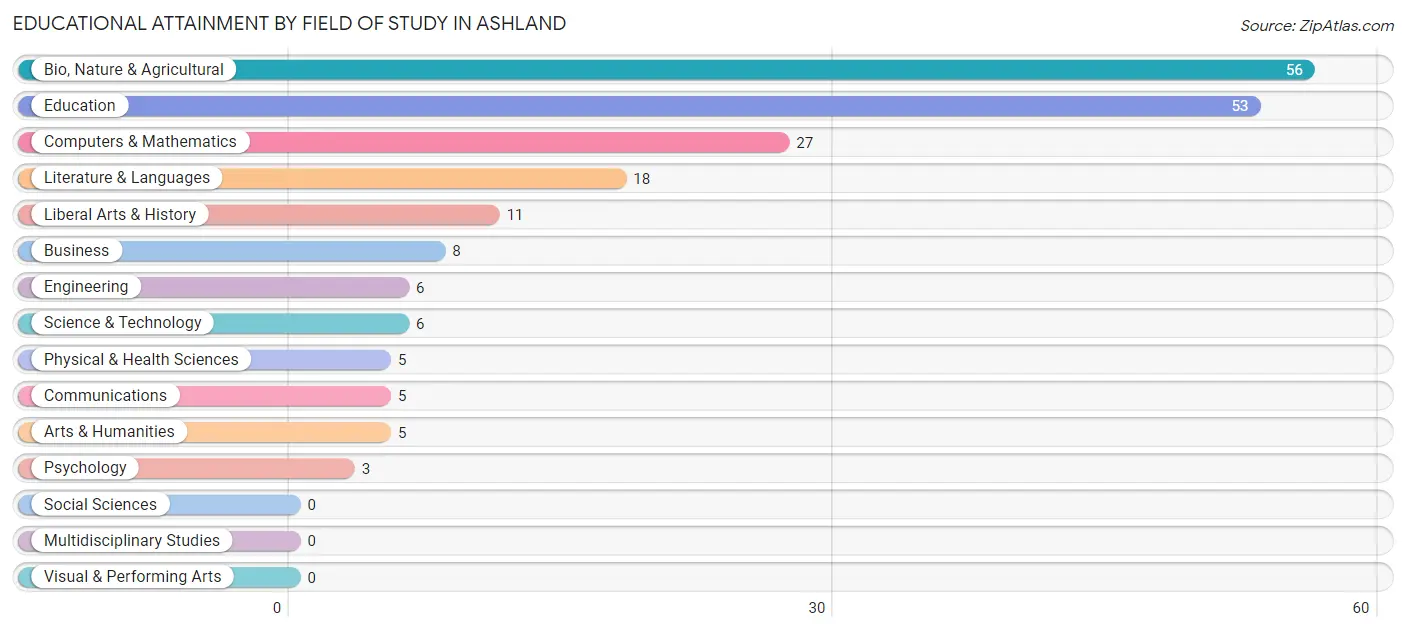
| Field of Study | # Graduates | % Graduates |
| Computers & Mathematics | 27 | 13.3% |
| Bio, Nature & Agricultural | 56 | 27.6% |
| Physical & Health Sciences | 5 | 2.5% |
| Psychology | 3 | 1.5% |
| Social Sciences | 0 | 0.0% |
| Engineering | 6 | 3.0% |
| Multidisciplinary Studies | 0 | 0.0% |
| Science & Technology | 6 | 3.0% |
| Business | 8 | 3.9% |
| Education | 53 | 26.1% |
| Literature & Languages | 18 | 8.9% |
| Liberal Arts & History | 11 | 5.4% |
| Visual & Performing Arts | 0 | 0.0% |
| Communications | 5 | 2.5% |
| Arts & Humanities | 5 | 2.5% |
| Total | 203 | 100.0% |
Transportation & Commute in Ashland
Vehicle Availability by Sex in Ashland
The most prevalent vehicle ownership categories in Ashland are males with 2 vehicles (177, accounting for 52.7%) and females with 2 vehicles (209, making up 49.2%).
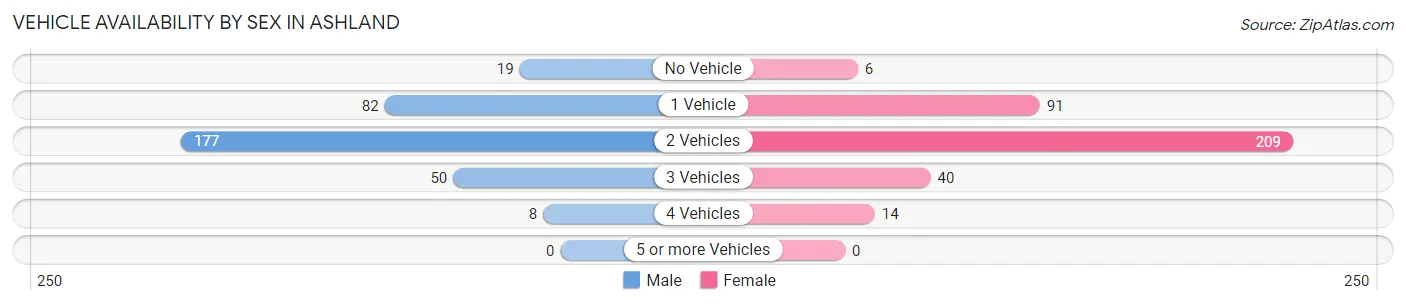
| Vehicles Available | Male | Female |
| No Vehicle | 19 (5.7%) | 6 (1.7%) |
| 1 Vehicle | 82 (24.4%) | 91 (25.3%) |
| 2 Vehicles | 177 (52.7%) | 209 (58.1%) |
| 3 Vehicles | 50 (14.9%) | 40 (11.1%) |
| 4 Vehicles | 8 (2.4%) | 14 (3.9%) |
| 5 or more Vehicles | 0 (0.0%) | 0 (0.0%) |
| Total | 336 (100.0%) | 360 (100.0%) |
Commute Time in Ashland
The most frequently occuring commute durations in Ashland are 30 to 34 minutes (114 commuters, 17.6%), 15 to 19 minutes (97 commuters, 15.0%), and less than 5 minutes (79 commuters, 12.2%).
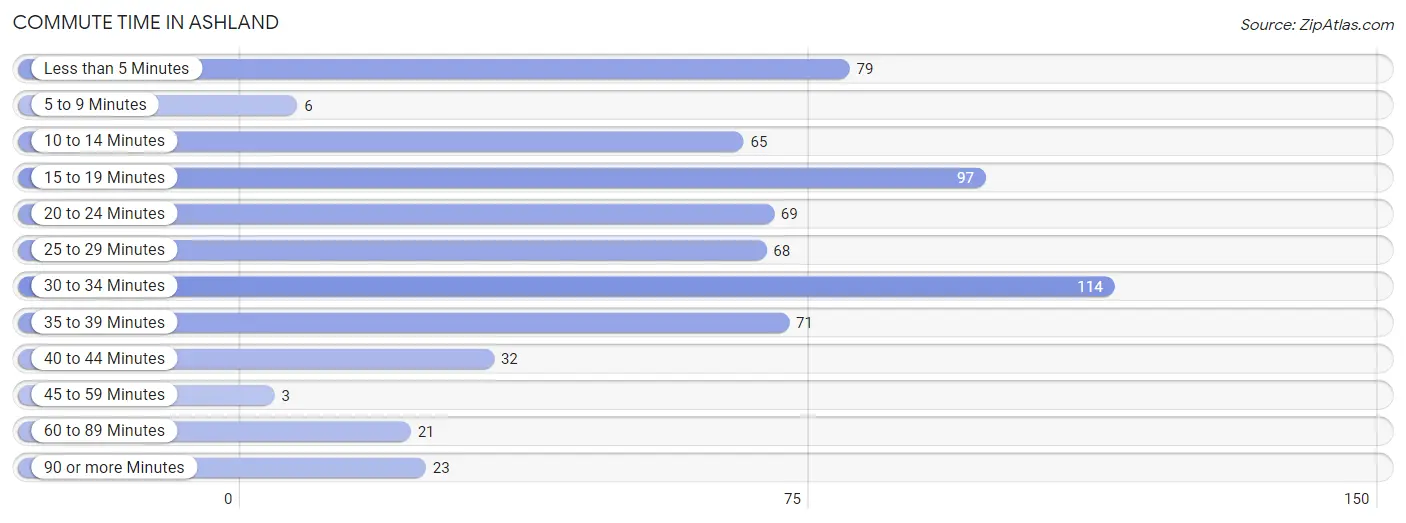
| Commute Time | # Commuters | % Commuters |
| Less than 5 Minutes | 79 | 12.2% |
| 5 to 9 Minutes | 6 | 0.9% |
| 10 to 14 Minutes | 65 | 10.0% |
| 15 to 19 Minutes | 97 | 15.0% |
| 20 to 24 Minutes | 69 | 10.6% |
| 25 to 29 Minutes | 68 | 10.5% |
| 30 to 34 Minutes | 114 | 17.6% |
| 35 to 39 Minutes | 71 | 11.0% |
| 40 to 44 Minutes | 32 | 4.9% |
| 45 to 59 Minutes | 3 | 0.5% |
| 60 to 89 Minutes | 21 | 3.2% |
| 90 or more Minutes | 23 | 3.5% |
Commute Time by Sex in Ashland
The most common commute times in Ashland are 25 to 29 minutes (68 commuters, 22.2%) for males and 30 to 34 minutes (101 commuters, 29.6%) for females.
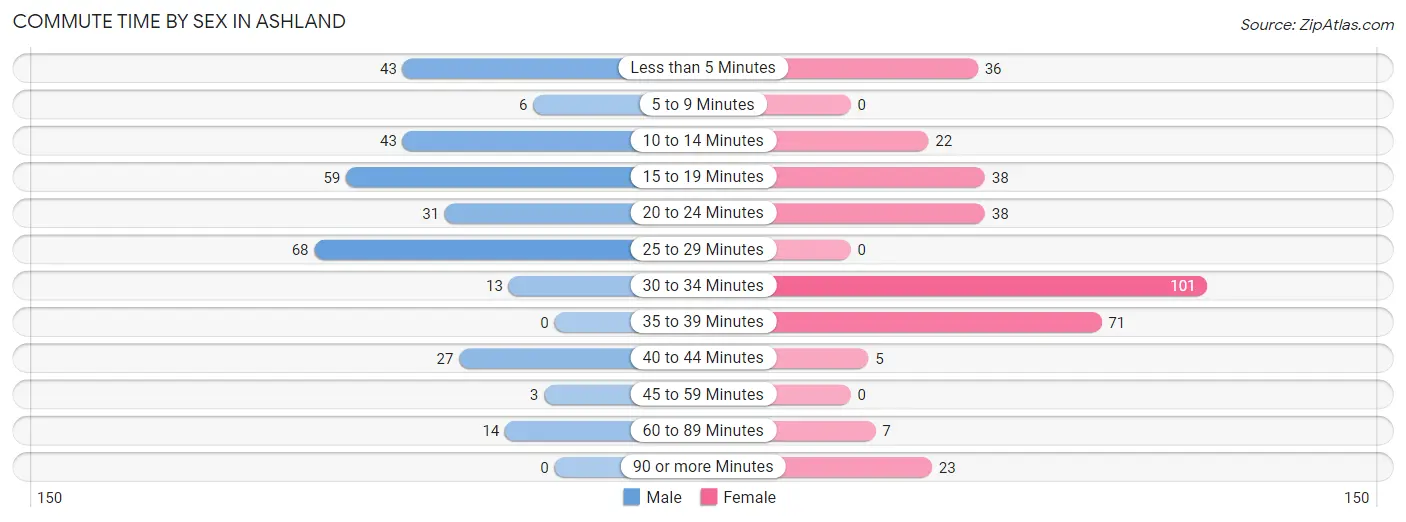
| Commute Time | Male | Female |
| Less than 5 Minutes | 43 (14.0%) | 36 (10.6%) |
| 5 to 9 Minutes | 6 (1.9%) | 0 (0.0%) |
| 10 to 14 Minutes | 43 (14.0%) | 22 (6.5%) |
| 15 to 19 Minutes | 59 (19.2%) | 38 (11.1%) |
| 20 to 24 Minutes | 31 (10.1%) | 38 (11.1%) |
| 25 to 29 Minutes | 68 (22.2%) | 0 (0.0%) |
| 30 to 34 Minutes | 13 (4.2%) | 101 (29.6%) |
| 35 to 39 Minutes | 0 (0.0%) | 71 (20.8%) |
| 40 to 44 Minutes | 27 (8.8%) | 5 (1.5%) |
| 45 to 59 Minutes | 3 (1.0%) | 0 (0.0%) |
| 60 to 89 Minutes | 14 (4.6%) | 7 (2.1%) |
| 90 or more Minutes | 0 (0.0%) | 23 (6.7%) |
Time of Departure to Work by Sex in Ashland
The most frequent times of departure to work in Ashland are 6:30 AM to 6:59 AM (50, 16.3%) for males and 12:00 AM to 4:59 AM (58, 17.0%) for females.
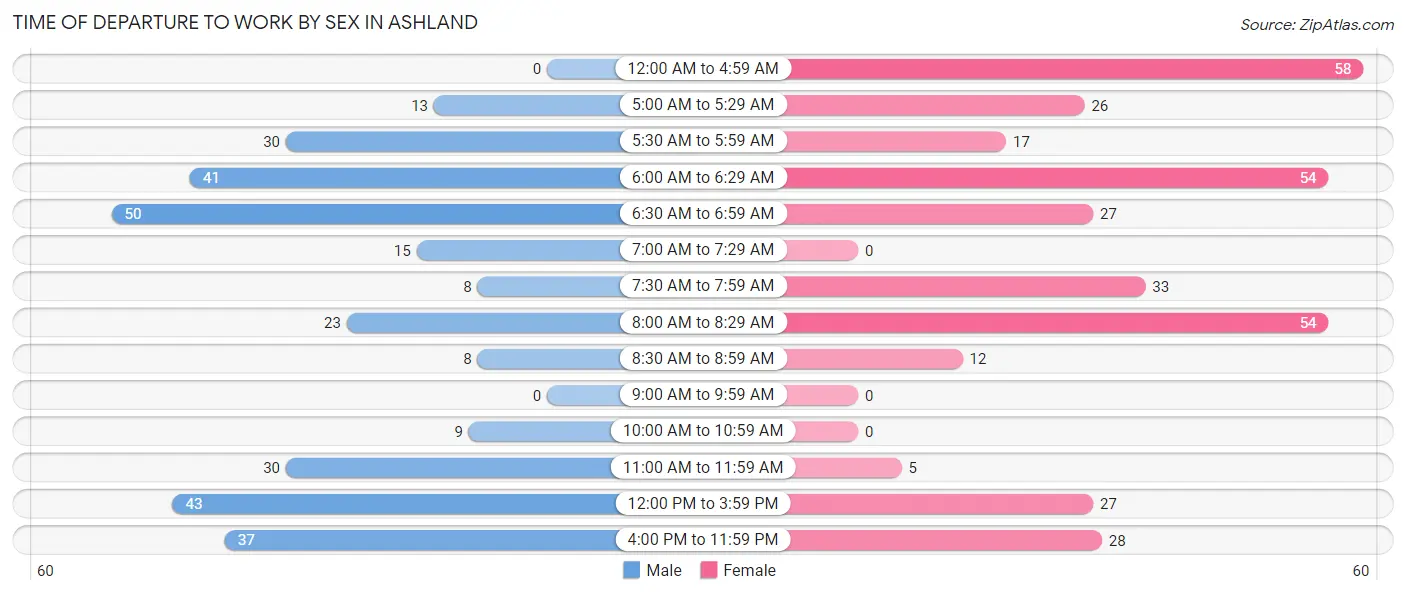
| Time of Departure | Male | Female |
| 12:00 AM to 4:59 AM | 0 (0.0%) | 58 (17.0%) |
| 5:00 AM to 5:29 AM | 13 (4.2%) | 26 (7.6%) |
| 5:30 AM to 5:59 AM | 30 (9.8%) | 17 (5.0%) |
| 6:00 AM to 6:29 AM | 41 (13.4%) | 54 (15.8%) |
| 6:30 AM to 6:59 AM | 50 (16.3%) | 27 (7.9%) |
| 7:00 AM to 7:29 AM | 15 (4.9%) | 0 (0.0%) |
| 7:30 AM to 7:59 AM | 8 (2.6%) | 33 (9.7%) |
| 8:00 AM to 8:29 AM | 23 (7.5%) | 54 (15.8%) |
| 8:30 AM to 8:59 AM | 8 (2.6%) | 12 (3.5%) |
| 9:00 AM to 9:59 AM | 0 (0.0%) | 0 (0.0%) |
| 10:00 AM to 10:59 AM | 9 (2.9%) | 0 (0.0%) |
| 11:00 AM to 11:59 AM | 30 (9.8%) | 5 (1.5%) |
| 12:00 PM to 3:59 PM | 43 (14.0%) | 27 (7.9%) |
| 4:00 PM to 11:59 PM | 37 (12.0%) | 28 (8.2%) |
| Total | 307 (100.0%) | 341 (100.0%) |
Housing Occupancy in Ashland
Occupancy by Ownership in Ashland
Of the total 681 dwellings in Ashland, owner-occupied units account for 377 (55.4%), while renter-occupied units make up 304 (44.6%).
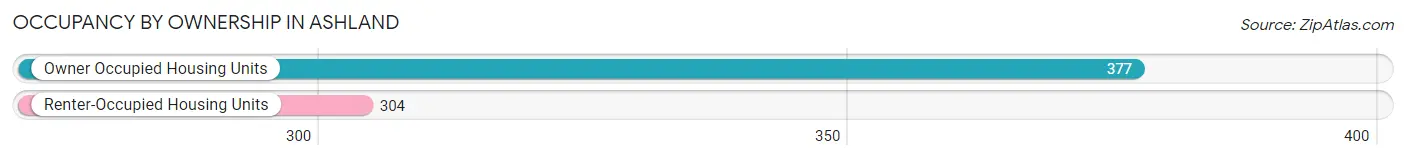
| Occupancy | # Housing Units | % Housing Units |
| Owner Occupied Housing Units | 377 | 55.4% |
| Renter-Occupied Housing Units | 304 | 44.6% |
| Total Occupied Housing Units | 681 | 100.0% |
Occupancy by Household Size in Ashland
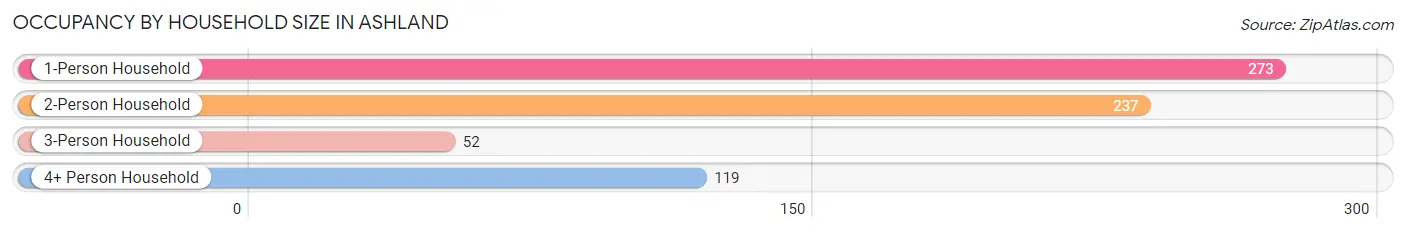
| Household Size | # Housing Units | % Housing Units |
| 1-Person Household | 273 | 40.1% |
| 2-Person Household | 237 | 34.8% |
| 3-Person Household | 52 | 7.6% |
| 4+ Person Household | 119 | 17.5% |
| Total Housing Units | 681 | 100.0% |
Occupancy by Ownership by Household Size in Ashland
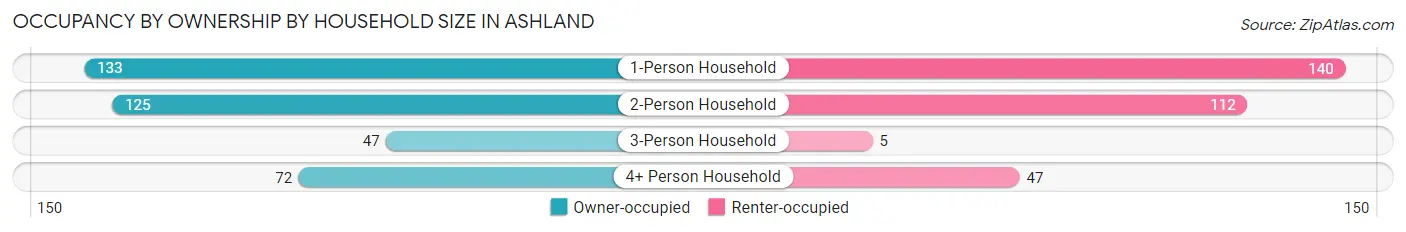
| Household Size | Owner-occupied | Renter-occupied |
| 1-Person Household | 133 (48.7%) | 140 (51.3%) |
| 2-Person Household | 125 (52.7%) | 112 (47.3%) |
| 3-Person Household | 47 (90.4%) | 5 (9.6%) |
| 4+ Person Household | 72 (60.5%) | 47 (39.5%) |
| Total Housing Units | 377 (55.4%) | 304 (44.6%) |
Occupancy by Educational Attainment in Ashland
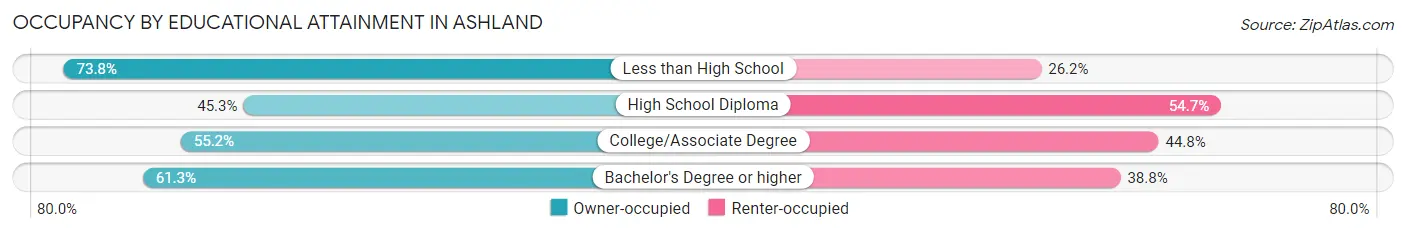
| Household Size | Owner-occupied | Renter-occupied |
| Less than High School | 62 (73.8%) | 22 (26.2%) |
| High School Diploma | 111 (45.3%) | 134 (54.7%) |
| College/Associate Degree | 106 (55.2%) | 86 (44.8%) |
| Bachelor's Degree or higher | 98 (61.3%) | 62 (38.8%) |
Occupancy by Age of Householder in Ashland
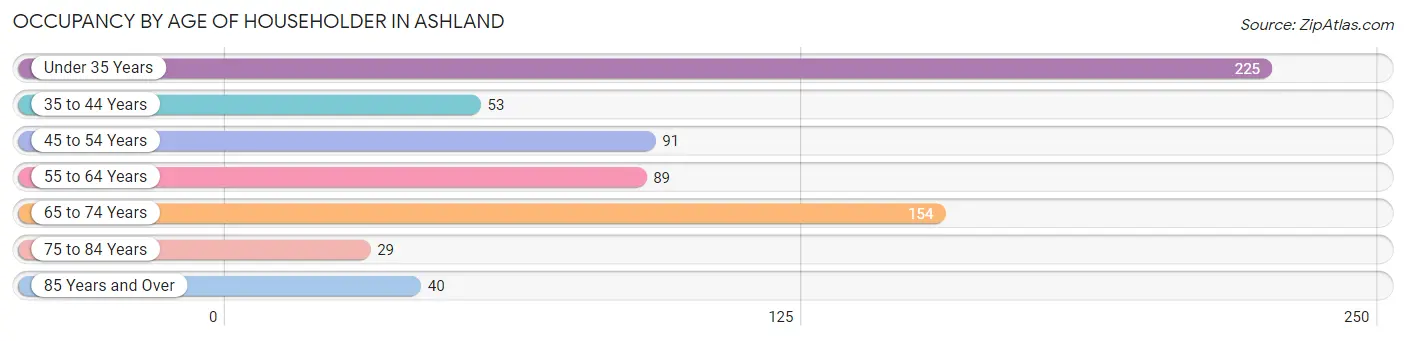
| Age Bracket | # Households | % Households |
| Under 35 Years | 225 | 33.0% |
| 35 to 44 Years | 53 | 7.8% |
| 45 to 54 Years | 91 | 13.4% |
| 55 to 64 Years | 89 | 13.1% |
| 65 to 74 Years | 154 | 22.6% |
| 75 to 84 Years | 29 | 4.3% |
| 85 Years and Over | 40 | 5.9% |
| Total | 681 | 100.0% |
Housing Finances in Ashland
Median Income by Occupancy in Ashland
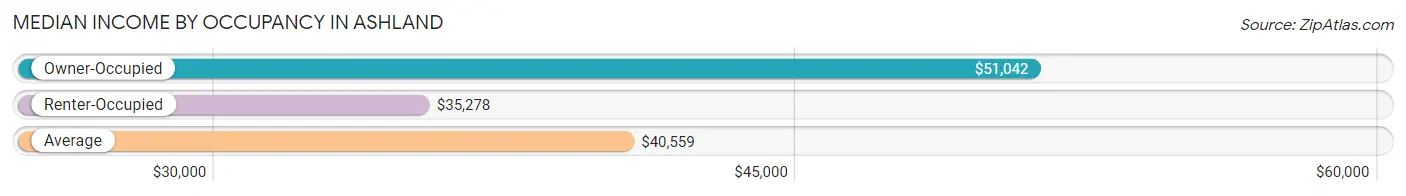
| Occupancy Type | # Households | Median Income |
| Owner-Occupied | 377 (55.4%) | $51,042 |
| Renter-Occupied | 304 (44.6%) | $35,278 |
| Average | 681 (100.0%) | $40,559 |
Occupancy by Householder Income Bracket in Ashland
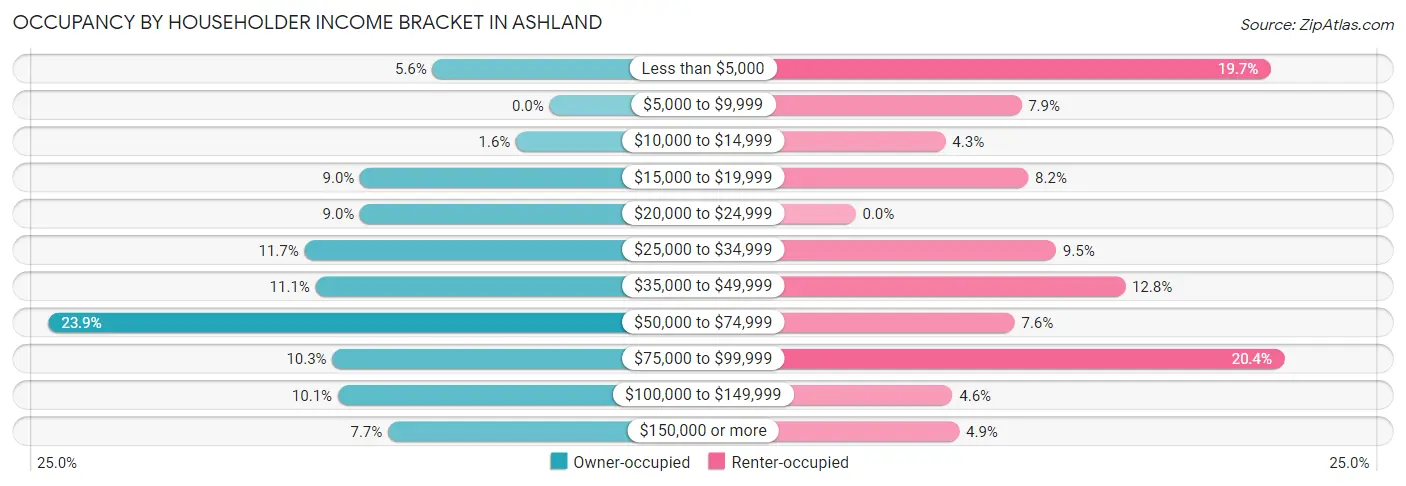
| Income Bracket | Owner-occupied | Renter-occupied |
| Less than $5,000 | 21 (5.6%) | 60 (19.7%) |
| $5,000 to $9,999 | 0 (0.0%) | 24 (7.9%) |
| $10,000 to $14,999 | 6 (1.6%) | 13 (4.3%) |
| $15,000 to $19,999 | 34 (9.0%) | 25 (8.2%) |
| $20,000 to $24,999 | 34 (9.0%) | 0 (0.0%) |
| $25,000 to $34,999 | 44 (11.7%) | 29 (9.5%) |
| $35,000 to $49,999 | 42 (11.1%) | 39 (12.8%) |
| $50,000 to $74,999 | 90 (23.9%) | 23 (7.6%) |
| $75,000 to $99,999 | 39 (10.3%) | 62 (20.4%) |
| $100,000 to $149,999 | 38 (10.1%) | 14 (4.6%) |
| $150,000 or more | 29 (7.7%) | 15 (4.9%) |
| Total | 377 (100.0%) | 304 (100.0%) |
Monthly Housing Cost Tiers in Ashland
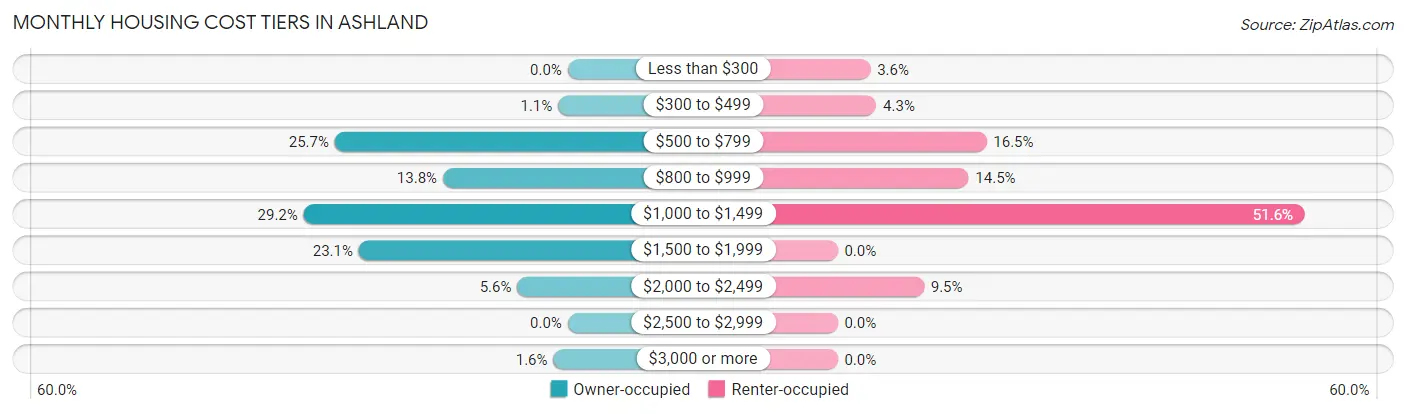
| Monthly Cost | Owner-occupied | Renter-occupied |
| Less than $300 | 0 (0.0%) | 11 (3.6%) |
| $300 to $499 | 4 (1.1%) | 13 (4.3%) |
| $500 to $799 | 97 (25.7%) | 50 (16.5%) |
| $800 to $999 | 52 (13.8%) | 44 (14.5%) |
| $1,000 to $1,499 | 110 (29.2%) | 157 (51.6%) |
| $1,500 to $1,999 | 87 (23.1%) | 0 (0.0%) |
| $2,000 to $2,499 | 21 (5.6%) | 29 (9.5%) |
| $2,500 to $2,999 | 0 (0.0%) | 0 (0.0%) |
| $3,000 or more | 6 (1.6%) | 0 (0.0%) |
| Total | 377 (100.0%) | 304 (100.0%) |
Physical Housing Characteristics in Ashland
Housing Structures in Ashland
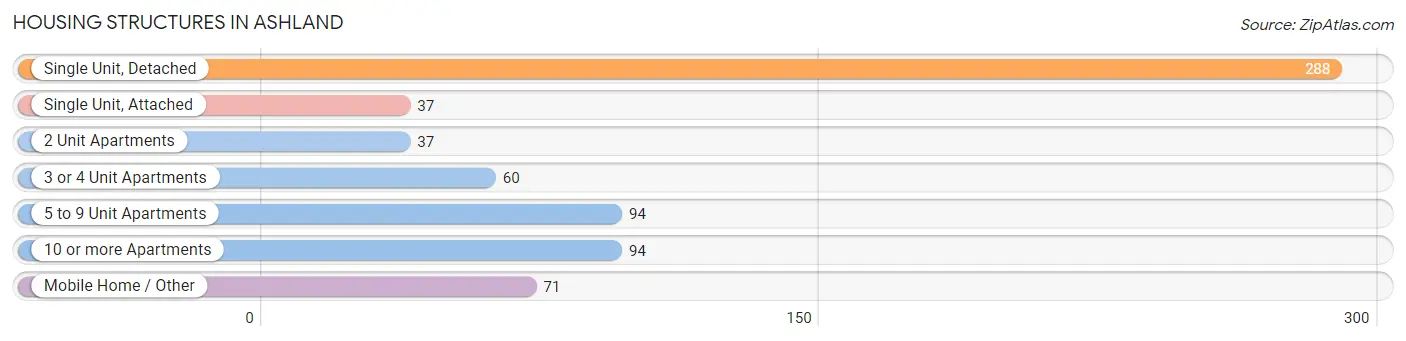
| Structure Type | # Housing Units | % Housing Units |
| Single Unit, Detached | 288 | 42.3% |
| Single Unit, Attached | 37 | 5.4% |
| 2 Unit Apartments | 37 | 5.4% |
| 3 or 4 Unit Apartments | 60 | 8.8% |
| 5 to 9 Unit Apartments | 94 | 13.8% |
| 10 or more Apartments | 94 | 13.8% |
| Mobile Home / Other | 71 | 10.4% |
| Total | 681 | 100.0% |
Housing Structures by Occupancy in Ashland
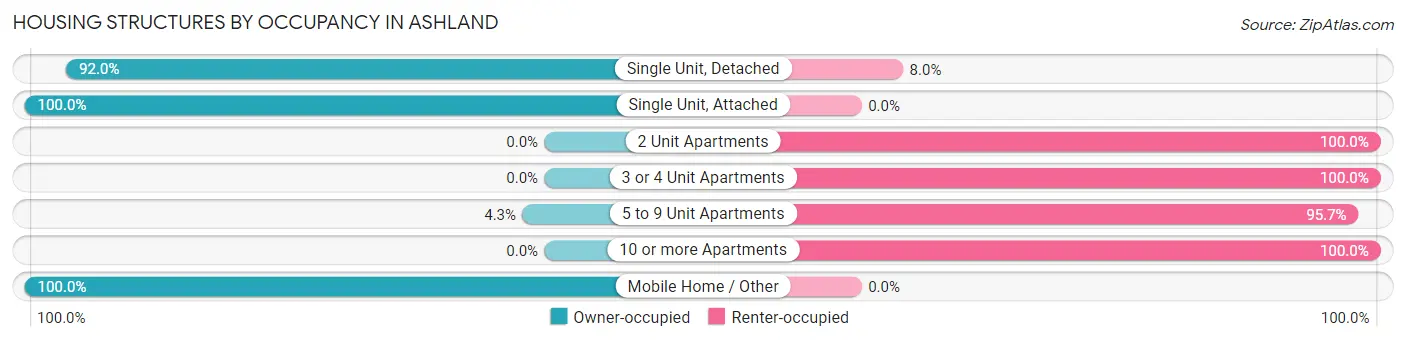
| Structure Type | Owner-occupied | Renter-occupied |
| Single Unit, Detached | 265 (92.0%) | 23 (8.0%) |
| Single Unit, Attached | 37 (100.0%) | 0 (0.0%) |
| 2 Unit Apartments | 0 (0.0%) | 37 (100.0%) |
| 3 or 4 Unit Apartments | 0 (0.0%) | 60 (100.0%) |
| 5 to 9 Unit Apartments | 4 (4.3%) | 90 (95.7%) |
| 10 or more Apartments | 0 (0.0%) | 94 (100.0%) |
| Mobile Home / Other | 71 (100.0%) | 0 (0.0%) |
| Total | 377 (55.4%) | 304 (44.6%) |
Housing Structures by Number of Rooms in Ashland
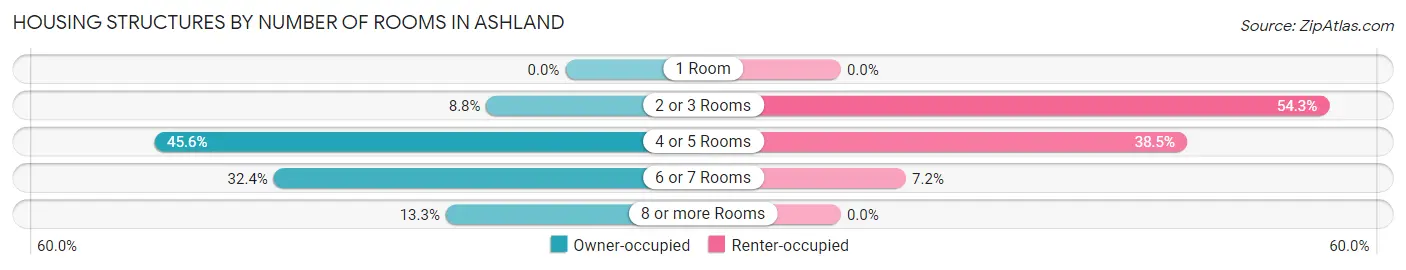
| Number of Rooms | Owner-occupied | Renter-occupied |
| 1 Room | 0 (0.0%) | 0 (0.0%) |
| 2 or 3 Rooms | 33 (8.7%) | 165 (54.3%) |
| 4 or 5 Rooms | 172 (45.6%) | 117 (38.5%) |
| 6 or 7 Rooms | 122 (32.4%) | 22 (7.2%) |
| 8 or more Rooms | 50 (13.3%) | 0 (0.0%) |
| Total | 377 (100.0%) | 304 (100.0%) |
Housing Structure by Heating Type in Ashland
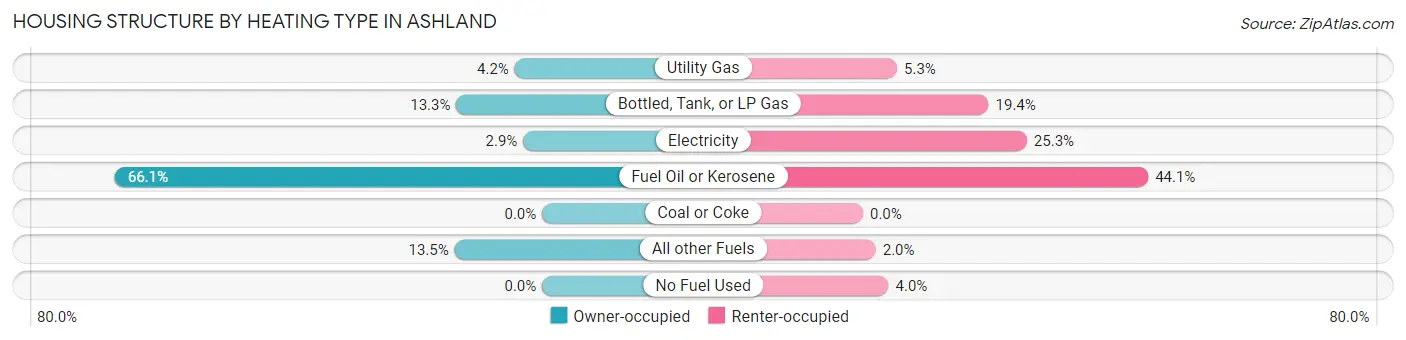
| Heating Type | Owner-occupied | Renter-occupied |
| Utility Gas | 16 (4.2%) | 16 (5.3%) |
| Bottled, Tank, or LP Gas | 50 (13.3%) | 59 (19.4%) |
| Electricity | 11 (2.9%) | 77 (25.3%) |
| Fuel Oil or Kerosene | 249 (66.0%) | 134 (44.1%) |
| Coal or Coke | 0 (0.0%) | 0 (0.0%) |
| All other Fuels | 51 (13.5%) | 6 (2.0%) |
| No Fuel Used | 0 (0.0%) | 12 (4.0%) |
| Total | 377 (100.0%) | 304 (100.0%) |
Household Vehicle Usage in Ashland
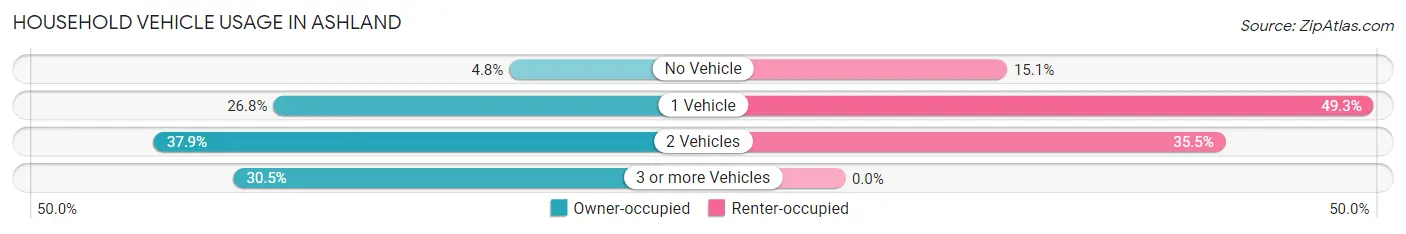
| Vehicles per Household | Owner-occupied | Renter-occupied |
| No Vehicle | 18 (4.8%) | 46 (15.1%) |
| 1 Vehicle | 101 (26.8%) | 150 (49.3%) |
| 2 Vehicles | 143 (37.9%) | 108 (35.5%) |
| 3 or more Vehicles | 115 (30.5%) | 0 (0.0%) |
| Total | 377 (100.0%) | 304 (100.0%) |
Real Estate & Mortgages in Ashland
Real Estate and Mortgage Overview in Ashland
| Characteristic | Without Mortgage | With Mortgage |
| Housing Units | 180 | 197 |
| Median Property Value | $165,500 | $162,100 |
| Median Household Income | $39,659 | $8 |
| Monthly Housing Costs | $812 | $6 |
| Real Estate Taxes | $4,059 | $0 |
Property Value by Mortgage Status in Ashland
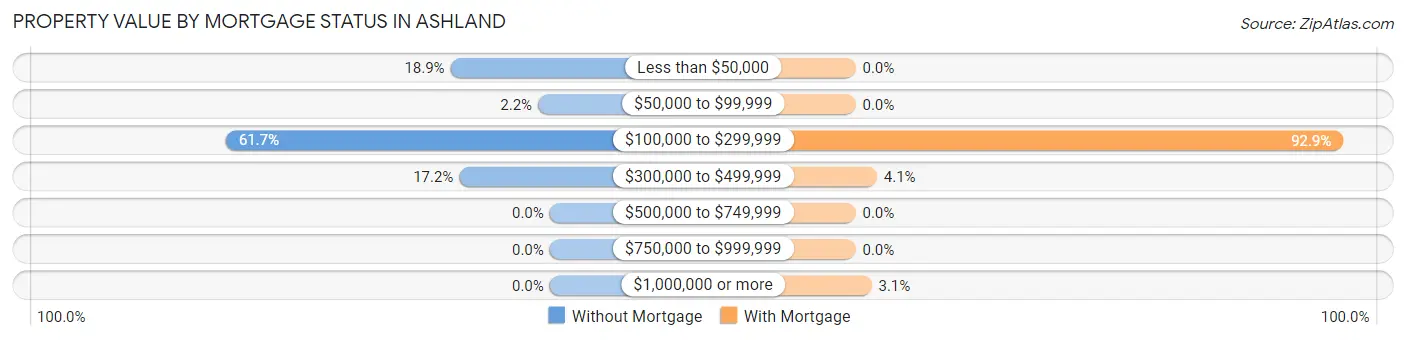
| Property Value | Without Mortgage | With Mortgage |
| Less than $50,000 | 34 (18.9%) | 0 (0.0%) |
| $50,000 to $99,999 | 4 (2.2%) | 0 (0.0%) |
| $100,000 to $299,999 | 111 (61.7%) | 183 (92.9%) |
| $300,000 to $499,999 | 31 (17.2%) | 8 (4.1%) |
| $500,000 to $749,999 | 0 (0.0%) | 0 (0.0%) |
| $750,000 to $999,999 | 0 (0.0%) | 0 (0.0%) |
| $1,000,000 or more | 0 (0.0%) | 6 (3.0%) |
| Total | 180 (100.0%) | 197 (100.0%) |
Household Income by Mortgage Status in Ashland
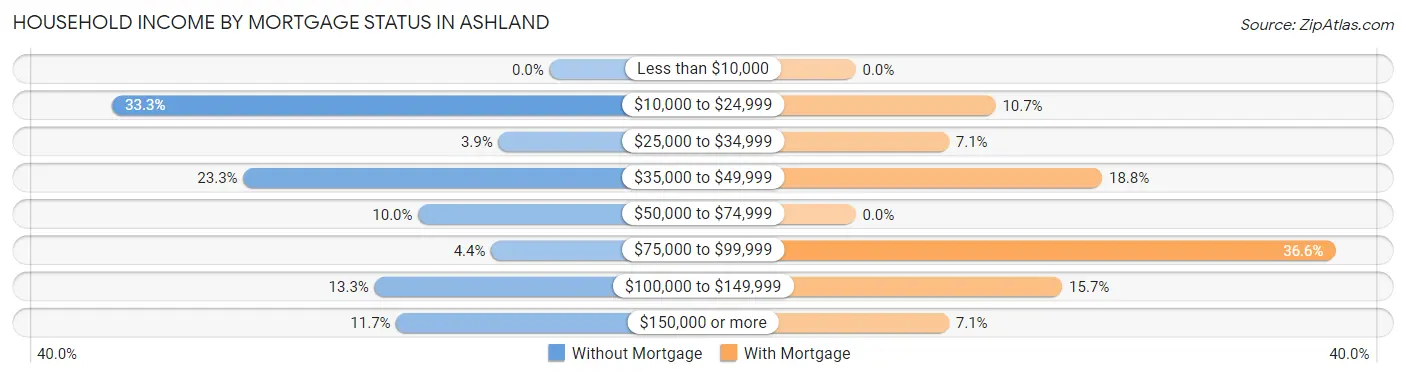
| Household Income | Without Mortgage | With Mortgage |
| Less than $10,000 | 0 (0.0%) | 0 (0.0%) |
| $10,000 to $24,999 | 60 (33.3%) | 21 (10.7%) |
| $25,000 to $34,999 | 7 (3.9%) | 14 (7.1%) |
| $35,000 to $49,999 | 42 (23.3%) | 37 (18.8%) |
| $50,000 to $74,999 | 18 (10.0%) | 0 (0.0%) |
| $75,000 to $99,999 | 8 (4.4%) | 72 (36.5%) |
| $100,000 to $149,999 | 24 (13.3%) | 31 (15.7%) |
| $150,000 or more | 21 (11.7%) | 14 (7.1%) |
| Total | 180 (100.0%) | 197 (100.0%) |
Property Value to Household Income Ratio in Ashland
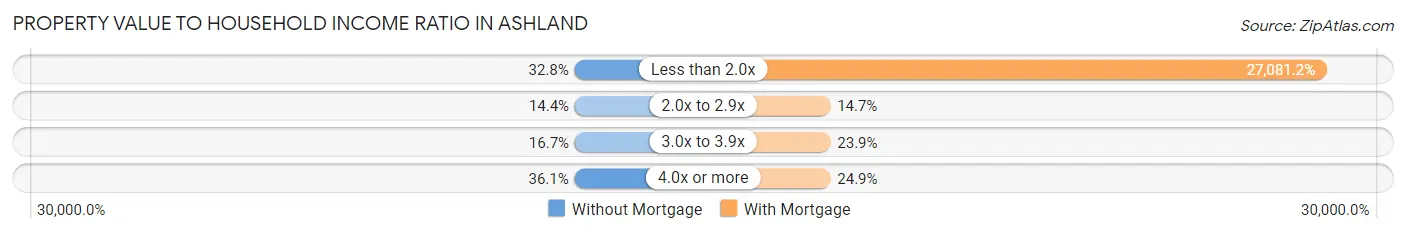
| Value-to-Income Ratio | Without Mortgage | With Mortgage |
| Less than 2.0x | 59 (32.8%) | 53,350 (27,081.2%) |
| 2.0x to 2.9x | 26 (14.4%) | 29 (14.7%) |
| 3.0x to 3.9x | 30 (16.7%) | 47 (23.9%) |
| 4.0x or more | 65 (36.1%) | 49 (24.9%) |
| Total | 180 (100.0%) | 197 (100.0%) |
Real Estate Taxes by Mortgage Status in Ashland
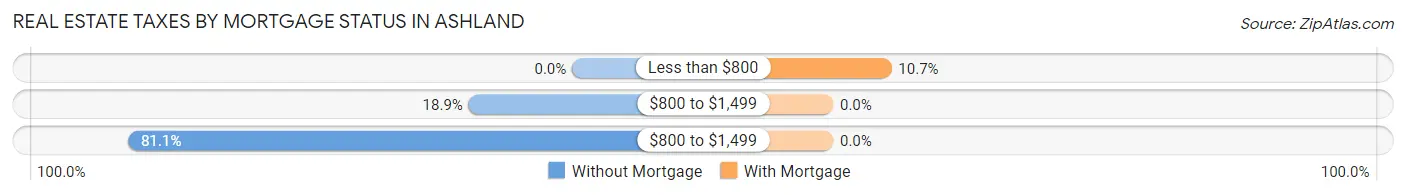
| Property Taxes | Without Mortgage | With Mortgage |
| Less than $800 | 0 (0.0%) | 21 (10.7%) |
| $800 to $1,499 | 34 (18.9%) | 0 (0.0%) |
| $800 to $1,499 | 146 (81.1%) | 0 (0.0%) |
| Total | 180 (100.0%) | 197 (100.0%) |
Health & Disability in Ashland
Health Insurance Coverage by Age in Ashland
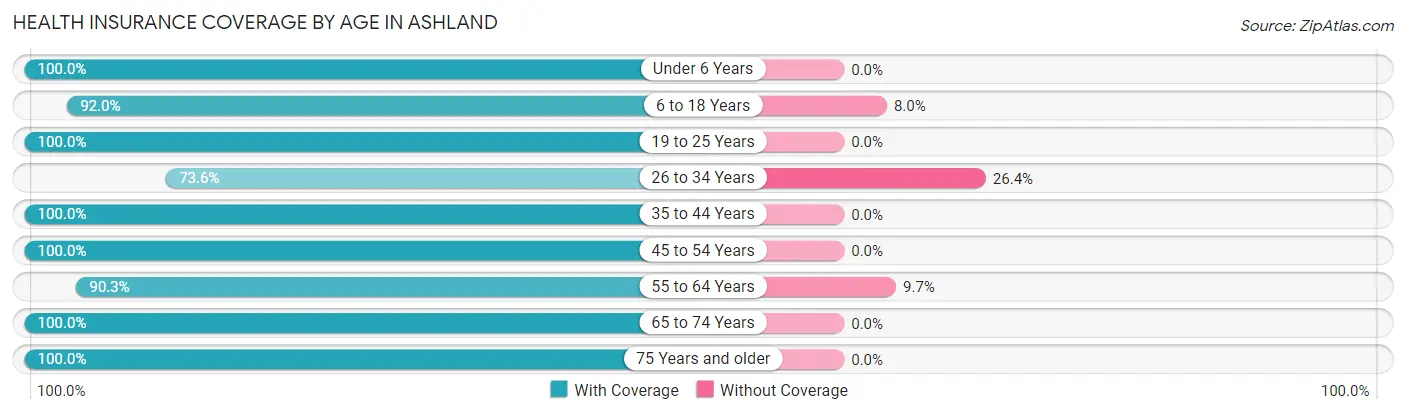
| Age Bracket | With Coverage | Without Coverage |
| Under 6 Years | 248 (100.0%) | 0 (0.0%) |
| 6 to 18 Years | 185 (92.0%) | 16 (8.0%) |
| 19 to 25 Years | 174 (100.0%) | 0 (0.0%) |
| 26 to 34 Years | 209 (73.6%) | 75 (26.4%) |
| 35 to 44 Years | 76 (100.0%) | 0 (0.0%) |
| 45 to 54 Years | 91 (100.0%) | 0 (0.0%) |
| 55 to 64 Years | 159 (90.3%) | 17 (9.7%) |
| 65 to 74 Years | 200 (100.0%) | 0 (0.0%) |
| 75 Years and older | 70 (100.0%) | 0 (0.0%) |
| Total | 1,412 (92.9%) | 108 (7.1%) |
Health Insurance Coverage by Citizenship Status in Ashland
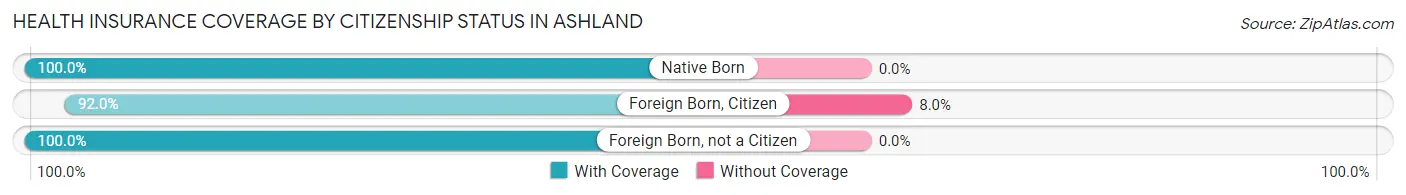
| Citizenship Status | With Coverage | Without Coverage |
| Native Born | 248 (100.0%) | 0 (0.0%) |
| Foreign Born, Citizen | 185 (92.0%) | 16 (8.0%) |
| Foreign Born, not a Citizen | 174 (100.0%) | 0 (0.0%) |
Health Insurance Coverage by Household Income in Ashland
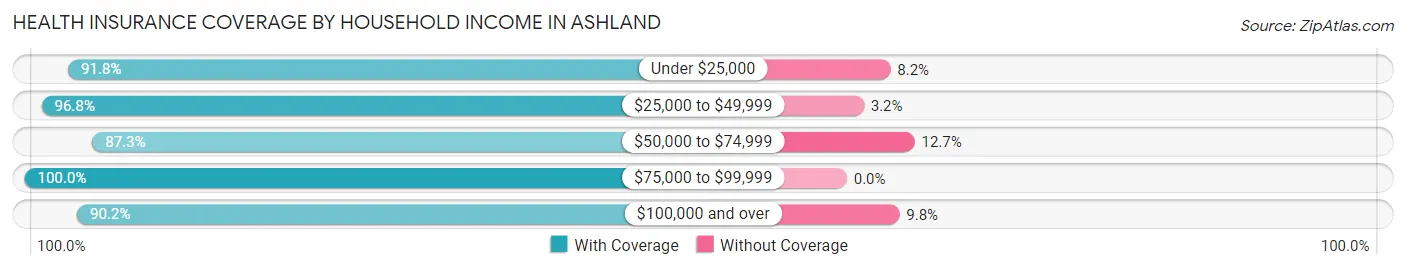
| Household Income | With Coverage | Without Coverage |
| Under $25,000 | 495 (91.8%) | 44 (8.2%) |
| $25,000 to $49,999 | 213 (96.8%) | 7 (3.2%) |
| $50,000 to $74,999 | 227 (87.3%) | 33 (12.7%) |
| $75,000 to $99,999 | 257 (100.0%) | 0 (0.0%) |
| $100,000 and over | 220 (90.2%) | 24 (9.8%) |
Public vs Private Health Insurance Coverage by Age in Ashland
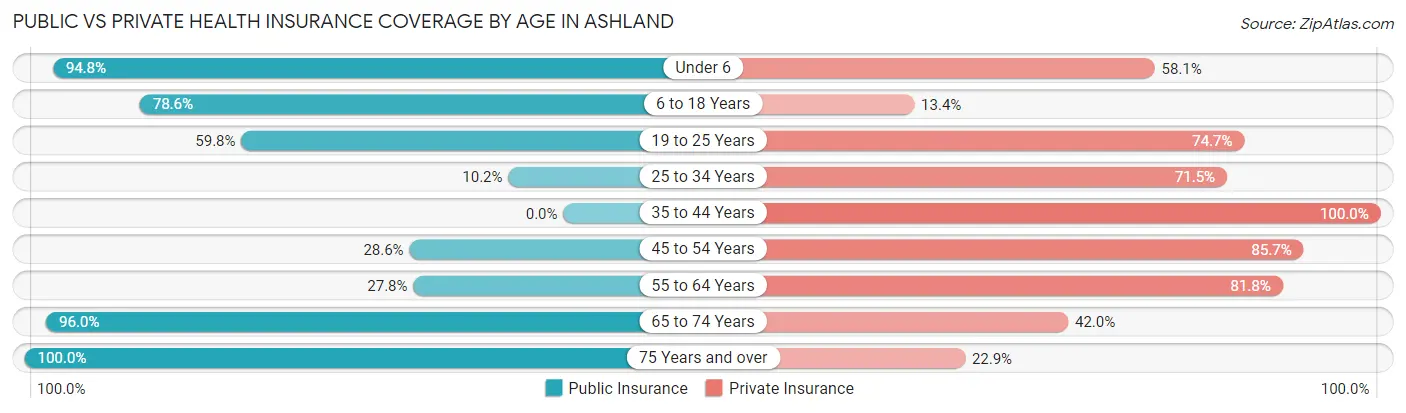
| Age Bracket | Public Insurance | Private Insurance |
| Under 6 | 235 (94.8%) | 144 (58.1%) |
| 6 to 18 Years | 158 (78.6%) | 27 (13.4%) |
| 19 to 25 Years | 104 (59.8%) | 130 (74.7%) |
| 25 to 34 Years | 29 (10.2%) | 203 (71.5%) |
| 35 to 44 Years | 0 (0.0%) | 76 (100.0%) |
| 45 to 54 Years | 26 (28.6%) | 78 (85.7%) |
| 55 to 64 Years | 49 (27.8%) | 144 (81.8%) |
| 65 to 74 Years | 192 (96.0%) | 84 (42.0%) |
| 75 Years and over | 70 (100.0%) | 16 (22.9%) |
| Total | 863 (56.8%) | 902 (59.3%) |
Disability Status by Sex by Age in Ashland
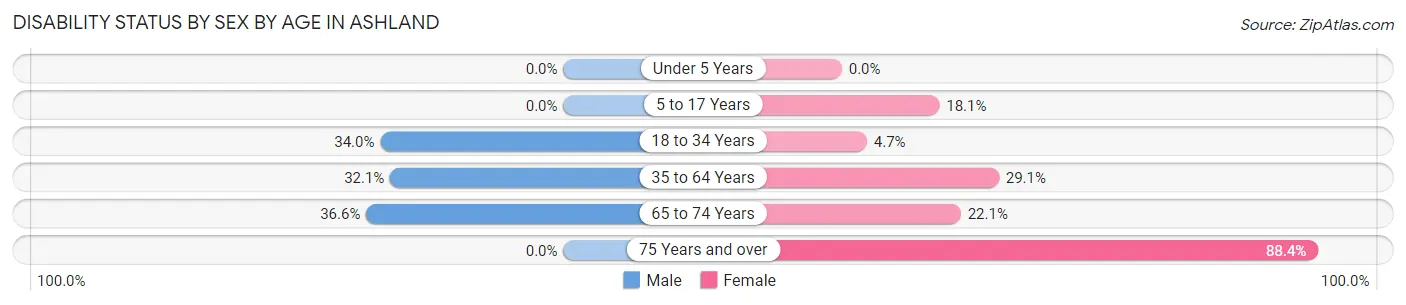
| Age Bracket | Male | Female |
| Under 5 Years | 0 (0.0%) | 0 (0.0%) |
| 5 to 17 Years | 0 (0.0%) | 21 (18.1%) |
| 18 to 34 Years | 70 (34.0%) | 12 (4.6%) |
| 35 to 64 Years | 54 (32.1%) | 51 (29.1%) |
| 65 to 74 Years | 45 (36.6%) | 17 (22.1%) |
| 75 Years and over | 0 (0.0%) | 61 (88.4%) |
Disability Class by Sex by Age in Ashland
Disability Class: Hearing Difficulty
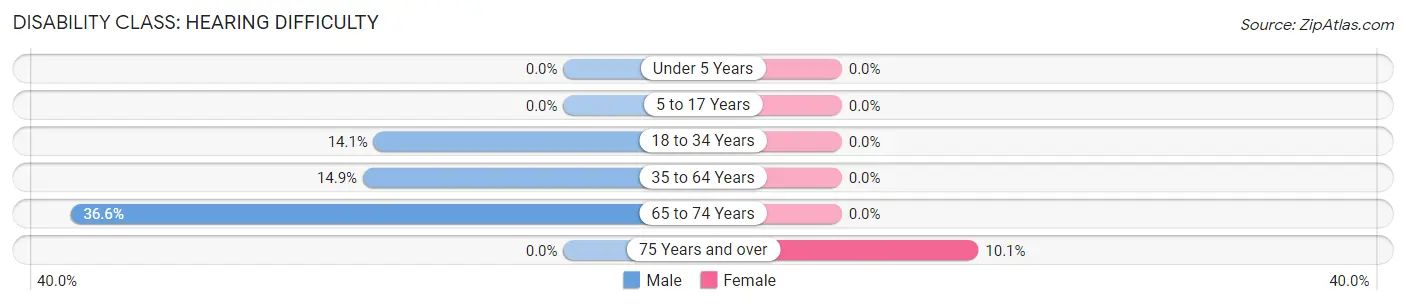
| Age Bracket | Male | Female |
| Under 5 Years | 0 (0.0%) | 0 (0.0%) |
| 5 to 17 Years | 0 (0.0%) | 0 (0.0%) |
| 18 to 34 Years | 29 (14.1%) | 0 (0.0%) |
| 35 to 64 Years | 25 (14.9%) | 0 (0.0%) |
| 65 to 74 Years | 45 (36.6%) | 0 (0.0%) |
| 75 Years and over | 0 (0.0%) | 7 (10.1%) |
Disability Class: Vision Difficulty
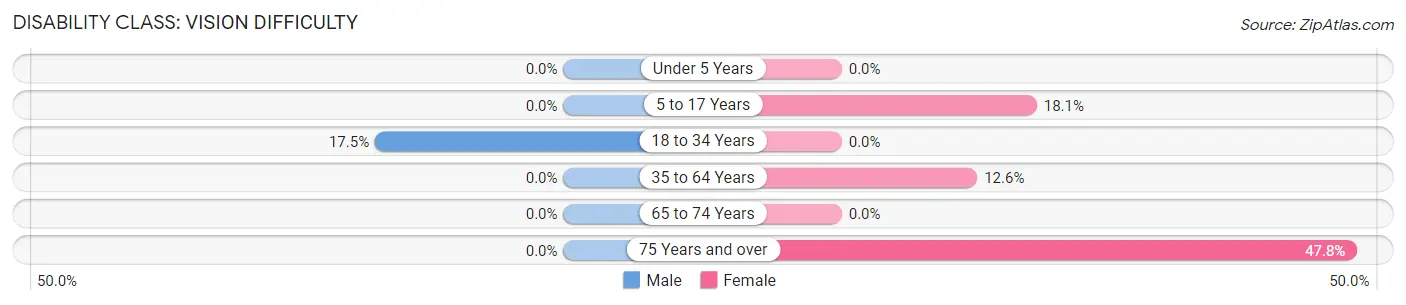
| Age Bracket | Male | Female |
| Under 5 Years | 0 (0.0%) | 0 (0.0%) |
| 5 to 17 Years | 0 (0.0%) | 21 (18.1%) |
| 18 to 34 Years | 36 (17.5%) | 0 (0.0%) |
| 35 to 64 Years | 0 (0.0%) | 22 (12.6%) |
| 65 to 74 Years | 0 (0.0%) | 0 (0.0%) |
| 75 Years and over | 0 (0.0%) | 33 (47.8%) |
Disability Class: Cognitive Difficulty
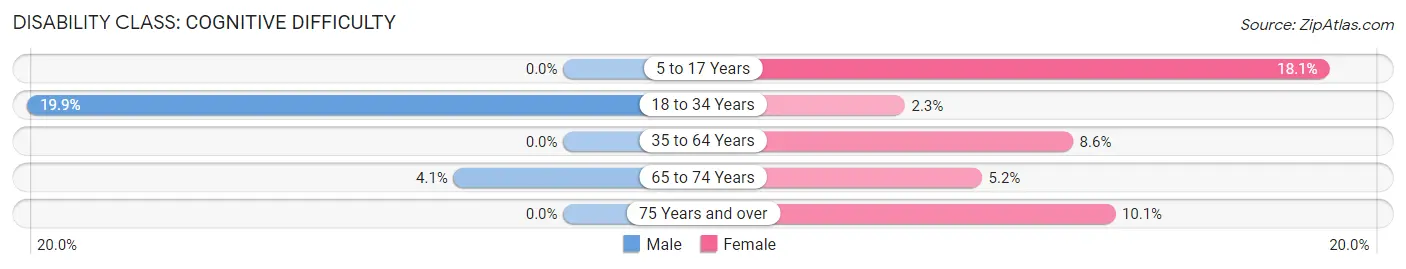
| Age Bracket | Male | Female |
| 5 to 17 Years | 0 (0.0%) | 21 (18.1%) |
| 18 to 34 Years | 41 (19.9%) | 6 (2.3%) |
| 35 to 64 Years | 0 (0.0%) | 15 (8.6%) |
| 65 to 74 Years | 5 (4.1%) | 4 (5.2%) |
| 75 Years and over | 0 (0.0%) | 7 (10.1%) |
Disability Class: Ambulatory Difficulty
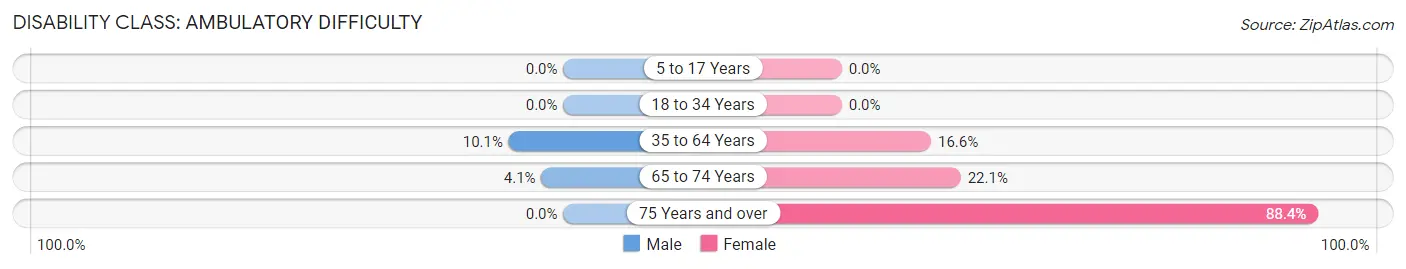
| Age Bracket | Male | Female |
| 5 to 17 Years | 0 (0.0%) | 0 (0.0%) |
| 18 to 34 Years | 0 (0.0%) | 0 (0.0%) |
| 35 to 64 Years | 17 (10.1%) | 29 (16.6%) |
| 65 to 74 Years | 5 (4.1%) | 17 (22.1%) |
| 75 Years and over | 0 (0.0%) | 61 (88.4%) |
Disability Class: Self-Care Difficulty
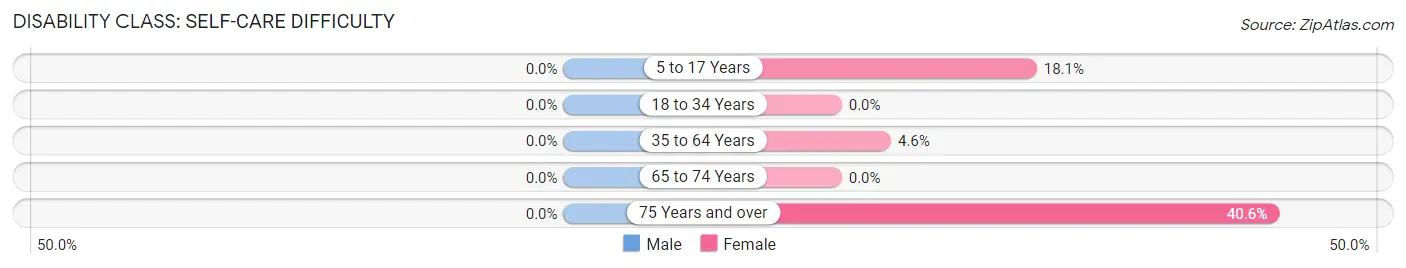
| Age Bracket | Male | Female |
| 5 to 17 Years | 0 (0.0%) | 21 (18.1%) |
| 18 to 34 Years | 0 (0.0%) | 0 (0.0%) |
| 35 to 64 Years | 0 (0.0%) | 8 (4.6%) |
| 65 to 74 Years | 0 (0.0%) | 0 (0.0%) |
| 75 Years and over | 0 (0.0%) | 28 (40.6%) |
Technology Access in Ashland
Computing Device Access in Ashland
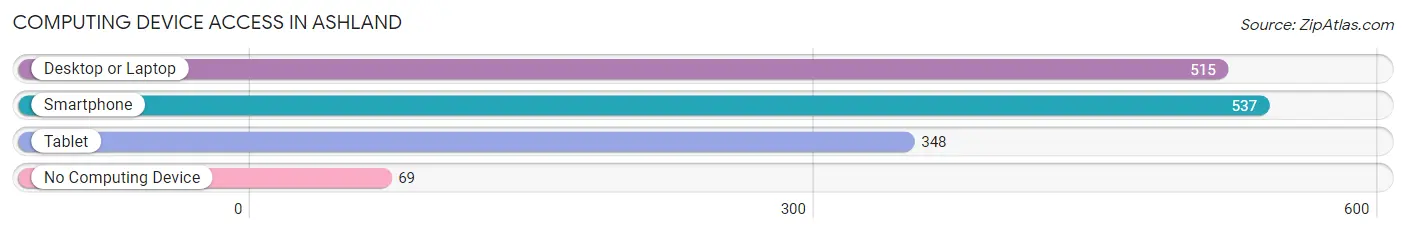
| Device Type | # Households | % Households |
| Desktop or Laptop | 515 | 75.6% |
| Smartphone | 537 | 78.8% |
| Tablet | 348 | 51.1% |
| No Computing Device | 69 | 10.1% |
| Total | 681 | 100.0% |
Internet Access in Ashland
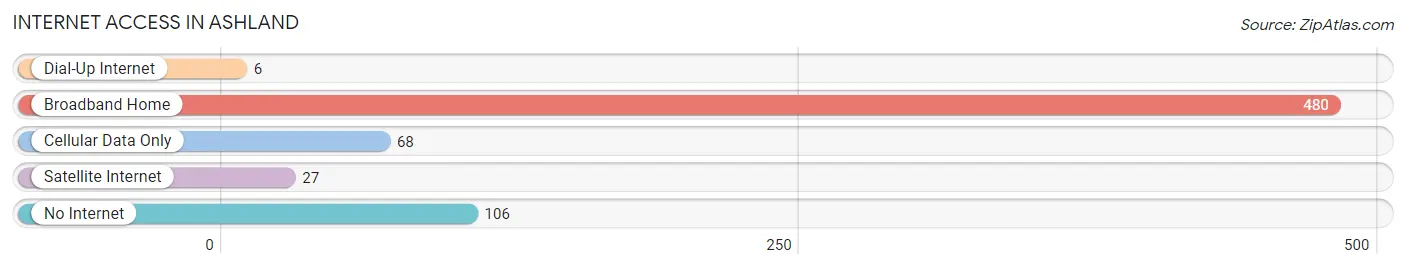
| Internet Type | # Households | % Households |
| Dial-Up Internet | 6 | 0.9% |
| Broadband Home | 480 | 70.5% |
| Cellular Data Only | 68 | 10.0% |
| Satellite Internet | 27 | 4.0% |
| No Internet | 106 | 15.6% |
| Total | 681 | 100.0% |
Ashland Summary
Ashland, New Hampshire is a small town located in the heart of the White Mountains region of the state. It is situated in Grafton County, and is bordered by the towns of Holderness, Plymouth, and Bridgewater. The town has a population of 1,845 people, according to the 2010 census.
Geography
Ashland is located in the White Mountains region of New Hampshire, and is situated in Grafton County. The town is bordered by the towns of Holderness, Plymouth, and Bridgewater. The town is located in the Pemigewasset River Valley, and is surrounded by the White Mountain National Forest. The town is located at an elevation of 1,400 feet, and is home to the highest peak in the state, Mount Washington. The town is also home to the Squam Lakes Natural Science Center, which is a popular tourist destination.
The town is located in a rural area, and is home to many small farms and businesses. The town is also home to the Ashland State Forest, which is a popular destination for hikers and campers. The town is also home to the Ashland Ski Area, which is a popular destination for skiers and snowboarders.
History
The town of Ashland was first settled in 1763 by settlers from Massachusetts. The town was originally known as "New Ashland", and was named after the town of Ashland, Massachusetts. The town was incorporated in 1777, and was named after the town of Ashland, Massachusetts.
The town was originally a farming community, and was home to many small farms and businesses. The town was also home to several mills, including a sawmill, gristmill, and a woolen mill. The town was also home to a tannery, which was used to produce leather goods.
The town was also home to a number of small businesses, including a blacksmith, a general store, and a post office. The town was also home to a number of churches, including the Congregational Church, the Methodist Church, and the Baptist Church.
The town was also home to a number of schools, including the Ashland Academy, which was founded in 1820. The town was also home to a number of other schools, including the Ashland High School, which was founded in 1872.
Economy
The economy of Ashland is largely based on tourism and outdoor recreation. The town is home to the Squam Lakes Natural Science Center, which is a popular tourist destination. The town is also home to the Ashland Ski Area, which is a popular destination for skiers and snowboarders.
The town is also home to a number of small businesses, including restaurants, retail stores, and lodging. The town is also home to a number of small farms, which produce a variety of products, including dairy, eggs, vegetables, and fruits.
Demographics
According to the 2010 census, the population of Ashland was 1,845 people. The town has a median age of 44.7 years, and a median household income of $50,945. The town is predominantly white, with 95.3% of the population being white. The town is also home to a small Hispanic population, with 2.2% of the population being Hispanic.
The town is also home to a small Native American population, with 0.3% of the population being Native American. The town is also home to a small Asian population, with 0.7% of the population being Asian. The town is also home to a small African American population, with 0.2% of the population being African American.
Common Questions
What is Per Capita Income in Ashland?
Per Capita income in Ashland is $25,740.
What is the Median Family Income in Ashland?
Median Family Income in Ashland is $58,269.
What is the Median Household income in Ashland?
Median Household Income in Ashland is $40,559.
What is Income or Wage Gap in Ashland?
Income or Wage Gap in Ashland is 6.7%.
Women in Ashland earn 93.3 cents for every dollar earned by a man.
What is Inequality or Gini Index in Ashland?
Inequality or Gini Index in Ashland is 0.47.
What is the Total Population of Ashland?
Total Population of Ashland is 1,520.
What is the Total Male Population of Ashland?
Total Male Population of Ashland is 783.
What is the Total Female Population of Ashland?
Total Female Population of Ashland is 737.
What is the Ratio of Males per 100 Females in Ashland?
There are 106.24 Males per 100 Females in Ashland.
What is the Ratio of Females per 100 Males in Ashland?
There are 94.13 Females per 100 Males in Ashland.
What is the Median Population Age in Ashland?
Median Population Age in Ashland is 29.1 Years.
What is the Average Family Size in Ashland
Average Family Size in Ashland is 3.1 People.
What is the Average Household Size in Ashland
Average Household Size in Ashland is 2.2 People.
How Large is the Labor Force in Ashland?
There are 720 People in the Labor Forcein in Ashland.
What is the Percentage of People in the Labor Force in Ashland?
65.1% of People are in the Labor Force in Ashland.
What is the Unemployment Rate in Ashland?
Unemployment Rate in Ashland is 2.6%.