New Hampton, NH Map & Demographics
New Hampton Map
New Hampton Overview
$26,042
PER CAPITA INCOME
$86,964
AVG FAMILY INCOME
$80,625
AVG HOUSEHOLD INCOME
0.25
INEQUALITY / GINI INDEX
324
TOTAL POPULATION
218
MALE POPULATION
106
FEMALE POPULATION
205.66
MALES / 100 FEMALES
48.62
FEMALES / 100 MALES
59.3
MEDIAN AGE
3.2
AVG FAMILY SIZE
2.7
AVG HOUSEHOLD SIZE
151
LABOR FORCE [ PEOPLE ]
50.8%
PERCENT IN LABOR FORCE
New Hampton Zip Codes
New Hampton Area Codes
Income in New Hampton
Income Overview in New Hampton
Per Capita Income in New Hampton is $26,042, while median incomes of families and households are $86,964 and $80,625 respectively.
| Characteristic | Number | Measure |
| Per Capita Income | 324 | $26,042 |
| Median Family Income | 61 | $86,964 |
| Mean Family Income | 61 | $96,557 |
| Median Household Income | 81 | $80,625 |
| Mean Household Income | 81 | $86,940 |
| Income Deficit | 61 | $0 |
| Wage / Income Gap (%) | 324 | 0.00% |
| Wage / Income Gap ($) | 324 | 100.00¢ per $1 |
| Gini / Inequality Index | 324 | 0.25 |
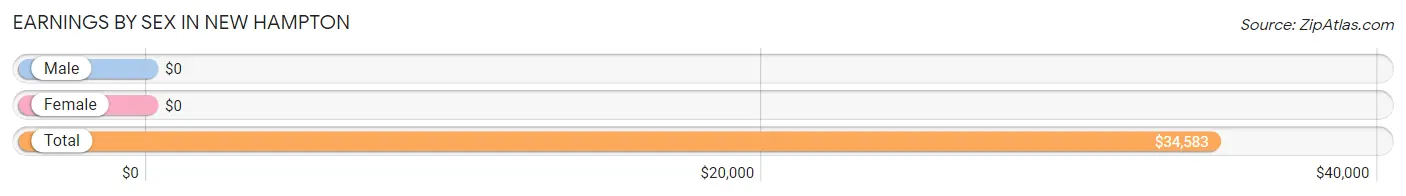
Earnings by Sex in New Hampton
| Sex | Number | Average Earnings |
| Male | 69 (45.7%) | $0 |
| Female | 82 (54.3%) | $0 |
| Total | 151 (100.0%) | $34,583 |
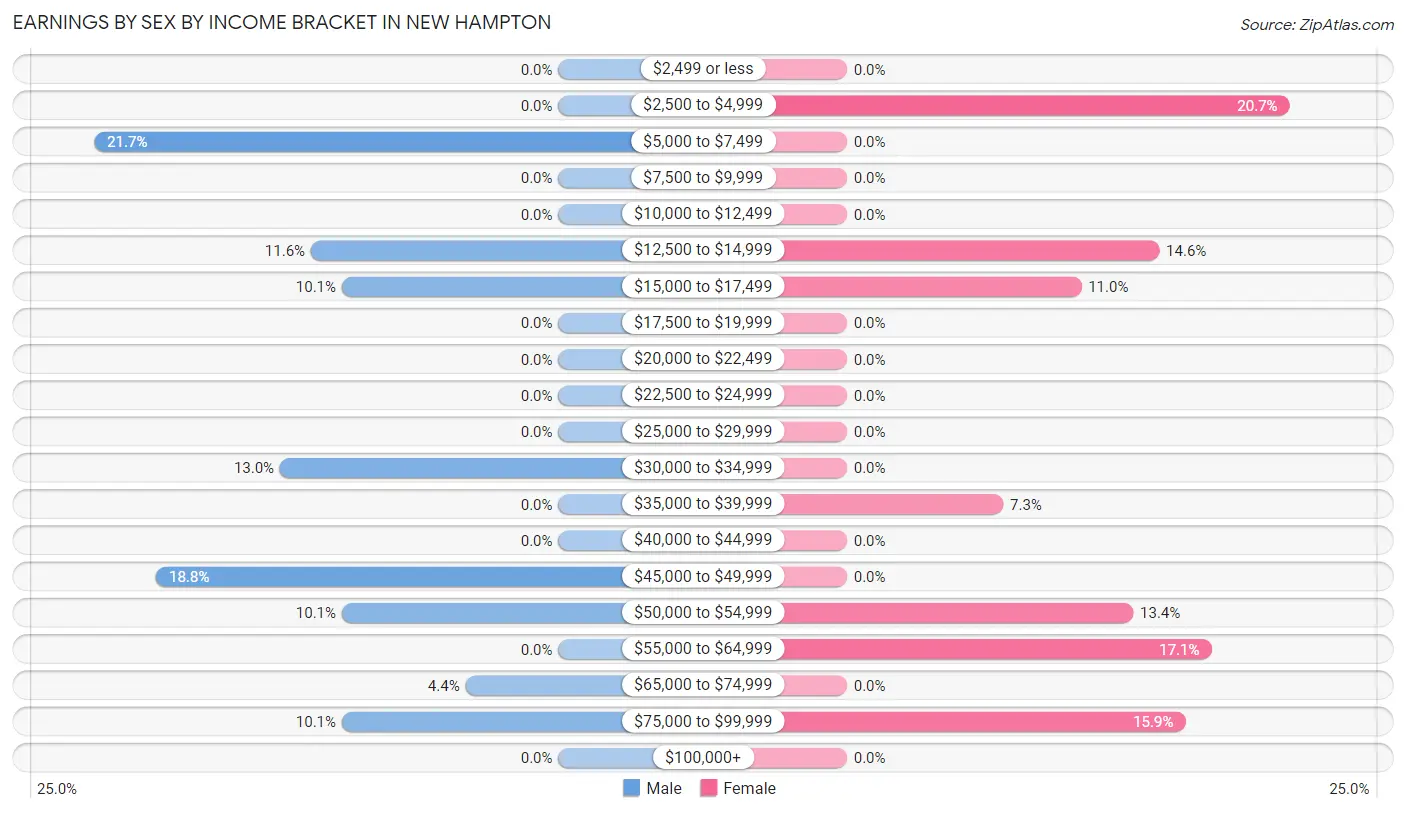
Earnings by Sex by Income Bracket in New Hampton
The most common earnings brackets in New Hampton are $5,000 to $7,499 for men (15 | 21.7%) and $2,500 to $4,999 for women (17 | 20.7%).
| Income | Male | Female |
| $2,499 or less | 0 (0.0%) | 0 (0.0%) |
| $2,500 to $4,999 | 0 (0.0%) | 17 (20.7%) |
| $5,000 to $7,499 | 15 (21.7%) | 0 (0.0%) |
| $7,500 to $9,999 | 0 (0.0%) | 0 (0.0%) |
| $10,000 to $12,499 | 0 (0.0%) | 0 (0.0%) |
| $12,500 to $14,999 | 8 (11.6%) | 12 (14.6%) |
| $15,000 to $17,499 | 7 (10.1%) | 9 (11.0%) |
| $17,500 to $19,999 | 0 (0.0%) | 0 (0.0%) |
| $20,000 to $22,499 | 0 (0.0%) | 0 (0.0%) |
| $22,500 to $24,999 | 0 (0.0%) | 0 (0.0%) |
| $25,000 to $29,999 | 0 (0.0%) | 0 (0.0%) |
| $30,000 to $34,999 | 9 (13.0%) | 0 (0.0%) |
| $35,000 to $39,999 | 0 (0.0%) | 6 (7.3%) |
| $40,000 to $44,999 | 0 (0.0%) | 0 (0.0%) |
| $45,000 to $49,999 | 13 (18.8%) | 0 (0.0%) |
| $50,000 to $54,999 | 7 (10.1%) | 11 (13.4%) |
| $55,000 to $64,999 | 0 (0.0%) | 14 (17.1%) |
| $65,000 to $74,999 | 3 (4.3%) | 0 (0.0%) |
| $75,000 to $99,999 | 7 (10.1%) | 13 (15.9%) |
| $100,000+ | 0 (0.0%) | 0 (0.0%) |
| Total | 69 (100.0%) | 82 (100.0%) |
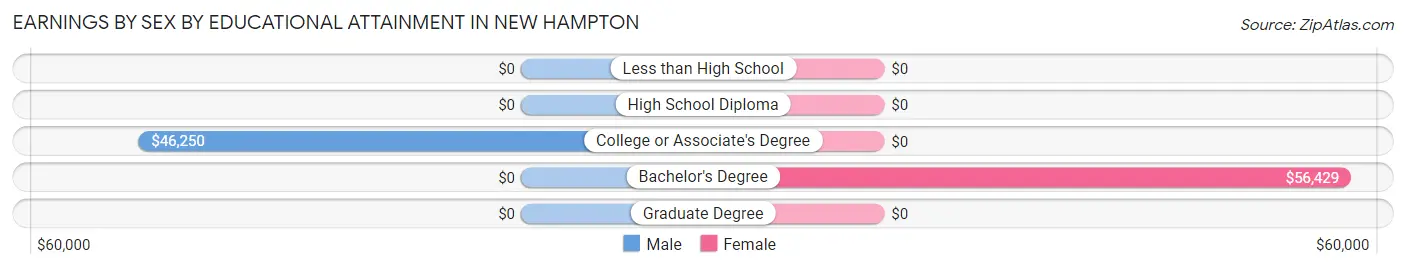
Earnings by Sex by Educational Attainment in New Hampton
| Educational Attainment | Male Income | Female Income |
| Less than High School | - | - |
| High School Diploma | - | - |
| College or Associate's Degree | $46,250 | $0 |
| Bachelor's Degree | - | - |
| Graduate Degree | - | - |
| Total | - | - |
Family Income in New Hampton
Family Income Brackets in New Hampton
According to the New Hampton family income data, there are 22 families falling into the $100,000 to $149,999 income range, which is the most common income bracket and makes up 36.1% of all families.
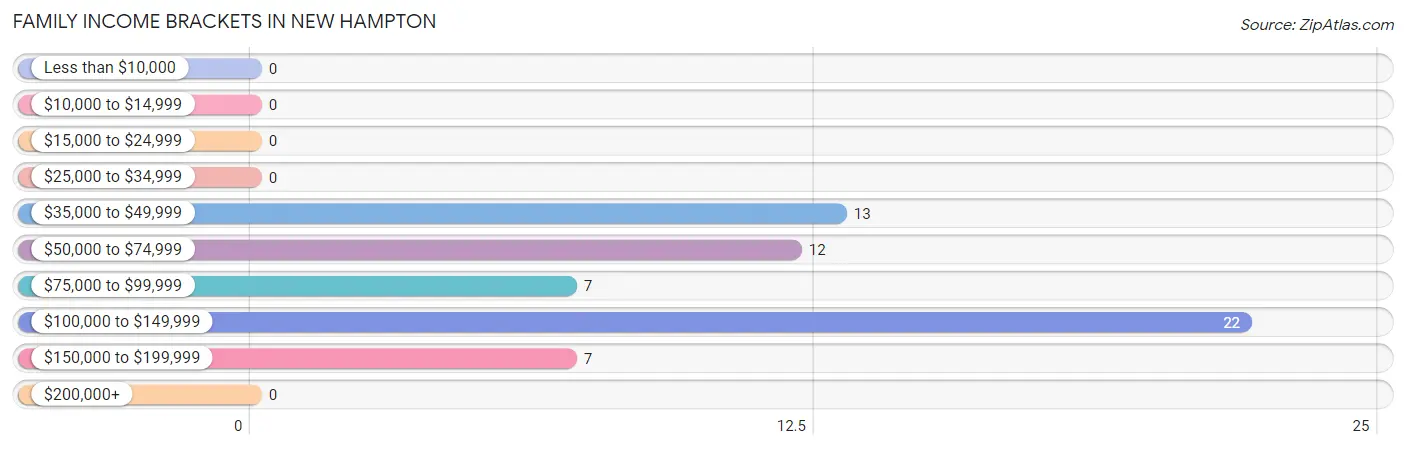
| Income Bracket | # Families | % Families |
| Less than $10,000 | 0 | 0.0% |
| $10,000 to $14,999 | 0 | 0.0% |
| $15,000 to $24,999 | 0 | 0.0% |
| $25,000 to $34,999 | 0 | 0.0% |
| $35,000 to $49,999 | 13 | 21.3% |
| $50,000 to $74,999 | 12 | 19.7% |
| $75,000 to $99,999 | 7 | 11.5% |
| $100,000 to $149,999 | 22 | 36.1% |
| $150,000 to $199,999 | 7 | 11.5% |
| $200,000+ | 0 | 0.0% |
Family Income by Famaliy Size in New Hampton
3-person families (22 | 36.1%) account for the highest median family income in New Hampton with $113,929 per family, while 2-person families (27 | 44.3%) have the highest median income of $42,590 per family member.
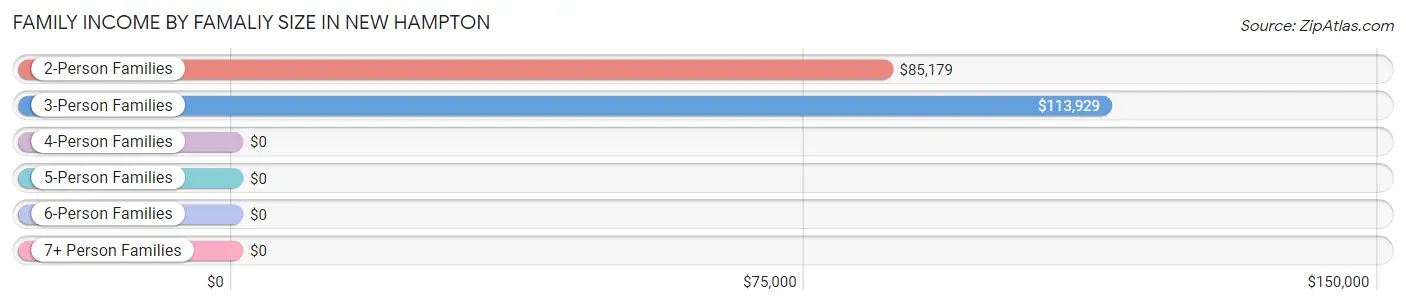
| Income Bracket | # Families | Median Income |
| 2-Person Families | 27 (44.3%) | $85,179 |
| 3-Person Families | 22 (36.1%) | $113,929 |
| 4-Person Families | 7 (11.5%) | $0 |
| 5-Person Families | 5 (8.2%) | $0 |
| 6-Person Families | 0 (0.0%) | $0 |
| 7+ Person Families | 0 (0.0%) | $0 |
| Total | 61 (100.0%) | $86,964 |
Family Income by Number of Earners in New Hampton
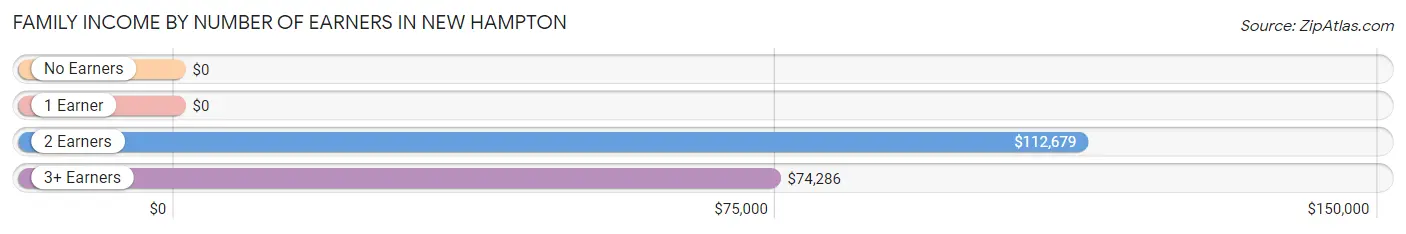
| Number of Earners | # Families | Median Income |
| No Earners | 4 (6.6%) | $0 |
| 1 Earner | 4 (6.6%) | $0 |
| 2 Earners | 33 (54.1%) | $112,679 |
| 3+ Earners | 20 (32.8%) | $74,286 |
| Total | 61 (100.0%) | $86,964 |
Household Income in New Hampton
Household Income Brackets in New Hampton
With 22 households falling in the category, the $100,000 to $149,999 income range is the most frequent in New Hampton, accounting for 27.2% of all households.
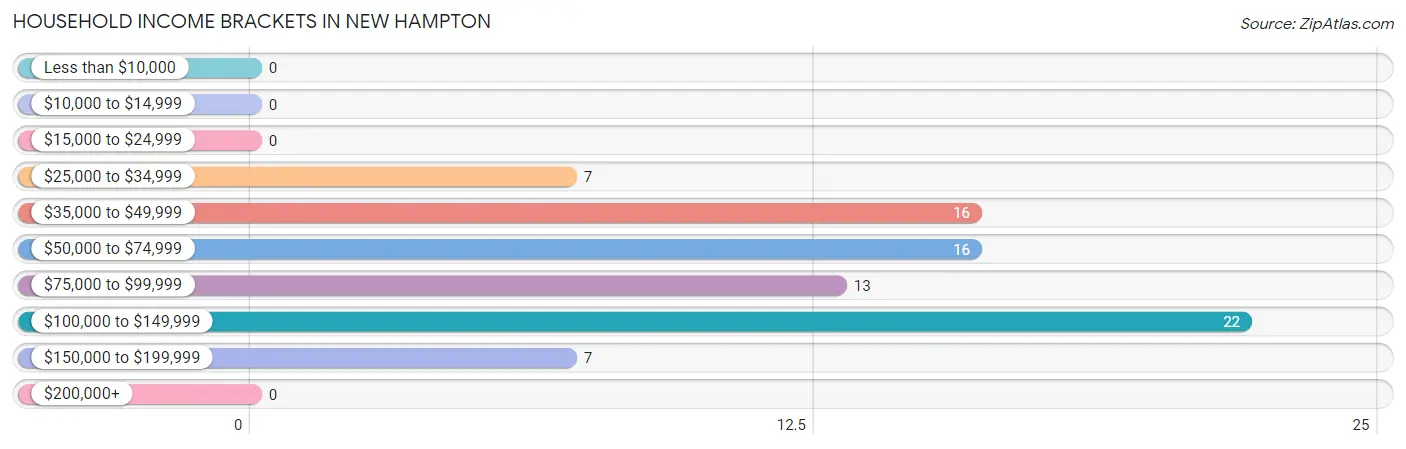
| Income Bracket | # Households | % Households |
| Less than $10,000 | 0 | 0.0% |
| $10,000 to $14,999 | 0 | 0.0% |
| $15,000 to $24,999 | 0 | 0.0% |
| $25,000 to $34,999 | 7 | 8.6% |
| $35,000 to $49,999 | 16 | 19.8% |
| $50,000 to $74,999 | 16 | 19.8% |
| $75,000 to $99,999 | 13 | 16.0% |
| $100,000 to $149,999 | 22 | 27.2% |
| $150,000 to $199,999 | 7 | 8.6% |
| $200,000+ | 0 | 0.0% |
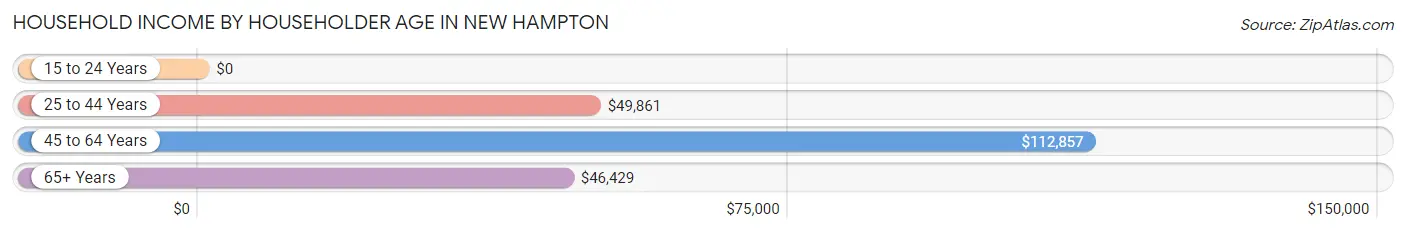
Household Income by Householder Age in New Hampton
The median household income in New Hampton is $80,625, with the highest median household income of $112,857 found in the 45 to 64 years age bracket for the primary householder. A total of 42 households (51.8%) fall into this category.
| Income Bracket | # Households | Median Income |
| 15 to 24 Years | 0 (0.0%) | $0 |
| 25 to 44 Years | 17 (21.0%) | $49,861 |
| 45 to 64 Years | 42 (51.8%) | $112,857 |
| 65+ Years | 22 (27.2%) | $46,429 |
| Total | 81 (100.0%) | $80,625 |
Poverty in New Hampton
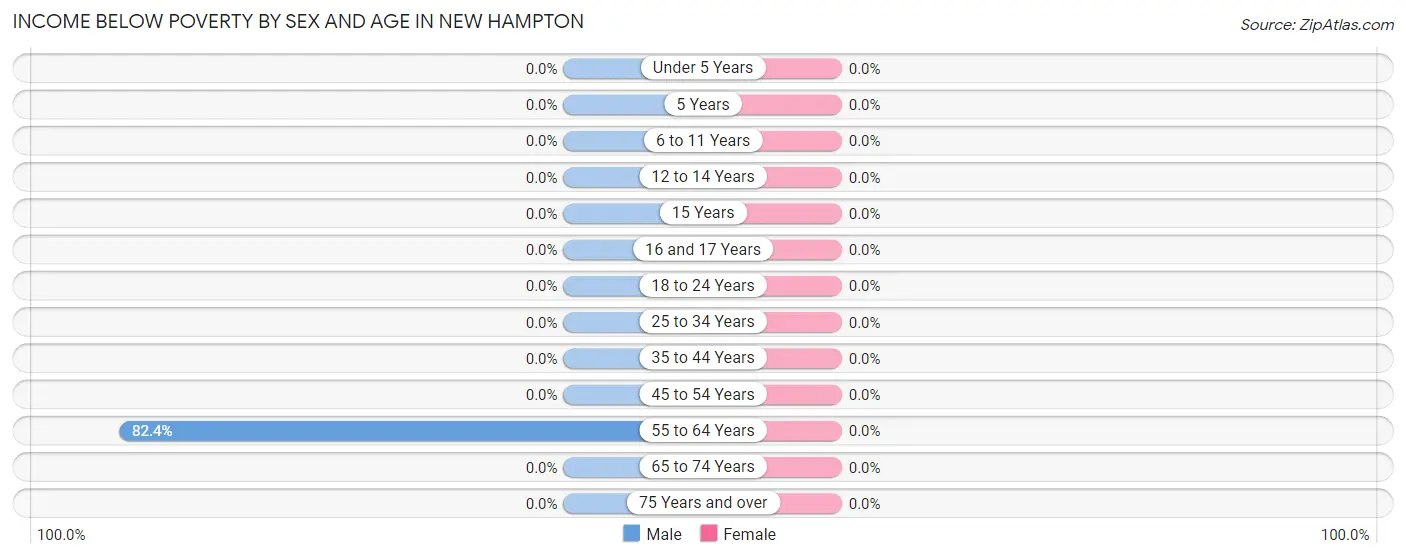
Income Below Poverty by Sex and Age in New Hampton
| Age Bracket | Male | Female |
| Under 5 Years | 0 (0.0%) | 0 (0.0%) |
| 5 Years | 0 (0.0%) | 0 (0.0%) |
| 6 to 11 Years | 0 (0.0%) | 0 (0.0%) |
| 12 to 14 Years | 0 (0.0%) | 0 (0.0%) |
| 15 Years | 0 (0.0%) | 0 (0.0%) |
| 16 and 17 Years | 0 (0.0%) | 0 (0.0%) |
| 18 to 24 Years | 0 (0.0%) | 0 (0.0%) |
| 25 to 34 Years | 0 (0.0%) | 0 (0.0%) |
| 35 to 44 Years | 0 (0.0%) | 0 (0.0%) |
| 45 to 54 Years | 0 (0.0%) | 0 (0.0%) |
| 55 to 64 Years | 108 (82.4%) | 0 (0.0%) |
| 65 to 74 Years | 0 (0.0%) | 0 (0.0%) |
| 75 Years and over | 0 (0.0%) | 0 (0.0%) |
| Total | 108 (49.5%) | 0 (0.0%) |
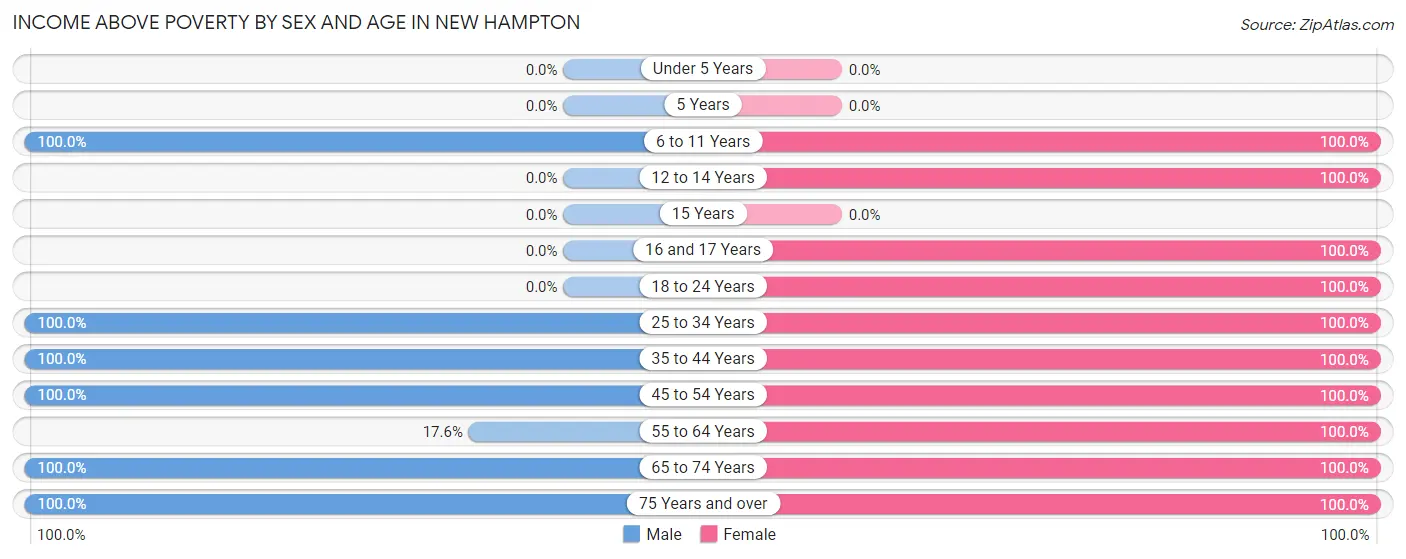
Income Above Poverty by Sex and Age in New Hampton
According to the poverty statistics in New Hampton, males aged 6 to 11 years and females aged 6 to 11 years are the age groups that are most secure financially, with 100.0% of males and 100.0% of females in these age groups living above the poverty line.
| Age Bracket | Male | Female |
| Under 5 Years | 0 (0.0%) | 0 (0.0%) |
| 5 Years | 0 (0.0%) | 0 (0.0%) |
| 6 to 11 Years | 11 (100.0%) | 9 (100.0%) |
| 12 to 14 Years | 0 (0.0%) | 7 (100.0%) |
| 15 Years | 0 (0.0%) | 0 (0.0%) |
| 16 and 17 Years | 0 (0.0%) | 5 (100.0%) |
| 18 to 24 Years | 0 (0.0%) | 12 (100.0%) |
| 25 to 34 Years | 40 (100.0%) | 16 (100.0%) |
| 35 to 44 Years | 5 (100.0%) | 12 (100.0%) |
| 45 to 54 Years | 14 (100.0%) | 13 (100.0%) |
| 55 to 64 Years | 23 (17.6%) | 20 (100.0%) |
| 65 to 74 Years | 7 (100.0%) | 8 (100.0%) |
| 75 Years and over | 10 (100.0%) | 4 (100.0%) |
| Total | 110 (50.5%) | 106 (100.0%) |
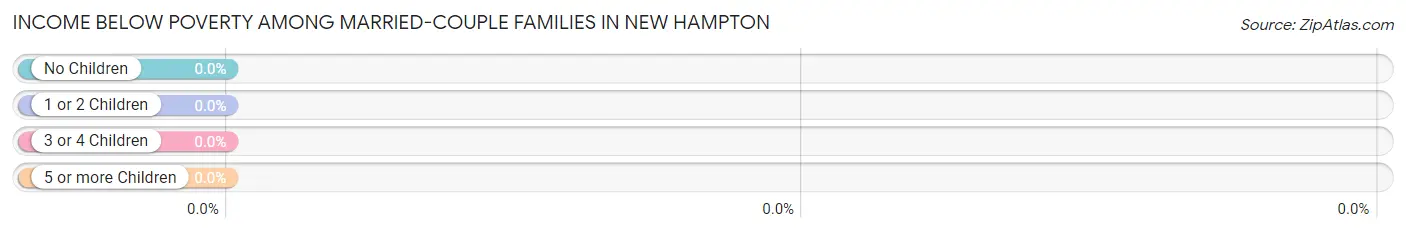
Income Below Poverty Among Married-Couple Families in New Hampton
| Children | Above Poverty | Below Poverty |
| No Children | 49 (100.0%) | 0 (0.0%) |
| 1 or 2 Children | 7 (100.0%) | 0 (0.0%) |
| 3 or 4 Children | 5 (100.0%) | 0 (0.0%) |
| 5 or more Children | 0 (0.0%) | 0 (0.0%) |
| Total | 61 (100.0%) | 0 (0.0%) |
Income Below Poverty Among Single-Parent Households in New Hampton
| Children | Single Father | Single Mother |
| No Children | 0 (0.0%) | 0 (0.0%) |
| 1 or 2 Children | 0 (0.0%) | 0 (0.0%) |
| 3 or 4 Children | 0 (0.0%) | 0 (0.0%) |
| 5 or more Children | 0 (0.0%) | 0 (0.0%) |
| Total | 0 (0.0%) | 0 (0.0%) |
Income Below Poverty Among Married-Couple vs Single-Parent Households in New Hampton
| Children | Married-Couple Families | Single-Parent Households |
| No Children | 0 (0.0%) | 0 (0.0%) |
| 1 or 2 Children | 0 (0.0%) | 0 (0.0%) |
| 3 or 4 Children | 0 (0.0%) | 0 (0.0%) |
| 5 or more Children | 0 (0.0%) | 0 (0.0%) |
| Total | 0 (0.0%) | 0 (0.0%) |
Race in New Hampton
The most populous races in New Hampton are , and White / Caucasian (324 | 100.0%).
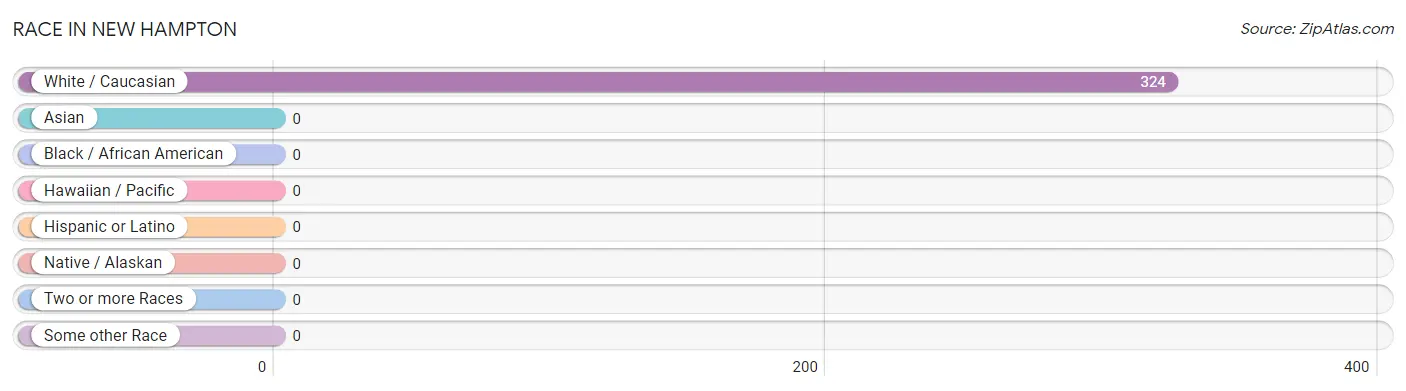
| Race | # Population | % Population |
| Asian | 0 | 0.0% |
| Black / African American | 0 | 0.0% |
| Hawaiian / Pacific | 0 | 0.0% |
| Hispanic or Latino | 0 | 0.0% |
| Native / Alaskan | 0 | 0.0% |
| White / Caucasian | 324 | 100.0% |
| Two or more Races | 0 | 0.0% |
| Some other Race | 0 | 0.0% |
| Total | 324 | 100.0% |
Ancestry in New Hampton
The most populous ancestries reported in New Hampton are German (75 | 23.2%), English (73 | 22.5%), Irish (60 | 18.5%), French (38 | 11.7%), and American (28 | 8.6%), together accounting for 84.6% of all New Hampton residents.
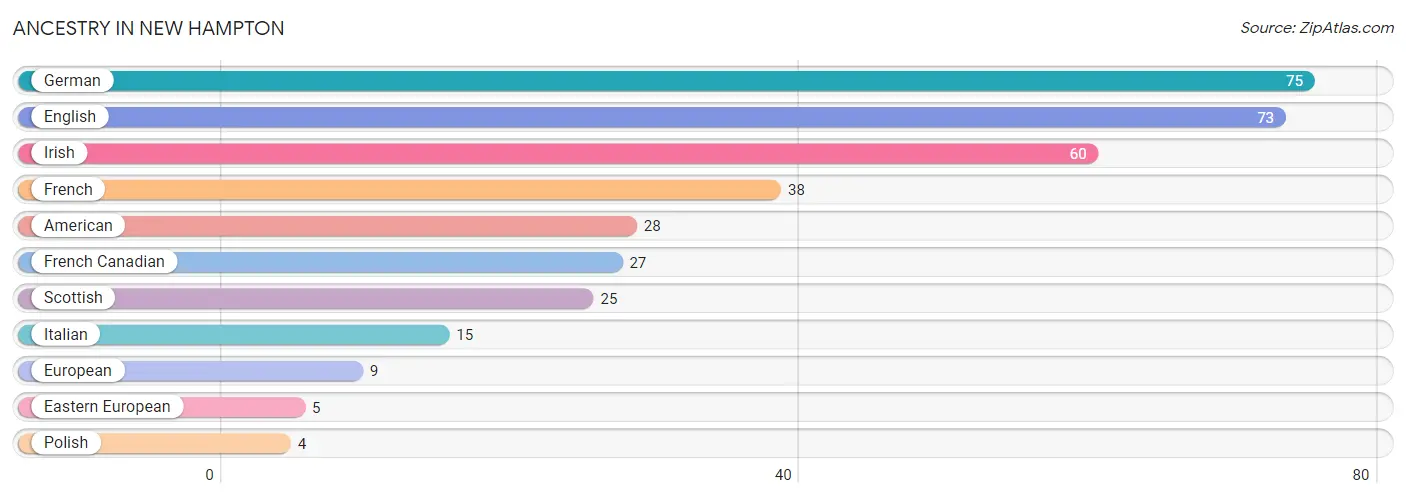
| Ancestry | # Population | % Population |
| American | 28 | 8.6% |
| Eastern European | 5 | 1.5% |
| English | 73 | 22.5% |
| European | 9 | 2.8% |
| French | 38 | 11.7% |
| French Canadian | 27 | 8.3% |
| German | 75 | 23.2% |
| Irish | 60 | 18.5% |
| Italian | 15 | 4.6% |
| Polish | 4 | 1.2% |
| Scottish | 25 | 7.7% | View All 11 Rows |
Immigrants in New Hampton

| Immigration Origin | # Population | % Population | View All 0 Rows |
Sex and Age in New Hampton
Sex and Age in New Hampton
The most populous age groups in New Hampton are 60 to 64 Years (116 | 53.2%) for men and 30 to 34 Years (16 | 15.1%) for women.
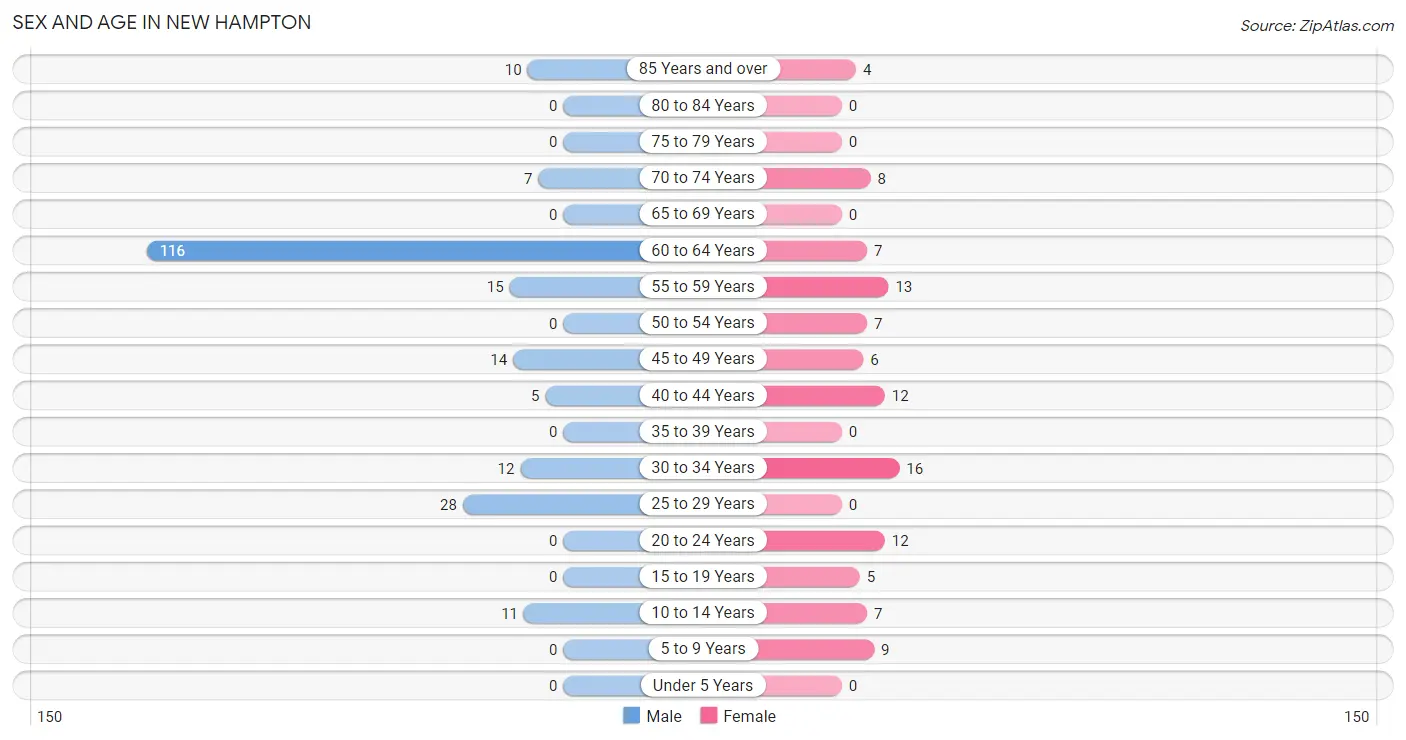
| Age Bracket | Male | Female |
| Under 5 Years | 0 (0.0%) | 0 (0.0%) |
| 5 to 9 Years | 0 (0.0%) | 9 (8.5%) |
| 10 to 14 Years | 11 (5.1%) | 7 (6.6%) |
| 15 to 19 Years | 0 (0.0%) | 5 (4.7%) |
| 20 to 24 Years | 0 (0.0%) | 12 (11.3%) |
| 25 to 29 Years | 28 (12.8%) | 0 (0.0%) |
| 30 to 34 Years | 12 (5.5%) | 16 (15.1%) |
| 35 to 39 Years | 0 (0.0%) | 0 (0.0%) |
| 40 to 44 Years | 5 (2.3%) | 12 (11.3%) |
| 45 to 49 Years | 14 (6.4%) | 6 (5.7%) |
| 50 to 54 Years | 0 (0.0%) | 7 (6.6%) |
| 55 to 59 Years | 15 (6.9%) | 13 (12.3%) |
| 60 to 64 Years | 116 (53.2%) | 7 (6.6%) |
| 65 to 69 Years | 0 (0.0%) | 0 (0.0%) |
| 70 to 74 Years | 7 (3.2%) | 8 (7.5%) |
| 75 to 79 Years | 0 (0.0%) | 0 (0.0%) |
| 80 to 84 Years | 0 (0.0%) | 0 (0.0%) |
| 85 Years and over | 10 (4.6%) | 4 (3.8%) |
| Total | 218 (100.0%) | 106 (100.0%) |
Families and Households in New Hampton
Median Family Size in New Hampton
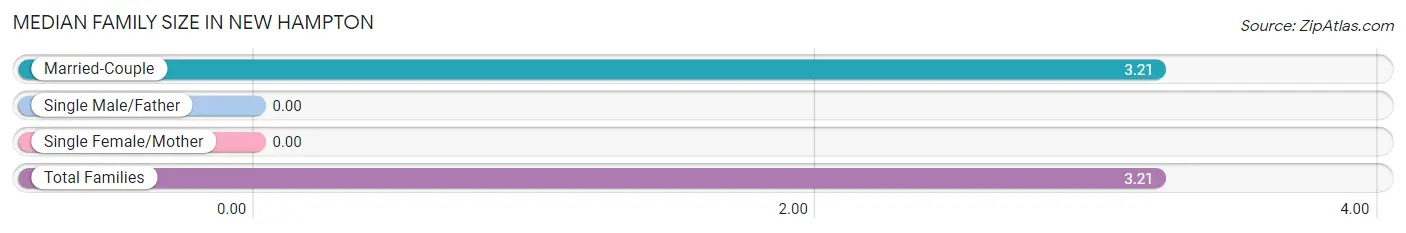
| Family Type | # Families | Family Size |
| Married-Couple | 61 (100.0%) | 3.21 |
| Single Male/Father | 0 (0.0%) | - |
| Single Female/Mother | 0 (0.0%) | - |
| Total Families | 61 (100.0%) | 3.21 |
Median Household Size in New Hampton
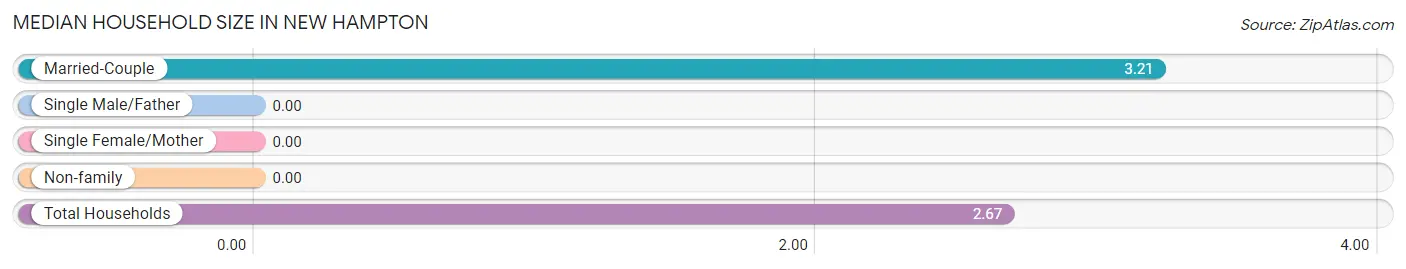
| Household Type | # Households | Household Size |
| Married-Couple | 61 (75.3%) | 3.21 |
| Single Male/Father | 0 (0.0%) | - |
| Single Female/Mother | 0 (0.0%) | - |
| Non-family | 20 (24.7%) | - |
| Total Households | 81 (100.0%) | 2.67 |
Household Size by Marriage Status in New Hampton
Out of a total of 81 households in New Hampton, 61 (75.3%) are family households, while 20 (24.7%) are nonfamily households. The most numerous type of family households are 2-person households, comprising 27, and the most common type of nonfamily households are 1-person households, comprising 20.
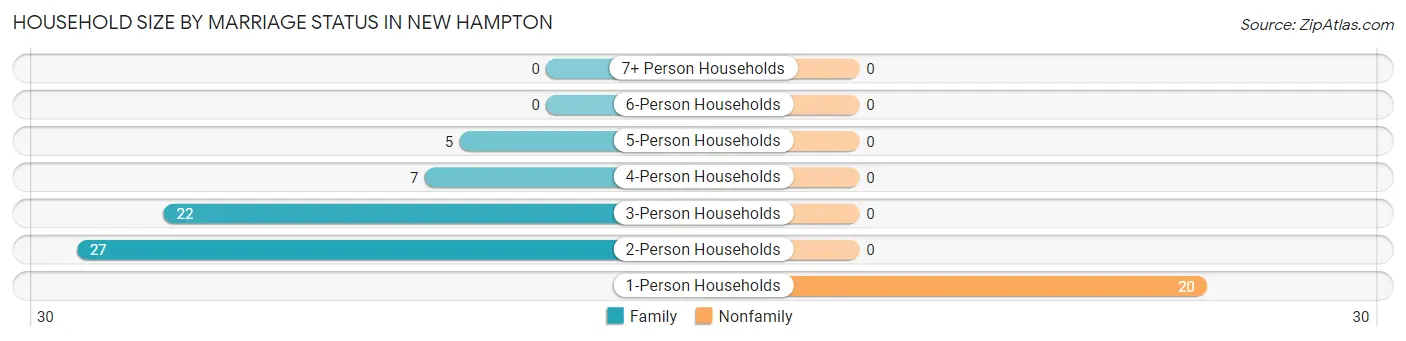
| Household Size | Family Households | Nonfamily Households |
| 1-Person Households | - | 20 (24.7%) |
| 2-Person Households | 27 (33.3%) | 0 (0.0%) |
| 3-Person Households | 22 (27.2%) | 0 (0.0%) |
| 4-Person Households | 7 (8.6%) | 0 (0.0%) |
| 5-Person Households | 5 (6.2%) | 0 (0.0%) |
| 6-Person Households | 0 (0.0%) | 0 (0.0%) |
| 7+ Person Households | 0 (0.0%) | 0 (0.0%) |
| Total | 61 (75.3%) | 20 (24.7%) |
Female Fertility in New Hampton
Fertility by Age in New Hampton
| Age Bracket | Women with Births | Births / 1,000 Women |
| 15 to 19 years | 0 (0.0%) | 0.0 |
| 20 to 34 years | 0 (0.0%) | 0.0 |
| 35 to 50 years | 0 (0.0%) | 0.0 |
| Total | 0 (0.0%) | 0.0 |
Fertility by Age by Marriage Status in New Hampton
| Age Bracket | Married | Unmarried |
| 15 to 19 years | 0 (0.0%) | 0 (0.0%) |
| 20 to 34 years | 0 (0.0%) | 0 (0.0%) |
| 35 to 50 years | 0 (0.0%) | 0 (0.0%) |
| Total | 0 (0.0%) | 0 (0.0%) |
Fertility by Education in New Hampton
| Educational Attainment | Women with Births | Births / 1,000 Women |
| Less than High School | 0 (0.0%) | 0.0 |
| High School Diploma | 0 (0.0%) | 0.0 |
| College or Associate's Degree | 0 (0.0%) | 0.0 |
| Bachelor's Degree | 0 (0.0%) | 0.0 |
| Graduate Degree | 0 (0.0%) | 0.0 |
| Total | 0 (0.0%) | 0.0 |
Fertility by Education by Marriage Status in New Hampton
| Educational Attainment | Married | Unmarried |
| Less than High School | 0 (0.0%) | 0 (0.0%) |
| High School Diploma | 0 (0.0%) | 0 (0.0%) |
| College or Associate's Degree | 0 (0.0%) | 0 (0.0%) |
| Bachelor's Degree | 0 (0.0%) | 0 (0.0%) |
| Graduate Degree | 0 (0.0%) | 0 (0.0%) |
| Total | 0 (0.0%) | 0 (0.0%) |
Employment Characteristics in New Hampton
Employment by Class of Employer in New Hampton
Among the 144 employed individuals in New Hampton, private company employees (62 | 43.1%), not-for-profit organizations (39 | 27.1%), and self-employed (not incorporated) (23 | 16.0%) make up the most common classes of employment.
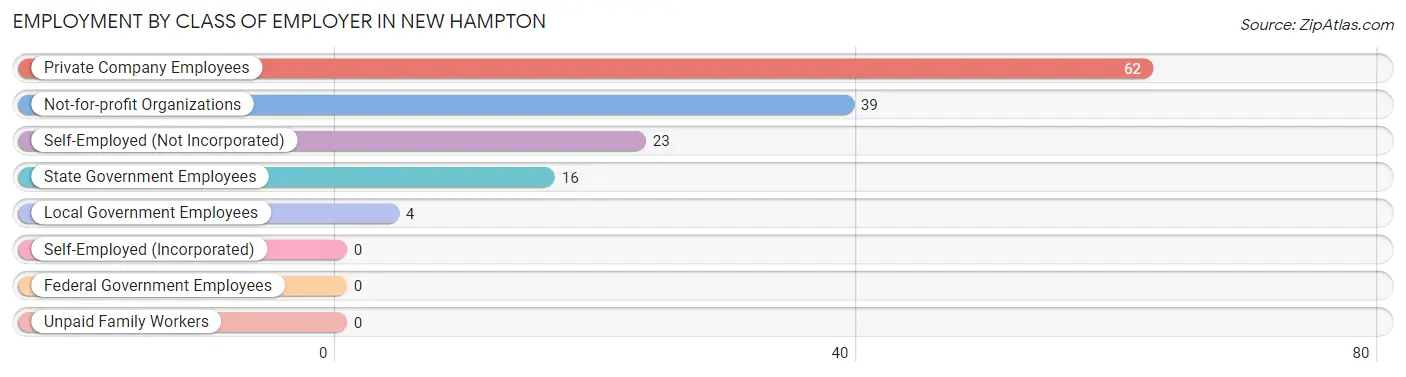
| Employer Class | # Employees | % Employees |
| Private Company Employees | 62 | 43.1% |
| Self-Employed (Incorporated) | 0 | 0.0% |
| Self-Employed (Not Incorporated) | 23 | 16.0% |
| Not-for-profit Organizations | 39 | 27.1% |
| Local Government Employees | 4 | 2.8% |
| State Government Employees | 16 | 11.1% |
| Federal Government Employees | 0 | 0.0% |
| Unpaid Family Workers | 0 | 0.0% |
| Total | 144 | 100.0% |
Employment Status by Age in New Hampton
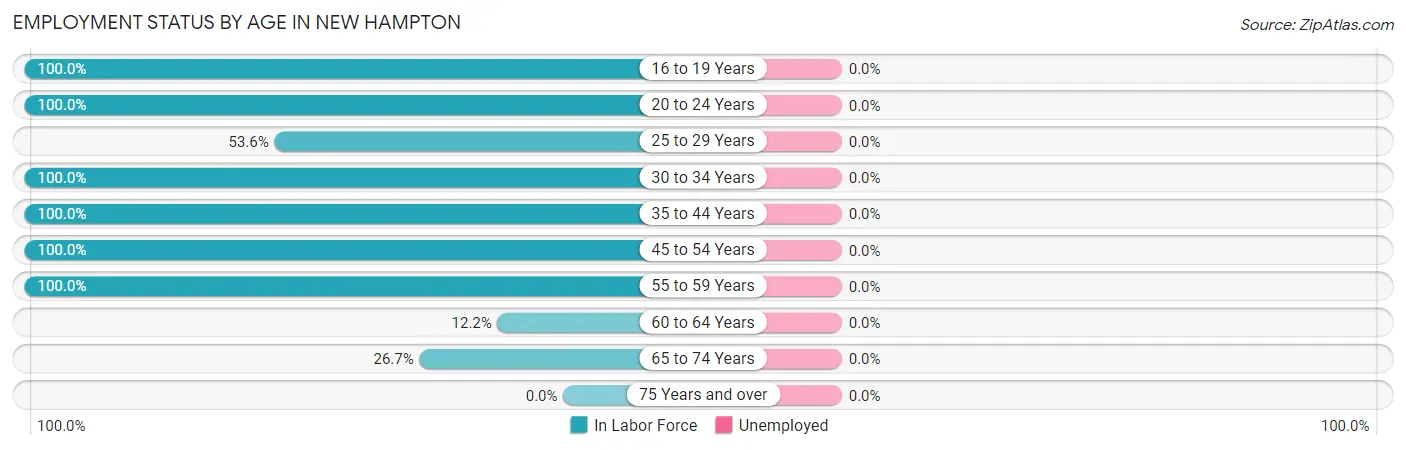
| Age Bracket | In Labor Force | Unemployed |
| 16 to 19 Years | 5 (100.0%) | 0 (0.0%) |
| 20 to 24 Years | 12 (100.0%) | 0 (0.0%) |
| 25 to 29 Years | 15 (53.6%) | 0 (0.0%) |
| 30 to 34 Years | 28 (100.0%) | 0 (0.0%) |
| 35 to 44 Years | 17 (100.0%) | 0 (0.0%) |
| 45 to 54 Years | 27 (100.0%) | 0 (0.0%) |
| 55 to 59 Years | 28 (100.0%) | 0 (0.0%) |
| 60 to 64 Years | 15 (12.2%) | 0 (0.0%) |
| 65 to 74 Years | 4 (26.7%) | 0 (0.0%) |
| 75 Years and over | 0 (0.0%) | 0 (0.0%) |
| Total | 151 (50.8%) | 0 (0.0%) |
Employment Status by Educational Attainment in New Hampton
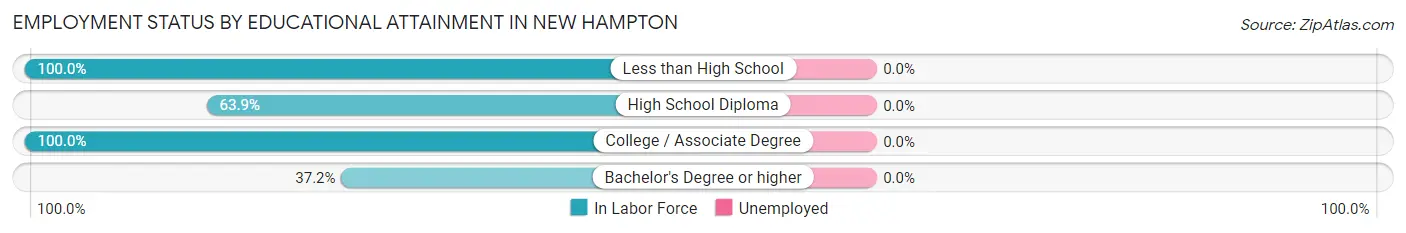
| Educational Attainment | In Labor Force | Unemployed |
| Less than High School | 7 (100.0%) | 0 (0.0%) |
| High School Diploma | 23 (63.9%) | 0 (0.0%) |
| College / Associate Degree | 36 (100.0%) | 0 (0.0%) |
| Bachelor's Degree or higher | 64 (37.2%) | 0 (0.0%) |
| Total | 130 (51.8%) | 0 (0.0%) |
Employment Occupations by Sex in New Hampton
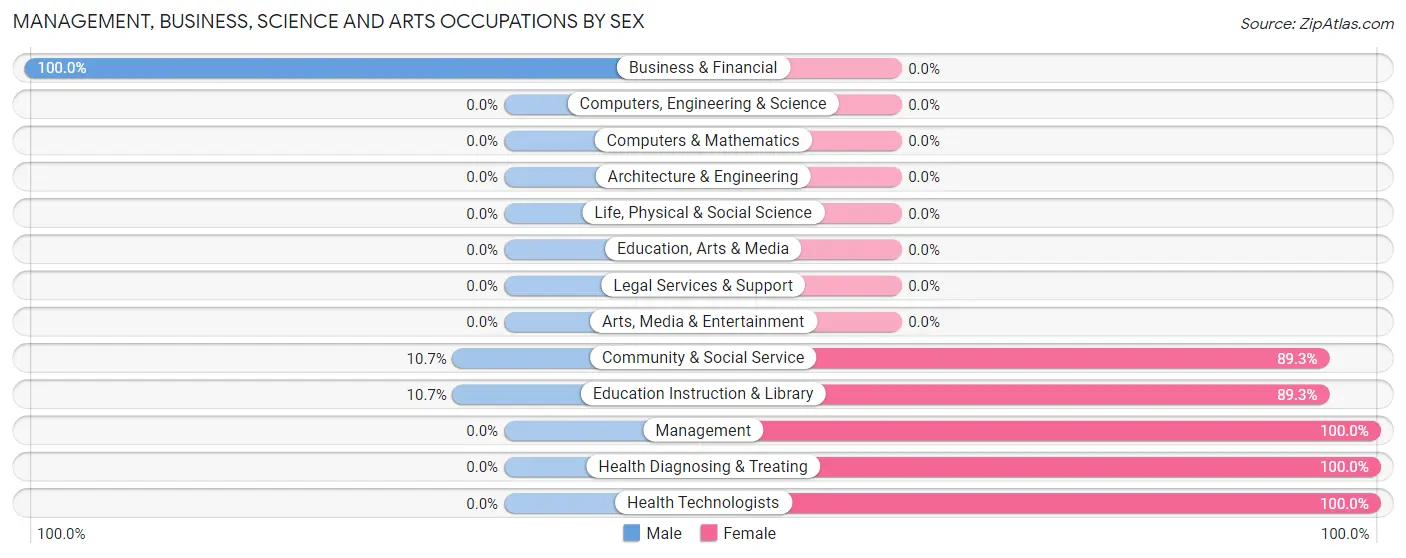
Management, Business, Science and Arts Occupations
The most common Management, Business, Science and Arts occupations in New Hampton are Community & Social Service (28 | 18.5%), Education Instruction & Library (28 | 18.5%), Health Diagnosing & Treating (12 | 8.0%), Health Technologists (12 | 8.0%), and Business & Financial (7 | 4.6%).
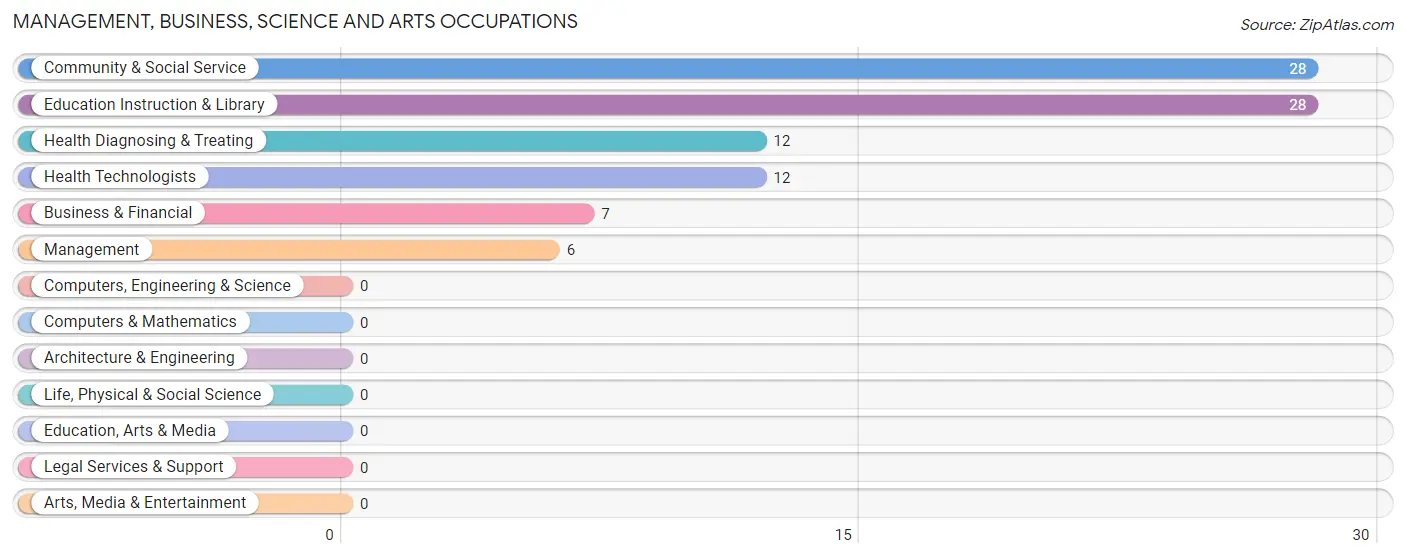
Management, Business, Science and Arts Occupations by Sex
Within the Management, Business, Science and Arts occupations in New Hampton, the most male-oriented occupations are Business & Financial (100.0%), Community & Social Service (10.7%), and Education Instruction & Library (10.7%), while the most female-oriented occupations are Management (100.0%), Health Diagnosing & Treating (100.0%), and Health Technologists (100.0%).
| Occupation | Male | Female |
| Management | 0 (0.0%) | 6 (100.0%) |
| Business & Financial | 7 (100.0%) | 0 (0.0%) |
| Computers, Engineering & Science | 0 (0.0%) | 0 (0.0%) |
| Computers & Mathematics | 0 (0.0%) | 0 (0.0%) |
| Architecture & Engineering | 0 (0.0%) | 0 (0.0%) |
| Life, Physical & Social Science | 0 (0.0%) | 0 (0.0%) |
| Community & Social Service | 3 (10.7%) | 25 (89.3%) |
| Education, Arts & Media | 0 (0.0%) | 0 (0.0%) |
| Legal Services & Support | 0 (0.0%) | 0 (0.0%) |
| Education Instruction & Library | 3 (10.7%) | 25 (89.3%) |
| Arts, Media & Entertainment | 0 (0.0%) | 0 (0.0%) |
| Health Diagnosing & Treating | 0 (0.0%) | 12 (100.0%) |
| Health Technologists | 0 (0.0%) | 12 (100.0%) |
| Total (Category) | 10 (18.9%) | 43 (81.1%) |
| Total (Overall) | 69 (45.7%) | 82 (54.3%) |
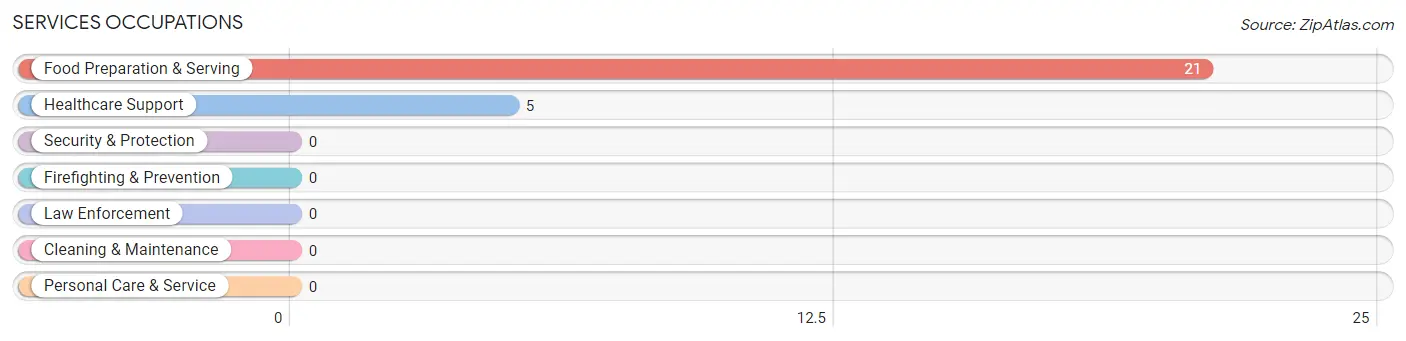
Services Occupations
The most common Services occupations in New Hampton are Food Preparation & Serving (21 | 13.9%), and Healthcare Support (5 | 3.3%).
Services Occupations by Sex
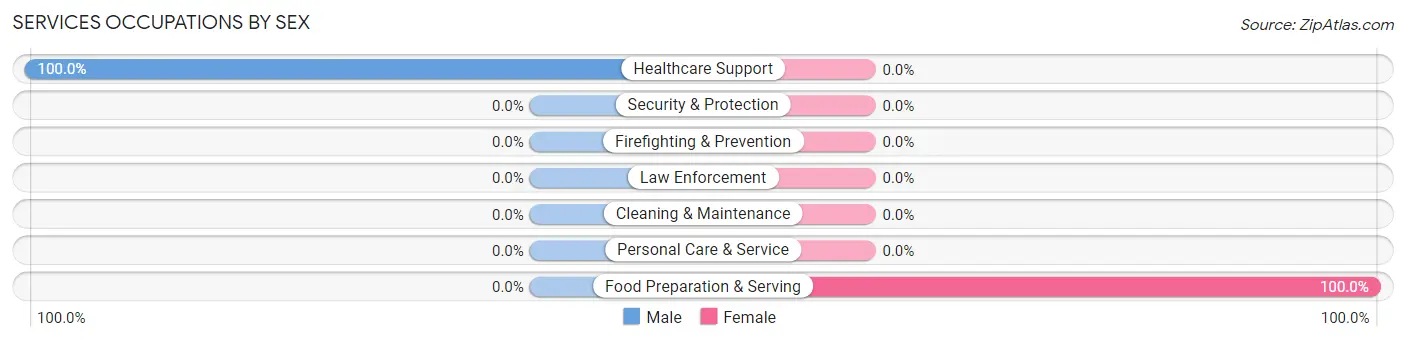
| Occupation | Male | Female |
| Healthcare Support | 5 (100.0%) | 0 (0.0%) |
| Security & Protection | 0 (0.0%) | 0 (0.0%) |
| Firefighting & Prevention | 0 (0.0%) | 0 (0.0%) |
| Law Enforcement | 0 (0.0%) | 0 (0.0%) |
| Food Preparation & Serving | 0 (0.0%) | 21 (100.0%) |
| Cleaning & Maintenance | 0 (0.0%) | 0 (0.0%) |
| Personal Care & Service | 0 (0.0%) | 0 (0.0%) |
| Total (Category) | 5 (19.2%) | 21 (80.8%) |
| Total (Overall) | 69 (45.7%) | 82 (54.3%) |
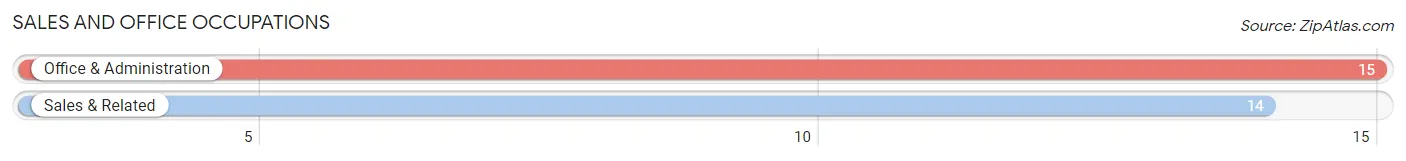
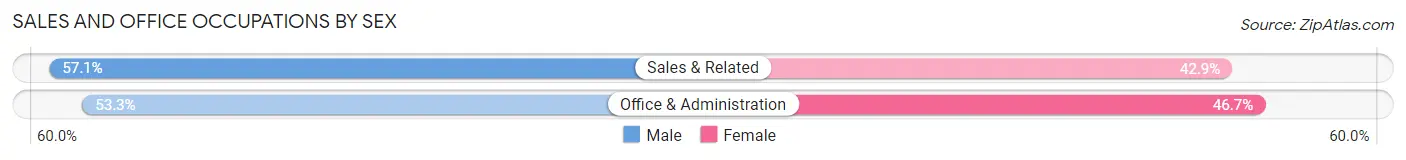
Sales and Office Occupations
The most common Sales and Office occupations in New Hampton are Office & Administration (15 | 9.9%), and Sales & Related (14 | 9.3%).
Sales and Office Occupations by Sex
| Occupation | Male | Female |
| Sales & Related | 8 (57.1%) | 6 (42.9%) |
| Office & Administration | 8 (53.3%) | 7 (46.7%) |
| Total (Category) | 16 (55.2%) | 13 (44.8%) |
| Total (Overall) | 69 (45.7%) | 82 (54.3%) |
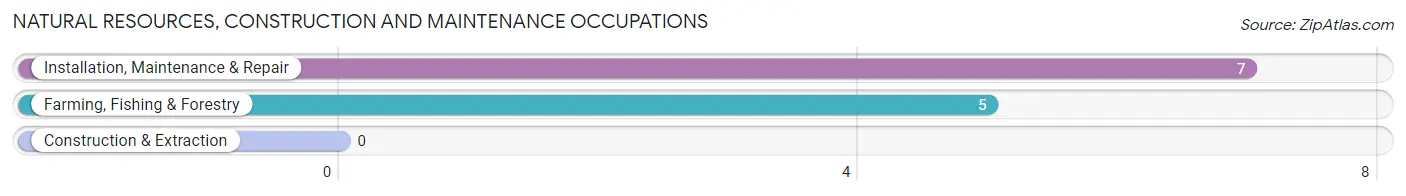
Natural Resources, Construction and Maintenance Occupations
The most common Natural Resources, Construction and Maintenance occupations in New Hampton are Installation, Maintenance & Repair (7 | 4.6%), and Farming, Fishing & Forestry (5 | 3.3%).
Natural Resources, Construction and Maintenance Occupations by Sex
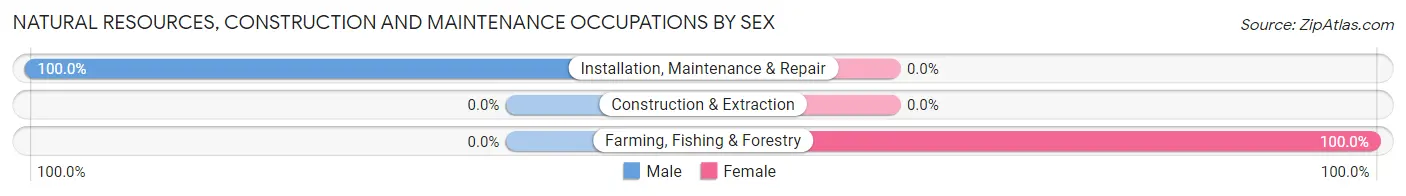
| Occupation | Male | Female |
| Farming, Fishing & Forestry | 0 (0.0%) | 5 (100.0%) |
| Construction & Extraction | 0 (0.0%) | 0 (0.0%) |
| Installation, Maintenance & Repair | 7 (100.0%) | 0 (0.0%) |
| Total (Category) | 7 (58.3%) | 5 (41.7%) |
| Total (Overall) | 69 (45.7%) | 82 (54.3%) |
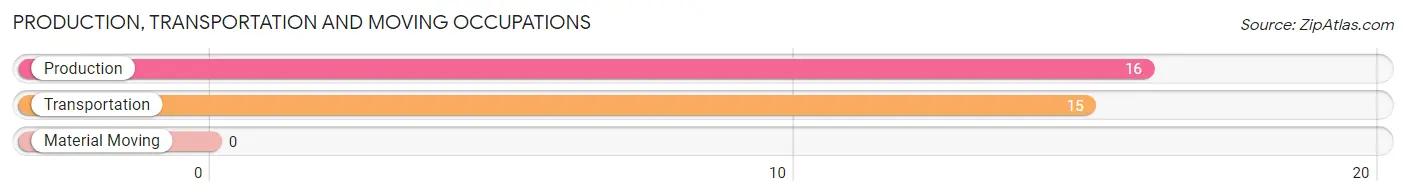
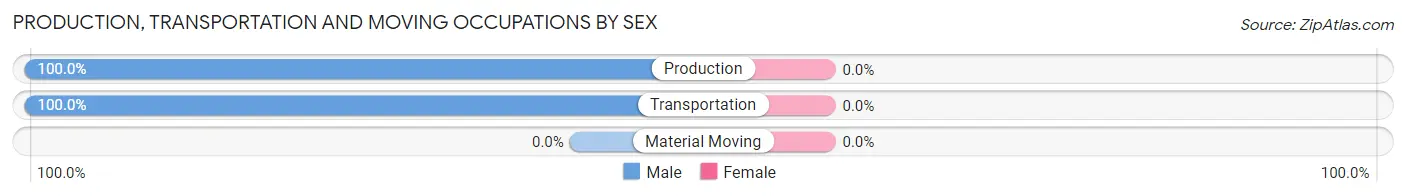
Production, Transportation and Moving Occupations
The most common Production, Transportation and Moving occupations in New Hampton are Production (16 | 10.6%), and Transportation (15 | 9.9%).
Production, Transportation and Moving Occupations by Sex
| Occupation | Male | Female |
| Production | 16 (100.0%) | 0 (0.0%) |
| Transportation | 15 (100.0%) | 0 (0.0%) |
| Material Moving | 0 (0.0%) | 0 (0.0%) |
| Total (Category) | 31 (100.0%) | 0 (0.0%) |
| Total (Overall) | 69 (45.7%) | 82 (54.3%) |
Employment Industries by Sex in New Hampton
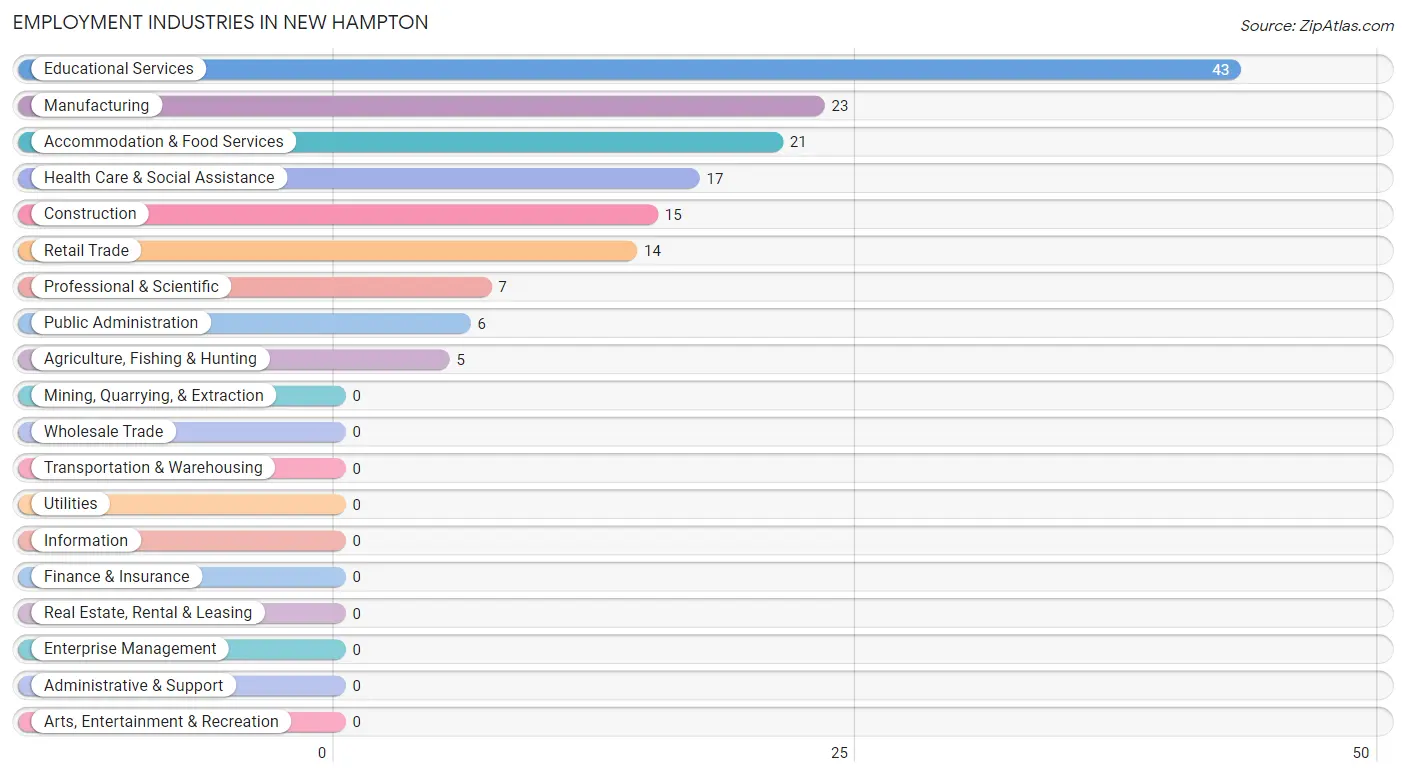
Employment Industries in New Hampton
The major employment industries in New Hampton include Educational Services (43 | 28.5%), Manufacturing (23 | 15.2%), Accommodation & Food Services (21 | 13.9%), Health Care & Social Assistance (17 | 11.3%), and Construction (15 | 9.9%).
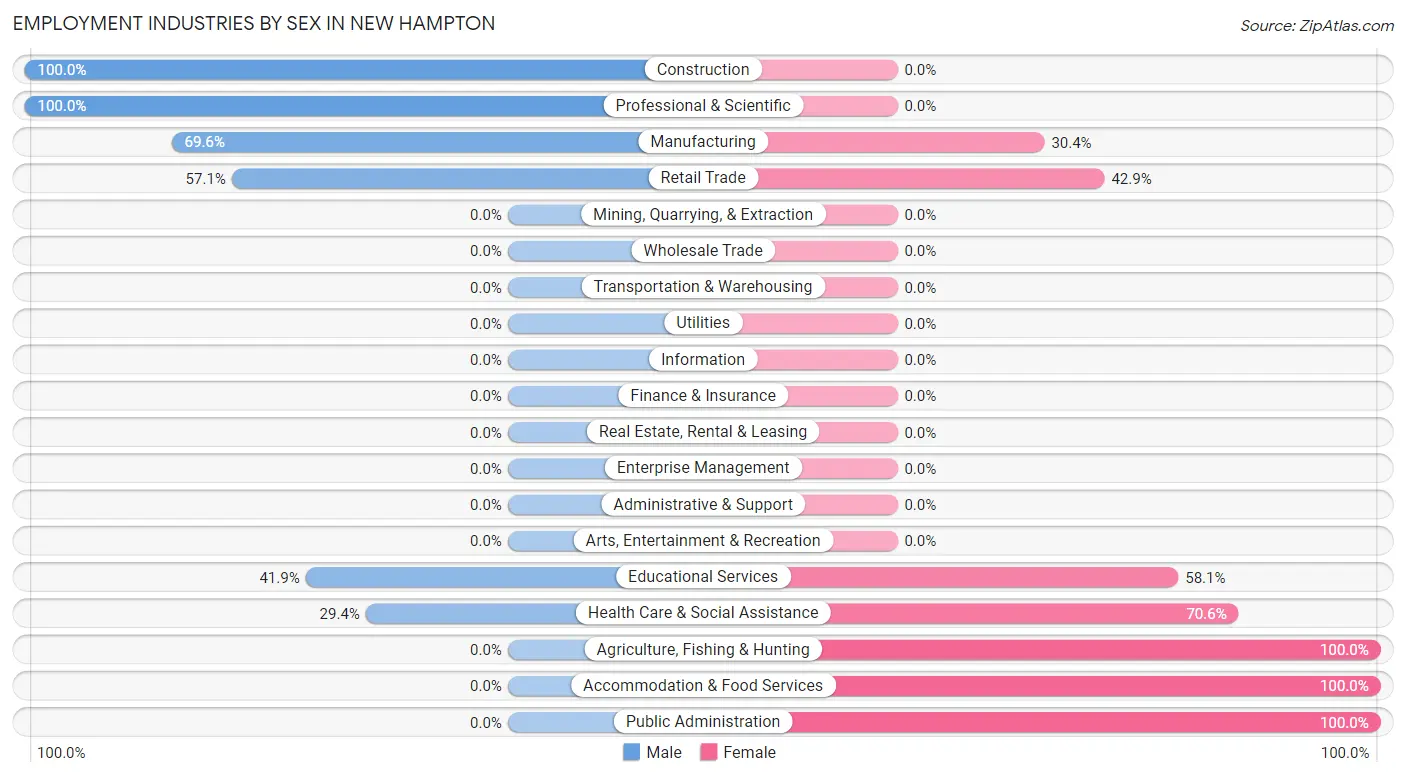
Employment Industries by Sex in New Hampton
The New Hampton industries that see more men than women are Construction (100.0%), Professional & Scientific (100.0%), and Manufacturing (69.6%), whereas the industries that tend to have a higher number of women are Agriculture, Fishing & Hunting (100.0%), Accommodation & Food Services (100.0%), and Public Administration (100.0%).
| Industry | Male | Female |
| Agriculture, Fishing & Hunting | 0 (0.0%) | 5 (100.0%) |
| Mining, Quarrying, & Extraction | 0 (0.0%) | 0 (0.0%) |
| Construction | 15 (100.0%) | 0 (0.0%) |
| Manufacturing | 16 (69.6%) | 7 (30.4%) |
| Wholesale Trade | 0 (0.0%) | 0 (0.0%) |
| Retail Trade | 8 (57.1%) | 6 (42.9%) |
| Transportation & Warehousing | 0 (0.0%) | 0 (0.0%) |
| Utilities | 0 (0.0%) | 0 (0.0%) |
| Information | 0 (0.0%) | 0 (0.0%) |
| Finance & Insurance | 0 (0.0%) | 0 (0.0%) |
| Real Estate, Rental & Leasing | 0 (0.0%) | 0 (0.0%) |
| Professional & Scientific | 7 (100.0%) | 0 (0.0%) |
| Enterprise Management | 0 (0.0%) | 0 (0.0%) |
| Administrative & Support | 0 (0.0%) | 0 (0.0%) |
| Educational Services | 18 (41.9%) | 25 (58.1%) |
| Health Care & Social Assistance | 5 (29.4%) | 12 (70.6%) |
| Arts, Entertainment & Recreation | 0 (0.0%) | 0 (0.0%) |
| Accommodation & Food Services | 0 (0.0%) | 21 (100.0%) |
| Public Administration | 0 (0.0%) | 6 (100.0%) |
| Total | 69 (45.7%) | 82 (54.3%) |
Education in New Hampton
School Enrollment in New Hampton
The most common levels of schooling among the 39 students in New Hampton are middle school (18 | 46.2%), elementary school (9 | 23.1%), and graduate / professional (7 | 17.9%).

| School Level | # Students | % Students |
| Nursery / Preschool | 0 | 0.0% |
| Kindergarten | 0 | 0.0% |
| Elementary School | 9 | 23.1% |
| Middle School | 18 | 46.2% |
| High School | 5 | 12.8% |
| College / Undergraduate | 0 | 0.0% |
| Graduate / Professional | 7 | 17.9% |
| Total | 39 | 100.0% |
School Enrollment by Age by Funding Source in New Hampton
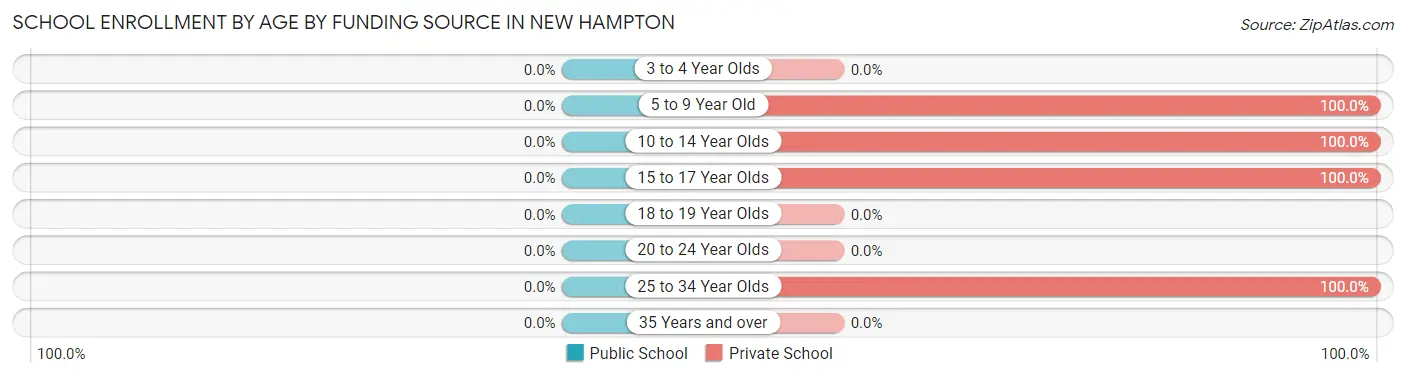
| Age Bracket | Public School | Private School |
| 3 to 4 Year Olds | 0 (0.0%) | 0 (0.0%) |
| 5 to 9 Year Old | 0 (0.0%) | 9 (100.0%) |
| 10 to 14 Year Olds | 0 (0.0%) | 18 (100.0%) |
| 15 to 17 Year Olds | 0 (0.0%) | 5 (100.0%) |
| 18 to 19 Year Olds | 0 (0.0%) | 0 (0.0%) |
| 20 to 24 Year Olds | 0 (0.0%) | 0 (0.0%) |
| 25 to 34 Year Olds | 0 (0.0%) | 7 (100.0%) |
| 35 Years and over | 0 (0.0%) | 0 (0.0%) |
| Total | 0 (0.0%) | 39 (100.0%) |
Educational Attainment by Field of Study in New Hampton
Business (117 | 60.6%), physical & health sciences (21 | 10.9%), bio, nature & agricultural (15 | 7.8%), science & technology (12 | 6.2%), and social sciences (7 | 3.6%) are the most common fields of study among 193 individuals in New Hampton who have obtained a bachelor's degree or higher.
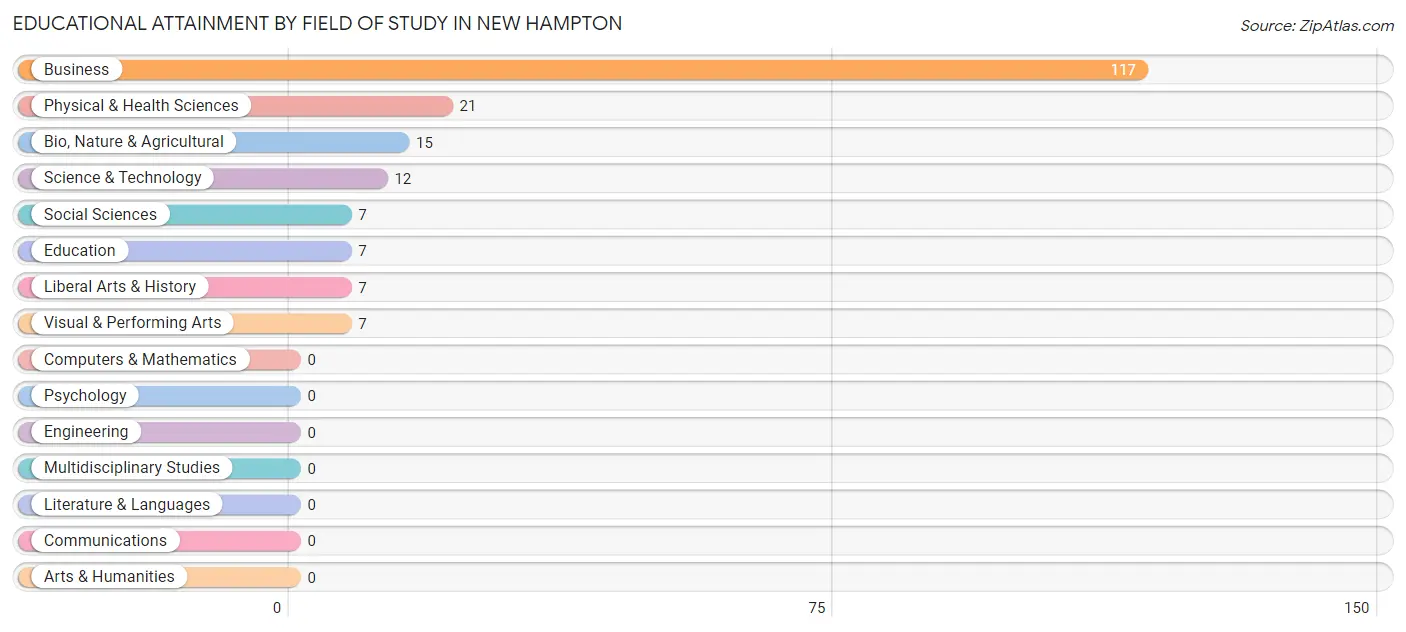
| Field of Study | # Graduates | % Graduates |
| Computers & Mathematics | 0 | 0.0% |
| Bio, Nature & Agricultural | 15 | 7.8% |
| Physical & Health Sciences | 21 | 10.9% |
| Psychology | 0 | 0.0% |
| Social Sciences | 7 | 3.6% |
| Engineering | 0 | 0.0% |
| Multidisciplinary Studies | 0 | 0.0% |
| Science & Technology | 12 | 6.2% |
| Business | 117 | 60.6% |
| Education | 7 | 3.6% |
| Literature & Languages | 0 | 0.0% |
| Liberal Arts & History | 7 | 3.6% |
| Visual & Performing Arts | 7 | 3.6% |
| Communications | 0 | 0.0% |
| Arts & Humanities | 0 | 0.0% |
| Total | 193 | 100.0% |
Transportation & Commute in New Hampton
Vehicle Availability by Sex in New Hampton
The most prevalent vehicle ownership categories in New Hampton are males with 2 vehicles (31, accounting for 50.0%) and females with 2 vehicles (46, making up 37.8%).
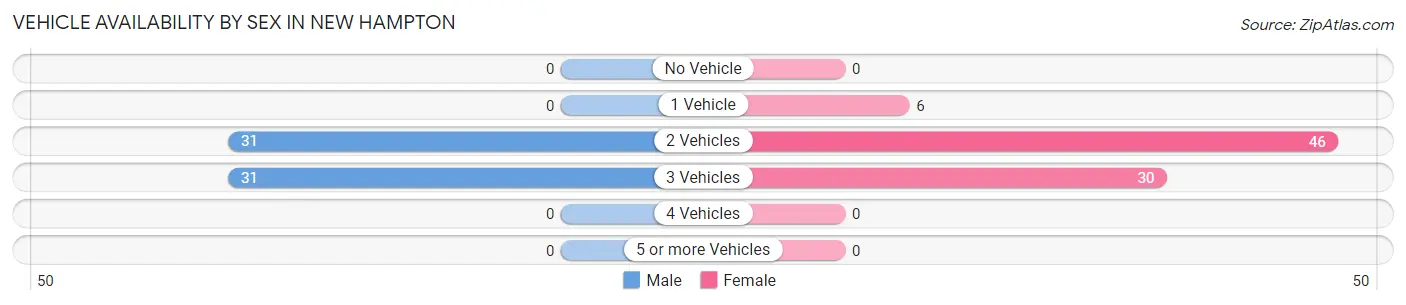
| Vehicles Available | Male | Female |
| No Vehicle | 0 (0.0%) | 0 (0.0%) |
| 1 Vehicle | 0 (0.0%) | 6 (7.3%) |
| 2 Vehicles | 31 (50.0%) | 46 (56.1%) |
| 3 Vehicles | 31 (50.0%) | 30 (36.6%) |
| 4 Vehicles | 0 (0.0%) | 0 (0.0%) |
| 5 or more Vehicles | 0 (0.0%) | 0 (0.0%) |
| Total | 62 (100.0%) | 82 (100.0%) |
Commute Time in New Hampton
The most frequently occuring commute durations in New Hampton are 10 to 14 minutes (22 commuters, 16.1%), 20 to 24 minutes (20 commuters, 14.6%), and 15 to 19 minutes (17 commuters, 12.4%).
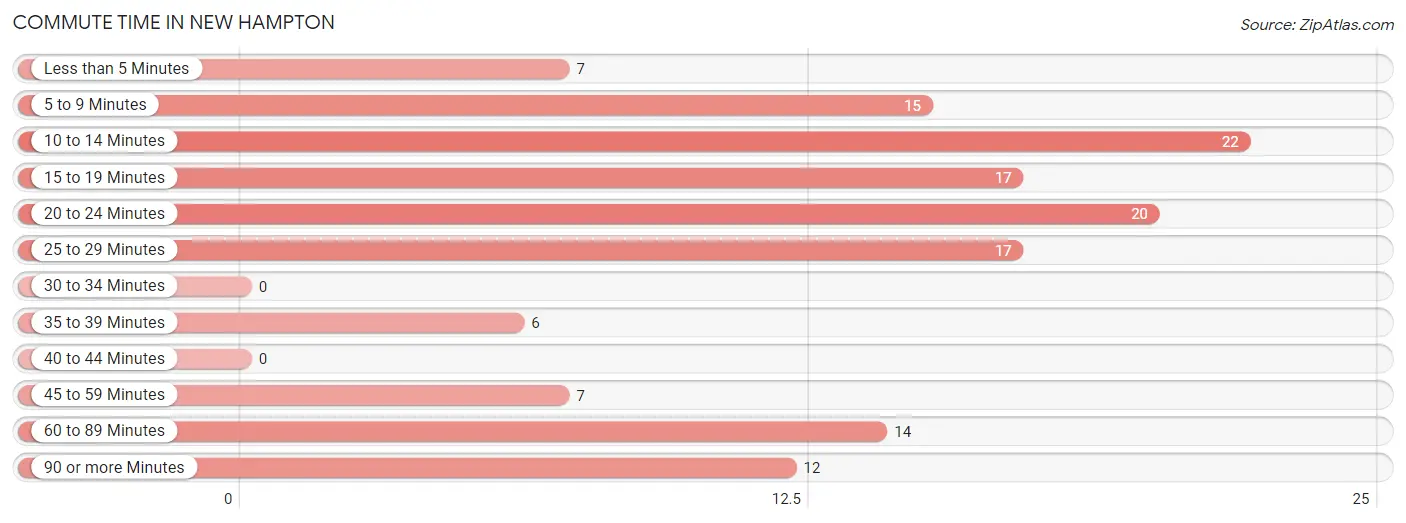
| Commute Time | # Commuters | % Commuters |
| Less than 5 Minutes | 7 | 5.1% |
| 5 to 9 Minutes | 15 | 11.0% |
| 10 to 14 Minutes | 22 | 16.1% |
| 15 to 19 Minutes | 17 | 12.4% |
| 20 to 24 Minutes | 20 | 14.6% |
| 25 to 29 Minutes | 17 | 12.4% |
| 30 to 34 Minutes | 0 | 0.0% |
| 35 to 39 Minutes | 6 | 4.4% |
| 40 to 44 Minutes | 0 | 0.0% |
| 45 to 59 Minutes | 7 | 5.1% |
| 60 to 89 Minutes | 14 | 10.2% |
| 90 or more Minutes | 12 | 8.8% |
Commute Time by Sex in New Hampton
The most common commute times in New Hampton are 15 to 19 minutes (17 commuters, 30.9%) for males and 20 to 24 minutes (15 commuters, 18.3%) for females.
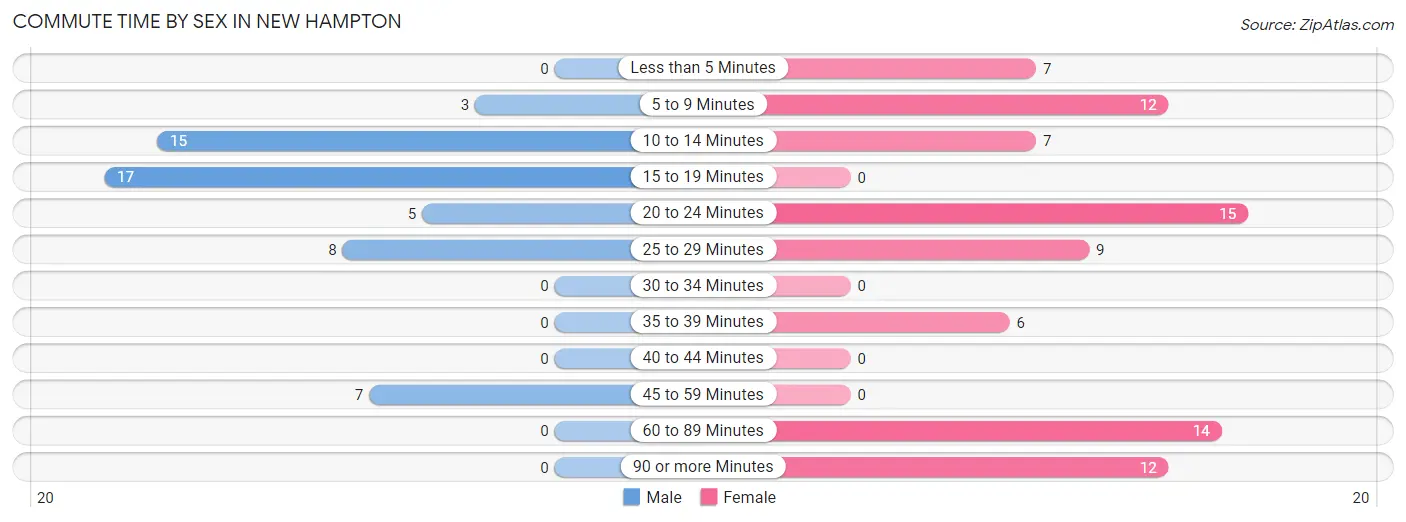
| Commute Time | Male | Female |
| Less than 5 Minutes | 0 (0.0%) | 7 (8.5%) |
| 5 to 9 Minutes | 3 (5.4%) | 12 (14.6%) |
| 10 to 14 Minutes | 15 (27.3%) | 7 (8.5%) |
| 15 to 19 Minutes | 17 (30.9%) | 0 (0.0%) |
| 20 to 24 Minutes | 5 (9.1%) | 15 (18.3%) |
| 25 to 29 Minutes | 8 (14.5%) | 9 (11.0%) |
| 30 to 34 Minutes | 0 (0.0%) | 0 (0.0%) |
| 35 to 39 Minutes | 0 (0.0%) | 6 (7.3%) |
| 40 to 44 Minutes | 0 (0.0%) | 0 (0.0%) |
| 45 to 59 Minutes | 7 (12.7%) | 0 (0.0%) |
| 60 to 89 Minutes | 0 (0.0%) | 14 (17.1%) |
| 90 or more Minutes | 0 (0.0%) | 12 (14.6%) |
Time of Departure to Work by Sex in New Hampton
The most frequent times of departure to work in New Hampton are 7:30 AM to 7:59 AM (15, 27.3%) for males and 7:30 AM to 7:59 AM (20, 24.4%) for females.
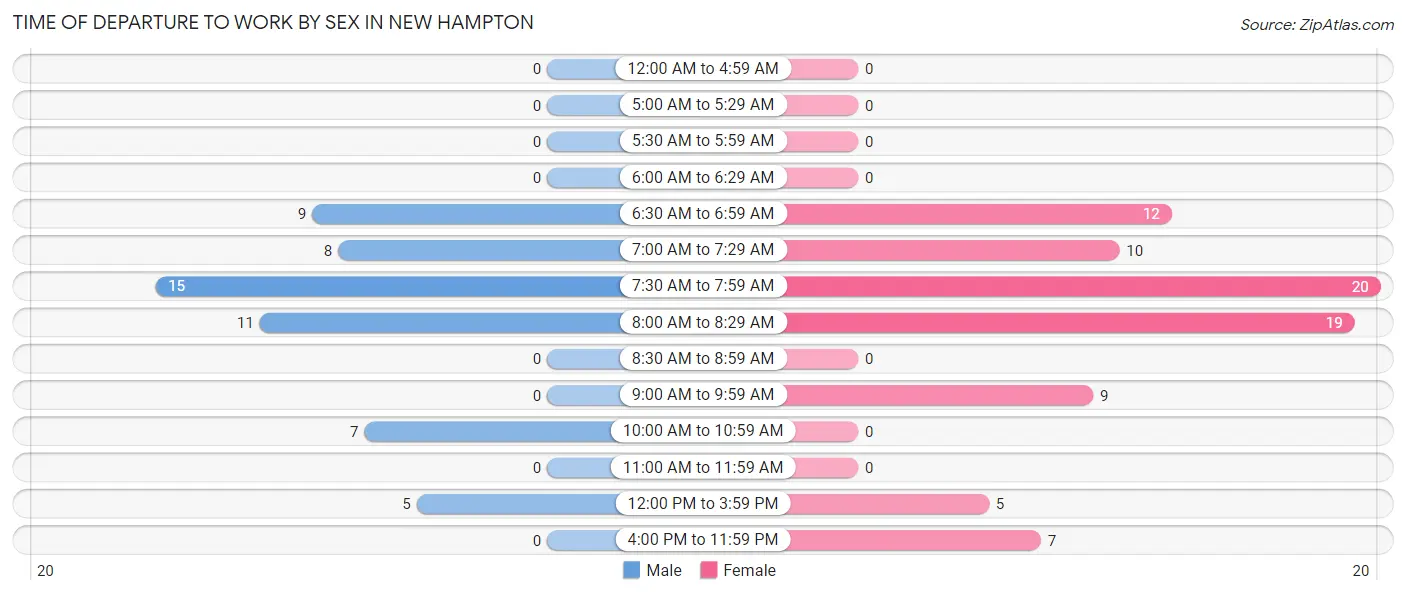
| Time of Departure | Male | Female |
| 12:00 AM to 4:59 AM | 0 (0.0%) | 0 (0.0%) |
| 5:00 AM to 5:29 AM | 0 (0.0%) | 0 (0.0%) |
| 5:30 AM to 5:59 AM | 0 (0.0%) | 0 (0.0%) |
| 6:00 AM to 6:29 AM | 0 (0.0%) | 0 (0.0%) |
| 6:30 AM to 6:59 AM | 9 (16.4%) | 12 (14.6%) |
| 7:00 AM to 7:29 AM | 8 (14.5%) | 10 (12.2%) |
| 7:30 AM to 7:59 AM | 15 (27.3%) | 20 (24.4%) |
| 8:00 AM to 8:29 AM | 11 (20.0%) | 19 (23.2%) |
| 8:30 AM to 8:59 AM | 0 (0.0%) | 0 (0.0%) |
| 9:00 AM to 9:59 AM | 0 (0.0%) | 9 (11.0%) |
| 10:00 AM to 10:59 AM | 7 (12.7%) | 0 (0.0%) |
| 11:00 AM to 11:59 AM | 0 (0.0%) | 0 (0.0%) |
| 12:00 PM to 3:59 PM | 5 (9.1%) | 5 (6.1%) |
| 4:00 PM to 11:59 PM | 0 (0.0%) | 7 (8.5%) |
| Total | 55 (100.0%) | 82 (100.0%) |
Housing Occupancy in New Hampton
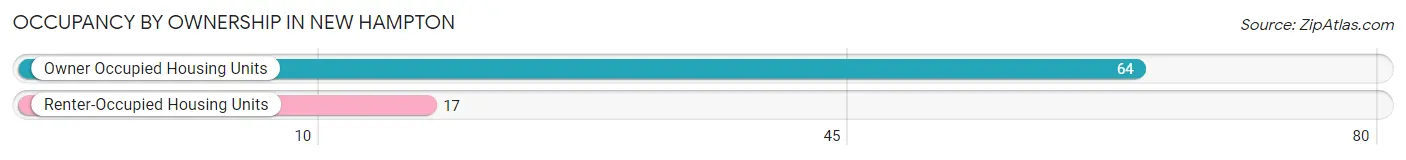
Occupancy by Ownership in New Hampton
Of the total 81 dwellings in New Hampton, owner-occupied units account for 64 (79.0%), while renter-occupied units make up 17 (21.0%).
| Occupancy | # Housing Units | % Housing Units |
| Owner Occupied Housing Units | 64 | 79.0% |
| Renter-Occupied Housing Units | 17 | 21.0% |
| Total Occupied Housing Units | 81 | 100.0% |
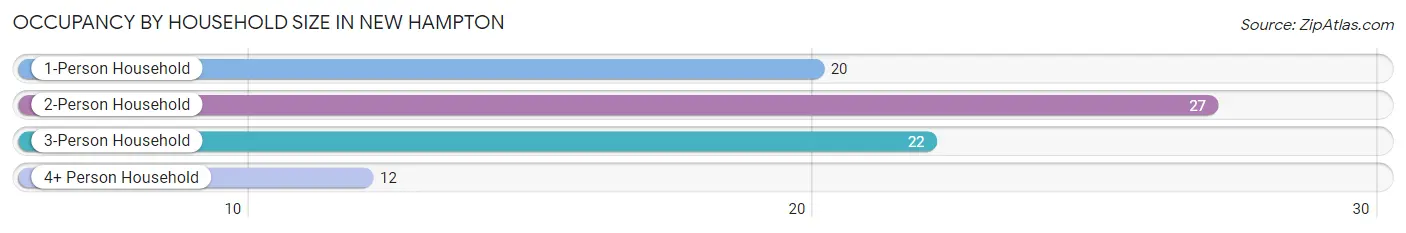
Occupancy by Household Size in New Hampton
| Household Size | # Housing Units | % Housing Units |
| 1-Person Household | 20 | 24.7% |
| 2-Person Household | 27 | 33.3% |
| 3-Person Household | 22 | 27.2% |
| 4+ Person Household | 12 | 14.8% |
| Total Housing Units | 81 | 100.0% |
Occupancy by Ownership by Household Size in New Hampton
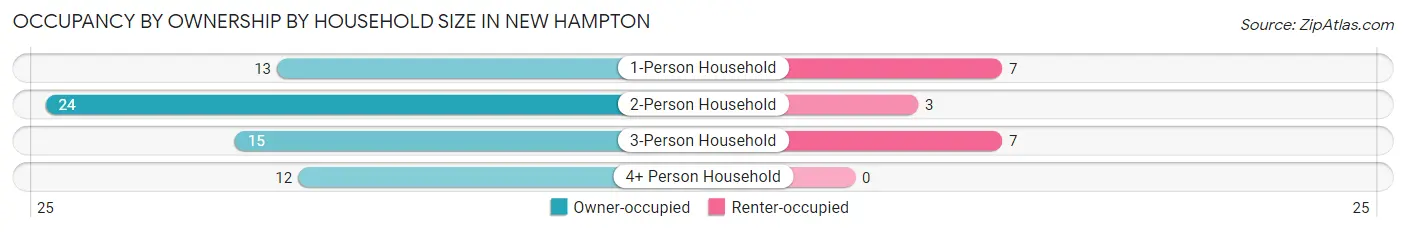
| Household Size | Owner-occupied | Renter-occupied |
| 1-Person Household | 13 (65.0%) | 7 (35.0%) |
| 2-Person Household | 24 (88.9%) | 3 (11.1%) |
| 3-Person Household | 15 (68.2%) | 7 (31.8%) |
| 4+ Person Household | 12 (100.0%) | 0 (0.0%) |
| Total Housing Units | 64 (79.0%) | 17 (21.0%) |
Occupancy by Educational Attainment in New Hampton
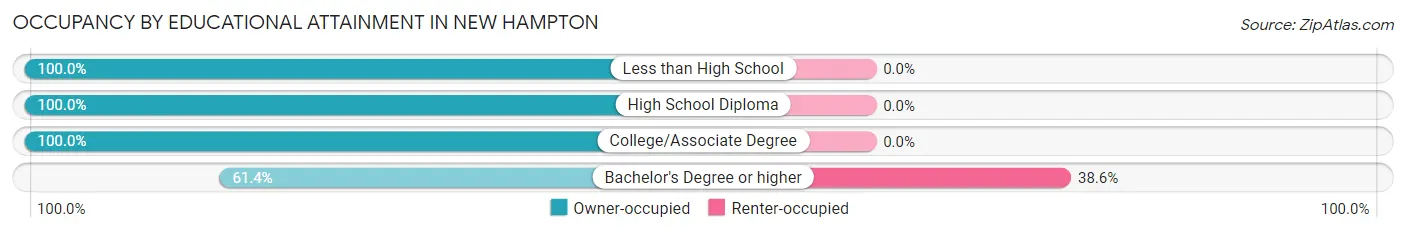
| Household Size | Owner-occupied | Renter-occupied |
| Less than High School | 7 (100.0%) | 0 (0.0%) |
| High School Diploma | 8 (100.0%) | 0 (0.0%) |
| College/Associate Degree | 22 (100.0%) | 0 (0.0%) |
| Bachelor's Degree or higher | 27 (61.4%) | 17 (38.6%) |
Occupancy by Age of Householder in New Hampton
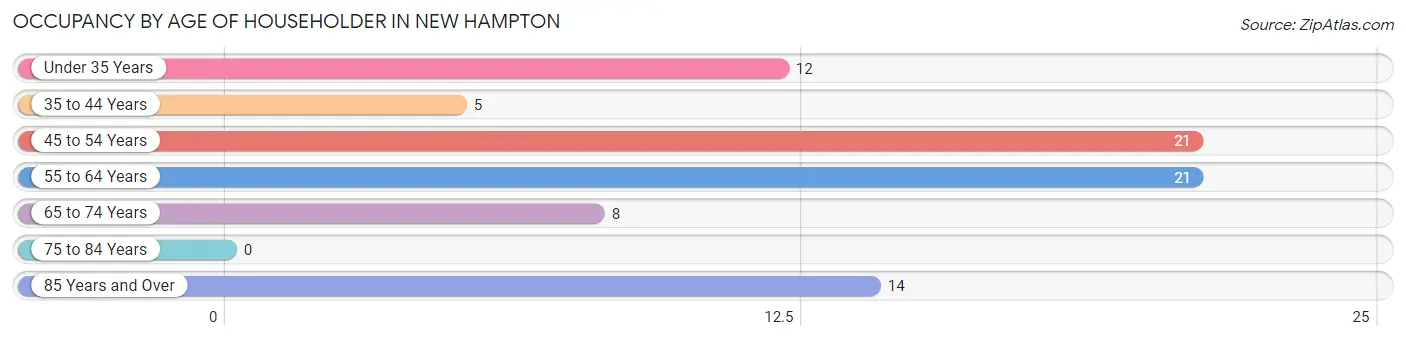
| Age Bracket | # Households | % Households |
| Under 35 Years | 12 | 14.8% |
| 35 to 44 Years | 5 | 6.2% |
| 45 to 54 Years | 21 | 25.9% |
| 55 to 64 Years | 21 | 25.9% |
| 65 to 74 Years | 8 | 9.9% |
| 75 to 84 Years | 0 | 0.0% |
| 85 Years and Over | 14 | 17.3% |
| Total | 81 | 100.0% |
Housing Finances in New Hampton
Median Income by Occupancy in New Hampton
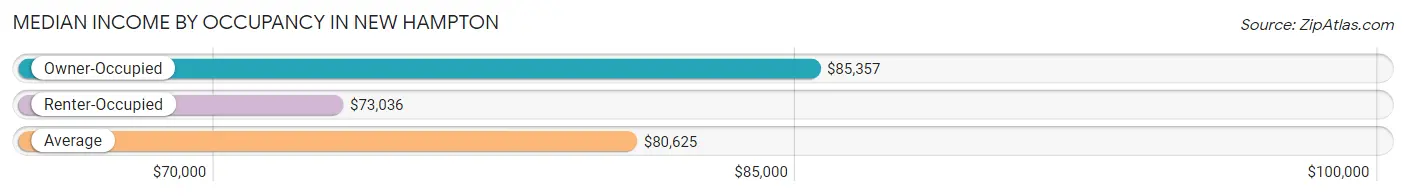
| Occupancy Type | # Households | Median Income |
| Owner-Occupied | 64 (79.0%) | $85,357 |
| Renter-Occupied | 17 (21.0%) | $73,036 |
| Average | 81 (100.0%) | $80,625 |
Occupancy by Householder Income Bracket in New Hampton
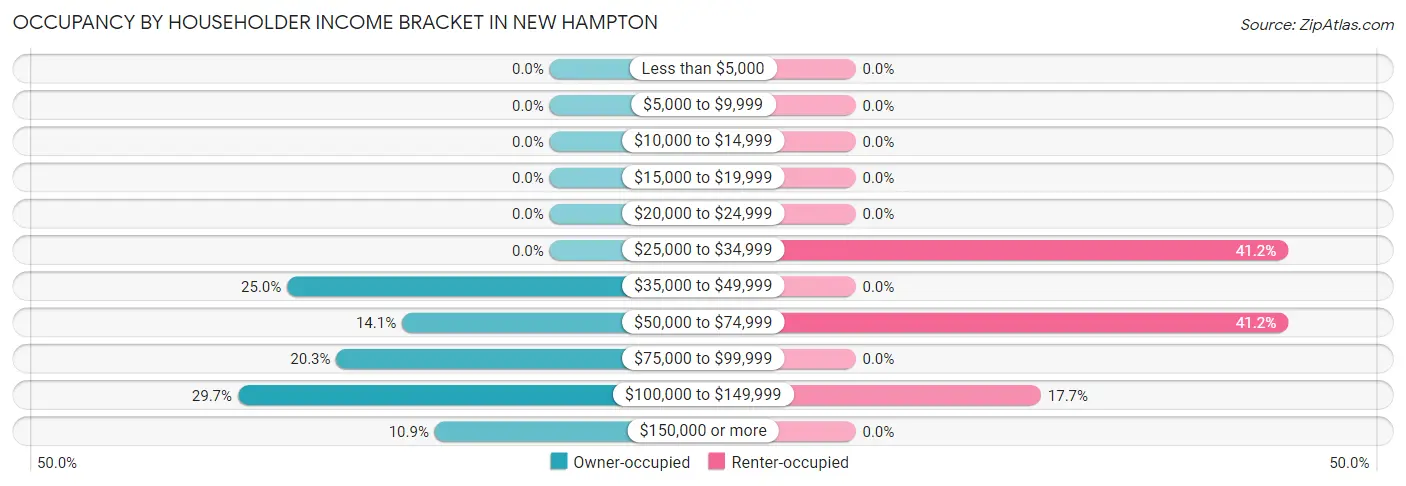
| Income Bracket | Owner-occupied | Renter-occupied |
| Less than $5,000 | 0 (0.0%) | 0 (0.0%) |
| $5,000 to $9,999 | 0 (0.0%) | 0 (0.0%) |
| $10,000 to $14,999 | 0 (0.0%) | 0 (0.0%) |
| $15,000 to $19,999 | 0 (0.0%) | 0 (0.0%) |
| $20,000 to $24,999 | 0 (0.0%) | 0 (0.0%) |
| $25,000 to $34,999 | 0 (0.0%) | 7 (41.2%) |
| $35,000 to $49,999 | 16 (25.0%) | 0 (0.0%) |
| $50,000 to $74,999 | 9 (14.1%) | 7 (41.2%) |
| $75,000 to $99,999 | 13 (20.3%) | 0 (0.0%) |
| $100,000 to $149,999 | 19 (29.7%) | 3 (17.6%) |
| $150,000 or more | 7 (10.9%) | 0 (0.0%) |
| Total | 64 (100.0%) | 17 (100.0%) |
Monthly Housing Cost Tiers in New Hampton
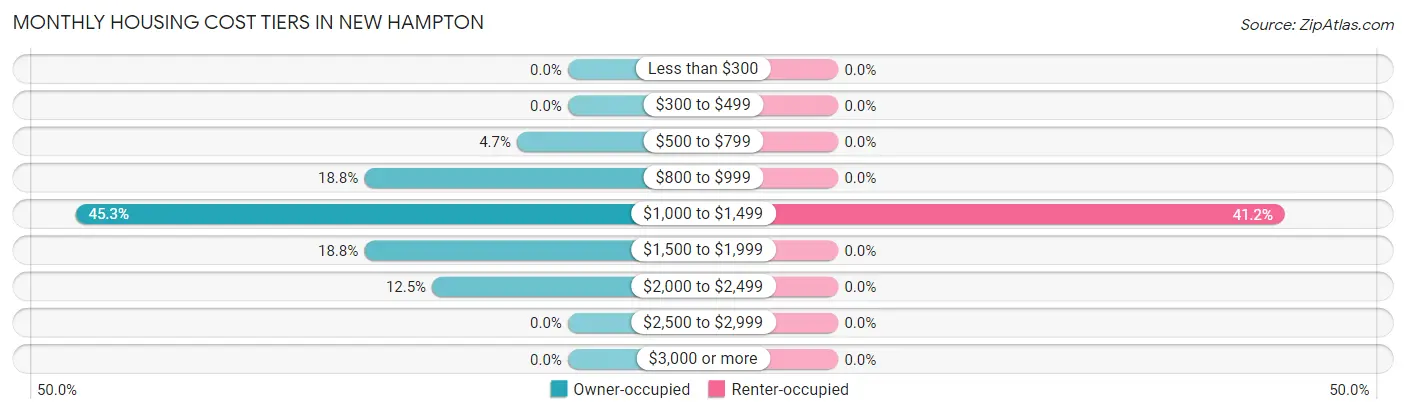
| Monthly Cost | Owner-occupied | Renter-occupied |
| Less than $300 | 0 (0.0%) | 0 (0.0%) |
| $300 to $499 | 0 (0.0%) | 0 (0.0%) |
| $500 to $799 | 3 (4.7%) | 0 (0.0%) |
| $800 to $999 | 12 (18.8%) | 0 (0.0%) |
| $1,000 to $1,499 | 29 (45.3%) | 7 (41.2%) |
| $1,500 to $1,999 | 12 (18.8%) | 0 (0.0%) |
| $2,000 to $2,499 | 8 (12.5%) | 0 (0.0%) |
| $2,500 to $2,999 | 0 (0.0%) | 0 (0.0%) |
| $3,000 or more | 0 (0.0%) | 0 (0.0%) |
| Total | 64 (100.0%) | 17 (100.0%) |
Physical Housing Characteristics in New Hampton
Housing Structures in New Hampton
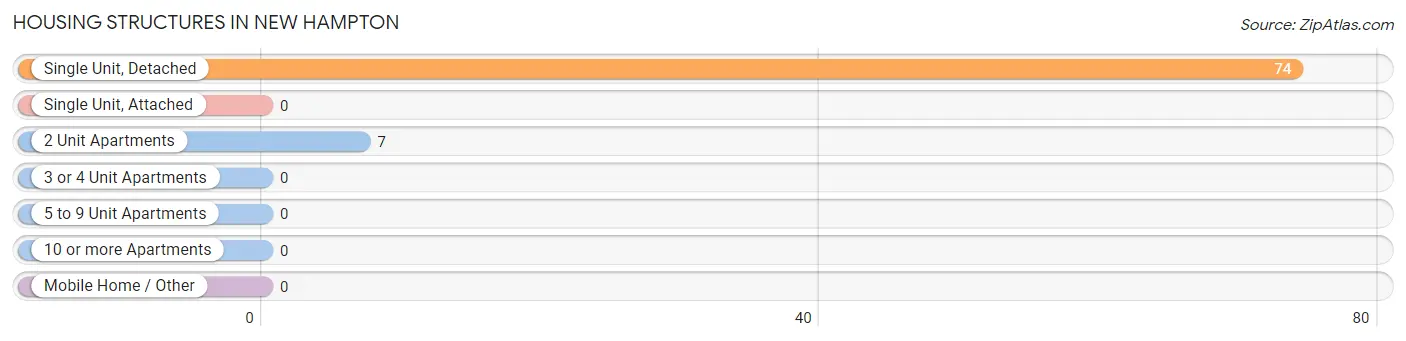
| Structure Type | # Housing Units | % Housing Units |
| Single Unit, Detached | 74 | 91.4% |
| Single Unit, Attached | 0 | 0.0% |
| 2 Unit Apartments | 7 | 8.6% |
| 3 or 4 Unit Apartments | 0 | 0.0% |
| 5 to 9 Unit Apartments | 0 | 0.0% |
| 10 or more Apartments | 0 | 0.0% |
| Mobile Home / Other | 0 | 0.0% |
| Total | 81 | 100.0% |
Housing Structures by Occupancy in New Hampton
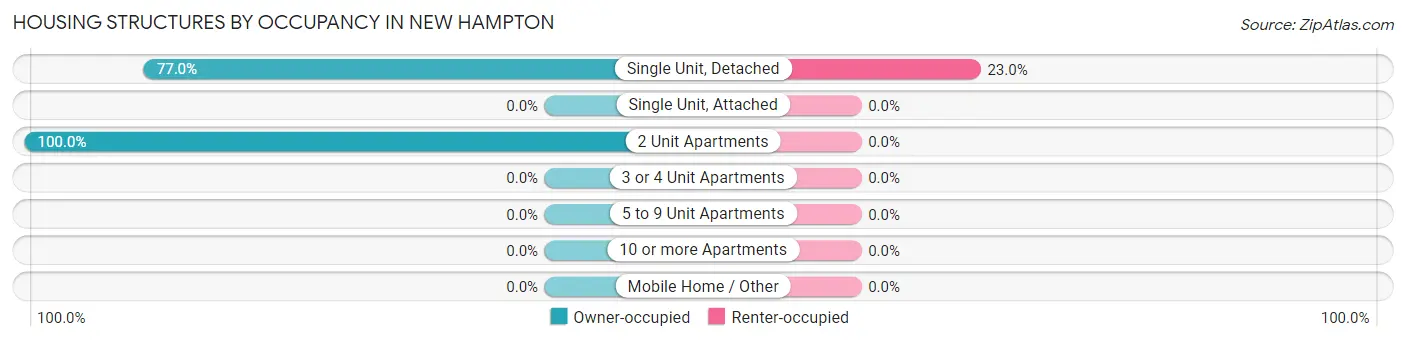
| Structure Type | Owner-occupied | Renter-occupied |
| Single Unit, Detached | 57 (77.0%) | 17 (23.0%) |
| Single Unit, Attached | 0 (0.0%) | 0 (0.0%) |
| 2 Unit Apartments | 7 (100.0%) | 0 (0.0%) |
| 3 or 4 Unit Apartments | 0 (0.0%) | 0 (0.0%) |
| 5 to 9 Unit Apartments | 0 (0.0%) | 0 (0.0%) |
| 10 or more Apartments | 0 (0.0%) | 0 (0.0%) |
| Mobile Home / Other | 0 (0.0%) | 0 (0.0%) |
| Total | 64 (79.0%) | 17 (21.0%) |
Housing Structures by Number of Rooms in New Hampton
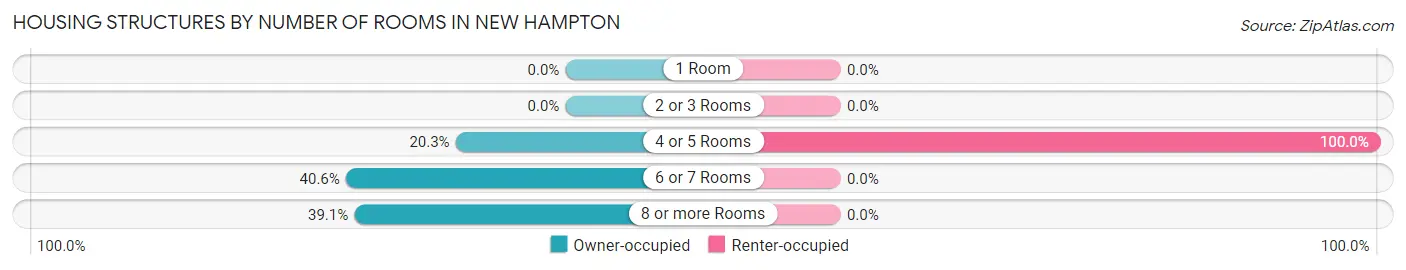
| Number of Rooms | Owner-occupied | Renter-occupied |
| 1 Room | 0 (0.0%) | 0 (0.0%) |
| 2 or 3 Rooms | 0 (0.0%) | 0 (0.0%) |
| 4 or 5 Rooms | 13 (20.3%) | 17 (100.0%) |
| 6 or 7 Rooms | 26 (40.6%) | 0 (0.0%) |
| 8 or more Rooms | 25 (39.1%) | 0 (0.0%) |
| Total | 64 (100.0%) | 17 (100.0%) |
Housing Structure by Heating Type in New Hampton
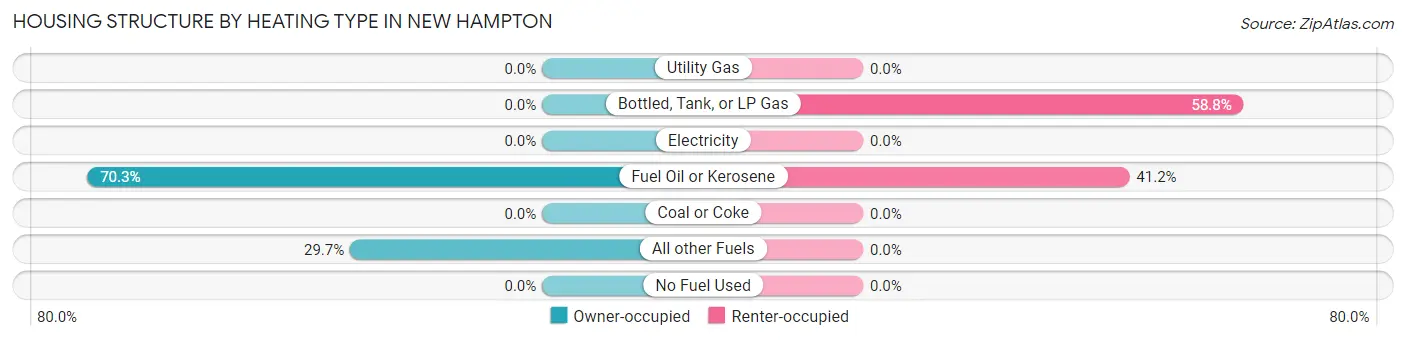
| Heating Type | Owner-occupied | Renter-occupied |
| Utility Gas | 0 (0.0%) | 0 (0.0%) |
| Bottled, Tank, or LP Gas | 0 (0.0%) | 10 (58.8%) |
| Electricity | 0 (0.0%) | 0 (0.0%) |
| Fuel Oil or Kerosene | 45 (70.3%) | 7 (41.2%) |
| Coal or Coke | 0 (0.0%) | 0 (0.0%) |
| All other Fuels | 19 (29.7%) | 0 (0.0%) |
| No Fuel Used | 0 (0.0%) | 0 (0.0%) |
| Total | 64 (100.0%) | 17 (100.0%) |
Household Vehicle Usage in New Hampton
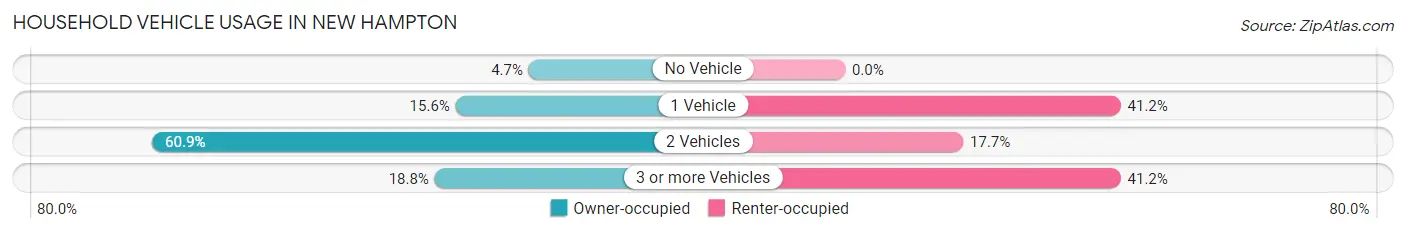
| Vehicles per Household | Owner-occupied | Renter-occupied |
| No Vehicle | 3 (4.7%) | 0 (0.0%) |
| 1 Vehicle | 10 (15.6%) | 7 (41.2%) |
| 2 Vehicles | 39 (60.9%) | 3 (17.6%) |
| 3 or more Vehicles | 12 (18.8%) | 7 (41.2%) |
| Total | 64 (100.0%) | 17 (100.0%) |
Real Estate & Mortgages in New Hampton
Real Estate and Mortgage Overview in New Hampton
| Characteristic | Without Mortgage | With Mortgage |
| Housing Units | 22 | 42 |
| Median Property Value | $281,800 | $218,800 |
| Median Household Income | $93,750 | $7 |
| Monthly Housing Costs | $900 | $0 |
| Real Estate Taxes | $5,667 | $0 |
Property Value by Mortgage Status in New Hampton
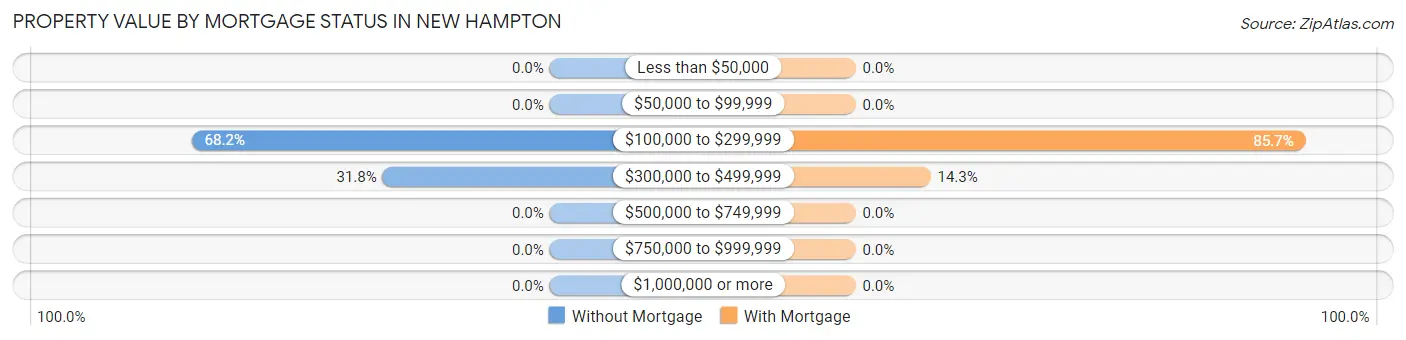
| Property Value | Without Mortgage | With Mortgage |
| Less than $50,000 | 0 (0.0%) | 0 (0.0%) |
| $50,000 to $99,999 | 0 (0.0%) | 0 (0.0%) |
| $100,000 to $299,999 | 15 (68.2%) | 36 (85.7%) |
| $300,000 to $499,999 | 7 (31.8%) | 6 (14.3%) |
| $500,000 to $749,999 | 0 (0.0%) | 0 (0.0%) |
| $750,000 to $999,999 | 0 (0.0%) | 0 (0.0%) |
| $1,000,000 or more | 0 (0.0%) | 0 (0.0%) |
| Total | 22 (100.0%) | 42 (100.0%) |
Household Income by Mortgage Status in New Hampton
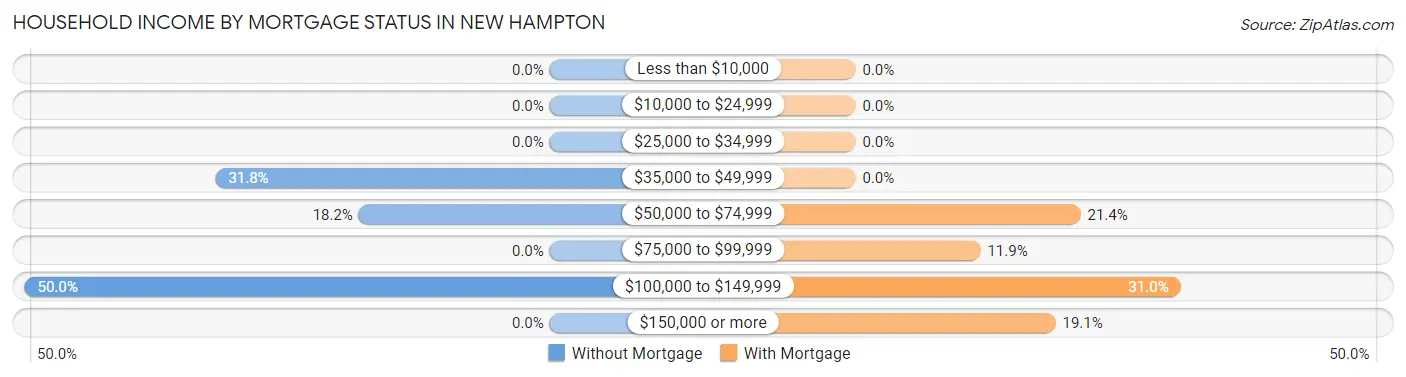
| Household Income | Without Mortgage | With Mortgage |
| Less than $10,000 | 0 (0.0%) | 0 (0.0%) |
| $10,000 to $24,999 | 0 (0.0%) | 0 (0.0%) |
| $25,000 to $34,999 | 0 (0.0%) | 0 (0.0%) |
| $35,000 to $49,999 | 7 (31.8%) | 0 (0.0%) |
| $50,000 to $74,999 | 4 (18.2%) | 9 (21.4%) |
| $75,000 to $99,999 | 0 (0.0%) | 5 (11.9%) |
| $100,000 to $149,999 | 11 (50.0%) | 13 (30.9%) |
| $150,000 or more | 0 (0.0%) | 8 (19.1%) |
| Total | 22 (100.0%) | 42 (100.0%) |
Property Value to Household Income Ratio in New Hampton
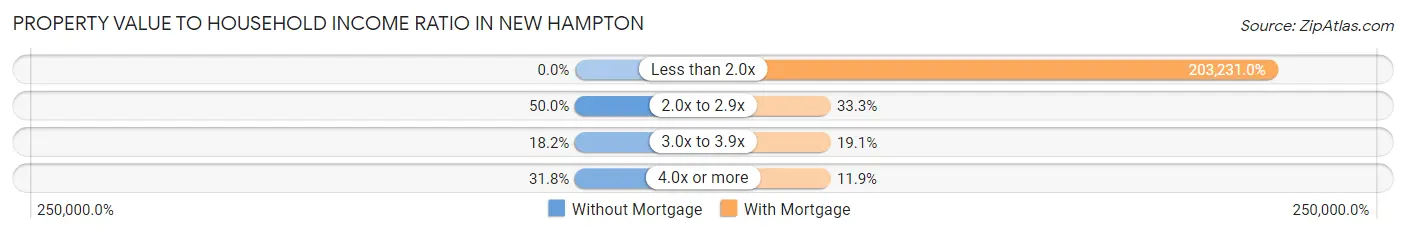
| Value-to-Income Ratio | Without Mortgage | With Mortgage |
| Less than 2.0x | 0 (0.0%) | 85,357 (203,231.0%) |
| 2.0x to 2.9x | 11 (50.0%) | 14 (33.3%) |
| 3.0x to 3.9x | 4 (18.2%) | 8 (19.1%) |
| 4.0x or more | 7 (31.8%) | 5 (11.9%) |
| Total | 22 (100.0%) | 42 (100.0%) |
Real Estate Taxes by Mortgage Status in New Hampton
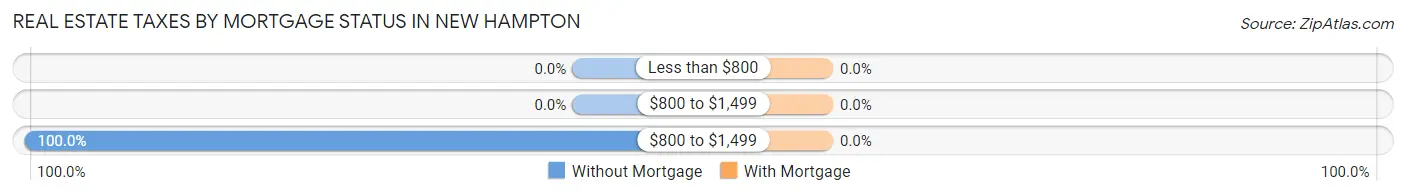
| Property Taxes | Without Mortgage | With Mortgage |
| Less than $800 | 0 (0.0%) | 0 (0.0%) |
| $800 to $1,499 | 0 (0.0%) | 0 (0.0%) |
| $800 to $1,499 | 22 (100.0%) | 0 (0.0%) |
| Total | 22 (100.0%) | 42 (100.0%) |
Health & Disability in New Hampton
Health Insurance Coverage by Age in New Hampton
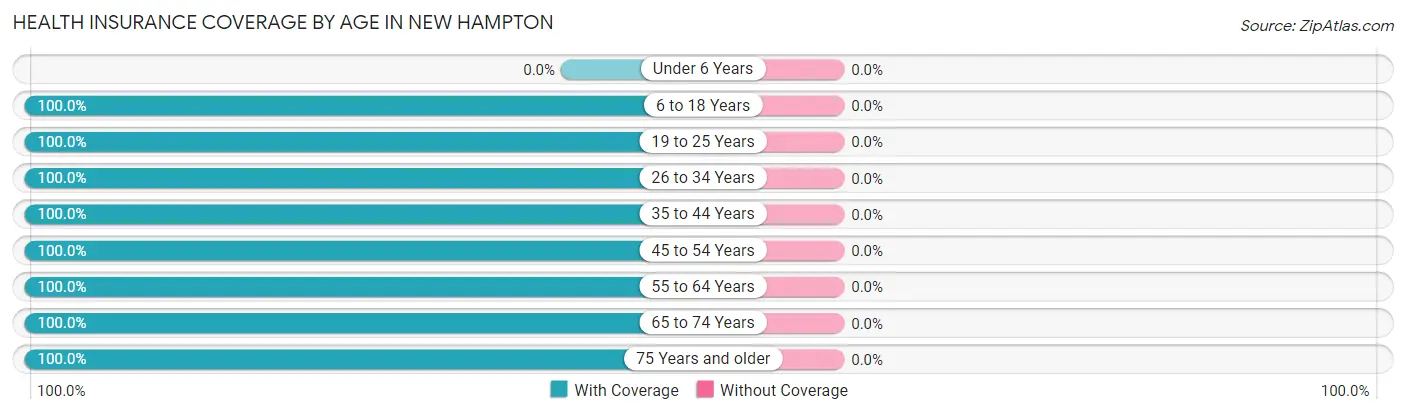
| Age Bracket | With Coverage | Without Coverage |
| Under 6 Years | 0 (0.0%) | 0 (0.0%) |
| 6 to 18 Years | 32 (100.0%) | 0 (0.0%) |
| 19 to 25 Years | 12 (100.0%) | 0 (0.0%) |
| 26 to 34 Years | 56 (100.0%) | 0 (0.0%) |
| 35 to 44 Years | 17 (100.0%) | 0 (0.0%) |
| 45 to 54 Years | 27 (100.0%) | 0 (0.0%) |
| 55 to 64 Years | 151 (100.0%) | 0 (0.0%) |
| 65 to 74 Years | 15 (100.0%) | 0 (0.0%) |
| 75 Years and older | 14 (100.0%) | 0 (0.0%) |
| Total | 324 (100.0%) | 0 (0.0%) |
Health Insurance Coverage by Citizenship Status in New Hampton
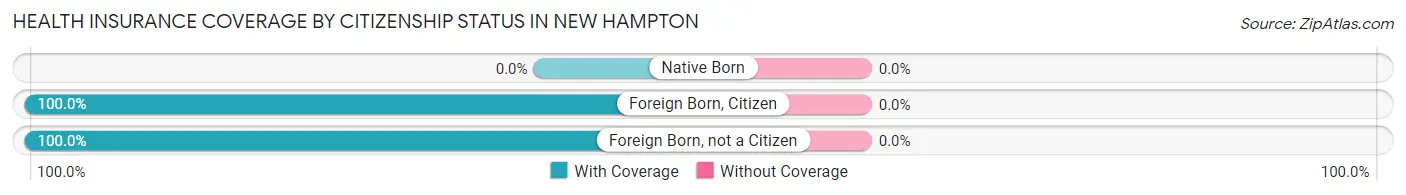
| Citizenship Status | With Coverage | Without Coverage |
| Native Born | 0 (0.0%) | 0 (0.0%) |
| Foreign Born, Citizen | 32 (100.0%) | 0 (0.0%) |
| Foreign Born, not a Citizen | 12 (100.0%) | 0 (0.0%) |
Health Insurance Coverage by Household Income in New Hampton
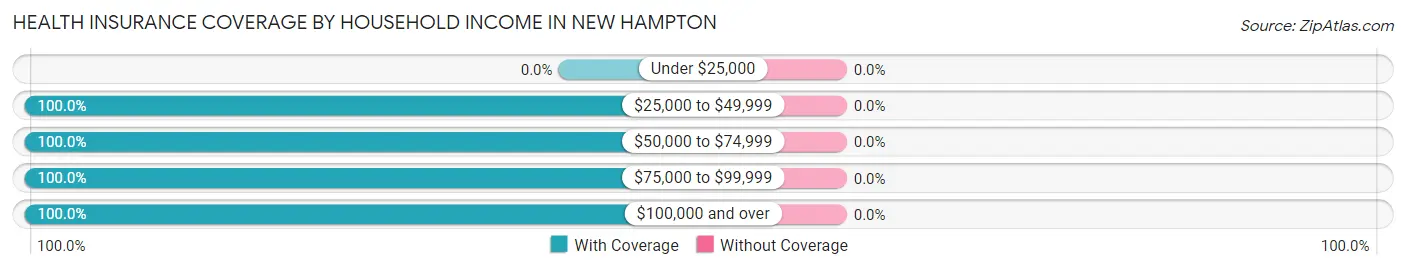
| Household Income | With Coverage | Without Coverage |
| Under $25,000 | 0 (0.0%) | 0 (0.0%) |
| $25,000 to $49,999 | 35 (100.0%) | 0 (0.0%) |
| $50,000 to $74,999 | 61 (100.0%) | 0 (0.0%) |
| $75,000 to $99,999 | 19 (100.0%) | 0 (0.0%) |
| $100,000 and over | 101 (100.0%) | 0 (0.0%) |
Public vs Private Health Insurance Coverage by Age in New Hampton
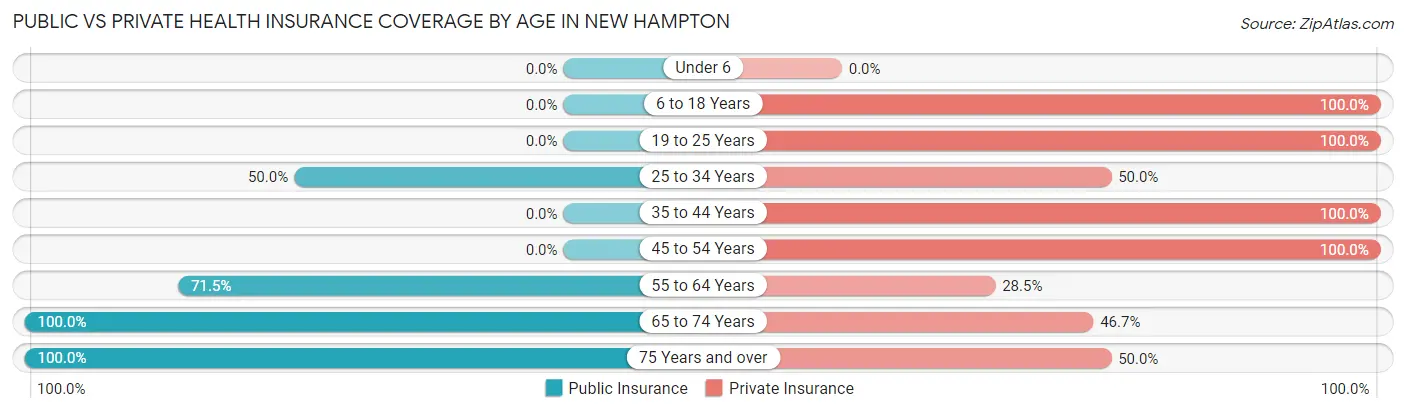
| Age Bracket | Public Insurance | Private Insurance |
| Under 6 | 0 (0.0%) | 0 (0.0%) |
| 6 to 18 Years | 0 (0.0%) | 32 (100.0%) |
| 19 to 25 Years | 0 (0.0%) | 12 (100.0%) |
| 25 to 34 Years | 28 (50.0%) | 28 (50.0%) |
| 35 to 44 Years | 0 (0.0%) | 17 (100.0%) |
| 45 to 54 Years | 0 (0.0%) | 27 (100.0%) |
| 55 to 64 Years | 108 (71.5%) | 43 (28.5%) |
| 65 to 74 Years | 15 (100.0%) | 7 (46.7%) |
| 75 Years and over | 14 (100.0%) | 7 (50.0%) |
| Total | 165 (50.9%) | 173 (53.4%) |
Disability Status by Sex by Age in New Hampton
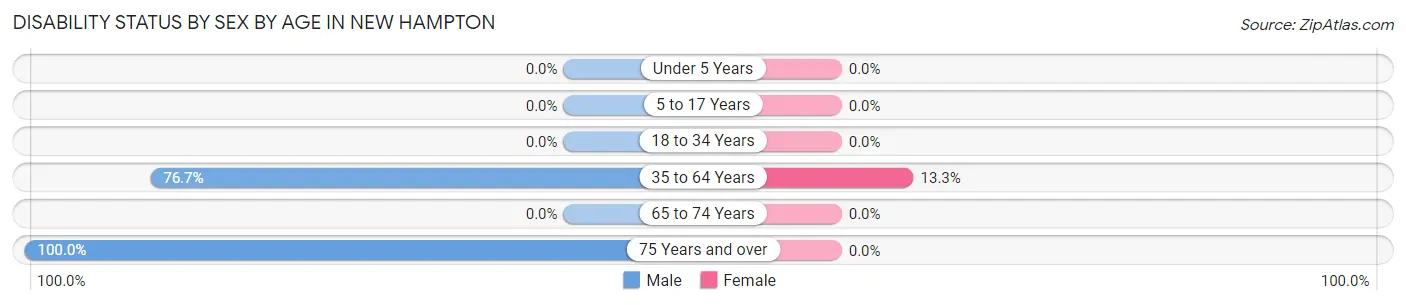
| Age Bracket | Male | Female |
| Under 5 Years | 0 (0.0%) | 0 (0.0%) |
| 5 to 17 Years | 0 (0.0%) | 0 (0.0%) |
| 18 to 34 Years | 0 (0.0%) | 0 (0.0%) |
| 35 to 64 Years | 115 (76.7%) | 6 (13.3%) |
| 65 to 74 Years | 0 (0.0%) | 0 (0.0%) |
| 75 Years and over | 10 (100.0%) | 0 (0.0%) |
Disability Class by Sex by Age in New Hampton
Disability Class: Hearing Difficulty
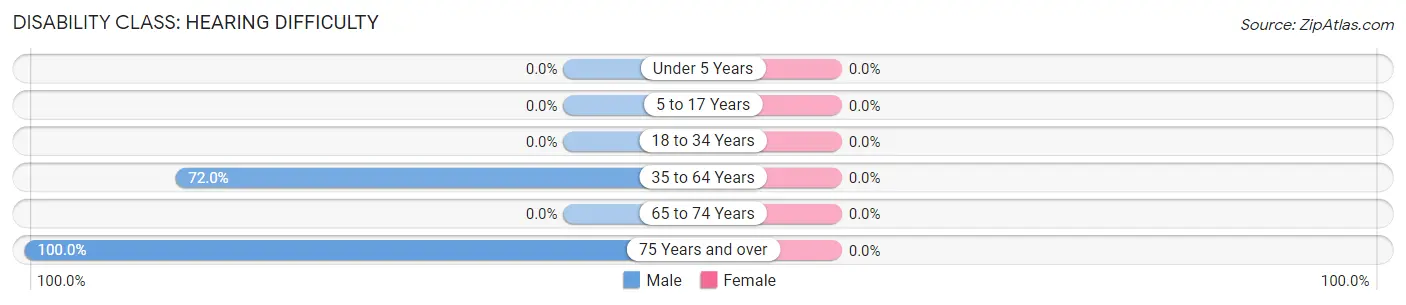
| Age Bracket | Male | Female |
| Under 5 Years | 0 (0.0%) | 0 (0.0%) |
| 5 to 17 Years | 0 (0.0%) | 0 (0.0%) |
| 18 to 34 Years | 0 (0.0%) | 0 (0.0%) |
| 35 to 64 Years | 108 (72.0%) | 0 (0.0%) |
| 65 to 74 Years | 0 (0.0%) | 0 (0.0%) |
| 75 Years and over | 10 (100.0%) | 0 (0.0%) |
Disability Class: Vision Difficulty
| Age Bracket | Male | Female |
| Under 5 Years | 0 (0.0%) | 0 (0.0%) |
| 5 to 17 Years | 0 (0.0%) | 0 (0.0%) |
| 18 to 34 Years | 0 (0.0%) | 0 (0.0%) |
| 35 to 64 Years | 0 (0.0%) | 0 (0.0%) |
| 65 to 74 Years | 0 (0.0%) | 0 (0.0%) |
| 75 Years and over | 0 (0.0%) | 0 (0.0%) |
Disability Class: Cognitive Difficulty
| Age Bracket | Male | Female |
| 5 to 17 Years | 0 (0.0%) | 0 (0.0%) |
| 18 to 34 Years | 0 (0.0%) | 0 (0.0%) |
| 35 to 64 Years | 0 (0.0%) | 6 (13.3%) |
| 65 to 74 Years | 0 (0.0%) | 0 (0.0%) |
| 75 Years and over | 10 (100.0%) | 0 (0.0%) |
Disability Class: Ambulatory Difficulty
| Age Bracket | Male | Female |
| 5 to 17 Years | 0 (0.0%) | 0 (0.0%) |
| 18 to 34 Years | 0 (0.0%) | 0 (0.0%) |
| 35 to 64 Years | 0 (0.0%) | 6 (13.3%) |
| 65 to 74 Years | 0 (0.0%) | 0 (0.0%) |
| 75 Years and over | 3 (30.0%) | 0 (0.0%) |
Disability Class: Self-Care Difficulty
| Age Bracket | Male | Female |
| 5 to 17 Years | 0 (0.0%) | 0 (0.0%) |
| 18 to 34 Years | 0 (0.0%) | 0 (0.0%) |
| 35 to 64 Years | 7 (4.7%) | 0 (0.0%) |
| 65 to 74 Years | 0 (0.0%) | 0 (0.0%) |
| 75 Years and over | 0 (0.0%) | 0 (0.0%) |
Technology Access in New Hampton
Computing Device Access in New Hampton
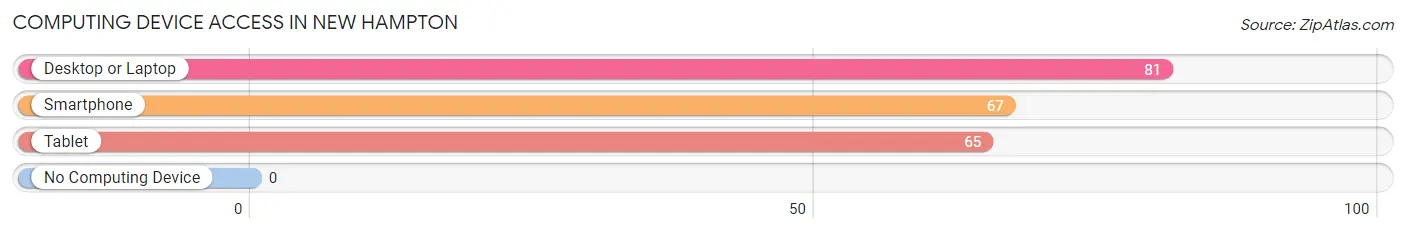
| Device Type | # Households | % Households |
| Desktop or Laptop | 81 | 100.0% |
| Smartphone | 67 | 82.7% |
| Tablet | 65 | 80.2% |
| No Computing Device | 0 | 0.0% |
| Total | 81 | 100.0% |
Internet Access in New Hampton
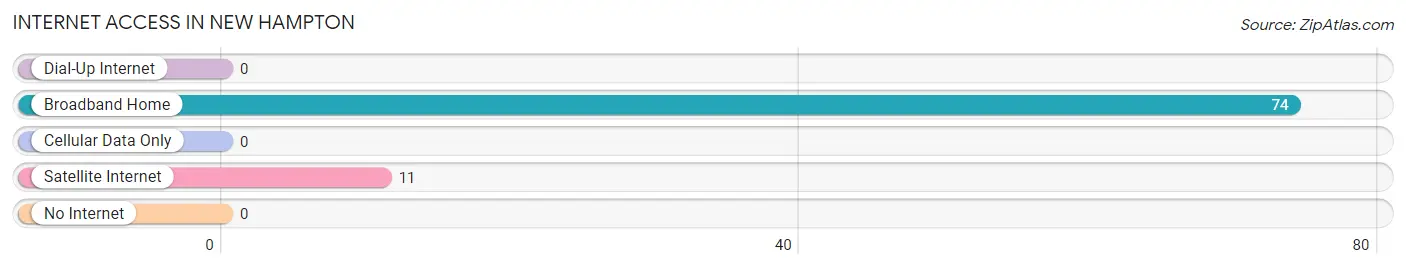
| Internet Type | # Households | % Households |
| Dial-Up Internet | 0 | 0.0% |
| Broadband Home | 74 | 91.4% |
| Cellular Data Only | 0 | 0.0% |
| Satellite Internet | 11 | 13.6% |
| No Internet | 0 | 0.0% |
| Total | 81 | 100.0% |
New Hampton Summary
New Hampton is a town located in Belknap County, New Hampshire, United States. The population was 2,165 at the 2010 census. It is home to the New Hampton School, a private preparatory school.
Geography
New Hampton is located in the Lakes Region of central New Hampshire. It is bordered by the towns of Meredith to the north, Sanbornton to the east, Hill to the south, and Bristol to the west.
According to the United States Census Bureau, the town has a total area of 28.2sqmi, of which 27.9sqmi is land and 0.3sqmi is water, comprising 1.09% of the town. The highest point in New Hampton is the summit of Mount Shaw, at 1,845 feet (562 m) above sea level.
Demographics
As of the census of 2010, there were 2,165 people, 845 households, and 590 families residing in the town. The population density was 77.4 people per square mile (29.9/km^2). There were 945 housing units at an average density of 33.9 per square mile (13.1/km^2). The racial makeup of the town was 97.7% White, 0.2% African American, 0.2% Native American, 0.3% Asian, 0.1% Pacific Islander, 0.2% from other races, and 1.3% from two or more races. Hispanic or Latino of any race were 0.9% of the population.
There were 845 households, out of which 32.2% had children under the age of 18 living with them, 56.2% were married couples living together, 9.2% had a female householder with no husband present, and 30.2% were non-families. 24.2% of all households were made up of individuals, and 9.2% had someone living alone who was 65 years of age or older. The average household size was 2.55 and the average family size was 3.03.
In the town, the population was spread out, with 25.3% under the age of 18, 6.2% from 18 to 24, 28.2% from 25 to 44, 27.2% from 45 to 64, and 13.1% who were 65 years of age or older. The median age was 39 years. For every 100 females, there were 97.2 males. For every 100 females age 18 and over, there were 95.2 males.
The median income for a household in the town was $50,938, and the median income for a family was $60,000. Males had a median income of $37,917 versus $27,500 for females. The per capita income for the town was $23,945. About 4.2% of families and 5.7% of the population were below the poverty line, including 6.2% of those under age 18 and 5.2% of those age 65 or over.
Economy
New Hampton's economy is largely based on tourism and agriculture. The town is home to several small businesses, including a general store, a hardware store, a gas station, and a few restaurants. The town is also home to the New Hampton School, a private preparatory school.
The town is also home to the New Hampton Fish Hatchery, which is the largest trout hatchery in the state. The hatchery produces over 1 million trout each year, which are stocked in lakes and streams throughout the state.
History
New Hampton was first settled in 1765 by a group of settlers from Hampton, Massachusetts. The town was originally known as Moultonborough Addition, but was later renamed New Hampton in 1777.
The town was an important stop on the stagecoach route between Concord and Portland, Maine. The town was also home to several mills, including a sawmill, gristmill, and a woolen mill.
In 1821, the New Hampton School was founded. The school is a private preparatory school that serves students from grades 9-12.
In the late 19th century, the town was home to several summer resorts, including the New Hampton Inn and the New Hampton Hotel. The resorts attracted visitors from all over the country, and the town became a popular summer destination.
In the early 20th century, the town was home to several factories, including a shoe factory, a paper mill, and a furniture factory. The factories provided employment for many of the town's residents.
Today, New Hampton is a quiet rural town. The town is home to several small businesses, and the New Hampton School continues to serve students from all over the world.
Common Questions
What is Per Capita Income in New Hampton?
Per Capita income in New Hampton is $26,042.
What is the Median Family Income in New Hampton?
Median Family Income in New Hampton is $86,964.
What is the Median Household income in New Hampton?
Median Household Income in New Hampton is $80,625.
What is Inequality or Gini Index in New Hampton?
Inequality or Gini Index in New Hampton is 0.25.
What is the Total Population of New Hampton?
Total Population of New Hampton is 324.
What is the Total Male Population of New Hampton?
Total Male Population of New Hampton is 218.
What is the Total Female Population of New Hampton?
Total Female Population of New Hampton is 106.
What is the Ratio of Males per 100 Females in New Hampton?
There are 205.66 Males per 100 Females in New Hampton.
What is the Ratio of Females per 100 Males in New Hampton?
There are 48.62 Females per 100 Males in New Hampton.
What is the Median Population Age in New Hampton?
Median Population Age in New Hampton is 59.3 Years.
What is the Average Family Size in New Hampton
Average Family Size in New Hampton is 3.2 People.
What is the Average Household Size in New Hampton
Average Household Size in New Hampton is 2.7 People.
How Large is the Labor Force in New Hampton?
There are 151 People in the Labor Forcein in New Hampton.
What is the Percentage of People in the Labor Force in New Hampton?
50.8% of People are in the Labor Force in New Hampton.