Belmont, NH Map & Demographics
Belmont Map
Belmont Overview
$31,897
PER CAPITA INCOME
$75,487
AVG FAMILY INCOME
0.52
INEQUALITY / GINI INDEX
1,252
TOTAL POPULATION
482
MALE POPULATION
770
FEMALE POPULATION
62.60
MALES / 100 FEMALES
159.75
FEMALES / 100 MALES
40.7
MEDIAN AGE
3.4
AVG FAMILY SIZE
2.5
AVG HOUSEHOLD SIZE
619
LABOR FORCE [ PEOPLE ]
68.3%
PERCENT IN LABOR FORCE
Belmont Zip Codes
Belmont Area Codes
Income in Belmont
Income Overview in Belmont
| Characteristic | Number | Measure |
| Per Capita Income | 1,252 | $31,897 |
| Median Family Income | 289 | $75,487 |
| Mean Family Income | 289 | $70,283 |
| Median Household Income | 506 | $0 |
| Mean Household Income | 506 | $79,928 |
| Income Deficit | 289 | $0 |
| Wage / Income Gap (%) | 1,252 | 0.00% |
| Wage / Income Gap ($) | 1,252 | 100.00¢ per $1 |
| Gini / Inequality Index | 1,252 | 0.52 |
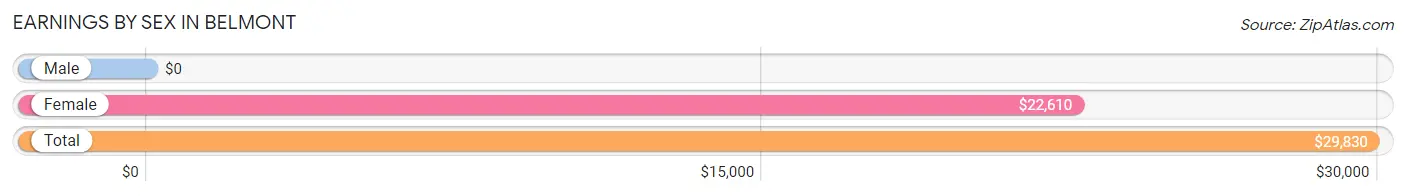
Earnings by Sex in Belmont
| Sex | Number | Average Earnings |
| Male | 312 (47.9%) | $0 |
| Female | 339 (52.1%) | $22,610 |
| Total | 651 (100.0%) | $29,830 |
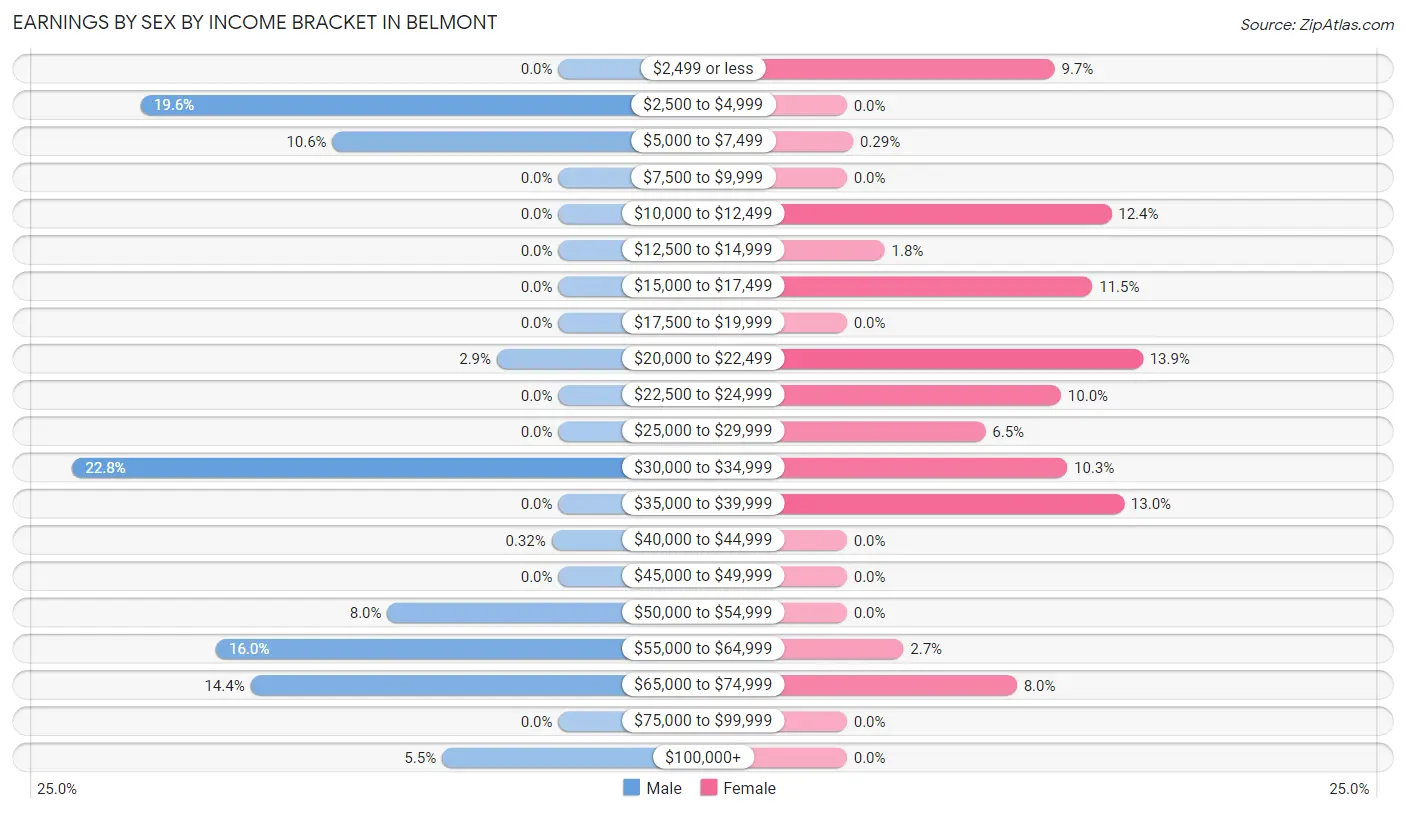
Earnings by Sex by Income Bracket in Belmont
The most common earnings brackets in Belmont are $30,000 to $34,999 for men (71 | 22.8%) and $20,000 to $22,499 for women (47 | 13.9%).
| Income | Male | Female |
| $2,499 or less | 0 (0.0%) | 33 (9.7%) |
| $2,500 to $4,999 | 61 (19.6%) | 0 (0.0%) |
| $5,000 to $7,499 | 33 (10.6%) | 1 (0.3%) |
| $7,500 to $9,999 | 0 (0.0%) | 0 (0.0%) |
| $10,000 to $12,499 | 0 (0.0%) | 42 (12.4%) |
| $12,500 to $14,999 | 0 (0.0%) | 6 (1.8%) |
| $15,000 to $17,499 | 0 (0.0%) | 39 (11.5%) |
| $17,500 to $19,999 | 0 (0.0%) | 0 (0.0%) |
| $20,000 to $22,499 | 9 (2.9%) | 47 (13.9%) |
| $22,500 to $24,999 | 0 (0.0%) | 34 (10.0%) |
| $25,000 to $29,999 | 0 (0.0%) | 22 (6.5%) |
| $30,000 to $34,999 | 71 (22.8%) | 35 (10.3%) |
| $35,000 to $39,999 | 0 (0.0%) | 44 (13.0%) |
| $40,000 to $44,999 | 1 (0.3%) | 0 (0.0%) |
| $45,000 to $49,999 | 0 (0.0%) | 0 (0.0%) |
| $50,000 to $54,999 | 25 (8.0%) | 0 (0.0%) |
| $55,000 to $64,999 | 50 (16.0%) | 9 (2.6%) |
| $65,000 to $74,999 | 45 (14.4%) | 27 (8.0%) |
| $75,000 to $99,999 | 0 (0.0%) | 0 (0.0%) |
| $100,000+ | 17 (5.4%) | 0 (0.0%) |
| Total | 312 (100.0%) | 339 (100.0%) |
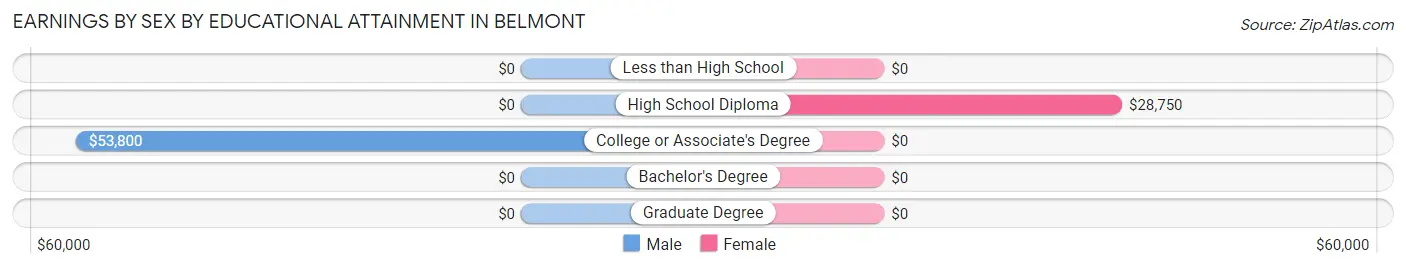
Earnings by Sex by Educational Attainment in Belmont
Average earnings in Belmont are $53,300 for men and $22,574 for women, a difference of 57.7%. Men with an educational attainment of college or associate's degree enjoy the highest average annual earnings of $53,800, while those with college or associate's degree education earn the least with $53,800. Women with an educational attainment of high school diploma earn the most with the average annual earnings of $28,750, while those with high school diploma education have the smallest earnings of $28,750.
| Educational Attainment | Male Income | Female Income |
| Less than High School | - | - |
| High School Diploma | - | - |
| College or Associate's Degree | $53,800 | $0 |
| Bachelor's Degree | - | - |
| Graduate Degree | - | - |
| Total | $53,300 | $22,574 |
Family Income in Belmont
Family Income Brackets in Belmont
According to the Belmont family income data, there are 84 families falling into the $75,000 to $99,999 income range, which is the most common income bracket and makes up 29.1% of all families.
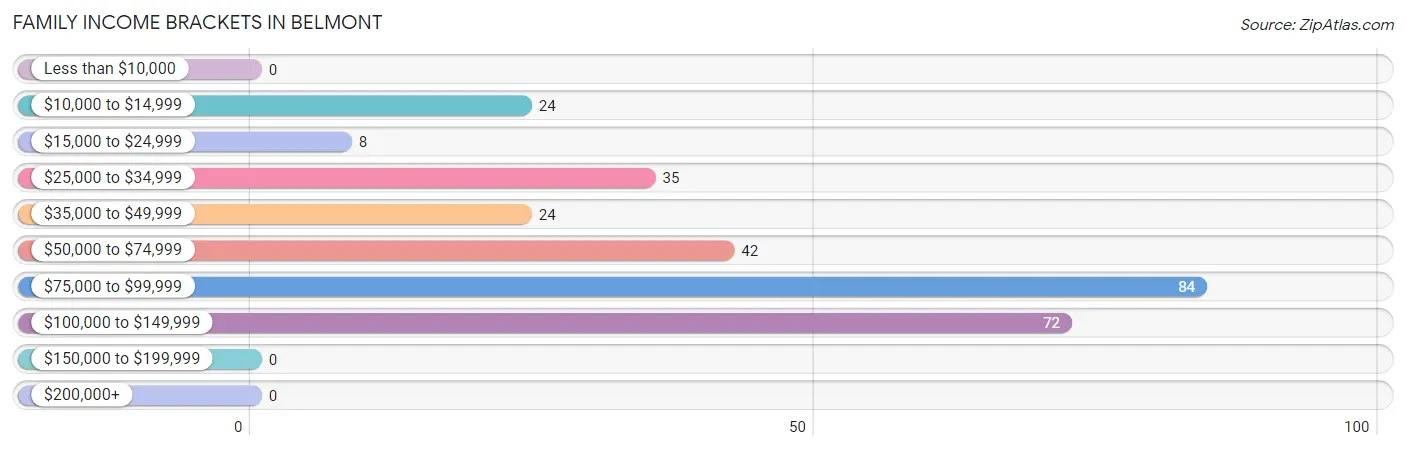
| Income Bracket | # Families | % Families |
| Less than $10,000 | 0 | 0.0% |
| $10,000 to $14,999 | 24 | 8.3% |
| $15,000 to $24,999 | 8 | 2.8% |
| $25,000 to $34,999 | 35 | 12.1% |
| $35,000 to $49,999 | 24 | 8.3% |
| $50,000 to $74,999 | 42 | 14.5% |
| $75,000 to $99,999 | 84 | 29.1% |
| $100,000 to $149,999 | 72 | 24.9% |
| $150,000 to $199,999 | 0 | 0.0% |
| $200,000+ | 0 | 0.0% |
Family Income by Famaliy Size in Belmont
3-person families (90 | 31.1%) account for the highest median family income in Belmont with $86,000 per family, while 2-person families (104 | 36.0%) have the highest median income of $37,969 per family member.
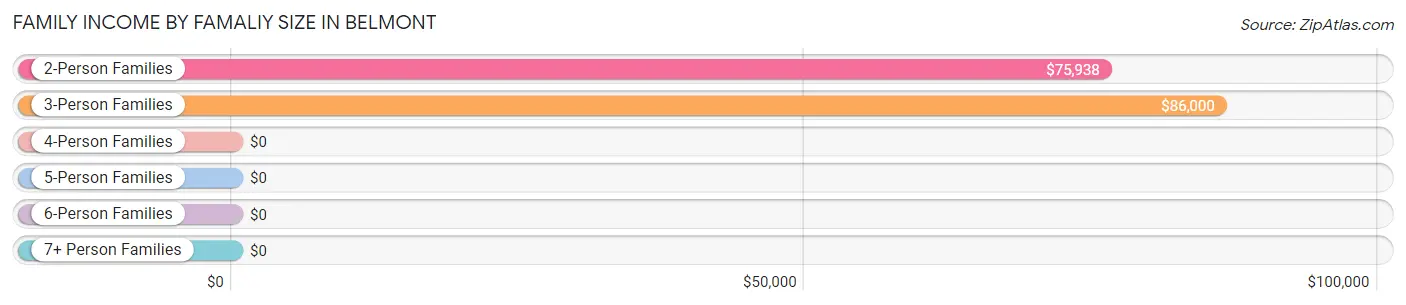
| Income Bracket | # Families | Median Income |
| 2-Person Families | 104 (36.0%) | $75,938 |
| 3-Person Families | 90 (31.1%) | $86,000 |
| 4-Person Families | 52 (18.0%) | $0 |
| 5-Person Families | 0 (0.0%) | $0 |
| 6-Person Families | 43 (14.9%) | $0 |
| 7+ Person Families | 0 (0.0%) | $0 |
| Total | 289 (100.0%) | $75,487 |
Family Income by Number of Earners in Belmont
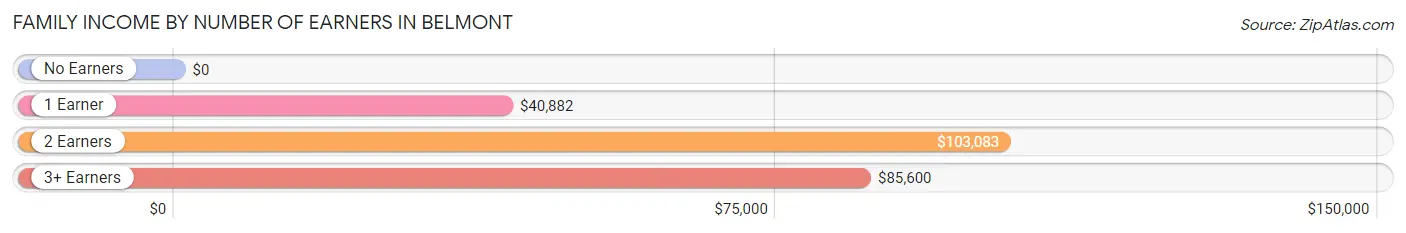
| Number of Earners | # Families | Median Income |
| No Earners | 32 (11.1%) | $0 |
| 1 Earner | 82 (28.4%) | $40,882 |
| 2 Earners | 77 (26.6%) | $103,083 |
| 3+ Earners | 98 (33.9%) | $85,600 |
| Total | 289 (100.0%) | $75,487 |
Household Income in Belmont
Household Income Brackets in Belmont
With 118 households falling in the category, the $25,000 to $34,999 income range is the most frequent in Belmont, accounting for 23.3% of all households.
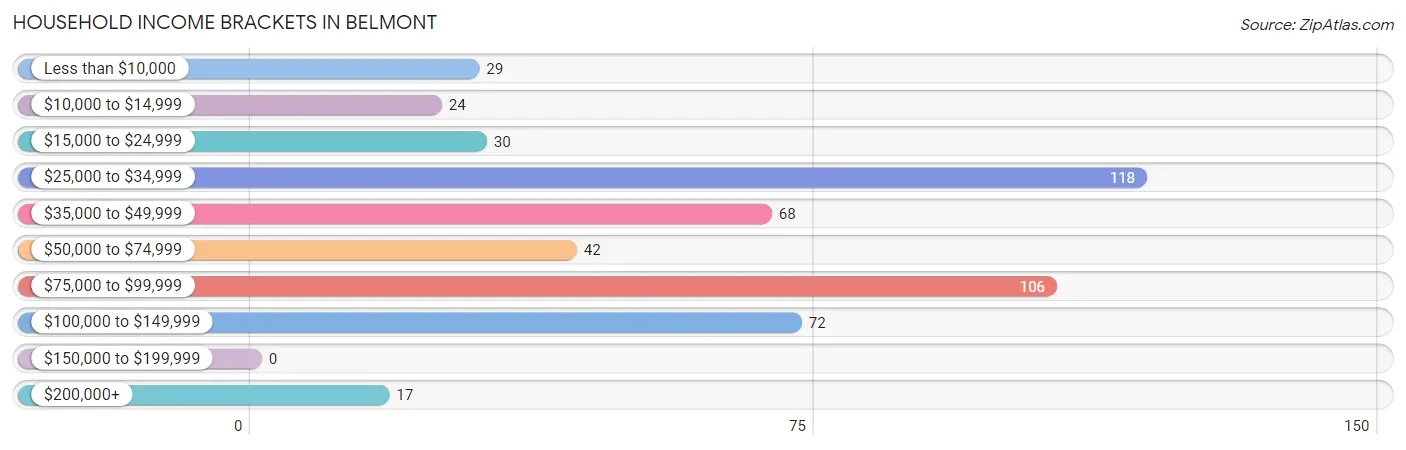
| Income Bracket | # Households | % Households |
| Less than $10,000 | 29 | 5.7% |
| $10,000 to $14,999 | 24 | 4.7% |
| $15,000 to $24,999 | 30 | 5.9% |
| $25,000 to $34,999 | 118 | 23.3% |
| $35,000 to $49,999 | 68 | 13.4% |
| $50,000 to $74,999 | 42 | 8.3% |
| $75,000 to $99,999 | 106 | 20.9% |
| $100,000 to $149,999 | 72 | 14.2% |
| $150,000 to $199,999 | 0 | 0.0% |
| $200,000+ | 17 | 3.4% |
Household Income by Householder Age in Belmont
The median household income in Belmont is $0, with the highest median household income of $90,000 found in the 45 to 64 years age bracket for the primary householder. A total of 124 households (24.5%) fall into this category. Meanwhile, the 15 to 24 years age bracket for the primary householder has the lowest median household income of $0, with 35 households (6.9%) in this group.
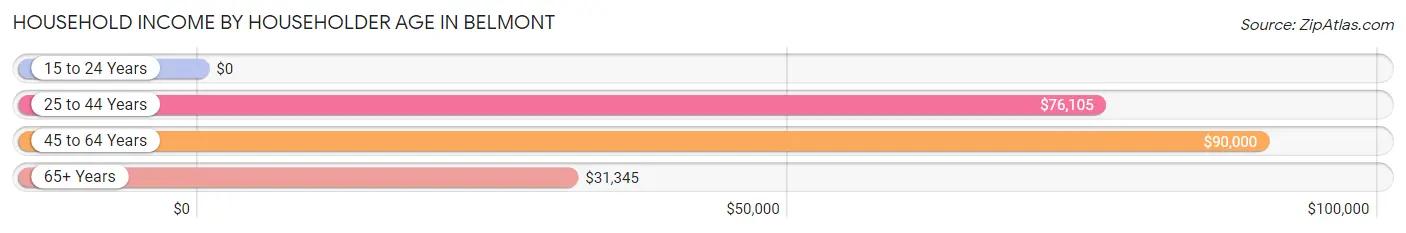
| Income Bracket | # Households | Median Income |
| 15 to 24 Years | 35 (6.9%) | $0 |
| 25 to 44 Years | 142 (28.1%) | $76,105 |
| 45 to 64 Years | 124 (24.5%) | $90,000 |
| 65+ Years | 205 (40.5%) | $31,345 |
| Total | 506 (100.0%) | $0 |
Poverty in Belmont
Income Below Poverty by Sex and Age in Belmont
With 12.9% poverty level for males and 14.4% for females among the residents of Belmont, 12 to 14 year old males and 6 to 11 year old females are the most vulnerable to poverty, with 29 males (100.0%) and 29 females (38.7%) in their respective age groups living below the poverty level.
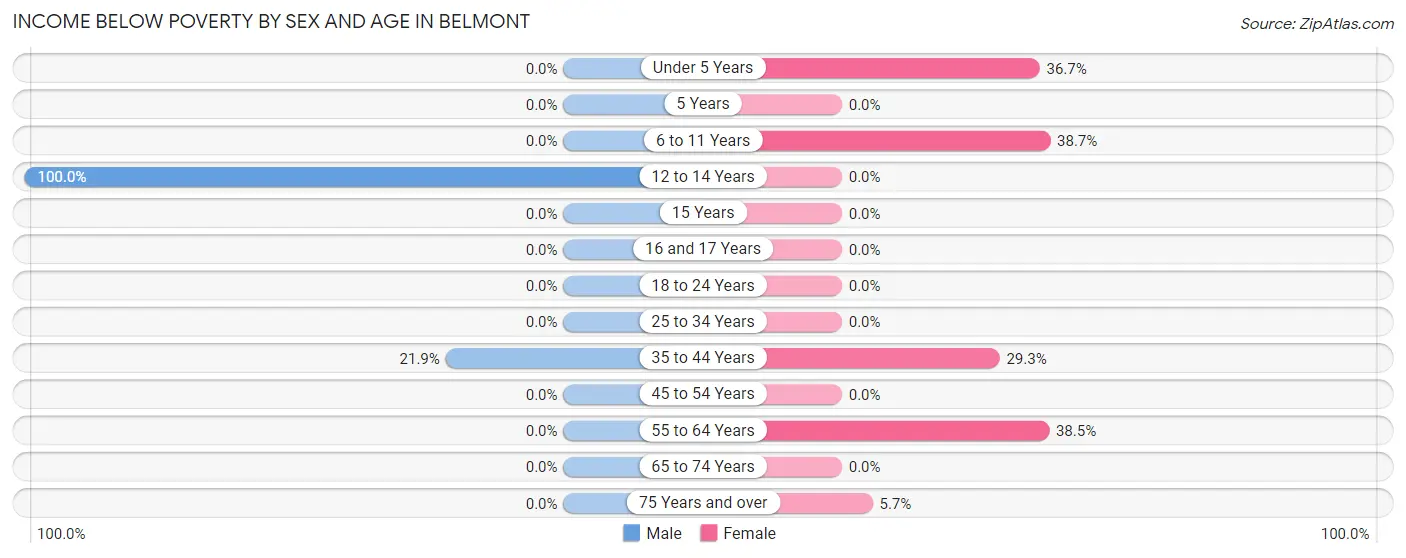
| Age Bracket | Male | Female |
| Under 5 Years | 0 (0.0%) | 29 (36.7%) |
| 5 Years | 0 (0.0%) | 0 (0.0%) |
| 6 to 11 Years | 0 (0.0%) | 29 (38.7%) |
| 12 to 14 Years | 29 (100.0%) | 0 (0.0%) |
| 15 Years | 0 (0.0%) | 0 (0.0%) |
| 16 and 17 Years | 0 (0.0%) | 0 (0.0%) |
| 18 to 24 Years | 0 (0.0%) | 0 (0.0%) |
| 25 to 34 Years | 0 (0.0%) | 0 (0.0%) |
| 35 to 44 Years | 33 (21.8%) | 24 (29.3%) |
| 45 to 54 Years | 0 (0.0%) | 0 (0.0%) |
| 55 to 64 Years | 0 (0.0%) | 20 (38.5%) |
| 65 to 74 Years | 0 (0.0%) | 0 (0.0%) |
| 75 Years and over | 0 (0.0%) | 9 (5.7%) |
| Total | 62 (12.9%) | 111 (14.4%) |
Income Above Poverty by Sex and Age in Belmont
According to the poverty statistics in Belmont, males aged 5 years and females aged 12 to 14 years are the age groups that are most secure financially, with 100.0% of males and 100.0% of females in these age groups living above the poverty line.
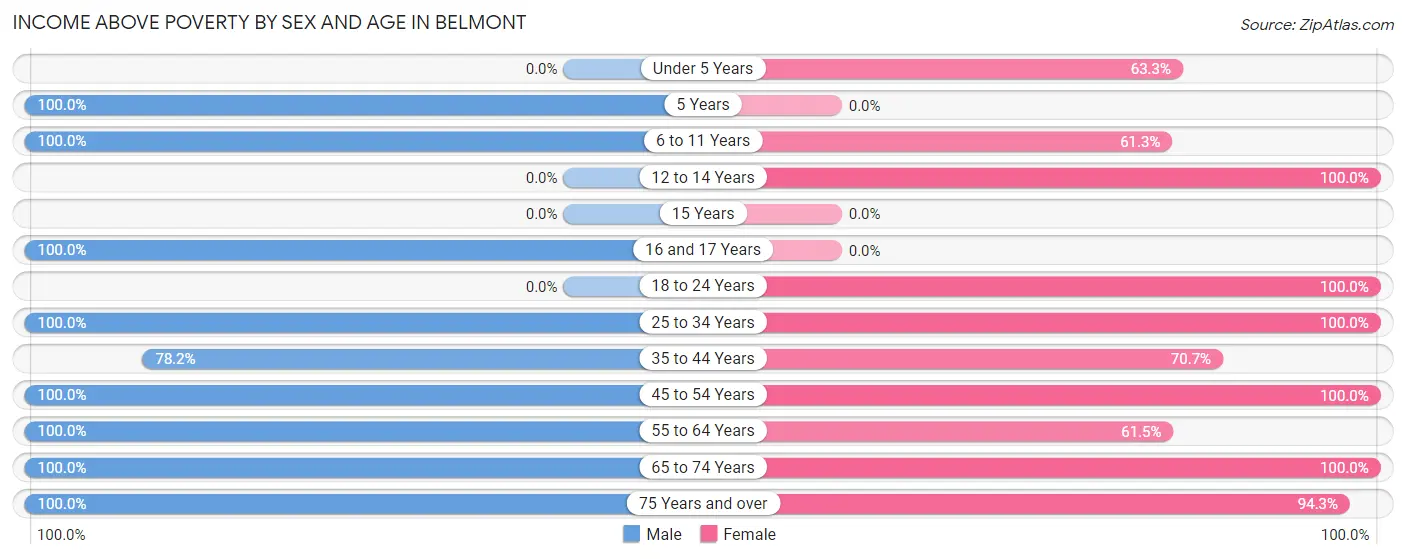
| Age Bracket | Male | Female |
| Under 5 Years | 0 (0.0%) | 50 (63.3%) |
| 5 Years | 59 (100.0%) | 0 (0.0%) |
| 6 to 11 Years | 46 (100.0%) | 46 (61.3%) |
| 12 to 14 Years | 0 (0.0%) | 58 (100.0%) |
| 15 Years | 0 (0.0%) | 0 (0.0%) |
| 16 and 17 Years | 54 (100.0%) | 0 (0.0%) |
| 18 to 24 Years | 0 (0.0%) | 68 (100.0%) |
| 25 to 34 Years | 28 (100.0%) | 25 (100.0%) |
| 35 to 44 Years | 118 (78.1%) | 58 (70.7%) |
| 45 to 54 Years | 17 (100.0%) | 120 (100.0%) |
| 55 to 64 Years | 62 (100.0%) | 32 (61.5%) |
| 65 to 74 Years | 14 (100.0%) | 52 (100.0%) |
| 75 Years and over | 22 (100.0%) | 149 (94.3%) |
| Total | 420 (87.1%) | 658 (85.6%) |
Income Below Poverty Among Married-Couple Families in Belmont
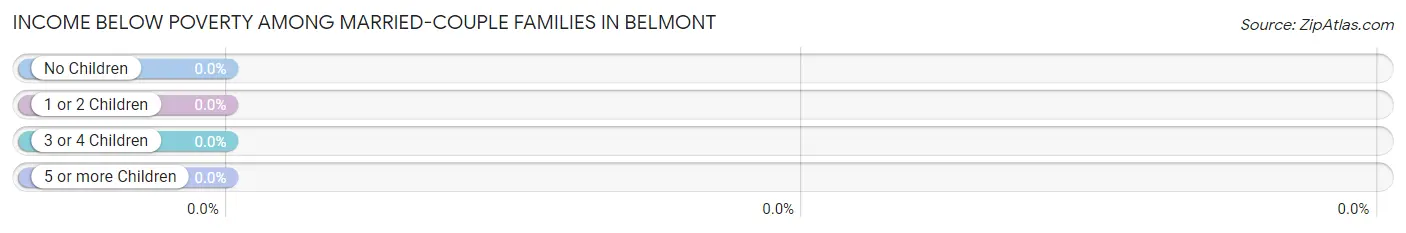
| Children | Above Poverty | Below Poverty |
| No Children | 159 (100.0%) | 0 (0.0%) |
| 1 or 2 Children | 28 (100.0%) | 0 (0.0%) |
| 3 or 4 Children | 43 (100.0%) | 0 (0.0%) |
| 5 or more Children | 0 (0.0%) | 0 (0.0%) |
| Total | 230 (100.0%) | 0 (0.0%) |
Income Below Poverty Among Single-Parent Households in Belmont
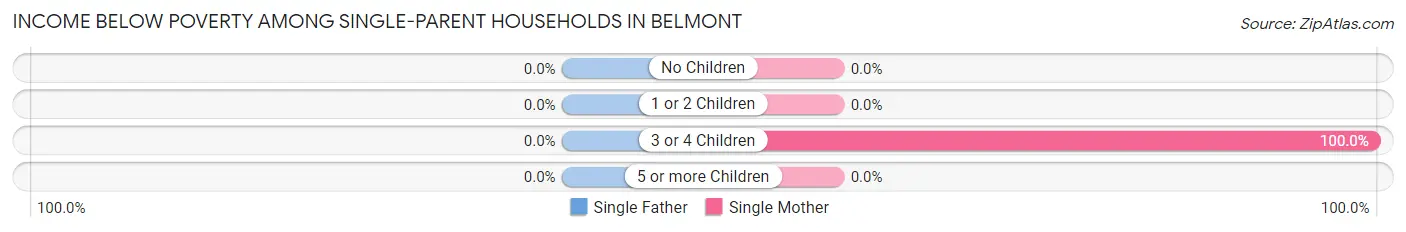
| Children | Single Father | Single Mother |
| No Children | 0 (0.0%) | 0 (0.0%) |
| 1 or 2 Children | 0 (0.0%) | 0 (0.0%) |
| 3 or 4 Children | 0 (0.0%) | 24 (100.0%) |
| 5 or more Children | 0 (0.0%) | 0 (0.0%) |
| Total | 0 (0.0%) | 24 (40.7%) |
Income Below Poverty Among Married-Couple vs Single-Parent Households in Belmont
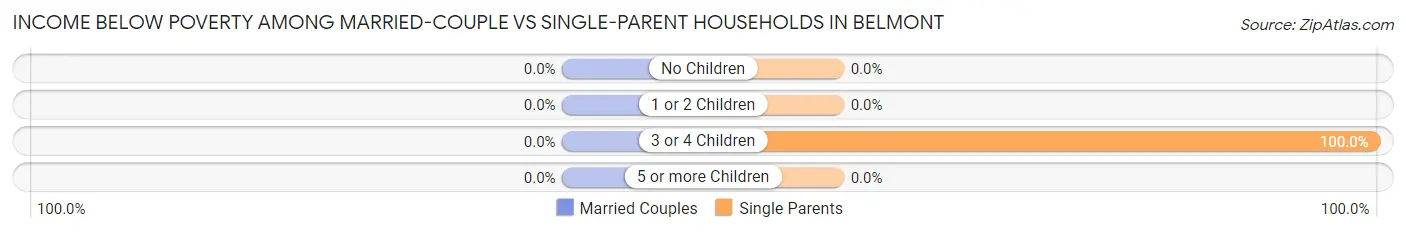
| Children | Married-Couple Families | Single-Parent Households |
| No Children | 0 (0.0%) | 0 (0.0%) |
| 1 or 2 Children | 0 (0.0%) | 0 (0.0%) |
| 3 or 4 Children | 0 (0.0%) | 24 (100.0%) |
| 5 or more Children | 0 (0.0%) | 0 (0.0%) |
| Total | 0 (0.0%) | 24 (40.7%) |
Race in Belmont
The most populous races in Belmont are White / Caucasian (1,140 | 91.0%), Black / African American (111 | 8.9%), and Hispanic or Latino (111 | 8.9%).
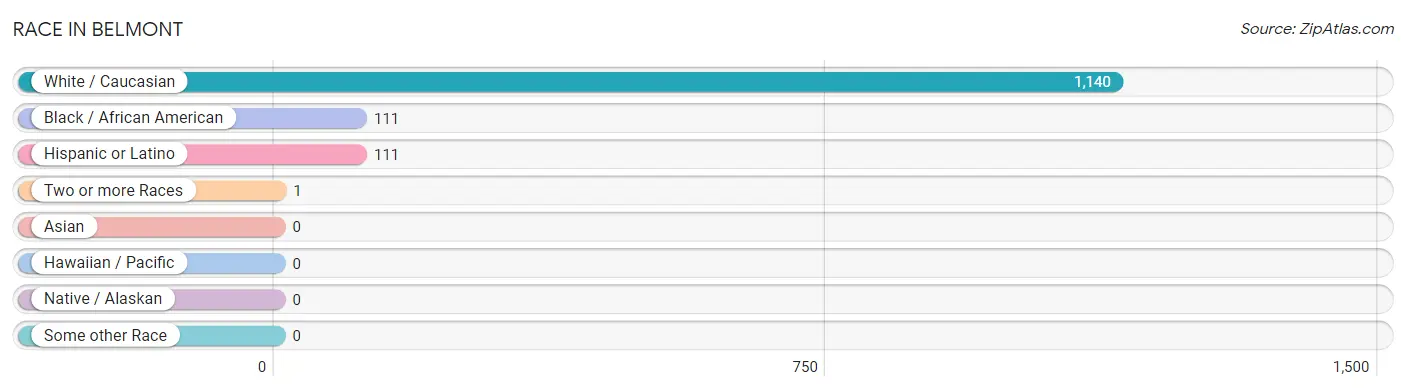
| Race | # Population | % Population |
| Asian | 0 | 0.0% |
| Black / African American | 111 | 8.9% |
| Hawaiian / Pacific | 0 | 0.0% |
| Hispanic or Latino | 111 | 8.9% |
| Native / Alaskan | 0 | 0.0% |
| White / Caucasian | 1,140 | 91.0% |
| Two or more Races | 1 | 0.1% |
| Some other Race | 0 | 0.0% |
| Total | 1,252 | 100.0% |
Ancestry in Belmont
The most populous ancestries reported in Belmont are French (198 | 15.8%), American (169 | 13.5%), Scottish (143 | 11.4%), Irish (126 | 10.1%), and Puerto Rican (111 | 8.9%), together accounting for 59.7% of all Belmont residents.
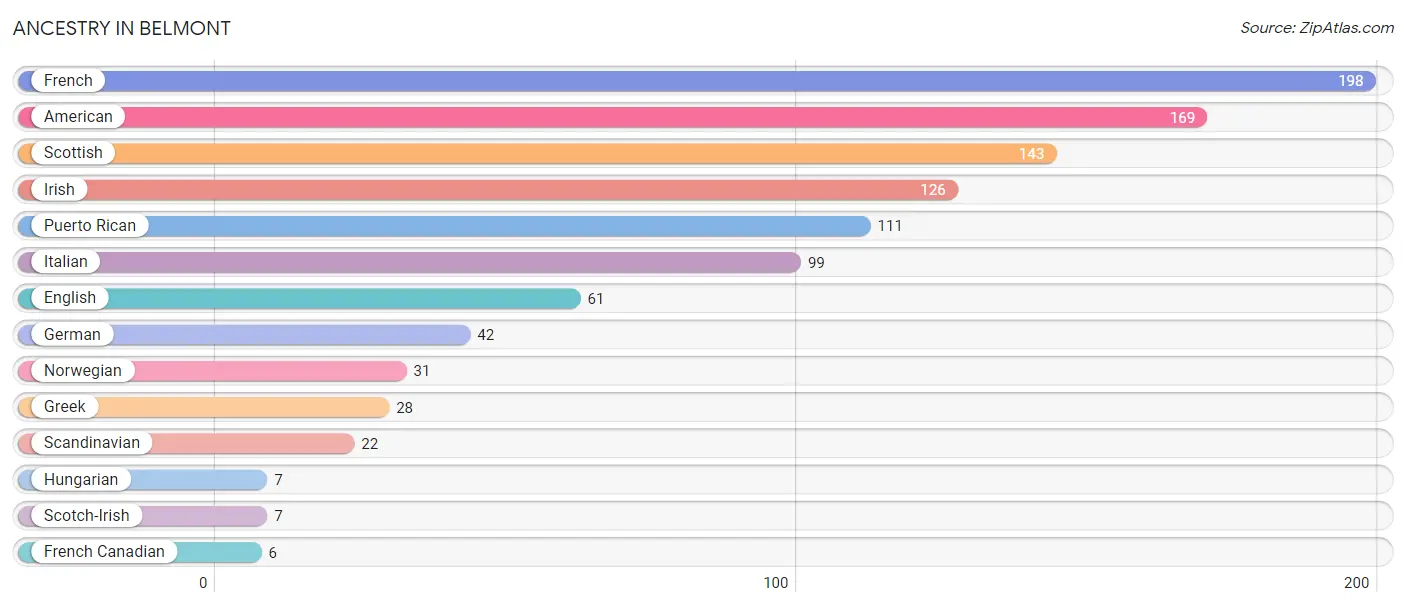
| Ancestry | # Population | % Population |
| American | 169 | 13.5% |
| English | 61 | 4.9% |
| French | 198 | 15.8% |
| French Canadian | 6 | 0.5% |
| German | 42 | 3.4% |
| Greek | 28 | 2.2% |
| Hungarian | 7 | 0.6% |
| Irish | 126 | 10.1% |
| Italian | 99 | 7.9% |
| Norwegian | 31 | 2.5% |
| Puerto Rican | 111 | 8.9% |
| Scandinavian | 22 | 1.8% |
| Scotch-Irish | 7 | 0.6% |
| Scottish | 143 | 11.4% | View All 14 Rows |
Immigrants in Belmont
The most numerous immigrant groups reported in Belmont came from , and Canada (1 | 0.1%), together accounting for 0.1% of all Belmont residents.

| Immigration Origin | # Population | % Population |
| Canada | 1 | 0.1% | View All 1 Rows |
Sex and Age in Belmont
Sex and Age in Belmont
The most populous age groups in Belmont are 40 to 44 Years (118 | 24.5%) for men and 75 to 79 Years (149 | 19.4%) for women.
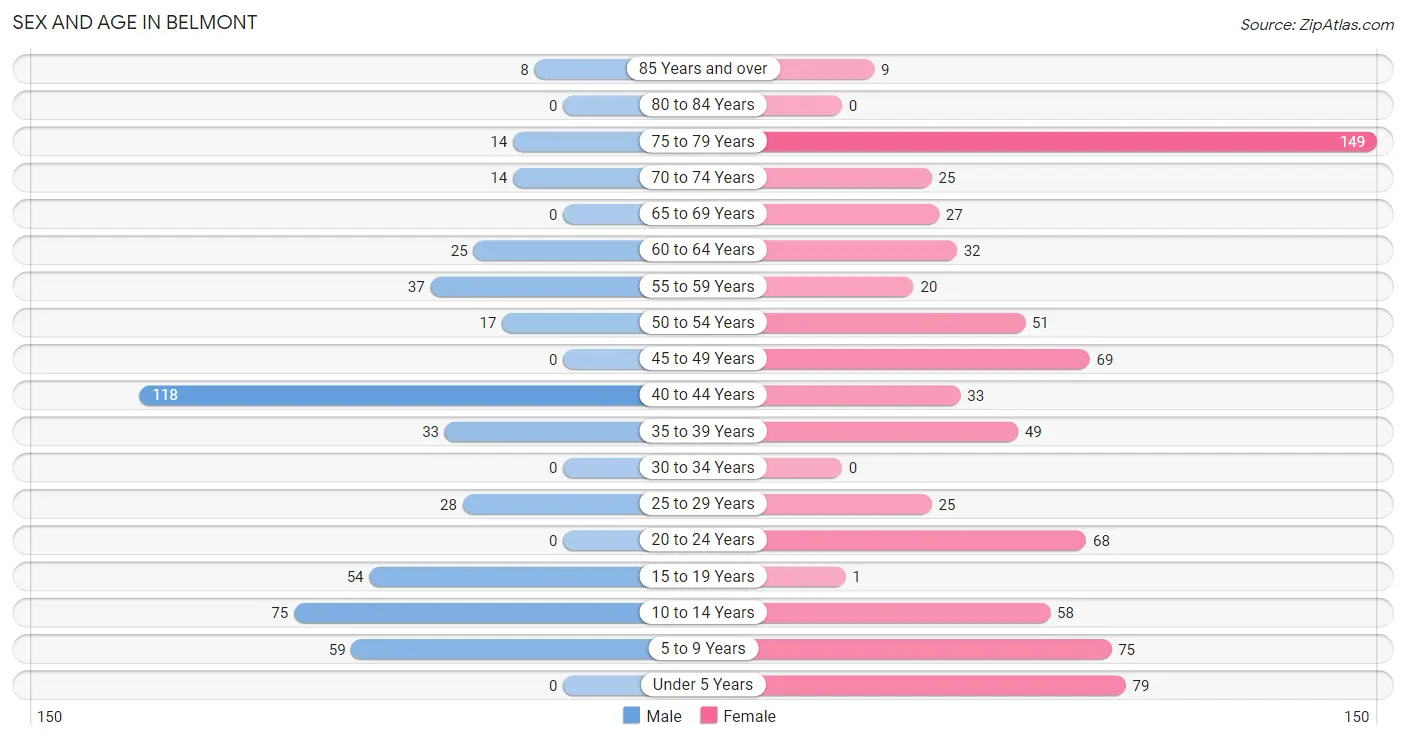
| Age Bracket | Male | Female |
| Under 5 Years | 0 (0.0%) | 79 (10.3%) |
| 5 to 9 Years | 59 (12.2%) | 75 (9.7%) |
| 10 to 14 Years | 75 (15.6%) | 58 (7.5%) |
| 15 to 19 Years | 54 (11.2%) | 1 (0.1%) |
| 20 to 24 Years | 0 (0.0%) | 68 (8.8%) |
| 25 to 29 Years | 28 (5.8%) | 25 (3.3%) |
| 30 to 34 Years | 0 (0.0%) | 0 (0.0%) |
| 35 to 39 Years | 33 (6.9%) | 49 (6.4%) |
| 40 to 44 Years | 118 (24.5%) | 33 (4.3%) |
| 45 to 49 Years | 0 (0.0%) | 69 (9.0%) |
| 50 to 54 Years | 17 (3.5%) | 51 (6.6%) |
| 55 to 59 Years | 37 (7.7%) | 20 (2.6%) |
| 60 to 64 Years | 25 (5.2%) | 32 (4.2%) |
| 65 to 69 Years | 0 (0.0%) | 27 (3.5%) |
| 70 to 74 Years | 14 (2.9%) | 25 (3.3%) |
| 75 to 79 Years | 14 (2.9%) | 149 (19.4%) |
| 80 to 84 Years | 0 (0.0%) | 0 (0.0%) |
| 85 Years and over | 8 (1.7%) | 9 (1.2%) |
| Total | 482 (100.0%) | 770 (100.0%) |
Families and Households in Belmont
Median Family Size in Belmont
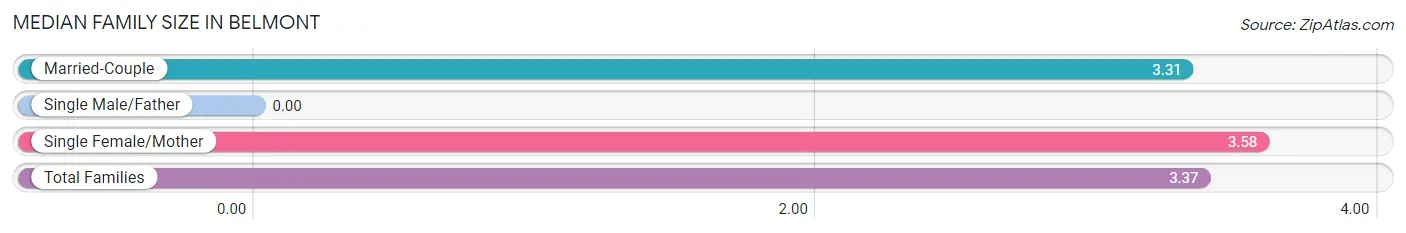
| Family Type | # Families | Family Size |
| Married-Couple | 230 (79.6%) | 3.31 |
| Single Male/Father | 0 (0.0%) | - |
| Single Female/Mother | 59 (20.4%) | 3.58 |
| Total Families | 289 (100.0%) | 3.37 |
Median Household Size in Belmont
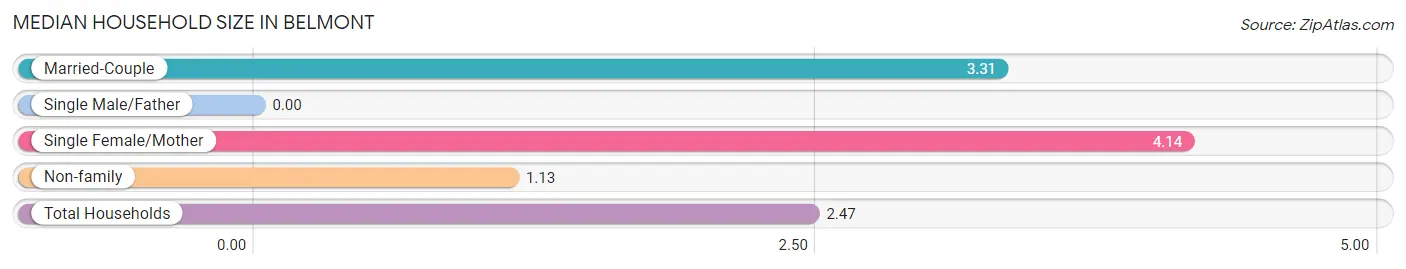
| Household Type | # Households | Household Size |
| Married-Couple | 230 (45.5%) | 3.31 |
| Single Male/Father | 0 (0.0%) | - |
| Single Female/Mother | 59 (11.7%) | 4.14 |
| Non-family | 217 (42.9%) | 1.13 |
| Total Households | 506 (100.0%) | 2.47 |
Household Size by Marriage Status in Belmont
Out of a total of 506 households in Belmont, 289 (57.1%) are family households, while 217 (42.9%) are nonfamily households. The most numerous type of family households are 2-person households, comprising 104, and the most common type of nonfamily households are 1-person households, comprising 195.
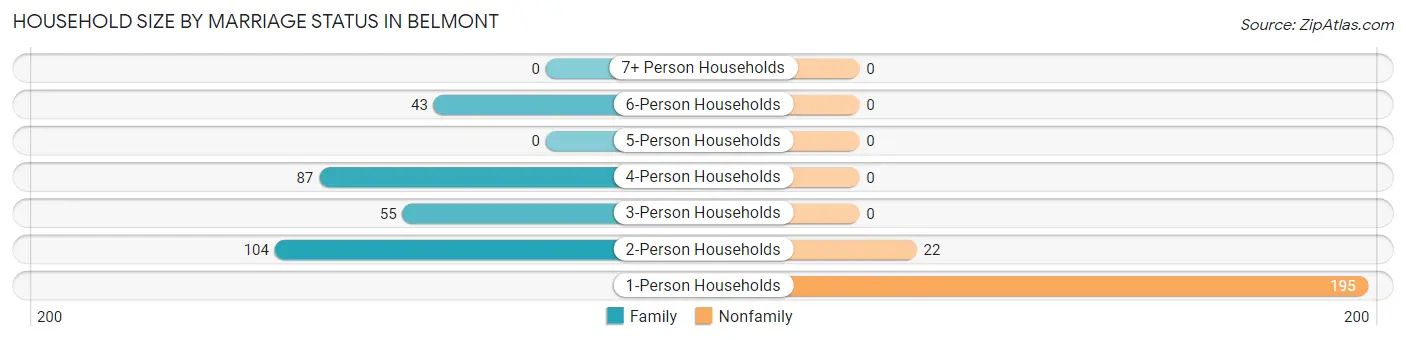
| Household Size | Family Households | Nonfamily Households |
| 1-Person Households | - | 195 (38.5%) |
| 2-Person Households | 104 (20.5%) | 22 (4.3%) |
| 3-Person Households | 55 (10.9%) | 0 (0.0%) |
| 4-Person Households | 87 (17.2%) | 0 (0.0%) |
| 5-Person Households | 0 (0.0%) | 0 (0.0%) |
| 6-Person Households | 43 (8.5%) | 0 (0.0%) |
| 7+ Person Households | 0 (0.0%) | 0 (0.0%) |
| Total | 289 (57.1%) | 217 (42.9%) |
Female Fertility in Belmont
Fertility by Age in Belmont
| Age Bracket | Women with Births | Births / 1,000 Women |
| 15 to 19 years | 0 (0.0%) | 0.0 |
| 20 to 34 years | 0 (0.0%) | 0.0 |
| 35 to 50 years | 0 (0.0%) | 0.0 |
| Total | 0 (0.0%) | 0.0 |
Fertility by Age by Marriage Status in Belmont
| Age Bracket | Married | Unmarried |
| 15 to 19 years | 0 (0.0%) | 0 (0.0%) |
| 20 to 34 years | 0 (0.0%) | 0 (0.0%) |
| 35 to 50 years | 0 (0.0%) | 0 (0.0%) |
| Total | 0 (0.0%) | 0 (0.0%) |
Fertility by Education in Belmont
| Educational Attainment | Women with Births | Births / 1,000 Women |
| Less than High School | 0 (0.0%) | 0.0 |
| High School Diploma | 0 (0.0%) | 0.0 |
| College or Associate's Degree | 0 (0.0%) | 0.0 |
| Bachelor's Degree | 0 (0.0%) | 0.0 |
| Graduate Degree | 0 (0.0%) | 0.0 |
| Total | 0 (0.0%) | 0.0 |
Fertility by Education by Marriage Status in Belmont
| Educational Attainment | Married | Unmarried |
| Less than High School | 0 (0.0%) | 0 (0.0%) |
| High School Diploma | 0 (0.0%) | 0 (0.0%) |
| College or Associate's Degree | 0 (0.0%) | 0 (0.0%) |
| Bachelor's Degree | 0 (0.0%) | 0 (0.0%) |
| Graduate Degree | 0 (0.0%) | 0 (0.0%) |
| Total | 0 (0.0%) | 0 (0.0%) |
Employment Characteristics in Belmont
Employment by Class of Employer in Belmont
Among the 565 employed individuals in Belmont, private company employees (394 | 69.7%), self-employed (not incorporated) (67 | 11.9%), and local government employees (58 | 10.3%) make up the most common classes of employment.
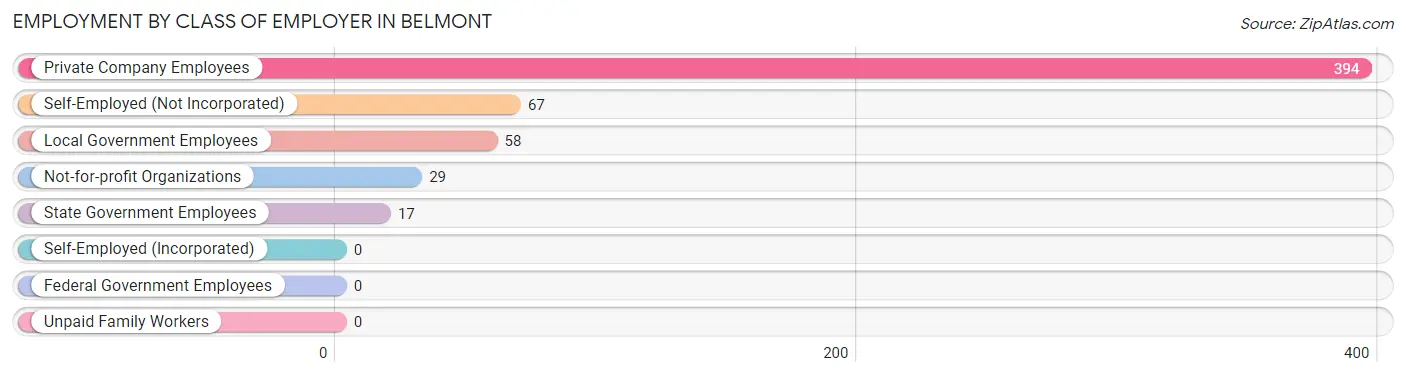
| Employer Class | # Employees | % Employees |
| Private Company Employees | 394 | 69.7% |
| Self-Employed (Incorporated) | 0 | 0.0% |
| Self-Employed (Not Incorporated) | 67 | 11.9% |
| Not-for-profit Organizations | 29 | 5.1% |
| Local Government Employees | 58 | 10.3% |
| State Government Employees | 17 | 3.0% |
| Federal Government Employees | 0 | 0.0% |
| Unpaid Family Workers | 0 | 0.0% |
| Total | 565 | 100.0% |
Employment Status by Age in Belmont
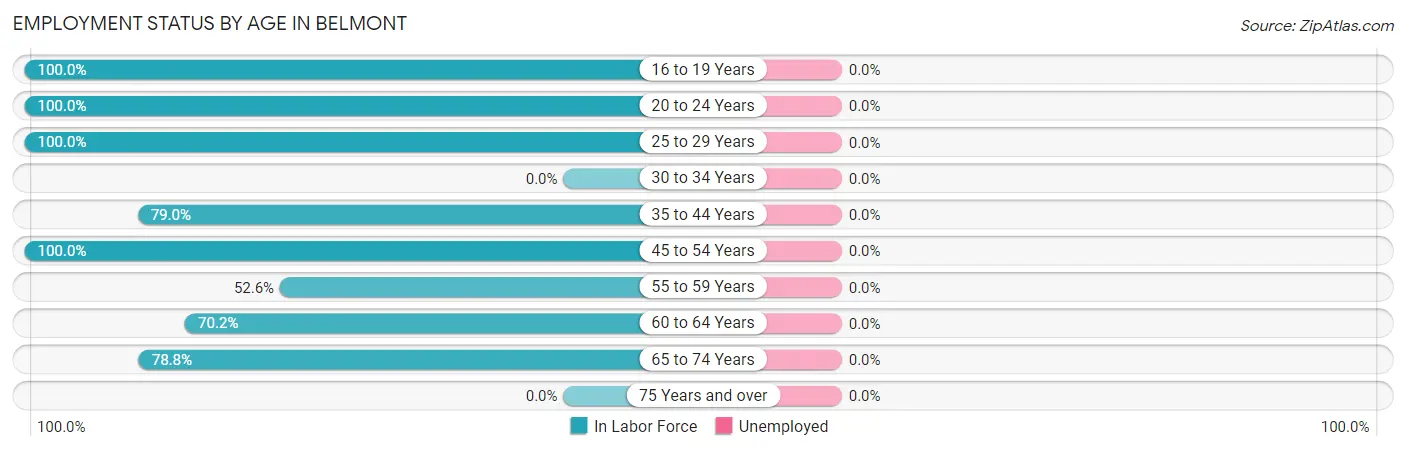
| Age Bracket | In Labor Force | Unemployed |
| 16 to 19 Years | 55 (100.0%) | 0 (0.0%) |
| 20 to 24 Years | 68 (100.0%) | 0 (0.0%) |
| 25 to 29 Years | 53 (100.0%) | 0 (0.0%) |
| 30 to 34 Years | 0 (0.0%) | 0 (0.0%) |
| 35 to 44 Years | 184 (79.0%) | 0 (0.0%) |
| 45 to 54 Years | 137 (100.0%) | 0 (0.0%) |
| 55 to 59 Years | 30 (52.6%) | 0 (0.0%) |
| 60 to 64 Years | 40 (70.2%) | 0 (0.0%) |
| 65 to 74 Years | 52 (78.8%) | 0 (0.0%) |
| 75 Years and over | 0 (0.0%) | 0 (0.0%) |
| Total | 619 (68.3%) | 0 (0.0%) |
Employment Status by Educational Attainment in Belmont
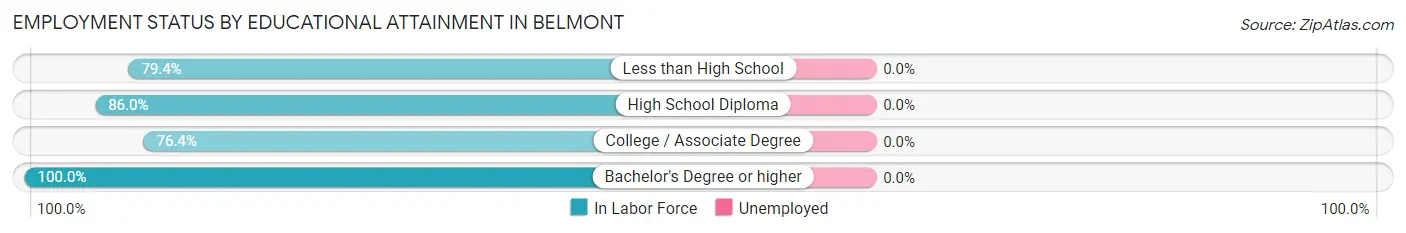
| Educational Attainment | In Labor Force | Unemployed |
| Less than High School | 77 (79.4%) | 0 (0.0%) |
| High School Diploma | 148 (86.0%) | 0 (0.0%) |
| College / Associate Degree | 159 (76.4%) | 0 (0.0%) |
| Bachelor's Degree or higher | 60 (100.0%) | 0 (0.0%) |
| Total | 444 (82.7%) | 0 (0.0%) |
Employment Occupations by Sex in Belmont
Management, Business, Science and Arts Occupations
The most common Management, Business, Science and Arts occupations in Belmont are Community & Social Service (55 | 8.9%), Health Diagnosing & Treating (53 | 8.6%), Education Instruction & Library (28 | 4.5%), Legal Services & Support (27 | 4.4%), and Business & Financial (25 | 4.0%).
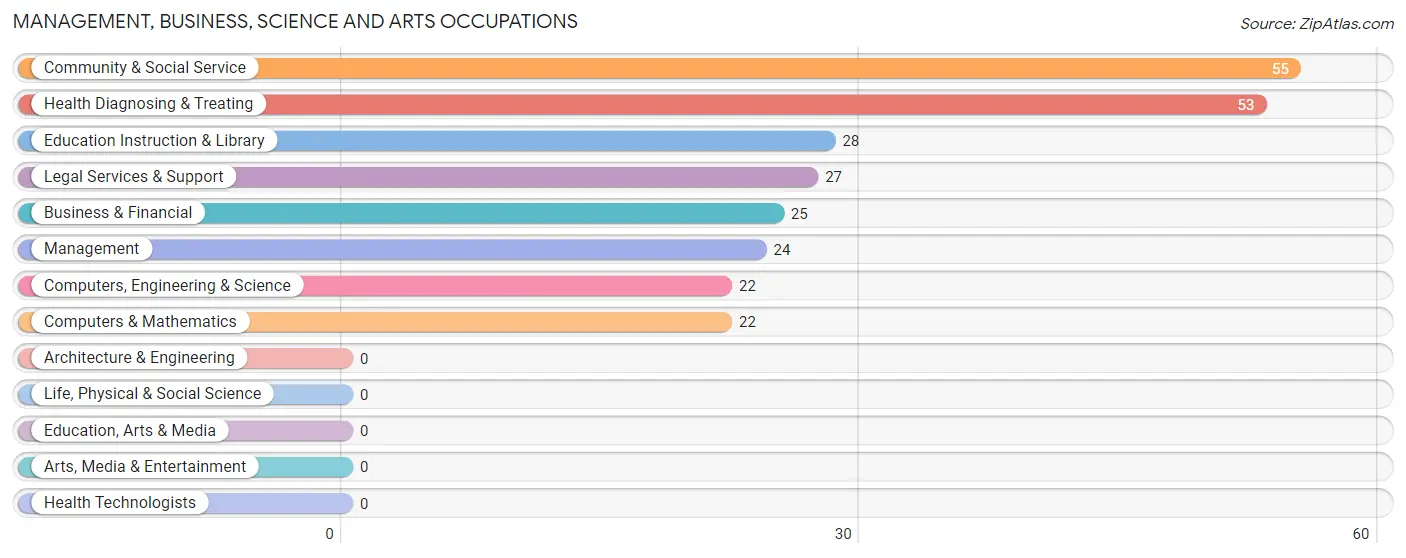
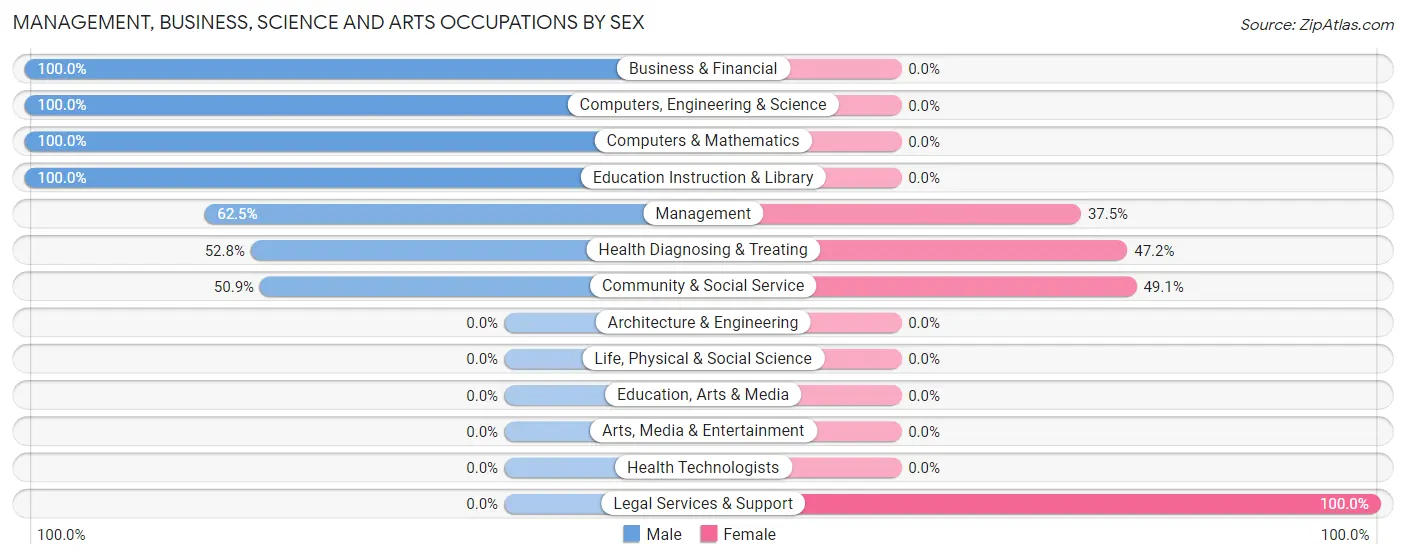
Management, Business, Science and Arts Occupations by Sex
Within the Management, Business, Science and Arts occupations in Belmont, the most male-oriented occupations are Business & Financial (100.0%), Computers, Engineering & Science (100.0%), and Computers & Mathematics (100.0%), while the most female-oriented occupations are Legal Services & Support (100.0%), Community & Social Service (49.1%), and Health Diagnosing & Treating (47.2%).
| Occupation | Male | Female |
| Management | 15 (62.5%) | 9 (37.5%) |
| Business & Financial | 25 (100.0%) | 0 (0.0%) |
| Computers, Engineering & Science | 22 (100.0%) | 0 (0.0%) |
| Computers & Mathematics | 22 (100.0%) | 0 (0.0%) |
| Architecture & Engineering | 0 (0.0%) | 0 (0.0%) |
| Life, Physical & Social Science | 0 (0.0%) | 0 (0.0%) |
| Community & Social Service | 28 (50.9%) | 27 (49.1%) |
| Education, Arts & Media | 0 (0.0%) | 0 (0.0%) |
| Legal Services & Support | 0 (0.0%) | 27 (100.0%) |
| Education Instruction & Library | 28 (100.0%) | 0 (0.0%) |
| Arts, Media & Entertainment | 0 (0.0%) | 0 (0.0%) |
| Health Diagnosing & Treating | 28 (52.8%) | 25 (47.2%) |
| Health Technologists | 0 (0.0%) | 0 (0.0%) |
| Total (Category) | 118 (65.9%) | 61 (34.1%) |
| Total (Overall) | 305 (49.3%) | 314 (50.7%) |
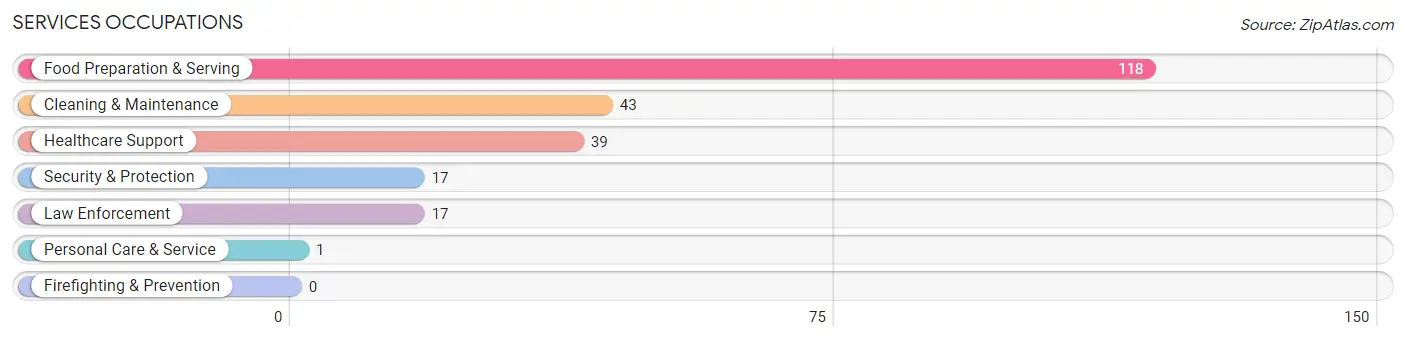
Services Occupations
The most common Services occupations in Belmont are Food Preparation & Serving (118 | 19.1%), Cleaning & Maintenance (43 | 7.0%), Healthcare Support (39 | 6.3%), Security & Protection (17 | 2.8%), and Law Enforcement (17 | 2.8%).
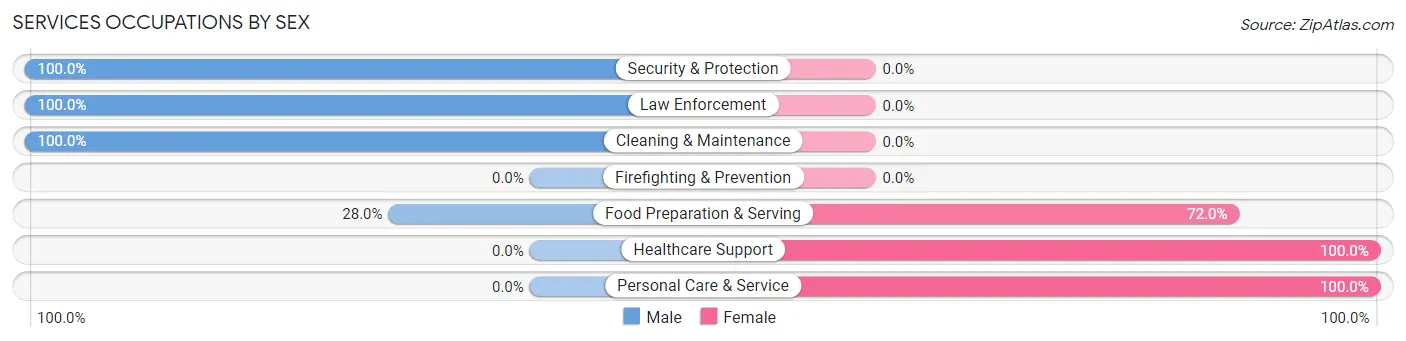
Services Occupations by Sex
Within the Services occupations in Belmont, the most male-oriented occupations are Security & Protection (100.0%), Law Enforcement (100.0%), and Cleaning & Maintenance (100.0%), while the most female-oriented occupations are Healthcare Support (100.0%), Personal Care & Service (100.0%), and Food Preparation & Serving (72.0%).
| Occupation | Male | Female |
| Healthcare Support | 0 (0.0%) | 39 (100.0%) |
| Security & Protection | 17 (100.0%) | 0 (0.0%) |
| Firefighting & Prevention | 0 (0.0%) | 0 (0.0%) |
| Law Enforcement | 17 (100.0%) | 0 (0.0%) |
| Food Preparation & Serving | 33 (28.0%) | 85 (72.0%) |
| Cleaning & Maintenance | 43 (100.0%) | 0 (0.0%) |
| Personal Care & Service | 0 (0.0%) | 1 (100.0%) |
| Total (Category) | 93 (42.7%) | 125 (57.3%) |
| Total (Overall) | 305 (49.3%) | 314 (50.7%) |
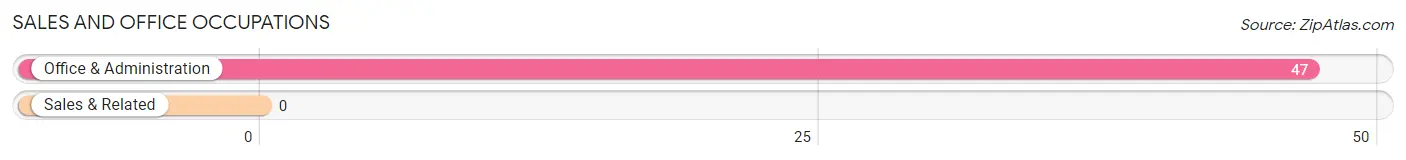
Sales and Office Occupations
The most common Sales and Office occupations in Belmont are , and Office & Administration (47 | 7.6%).
Sales and Office Occupations by Sex

| Occupation | Male | Female |
| Sales & Related | 0 (0.0%) | 0 (0.0%) |
| Office & Administration | 0 (0.0%) | 47 (100.0%) |
| Total (Category) | 0 (0.0%) | 47 (100.0%) |
| Total (Overall) | 305 (49.3%) | 314 (50.7%) |
Natural Resources, Construction and Maintenance Occupations
The most common Natural Resources, Construction and Maintenance occupations in Belmont are , and Construction & Extraction (10 | 1.6%).
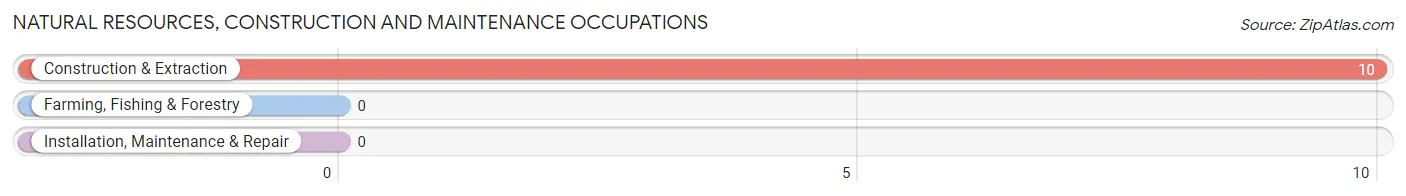
Natural Resources, Construction and Maintenance Occupations by Sex
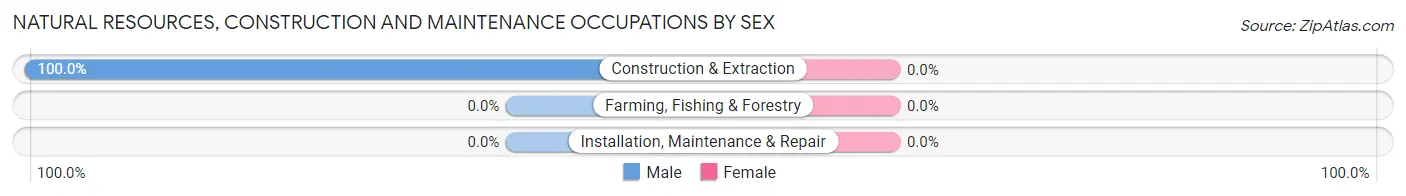
| Occupation | Male | Female |
| Farming, Fishing & Forestry | 0 (0.0%) | 0 (0.0%) |
| Construction & Extraction | 10 (100.0%) | 0 (0.0%) |
| Installation, Maintenance & Repair | 0 (0.0%) | 0 (0.0%) |
| Total (Category) | 10 (100.0%) | 0 (0.0%) |
| Total (Overall) | 305 (49.3%) | 314 (50.7%) |
Production, Transportation and Moving Occupations
The most common Production, Transportation and Moving occupations in Belmont are Material Moving (101 | 16.3%), and Production (64 | 10.3%).
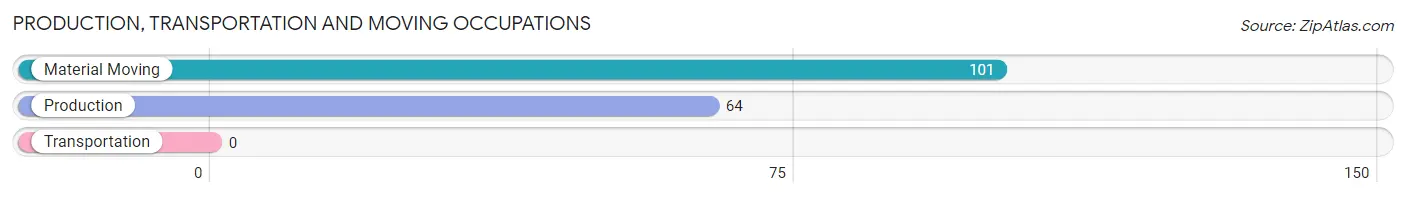
Production, Transportation and Moving Occupations by Sex
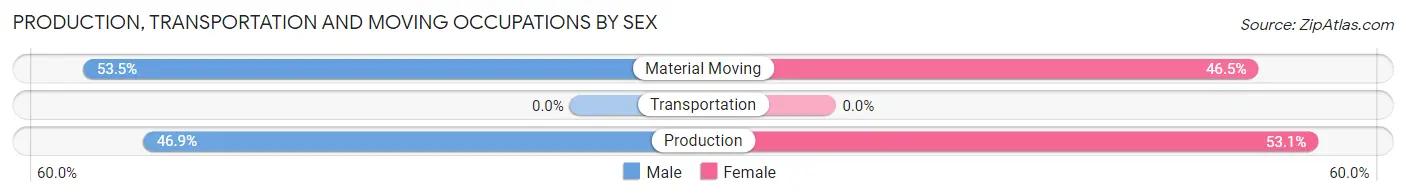
| Occupation | Male | Female |
| Production | 30 (46.9%) | 34 (53.1%) |
| Transportation | 0 (0.0%) | 0 (0.0%) |
| Material Moving | 54 (53.5%) | 47 (46.5%) |
| Total (Category) | 84 (50.9%) | 81 (49.1%) |
| Total (Overall) | 305 (49.3%) | 314 (50.7%) |
Employment Industries by Sex in Belmont
Employment Industries in Belmont
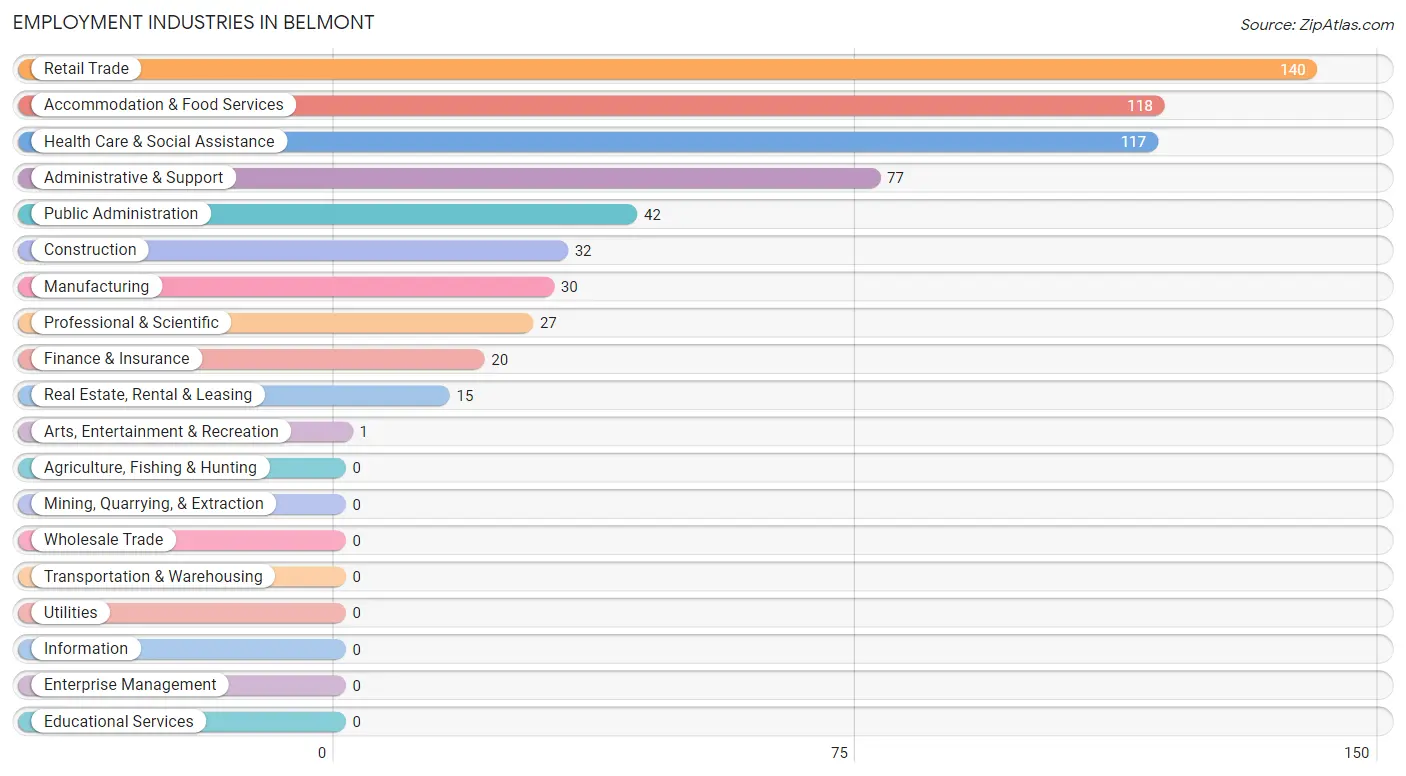
The major employment industries in Belmont include Retail Trade (140 | 22.6%), Accommodation & Food Services (118 | 19.1%), Health Care & Social Assistance (117 | 18.9%), Administrative & Support (77 | 12.4%), and Public Administration (42 | 6.8%).
Employment Industries by Sex in Belmont
The Belmont industries that see more men than women are Construction (100.0%), Manufacturing (100.0%), and Real Estate, Rental & Leasing (100.0%), whereas the industries that tend to have a higher number of women are Finance & Insurance (100.0%), Professional & Scientific (100.0%), and Arts, Entertainment & Recreation (100.0%).
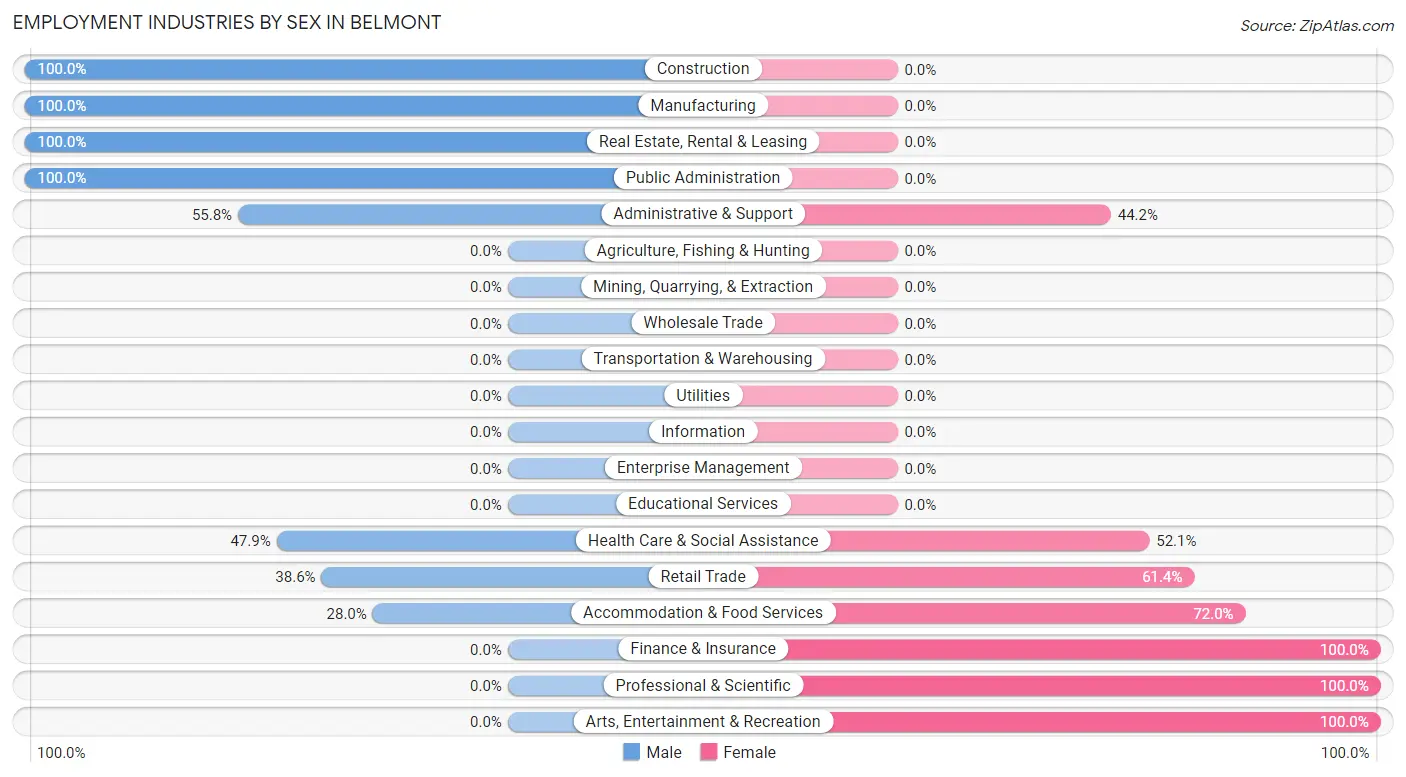
| Industry | Male | Female |
| Agriculture, Fishing & Hunting | 0 (0.0%) | 0 (0.0%) |
| Mining, Quarrying, & Extraction | 0 (0.0%) | 0 (0.0%) |
| Construction | 32 (100.0%) | 0 (0.0%) |
| Manufacturing | 30 (100.0%) | 0 (0.0%) |
| Wholesale Trade | 0 (0.0%) | 0 (0.0%) |
| Retail Trade | 54 (38.6%) | 86 (61.4%) |
| Transportation & Warehousing | 0 (0.0%) | 0 (0.0%) |
| Utilities | 0 (0.0%) | 0 (0.0%) |
| Information | 0 (0.0%) | 0 (0.0%) |
| Finance & Insurance | 0 (0.0%) | 20 (100.0%) |
| Real Estate, Rental & Leasing | 15 (100.0%) | 0 (0.0%) |
| Professional & Scientific | 0 (0.0%) | 27 (100.0%) |
| Enterprise Management | 0 (0.0%) | 0 (0.0%) |
| Administrative & Support | 43 (55.8%) | 34 (44.2%) |
| Educational Services | 0 (0.0%) | 0 (0.0%) |
| Health Care & Social Assistance | 56 (47.9%) | 61 (52.1%) |
| Arts, Entertainment & Recreation | 0 (0.0%) | 1 (100.0%) |
| Accommodation & Food Services | 33 (28.0%) | 85 (72.0%) |
| Public Administration | 42 (100.0%) | 0 (0.0%) |
| Total | 305 (49.3%) | 314 (50.7%) |
Education in Belmont
School Enrollment in Belmont
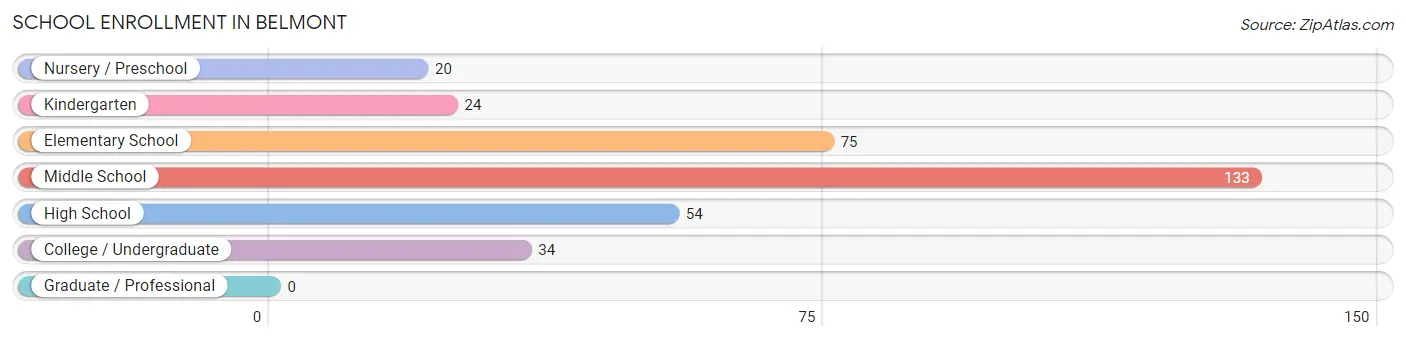
The most common levels of schooling among the 340 students in Belmont are middle school (133 | 39.1%), elementary school (75 | 22.1%), and high school (54 | 15.9%).
| School Level | # Students | % Students |
| Nursery / Preschool | 20 | 5.9% |
| Kindergarten | 24 | 7.1% |
| Elementary School | 75 | 22.1% |
| Middle School | 133 | 39.1% |
| High School | 54 | 15.9% |
| College / Undergraduate | 34 | 10.0% |
| Graduate / Professional | 0 | 0.0% |
| Total | 340 | 100.0% |
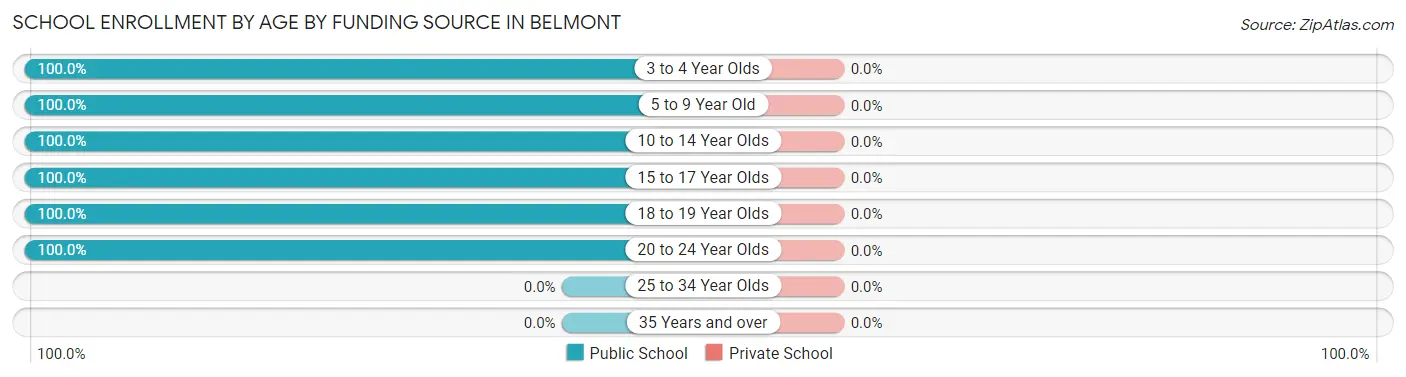
School Enrollment by Age by Funding Source in Belmont
| Age Bracket | Public School | Private School |
| 3 to 4 Year Olds | 20 (100.0%) | 0 (0.0%) |
| 5 to 9 Year Old | 99 (100.0%) | 0 (0.0%) |
| 10 to 14 Year Olds | 133 (100.0%) | 0 (0.0%) |
| 15 to 17 Year Olds | 54 (100.0%) | 0 (0.0%) |
| 18 to 19 Year Olds | 1 (100.0%) | 0 (0.0%) |
| 20 to 24 Year Olds | 33 (100.0%) | 0 (0.0%) |
| 25 to 34 Year Olds | 0 (0.0%) | 0 (0.0%) |
| 35 Years and over | 0 (0.0%) | 0 (0.0%) |
| Total | 340 (100.0%) | 0 (0.0%) |
Educational Attainment by Field of Study in Belmont
Computers & mathematics (28 | 46.7%), arts & humanities (17 | 28.3%), and bio, nature & agricultural (15 | 25.0%) are the most common fields of study among 60 individuals in Belmont who have obtained a bachelor's degree or higher.
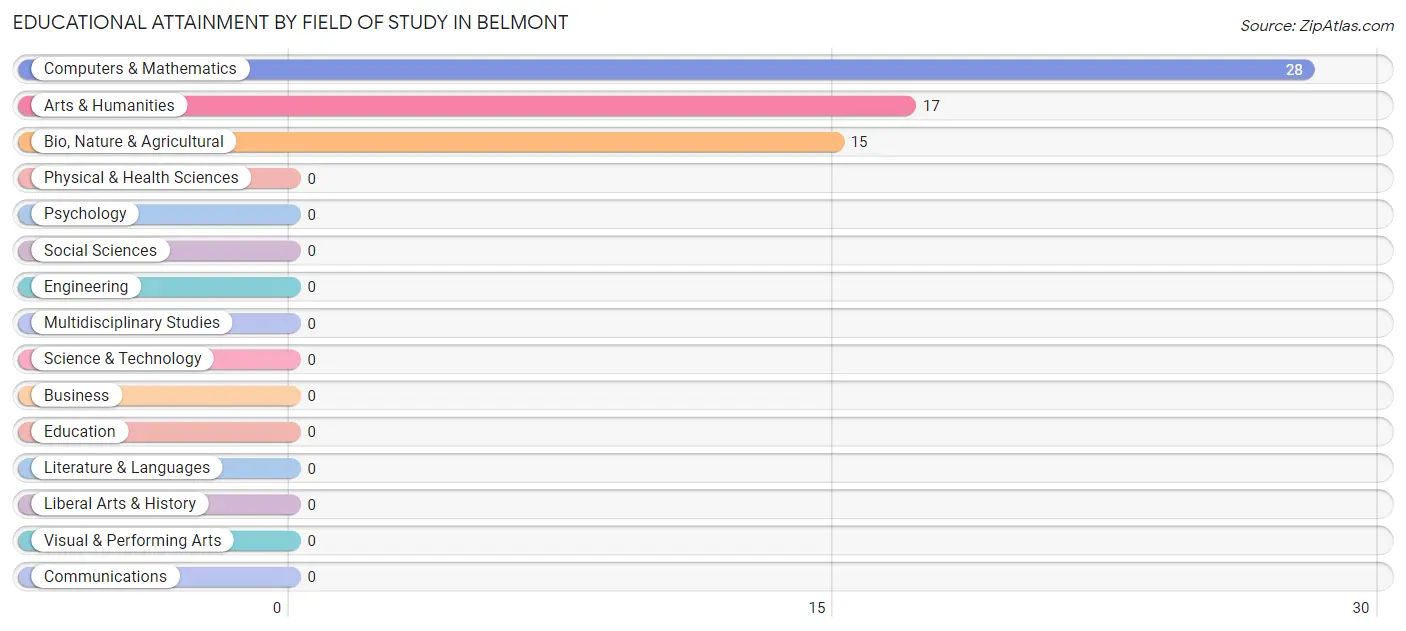
| Field of Study | # Graduates | % Graduates |
| Computers & Mathematics | 28 | 46.7% |
| Bio, Nature & Agricultural | 15 | 25.0% |
| Physical & Health Sciences | 0 | 0.0% |
| Psychology | 0 | 0.0% |
| Social Sciences | 0 | 0.0% |
| Engineering | 0 | 0.0% |
| Multidisciplinary Studies | 0 | 0.0% |
| Science & Technology | 0 | 0.0% |
| Business | 0 | 0.0% |
| Education | 0 | 0.0% |
| Literature & Languages | 0 | 0.0% |
| Liberal Arts & History | 0 | 0.0% |
| Visual & Performing Arts | 0 | 0.0% |
| Communications | 0 | 0.0% |
| Arts & Humanities | 17 | 28.3% |
| Total | 60 | 100.0% |
Transportation & Commute in Belmont
Vehicle Availability by Sex in Belmont
The most prevalent vehicle ownership categories in Belmont are males with 3 vehicles (121, accounting for 48.2%) and females with 3 vehicles (158, making up 38.7%).
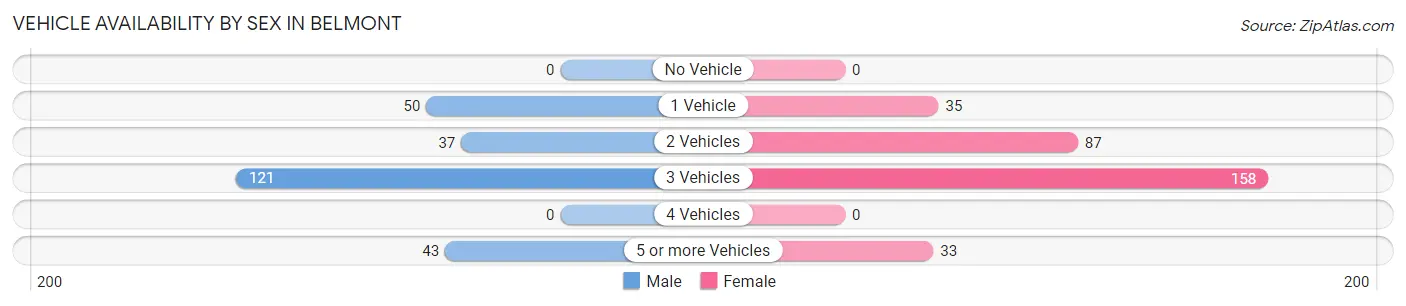
| Vehicles Available | Male | Female |
| No Vehicle | 0 (0.0%) | 0 (0.0%) |
| 1 Vehicle | 50 (19.9%) | 35 (11.2%) |
| 2 Vehicles | 37 (14.7%) | 87 (27.8%) |
| 3 Vehicles | 121 (48.2%) | 158 (50.5%) |
| 4 Vehicles | 0 (0.0%) | 0 (0.0%) |
| 5 or more Vehicles | 43 (17.1%) | 33 (10.5%) |
| Total | 251 (100.0%) | 313 (100.0%) |
Commute Time in Belmont
The most frequently occuring commute durations in Belmont are 15 to 19 minutes (200 commuters, 37.9%), 30 to 34 minutes (120 commuters, 22.7%), and 60 to 89 minutes (53 commuters, 10.0%).

| Commute Time | # Commuters | % Commuters |
| Less than 5 Minutes | 17 | 3.2% |
| 5 to 9 Minutes | 0 | 0.0% |
| 10 to 14 Minutes | 51 | 9.7% |
| 15 to 19 Minutes | 200 | 37.9% |
| 20 to 24 Minutes | 28 | 5.3% |
| 25 to 29 Minutes | 0 | 0.0% |
| 30 to 34 Minutes | 120 | 22.7% |
| 35 to 39 Minutes | 0 | 0.0% |
| 40 to 44 Minutes | 14 | 2.6% |
| 45 to 59 Minutes | 45 | 8.5% |
| 60 to 89 Minutes | 53 | 10.0% |
| 90 or more Minutes | 0 | 0.0% |
Commute Time by Sex in Belmont
The most common commute times in Belmont are 15 to 19 minutes (76 commuters, 35.5%) for males and 15 to 19 minutes (124 commuters, 39.5%) for females.
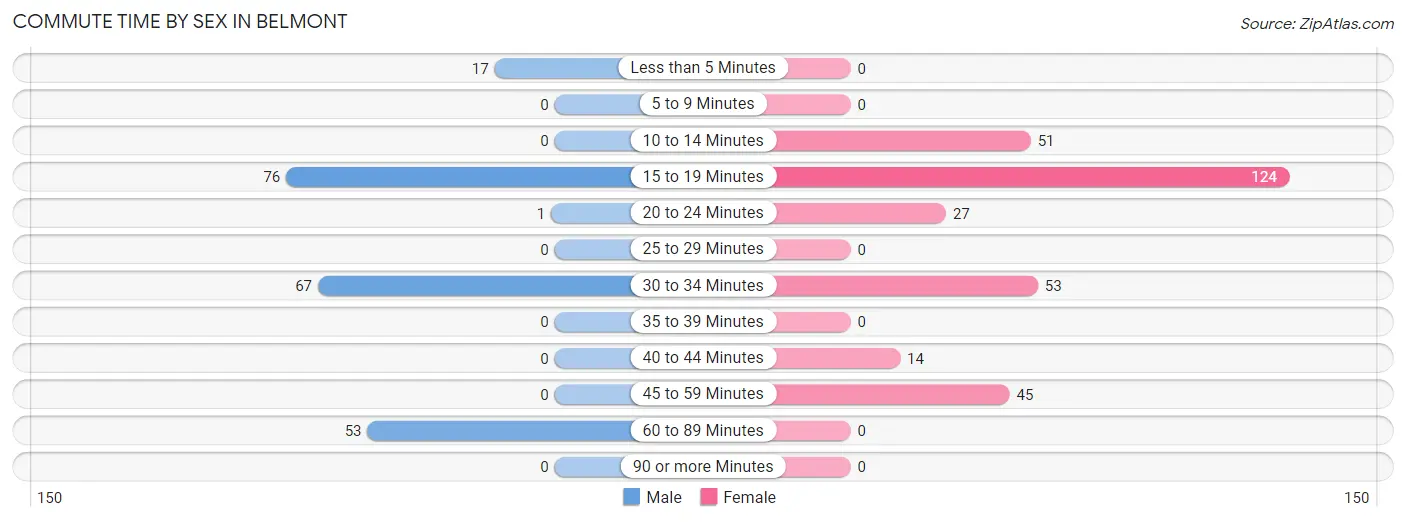
| Commute Time | Male | Female |
| Less than 5 Minutes | 17 (7.9%) | 0 (0.0%) |
| 5 to 9 Minutes | 0 (0.0%) | 0 (0.0%) |
| 10 to 14 Minutes | 0 (0.0%) | 51 (16.2%) |
| 15 to 19 Minutes | 76 (35.5%) | 124 (39.5%) |
| 20 to 24 Minutes | 1 (0.5%) | 27 (8.6%) |
| 25 to 29 Minutes | 0 (0.0%) | 0 (0.0%) |
| 30 to 34 Minutes | 67 (31.3%) | 53 (16.9%) |
| 35 to 39 Minutes | 0 (0.0%) | 0 (0.0%) |
| 40 to 44 Minutes | 0 (0.0%) | 14 (4.5%) |
| 45 to 59 Minutes | 0 (0.0%) | 45 (14.3%) |
| 60 to 89 Minutes | 53 (24.8%) | 0 (0.0%) |
| 90 or more Minutes | 0 (0.0%) | 0 (0.0%) |
Time of Departure to Work by Sex in Belmont
The most frequent times of departure to work in Belmont are 8:30 AM to 8:59 AM (43, 20.1%) for males and 4:00 PM to 11:59 PM (106, 33.8%) for females.
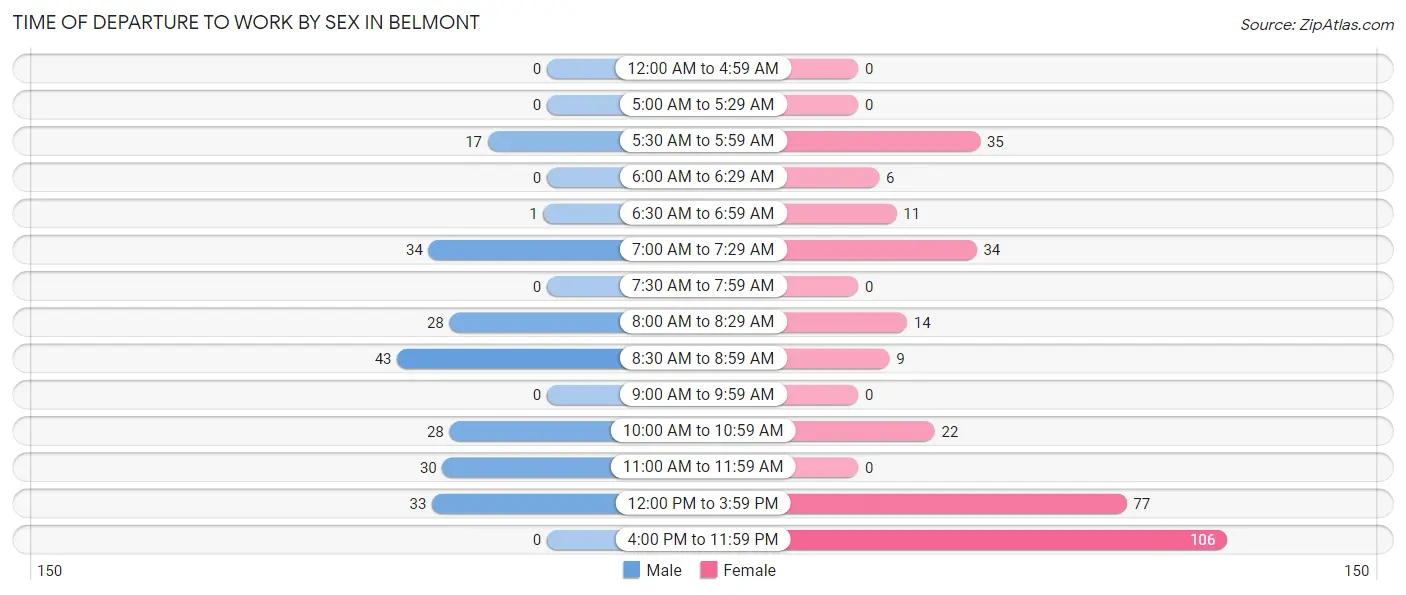
| Time of Departure | Male | Female |
| 12:00 AM to 4:59 AM | 0 (0.0%) | 0 (0.0%) |
| 5:00 AM to 5:29 AM | 0 (0.0%) | 0 (0.0%) |
| 5:30 AM to 5:59 AM | 17 (7.9%) | 35 (11.2%) |
| 6:00 AM to 6:29 AM | 0 (0.0%) | 6 (1.9%) |
| 6:30 AM to 6:59 AM | 1 (0.5%) | 11 (3.5%) |
| 7:00 AM to 7:29 AM | 34 (15.9%) | 34 (10.8%) |
| 7:30 AM to 7:59 AM | 0 (0.0%) | 0 (0.0%) |
| 8:00 AM to 8:29 AM | 28 (13.1%) | 14 (4.5%) |
| 8:30 AM to 8:59 AM | 43 (20.1%) | 9 (2.9%) |
| 9:00 AM to 9:59 AM | 0 (0.0%) | 0 (0.0%) |
| 10:00 AM to 10:59 AM | 28 (13.1%) | 22 (7.0%) |
| 11:00 AM to 11:59 AM | 30 (14.0%) | 0 (0.0%) |
| 12:00 PM to 3:59 PM | 33 (15.4%) | 77 (24.5%) |
| 4:00 PM to 11:59 PM | 0 (0.0%) | 106 (33.8%) |
| Total | 214 (100.0%) | 314 (100.0%) |
Housing Occupancy in Belmont
Occupancy by Ownership in Belmont
Of the total 506 dwellings in Belmont, owner-occupied units account for 433 (85.6%), while renter-occupied units make up 73 (14.4%).
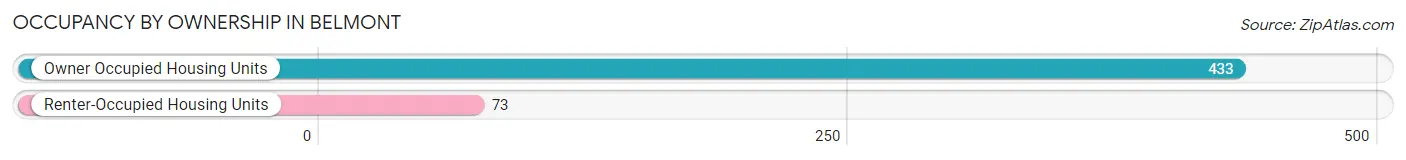
| Occupancy | # Housing Units | % Housing Units |
| Owner Occupied Housing Units | 433 | 85.6% |
| Renter-Occupied Housing Units | 73 | 14.4% |
| Total Occupied Housing Units | 506 | 100.0% |
Occupancy by Household Size in Belmont
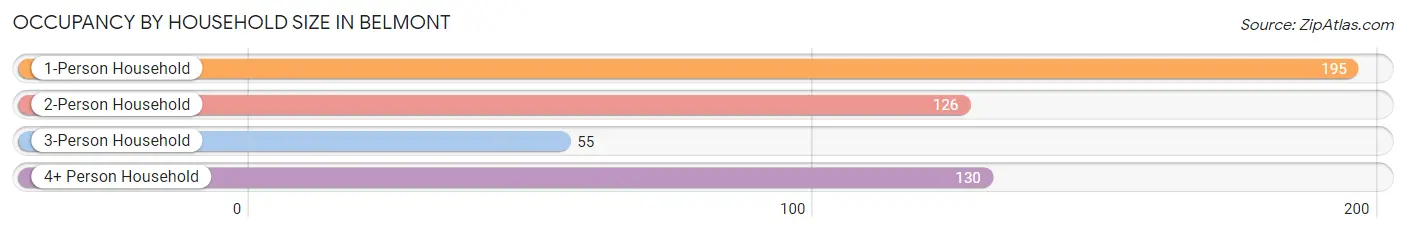
| Household Size | # Housing Units | % Housing Units |
| 1-Person Household | 195 | 38.5% |
| 2-Person Household | 126 | 24.9% |
| 3-Person Household | 55 | 10.9% |
| 4+ Person Household | 130 | 25.7% |
| Total Housing Units | 506 | 100.0% |
Occupancy by Ownership by Household Size in Belmont
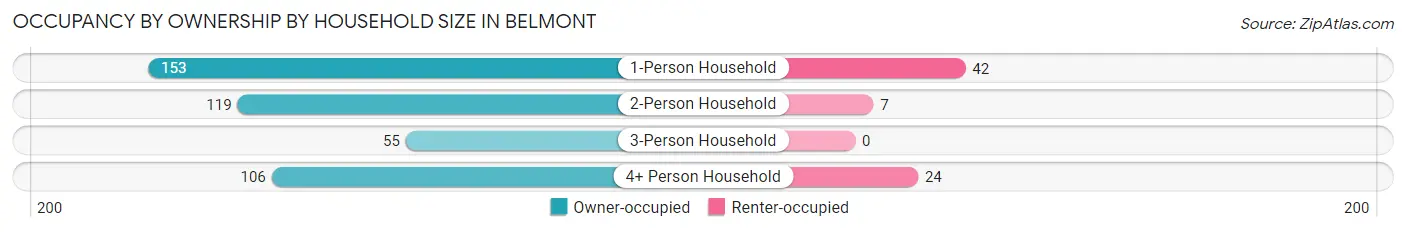
| Household Size | Owner-occupied | Renter-occupied |
| 1-Person Household | 153 (78.5%) | 42 (21.5%) |
| 2-Person Household | 119 (94.4%) | 7 (5.6%) |
| 3-Person Household | 55 (100.0%) | 0 (0.0%) |
| 4+ Person Household | 106 (81.5%) | 24 (18.5%) |
| Total Housing Units | 433 (85.6%) | 73 (14.4%) |
Occupancy by Educational Attainment in Belmont
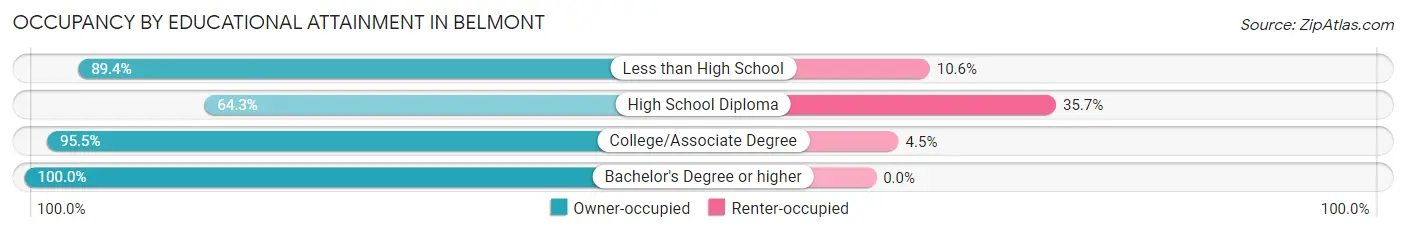
| Household Size | Owner-occupied | Renter-occupied |
| Less than High School | 168 (89.4%) | 20 (10.6%) |
| High School Diploma | 83 (64.3%) | 46 (35.7%) |
| College/Associate Degree | 150 (95.5%) | 7 (4.5%) |
| Bachelor's Degree or higher | 32 (100.0%) | 0 (0.0%) |
Occupancy by Age of Householder in Belmont
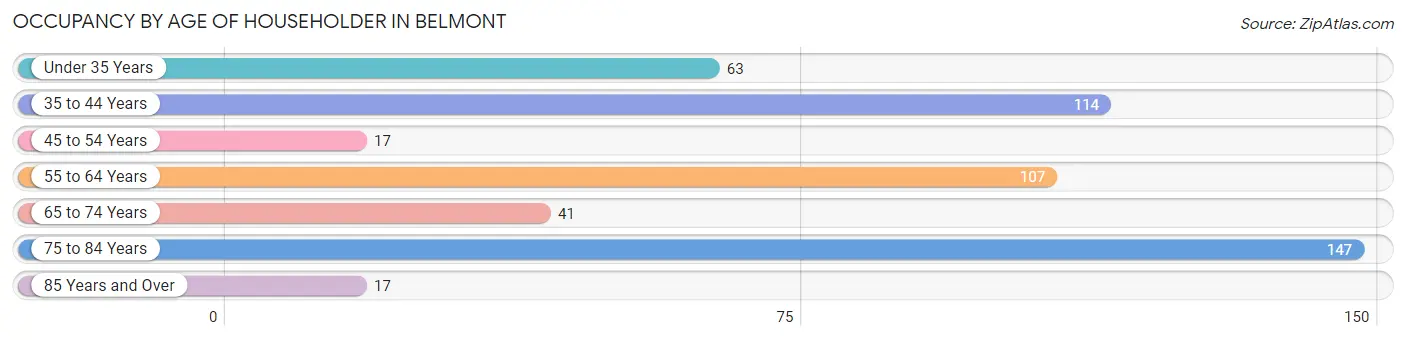
| Age Bracket | # Households | % Households |
| Under 35 Years | 63 | 12.4% |
| 35 to 44 Years | 114 | 22.5% |
| 45 to 54 Years | 17 | 3.4% |
| 55 to 64 Years | 107 | 21.1% |
| 65 to 74 Years | 41 | 8.1% |
| 75 to 84 Years | 147 | 29.0% |
| 85 Years and Over | 17 | 3.4% |
| Total | 506 | 100.0% |
Housing Finances in Belmont
Median Income by Occupancy in Belmont
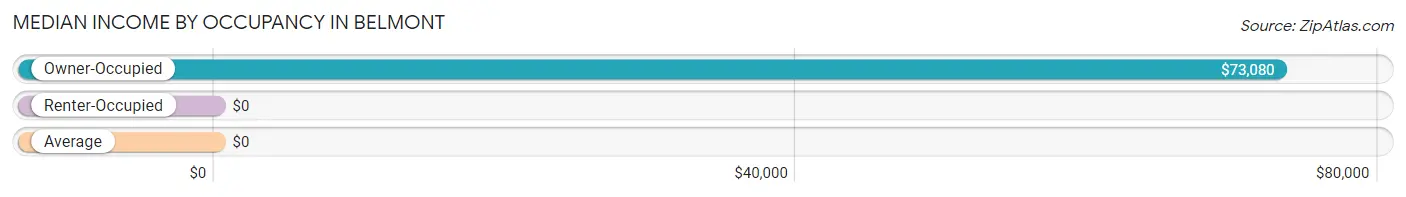
| Occupancy Type | # Households | Median Income |
| Owner-Occupied | 433 (85.6%) | $73,080 |
| Renter-Occupied | 73 (14.4%) | $0 |
| Average | 506 (100.0%) | $0 |
Occupancy by Householder Income Bracket in Belmont
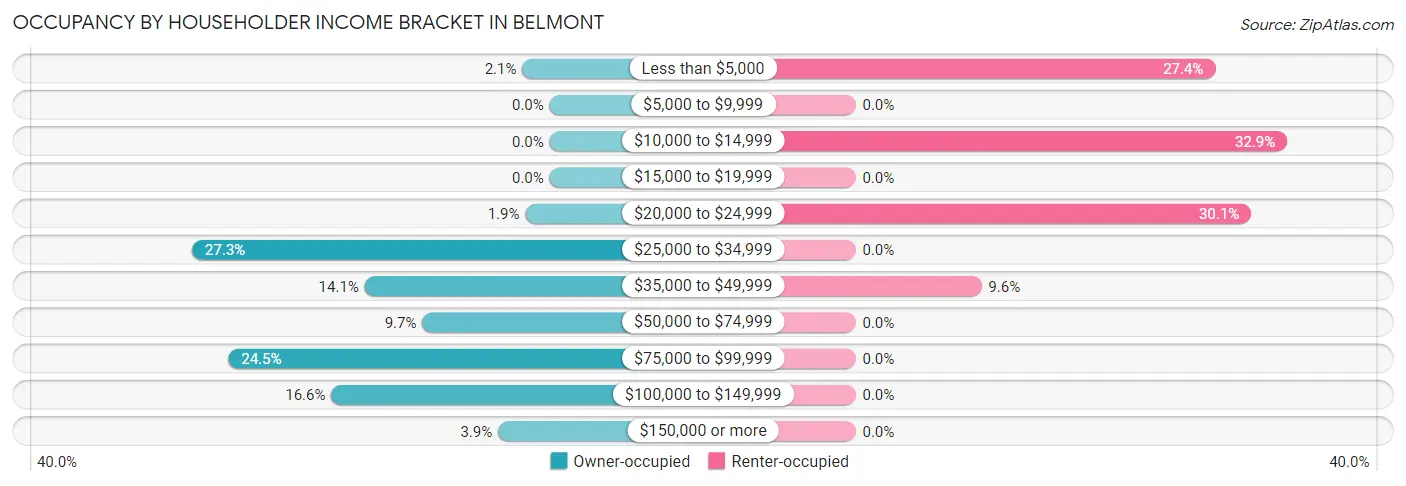
| Income Bracket | Owner-occupied | Renter-occupied |
| Less than $5,000 | 9 (2.1%) | 20 (27.4%) |
| $5,000 to $9,999 | 0 (0.0%) | 0 (0.0%) |
| $10,000 to $14,999 | 0 (0.0%) | 24 (32.9%) |
| $15,000 to $19,999 | 0 (0.0%) | 0 (0.0%) |
| $20,000 to $24,999 | 8 (1.8%) | 22 (30.1%) |
| $25,000 to $34,999 | 118 (27.3%) | 0 (0.0%) |
| $35,000 to $49,999 | 61 (14.1%) | 7 (9.6%) |
| $50,000 to $74,999 | 42 (9.7%) | 0 (0.0%) |
| $75,000 to $99,999 | 106 (24.5%) | 0 (0.0%) |
| $100,000 to $149,999 | 72 (16.6%) | 0 (0.0%) |
| $150,000 or more | 17 (3.9%) | 0 (0.0%) |
| Total | 433 (100.0%) | 73 (100.0%) |
Monthly Housing Cost Tiers in Belmont
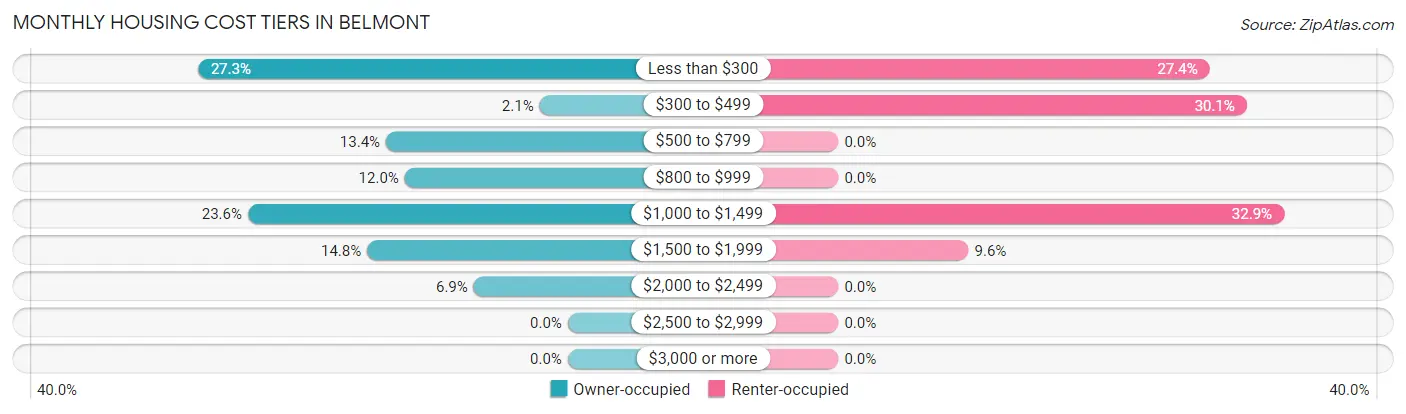
| Monthly Cost | Owner-occupied | Renter-occupied |
| Less than $300 | 118 (27.3%) | 20 (27.4%) |
| $300 to $499 | 9 (2.1%) | 22 (30.1%) |
| $500 to $799 | 58 (13.4%) | 0 (0.0%) |
| $800 to $999 | 52 (12.0%) | 0 (0.0%) |
| $1,000 to $1,499 | 102 (23.6%) | 24 (32.9%) |
| $1,500 to $1,999 | 64 (14.8%) | 7 (9.6%) |
| $2,000 to $2,499 | 30 (6.9%) | 0 (0.0%) |
| $2,500 to $2,999 | 0 (0.0%) | 0 (0.0%) |
| $3,000 or more | 0 (0.0%) | 0 (0.0%) |
| Total | 433 (100.0%) | 73 (100.0%) |
Physical Housing Characteristics in Belmont
Housing Structures in Belmont
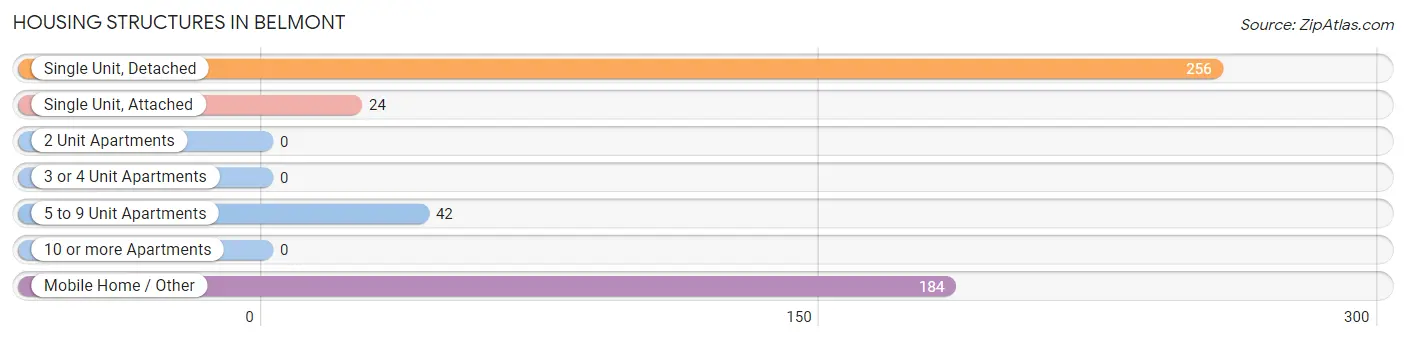
| Structure Type | # Housing Units | % Housing Units |
| Single Unit, Detached | 256 | 50.6% |
| Single Unit, Attached | 24 | 4.7% |
| 2 Unit Apartments | 0 | 0.0% |
| 3 or 4 Unit Apartments | 0 | 0.0% |
| 5 to 9 Unit Apartments | 42 | 8.3% |
| 10 or more Apartments | 0 | 0.0% |
| Mobile Home / Other | 184 | 36.4% |
| Total | 506 | 100.0% |
Housing Structures by Occupancy in Belmont
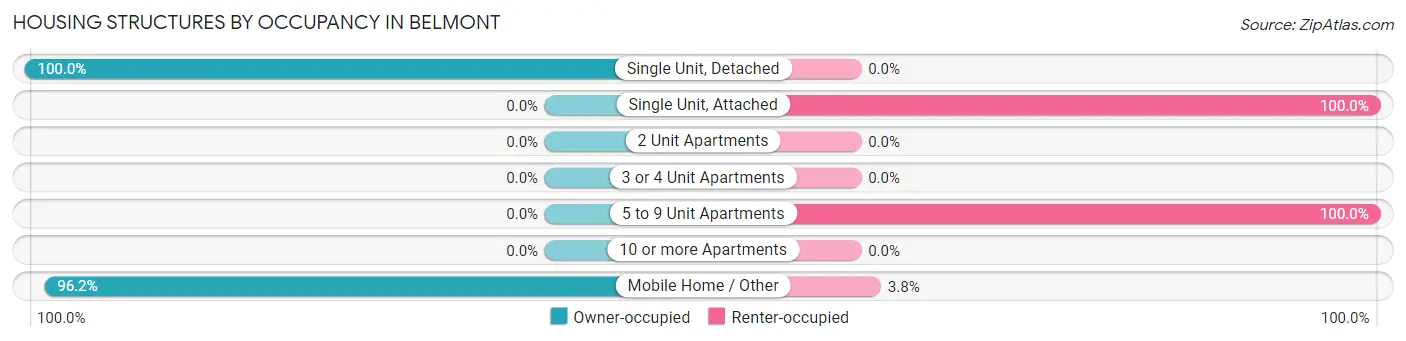
| Structure Type | Owner-occupied | Renter-occupied |
| Single Unit, Detached | 256 (100.0%) | 0 (0.0%) |
| Single Unit, Attached | 0 (0.0%) | 24 (100.0%) |
| 2 Unit Apartments | 0 (0.0%) | 0 (0.0%) |
| 3 or 4 Unit Apartments | 0 (0.0%) | 0 (0.0%) |
| 5 to 9 Unit Apartments | 0 (0.0%) | 42 (100.0%) |
| 10 or more Apartments | 0 (0.0%) | 0 (0.0%) |
| Mobile Home / Other | 177 (96.2%) | 7 (3.8%) |
| Total | 433 (85.6%) | 73 (14.4%) |
Housing Structures by Number of Rooms in Belmont
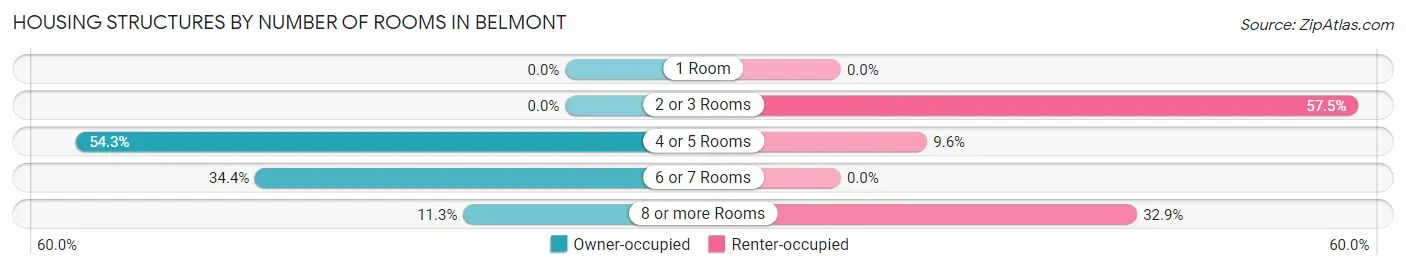
| Number of Rooms | Owner-occupied | Renter-occupied |
| 1 Room | 0 (0.0%) | 0 (0.0%) |
| 2 or 3 Rooms | 0 (0.0%) | 42 (57.5%) |
| 4 or 5 Rooms | 235 (54.3%) | 7 (9.6%) |
| 6 or 7 Rooms | 149 (34.4%) | 0 (0.0%) |
| 8 or more Rooms | 49 (11.3%) | 24 (32.9%) |
| Total | 433 (100.0%) | 73 (100.0%) |
Housing Structure by Heating Type in Belmont
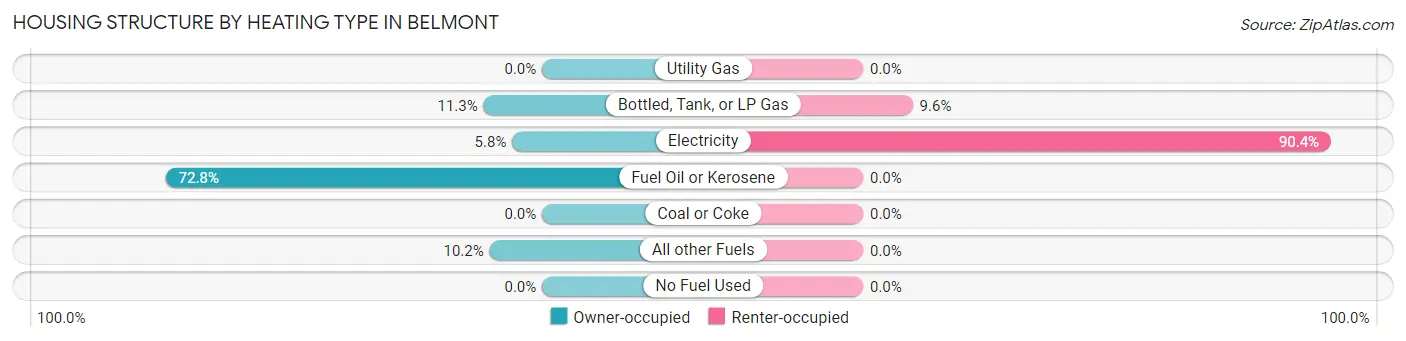
| Heating Type | Owner-occupied | Renter-occupied |
| Utility Gas | 0 (0.0%) | 0 (0.0%) |
| Bottled, Tank, or LP Gas | 49 (11.3%) | 7 (9.6%) |
| Electricity | 25 (5.8%) | 66 (90.4%) |
| Fuel Oil or Kerosene | 315 (72.8%) | 0 (0.0%) |
| Coal or Coke | 0 (0.0%) | 0 (0.0%) |
| All other Fuels | 44 (10.2%) | 0 (0.0%) |
| No Fuel Used | 0 (0.0%) | 0 (0.0%) |
| Total | 433 (100.0%) | 73 (100.0%) |
Household Vehicle Usage in Belmont
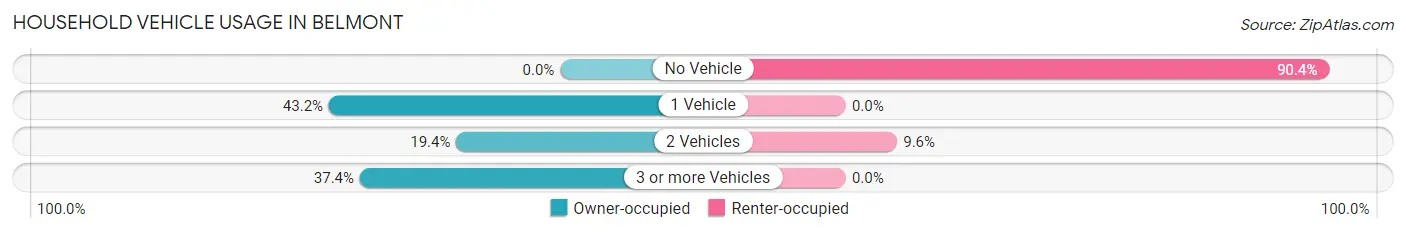
| Vehicles per Household | Owner-occupied | Renter-occupied |
| No Vehicle | 0 (0.0%) | 66 (90.4%) |
| 1 Vehicle | 187 (43.2%) | 0 (0.0%) |
| 2 Vehicles | 84 (19.4%) | 7 (9.6%) |
| 3 or more Vehicles | 162 (37.4%) | 0 (0.0%) |
| Total | 433 (100.0%) | 73 (100.0%) |
Real Estate & Mortgages in Belmont
Real Estate and Mortgage Overview in Belmont
| Characteristic | Without Mortgage | With Mortgage |
| Housing Units | 209 | 224 |
| Median Property Value | $140,400 | $192,900 |
| Median Household Income | $31,854 | $0 |
| Monthly Housing Costs | - | - |
| Real Estate Taxes | $2,895 | $0 |
Property Value by Mortgage Status in Belmont
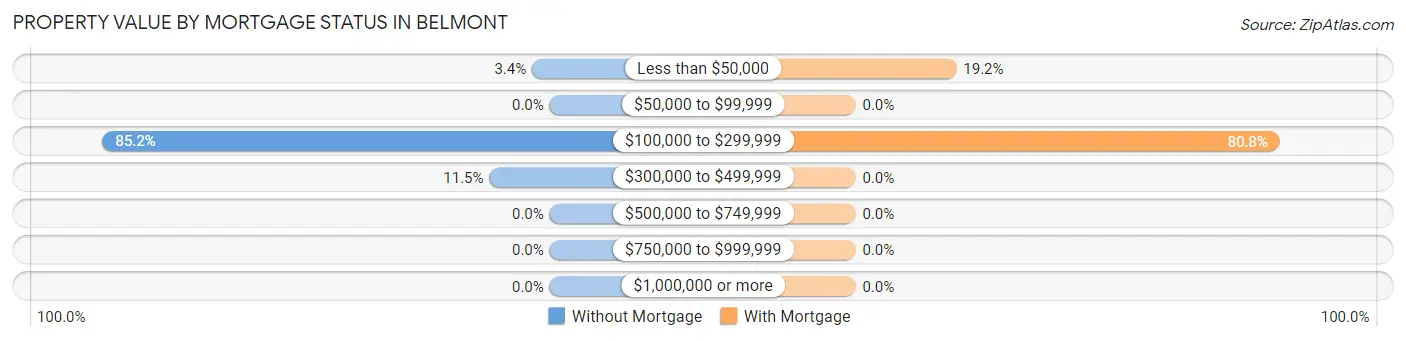
| Property Value | Without Mortgage | With Mortgage |
| Less than $50,000 | 7 (3.4%) | 43 (19.2%) |
| $50,000 to $99,999 | 0 (0.0%) | 0 (0.0%) |
| $100,000 to $299,999 | 178 (85.2%) | 181 (80.8%) |
| $300,000 to $499,999 | 24 (11.5%) | 0 (0.0%) |
| $500,000 to $749,999 | 0 (0.0%) | 0 (0.0%) |
| $750,000 to $999,999 | 0 (0.0%) | 0 (0.0%) |
| $1,000,000 or more | 0 (0.0%) | 0 (0.0%) |
| Total | 209 (100.0%) | 224 (100.0%) |
Household Income by Mortgage Status in Belmont
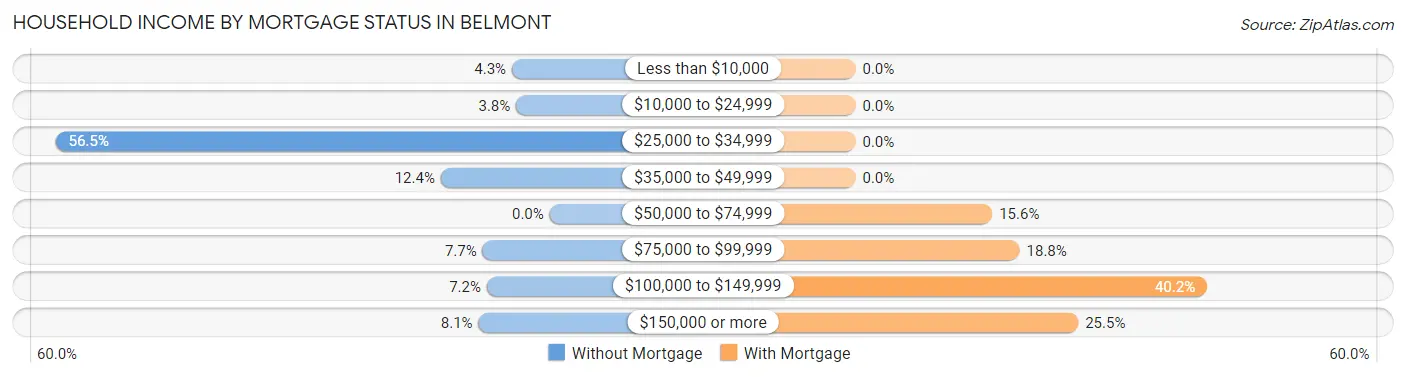
| Household Income | Without Mortgage | With Mortgage |
| Less than $10,000 | 9 (4.3%) | 0 (0.0%) |
| $10,000 to $24,999 | 8 (3.8%) | 0 (0.0%) |
| $25,000 to $34,999 | 118 (56.5%) | 0 (0.0%) |
| $35,000 to $49,999 | 26 (12.4%) | 0 (0.0%) |
| $50,000 to $74,999 | 0 (0.0%) | 35 (15.6%) |
| $75,000 to $99,999 | 16 (7.7%) | 42 (18.8%) |
| $100,000 to $149,999 | 15 (7.2%) | 90 (40.2%) |
| $150,000 or more | 17 (8.1%) | 57 (25.5%) |
| Total | 209 (100.0%) | 224 (100.0%) |
Property Value to Household Income Ratio in Belmont
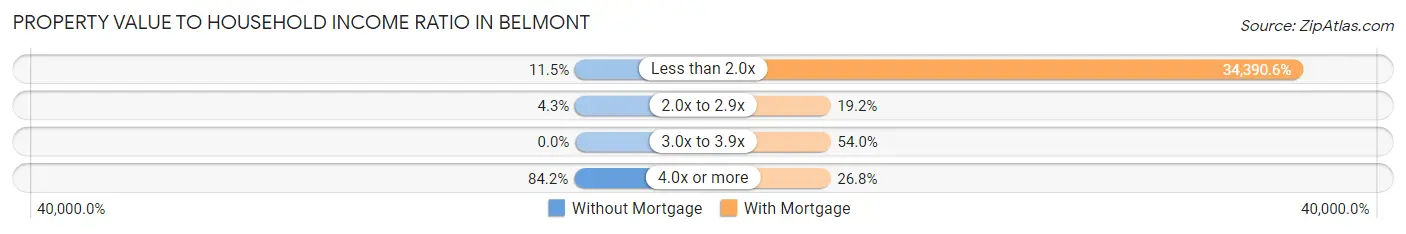
| Value-to-Income Ratio | Without Mortgage | With Mortgage |
| Less than 2.0x | 24 (11.5%) | 77,035 (34,390.6%) |
| 2.0x to 2.9x | 9 (4.3%) | 43 (19.2%) |
| 3.0x to 3.9x | 0 (0.0%) | 121 (54.0%) |
| 4.0x or more | 176 (84.2%) | 60 (26.8%) |
| Total | 209 (100.0%) | 224 (100.0%) |
Real Estate Taxes by Mortgage Status in Belmont
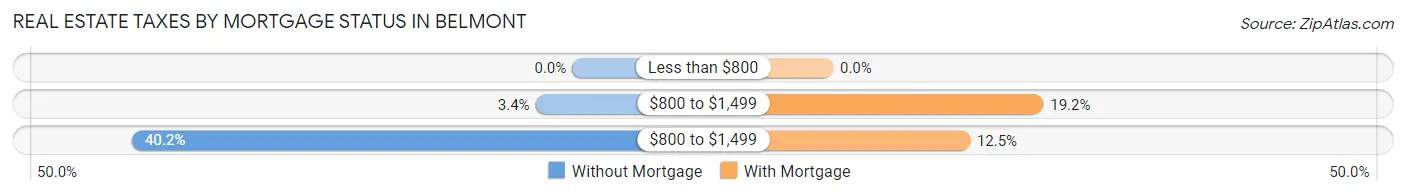
| Property Taxes | Without Mortgage | With Mortgage |
| Less than $800 | 0 (0.0%) | 0 (0.0%) |
| $800 to $1,499 | 7 (3.4%) | 43 (19.2%) |
| $800 to $1,499 | 84 (40.2%) | 28 (12.5%) |
| Total | 209 (100.0%) | 224 (100.0%) |
Health & Disability in Belmont
Health Insurance Coverage by Age in Belmont
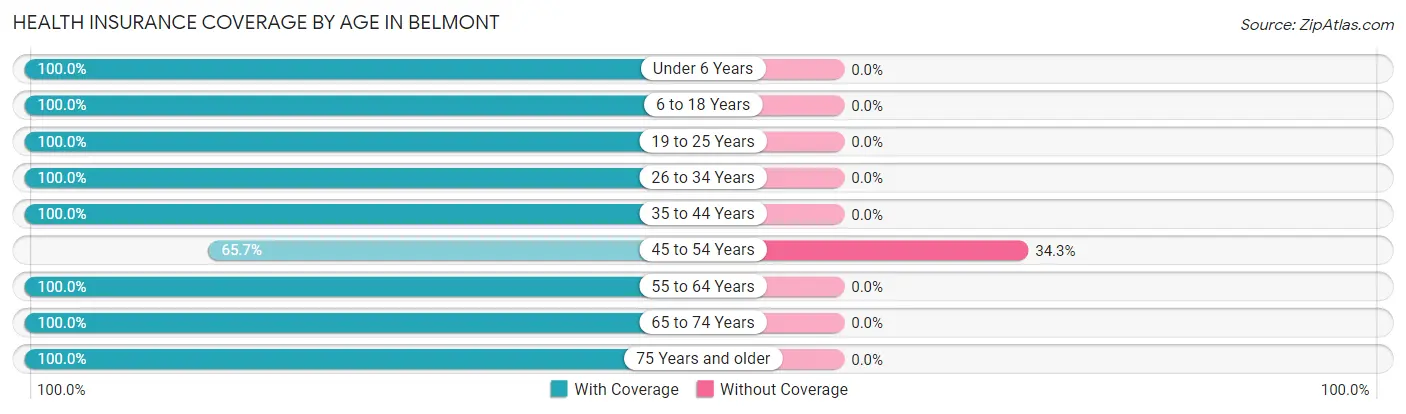
| Age Bracket | With Coverage | Without Coverage |
| Under 6 Years | 138 (100.0%) | 0 (0.0%) |
| 6 to 18 Years | 263 (100.0%) | 0 (0.0%) |
| 19 to 25 Years | 68 (100.0%) | 0 (0.0%) |
| 26 to 34 Years | 53 (100.0%) | 0 (0.0%) |
| 35 to 44 Years | 233 (100.0%) | 0 (0.0%) |
| 45 to 54 Years | 90 (65.7%) | 47 (34.3%) |
| 55 to 64 Years | 114 (100.0%) | 0 (0.0%) |
| 65 to 74 Years | 66 (100.0%) | 0 (0.0%) |
| 75 Years and older | 180 (100.0%) | 0 (0.0%) |
| Total | 1,205 (96.3%) | 47 (3.7%) |
Health Insurance Coverage by Citizenship Status in Belmont
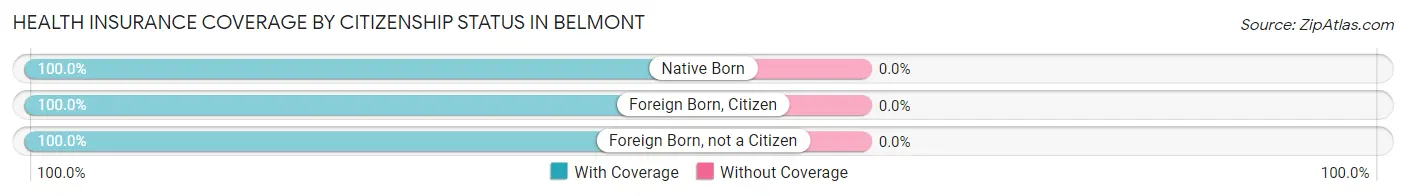
| Citizenship Status | With Coverage | Without Coverage |
| Native Born | 138 (100.0%) | 0 (0.0%) |
| Foreign Born, Citizen | 263 (100.0%) | 0 (0.0%) |
| Foreign Born, not a Citizen | 68 (100.0%) | 0 (0.0%) |
Health Insurance Coverage by Household Income in Belmont
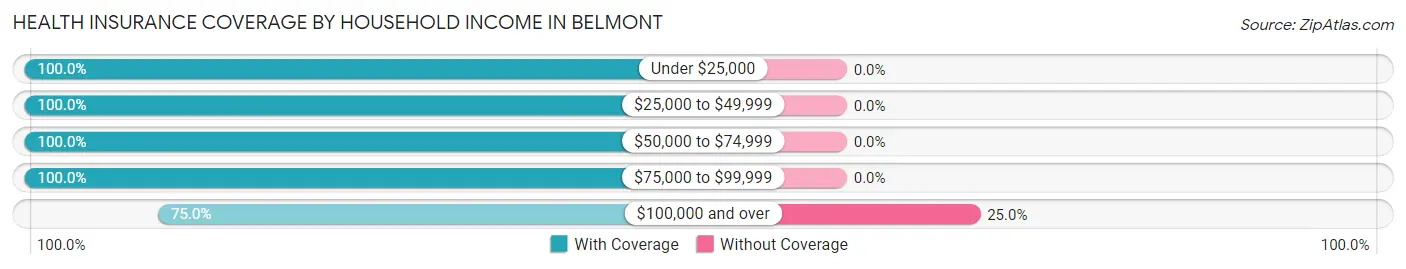
| Household Income | With Coverage | Without Coverage |
| Under $25,000 | 179 (100.0%) | 0 (0.0%) |
| $25,000 to $49,999 | 312 (100.0%) | 0 (0.0%) |
| $50,000 to $74,999 | 125 (100.0%) | 0 (0.0%) |
| $75,000 to $99,999 | 447 (100.0%) | 0 (0.0%) |
| $100,000 and over | 141 (75.0%) | 47 (25.0%) |
Public vs Private Health Insurance Coverage by Age in Belmont
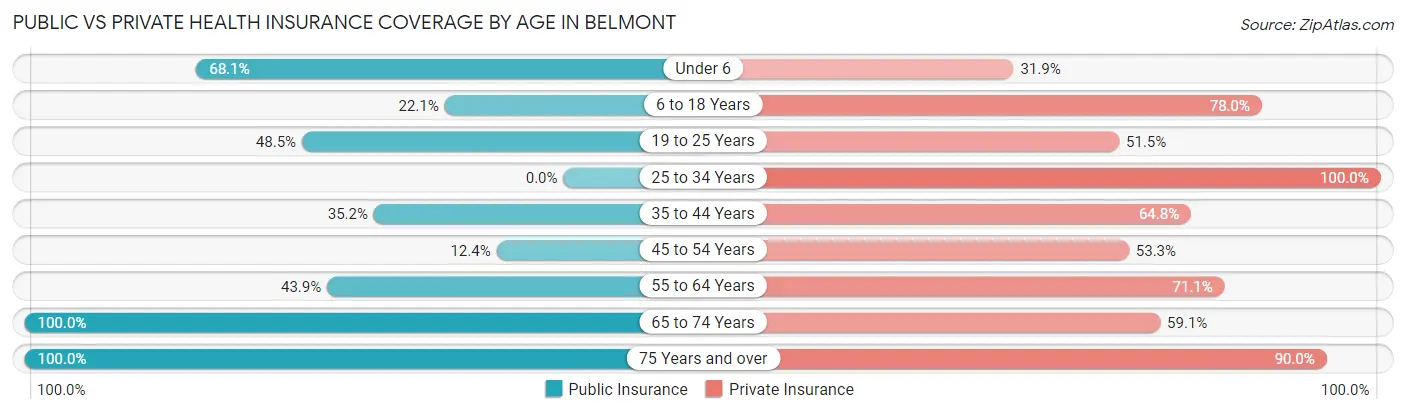
| Age Bracket | Public Insurance | Private Insurance |
| Under 6 | 94 (68.1%) | 44 (31.9%) |
| 6 to 18 Years | 58 (22.1%) | 205 (77.9%) |
| 19 to 25 Years | 33 (48.5%) | 35 (51.5%) |
| 25 to 34 Years | 0 (0.0%) | 53 (100.0%) |
| 35 to 44 Years | 82 (35.2%) | 151 (64.8%) |
| 45 to 54 Years | 17 (12.4%) | 73 (53.3%) |
| 55 to 64 Years | 50 (43.9%) | 81 (71.1%) |
| 65 to 74 Years | 66 (100.0%) | 39 (59.1%) |
| 75 Years and over | 180 (100.0%) | 162 (90.0%) |
| Total | 580 (46.3%) | 843 (67.3%) |
Disability Status by Sex by Age in Belmont
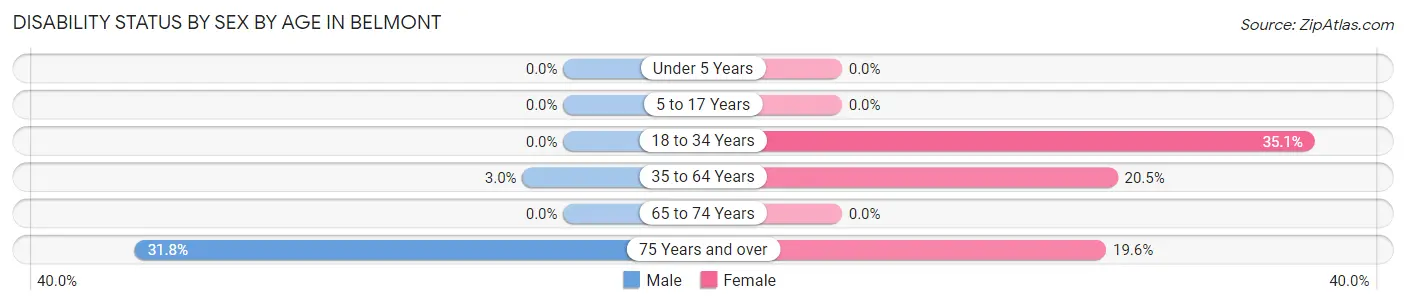
| Age Bracket | Male | Female |
| Under 5 Years | 0 (0.0%) | 0 (0.0%) |
| 5 to 17 Years | 0 (0.0%) | 0 (0.0%) |
| 18 to 34 Years | 0 (0.0%) | 33 (35.1%) |
| 35 to 64 Years | 7 (3.0%) | 52 (20.5%) |
| 65 to 74 Years | 0 (0.0%) | 0 (0.0%) |
| 75 Years and over | 7 (31.8%) | 31 (19.6%) |
Disability Class by Sex by Age in Belmont
Disability Class: Hearing Difficulty
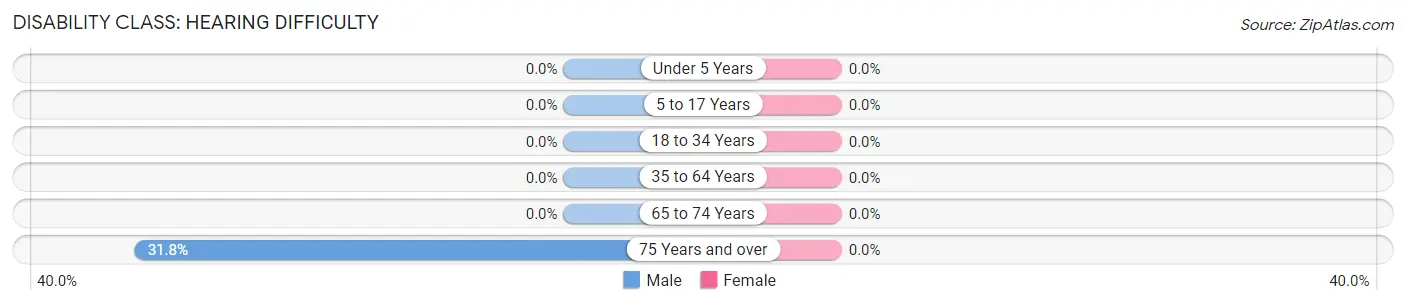
| Age Bracket | Male | Female |
| Under 5 Years | 0 (0.0%) | 0 (0.0%) |
| 5 to 17 Years | 0 (0.0%) | 0 (0.0%) |
| 18 to 34 Years | 0 (0.0%) | 0 (0.0%) |
| 35 to 64 Years | 0 (0.0%) | 0 (0.0%) |
| 65 to 74 Years | 0 (0.0%) | 0 (0.0%) |
| 75 Years and over | 7 (31.8%) | 0 (0.0%) |
Disability Class: Vision Difficulty
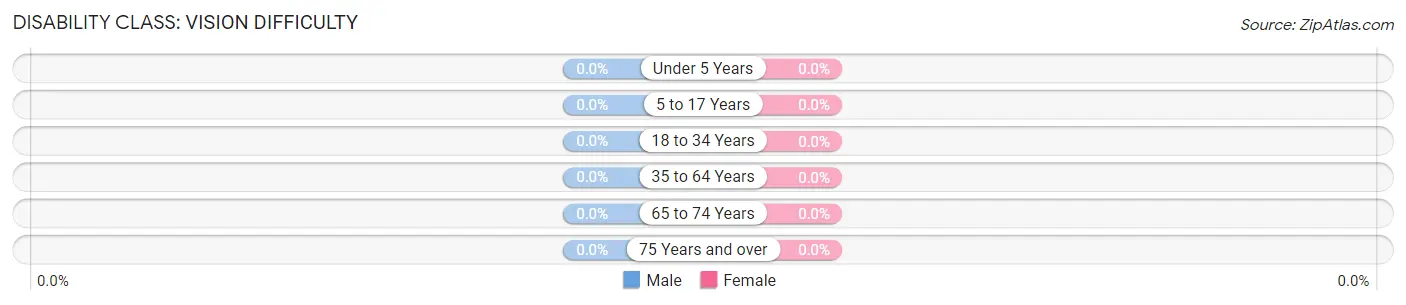
| Age Bracket | Male | Female |
| Under 5 Years | 0 (0.0%) | 0 (0.0%) |
| 5 to 17 Years | 0 (0.0%) | 0 (0.0%) |
| 18 to 34 Years | 0 (0.0%) | 0 (0.0%) |
| 35 to 64 Years | 0 (0.0%) | 0 (0.0%) |
| 65 to 74 Years | 0 (0.0%) | 0 (0.0%) |
| 75 Years and over | 0 (0.0%) | 0 (0.0%) |
Disability Class: Cognitive Difficulty
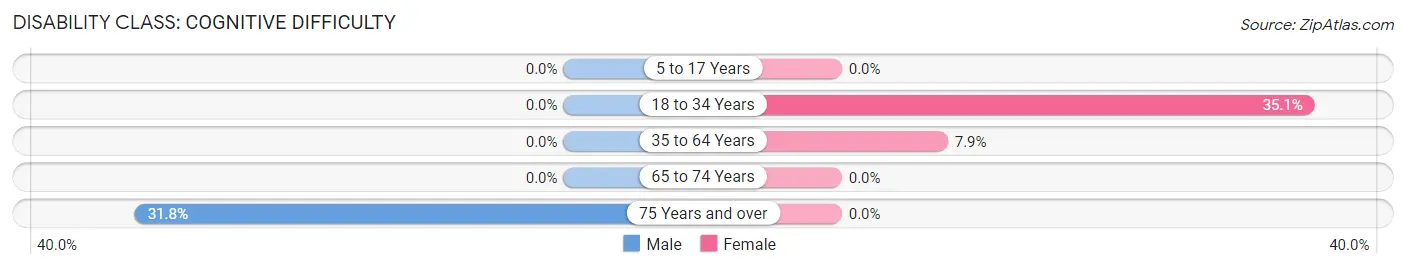
| Age Bracket | Male | Female |
| 5 to 17 Years | 0 (0.0%) | 0 (0.0%) |
| 18 to 34 Years | 0 (0.0%) | 33 (35.1%) |
| 35 to 64 Years | 0 (0.0%) | 20 (7.9%) |
| 65 to 74 Years | 0 (0.0%) | 0 (0.0%) |
| 75 Years and over | 7 (31.8%) | 0 (0.0%) |
Disability Class: Ambulatory Difficulty
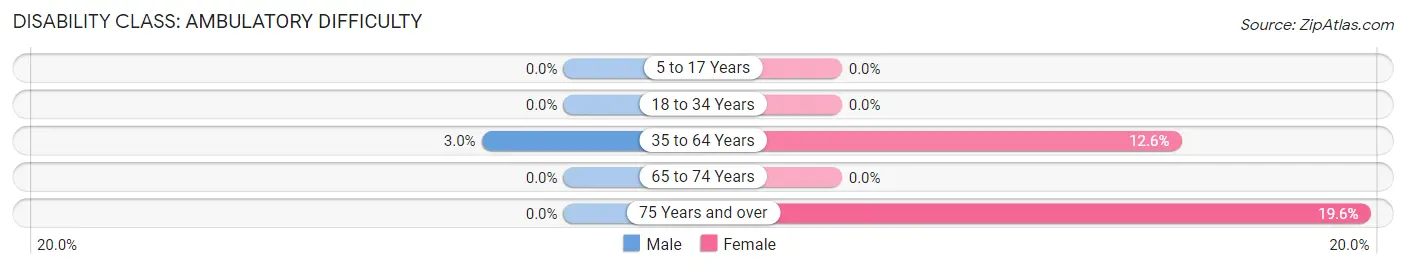
| Age Bracket | Male | Female |
| 5 to 17 Years | 0 (0.0%) | 0 (0.0%) |
| 18 to 34 Years | 0 (0.0%) | 0 (0.0%) |
| 35 to 64 Years | 7 (3.0%) | 32 (12.6%) |
| 65 to 74 Years | 0 (0.0%) | 0 (0.0%) |
| 75 Years and over | 0 (0.0%) | 31 (19.6%) |
Disability Class: Self-Care Difficulty
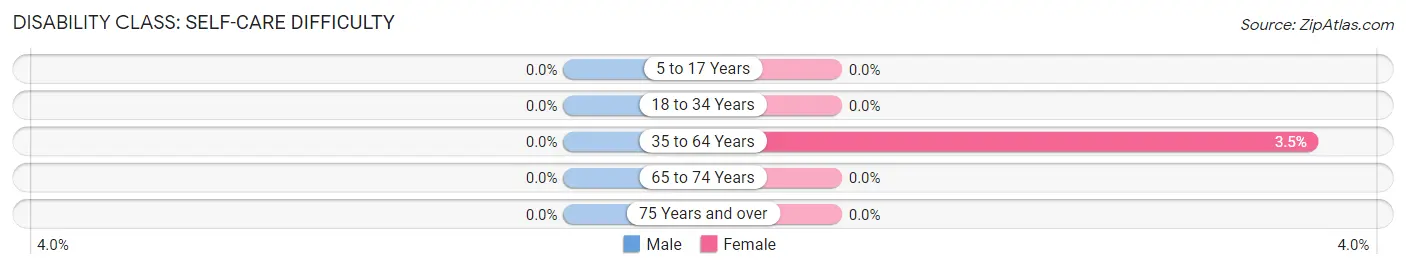
| Age Bracket | Male | Female |
| 5 to 17 Years | 0 (0.0%) | 0 (0.0%) |
| 18 to 34 Years | 0 (0.0%) | 0 (0.0%) |
| 35 to 64 Years | 0 (0.0%) | 9 (3.5%) |
| 65 to 74 Years | 0 (0.0%) | 0 (0.0%) |
| 75 Years and over | 0 (0.0%) | 0 (0.0%) |
Technology Access in Belmont
Computing Device Access in Belmont
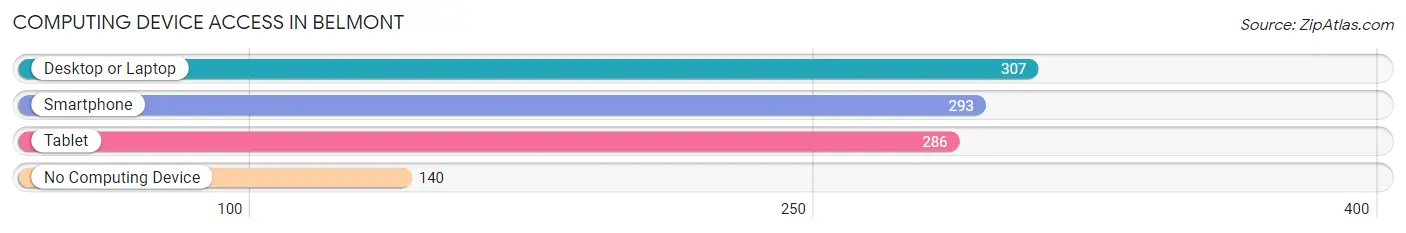
| Device Type | # Households | % Households |
| Desktop or Laptop | 307 | 60.7% |
| Smartphone | 293 | 57.9% |
| Tablet | 286 | 56.5% |
| No Computing Device | 140 | 27.7% |
| Total | 506 | 100.0% |
Internet Access in Belmont
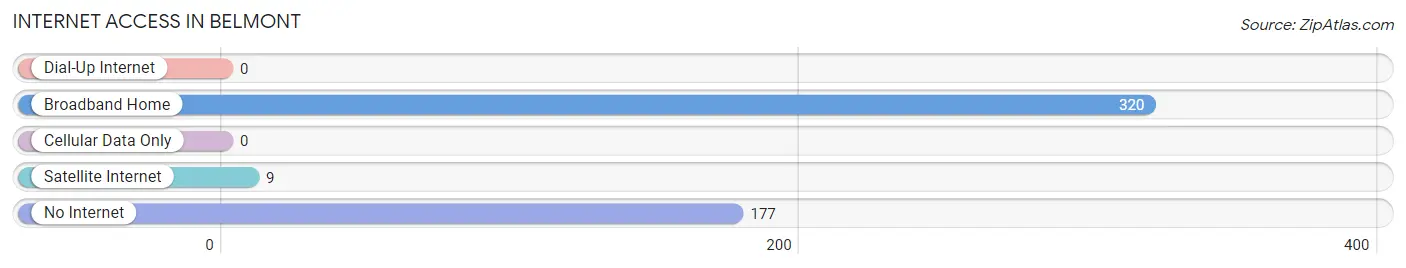
| Internet Type | # Households | % Households |
| Dial-Up Internet | 0 | 0.0% |
| Broadband Home | 320 | 63.2% |
| Cellular Data Only | 0 | 0.0% |
| Satellite Internet | 9 | 1.8% |
| No Internet | 177 | 35.0% |
| Total | 506 | 100.0% |
Belmont Summary
Belmont, New Hampshire is a small town located in the Lakes Region of the state. It is situated in Belknap County, and is bordered by the towns of Gilford, Laconia, and Gilmanton. The town has a population of approximately 6,000 people, and is home to a variety of businesses, including a ski resort, a golf course, and a number of small businesses.
Geography
Belmont is located in the Lakes Region of New Hampshire, and is situated in Belknap County. The town is bordered by the towns of Gilford, Laconia, and Gilmanton. The town is located on the western shore of Lake Winnipesaukee, and is home to several small lakes, including Silver Lake, Lake Winnisquam, and Lake Waukewan. The town is also home to the Belknap Mountains, which are part of the White Mountain National Forest.
The town has a total area of 28.2 square miles, of which 27.7 square miles is land and 0.5 square miles is water. The highest point in the town is the summit of Belknap Mountain, which has an elevation of 1,902 feet.
History
Belmont was first settled in 1763, and was originally part of Gilmanton. The town was incorporated in 1790, and was named after the Belknap family, who were prominent landowners in the area.
The town was primarily an agricultural community for much of its history, and was home to several mills and factories. In the late 19th century, the town became a popular tourist destination, and was home to several resorts and hotels.
Economy
Belmont is home to a variety of businesses, including a ski resort, a golf course, and a number of small businesses. The town is also home to several manufacturing companies, including a paper mill and a plastics factory.
The town is also home to several educational institutions, including Belmont High School, Belmont Middle School, and Belmont Elementary School.
Demographics
As of the 2010 census, the population of Belmont was 6,078. The racial makeup of the town was 97.2% White, 0.7% African American, 0.3% Native American, 0.5% Asian, 0.1% Pacific Islander, 0.3% from other races, and 1.0% from two or more races. Hispanic or Latino of any race were 1.2% of the population.
The median income for a household in the town was $50,945, and the median income for a family was $60,917. The per capita income for the town was $25,945. About 4.3% of families and 5.7% of the population were below the poverty line, including 6.3% of those under age 18 and 4.2% of those age 65 or over.
Common Questions
What is Per Capita Income in Belmont?
Per Capita income in Belmont is $31,897.
What is the Median Family Income in Belmont?
Median Family Income in Belmont is $75,487.
What is Inequality or Gini Index in Belmont?
Inequality or Gini Index in Belmont is 0.52.
What is the Total Population of Belmont?
Total Population of Belmont is 1,252.
What is the Total Male Population of Belmont?
Total Male Population of Belmont is 482.
What is the Total Female Population of Belmont?
Total Female Population of Belmont is 770.
What is the Ratio of Males per 100 Females in Belmont?
There are 62.60 Males per 100 Females in Belmont.
What is the Ratio of Females per 100 Males in Belmont?
There are 159.75 Females per 100 Males in Belmont.
What is the Median Population Age in Belmont?
Median Population Age in Belmont is 40.7 Years.
What is the Average Family Size in Belmont
Average Family Size in Belmont is 3.4 People.
What is the Average Household Size in Belmont
Average Household Size in Belmont is 2.5 People.
How Large is the Labor Force in Belmont?
There are 619 People in the Labor Forcein in Belmont.
What is the Percentage of People in the Labor Force in Belmont?
68.3% of People are in the Labor Force in Belmont.