Enfield, NH Map & Demographics
Enfield Map
Enfield Overview
$29,590
PER CAPITA INCOME
$54,493
AVG HOUSEHOLD INCOME
8.6%
WAGE / INCOME GAP [ % ]
91.4¢/ $1
WAGE / INCOME GAP [ $ ]
0.44
INEQUALITY / GINI INDEX
2,079
TOTAL POPULATION
985
MALE POPULATION
1,094
FEMALE POPULATION
90.04
MALES / 100 FEMALES
111.07
FEMALES / 100 MALES
43.7
MEDIAN AGE
2.9
AVG FAMILY SIZE
2.3
AVG HOUSEHOLD SIZE
977
LABOR FORCE [ PEOPLE ]
61.2%
PERCENT IN LABOR FORCE
Enfield Zip Codes
Enfield Area Codes
Income in Enfield
Income Overview in Enfield
| Characteristic | Number | Measure |
| Per Capita Income | 2,079 | $29,590 |
| Median Family Income | 585 | $0 |
| Mean Family Income | 585 | $67,757 |
| Median Household Income | 897 | $54,493 |
| Mean Household Income | 897 | $67,080 |
| Income Deficit | 585 | $0 |
| Wage / Income Gap (%) | 2,079 | 8.59% |
| Wage / Income Gap ($) | 2,079 | 91.41¢ per $1 |
| Gini / Inequality Index | 2,079 | 0.44 |
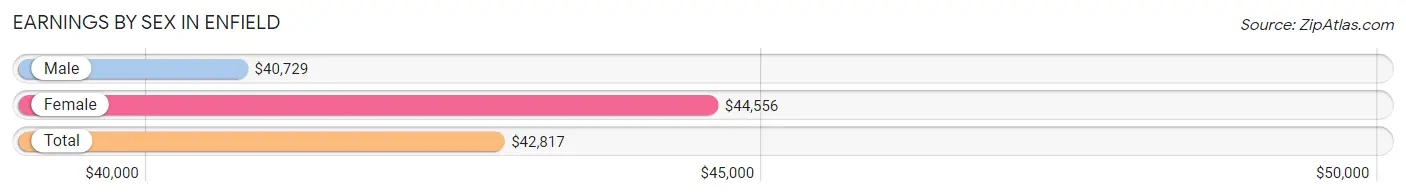
Earnings by Sex in Enfield
Average Earnings in Enfield are $42,817, $40,729 for men and $44,556 for women, a difference of 8.6%.
| Sex | Number | Average Earnings |
| Male | 366 (36.7%) | $40,729 |
| Female | 631 (63.3%) | $44,556 |
| Total | 997 (100.0%) | $42,817 |
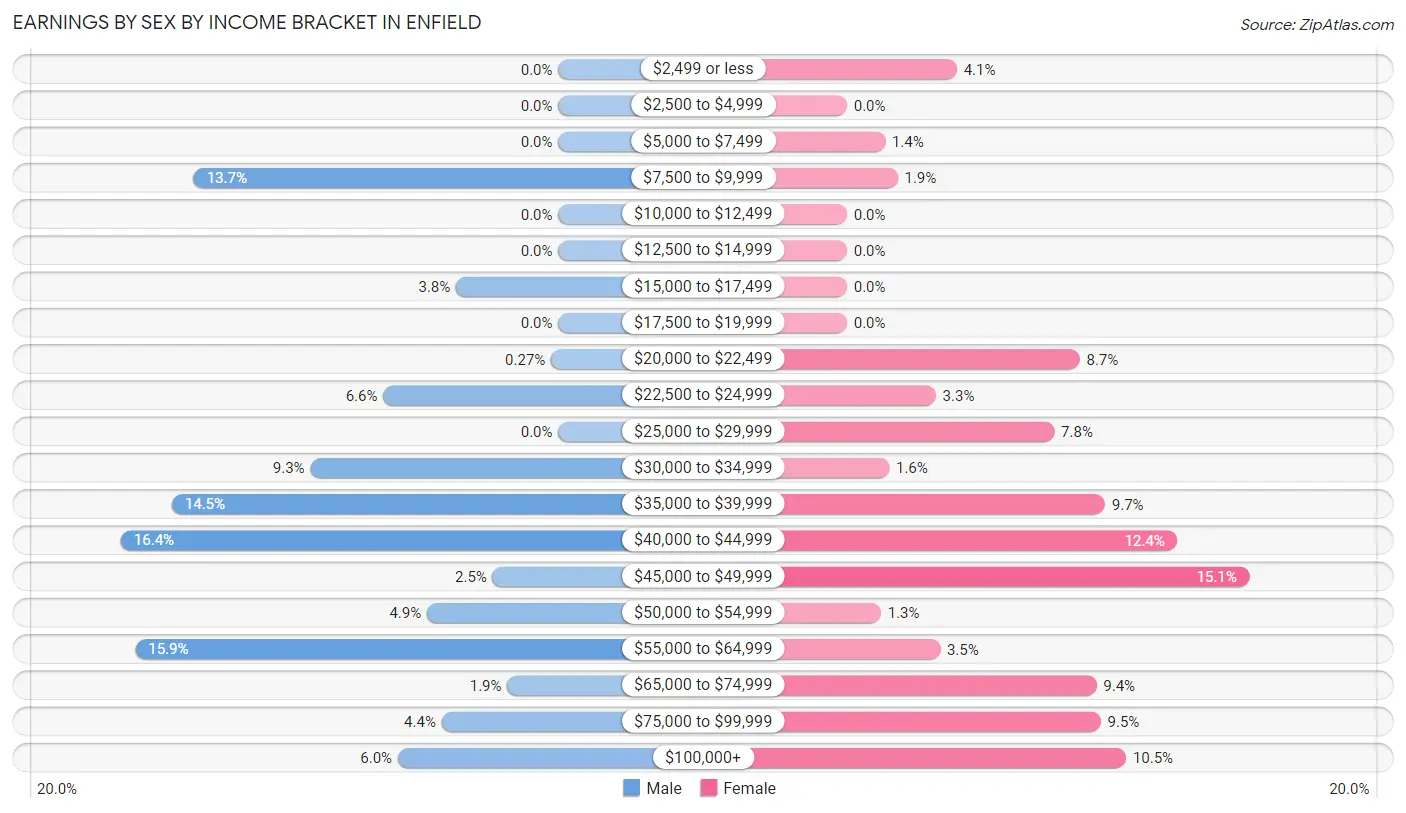
Earnings by Sex by Income Bracket in Enfield
The most common earnings brackets in Enfield are $40,000 to $44,999 for men (60 | 16.4%) and $45,000 to $49,999 for women (95 | 15.1%).
| Income | Male | Female |
| $2,499 or less | 0 (0.0%) | 26 (4.1%) |
| $2,500 to $4,999 | 0 (0.0%) | 0 (0.0%) |
| $5,000 to $7,499 | 0 (0.0%) | 9 (1.4%) |
| $7,500 to $9,999 | 50 (13.7%) | 12 (1.9%) |
| $10,000 to $12,499 | 0 (0.0%) | 0 (0.0%) |
| $12,500 to $14,999 | 0 (0.0%) | 0 (0.0%) |
| $15,000 to $17,499 | 14 (3.8%) | 0 (0.0%) |
| $17,500 to $19,999 | 0 (0.0%) | 0 (0.0%) |
| $20,000 to $22,499 | 1 (0.3%) | 55 (8.7%) |
| $22,500 to $24,999 | 24 (6.6%) | 21 (3.3%) |
| $25,000 to $29,999 | 0 (0.0%) | 49 (7.8%) |
| $30,000 to $34,999 | 34 (9.3%) | 10 (1.6%) |
| $35,000 to $39,999 | 53 (14.5%) | 61 (9.7%) |
| $40,000 to $44,999 | 60 (16.4%) | 78 (12.4%) |
| $45,000 to $49,999 | 9 (2.5%) | 95 (15.1%) |
| $50,000 to $54,999 | 18 (4.9%) | 8 (1.3%) |
| $55,000 to $64,999 | 58 (15.9%) | 22 (3.5%) |
| $65,000 to $74,999 | 7 (1.9%) | 59 (9.3%) |
| $75,000 to $99,999 | 16 (4.4%) | 60 (9.5%) |
| $100,000+ | 22 (6.0%) | 66 (10.5%) |
| Total | 366 (100.0%) | 631 (100.0%) |
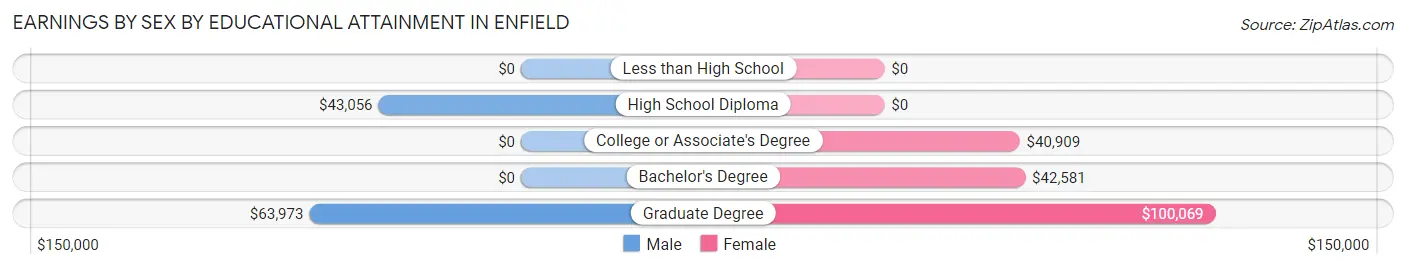
Earnings by Sex by Educational Attainment in Enfield
Average earnings in Enfield are $42,500 for men and $46,420 for women, a difference of 8.4%. Men with an educational attainment of graduate degree enjoy the highest average annual earnings of $63,973, while those with high school diploma education earn the least with $43,056. Women with an educational attainment of graduate degree earn the most with the average annual earnings of $100,069, while those with college or associate's degree education have the smallest earnings of $40,909.
| Educational Attainment | Male Income | Female Income |
| Less than High School | - | - |
| High School Diploma | $43,056 | $0 |
| College or Associate's Degree | - | - |
| Bachelor's Degree | - | - |
| Graduate Degree | $63,973 | $100,069 |
| Total | $42,500 | $46,420 |
Family Income in Enfield
Family Income Brackets in Enfield
According to the Enfield family income data, there are 162 families falling into the $75,000 to $99,999 income range, which is the most common income bracket and makes up 27.7% of all families.
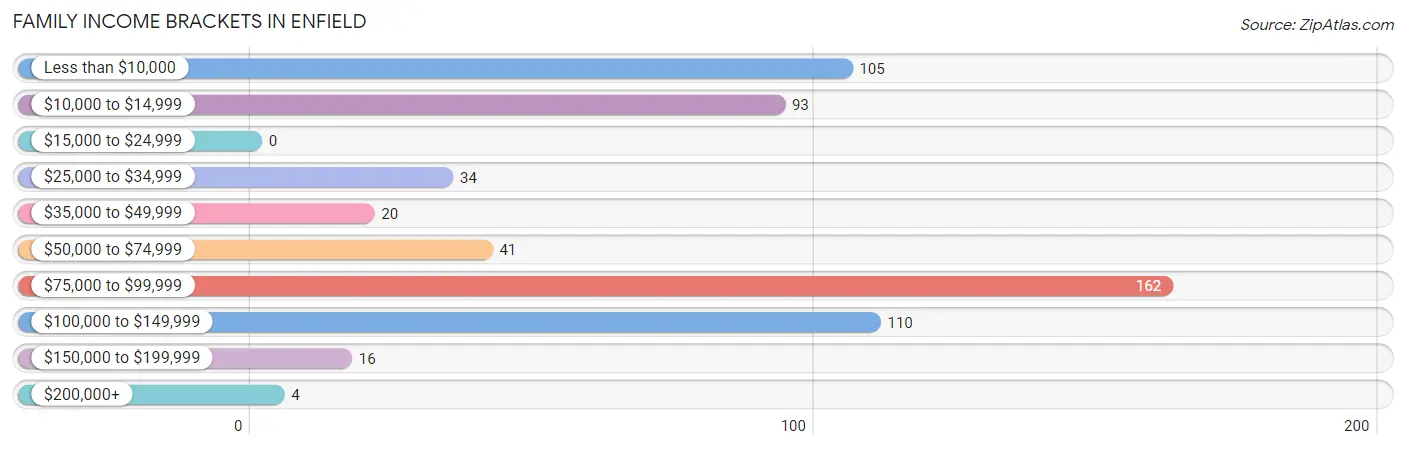
| Income Bracket | # Families | % Families |
| Less than $10,000 | 105 | 17.9% |
| $10,000 to $14,999 | 93 | 15.9% |
| $15,000 to $24,999 | 0 | 0.0% |
| $25,000 to $34,999 | 34 | 5.8% |
| $35,000 to $49,999 | 20 | 3.4% |
| $50,000 to $74,999 | 41 | 7.0% |
| $75,000 to $99,999 | 162 | 27.7% |
| $100,000 to $149,999 | 110 | 18.8% |
| $150,000 to $199,999 | 16 | 2.7% |
| $200,000+ | 4 | 0.7% |
Family Income by Famaliy Size in Enfield
| Income Bracket | # Families | Median Income |
| 2-Person Families | 400 (68.4%) | $0 |
| 3-Person Families | 70 (12.0%) | $0 |
| 4-Person Families | 56 (9.6%) | $0 |
| 5-Person Families | 25 (4.3%) | $0 |
| 6-Person Families | 34 (5.8%) | $0 |
| 7+ Person Families | 0 (0.0%) | $0 |
| Total | 585 (100.0%) | $0 |
Family Income by Number of Earners in Enfield
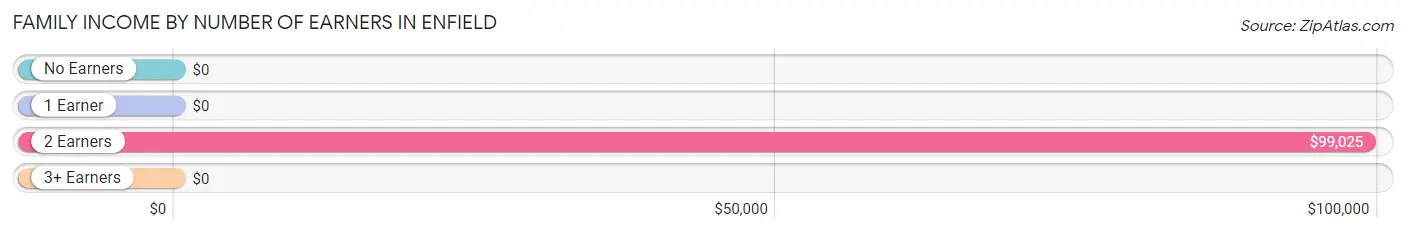
| Number of Earners | # Families | Median Income |
| No Earners | 248 (42.4%) | $0 |
| 1 Earner | 69 (11.8%) | $0 |
| 2 Earners | 237 (40.5%) | $99,025 |
| 3+ Earners | 31 (5.3%) | $0 |
| Total | 585 (100.0%) | $0 |
Household Income in Enfield
Household Income Brackets in Enfield
With 162 households falling in the category, the $75,000 to $99,999 income range is the most frequent in Enfield, accounting for 18.1% of all households. In contrast, only 4 households (0.4%) fall into the $200,000+ income bracket, making it the least populous group.
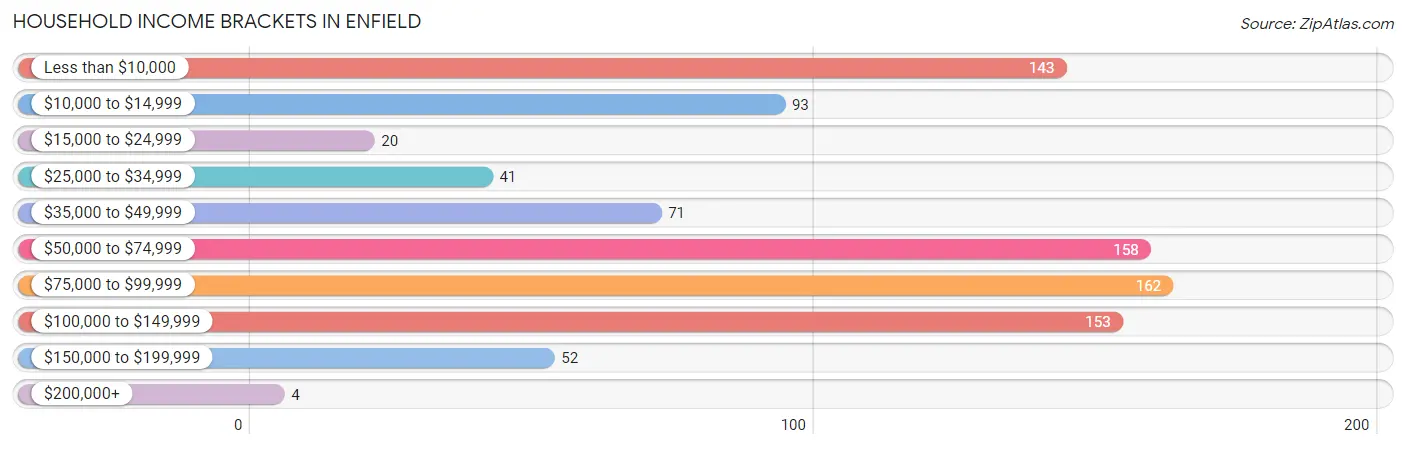
| Income Bracket | # Households | % Households |
| Less than $10,000 | 143 | 15.9% |
| $10,000 to $14,999 | 93 | 10.4% |
| $15,000 to $24,999 | 20 | 2.2% |
| $25,000 to $34,999 | 41 | 4.6% |
| $35,000 to $49,999 | 71 | 7.9% |
| $50,000 to $74,999 | 158 | 17.6% |
| $75,000 to $99,999 | 162 | 18.1% |
| $100,000 to $149,999 | 153 | 17.1% |
| $150,000 to $199,999 | 52 | 5.8% |
| $200,000+ | 4 | 0.4% |
Household Income by Householder Age in Enfield
The median household income in Enfield is $54,493, with the highest median household income of $91,941 found in the 25 to 44 years age bracket for the primary householder. A total of 219 households (24.4%) fall into this category. Meanwhile, the 15 to 24 years age bracket for the primary householder has the lowest median household income of $0, with 34 households (3.8%) in this group.
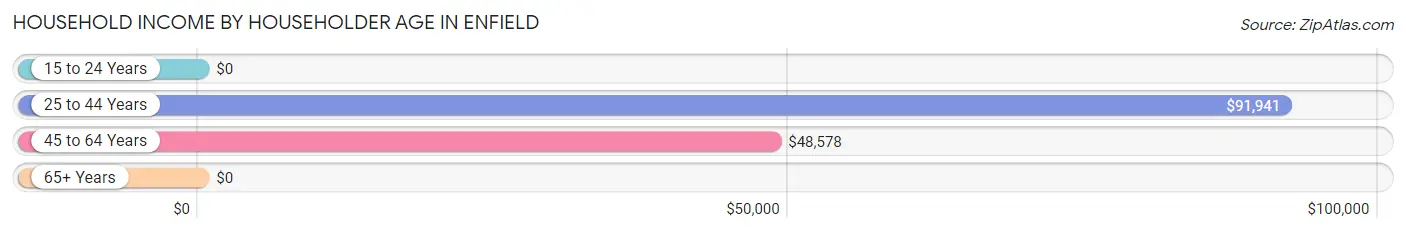
| Income Bracket | # Households | Median Income |
| 15 to 24 Years | 34 (3.8%) | $0 |
| 25 to 44 Years | 219 (24.4%) | $91,941 |
| 45 to 64 Years | 304 (33.9%) | $48,578 |
| 65+ Years | 340 (37.9%) | $0 |
| Total | 897 (100.0%) | $54,493 |
Poverty in Enfield
Income Below Poverty by Sex and Age in Enfield
With 21.4% poverty level for males and 19.9% for females among the residents of Enfield, 65 to 74 year old males and 65 to 74 year old females are the most vulnerable to poverty, with 208 males (70.0%) and 105 females (52.5%) in their respective age groups living below the poverty level.
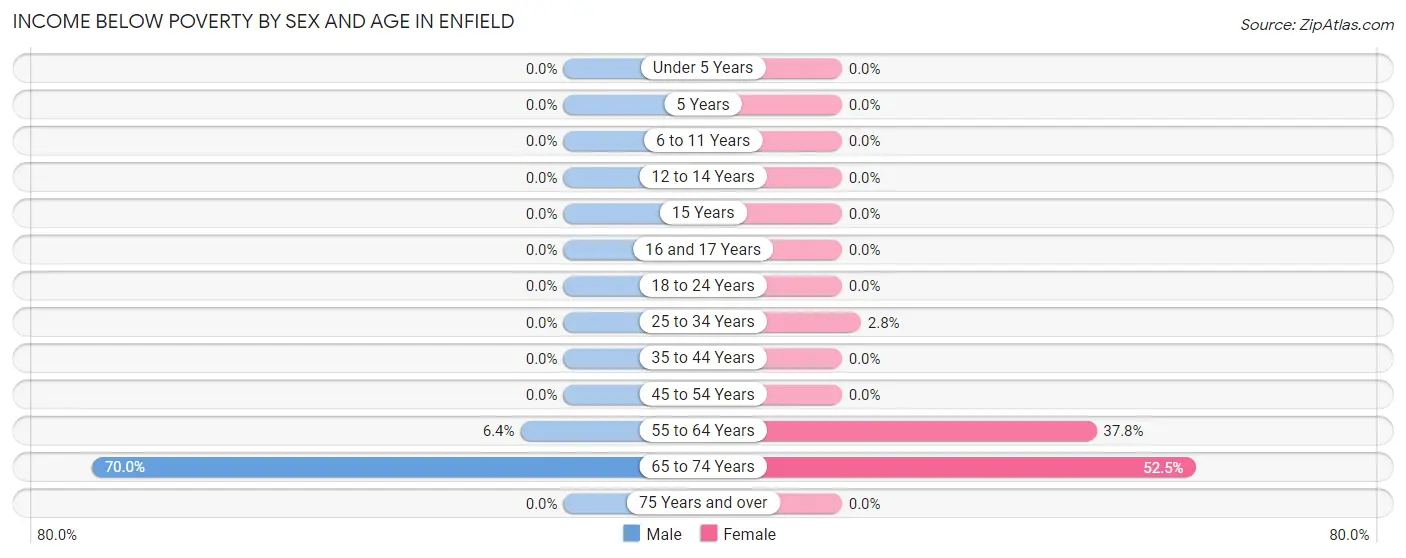
| Age Bracket | Male | Female |
| Under 5 Years | 0 (0.0%) | 0 (0.0%) |
| 5 Years | 0 (0.0%) | 0 (0.0%) |
| 6 to 11 Years | 0 (0.0%) | 0 (0.0%) |
| 12 to 14 Years | 0 (0.0%) | 0 (0.0%) |
| 15 Years | 0 (0.0%) | 0 (0.0%) |
| 16 and 17 Years | 0 (0.0%) | 0 (0.0%) |
| 18 to 24 Years | 0 (0.0%) | 0 (0.0%) |
| 25 to 34 Years | 0 (0.0%) | 3 (2.8%) |
| 35 to 44 Years | 0 (0.0%) | 0 (0.0%) |
| 45 to 54 Years | 0 (0.0%) | 0 (0.0%) |
| 55 to 64 Years | 3 (6.4%) | 110 (37.8%) |
| 65 to 74 Years | 208 (70.0%) | 105 (52.5%) |
| 75 Years and over | 0 (0.0%) | 0 (0.0%) |
| Total | 211 (21.4%) | 218 (19.9%) |
Income Above Poverty by Sex and Age in Enfield
According to the poverty statistics in Enfield, males aged under 5 years and females aged under 5 years are the age groups that are most secure financially, with 100.0% of males and 100.0% of females in these age groups living above the poverty line.
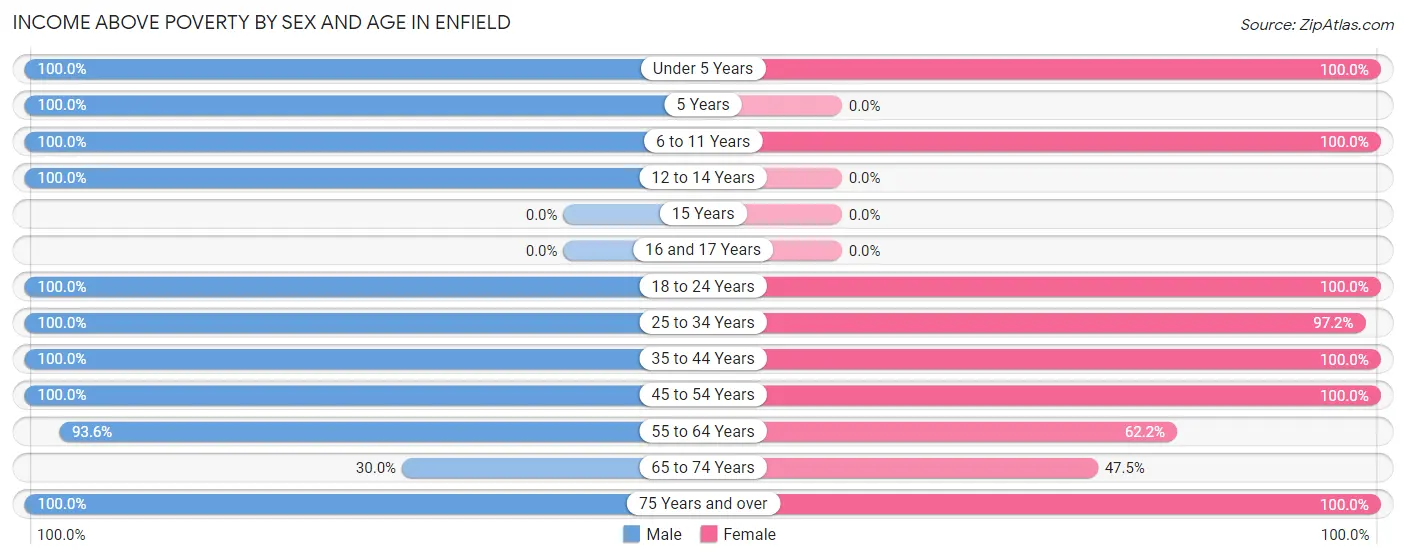
| Age Bracket | Male | Female |
| Under 5 Years | 196 (100.0%) | 120 (100.0%) |
| 5 Years | 23 (100.0%) | 0 (0.0%) |
| 6 to 11 Years | 57 (100.0%) | 13 (100.0%) |
| 12 to 14 Years | 73 (100.0%) | 0 (0.0%) |
| 15 Years | 0 (0.0%) | 0 (0.0%) |
| 16 and 17 Years | 0 (0.0%) | 0 (0.0%) |
| 18 to 24 Years | 34 (100.0%) | 61 (100.0%) |
| 25 to 34 Years | 97 (100.0%) | 103 (97.2%) |
| 35 to 44 Years | 118 (100.0%) | 150 (100.0%) |
| 45 to 54 Years | 19 (100.0%) | 87 (100.0%) |
| 55 to 64 Years | 44 (93.6%) | 181 (62.2%) |
| 65 to 74 Years | 89 (30.0%) | 95 (47.5%) |
| 75 Years and over | 24 (100.0%) | 66 (100.0%) |
| Total | 774 (78.6%) | 876 (80.1%) |
Income Below Poverty Among Married-Couple Families in Enfield
The poverty statistics for married-couple families in Enfield show that 37.6% or 198 of the total 526 families live below the poverty line. Families with no children have the highest poverty rate of 51.3%, comprising of 198 families. On the other hand, families with 1 or 2 children have the lowest poverty rate of 0.0%, which includes 0 families.
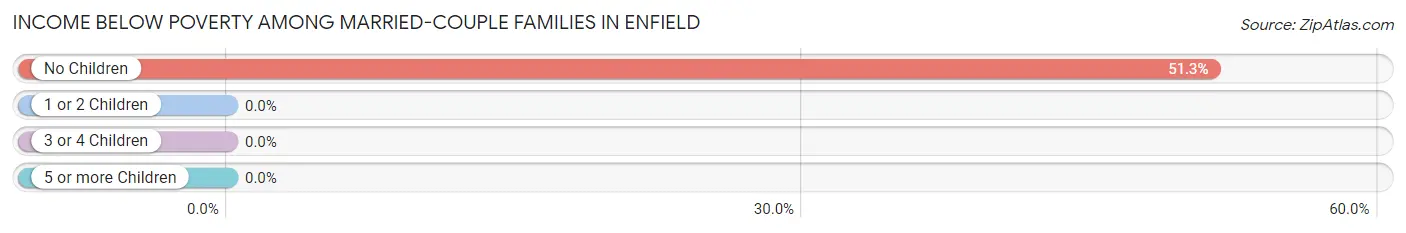
| Children | Above Poverty | Below Poverty |
| No Children | 188 (48.7%) | 198 (51.3%) |
| 1 or 2 Children | 112 (100.0%) | 0 (0.0%) |
| 3 or 4 Children | 28 (100.0%) | 0 (0.0%) |
| 5 or more Children | 0 (0.0%) | 0 (0.0%) |
| Total | 328 (62.4%) | 198 (37.6%) |
Income Below Poverty Among Single-Parent Households in Enfield
| Children | Single Father | Single Mother |
| No Children | 0 (0.0%) | 0 (0.0%) |
| 1 or 2 Children | 0 (0.0%) | 0 (0.0%) |
| 3 or 4 Children | 0 (0.0%) | 0 (0.0%) |
| 5 or more Children | 0 (0.0%) | 0 (0.0%) |
| Total | 0 (0.0%) | 0 (0.0%) |
Income Below Poverty Among Married-Couple vs Single-Parent Households in Enfield
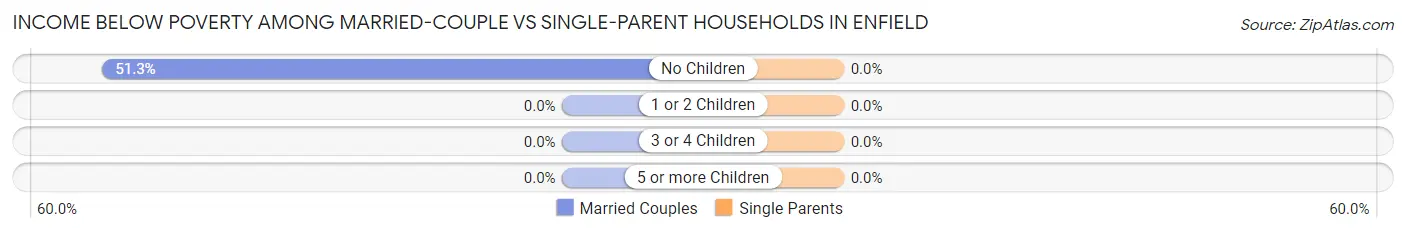
| Children | Married-Couple Families | Single-Parent Households |
| No Children | 198 (51.3%) | 0 (0.0%) |
| 1 or 2 Children | 0 (0.0%) | 0 (0.0%) |
| 3 or 4 Children | 0 (0.0%) | 0 (0.0%) |
| 5 or more Children | 0 (0.0%) | 0 (0.0%) |
| Total | 198 (37.6%) | 0 (0.0%) |
Race in Enfield
The most populous races in Enfield are White / Caucasian (2,067 | 99.4%), Two or more Races (11 | 0.5%), and Hispanic or Latino (3 | 0.1%).
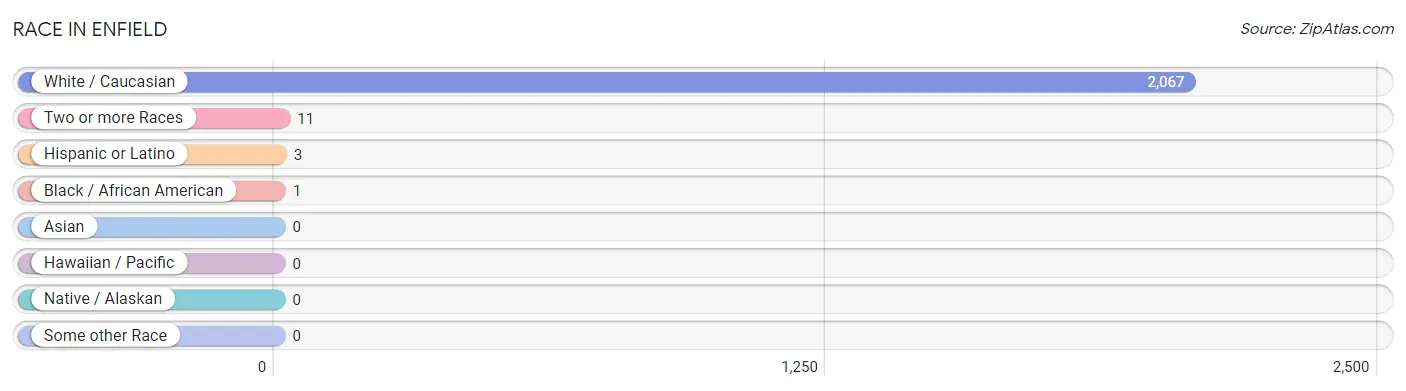
| Race | # Population | % Population |
| Asian | 0 | 0.0% |
| Black / African American | 1 | 0.1% |
| Hawaiian / Pacific | 0 | 0.0% |
| Hispanic or Latino | 3 | 0.1% |
| Native / Alaskan | 0 | 0.0% |
| White / Caucasian | 2,067 | 99.4% |
| Two or more Races | 11 | 0.5% |
| Some other Race | 0 | 0.0% |
| Total | 2,079 | 100.0% |
Ancestry in Enfield
The most populous ancestries reported in Enfield are English (695 | 33.4%), French (584 | 28.1%), Irish (301 | 14.5%), Scottish (260 | 12.5%), and Danish (144 | 6.9%), together accounting for 95.4% of all Enfield residents.
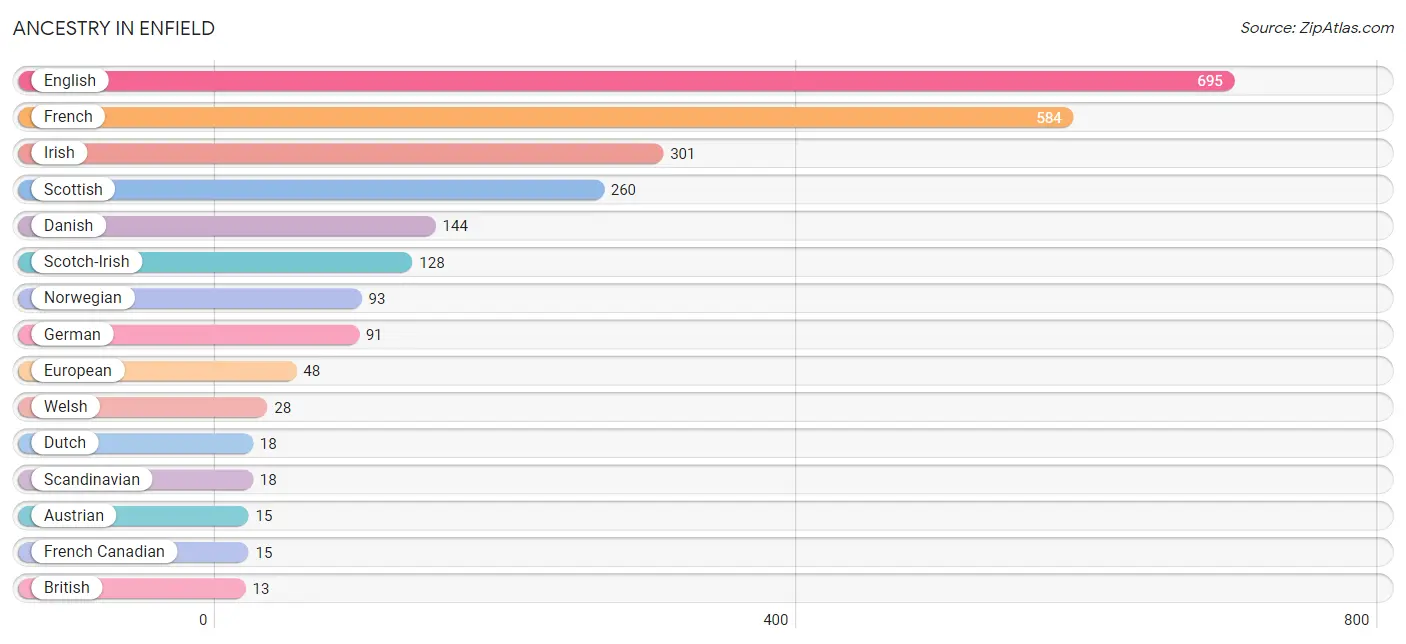
| Ancestry | # Population | % Population |
| American | 3 | 0.1% |
| Austrian | 15 | 0.7% |
| British | 13 | 0.6% |
| Canadian | 13 | 0.6% |
| Danish | 144 | 6.9% |
| Dominican | 3 | 0.1% |
| Dutch | 18 | 0.9% |
| English | 695 | 33.4% |
| European | 48 | 2.3% |
| French | 584 | 28.1% |
| French Canadian | 15 | 0.7% |
| German | 91 | 4.4% |
| Irish | 301 | 14.5% |
| Italian | 7 | 0.3% |
| Jamaican | 11 | 0.5% |
| Nigerian | 1 | 0.1% |
| Norwegian | 93 | 4.5% |
| Polish | 6 | 0.3% |
| Scandinavian | 18 | 0.9% |
| Scotch-Irish | 128 | 6.2% |
| Scottish | 260 | 12.5% |
| Subsaharan African | 1 | 0.1% |
| Welsh | 28 | 1.3% | View All 23 Rows |
Immigrants in Enfield
The most numerous immigrant groups reported in Enfield came from Europe (13 | 0.6%), Northern Europe (13 | 0.6%), Africa (1 | 0.1%), Nigeria (1 | 0.1%), and Western Africa (1 | 0.1%), together accounting for 1.4% of all Enfield residents.
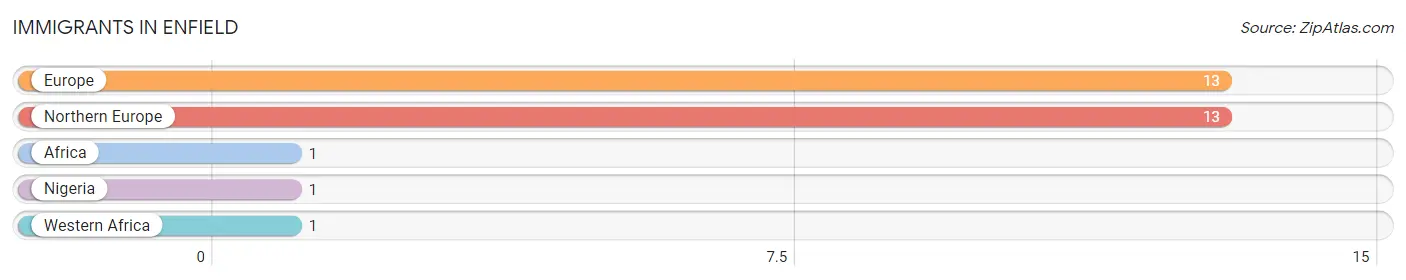
| Immigration Origin | # Population | % Population |
| Africa | 1 | 0.1% |
| Europe | 13 | 0.6% |
| Nigeria | 1 | 0.1% |
| Northern Europe | 13 | 0.6% |
| Western Africa | 1 | 0.1% | View All 5 Rows |
Sex and Age in Enfield
Sex and Age in Enfield
The most populous age groups in Enfield are 70 to 74 Years (226 | 22.9%) for men and 60 to 64 Years (160 | 14.6%) for women.
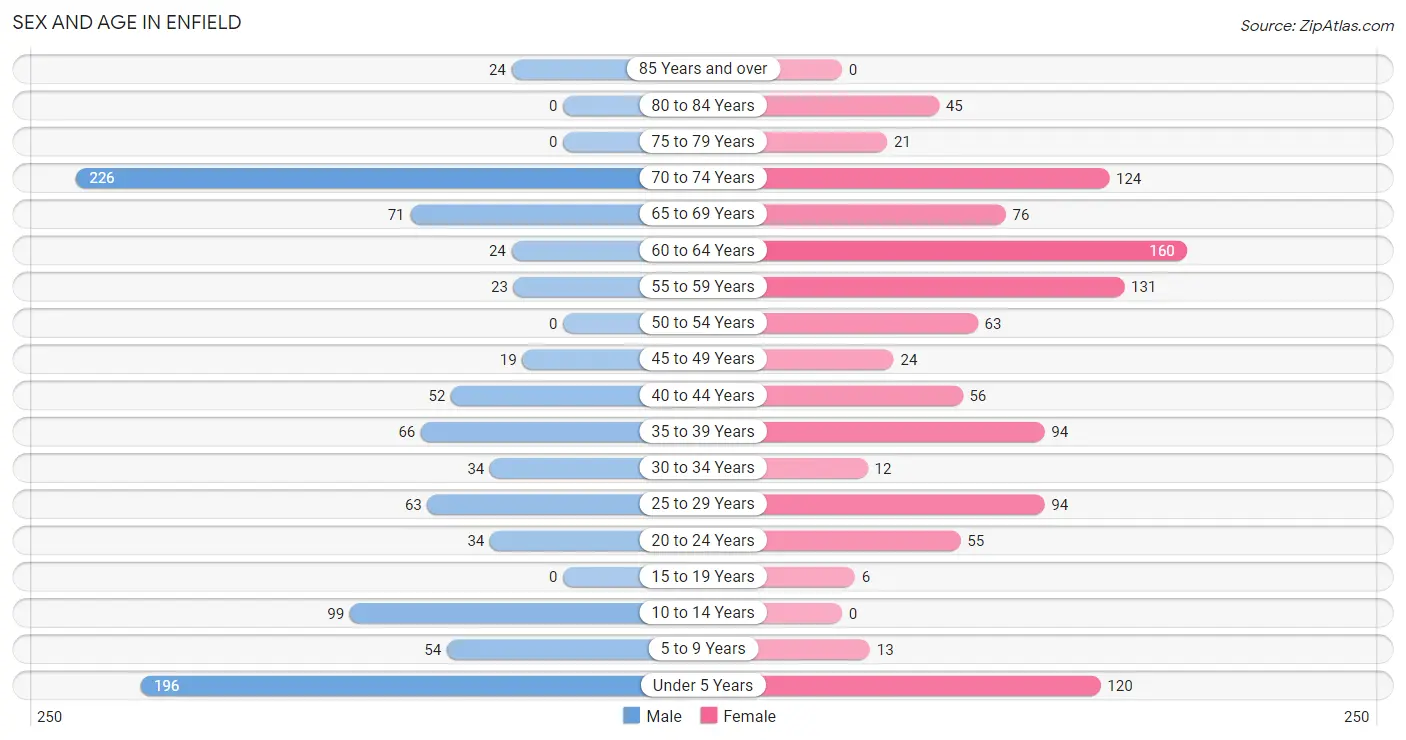
| Age Bracket | Male | Female |
| Under 5 Years | 196 (19.9%) | 120 (11.0%) |
| 5 to 9 Years | 54 (5.5%) | 13 (1.2%) |
| 10 to 14 Years | 99 (10.1%) | 0 (0.0%) |
| 15 to 19 Years | 0 (0.0%) | 6 (0.5%) |
| 20 to 24 Years | 34 (3.5%) | 55 (5.0%) |
| 25 to 29 Years | 63 (6.4%) | 94 (8.6%) |
| 30 to 34 Years | 34 (3.5%) | 12 (1.1%) |
| 35 to 39 Years | 66 (6.7%) | 94 (8.6%) |
| 40 to 44 Years | 52 (5.3%) | 56 (5.1%) |
| 45 to 49 Years | 19 (1.9%) | 24 (2.2%) |
| 50 to 54 Years | 0 (0.0%) | 63 (5.8%) |
| 55 to 59 Years | 23 (2.3%) | 131 (12.0%) |
| 60 to 64 Years | 24 (2.4%) | 160 (14.6%) |
| 65 to 69 Years | 71 (7.2%) | 76 (7.0%) |
| 70 to 74 Years | 226 (22.9%) | 124 (11.3%) |
| 75 to 79 Years | 0 (0.0%) | 21 (1.9%) |
| 80 to 84 Years | 0 (0.0%) | 45 (4.1%) |
| 85 Years and over | 24 (2.4%) | 0 (0.0%) |
| Total | 985 (100.0%) | 1,094 (100.0%) |
Families and Households in Enfield
Median Family Size in Enfield
The median family size in Enfield is 2.85 persons per family, with single male/father families (34 | 5.8%) accounting for the largest median family size of 4.15 persons per family. On the other hand, single female/mother families (25 | 4.3%) represent the smallest median family size with 2.64 persons per family.
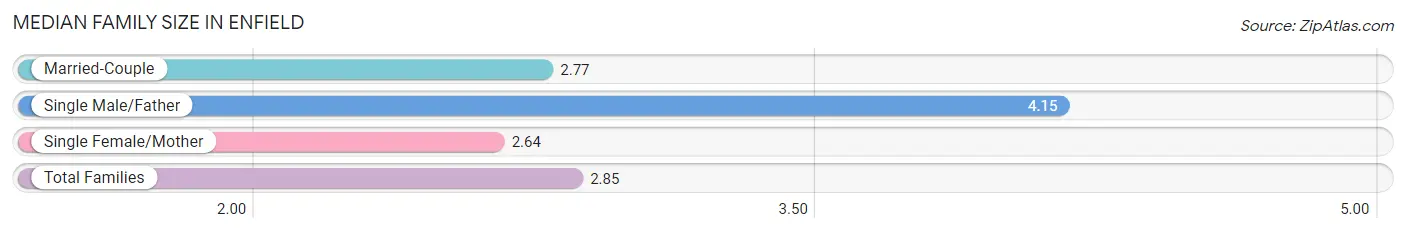
| Family Type | # Families | Family Size |
| Married-Couple | 526 (89.9%) | 2.77 |
| Single Male/Father | 34 (5.8%) | 4.15 |
| Single Female/Mother | 25 (4.3%) | 2.64 |
| Total Families | 585 (100.0%) | 2.85 |
Median Household Size in Enfield
The median household size in Enfield is 2.31 persons per household, with single male/father households (34 | 3.8%) accounting for the largest median household size of 5.76 persons per household. non-family households (312 | 34.8%) represent the smallest median household size with 1.09 persons per household.
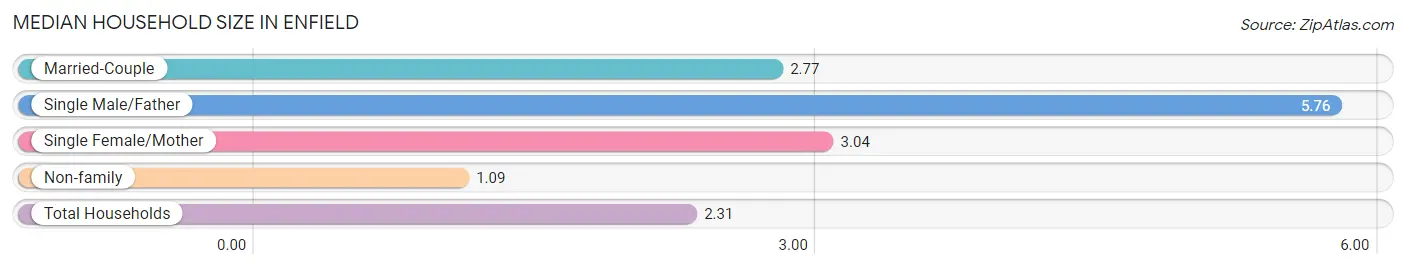
| Household Type | # Households | Household Size |
| Married-Couple | 526 (58.6%) | 2.77 |
| Single Male/Father | 34 (3.8%) | 5.76 |
| Single Female/Mother | 25 (2.8%) | 3.04 |
| Non-family | 312 (34.8%) | 1.09 |
| Total Households | 897 (100.0%) | 2.31 |
Household Size by Marriage Status in Enfield
Out of a total of 897 households in Enfield, 585 (65.2%) are family households, while 312 (34.8%) are nonfamily households. The most numerous type of family households are 2-person households, comprising 400, and the most common type of nonfamily households are 1-person households, comprising 262.
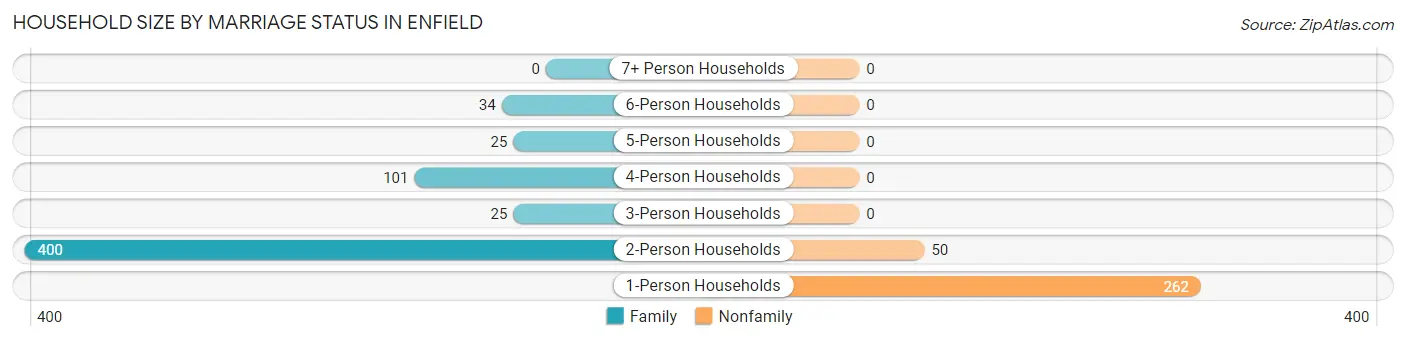
| Household Size | Family Households | Nonfamily Households |
| 1-Person Households | - | 262 (29.2%) |
| 2-Person Households | 400 (44.6%) | 50 (5.6%) |
| 3-Person Households | 25 (2.8%) | 0 (0.0%) |
| 4-Person Households | 101 (11.3%) | 0 (0.0%) |
| 5-Person Households | 25 (2.8%) | 0 (0.0%) |
| 6-Person Households | 34 (3.8%) | 0 (0.0%) |
| 7+ Person Households | 0 (0.0%) | 0 (0.0%) |
| Total | 585 (65.2%) | 312 (34.8%) |
Female Fertility in Enfield
Fertility by Age in Enfield
Average fertility rate in Enfield is 229.0 births per 1,000 women. Women in the age bracket of 20 to 34 years have the highest fertility rate with 429.0 births per 1,000 women. Women in the age bracket of 20 to 34 years acount for 88.5% of all women with births.
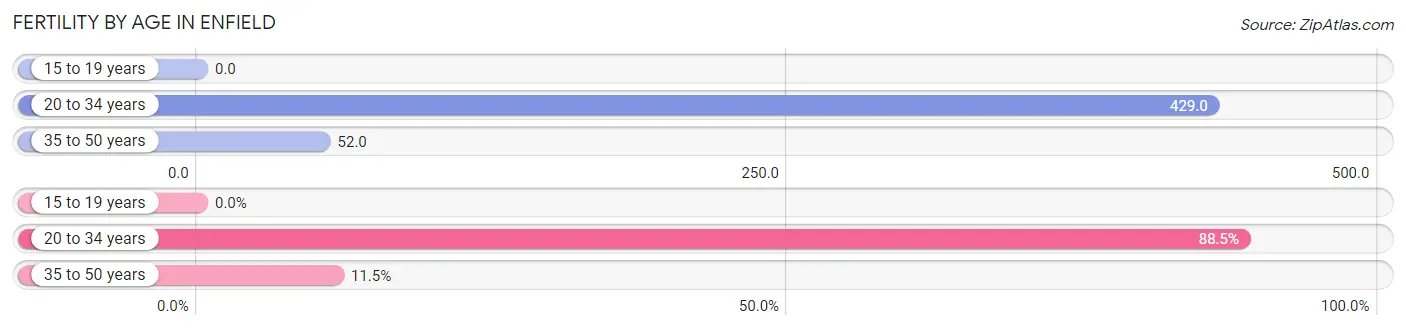
| Age Bracket | Women with Births | Births / 1,000 Women |
| 15 to 19 years | 0 (0.0%) | 0.0 |
| 20 to 34 years | 69 (88.5%) | 429.0 |
| 35 to 50 years | 9 (11.5%) | 52.0 |
| Total | 78 (100.0%) | 229.0 |
Fertility by Age by Marriage Status in Enfield
11.5% of women with births (78) in Enfield are married. The highest percentage of unmarried women with births falls into 20 to 34 years age bracket with 100.0% of them unmarried at the time of birth, while the lowest percentage of unmarried women with births belong to 35 to 50 years age bracket with 0.0% of them unmarried.
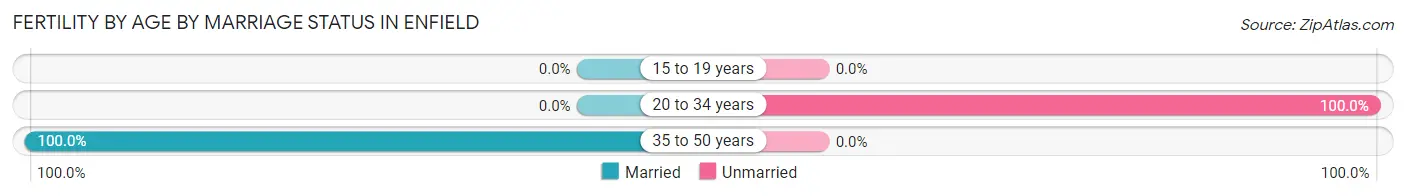
| Age Bracket | Married | Unmarried |
| 15 to 19 years | 0 (0.0%) | 0 (0.0%) |
| 20 to 34 years | 0 (0.0%) | 69 (100.0%) |
| 35 to 50 years | 9 (100.0%) | 0 (0.0%) |
| Total | 9 (11.5%) | 69 (88.5%) |
Fertility by Education in Enfield
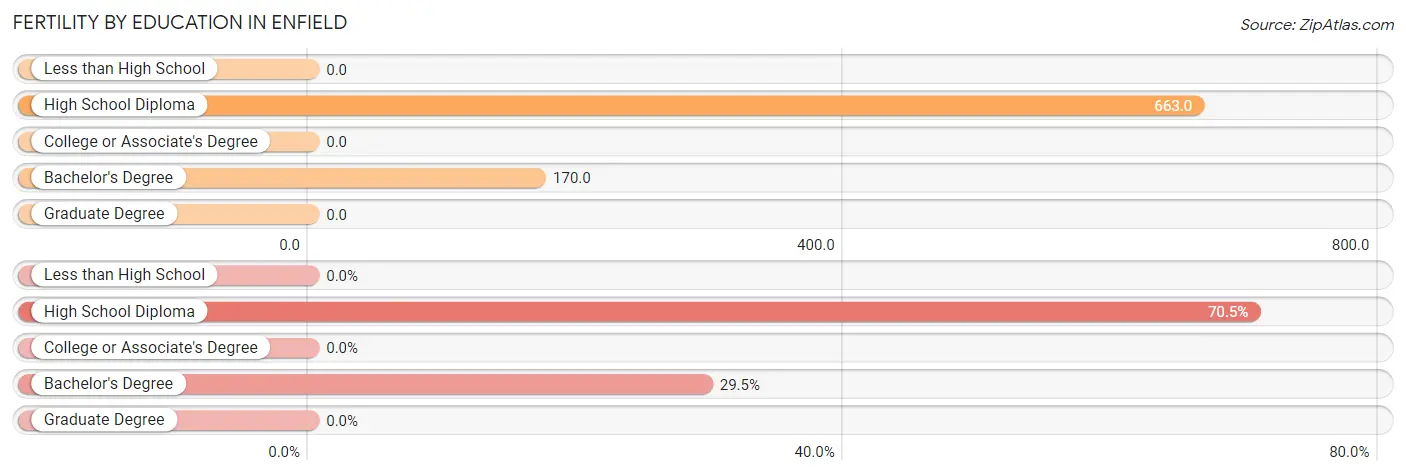
| Educational Attainment | Women with Births | Births / 1,000 Women |
| Less than High School | 0 (0.0%) | 0.0 |
| High School Diploma | 55 (70.5%) | 663.0 |
| College or Associate's Degree | 0 (0.0%) | 0.0 |
| Bachelor's Degree | 23 (29.5%) | 170.0 |
| Graduate Degree | 0 (0.0%) | 0.0 |
| Total | 78 (100.0%) | 229.0 |
Fertility by Education by Marriage Status in Enfield
88.5% of women with births in Enfield are unmarried. Women with the educational attainment of bachelor's degree are most likely to be married with 39.1% of them married at childbirth, while women with the educational attainment of high school diploma are least likely to be married with 100.0% of them unmarried at childbirth.
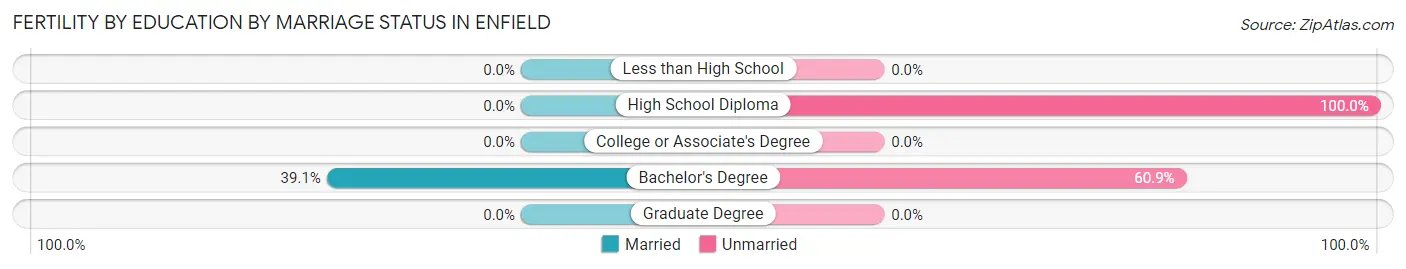
| Educational Attainment | Married | Unmarried |
| Less than High School | 0 (0.0%) | 0 (0.0%) |
| High School Diploma | 0 (0.0%) | 55 (100.0%) |
| College or Associate's Degree | 0 (0.0%) | 0 (0.0%) |
| Bachelor's Degree | 9 (39.1%) | 14 (60.9%) |
| Graduate Degree | 0 (0.0%) | 0 (0.0%) |
| Total | 9 (11.5%) | 69 (88.5%) |
Employment Characteristics in Enfield
Employment by Class of Employer in Enfield
Among the 950 employed individuals in Enfield, private company employees (520 | 54.7%), not-for-profit organizations (231 | 24.3%), and self-employed (not incorporated) (104 | 11.0%) make up the most common classes of employment.
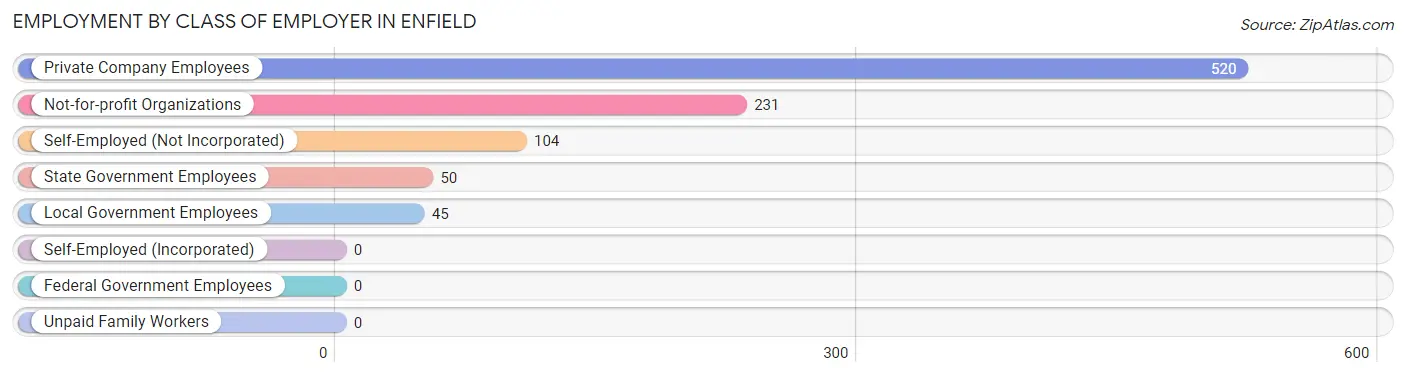
| Employer Class | # Employees | % Employees |
| Private Company Employees | 520 | 54.7% |
| Self-Employed (Incorporated) | 0 | 0.0% |
| Self-Employed (Not Incorporated) | 104 | 11.0% |
| Not-for-profit Organizations | 231 | 24.3% |
| Local Government Employees | 45 | 4.7% |
| State Government Employees | 50 | 5.3% |
| Federal Government Employees | 0 | 0.0% |
| Unpaid Family Workers | 0 | 0.0% |
| Total | 950 | 100.0% |
Employment Status by Age in Enfield
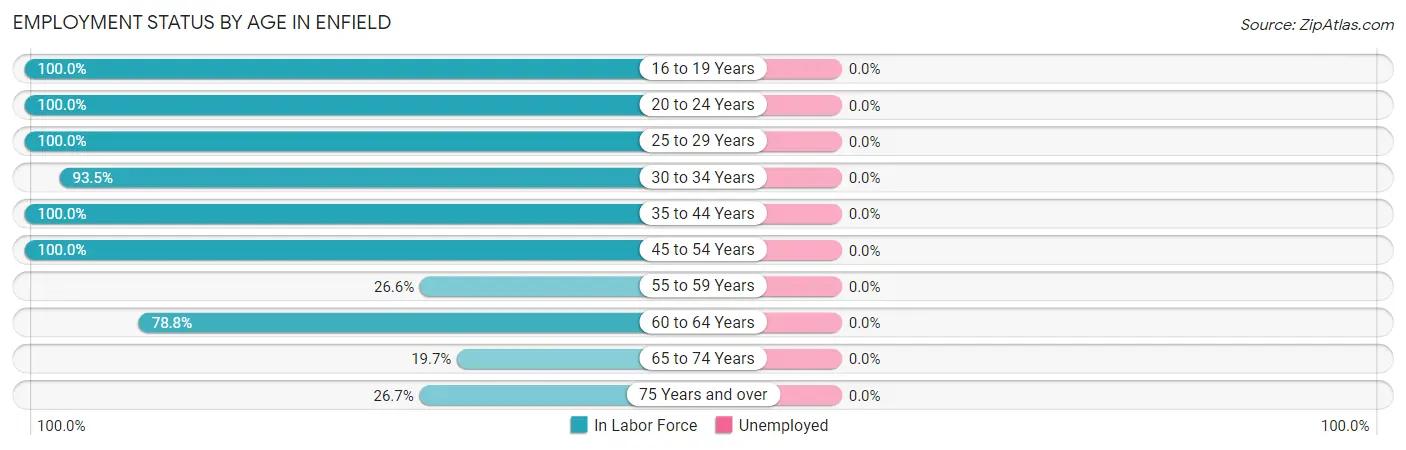
| Age Bracket | In Labor Force | Unemployed |
| 16 to 19 Years | 6 (100.0%) | 0 (0.0%) |
| 20 to 24 Years | 89 (100.0%) | 0 (0.0%) |
| 25 to 29 Years | 157 (100.0%) | 0 (0.0%) |
| 30 to 34 Years | 43 (93.5%) | 0 (0.0%) |
| 35 to 44 Years | 268 (100.0%) | 0 (0.0%) |
| 45 to 54 Years | 106 (100.0%) | 0 (0.0%) |
| 55 to 59 Years | 41 (26.6%) | 0 (0.0%) |
| 60 to 64 Years | 145 (78.8%) | 0 (0.0%) |
| 65 to 74 Years | 98 (19.7%) | 0 (0.0%) |
| 75 Years and over | 24 (26.7%) | 0 (0.0%) |
| Total | 977 (61.2%) | 0 (0.0%) |
Employment Status by Educational Attainment in Enfield
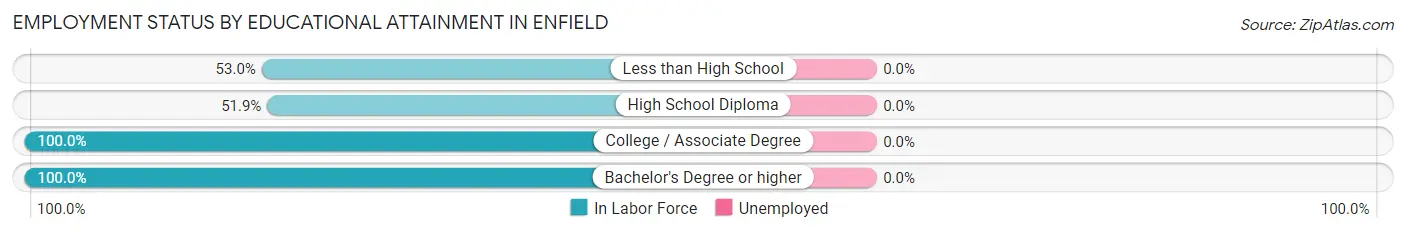
| Educational Attainment | In Labor Force | Unemployed |
| Less than High School | 44 (53.0%) | 0 (0.0%) |
| High School Diploma | 125 (51.9%) | 0 (0.0%) |
| College / Associate Degree | 188 (100.0%) | 0 (0.0%) |
| Bachelor's Degree or higher | 403 (100.0%) | 0 (0.0%) |
| Total | 760 (83.1%) | 0 (0.0%) |
Employment Occupations by Sex in Enfield
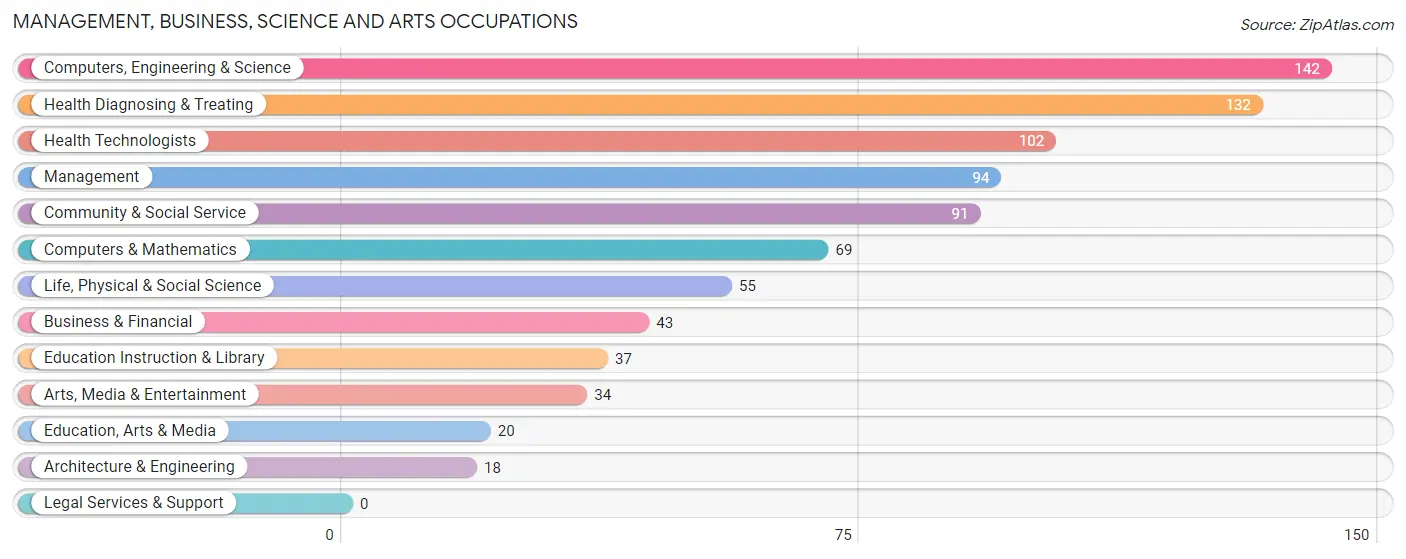
Management, Business, Science and Arts Occupations
The most common Management, Business, Science and Arts occupations in Enfield are Computers, Engineering & Science (142 | 14.5%), Health Diagnosing & Treating (132 | 13.5%), Health Technologists (102 | 10.4%), Management (94 | 9.6%), and Community & Social Service (91 | 9.3%).
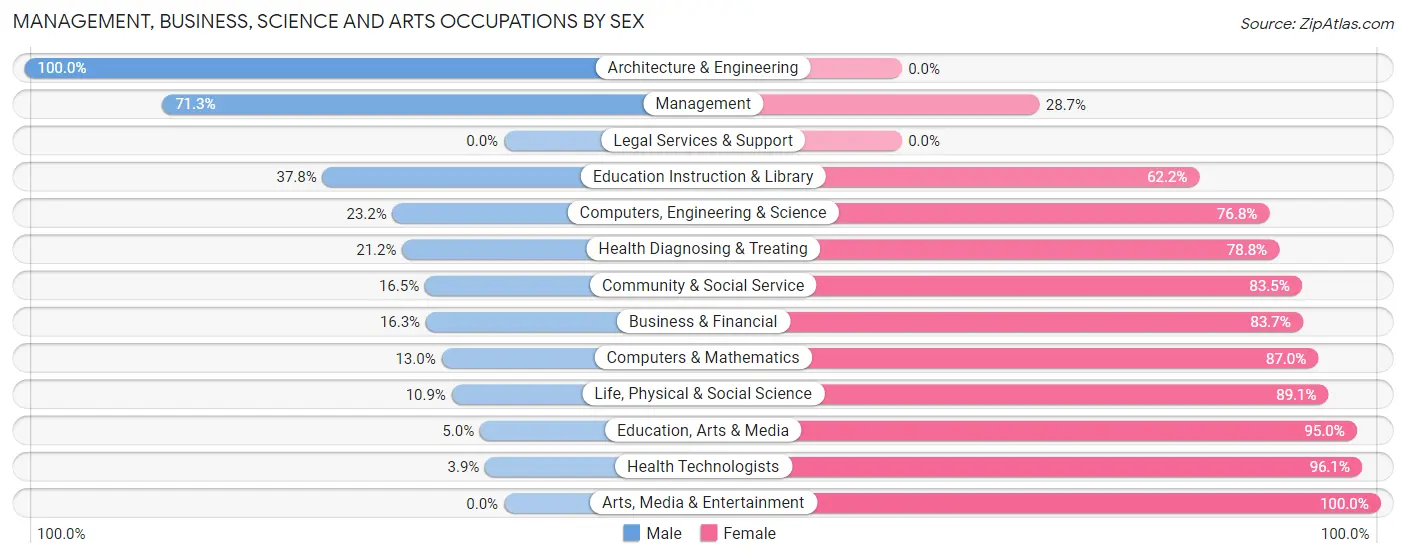
Management, Business, Science and Arts Occupations by Sex
Within the Management, Business, Science and Arts occupations in Enfield, the most male-oriented occupations are Architecture & Engineering (100.0%), Management (71.3%), and Education Instruction & Library (37.8%), while the most female-oriented occupations are Arts, Media & Entertainment (100.0%), Health Technologists (96.1%), and Education, Arts & Media (95.0%).
| Occupation | Male | Female |
| Management | 67 (71.3%) | 27 (28.7%) |
| Business & Financial | 7 (16.3%) | 36 (83.7%) |
| Computers, Engineering & Science | 33 (23.2%) | 109 (76.8%) |
| Computers & Mathematics | 9 (13.0%) | 60 (87.0%) |
| Architecture & Engineering | 18 (100.0%) | 0 (0.0%) |
| Life, Physical & Social Science | 6 (10.9%) | 49 (89.1%) |
| Community & Social Service | 15 (16.5%) | 76 (83.5%) |
| Education, Arts & Media | 1 (5.0%) | 19 (95.0%) |
| Legal Services & Support | 0 (0.0%) | 0 (0.0%) |
| Education Instruction & Library | 14 (37.8%) | 23 (62.2%) |
| Arts, Media & Entertainment | 0 (0.0%) | 34 (100.0%) |
| Health Diagnosing & Treating | 28 (21.2%) | 104 (78.8%) |
| Health Technologists | 4 (3.9%) | 98 (96.1%) |
| Total (Category) | 150 (29.9%) | 352 (70.1%) |
| Total (Overall) | 366 (37.5%) | 611 (62.5%) |
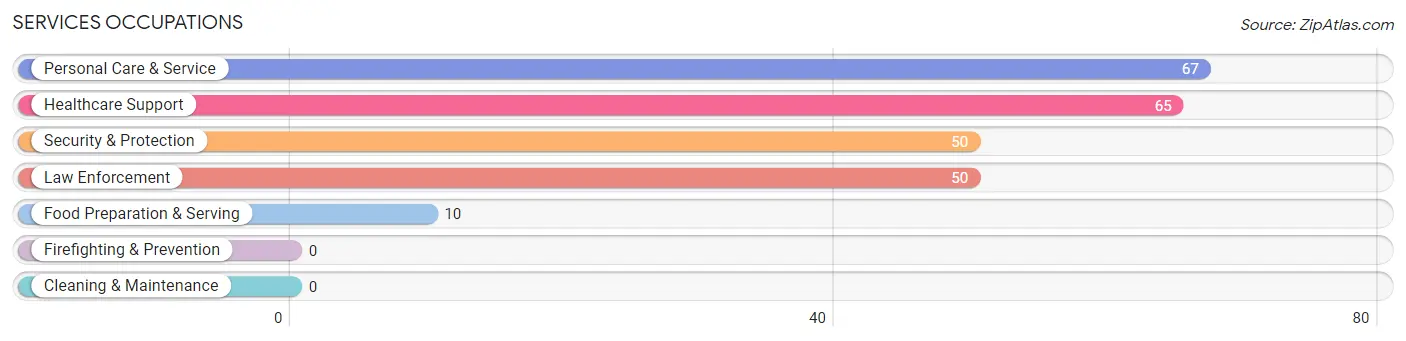
Services Occupations
The most common Services occupations in Enfield are Personal Care & Service (67 | 6.9%), Healthcare Support (65 | 6.7%), Security & Protection (50 | 5.1%), Law Enforcement (50 | 5.1%), and Food Preparation & Serving (10 | 1.0%).
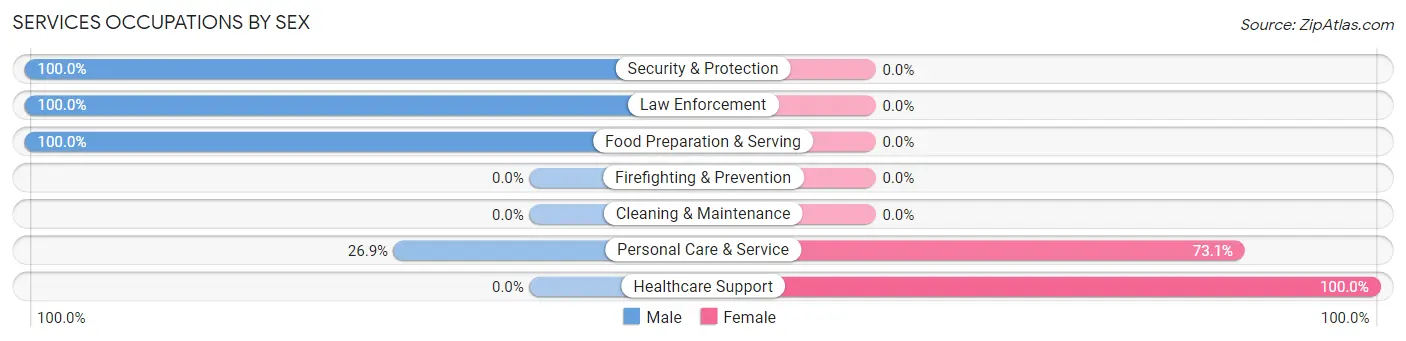
Services Occupations by Sex
Within the Services occupations in Enfield, the most male-oriented occupations are Security & Protection (100.0%), Law Enforcement (100.0%), and Food Preparation & Serving (100.0%), while the most female-oriented occupations are Healthcare Support (100.0%), and Personal Care & Service (73.1%).
| Occupation | Male | Female |
| Healthcare Support | 0 (0.0%) | 65 (100.0%) |
| Security & Protection | 50 (100.0%) | 0 (0.0%) |
| Firefighting & Prevention | 0 (0.0%) | 0 (0.0%) |
| Law Enforcement | 50 (100.0%) | 0 (0.0%) |
| Food Preparation & Serving | 10 (100.0%) | 0 (0.0%) |
| Cleaning & Maintenance | 0 (0.0%) | 0 (0.0%) |
| Personal Care & Service | 18 (26.9%) | 49 (73.1%) |
| Total (Category) | 78 (40.6%) | 114 (59.4%) |
| Total (Overall) | 366 (37.5%) | 611 (62.5%) |
Sales and Office Occupations
The most common Sales and Office occupations in Enfield are , and Office & Administration (89 | 9.1%).
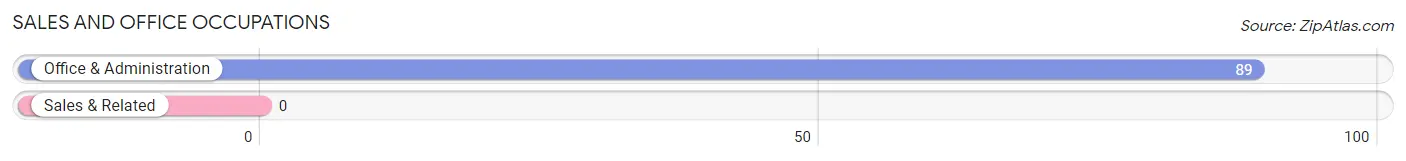
Sales and Office Occupations by Sex
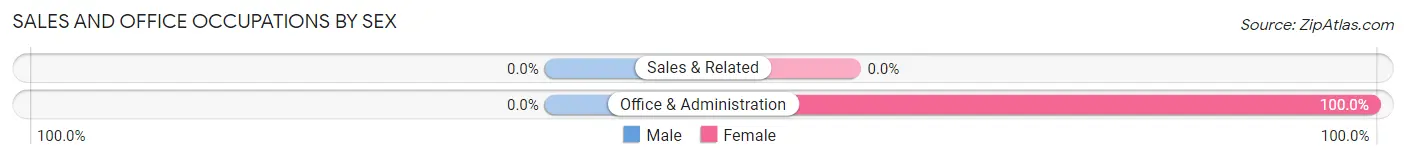
| Occupation | Male | Female |
| Sales & Related | 0 (0.0%) | 0 (0.0%) |
| Office & Administration | 0 (0.0%) | 89 (100.0%) |
| Total (Category) | 0 (0.0%) | 89 (100.0%) |
| Total (Overall) | 366 (37.5%) | 611 (62.5%) |
Natural Resources, Construction and Maintenance Occupations
The most common Natural Resources, Construction and Maintenance occupations in Enfield are , and Construction & Extraction (52 | 5.3%).
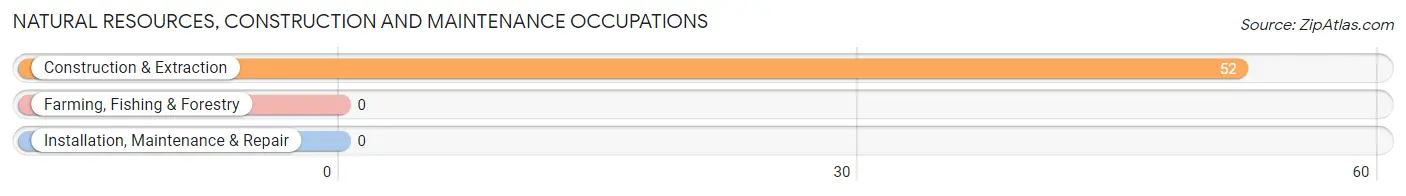
Natural Resources, Construction and Maintenance Occupations by Sex
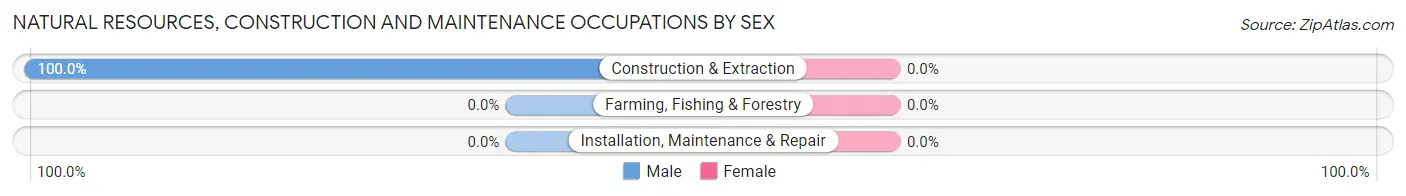
| Occupation | Male | Female |
| Farming, Fishing & Forestry | 0 (0.0%) | 0 (0.0%) |
| Construction & Extraction | 52 (100.0%) | 0 (0.0%) |
| Installation, Maintenance & Repair | 0 (0.0%) | 0 (0.0%) |
| Total (Category) | 52 (100.0%) | 0 (0.0%) |
| Total (Overall) | 366 (37.5%) | 611 (62.5%) |
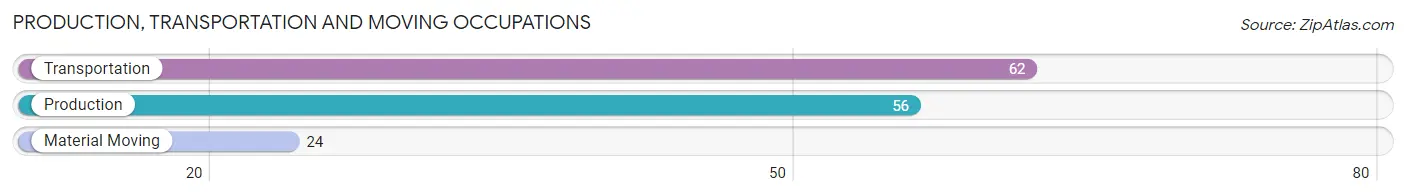
Production, Transportation and Moving Occupations
The most common Production, Transportation and Moving occupations in Enfield are Transportation (62 | 6.4%), Production (56 | 5.7%), and Material Moving (24 | 2.5%).
Production, Transportation and Moving Occupations by Sex
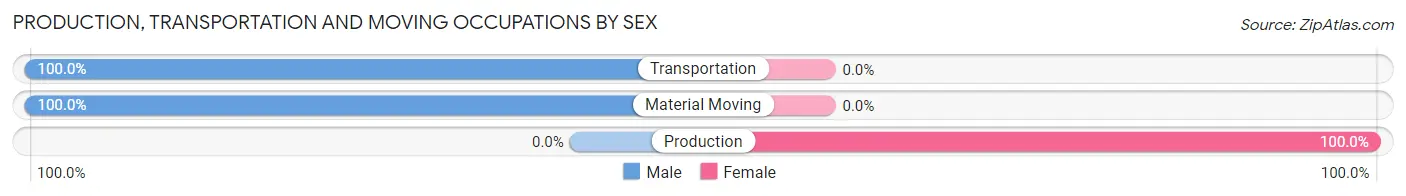
| Occupation | Male | Female |
| Production | 0 (0.0%) | 56 (100.0%) |
| Transportation | 62 (100.0%) | 0 (0.0%) |
| Material Moving | 24 (100.0%) | 0 (0.0%) |
| Total (Category) | 86 (60.6%) | 56 (39.4%) |
| Total (Overall) | 366 (37.5%) | 611 (62.5%) |
Employment Industries by Sex in Enfield
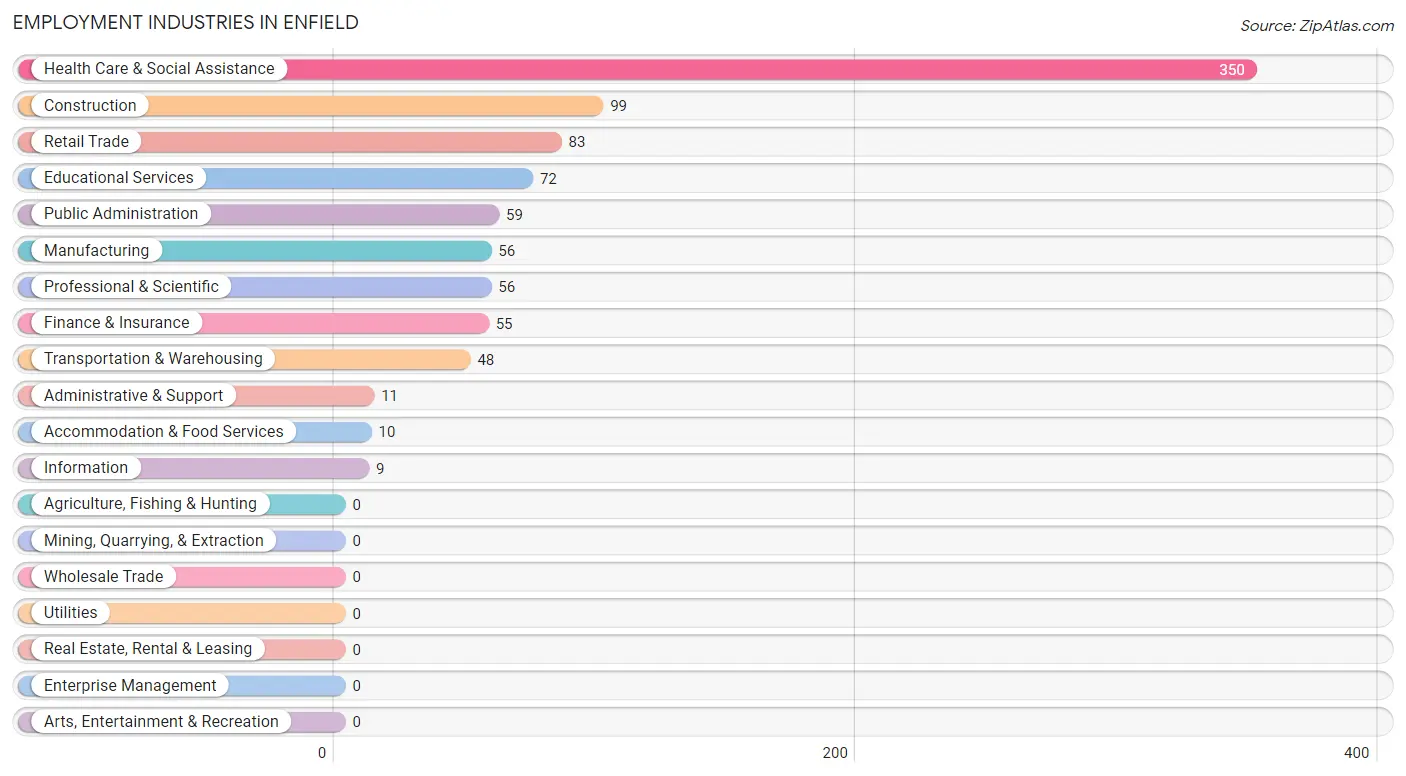
Employment Industries in Enfield
The major employment industries in Enfield include Health Care & Social Assistance (350 | 35.8%), Construction (99 | 10.1%), Retail Trade (83 | 8.5%), Educational Services (72 | 7.4%), and Public Administration (59 | 6.0%).
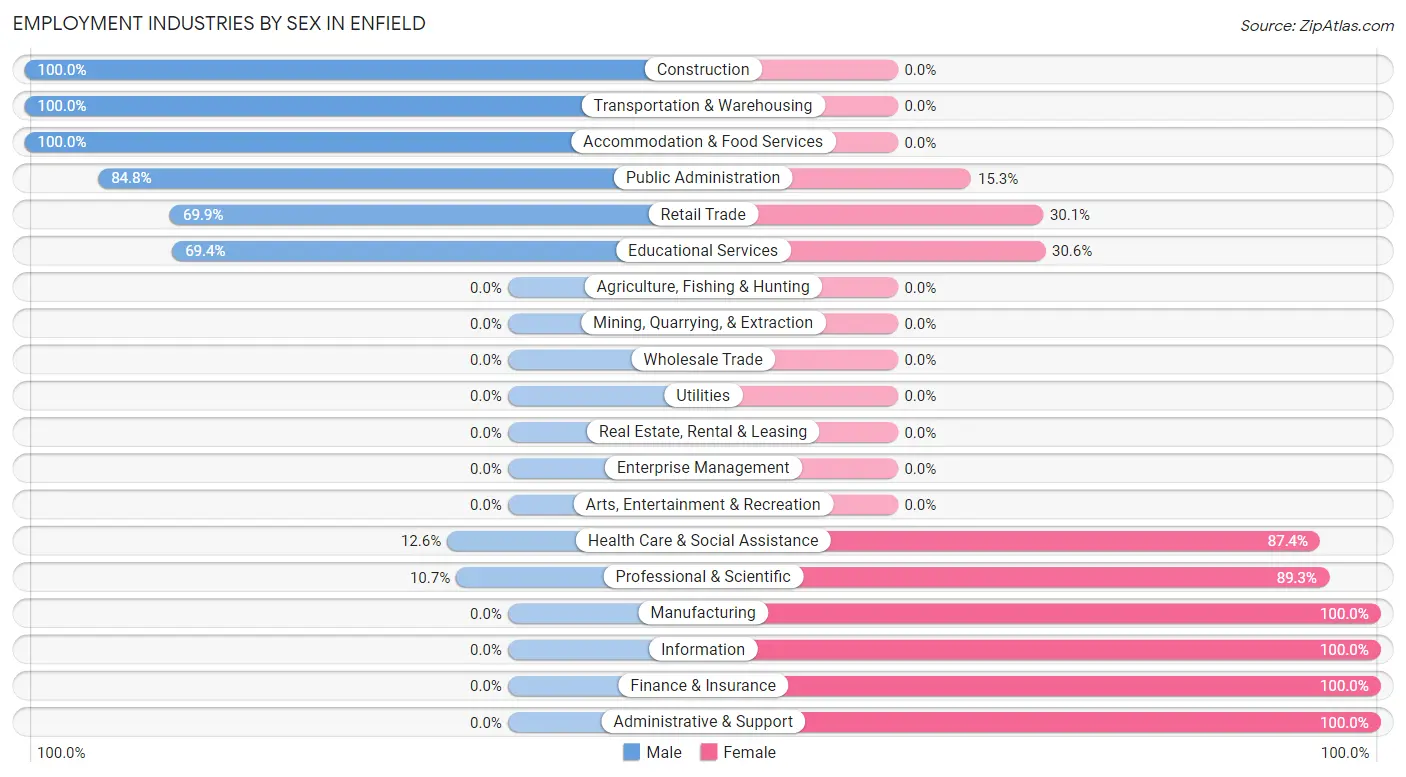
Employment Industries by Sex in Enfield
The Enfield industries that see more men than women are Construction (100.0%), Transportation & Warehousing (100.0%), and Accommodation & Food Services (100.0%), whereas the industries that tend to have a higher number of women are Manufacturing (100.0%), Information (100.0%), and Finance & Insurance (100.0%).
| Industry | Male | Female |
| Agriculture, Fishing & Hunting | 0 (0.0%) | 0 (0.0%) |
| Mining, Quarrying, & Extraction | 0 (0.0%) | 0 (0.0%) |
| Construction | 99 (100.0%) | 0 (0.0%) |
| Manufacturing | 0 (0.0%) | 56 (100.0%) |
| Wholesale Trade | 0 (0.0%) | 0 (0.0%) |
| Retail Trade | 58 (69.9%) | 25 (30.1%) |
| Transportation & Warehousing | 48 (100.0%) | 0 (0.0%) |
| Utilities | 0 (0.0%) | 0 (0.0%) |
| Information | 0 (0.0%) | 9 (100.0%) |
| Finance & Insurance | 0 (0.0%) | 55 (100.0%) |
| Real Estate, Rental & Leasing | 0 (0.0%) | 0 (0.0%) |
| Professional & Scientific | 6 (10.7%) | 50 (89.3%) |
| Enterprise Management | 0 (0.0%) | 0 (0.0%) |
| Administrative & Support | 0 (0.0%) | 11 (100.0%) |
| Educational Services | 50 (69.4%) | 22 (30.6%) |
| Health Care & Social Assistance | 44 (12.6%) | 306 (87.4%) |
| Arts, Entertainment & Recreation | 0 (0.0%) | 0 (0.0%) |
| Accommodation & Food Services | 10 (100.0%) | 0 (0.0%) |
| Public Administration | 50 (84.8%) | 9 (15.2%) |
| Total | 366 (37.5%) | 611 (62.5%) |
Education in Enfield
School Enrollment in Enfield
The most common levels of schooling among the 213 students in Enfield are middle school (73 | 34.3%), elementary school (70 | 32.9%), and nursery / preschool (58 | 27.2%).
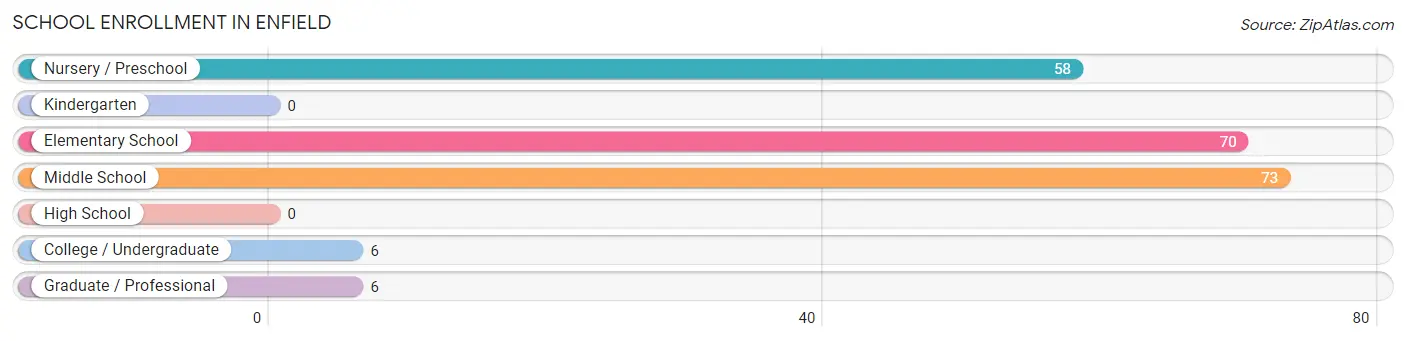
| School Level | # Students | % Students |
| Nursery / Preschool | 58 | 27.2% |
| Kindergarten | 0 | 0.0% |
| Elementary School | 70 | 32.9% |
| Middle School | 73 | 34.3% |
| High School | 0 | 0.0% |
| College / Undergraduate | 6 | 2.8% |
| Graduate / Professional | 6 | 2.8% |
| Total | 213 | 100.0% |
School Enrollment by Age by Funding Source in Enfield
Out of a total of 213 students who are enrolled in schools in Enfield, 29 (13.6%) attend a private institution, while the remaining 184 (86.4%) are enrolled in public schools. The age group of 25 to 34 year olds has the highest likelihood of being enrolled in private schools, with 6 (100.0% in the age bracket) enrolled. Conversely, the age group of 3 to 4 year olds has the lowest likelihood of being enrolled in a private school, with 35 (100.0% in the age bracket) attending a public institution.
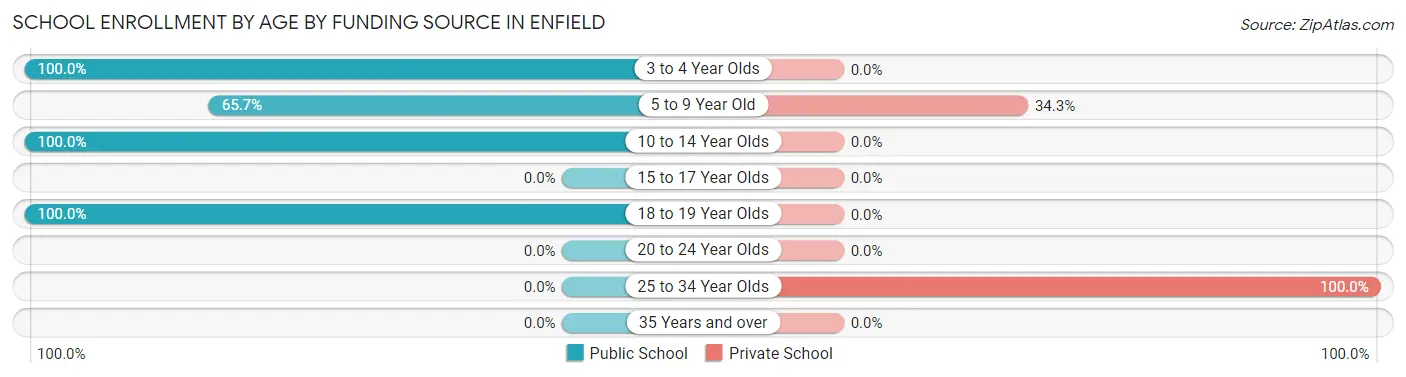
| Age Bracket | Public School | Private School |
| 3 to 4 Year Olds | 35 (100.0%) | 0 (0.0%) |
| 5 to 9 Year Old | 44 (65.7%) | 23 (34.3%) |
| 10 to 14 Year Olds | 99 (100.0%) | 0 (0.0%) |
| 15 to 17 Year Olds | 0 (0.0%) | 0 (0.0%) |
| 18 to 19 Year Olds | 6 (100.0%) | 0 (0.0%) |
| 20 to 24 Year Olds | 0 (0.0%) | 0 (0.0%) |
| 25 to 34 Year Olds | 0 (0.0%) | 6 (100.0%) |
| 35 Years and over | 0 (0.0%) | 0 (0.0%) |
| Total | 184 (86.4%) | 29 (13.6%) |
Educational Attainment by Field of Study in Enfield
Science & technology (98 | 18.4%), business (89 | 16.7%), psychology (74 | 13.9%), social sciences (62 | 11.6%), and computers & mathematics (42 | 7.9%) are the most common fields of study among 533 individuals in Enfield who have obtained a bachelor's degree or higher.
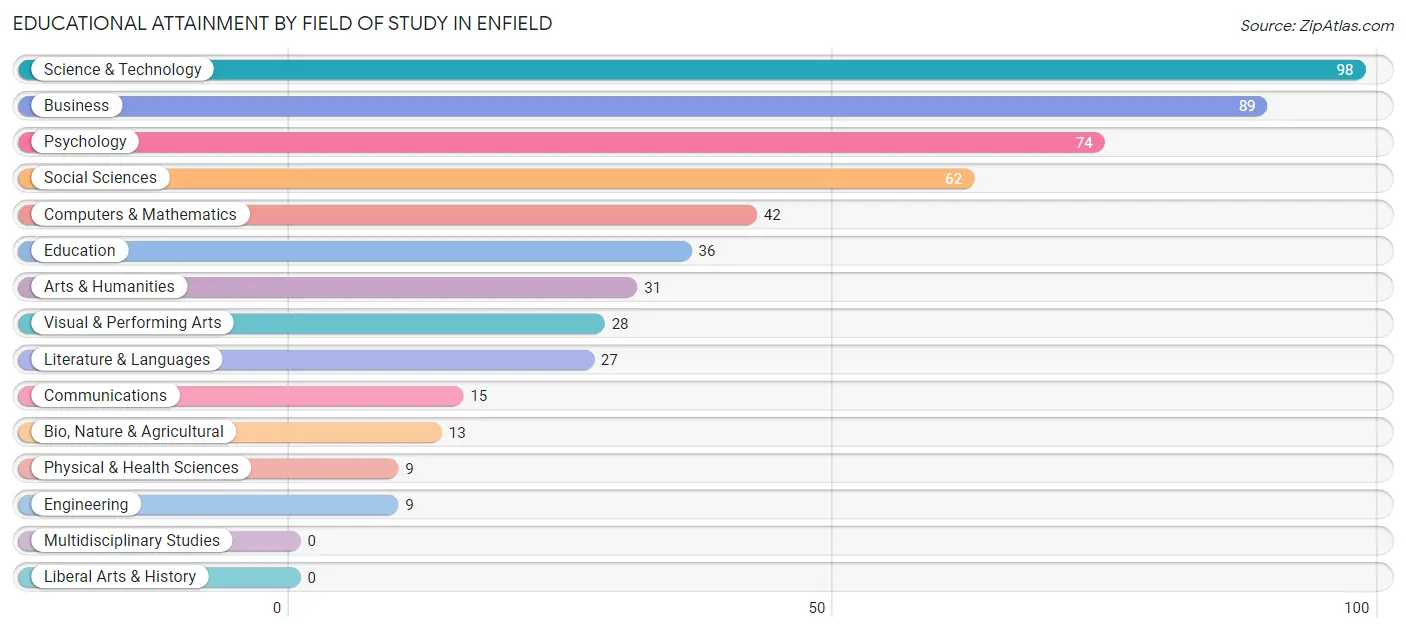
| Field of Study | # Graduates | % Graduates |
| Computers & Mathematics | 42 | 7.9% |
| Bio, Nature & Agricultural | 13 | 2.4% |
| Physical & Health Sciences | 9 | 1.7% |
| Psychology | 74 | 13.9% |
| Social Sciences | 62 | 11.6% |
| Engineering | 9 | 1.7% |
| Multidisciplinary Studies | 0 | 0.0% |
| Science & Technology | 98 | 18.4% |
| Business | 89 | 16.7% |
| Education | 36 | 6.8% |
| Literature & Languages | 27 | 5.1% |
| Liberal Arts & History | 0 | 0.0% |
| Visual & Performing Arts | 28 | 5.2% |
| Communications | 15 | 2.8% |
| Arts & Humanities | 31 | 5.8% |
| Total | 533 | 100.0% |
Transportation & Commute in Enfield
Vehicle Availability by Sex in Enfield
The most prevalent vehicle ownership categories in Enfield are males with 2 vehicles (221, accounting for 60.6%) and females with 2 vehicles (313, making up 37.8%).
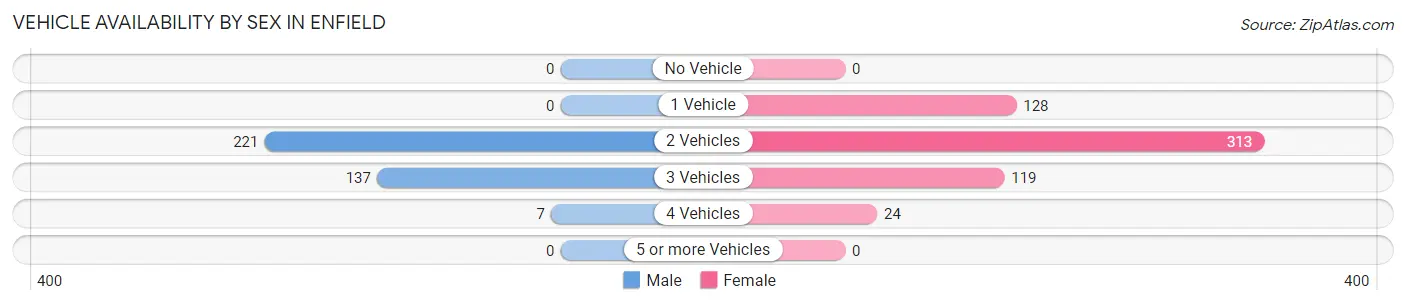
| Vehicles Available | Male | Female |
| No Vehicle | 0 (0.0%) | 0 (0.0%) |
| 1 Vehicle | 0 (0.0%) | 128 (21.9%) |
| 2 Vehicles | 221 (60.6%) | 313 (53.6%) |
| 3 Vehicles | 137 (37.5%) | 119 (20.4%) |
| 4 Vehicles | 7 (1.9%) | 24 (4.1%) |
| 5 or more Vehicles | 0 (0.0%) | 0 (0.0%) |
| Total | 365 (100.0%) | 584 (100.0%) |
Commute Time in Enfield
The most frequently occuring commute durations in Enfield are 15 to 19 minutes (248 commuters, 29.5%), 20 to 24 minutes (175 commuters, 20.8%), and 10 to 14 minutes (104 commuters, 12.4%).
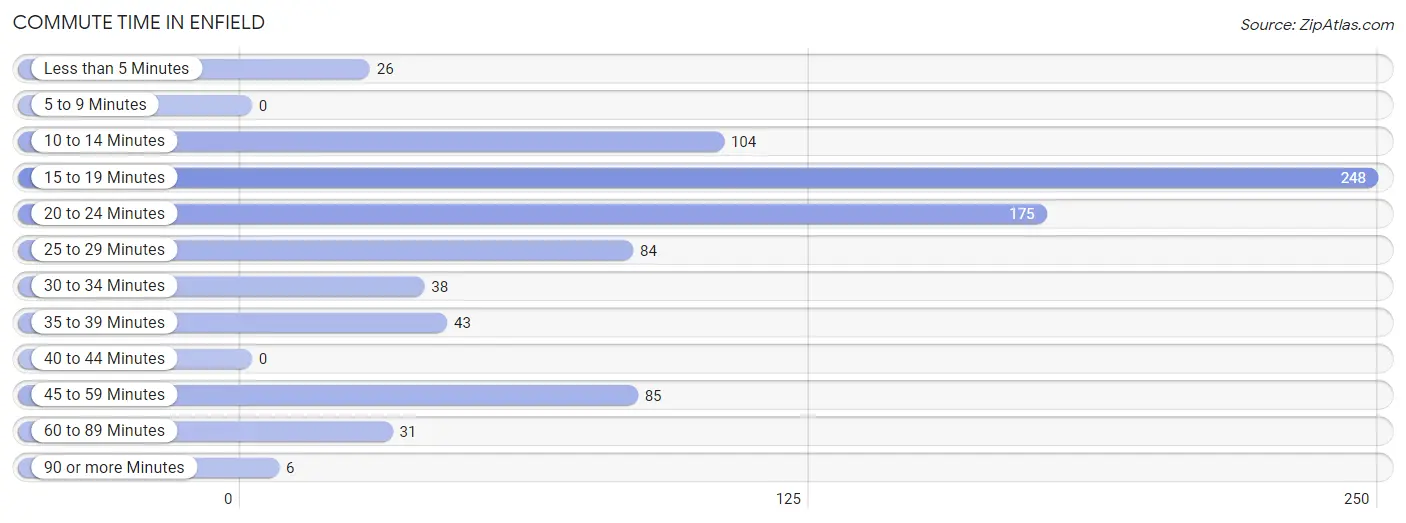
| Commute Time | # Commuters | % Commuters |
| Less than 5 Minutes | 26 | 3.1% |
| 5 to 9 Minutes | 0 | 0.0% |
| 10 to 14 Minutes | 104 | 12.4% |
| 15 to 19 Minutes | 248 | 29.5% |
| 20 to 24 Minutes | 175 | 20.8% |
| 25 to 29 Minutes | 84 | 10.0% |
| 30 to 34 Minutes | 38 | 4.5% |
| 35 to 39 Minutes | 43 | 5.1% |
| 40 to 44 Minutes | 0 | 0.0% |
| 45 to 59 Minutes | 85 | 10.1% |
| 60 to 89 Minutes | 31 | 3.7% |
| 90 or more Minutes | 6 | 0.7% |
Commute Time by Sex in Enfield
The most common commute times in Enfield are 15 to 19 minutes (124 commuters, 40.5%) for males and 20 to 24 minutes (164 commuters, 30.7%) for females.
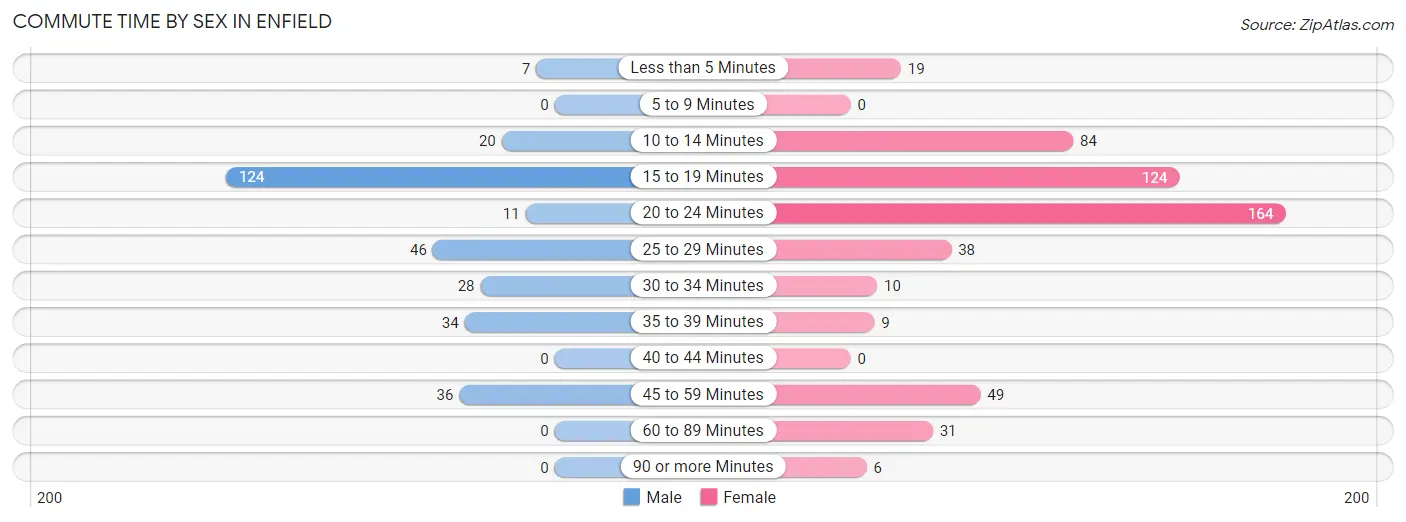
| Commute Time | Male | Female |
| Less than 5 Minutes | 7 (2.3%) | 19 (3.6%) |
| 5 to 9 Minutes | 0 (0.0%) | 0 (0.0%) |
| 10 to 14 Minutes | 20 (6.5%) | 84 (15.7%) |
| 15 to 19 Minutes | 124 (40.5%) | 124 (23.2%) |
| 20 to 24 Minutes | 11 (3.6%) | 164 (30.7%) |
| 25 to 29 Minutes | 46 (15.0%) | 38 (7.1%) |
| 30 to 34 Minutes | 28 (9.1%) | 10 (1.9%) |
| 35 to 39 Minutes | 34 (11.1%) | 9 (1.7%) |
| 40 to 44 Minutes | 0 (0.0%) | 0 (0.0%) |
| 45 to 59 Minutes | 36 (11.8%) | 49 (9.2%) |
| 60 to 89 Minutes | 0 (0.0%) | 31 (5.8%) |
| 90 or more Minutes | 0 (0.0%) | 6 (1.1%) |
Time of Departure to Work by Sex in Enfield
The most frequent times of departure to work in Enfield are 7:00 AM to 7:29 AM (129, 42.2%) for males and 7:30 AM to 7:59 AM (78, 14.6%) for females.
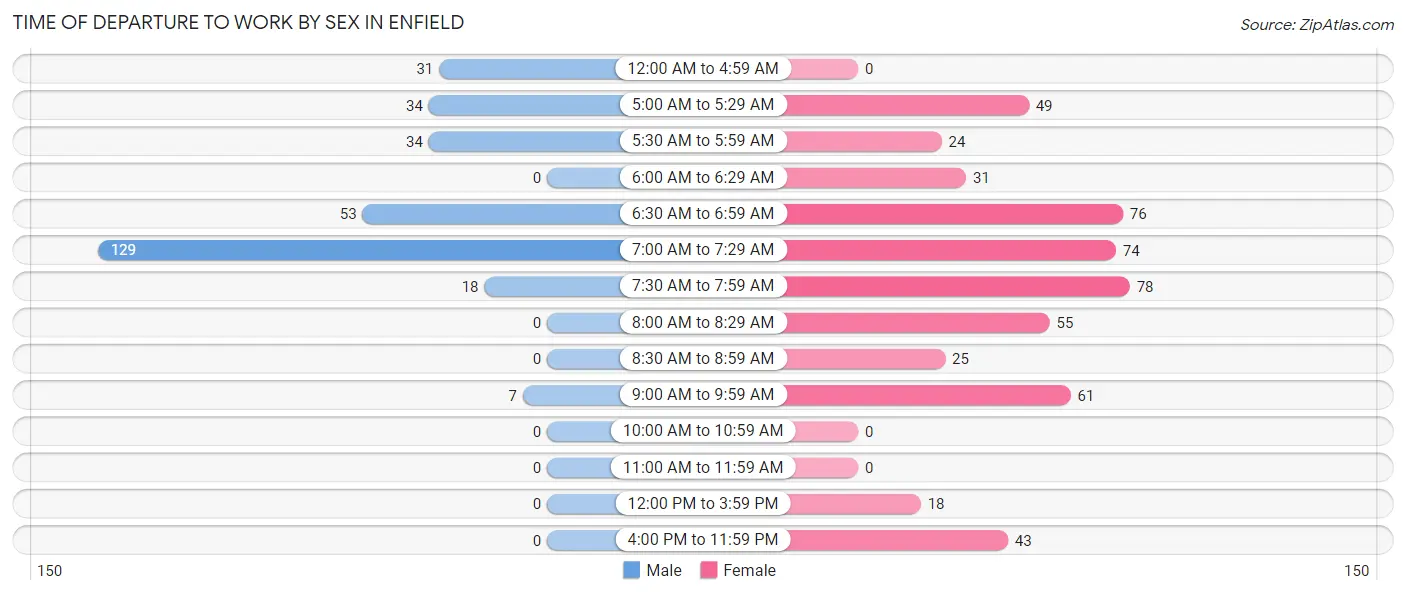
| Time of Departure | Male | Female |
| 12:00 AM to 4:59 AM | 31 (10.1%) | 0 (0.0%) |
| 5:00 AM to 5:29 AM | 34 (11.1%) | 49 (9.2%) |
| 5:30 AM to 5:59 AM | 34 (11.1%) | 24 (4.5%) |
| 6:00 AM to 6:29 AM | 0 (0.0%) | 31 (5.8%) |
| 6:30 AM to 6:59 AM | 53 (17.3%) | 76 (14.2%) |
| 7:00 AM to 7:29 AM | 129 (42.2%) | 74 (13.9%) |
| 7:30 AM to 7:59 AM | 18 (5.9%) | 78 (14.6%) |
| 8:00 AM to 8:29 AM | 0 (0.0%) | 55 (10.3%) |
| 8:30 AM to 8:59 AM | 0 (0.0%) | 25 (4.7%) |
| 9:00 AM to 9:59 AM | 7 (2.3%) | 61 (11.4%) |
| 10:00 AM to 10:59 AM | 0 (0.0%) | 0 (0.0%) |
| 11:00 AM to 11:59 AM | 0 (0.0%) | 0 (0.0%) |
| 12:00 PM to 3:59 PM | 0 (0.0%) | 18 (3.4%) |
| 4:00 PM to 11:59 PM | 0 (0.0%) | 43 (8.1%) |
| Total | 306 (100.0%) | 534 (100.0%) |
Housing Occupancy in Enfield
Occupancy by Ownership in Enfield
Of the total 897 dwellings in Enfield, owner-occupied units account for 593 (66.1%), while renter-occupied units make up 304 (33.9%).
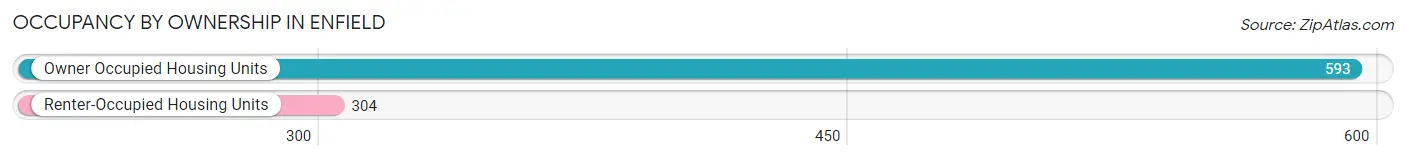
| Occupancy | # Housing Units | % Housing Units |
| Owner Occupied Housing Units | 593 | 66.1% |
| Renter-Occupied Housing Units | 304 | 33.9% |
| Total Occupied Housing Units | 897 | 100.0% |
Occupancy by Household Size in Enfield
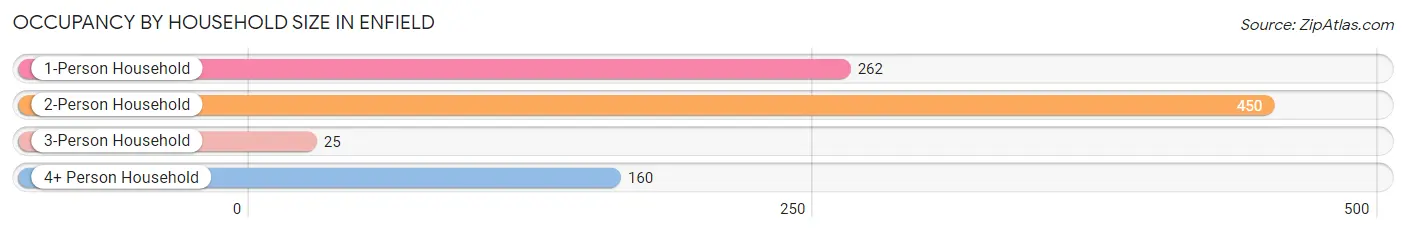
| Household Size | # Housing Units | % Housing Units |
| 1-Person Household | 262 | 29.2% |
| 2-Person Household | 450 | 50.2% |
| 3-Person Household | 25 | 2.8% |
| 4+ Person Household | 160 | 17.8% |
| Total Housing Units | 897 | 100.0% |
Occupancy by Ownership by Household Size in Enfield
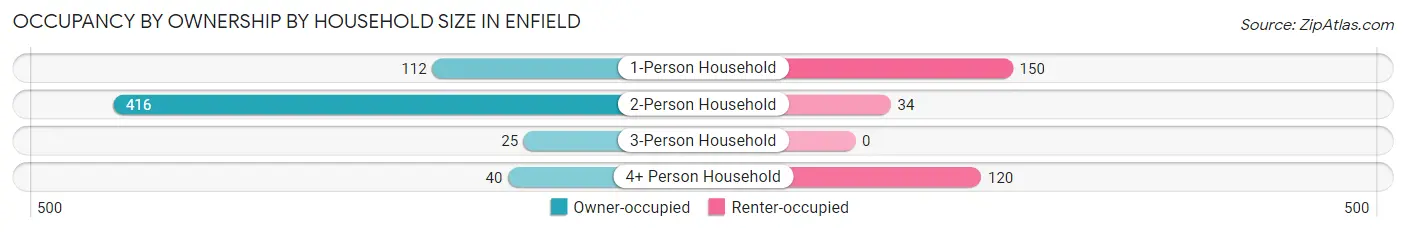
| Household Size | Owner-occupied | Renter-occupied |
| 1-Person Household | 112 (42.7%) | 150 (57.3%) |
| 2-Person Household | 416 (92.4%) | 34 (7.6%) |
| 3-Person Household | 25 (100.0%) | 0 (0.0%) |
| 4+ Person Household | 40 (25.0%) | 120 (75.0%) |
| Total Housing Units | 593 (66.1%) | 304 (33.9%) |
Occupancy by Educational Attainment in Enfield
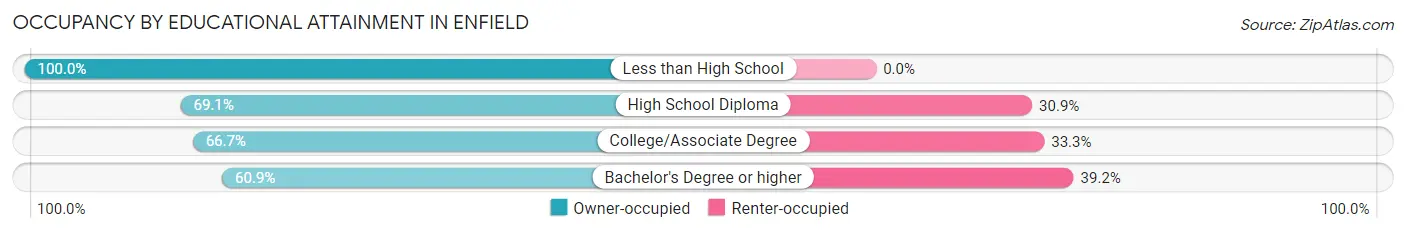
| Household Size | Owner-occupied | Renter-occupied |
| Less than High School | 17 (100.0%) | 0 (0.0%) |
| High School Diploma | 163 (69.1%) | 73 (30.9%) |
| College/Associate Degree | 242 (66.7%) | 121 (33.3%) |
| Bachelor's Degree or higher | 171 (60.9%) | 110 (39.2%) |
Occupancy by Age of Householder in Enfield
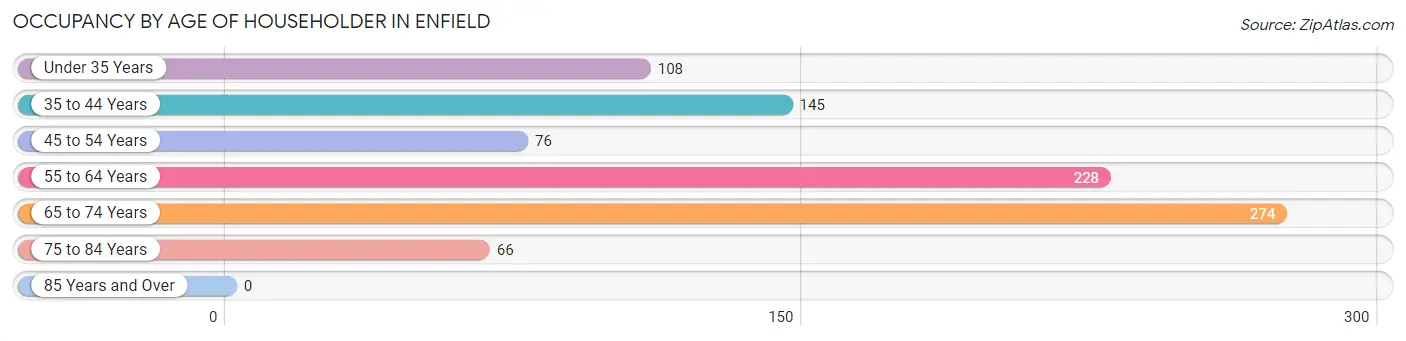
| Age Bracket | # Households | % Households |
| Under 35 Years | 108 | 12.0% |
| 35 to 44 Years | 145 | 16.2% |
| 45 to 54 Years | 76 | 8.5% |
| 55 to 64 Years | 228 | 25.4% |
| 65 to 74 Years | 274 | 30.5% |
| 75 to 84 Years | 66 | 7.4% |
| 85 Years and Over | 0 | 0.0% |
| Total | 897 | 100.0% |
Housing Finances in Enfield
Median Income by Occupancy in Enfield
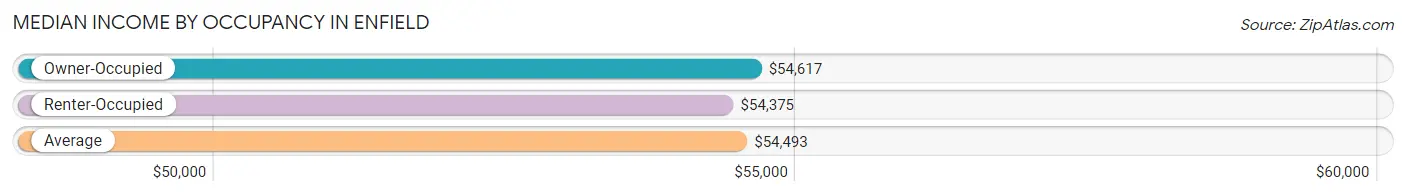
| Occupancy Type | # Households | Median Income |
| Owner-Occupied | 593 (66.1%) | $54,617 |
| Renter-Occupied | 304 (33.9%) | $54,375 |
| Average | 897 (100.0%) | $54,493 |
Occupancy by Householder Income Bracket in Enfield
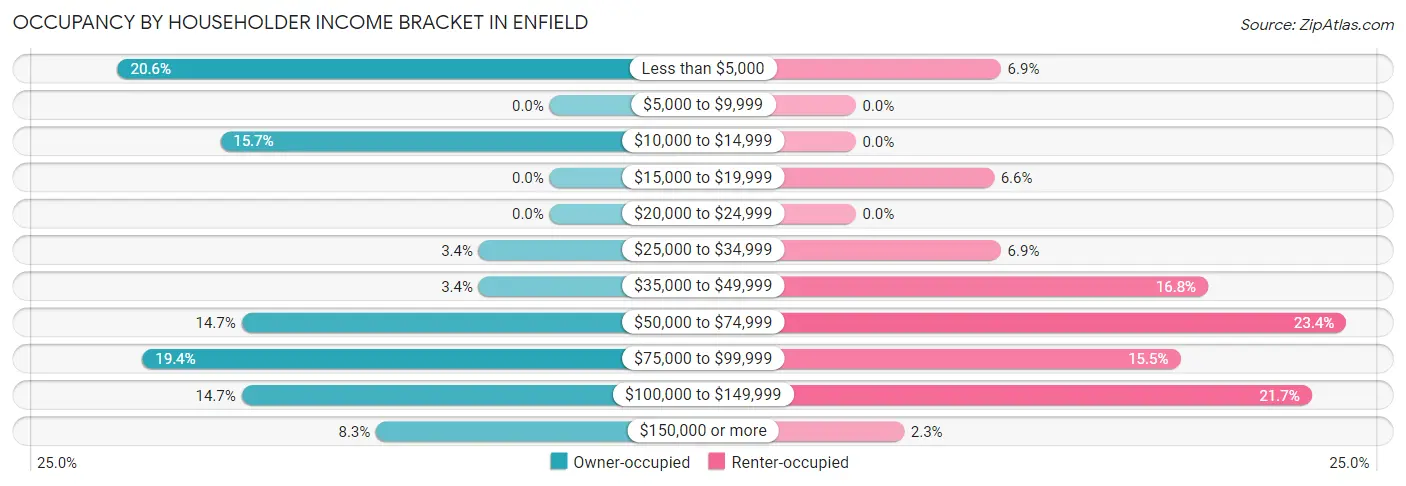
| Income Bracket | Owner-occupied | Renter-occupied |
| Less than $5,000 | 122 (20.6%) | 21 (6.9%) |
| $5,000 to $9,999 | 0 (0.0%) | 0 (0.0%) |
| $10,000 to $14,999 | 93 (15.7%) | 0 (0.0%) |
| $15,000 to $19,999 | 0 (0.0%) | 20 (6.6%) |
| $20,000 to $24,999 | 0 (0.0%) | 0 (0.0%) |
| $25,000 to $34,999 | 20 (3.4%) | 21 (6.9%) |
| $35,000 to $49,999 | 20 (3.4%) | 51 (16.8%) |
| $50,000 to $74,999 | 87 (14.7%) | 71 (23.4%) |
| $75,000 to $99,999 | 115 (19.4%) | 47 (15.5%) |
| $100,000 to $149,999 | 87 (14.7%) | 66 (21.7%) |
| $150,000 or more | 49 (8.3%) | 7 (2.3%) |
| Total | 593 (100.0%) | 304 (100.0%) |
Monthly Housing Cost Tiers in Enfield
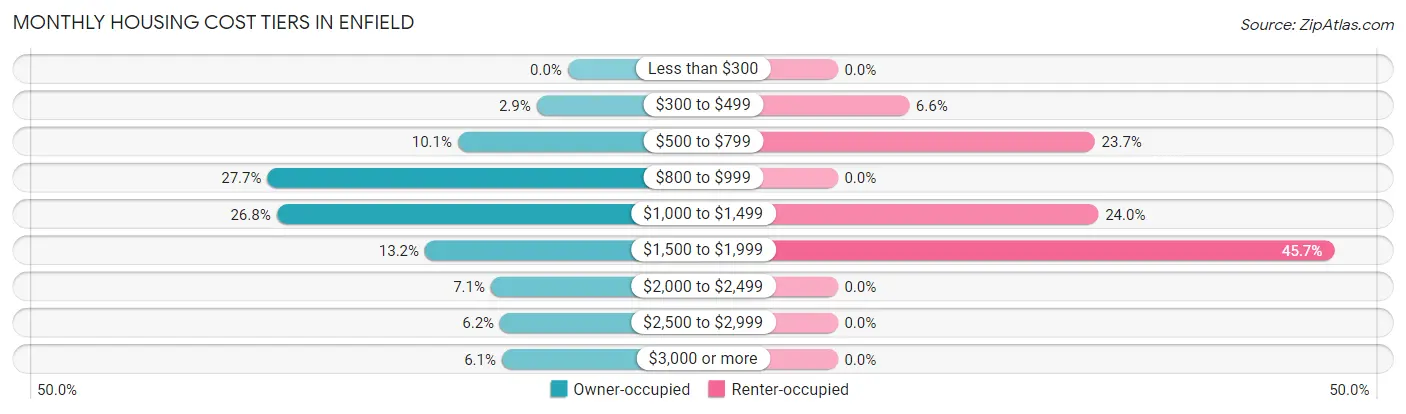
| Monthly Cost | Owner-occupied | Renter-occupied |
| Less than $300 | 0 (0.0%) | 0 (0.0%) |
| $300 to $499 | 17 (2.9%) | 20 (6.6%) |
| $500 to $799 | 60 (10.1%) | 72 (23.7%) |
| $800 to $999 | 164 (27.7%) | 0 (0.0%) |
| $1,000 to $1,499 | 159 (26.8%) | 73 (24.0%) |
| $1,500 to $1,999 | 78 (13.2%) | 139 (45.7%) |
| $2,000 to $2,499 | 42 (7.1%) | 0 (0.0%) |
| $2,500 to $2,999 | 37 (6.2%) | 0 (0.0%) |
| $3,000 or more | 36 (6.1%) | 0 (0.0%) |
| Total | 593 (100.0%) | 304 (100.0%) |
Physical Housing Characteristics in Enfield
Housing Structures in Enfield
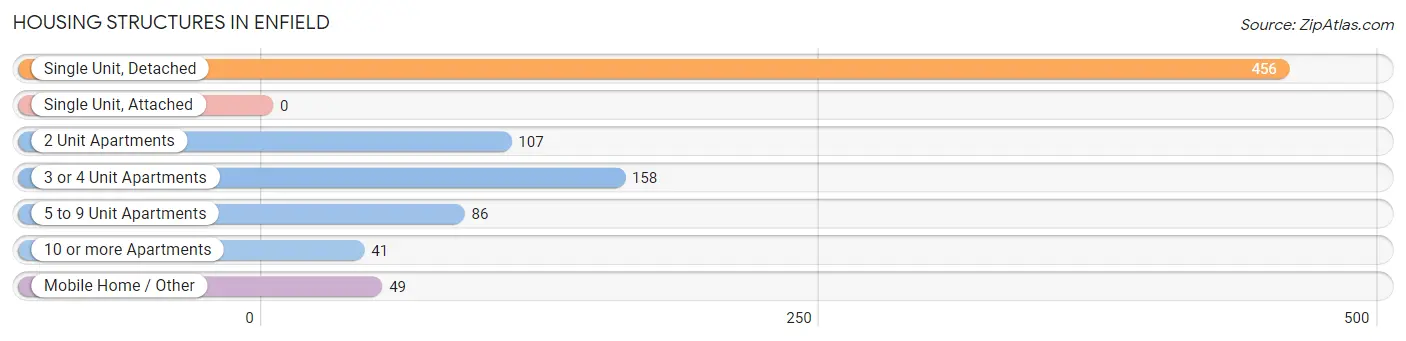
| Structure Type | # Housing Units | % Housing Units |
| Single Unit, Detached | 456 | 50.8% |
| Single Unit, Attached | 0 | 0.0% |
| 2 Unit Apartments | 107 | 11.9% |
| 3 or 4 Unit Apartments | 158 | 17.6% |
| 5 to 9 Unit Apartments | 86 | 9.6% |
| 10 or more Apartments | 41 | 4.6% |
| Mobile Home / Other | 49 | 5.5% |
| Total | 897 | 100.0% |
Housing Structures by Occupancy in Enfield
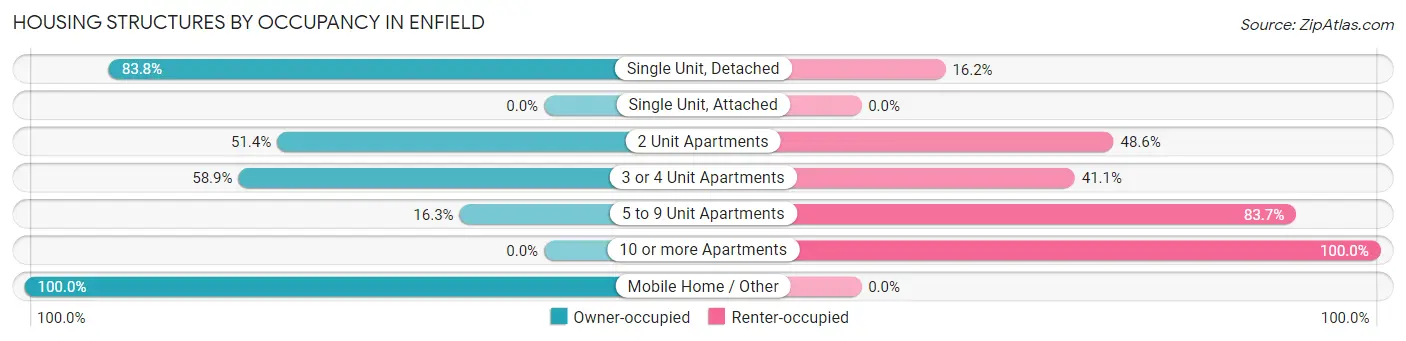
| Structure Type | Owner-occupied | Renter-occupied |
| Single Unit, Detached | 382 (83.8%) | 74 (16.2%) |
| Single Unit, Attached | 0 (0.0%) | 0 (0.0%) |
| 2 Unit Apartments | 55 (51.4%) | 52 (48.6%) |
| 3 or 4 Unit Apartments | 93 (58.9%) | 65 (41.1%) |
| 5 to 9 Unit Apartments | 14 (16.3%) | 72 (83.7%) |
| 10 or more Apartments | 0 (0.0%) | 41 (100.0%) |
| Mobile Home / Other | 49 (100.0%) | 0 (0.0%) |
| Total | 593 (66.1%) | 304 (33.9%) |
Housing Structures by Number of Rooms in Enfield
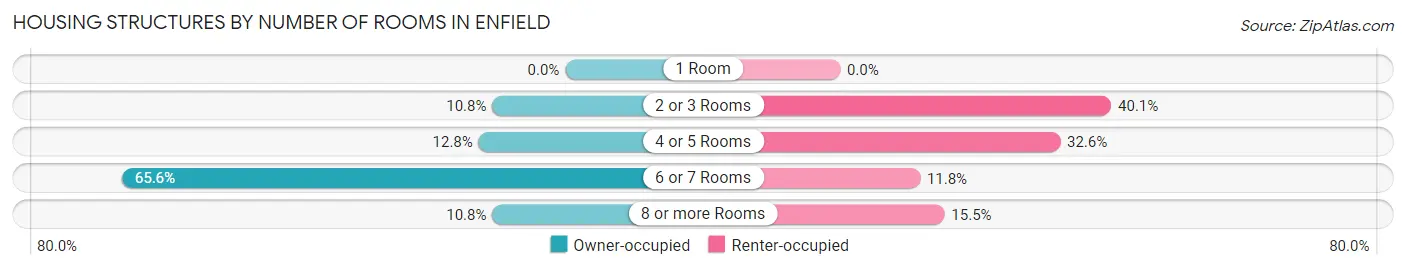
| Number of Rooms | Owner-occupied | Renter-occupied |
| 1 Room | 0 (0.0%) | 0 (0.0%) |
| 2 or 3 Rooms | 64 (10.8%) | 122 (40.1%) |
| 4 or 5 Rooms | 76 (12.8%) | 99 (32.6%) |
| 6 or 7 Rooms | 389 (65.6%) | 36 (11.8%) |
| 8 or more Rooms | 64 (10.8%) | 47 (15.5%) |
| Total | 593 (100.0%) | 304 (100.0%) |
Housing Structure by Heating Type in Enfield
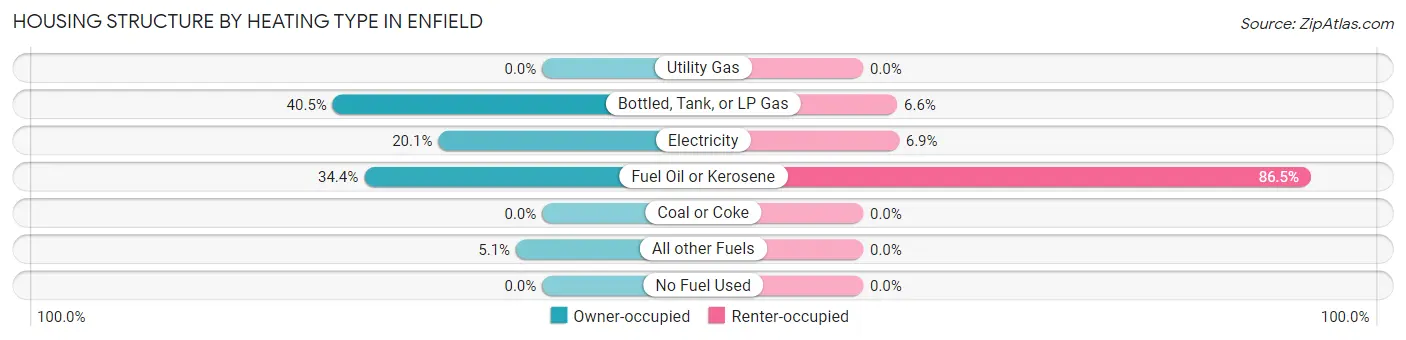
| Heating Type | Owner-occupied | Renter-occupied |
| Utility Gas | 0 (0.0%) | 0 (0.0%) |
| Bottled, Tank, or LP Gas | 240 (40.5%) | 20 (6.6%) |
| Electricity | 119 (20.1%) | 21 (6.9%) |
| Fuel Oil or Kerosene | 204 (34.4%) | 263 (86.5%) |
| Coal or Coke | 0 (0.0%) | 0 (0.0%) |
| All other Fuels | 30 (5.1%) | 0 (0.0%) |
| No Fuel Used | 0 (0.0%) | 0 (0.0%) |
| Total | 593 (100.0%) | 304 (100.0%) |
Household Vehicle Usage in Enfield
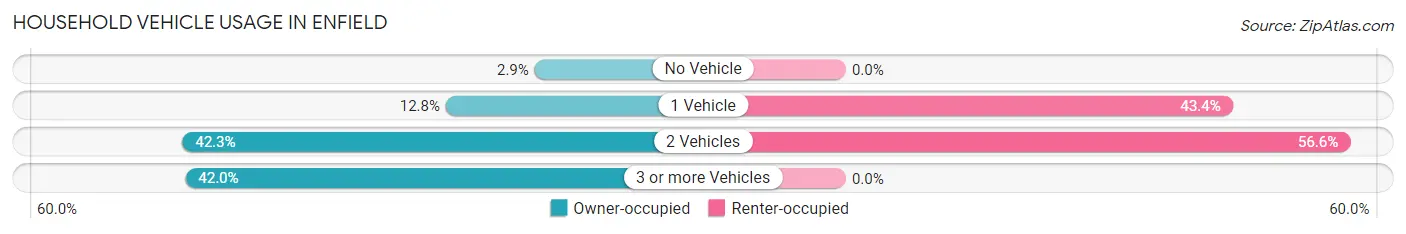
| Vehicles per Household | Owner-occupied | Renter-occupied |
| No Vehicle | 17 (2.9%) | 0 (0.0%) |
| 1 Vehicle | 76 (12.8%) | 132 (43.4%) |
| 2 Vehicles | 251 (42.3%) | 172 (56.6%) |
| 3 or more Vehicles | 249 (42.0%) | 0 (0.0%) |
| Total | 593 (100.0%) | 304 (100.0%) |
Real Estate & Mortgages in Enfield
Real Estate and Mortgage Overview in Enfield
| Characteristic | Without Mortgage | With Mortgage |
| Housing Units | 289 | 304 |
| Median Property Value | $227,400 | $207,000 |
| Median Household Income | - | - |
| Monthly Housing Costs | $841 | $36 |
| Real Estate Taxes | $4,548 | $0 |
Property Value by Mortgage Status in Enfield
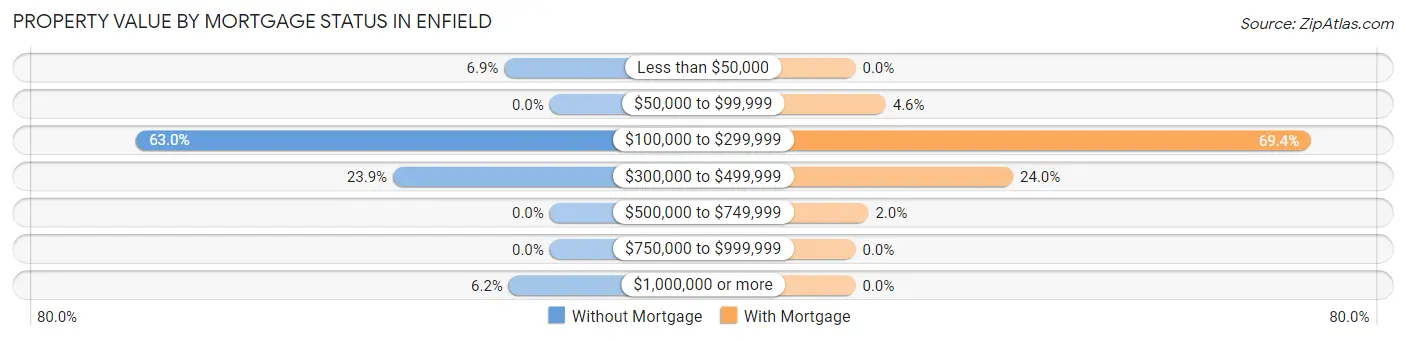
| Property Value | Without Mortgage | With Mortgage |
| Less than $50,000 | 20 (6.9%) | 0 (0.0%) |
| $50,000 to $99,999 | 0 (0.0%) | 14 (4.6%) |
| $100,000 to $299,999 | 182 (63.0%) | 211 (69.4%) |
| $300,000 to $499,999 | 69 (23.9%) | 73 (24.0%) |
| $500,000 to $749,999 | 0 (0.0%) | 6 (2.0%) |
| $750,000 to $999,999 | 0 (0.0%) | 0 (0.0%) |
| $1,000,000 or more | 18 (6.2%) | 0 (0.0%) |
| Total | 289 (100.0%) | 304 (100.0%) |
Household Income by Mortgage Status in Enfield
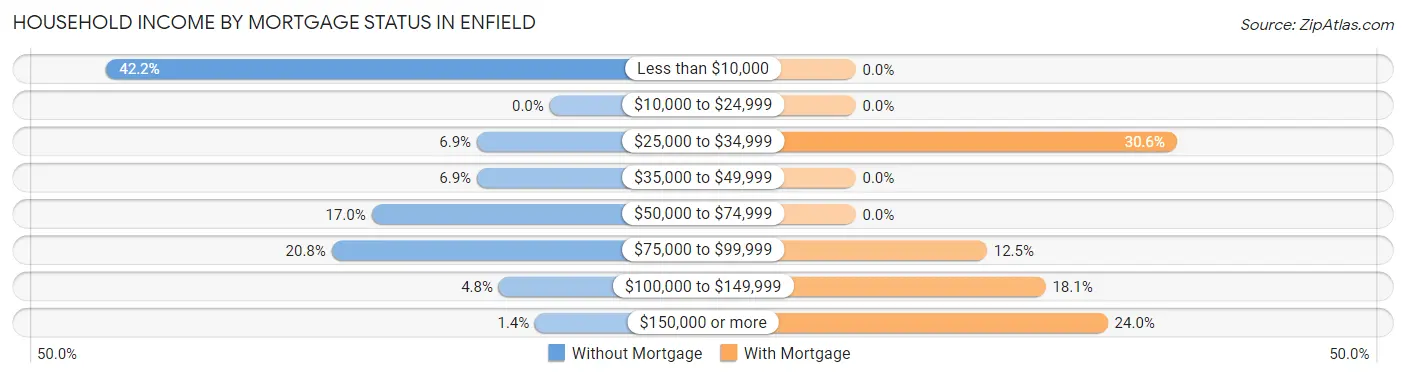
| Household Income | Without Mortgage | With Mortgage |
| Less than $10,000 | 122 (42.2%) | 0 (0.0%) |
| $10,000 to $24,999 | 0 (0.0%) | 0 (0.0%) |
| $25,000 to $34,999 | 20 (6.9%) | 93 (30.6%) |
| $35,000 to $49,999 | 20 (6.9%) | 0 (0.0%) |
| $50,000 to $74,999 | 49 (17.0%) | 0 (0.0%) |
| $75,000 to $99,999 | 60 (20.8%) | 38 (12.5%) |
| $100,000 to $149,999 | 14 (4.8%) | 55 (18.1%) |
| $150,000 or more | 4 (1.4%) | 73 (24.0%) |
| Total | 289 (100.0%) | 304 (100.0%) |
Property Value to Household Income Ratio in Enfield
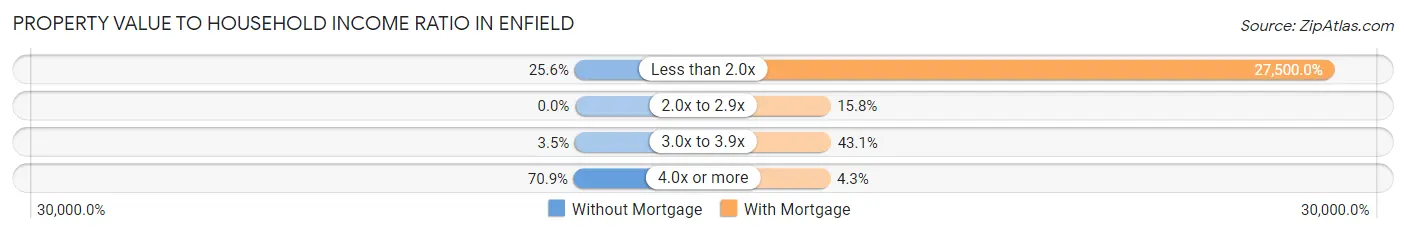
| Value-to-Income Ratio | Without Mortgage | With Mortgage |
| Less than 2.0x | 74 (25.6%) | 83,600 (27,500.0%) |
| 2.0x to 2.9x | 0 (0.0%) | 48 (15.8%) |
| 3.0x to 3.9x | 10 (3.5%) | 131 (43.1%) |
| 4.0x or more | 205 (70.9%) | 13 (4.3%) |
| Total | 289 (100.0%) | 304 (100.0%) |
Real Estate Taxes by Mortgage Status in Enfield
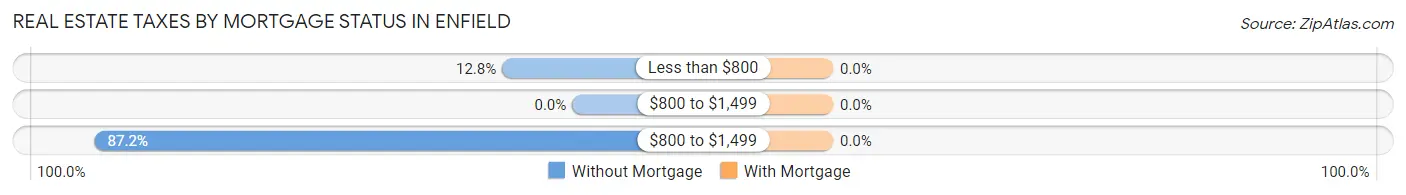
| Property Taxes | Without Mortgage | With Mortgage |
| Less than $800 | 37 (12.8%) | 0 (0.0%) |
| $800 to $1,499 | 0 (0.0%) | 0 (0.0%) |
| $800 to $1,499 | 252 (87.2%) | 0 (0.0%) |
| Total | 289 (100.0%) | 304 (100.0%) |
Health & Disability in Enfield
Health Insurance Coverage by Age in Enfield
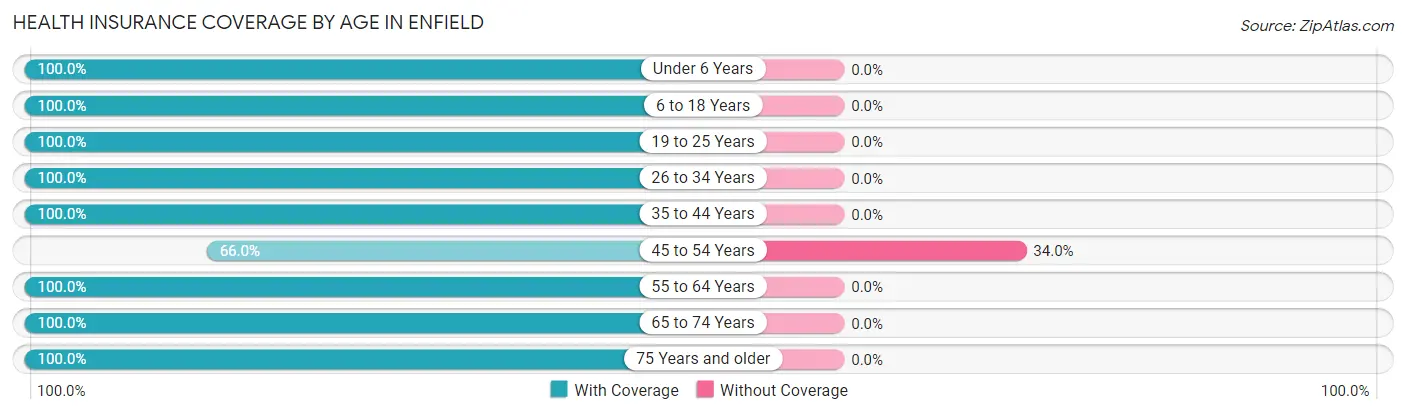
| Age Bracket | With Coverage | Without Coverage |
| Under 6 Years | 339 (100.0%) | 0 (0.0%) |
| 6 to 18 Years | 143 (100.0%) | 0 (0.0%) |
| 19 to 25 Years | 95 (100.0%) | 0 (0.0%) |
| 26 to 34 Years | 203 (100.0%) | 0 (0.0%) |
| 35 to 44 Years | 268 (100.0%) | 0 (0.0%) |
| 45 to 54 Years | 70 (66.0%) | 36 (34.0%) |
| 55 to 64 Years | 338 (100.0%) | 0 (0.0%) |
| 65 to 74 Years | 497 (100.0%) | 0 (0.0%) |
| 75 Years and older | 90 (100.0%) | 0 (0.0%) |
| Total | 2,043 (98.3%) | 36 (1.7%) |
Health Insurance Coverage by Citizenship Status in Enfield
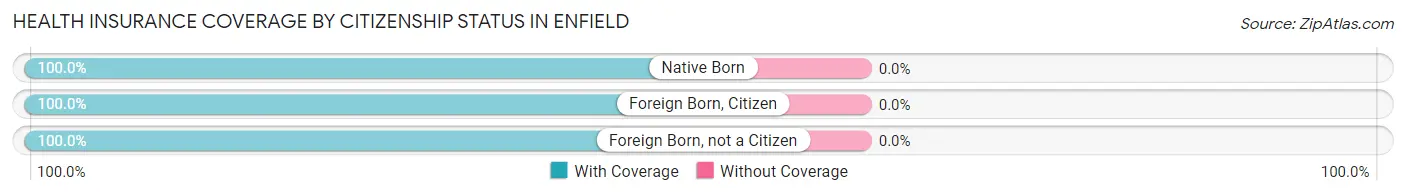
| Citizenship Status | With Coverage | Without Coverage |
| Native Born | 339 (100.0%) | 0 (0.0%) |
| Foreign Born, Citizen | 143 (100.0%) | 0 (0.0%) |
| Foreign Born, not a Citizen | 95 (100.0%) | 0 (0.0%) |
Health Insurance Coverage by Household Income in Enfield
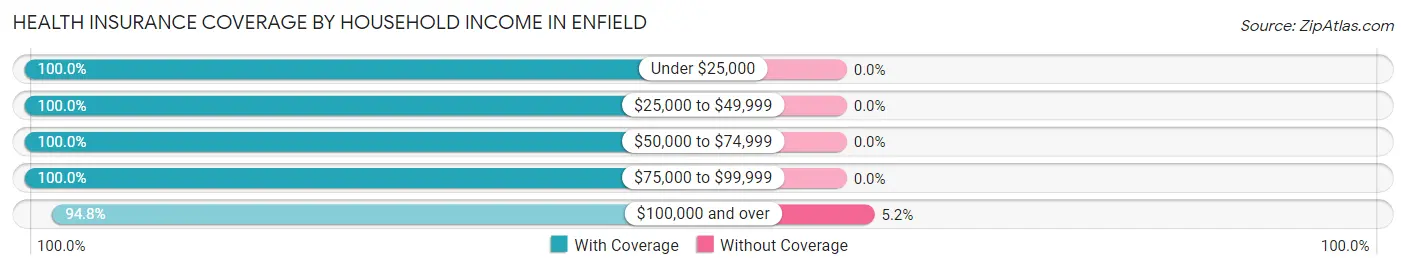
| Household Income | With Coverage | Without Coverage |
| Under $25,000 | 430 (100.0%) | 0 (0.0%) |
| $25,000 to $49,999 | 131 (100.0%) | 0 (0.0%) |
| $50,000 to $74,999 | 347 (100.0%) | 0 (0.0%) |
| $75,000 to $99,999 | 472 (100.0%) | 0 (0.0%) |
| $100,000 and over | 656 (94.8%) | 36 (5.2%) |
Public vs Private Health Insurance Coverage by Age in Enfield
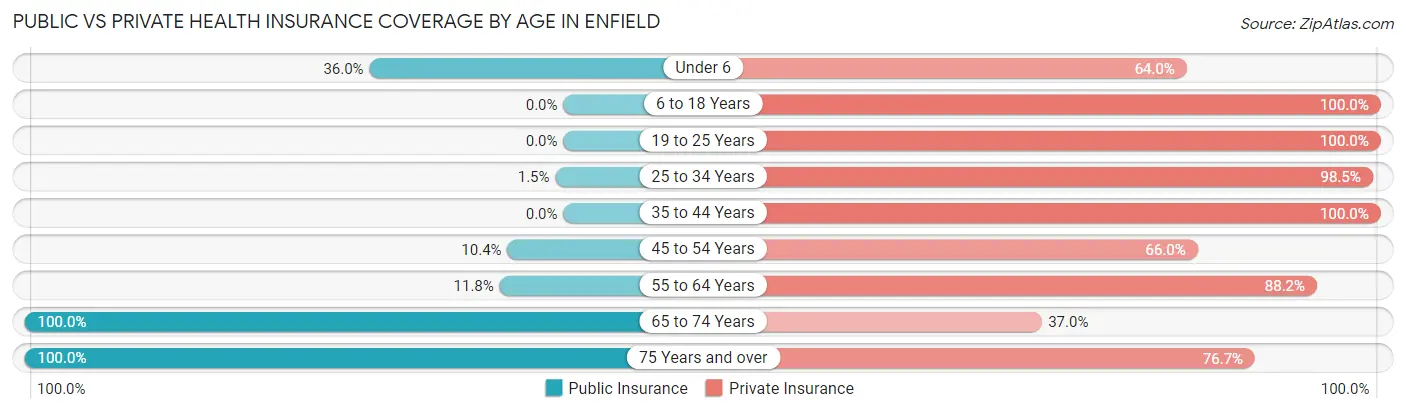
| Age Bracket | Public Insurance | Private Insurance |
| Under 6 | 122 (36.0%) | 217 (64.0%) |
| 6 to 18 Years | 0 (0.0%) | 143 (100.0%) |
| 19 to 25 Years | 0 (0.0%) | 95 (100.0%) |
| 25 to 34 Years | 3 (1.5%) | 200 (98.5%) |
| 35 to 44 Years | 0 (0.0%) | 268 (100.0%) |
| 45 to 54 Years | 11 (10.4%) | 70 (66.0%) |
| 55 to 64 Years | 40 (11.8%) | 298 (88.2%) |
| 65 to 74 Years | 497 (100.0%) | 184 (37.0%) |
| 75 Years and over | 90 (100.0%) | 69 (76.7%) |
| Total | 763 (36.7%) | 1,544 (74.3%) |
Disability Status by Sex by Age in Enfield
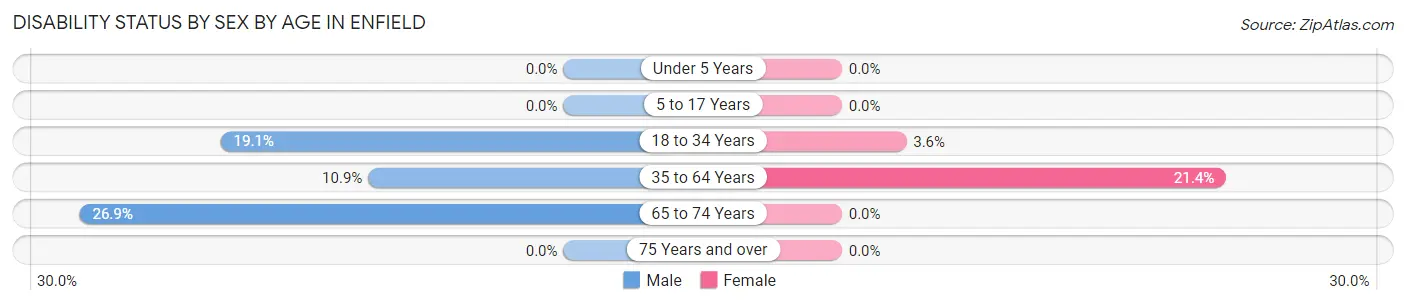
| Age Bracket | Male | Female |
| Under 5 Years | 0 (0.0%) | 0 (0.0%) |
| 5 to 17 Years | 0 (0.0%) | 0 (0.0%) |
| 18 to 34 Years | 25 (19.1%) | 6 (3.6%) |
| 35 to 64 Years | 20 (10.9%) | 113 (21.4%) |
| 65 to 74 Years | 80 (26.9%) | 0 (0.0%) |
| 75 Years and over | 0 (0.0%) | 0 (0.0%) |
Disability Class by Sex by Age in Enfield
Disability Class: Hearing Difficulty
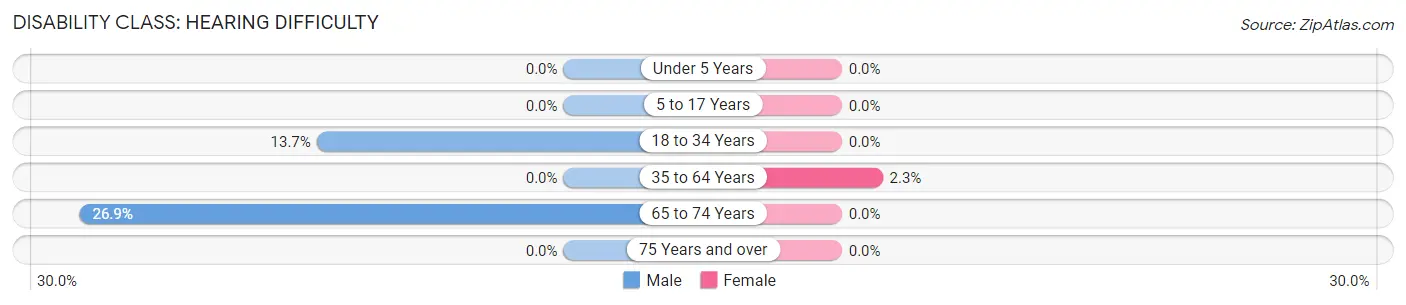
| Age Bracket | Male | Female |
| Under 5 Years | 0 (0.0%) | 0 (0.0%) |
| 5 to 17 Years | 0 (0.0%) | 0 (0.0%) |
| 18 to 34 Years | 18 (13.7%) | 0 (0.0%) |
| 35 to 64 Years | 0 (0.0%) | 12 (2.3%) |
| 65 to 74 Years | 80 (26.9%) | 0 (0.0%) |
| 75 Years and over | 0 (0.0%) | 0 (0.0%) |
Disability Class: Vision Difficulty
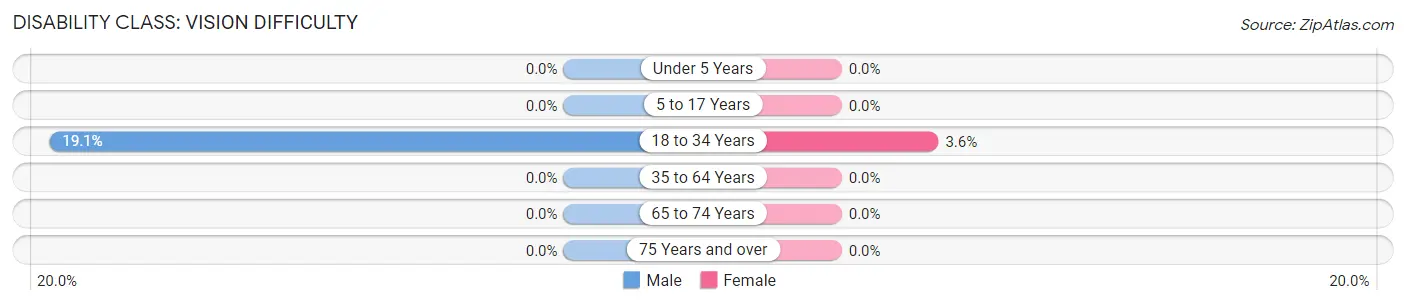
| Age Bracket | Male | Female |
| Under 5 Years | 0 (0.0%) | 0 (0.0%) |
| 5 to 17 Years | 0 (0.0%) | 0 (0.0%) |
| 18 to 34 Years | 25 (19.1%) | 6 (3.6%) |
| 35 to 64 Years | 0 (0.0%) | 0 (0.0%) |
| 65 to 74 Years | 0 (0.0%) | 0 (0.0%) |
| 75 Years and over | 0 (0.0%) | 0 (0.0%) |
Disability Class: Cognitive Difficulty
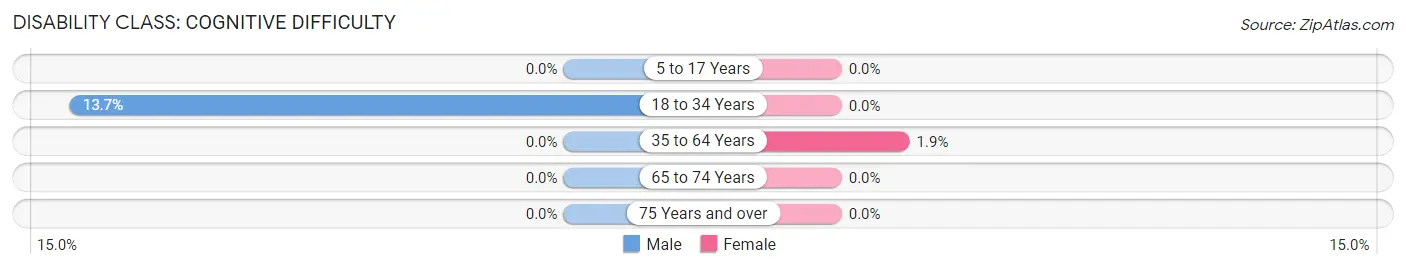
| Age Bracket | Male | Female |
| 5 to 17 Years | 0 (0.0%) | 0 (0.0%) |
| 18 to 34 Years | 18 (13.7%) | 0 (0.0%) |
| 35 to 64 Years | 0 (0.0%) | 10 (1.9%) |
| 65 to 74 Years | 0 (0.0%) | 0 (0.0%) |
| 75 Years and over | 0 (0.0%) | 0 (0.0%) |
Disability Class: Ambulatory Difficulty
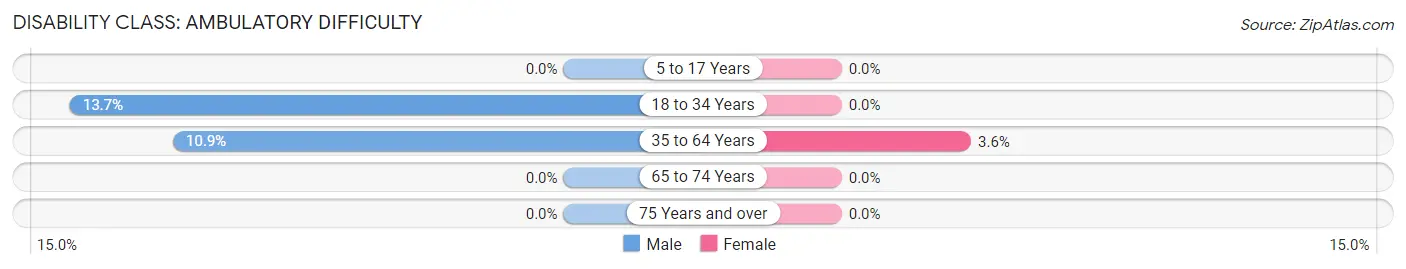
| Age Bracket | Male | Female |
| 5 to 17 Years | 0 (0.0%) | 0 (0.0%) |
| 18 to 34 Years | 18 (13.7%) | 0 (0.0%) |
| 35 to 64 Years | 20 (10.9%) | 19 (3.6%) |
| 65 to 74 Years | 0 (0.0%) | 0 (0.0%) |
| 75 Years and over | 0 (0.0%) | 0 (0.0%) |
Disability Class: Self-Care Difficulty
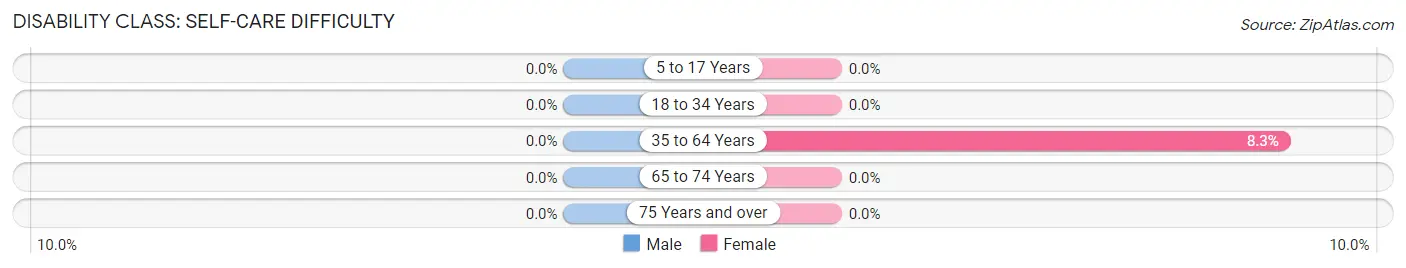
| Age Bracket | Male | Female |
| 5 to 17 Years | 0 (0.0%) | 0 (0.0%) |
| 18 to 34 Years | 0 (0.0%) | 0 (0.0%) |
| 35 to 64 Years | 0 (0.0%) | 44 (8.3%) |
| 65 to 74 Years | 0 (0.0%) | 0 (0.0%) |
| 75 Years and over | 0 (0.0%) | 0 (0.0%) |
Technology Access in Enfield
Computing Device Access in Enfield
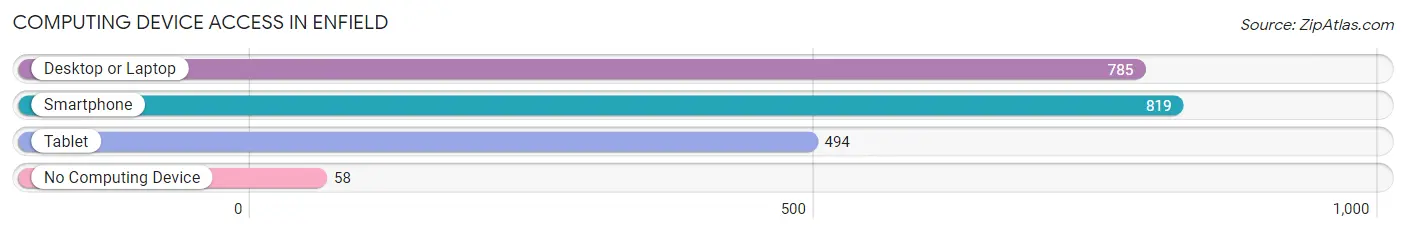
| Device Type | # Households | % Households |
| Desktop or Laptop | 785 | 87.5% |
| Smartphone | 819 | 91.3% |
| Tablet | 494 | 55.1% |
| No Computing Device | 58 | 6.5% |
| Total | 897 | 100.0% |
Internet Access in Enfield
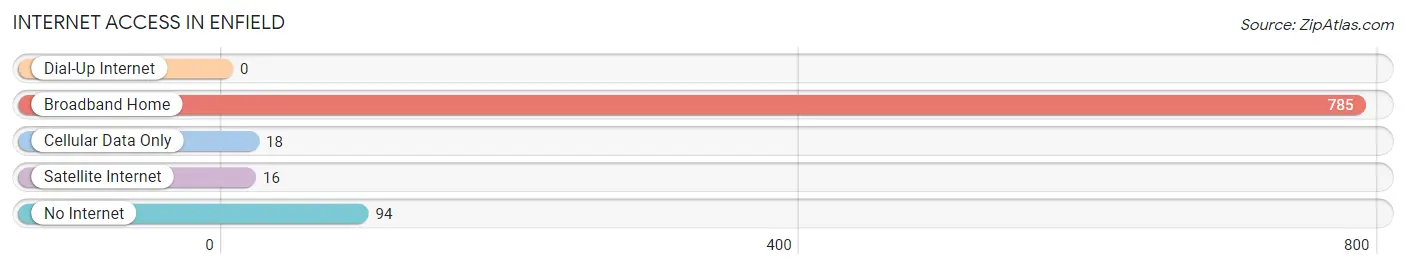
| Internet Type | # Households | % Households |
| Dial-Up Internet | 0 | 0.0% |
| Broadband Home | 785 | 87.5% |
| Cellular Data Only | 18 | 2.0% |
| Satellite Internet | 16 | 1.8% |
| No Internet | 94 | 10.5% |
| Total | 897 | 100.0% |
Enfield Summary
Enfield, New Hampshire is a small town located in Grafton County in the state of New Hampshire. It is situated in the White Mountains region of the state, and is bordered by the towns of Lebanon, Canaan, and Dorchester. The town has a population of 4,582 as of the 2010 census, and is the second-largest town in Grafton County.
History
Enfield was first settled in 1761 by a group of settlers from Connecticut. The town was originally known as "Upper Ashuelot," and was part of the town of Lebanon until it was incorporated in 1761. The town was named after Enfield, Connecticut, the hometown of many of the settlers.
The town was an agricultural community for much of its history, with dairy farming and apple orchards being the main sources of income. The town also had a number of mills, including a sawmill, gristmill, and a woolen mill.
Geography
Enfield is located in the White Mountains region of New Hampshire, and is bordered by the towns of Lebanon, Canaan, and Dorchester. The town is situated on the banks of the Mascoma River, and is home to the Mascoma Lake State Park. The town is located approximately 25 miles north of Concord, the state capital.
The town has a total area of 33.2 square miles, of which 32.9 square miles is land and 0.3 square miles is water. The highest point in the town is the summit of Mount Cube, which has an elevation of 2,890 feet.
Economy
Enfield's economy is largely based on tourism, with the town being a popular destination for outdoor recreation. The town is home to the Mascoma Lake State Park, which offers camping, fishing, and hiking opportunities. The town is also home to a number of ski resorts, including the Mount Sunapee Resort and the Whaleback Mountain Ski Area.
The town is also home to a number of small businesses, including restaurants, retail stores, and a number of bed and breakfasts. The town is also home to a number of manufacturing companies, including a paper mill and a woodworking factory.
Demographics
As of the 2010 census, the town had a population of 4,582. The racial makeup of the town was 97.2% White, 0.5% African American, 0.3% Native American, 0.4% Asian, 0.1% Pacific Islander, 0.3% from other races, and 1.2% from two or more races. Hispanic or Latino of any race were 1.2% of the population.
The median income for a household in the town was $50,938, and the median income for a family was $60,938. The per capita income for the town was $25,938. About 5.2% of families and 8.2% of the population were below the poverty line, including 10.2% of those under age 18 and 5.2% of those age 65 or over.
Common Questions
What is Per Capita Income in Enfield?
Per Capita income in Enfield is $29,590.
What is the Median Household income in Enfield?
Median Household Income in Enfield is $54,493.
What is Income or Wage Gap in Enfield?
Income or Wage Gap in Enfield is 8.6%.
Women in Enfield earn 91.4 cents for every dollar earned by a man.
What is Inequality or Gini Index in Enfield?
Inequality or Gini Index in Enfield is 0.44.
What is the Total Population of Enfield?
Total Population of Enfield is 2,079.
What is the Total Male Population of Enfield?
Total Male Population of Enfield is 985.
What is the Total Female Population of Enfield?
Total Female Population of Enfield is 1,094.
What is the Ratio of Males per 100 Females in Enfield?
There are 90.04 Males per 100 Females in Enfield.
What is the Ratio of Females per 100 Males in Enfield?
There are 111.07 Females per 100 Males in Enfield.
What is the Median Population Age in Enfield?
Median Population Age in Enfield is 43.7 Years.
What is the Average Family Size in Enfield
Average Family Size in Enfield is 2.9 People.
What is the Average Household Size in Enfield
Average Household Size in Enfield is 2.3 People.
How Large is the Labor Force in Enfield?
There are 977 People in the Labor Forcein in Enfield.
What is the Percentage of People in the Labor Force in Enfield?
61.2% of People are in the Labor Force in Enfield.