North Woodstock, NH Map & Demographics
North Woodstock Map
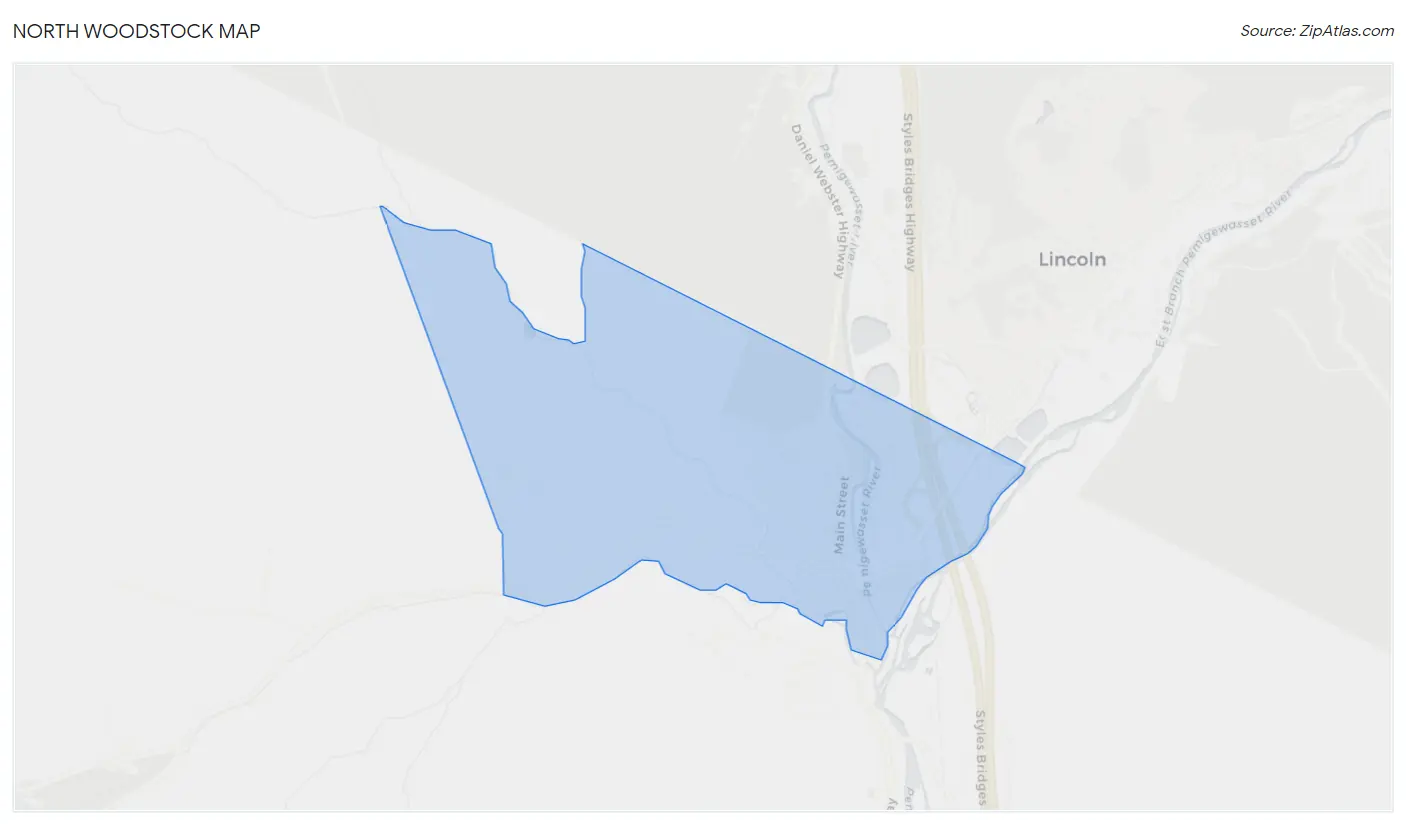
North Woodstock Overview
$62,304
PER CAPITA INCOME
$64,419
AVG HOUSEHOLD INCOME
64.8%
WAGE / INCOME GAP [ % ]
35.2¢/ $1
WAGE / INCOME GAP [ $ ]
0.50
INEQUALITY / GINI INDEX
532
TOTAL POPULATION
247
MALE POPULATION
285
FEMALE POPULATION
86.67
MALES / 100 FEMALES
115.38
FEMALES / 100 MALES
55.4
MEDIAN AGE
3.0
AVG FAMILY SIZE
2.2
AVG HOUSEHOLD SIZE
290
LABOR FORCE [ PEOPLE ]
63.2%
PERCENT IN LABOR FORCE
2.8%
UNEMPLOYMENT RATE
North Woodstock Zip Codes
North Woodstock Area Codes
Income in North Woodstock
Income Overview in North Woodstock
| Characteristic | Number | Measure |
| Per Capita Income | 532 | $62,304 |
| Median Family Income | 129 | $0 |
| Mean Family Income | 129 | $126,902 |
| Median Household Income | 240 | $64,419 |
| Mean Household Income | 240 | $115,300 |
| Income Deficit | 129 | $0 |
| Wage / Income Gap (%) | 532 | 64.78% |
| Wage / Income Gap ($) | 532 | 35.22¢ per $1 |
| Gini / Inequality Index | 532 | 0.50 |
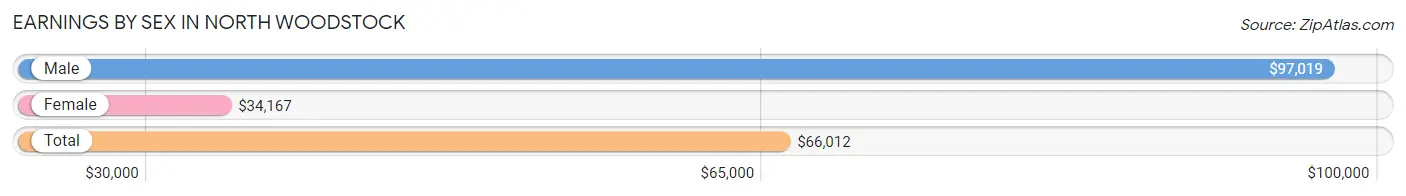
Earnings by Sex in North Woodstock
Average Earnings in North Woodstock are $66,012, $97,019 for men and $34,167 for women, a difference of 64.8%.
| Sex | Number | Average Earnings |
| Male | 165 (54.1%) | $97,019 |
| Female | 140 (45.9%) | $34,167 |
| Total | 305 (100.0%) | $66,012 |
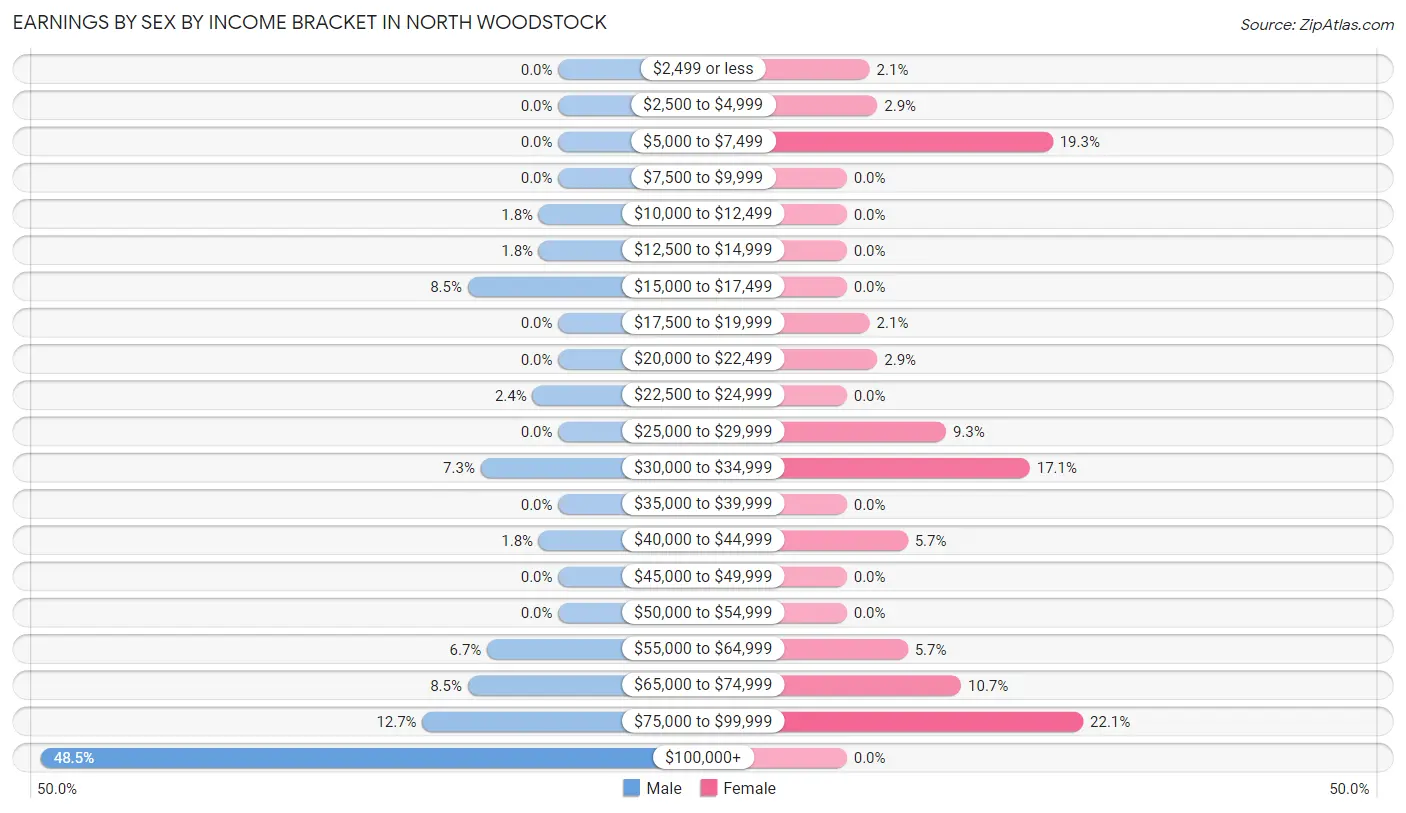
Earnings by Sex by Income Bracket in North Woodstock
The most common earnings brackets in North Woodstock are $100,000+ for men (80 | 48.5%) and $75,000 to $99,999 for women (31 | 22.1%).
| Income | Male | Female |
| $2,499 or less | 0 (0.0%) | 3 (2.1%) |
| $2,500 to $4,999 | 0 (0.0%) | 4 (2.9%) |
| $5,000 to $7,499 | 0 (0.0%) | 27 (19.3%) |
| $7,500 to $9,999 | 0 (0.0%) | 0 (0.0%) |
| $10,000 to $12,499 | 3 (1.8%) | 0 (0.0%) |
| $12,500 to $14,999 | 3 (1.8%) | 0 (0.0%) |
| $15,000 to $17,499 | 14 (8.5%) | 0 (0.0%) |
| $17,500 to $19,999 | 0 (0.0%) | 3 (2.1%) |
| $20,000 to $22,499 | 0 (0.0%) | 4 (2.9%) |
| $22,500 to $24,999 | 4 (2.4%) | 0 (0.0%) |
| $25,000 to $29,999 | 0 (0.0%) | 13 (9.3%) |
| $30,000 to $34,999 | 12 (7.3%) | 24 (17.1%) |
| $35,000 to $39,999 | 0 (0.0%) | 0 (0.0%) |
| $40,000 to $44,999 | 3 (1.8%) | 8 (5.7%) |
| $45,000 to $49,999 | 0 (0.0%) | 0 (0.0%) |
| $50,000 to $54,999 | 0 (0.0%) | 0 (0.0%) |
| $55,000 to $64,999 | 11 (6.7%) | 8 (5.7%) |
| $65,000 to $74,999 | 14 (8.5%) | 15 (10.7%) |
| $75,000 to $99,999 | 21 (12.7%) | 31 (22.1%) |
| $100,000+ | 80 (48.5%) | 0 (0.0%) |
| Total | 165 (100.0%) | 140 (100.0%) |
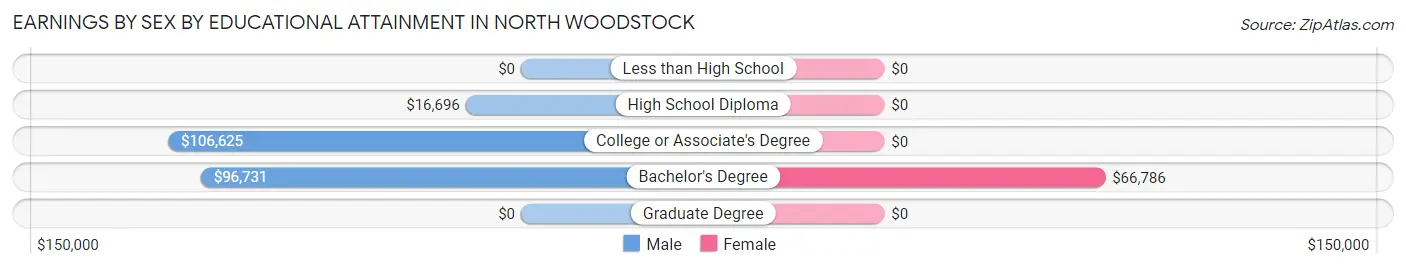
Earnings by Sex by Educational Attainment in North Woodstock
| Educational Attainment | Male Income | Female Income |
| Less than High School | - | - |
| High School Diploma | $16,696 | $0 |
| College or Associate's Degree | $106,625 | $0 |
| Bachelor's Degree | $96,731 | $66,786 |
| Graduate Degree | - | - |
| Total | $97,019 | $0 |
Family Income in North Woodstock
Family Income Brackets in North Woodstock
According to the North Woodstock family income data, there are 53 families falling into the $50,000 to $74,999 income range, which is the most common income bracket and makes up 41.1% of all families.
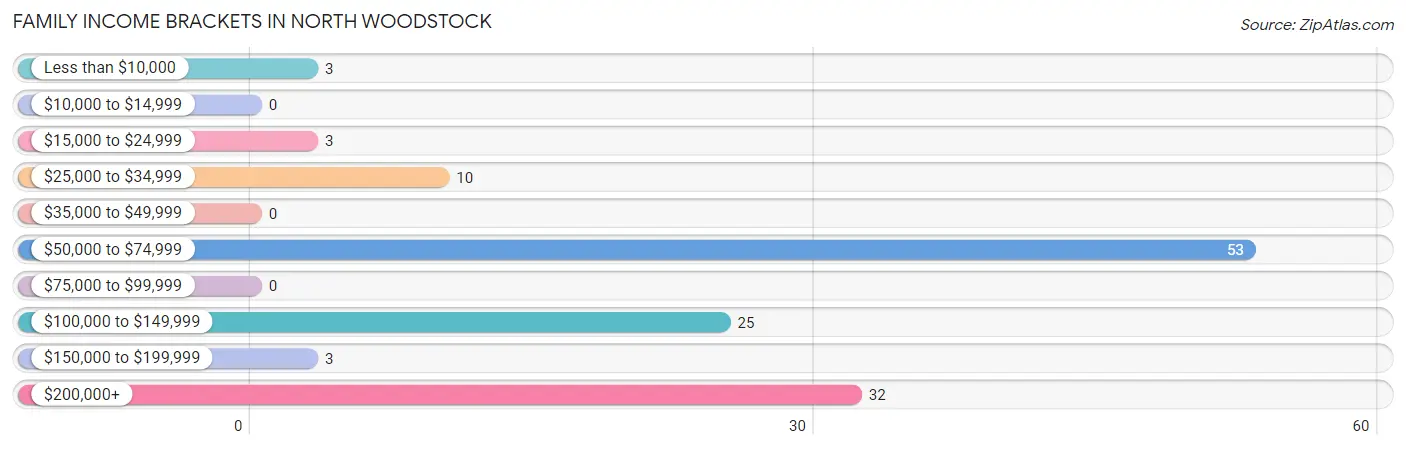
| Income Bracket | # Families | % Families |
| Less than $10,000 | 3 | 2.3% |
| $10,000 to $14,999 | 0 | 0.0% |
| $15,000 to $24,999 | 3 | 2.3% |
| $25,000 to $34,999 | 10 | 7.8% |
| $35,000 to $49,999 | 0 | 0.0% |
| $50,000 to $74,999 | 53 | 41.1% |
| $75,000 to $99,999 | 0 | 0.0% |
| $100,000 to $149,999 | 25 | 19.4% |
| $150,000 to $199,999 | 3 | 2.3% |
| $200,000+ | 32 | 24.8% |
Family Income by Famaliy Size in North Woodstock
2-person families (78 | 60.5%) account for the highest median family income in North Woodstock with $63,438 per family, while 2-person families (78 | 60.5%) have the highest median income of $31,719 per family member.
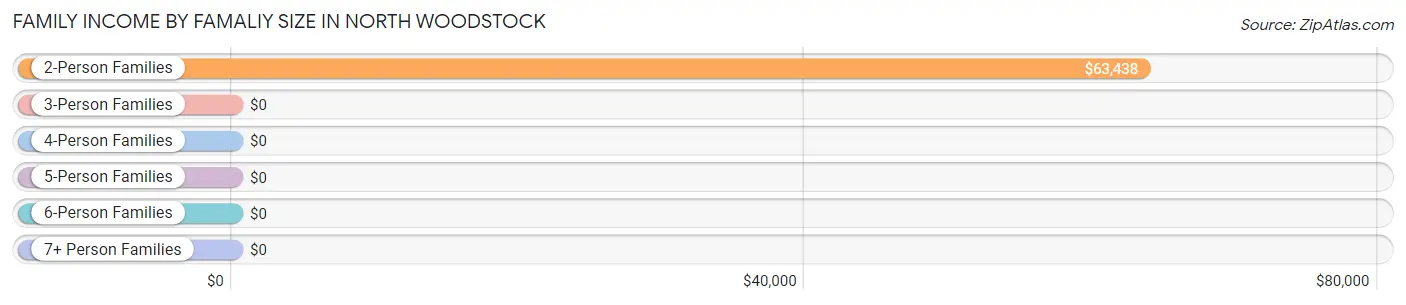
| Income Bracket | # Families | Median Income |
| 2-Person Families | 78 (60.5%) | $63,438 |
| 3-Person Families | 29 (22.5%) | $0 |
| 4-Person Families | 22 (17.1%) | $0 |
| 5-Person Families | 0 (0.0%) | $0 |
| 6-Person Families | 0 (0.0%) | $0 |
| 7+ Person Families | 0 (0.0%) | $0 |
| Total | 129 (100.0%) | $0 |
Family Income by Number of Earners in North Woodstock
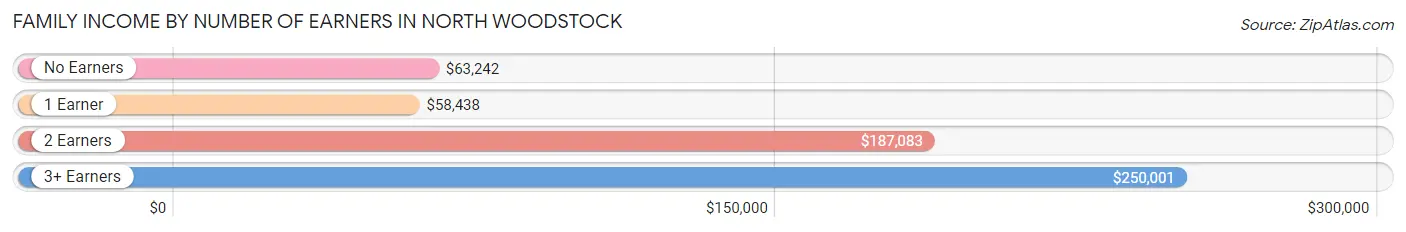
| Number of Earners | # Families | Median Income |
| No Earners | 45 (34.9%) | $63,242 |
| 1 Earner | 31 (24.0%) | $58,438 |
| 2 Earners | 27 (20.9%) | $187,083 |
| 3+ Earners | 26 (20.2%) | $250,001 |
| Total | 129 (100.0%) | $0 |
Household Income in North Woodstock
Household Income Brackets in North Woodstock
With 76 households falling in the category, the $50,000 to $74,999 income range is the most frequent in North Woodstock, accounting for 31.7% of all households. In contrast, only 3 households (1.3%) fall into the less than $10,000 income bracket, making it the least populous group.
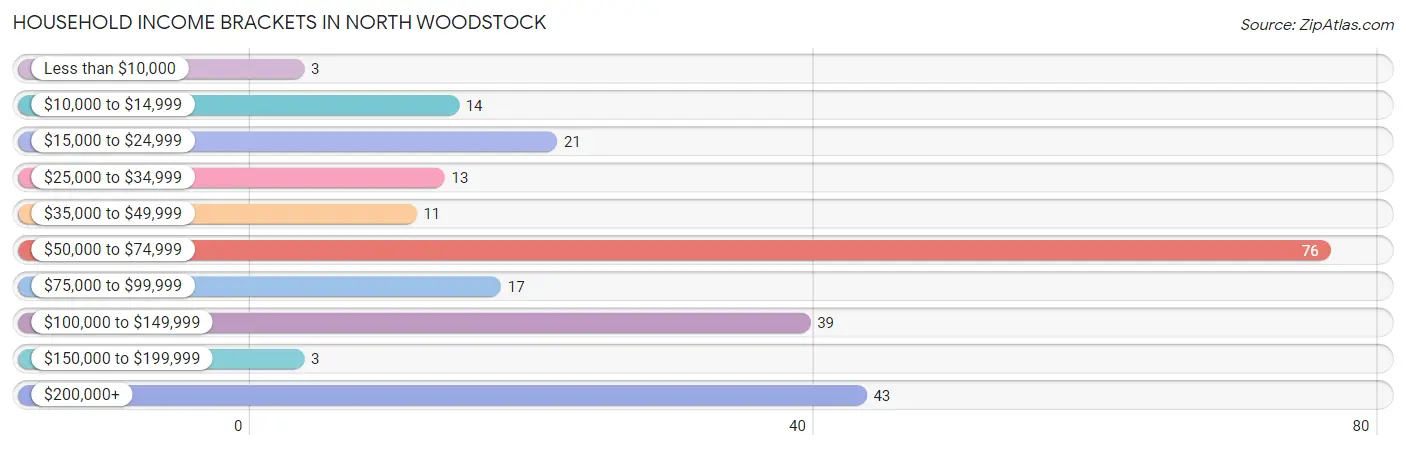
| Income Bracket | # Households | % Households |
| Less than $10,000 | 3 | 1.3% |
| $10,000 to $14,999 | 14 | 5.8% |
| $15,000 to $24,999 | 21 | 8.8% |
| $25,000 to $34,999 | 13 | 5.4% |
| $35,000 to $49,999 | 11 | 4.6% |
| $50,000 to $74,999 | 76 | 31.7% |
| $75,000 to $99,999 | 17 | 7.1% |
| $100,000 to $149,999 | 39 | 16.3% |
| $150,000 to $199,999 | 3 | 1.3% |
| $200,000+ | 43 | 17.9% |
Household Income by Householder Age in North Woodstock
The median household income in North Woodstock is $64,419, with the highest median household income of $105,750 found in the 45 to 64 years age bracket for the primary householder. A total of 88 households (36.7%) fall into this category. Meanwhile, the 15 to 24 years age bracket for the primary householder has the lowest median household income of $0, with 4 households (1.7%) in this group.
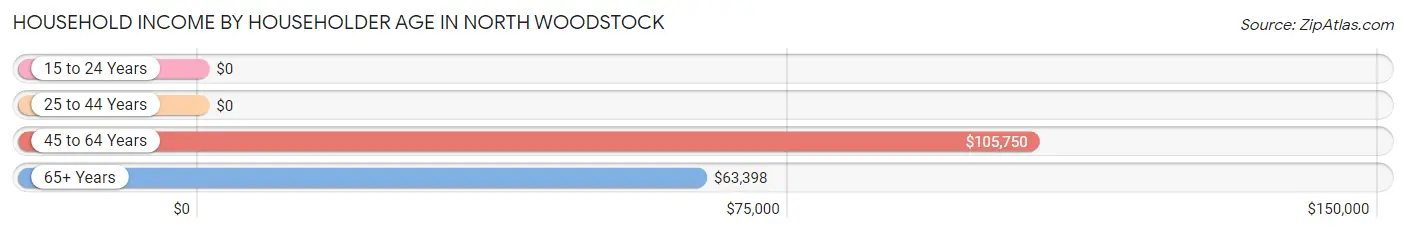
| Income Bracket | # Households | Median Income |
| 15 to 24 Years | 4 (1.7%) | $0 |
| 25 to 44 Years | 55 (22.9%) | $0 |
| 45 to 64 Years | 88 (36.7%) | $105,750 |
| 65+ Years | 93 (38.8%) | $63,398 |
| Total | 240 (100.0%) | $64,419 |
Poverty in North Woodstock
Income Below Poverty by Sex and Age in North Woodstock
With 5.7% poverty level for males and 7.4% for females among the residents of North Woodstock, 12 to 14 year old males and 65 to 74 year old females are the most vulnerable to poverty, with 3 males (100.0%) and 11 females (22.5%) in their respective age groups living below the poverty level.
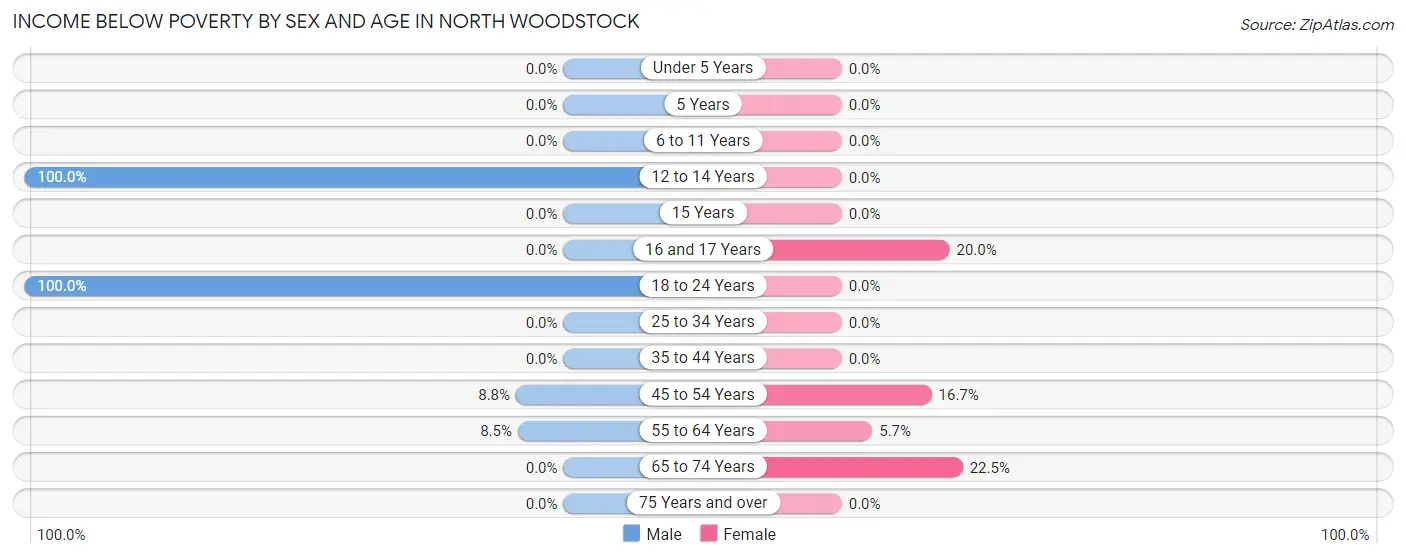
| Age Bracket | Male | Female |
| Under 5 Years | 0 (0.0%) | 0 (0.0%) |
| 5 Years | 0 (0.0%) | 0 (0.0%) |
| 6 to 11 Years | 0 (0.0%) | 0 (0.0%) |
| 12 to 14 Years | 3 (100.0%) | 0 (0.0%) |
| 15 Years | 0 (0.0%) | 0 (0.0%) |
| 16 and 17 Years | 0 (0.0%) | 3 (20.0%) |
| 18 to 24 Years | 2 (100.0%) | 0 (0.0%) |
| 25 to 34 Years | 0 (0.0%) | 0 (0.0%) |
| 35 to 44 Years | 0 (0.0%) | 0 (0.0%) |
| 45 to 54 Years | 3 (8.8%) | 4 (16.7%) |
| 55 to 64 Years | 6 (8.5%) | 3 (5.7%) |
| 65 to 74 Years | 0 (0.0%) | 11 (22.5%) |
| 75 Years and over | 0 (0.0%) | 0 (0.0%) |
| Total | 14 (5.7%) | 21 (7.4%) |
Income Above Poverty by Sex and Age in North Woodstock
According to the poverty statistics in North Woodstock, males aged 6 to 11 years and females aged under 5 years are the age groups that are most secure financially, with 100.0% of males and 100.0% of females in these age groups living above the poverty line.
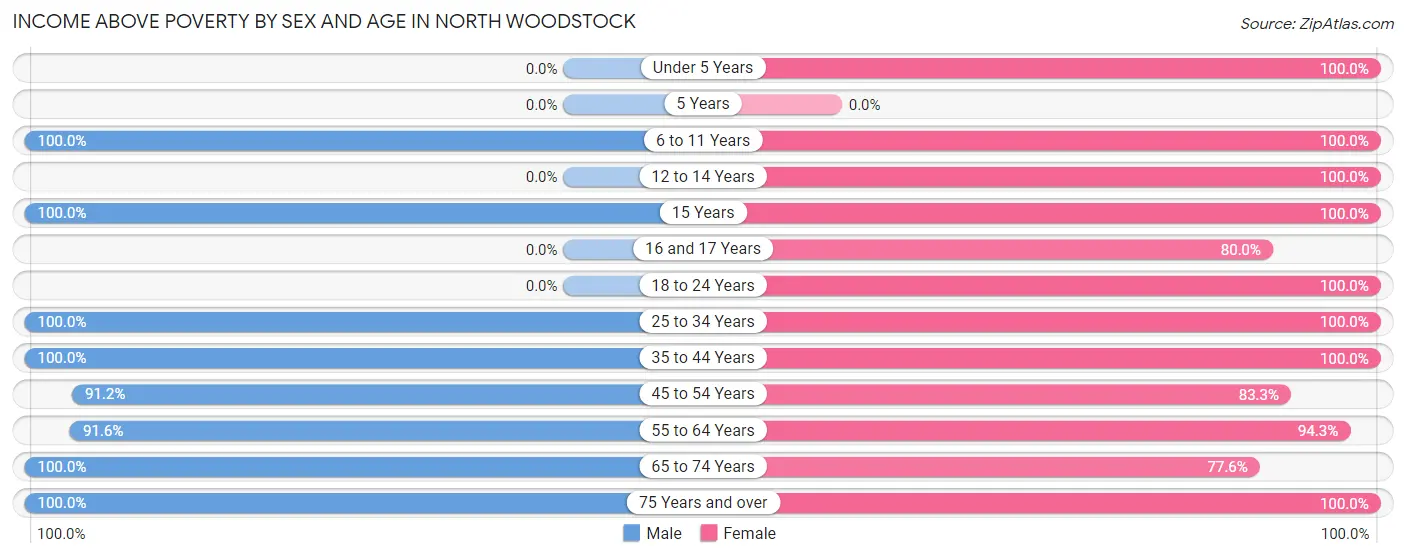
| Age Bracket | Male | Female |
| Under 5 Years | 0 (0.0%) | 4 (100.0%) |
| 5 Years | 0 (0.0%) | 0 (0.0%) |
| 6 to 11 Years | 10 (100.0%) | 21 (100.0%) |
| 12 to 14 Years | 0 (0.0%) | 11 (100.0%) |
| 15 Years | 6 (100.0%) | 18 (100.0%) |
| 16 and 17 Years | 0 (0.0%) | 12 (80.0%) |
| 18 to 24 Years | 0 (0.0%) | 4 (100.0%) |
| 25 to 34 Years | 54 (100.0%) | 25 (100.0%) |
| 35 to 44 Years | 18 (100.0%) | 15 (100.0%) |
| 45 to 54 Years | 31 (91.2%) | 20 (83.3%) |
| 55 to 64 Years | 65 (91.5%) | 50 (94.3%) |
| 65 to 74 Years | 29 (100.0%) | 38 (77.5%) |
| 75 Years and over | 20 (100.0%) | 46 (100.0%) |
| Total | 233 (94.3%) | 264 (92.6%) |
Income Below Poverty Among Married-Couple Families in North Woodstock
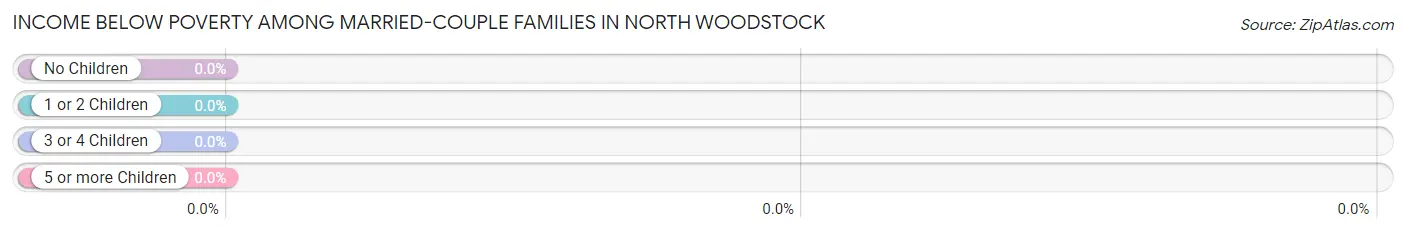
| Children | Above Poverty | Below Poverty |
| No Children | 72 (100.0%) | 0 (0.0%) |
| 1 or 2 Children | 22 (100.0%) | 0 (0.0%) |
| 3 or 4 Children | 0 (0.0%) | 0 (0.0%) |
| 5 or more Children | 0 (0.0%) | 0 (0.0%) |
| Total | 94 (100.0%) | 0 (0.0%) |
Income Below Poverty Among Single-Parent Households in North Woodstock
According to the poverty data in North Woodstock, 13.6% or 3 single-father households and 23.1% or 3 single-mother households are living below the poverty line. Among single-father households, those with 1 or 2 children have the highest poverty rate, with 3 households (23.1%) experiencing poverty. Likewise, among single-mother households, those with 1 or 2 children have the highest poverty rate, with 3 households (42.9%) falling below the poverty line.
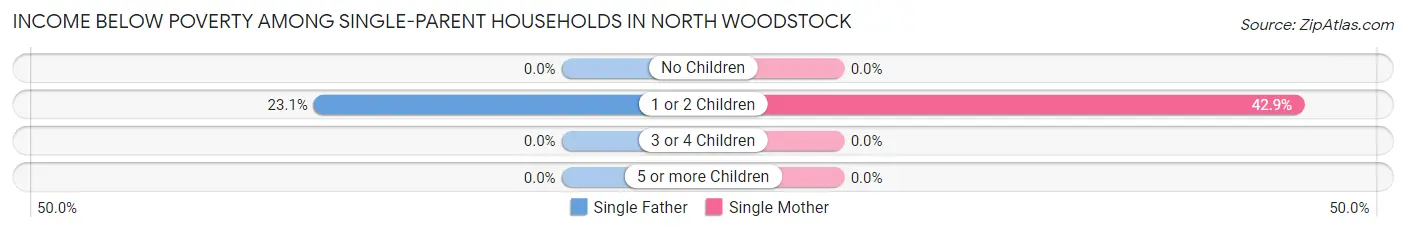
| Children | Single Father | Single Mother |
| No Children | 0 (0.0%) | 0 (0.0%) |
| 1 or 2 Children | 3 (23.1%) | 3 (42.9%) |
| 3 or 4 Children | 0 (0.0%) | 0 (0.0%) |
| 5 or more Children | 0 (0.0%) | 0 (0.0%) |
| Total | 3 (13.6%) | 3 (23.1%) |
Income Below Poverty Among Married-Couple vs Single-Parent Households in North Woodstock
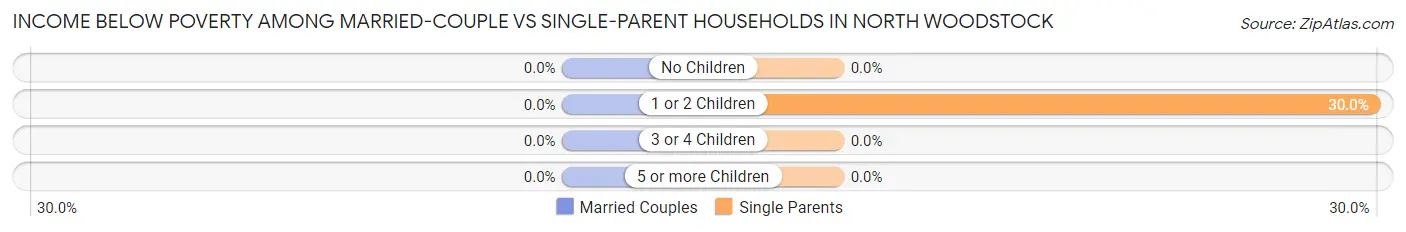
| Children | Married-Couple Families | Single-Parent Households |
| No Children | 0 (0.0%) | 0 (0.0%) |
| 1 or 2 Children | 0 (0.0%) | 6 (30.0%) |
| 3 or 4 Children | 0 (0.0%) | 0 (0.0%) |
| 5 or more Children | 0 (0.0%) | 0 (0.0%) |
| Total | 0 (0.0%) | 6 (17.1%) |
Race in North Woodstock
The most populous races in North Woodstock are White / Caucasian (526 | 98.9%), and Two or more Races (6 | 1.1%).
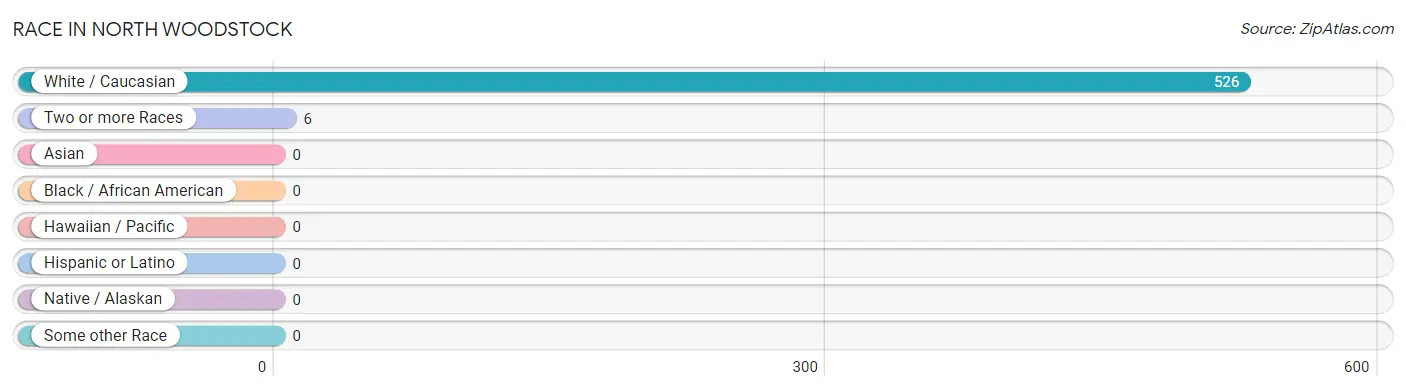
| Race | # Population | % Population |
| Asian | 0 | 0.0% |
| Black / African American | 0 | 0.0% |
| Hawaiian / Pacific | 0 | 0.0% |
| Hispanic or Latino | 0 | 0.0% |
| Native / Alaskan | 0 | 0.0% |
| White / Caucasian | 526 | 98.9% |
| Two or more Races | 6 | 1.1% |
| Some other Race | 0 | 0.0% |
| Total | 532 | 100.0% |
Ancestry in North Woodstock
The most populous ancestries reported in North Woodstock are Irish (107 | 20.1%), English (69 | 13.0%), European (62 | 11.7%), French (51 | 9.6%), and Swedish (37 | 7.0%), together accounting for 61.3% of all North Woodstock residents.
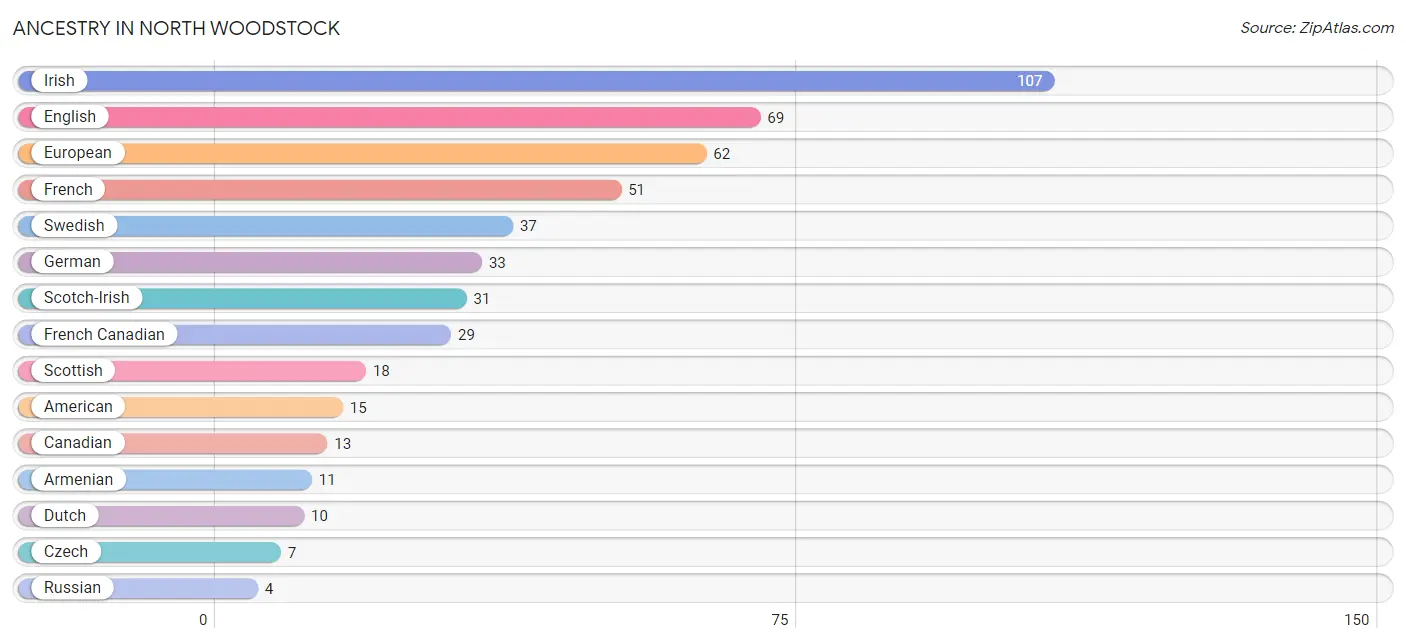
| Ancestry | # Population | % Population |
| American | 15 | 2.8% |
| Armenian | 11 | 2.1% |
| Canadian | 13 | 2.4% |
| Czech | 7 | 1.3% |
| Dutch | 10 | 1.9% |
| English | 69 | 13.0% |
| European | 62 | 11.7% |
| French | 51 | 9.6% |
| French Canadian | 29 | 5.4% |
| German | 33 | 6.2% |
| Hungarian | 3 | 0.6% |
| Irish | 107 | 20.1% |
| Russian | 4 | 0.7% |
| Scotch-Irish | 31 | 5.8% |
| Scottish | 18 | 3.4% |
| Swedish | 37 | 7.0% | View All 16 Rows |
Immigrants in North Woodstock
The most numerous immigrant groups reported in North Woodstock came from , and Canada (4 | 0.7%), together accounting for 0.7% of all North Woodstock residents.

| Immigration Origin | # Population | % Population |
| Canada | 4 | 0.7% | View All 1 Rows |
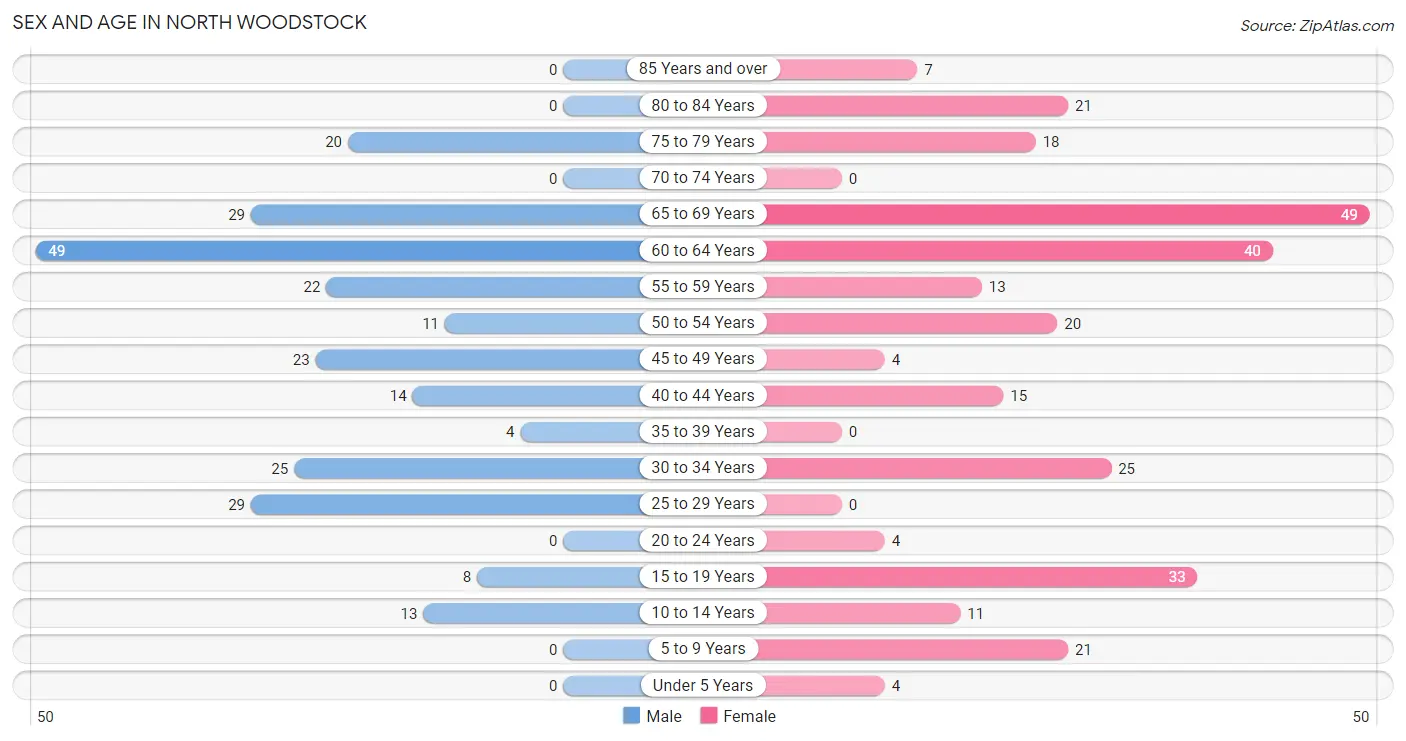
Sex and Age in North Woodstock
Sex and Age in North Woodstock
The most populous age groups in North Woodstock are 60 to 64 Years (49 | 19.8%) for men and 65 to 69 Years (49 | 17.2%) for women.
| Age Bracket | Male | Female |
| Under 5 Years | 0 (0.0%) | 4 (1.4%) |
| 5 to 9 Years | 0 (0.0%) | 21 (7.4%) |
| 10 to 14 Years | 13 (5.3%) | 11 (3.9%) |
| 15 to 19 Years | 8 (3.2%) | 33 (11.6%) |
| 20 to 24 Years | 0 (0.0%) | 4 (1.4%) |
| 25 to 29 Years | 29 (11.7%) | 0 (0.0%) |
| 30 to 34 Years | 25 (10.1%) | 25 (8.8%) |
| 35 to 39 Years | 4 (1.6%) | 0 (0.0%) |
| 40 to 44 Years | 14 (5.7%) | 15 (5.3%) |
| 45 to 49 Years | 23 (9.3%) | 4 (1.4%) |
| 50 to 54 Years | 11 (4.4%) | 20 (7.0%) |
| 55 to 59 Years | 22 (8.9%) | 13 (4.6%) |
| 60 to 64 Years | 49 (19.8%) | 40 (14.0%) |
| 65 to 69 Years | 29 (11.7%) | 49 (17.2%) |
| 70 to 74 Years | 0 (0.0%) | 0 (0.0%) |
| 75 to 79 Years | 20 (8.1%) | 18 (6.3%) |
| 80 to 84 Years | 0 (0.0%) | 21 (7.4%) |
| 85 Years and over | 0 (0.0%) | 7 (2.5%) |
| Total | 247 (100.0%) | 285 (100.0%) |
Families and Households in North Woodstock
Median Family Size in North Woodstock
The median family size in North Woodstock is 3.02 persons per family, with single male/father families (22 | 17.1%) accounting for the largest median family size of 4.14 persons per family. On the other hand, married-couple families (94 | 72.9%) represent the smallest median family size with 2.70 persons per family.
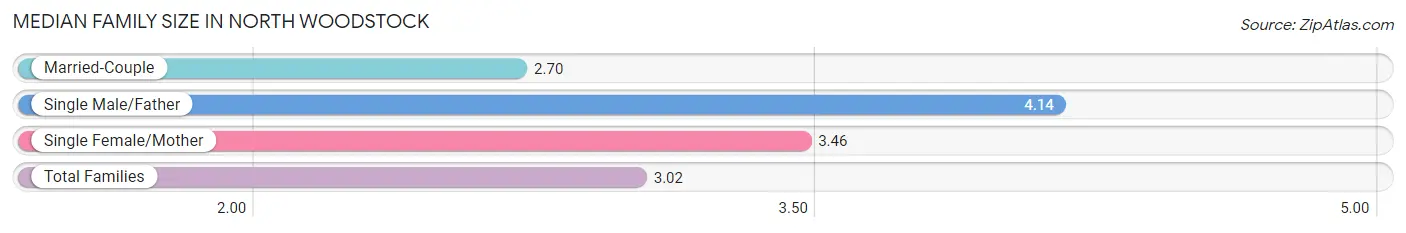
| Family Type | # Families | Family Size |
| Married-Couple | 94 (72.9%) | 2.70 |
| Single Male/Father | 22 (17.1%) | 4.14 |
| Single Female/Mother | 13 (10.1%) | 3.46 |
| Total Families | 129 (100.0%) | 3.02 |
Median Household Size in North Woodstock
The median household size in North Woodstock is 2.22 persons per household, with single male/father households (22 | 9.2%) accounting for the largest median household size of 4.32 persons per household. non-family households (111 | 46.3%) represent the smallest median household size with 1.03 persons per household.
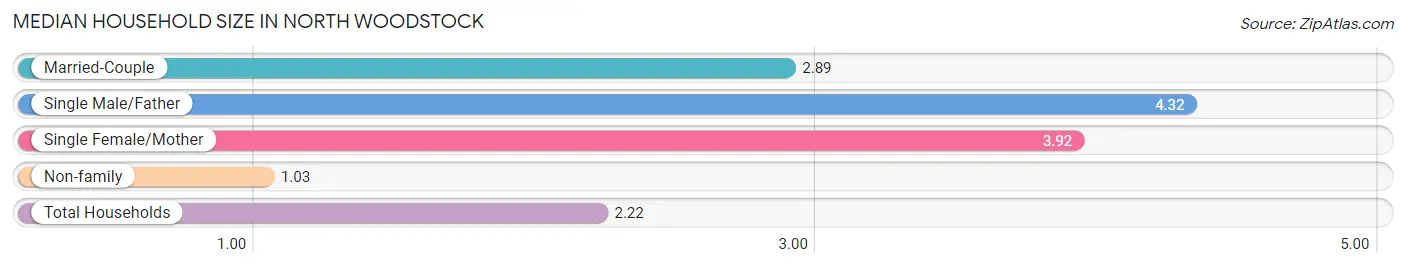
| Household Type | # Households | Household Size |
| Married-Couple | 94 (39.2%) | 2.89 |
| Single Male/Father | 22 (9.2%) | 4.32 |
| Single Female/Mother | 13 (5.4%) | 3.92 |
| Non-family | 111 (46.3%) | 1.03 |
| Total Households | 240 (100.0%) | 2.22 |
Household Size by Marriage Status in North Woodstock
Out of a total of 240 households in North Woodstock, 129 (53.7%) are family households, while 111 (46.3%) are nonfamily households. The most numerous type of family households are 2-person households, comprising 72, and the most common type of nonfamily households are 1-person households, comprising 108.
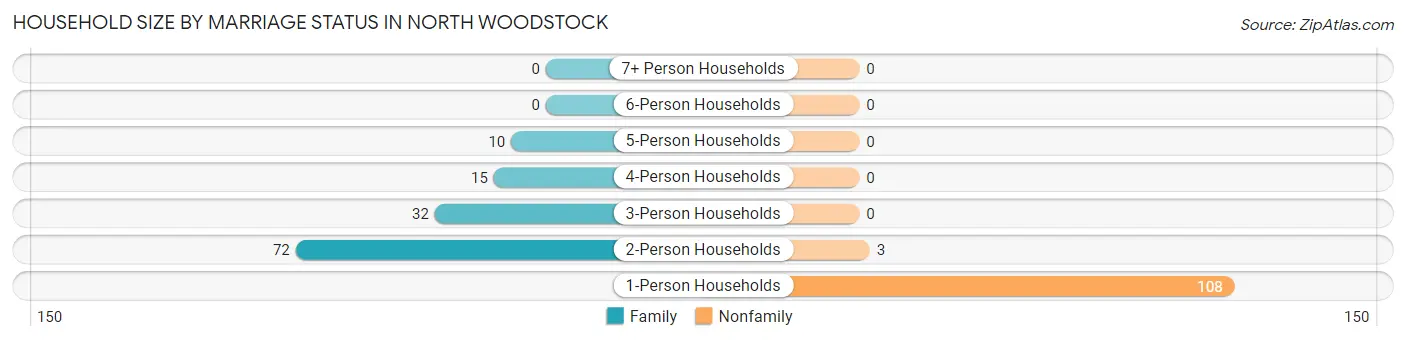
| Household Size | Family Households | Nonfamily Households |
| 1-Person Households | - | 108 (45.0%) |
| 2-Person Households | 72 (30.0%) | 3 (1.3%) |
| 3-Person Households | 32 (13.3%) | 0 (0.0%) |
| 4-Person Households | 15 (6.2%) | 0 (0.0%) |
| 5-Person Households | 10 (4.2%) | 0 (0.0%) |
| 6-Person Households | 0 (0.0%) | 0 (0.0%) |
| 7+ Person Households | 0 (0.0%) | 0 (0.0%) |
| Total | 129 (53.7%) | 111 (46.3%) |
Female Fertility in North Woodstock
Fertility by Age in North Woodstock
| Age Bracket | Women with Births | Births / 1,000 Women |
| 15 to 19 years | 0 (0.0%) | 0.0 |
| 20 to 34 years | 0 (0.0%) | 0.0 |
| 35 to 50 years | 0 (0.0%) | 0.0 |
| Total | 0 (0.0%) | 0.0 |
Fertility by Age by Marriage Status in North Woodstock
| Age Bracket | Married | Unmarried |
| 15 to 19 years | 0 (0.0%) | 0 (0.0%) |
| 20 to 34 years | 0 (0.0%) | 0 (0.0%) |
| 35 to 50 years | 0 (0.0%) | 0 (0.0%) |
| Total | 0 (0.0%) | 0 (0.0%) |
Fertility by Education in North Woodstock
| Educational Attainment | Women with Births | Births / 1,000 Women |
| Less than High School | 0 (0.0%) | 0.0 |
| High School Diploma | 0 (0.0%) | 0.0 |
| College or Associate's Degree | 0 (0.0%) | 0.0 |
| Bachelor's Degree | 0 (0.0%) | 0.0 |
| Graduate Degree | 0 (0.0%) | 0.0 |
| Total | 0 (0.0%) | 0.0 |
Fertility by Education by Marriage Status in North Woodstock
| Educational Attainment | Married | Unmarried |
| Less than High School | 0 (0.0%) | 0 (0.0%) |
| High School Diploma | 0 (0.0%) | 0 (0.0%) |
| College or Associate's Degree | 0 (0.0%) | 0 (0.0%) |
| Bachelor's Degree | 0 (0.0%) | 0 (0.0%) |
| Graduate Degree | 0 (0.0%) | 0 (0.0%) |
| Total | 0 (0.0%) | 0 (0.0%) |
Employment Characteristics in North Woodstock
Employment by Class of Employer in North Woodstock
Among the 282 employed individuals in North Woodstock, private company employees (207 | 73.4%), local government employees (30 | 10.6%), and self-employed (not incorporated) (16 | 5.7%) make up the most common classes of employment.
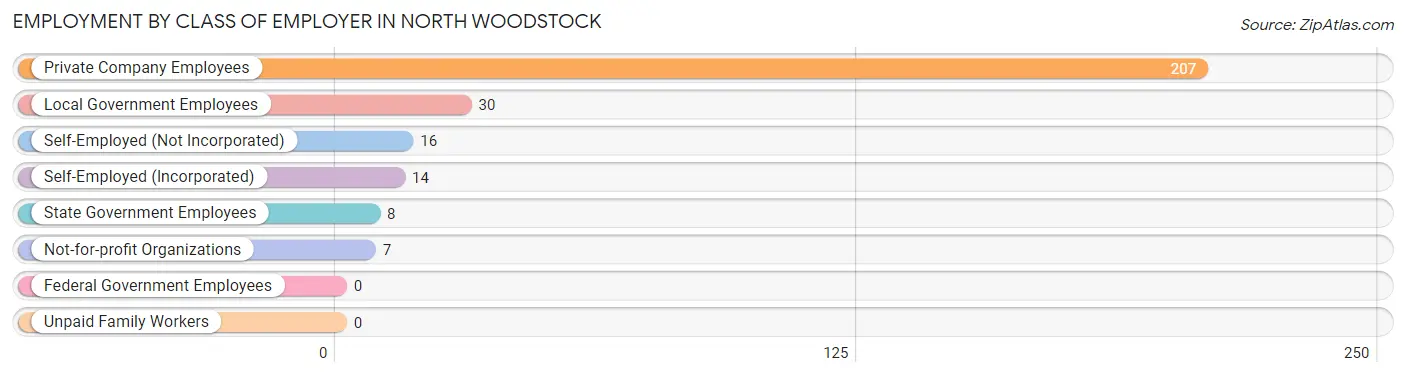
| Employer Class | # Employees | % Employees |
| Private Company Employees | 207 | 73.4% |
| Self-Employed (Incorporated) | 14 | 5.0% |
| Self-Employed (Not Incorporated) | 16 | 5.7% |
| Not-for-profit Organizations | 7 | 2.5% |
| Local Government Employees | 30 | 10.6% |
| State Government Employees | 8 | 2.8% |
| Federal Government Employees | 0 | 0.0% |
| Unpaid Family Workers | 0 | 0.0% |
| Total | 282 | 100.0% |
Employment Status by Age in North Woodstock
According to the labor force statistics for North Woodstock, out of the total population over 16 years of age (459), 63.2% or 290 individuals are in the labor force, with 2.8% or 8 of them unemployed. The age group with the highest labor force participation rate is 20 to 24 years, with 100.0% or 4 individuals in the labor force. Within the labor force, the 35 to 44 years age range has the highest percentage of unemployed individuals, with 12.1% or 4 of them being unemployed.
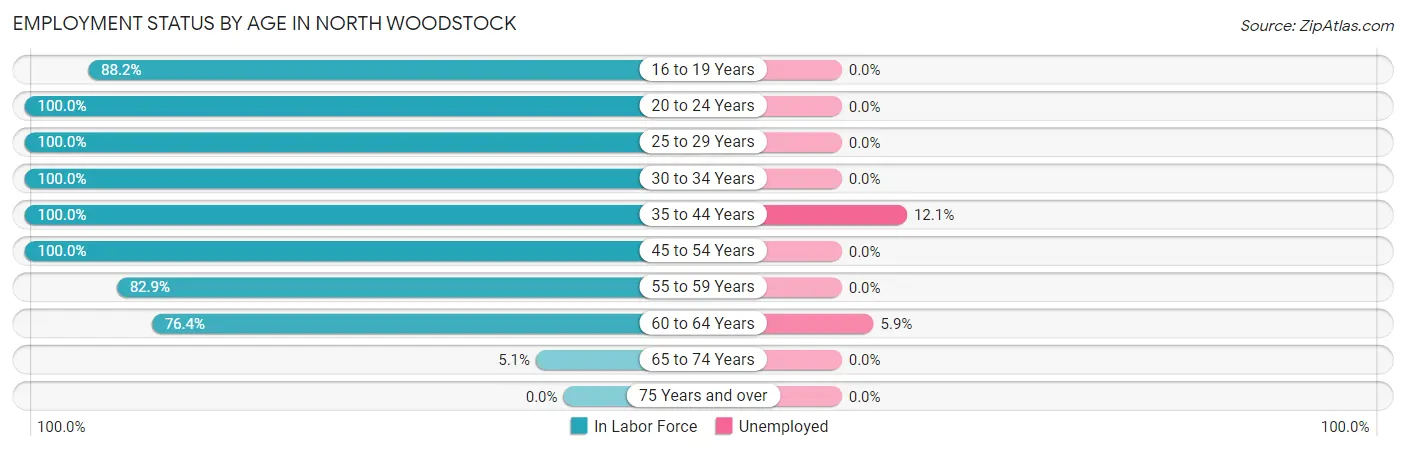
| Age Bracket | In Labor Force | Unemployed |
| 16 to 19 Years | 15 (88.2%) | 0 (0.0%) |
| 20 to 24 Years | 4 (100.0%) | 0 (0.0%) |
| 25 to 29 Years | 29 (100.0%) | 0 (0.0%) |
| 30 to 34 Years | 50 (100.0%) | 0 (0.0%) |
| 35 to 44 Years | 33 (100.0%) | 4 (12.1%) |
| 45 to 54 Years | 58 (100.0%) | 0 (0.0%) |
| 55 to 59 Years | 29 (82.9%) | 0 (0.0%) |
| 60 to 64 Years | 68 (76.4%) | 4 (5.9%) |
| 65 to 74 Years | 4 (5.1%) | 0 (0.0%) |
| 75 Years and over | 0 (0.0%) | 0 (0.0%) |
| Total | 290 (63.2%) | 8 (2.8%) |
Employment Status by Educational Attainment in North Woodstock
According to labor force statistics for North Woodstock, 90.8% of individuals (267) out of the total population between 25 and 64 years of age (294) are in the labor force, with 3.0% or 8 of them being unemployed. The group with the highest labor force participation rate are those with the educational attainment of bachelor's degree or higher, with 100.0% or 146 individuals in the labor force. Within the labor force, individuals with bachelor's degree or higher education have the highest percentage of unemployment, with 5.5% or 8 of them being unemployed.
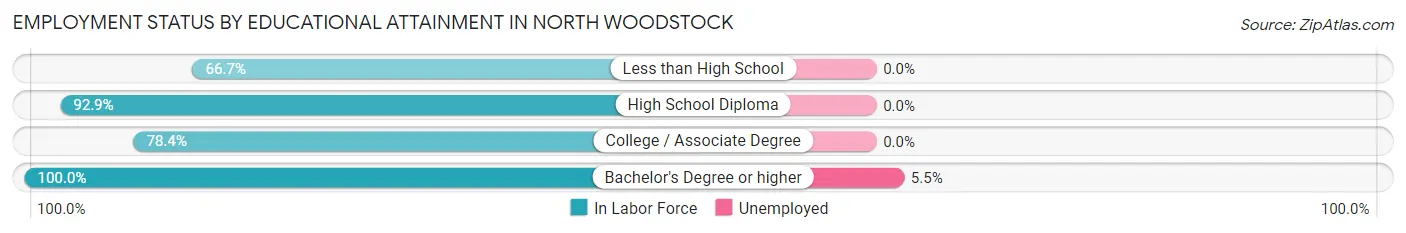
| Educational Attainment | In Labor Force | Unemployed |
| Less than High School | 6 (66.7%) | 0 (0.0%) |
| High School Diploma | 39 (92.9%) | 0 (0.0%) |
| College / Associate Degree | 76 (78.4%) | 0 (0.0%) |
| Bachelor's Degree or higher | 146 (100.0%) | 8 (5.5%) |
| Total | 267 (90.8%) | 9 (3.0%) |
Employment Occupations by Sex in North Woodstock
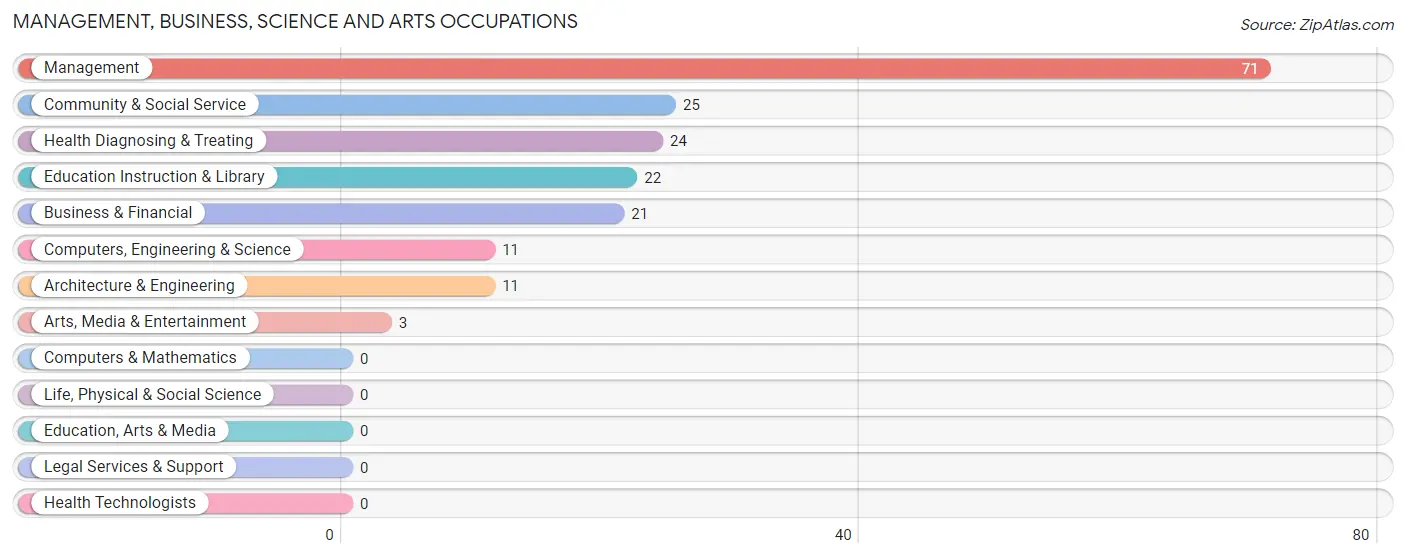
Management, Business, Science and Arts Occupations
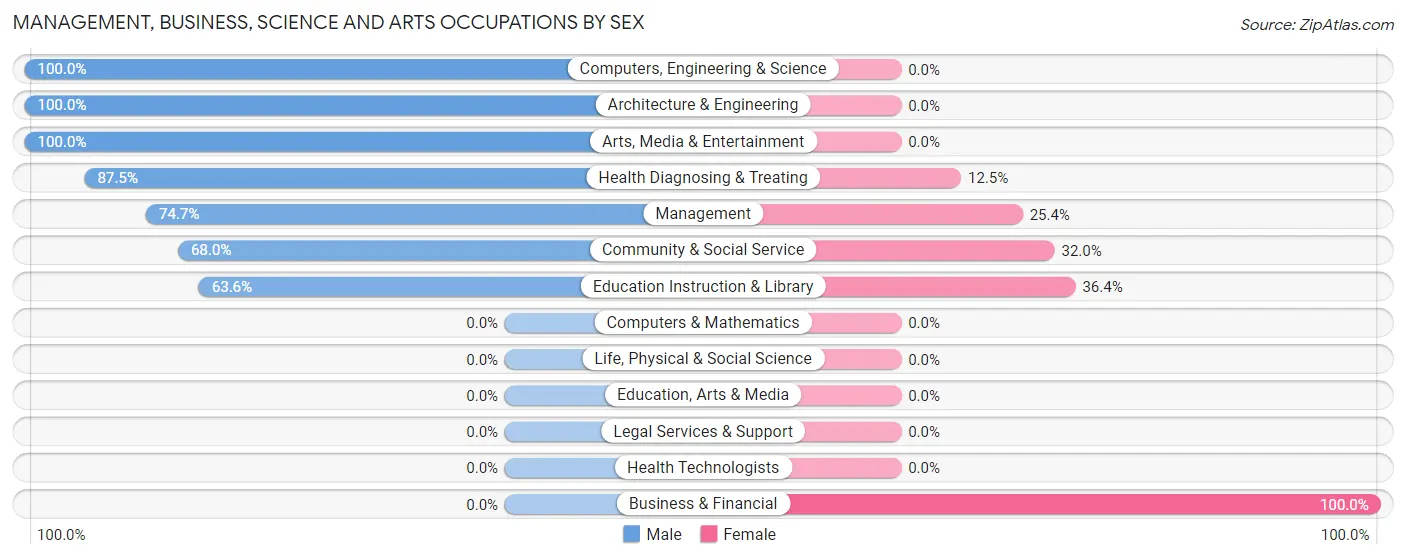
The most common Management, Business, Science and Arts occupations in North Woodstock are Management (71 | 25.2%), Community & Social Service (25 | 8.9%), Health Diagnosing & Treating (24 | 8.5%), Education Instruction & Library (22 | 7.8%), and Business & Financial (21 | 7.4%).
Management, Business, Science and Arts Occupations by Sex
Within the Management, Business, Science and Arts occupations in North Woodstock, the most male-oriented occupations are Computers, Engineering & Science (100.0%), Architecture & Engineering (100.0%), and Arts, Media & Entertainment (100.0%), while the most female-oriented occupations are Business & Financial (100.0%), Education Instruction & Library (36.4%), and Community & Social Service (32.0%).
| Occupation | Male | Female |
| Management | 53 (74.7%) | 18 (25.4%) |
| Business & Financial | 0 (0.0%) | 21 (100.0%) |
| Computers, Engineering & Science | 11 (100.0%) | 0 (0.0%) |
| Computers & Mathematics | 0 (0.0%) | 0 (0.0%) |
| Architecture & Engineering | 11 (100.0%) | 0 (0.0%) |
| Life, Physical & Social Science | 0 (0.0%) | 0 (0.0%) |
| Community & Social Service | 17 (68.0%) | 8 (32.0%) |
| Education, Arts & Media | 0 (0.0%) | 0 (0.0%) |
| Legal Services & Support | 0 (0.0%) | 0 (0.0%) |
| Education Instruction & Library | 14 (63.6%) | 8 (36.4%) |
| Arts, Media & Entertainment | 3 (100.0%) | 0 (0.0%) |
| Health Diagnosing & Treating | 21 (87.5%) | 3 (12.5%) |
| Health Technologists | 0 (0.0%) | 0 (0.0%) |
| Total (Category) | 102 (67.1%) | 50 (32.9%) |
| Total (Overall) | 161 (57.1%) | 121 (42.9%) |
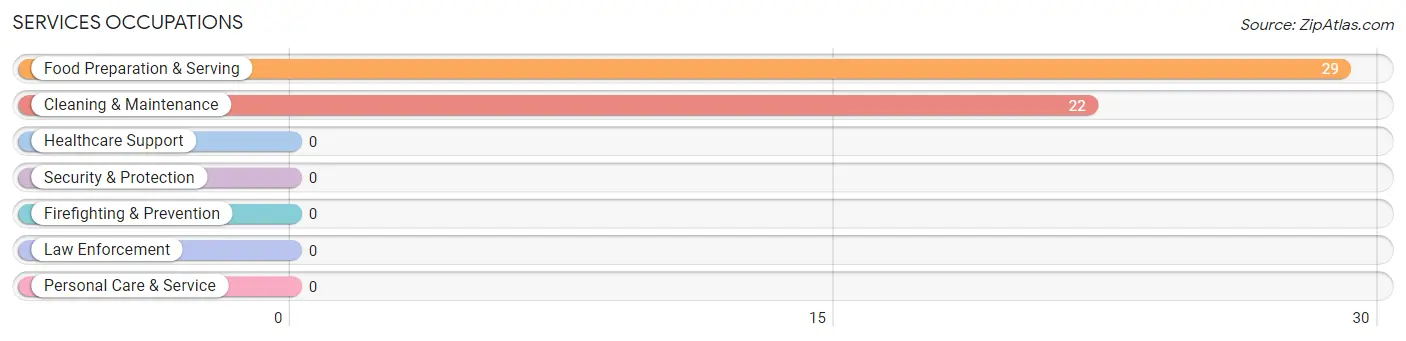
Services Occupations
The most common Services occupations in North Woodstock are Food Preparation & Serving (29 | 10.3%), and Cleaning & Maintenance (22 | 7.8%).
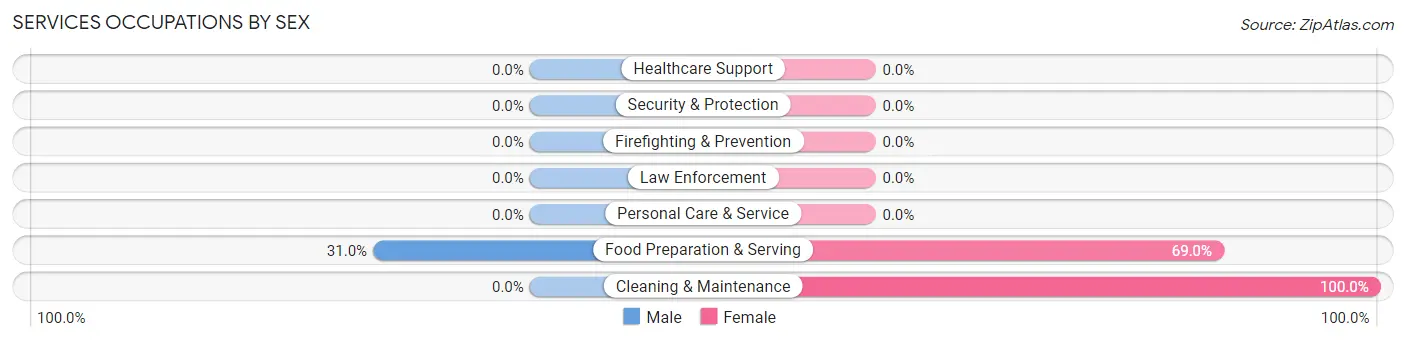
Services Occupations by Sex
| Occupation | Male | Female |
| Healthcare Support | 0 (0.0%) | 0 (0.0%) |
| Security & Protection | 0 (0.0%) | 0 (0.0%) |
| Firefighting & Prevention | 0 (0.0%) | 0 (0.0%) |
| Law Enforcement | 0 (0.0%) | 0 (0.0%) |
| Food Preparation & Serving | 9 (31.0%) | 20 (69.0%) |
| Cleaning & Maintenance | 0 (0.0%) | 22 (100.0%) |
| Personal Care & Service | 0 (0.0%) | 0 (0.0%) |
| Total (Category) | 9 (17.6%) | 42 (82.4%) |
| Total (Overall) | 161 (57.1%) | 121 (42.9%) |
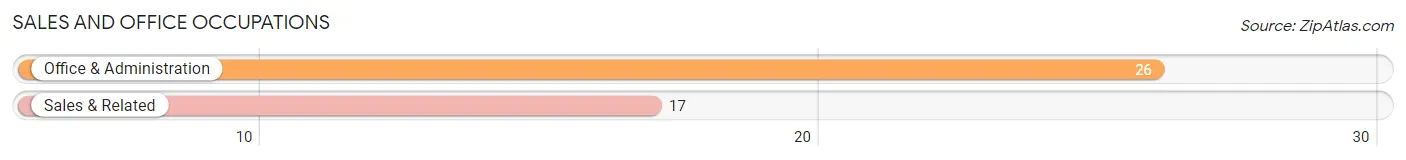
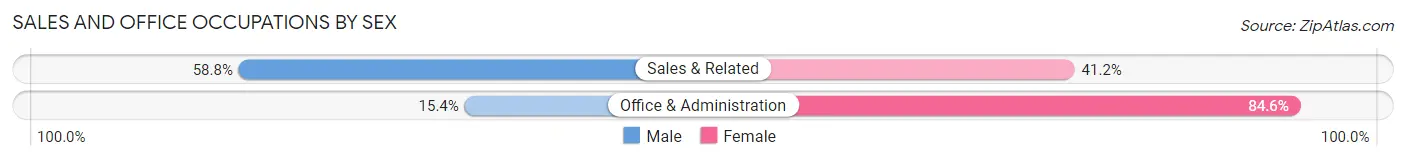
Sales and Office Occupations
The most common Sales and Office occupations in North Woodstock are Office & Administration (26 | 9.2%), and Sales & Related (17 | 6.0%).
Sales and Office Occupations by Sex
| Occupation | Male | Female |
| Sales & Related | 10 (58.8%) | 7 (41.2%) |
| Office & Administration | 4 (15.4%) | 22 (84.6%) |
| Total (Category) | 14 (32.6%) | 29 (67.4%) |
| Total (Overall) | 161 (57.1%) | 121 (42.9%) |
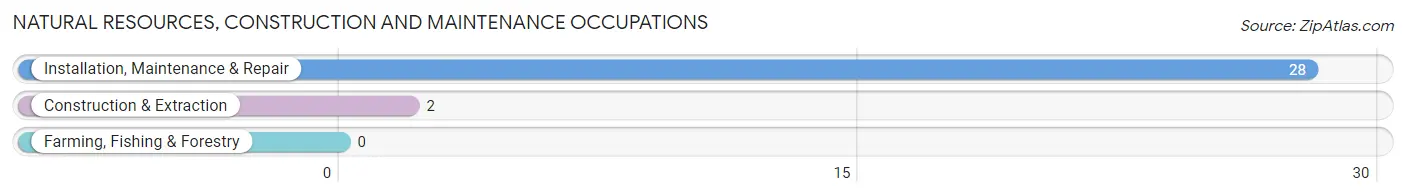
Natural Resources, Construction and Maintenance Occupations
The most common Natural Resources, Construction and Maintenance occupations in North Woodstock are Installation, Maintenance & Repair (28 | 9.9%), and Construction & Extraction (2 | 0.7%).
Natural Resources, Construction and Maintenance Occupations by Sex
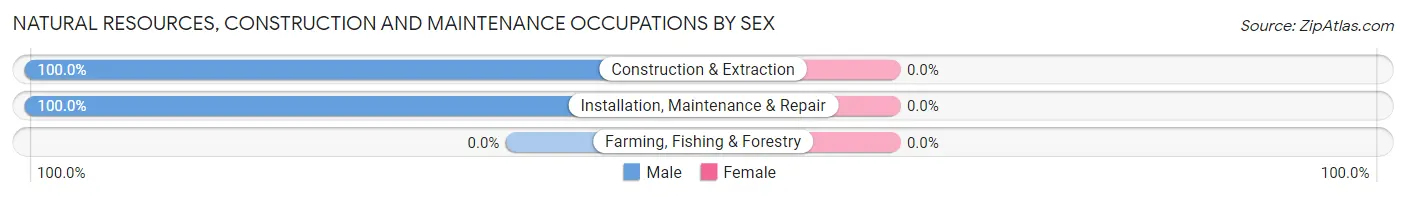
| Occupation | Male | Female |
| Farming, Fishing & Forestry | 0 (0.0%) | 0 (0.0%) |
| Construction & Extraction | 2 (100.0%) | 0 (0.0%) |
| Installation, Maintenance & Repair | 28 (100.0%) | 0 (0.0%) |
| Total (Category) | 30 (100.0%) | 0 (0.0%) |
| Total (Overall) | 161 (57.1%) | 121 (42.9%) |
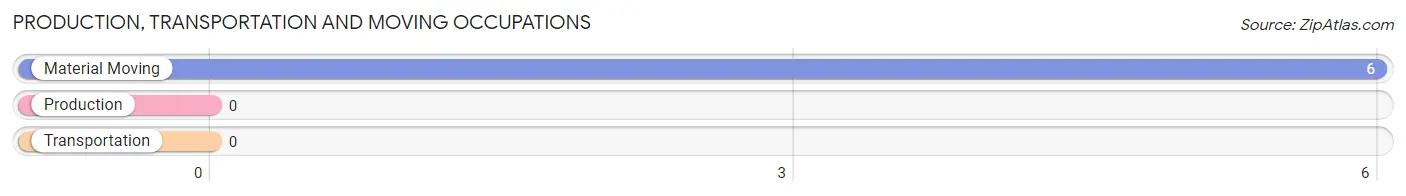
Production, Transportation and Moving Occupations
The most common Production, Transportation and Moving occupations in North Woodstock are , and Material Moving (6 | 2.1%).
Production, Transportation and Moving Occupations by Sex
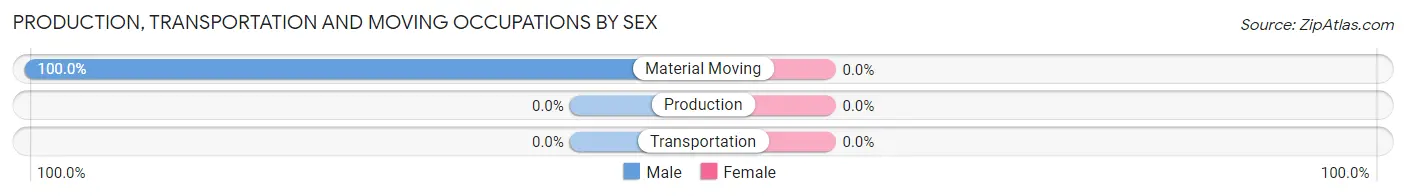
| Occupation | Male | Female |
| Production | 0 (0.0%) | 0 (0.0%) |
| Transportation | 0 (0.0%) | 0 (0.0%) |
| Material Moving | 6 (100.0%) | 0 (0.0%) |
| Total (Category) | 6 (100.0%) | 0 (0.0%) |
| Total (Overall) | 161 (57.1%) | 121 (42.9%) |
Employment Industries by Sex in North Woodstock
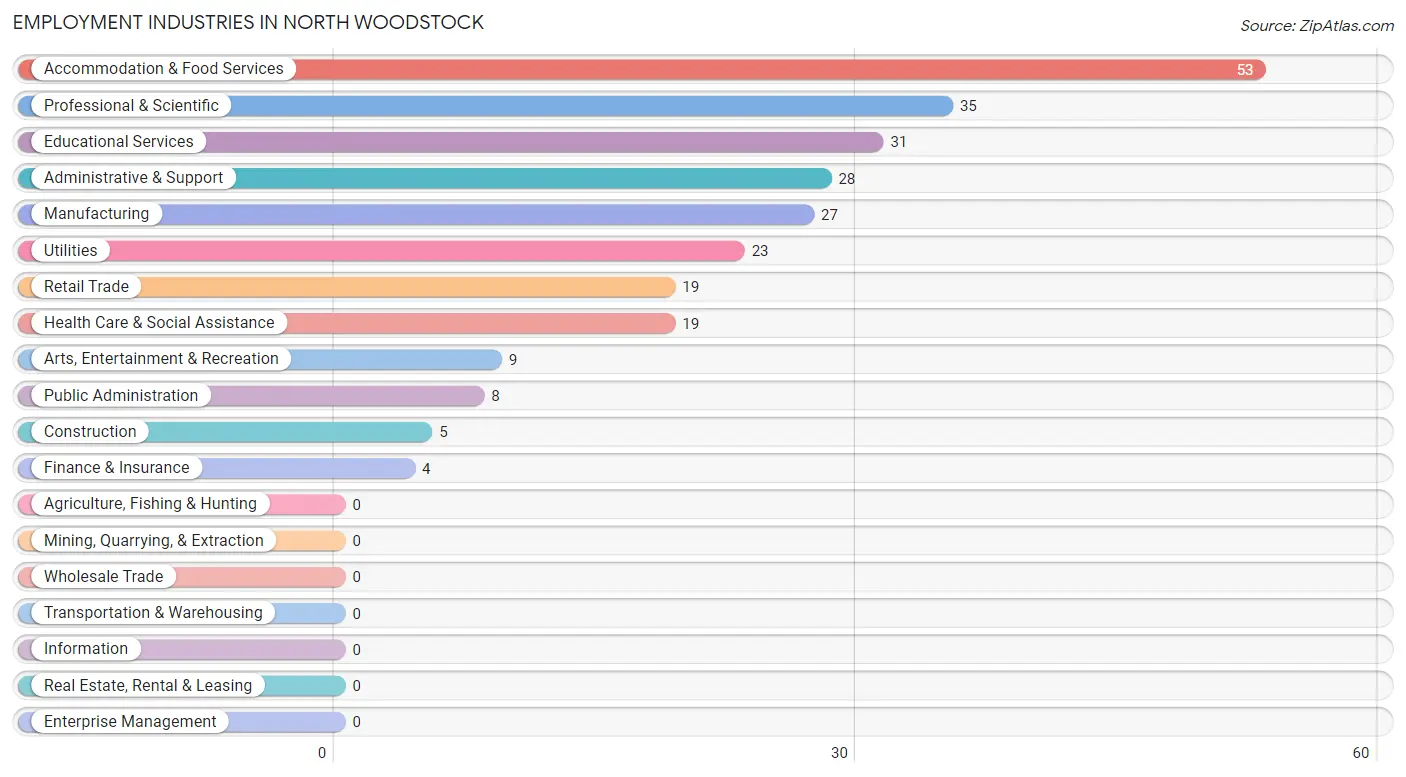
Employment Industries in North Woodstock
The major employment industries in North Woodstock include Accommodation & Food Services (53 | 18.8%), Professional & Scientific (35 | 12.4%), Educational Services (31 | 11.0%), Administrative & Support (28 | 9.9%), and Manufacturing (27 | 9.6%).
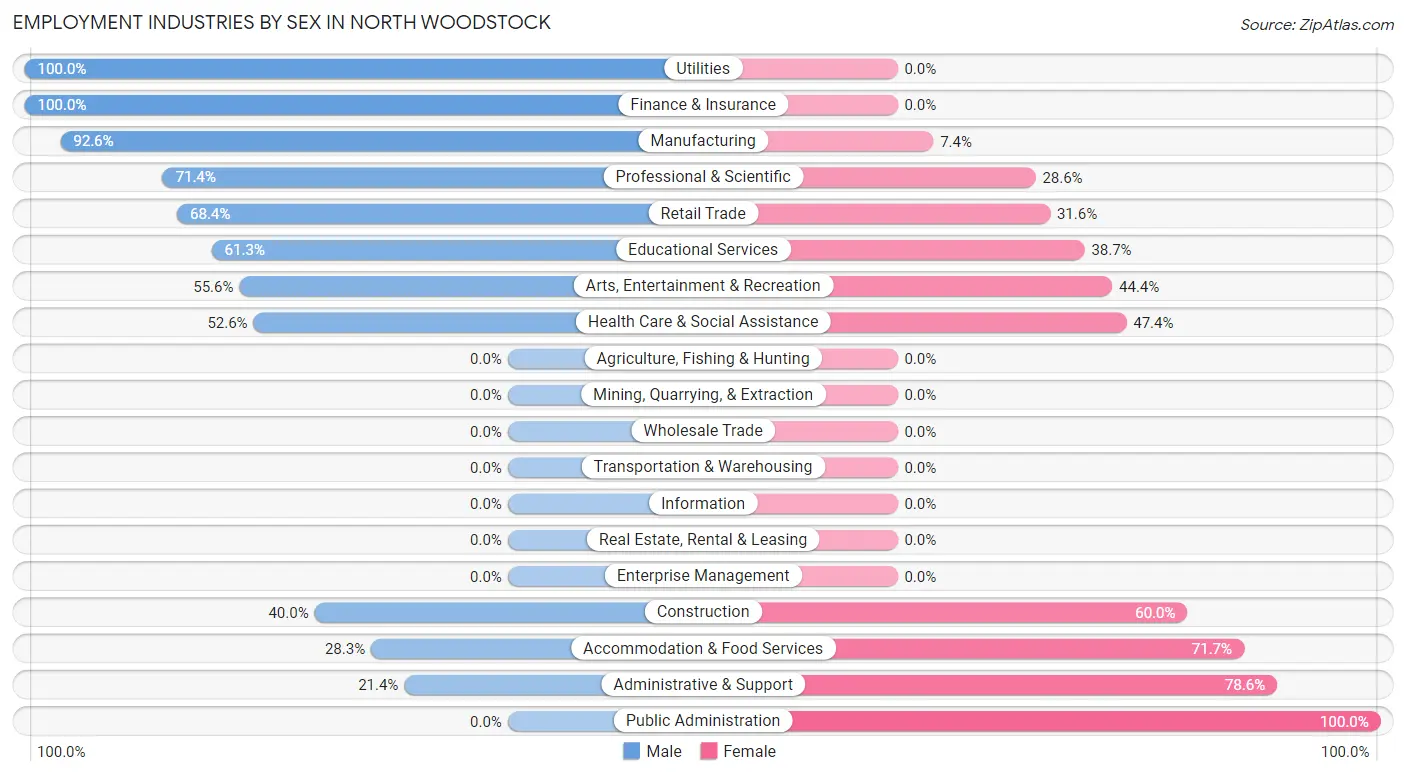
Employment Industries by Sex in North Woodstock
The North Woodstock industries that see more men than women are Utilities (100.0%), Finance & Insurance (100.0%), and Manufacturing (92.6%), whereas the industries that tend to have a higher number of women are Public Administration (100.0%), Administrative & Support (78.6%), and Accommodation & Food Services (71.7%).
| Industry | Male | Female |
| Agriculture, Fishing & Hunting | 0 (0.0%) | 0 (0.0%) |
| Mining, Quarrying, & Extraction | 0 (0.0%) | 0 (0.0%) |
| Construction | 2 (40.0%) | 3 (60.0%) |
| Manufacturing | 25 (92.6%) | 2 (7.4%) |
| Wholesale Trade | 0 (0.0%) | 0 (0.0%) |
| Retail Trade | 13 (68.4%) | 6 (31.6%) |
| Transportation & Warehousing | 0 (0.0%) | 0 (0.0%) |
| Utilities | 23 (100.0%) | 0 (0.0%) |
| Information | 0 (0.0%) | 0 (0.0%) |
| Finance & Insurance | 4 (100.0%) | 0 (0.0%) |
| Real Estate, Rental & Leasing | 0 (0.0%) | 0 (0.0%) |
| Professional & Scientific | 25 (71.4%) | 10 (28.6%) |
| Enterprise Management | 0 (0.0%) | 0 (0.0%) |
| Administrative & Support | 6 (21.4%) | 22 (78.6%) |
| Educational Services | 19 (61.3%) | 12 (38.7%) |
| Health Care & Social Assistance | 10 (52.6%) | 9 (47.4%) |
| Arts, Entertainment & Recreation | 5 (55.6%) | 4 (44.4%) |
| Accommodation & Food Services | 15 (28.3%) | 38 (71.7%) |
| Public Administration | 0 (0.0%) | 8 (100.0%) |
| Total | 161 (57.1%) | 121 (42.9%) |
Education in North Woodstock
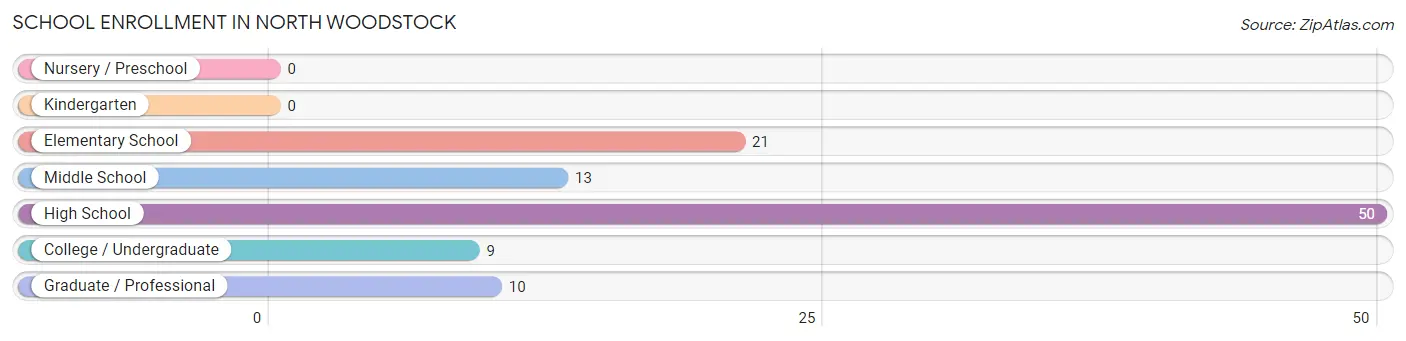
School Enrollment in North Woodstock
The most common levels of schooling among the 103 students in North Woodstock are high school (50 | 48.5%), elementary school (21 | 20.4%), and middle school (13 | 12.6%).
| School Level | # Students | % Students |
| Nursery / Preschool | 0 | 0.0% |
| Kindergarten | 0 | 0.0% |
| Elementary School | 21 | 20.4% |
| Middle School | 13 | 12.6% |
| High School | 50 | 48.5% |
| College / Undergraduate | 9 | 8.7% |
| Graduate / Professional | 10 | 9.7% |
| Total | 103 | 100.0% |
School Enrollment by Age by Funding Source in North Woodstock
Out of a total of 103 students who are enrolled in schools in North Woodstock, 10 (9.7%) attend a private institution, while the remaining 93 (90.3%) are enrolled in public schools. The age group of 35 years and over has the highest likelihood of being enrolled in private schools, with 10 (52.6% in the age bracket) enrolled. Conversely, the age group of 5 to 9 year old has the lowest likelihood of being enrolled in a private school, with 21 (100.0% in the age bracket) attending a public institution.
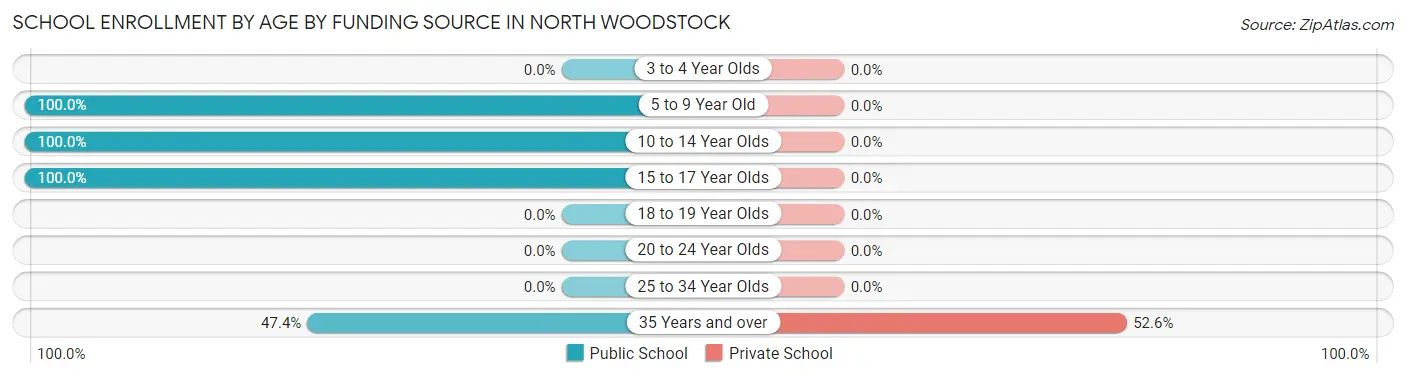
| Age Bracket | Public School | Private School |
| 3 to 4 Year Olds | 0 (0.0%) | 0 (0.0%) |
| 5 to 9 Year Old | 21 (100.0%) | 0 (0.0%) |
| 10 to 14 Year Olds | 24 (100.0%) | 0 (0.0%) |
| 15 to 17 Year Olds | 39 (100.0%) | 0 (0.0%) |
| 18 to 19 Year Olds | 0 (0.0%) | 0 (0.0%) |
| 20 to 24 Year Olds | 0 (0.0%) | 0 (0.0%) |
| 25 to 34 Year Olds | 0 (0.0%) | 0 (0.0%) |
| 35 Years and over | 9 (47.4%) | 10 (52.6%) |
| Total | 93 (90.3%) | 10 (9.7%) |
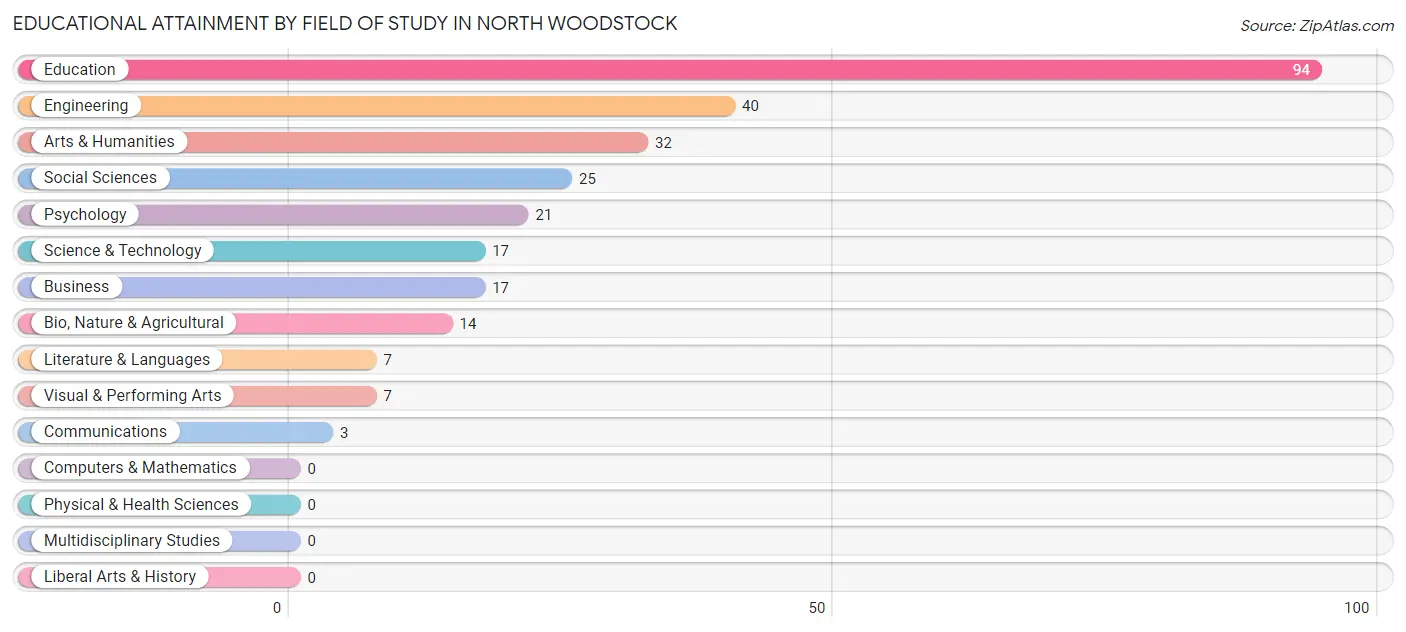
Educational Attainment by Field of Study in North Woodstock
Education (94 | 33.9%), engineering (40 | 14.4%), arts & humanities (32 | 11.6%), social sciences (25 | 9.0%), and psychology (21 | 7.6%) are the most common fields of study among 277 individuals in North Woodstock who have obtained a bachelor's degree or higher.
| Field of Study | # Graduates | % Graduates |
| Computers & Mathematics | 0 | 0.0% |
| Bio, Nature & Agricultural | 14 | 5.1% |
| Physical & Health Sciences | 0 | 0.0% |
| Psychology | 21 | 7.6% |
| Social Sciences | 25 | 9.0% |
| Engineering | 40 | 14.4% |
| Multidisciplinary Studies | 0 | 0.0% |
| Science & Technology | 17 | 6.1% |
| Business | 17 | 6.1% |
| Education | 94 | 33.9% |
| Literature & Languages | 7 | 2.5% |
| Liberal Arts & History | 0 | 0.0% |
| Visual & Performing Arts | 7 | 2.5% |
| Communications | 3 | 1.1% |
| Arts & Humanities | 32 | 11.6% |
| Total | 277 | 100.0% |
Transportation & Commute in North Woodstock
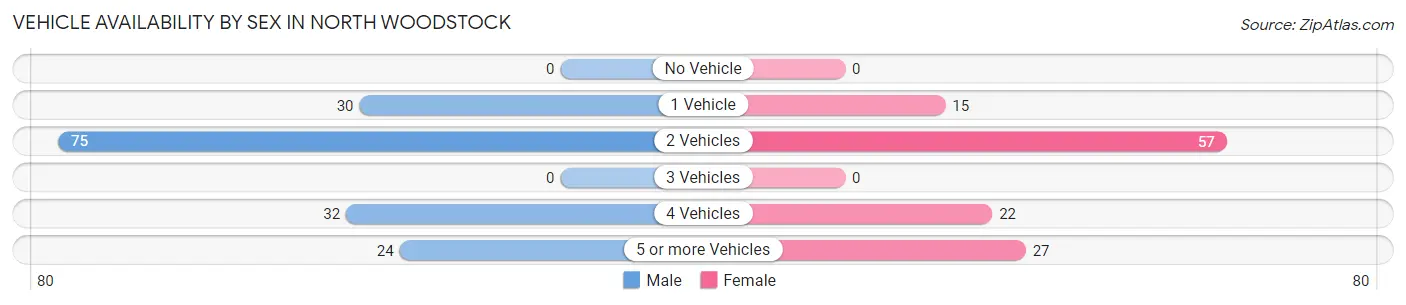
Vehicle Availability by Sex in North Woodstock
The most prevalent vehicle ownership categories in North Woodstock are males with 2 vehicles (75, accounting for 46.6%) and females with 2 vehicles (57, making up 62.0%).
| Vehicles Available | Male | Female |
| No Vehicle | 0 (0.0%) | 0 (0.0%) |
| 1 Vehicle | 30 (18.6%) | 15 (12.4%) |
| 2 Vehicles | 75 (46.6%) | 57 (47.1%) |
| 3 Vehicles | 0 (0.0%) | 0 (0.0%) |
| 4 Vehicles | 32 (19.9%) | 22 (18.2%) |
| 5 or more Vehicles | 24 (14.9%) | 27 (22.3%) |
| Total | 161 (100.0%) | 121 (100.0%) |
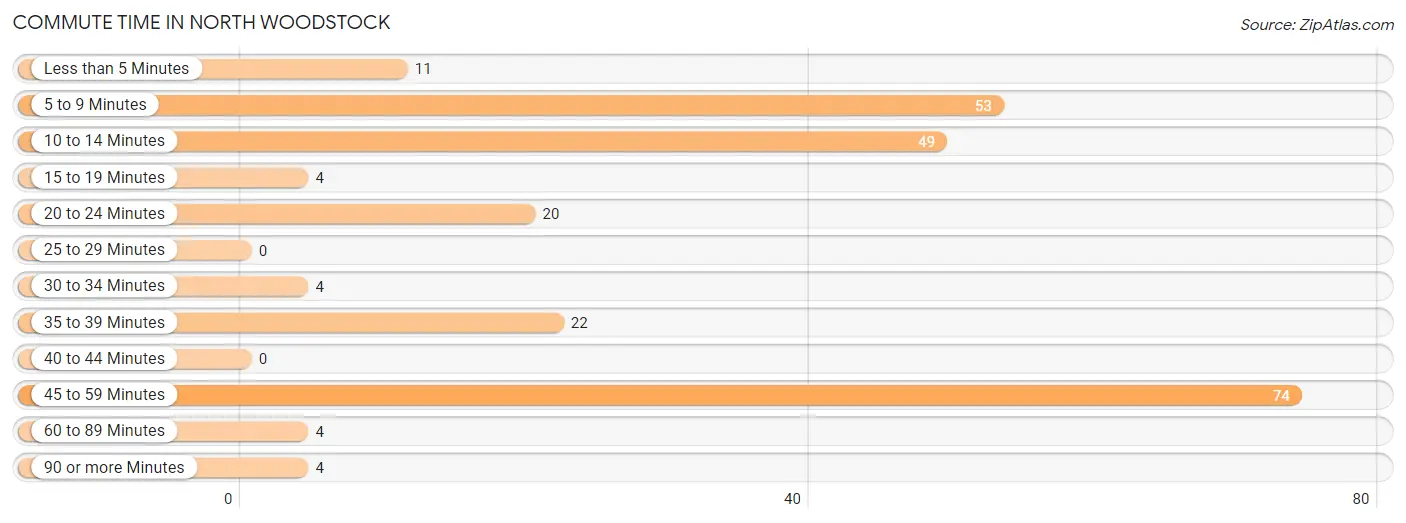
Commute Time in North Woodstock
The most frequently occuring commute durations in North Woodstock are 45 to 59 minutes (74 commuters, 30.2%), 5 to 9 minutes (53 commuters, 21.6%), and 10 to 14 minutes (49 commuters, 20.0%).
| Commute Time | # Commuters | % Commuters |
| Less than 5 Minutes | 11 | 4.5% |
| 5 to 9 Minutes | 53 | 21.6% |
| 10 to 14 Minutes | 49 | 20.0% |
| 15 to 19 Minutes | 4 | 1.6% |
| 20 to 24 Minutes | 20 | 8.2% |
| 25 to 29 Minutes | 0 | 0.0% |
| 30 to 34 Minutes | 4 | 1.6% |
| 35 to 39 Minutes | 22 | 9.0% |
| 40 to 44 Minutes | 0 | 0.0% |
| 45 to 59 Minutes | 74 | 30.2% |
| 60 to 89 Minutes | 4 | 1.6% |
| 90 or more Minutes | 4 | 1.6% |
Commute Time by Sex in North Woodstock
The most common commute times in North Woodstock are 45 to 59 minutes (47 commuters, 34.3%) for males and 5 to 9 minutes (31 commuters, 28.7%) for females.
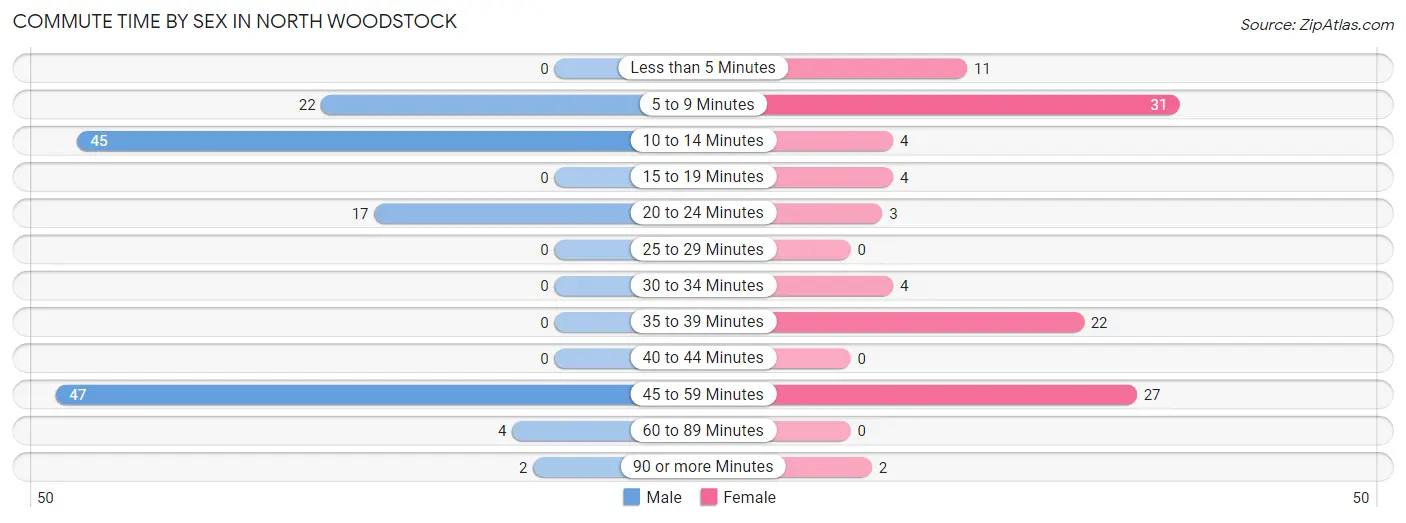
| Commute Time | Male | Female |
| Less than 5 Minutes | 0 (0.0%) | 11 (10.2%) |
| 5 to 9 Minutes | 22 (16.1%) | 31 (28.7%) |
| 10 to 14 Minutes | 45 (32.9%) | 4 (3.7%) |
| 15 to 19 Minutes | 0 (0.0%) | 4 (3.7%) |
| 20 to 24 Minutes | 17 (12.4%) | 3 (2.8%) |
| 25 to 29 Minutes | 0 (0.0%) | 0 (0.0%) |
| 30 to 34 Minutes | 0 (0.0%) | 4 (3.7%) |
| 35 to 39 Minutes | 0 (0.0%) | 22 (20.4%) |
| 40 to 44 Minutes | 0 (0.0%) | 0 (0.0%) |
| 45 to 59 Minutes | 47 (34.3%) | 27 (25.0%) |
| 60 to 89 Minutes | 4 (2.9%) | 0 (0.0%) |
| 90 or more Minutes | 2 (1.5%) | 2 (1.8%) |
Time of Departure to Work by Sex in North Woodstock
The most frequent times of departure to work in North Woodstock are 7:00 AM to 7:29 AM (35, 25.6%) for males and 6:30 AM to 6:59 AM (37, 34.3%) for females.
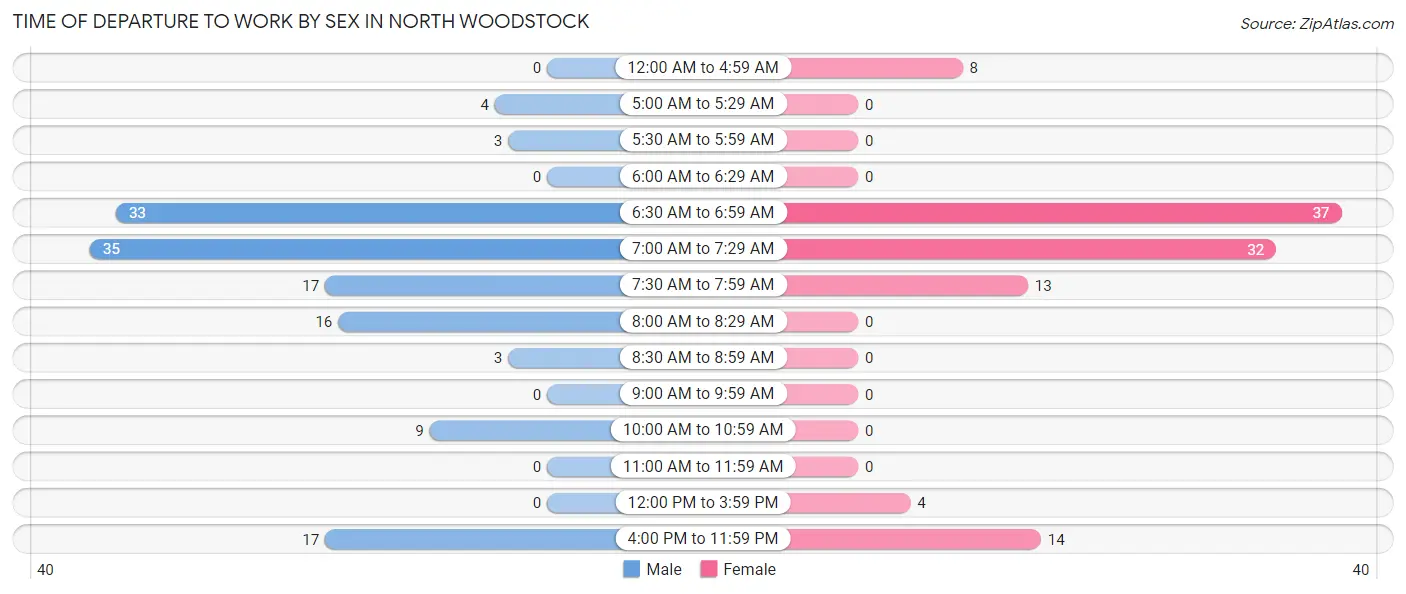
| Time of Departure | Male | Female |
| 12:00 AM to 4:59 AM | 0 (0.0%) | 8 (7.4%) |
| 5:00 AM to 5:29 AM | 4 (2.9%) | 0 (0.0%) |
| 5:30 AM to 5:59 AM | 3 (2.2%) | 0 (0.0%) |
| 6:00 AM to 6:29 AM | 0 (0.0%) | 0 (0.0%) |
| 6:30 AM to 6:59 AM | 33 (24.1%) | 37 (34.3%) |
| 7:00 AM to 7:29 AM | 35 (25.6%) | 32 (29.6%) |
| 7:30 AM to 7:59 AM | 17 (12.4%) | 13 (12.0%) |
| 8:00 AM to 8:29 AM | 16 (11.7%) | 0 (0.0%) |
| 8:30 AM to 8:59 AM | 3 (2.2%) | 0 (0.0%) |
| 9:00 AM to 9:59 AM | 0 (0.0%) | 0 (0.0%) |
| 10:00 AM to 10:59 AM | 9 (6.6%) | 0 (0.0%) |
| 11:00 AM to 11:59 AM | 0 (0.0%) | 0 (0.0%) |
| 12:00 PM to 3:59 PM | 0 (0.0%) | 4 (3.7%) |
| 4:00 PM to 11:59 PM | 17 (12.4%) | 14 (13.0%) |
| Total | 137 (100.0%) | 108 (100.0%) |
Housing Occupancy in North Woodstock
Occupancy by Ownership in North Woodstock
Of the total 240 dwellings in North Woodstock, owner-occupied units account for 179 (74.6%), while renter-occupied units make up 61 (25.4%).
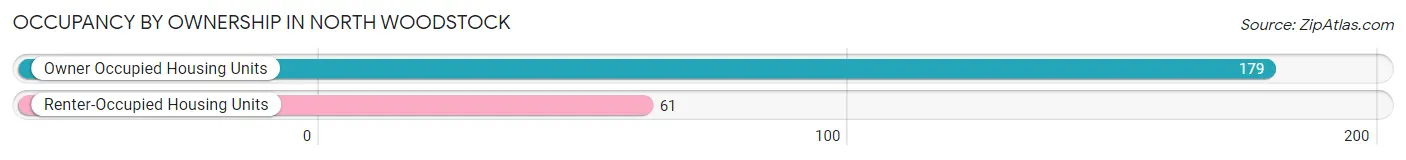
| Occupancy | # Housing Units | % Housing Units |
| Owner Occupied Housing Units | 179 | 74.6% |
| Renter-Occupied Housing Units | 61 | 25.4% |
| Total Occupied Housing Units | 240 | 100.0% |
Occupancy by Household Size in North Woodstock
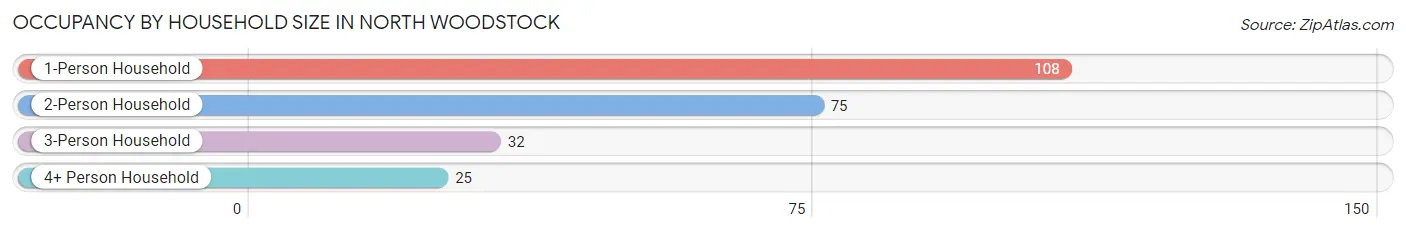
| Household Size | # Housing Units | % Housing Units |
| 1-Person Household | 108 | 45.0% |
| 2-Person Household | 75 | 31.2% |
| 3-Person Household | 32 | 13.3% |
| 4+ Person Household | 25 | 10.4% |
| Total Housing Units | 240 | 100.0% |
Occupancy by Ownership by Household Size in North Woodstock
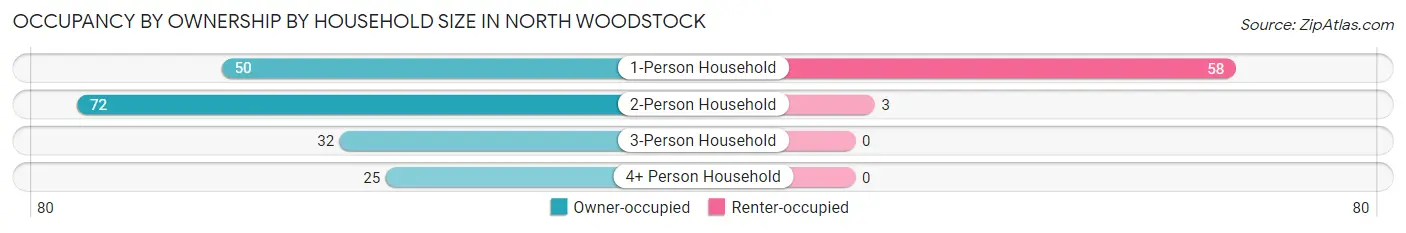
| Household Size | Owner-occupied | Renter-occupied |
| 1-Person Household | 50 (46.3%) | 58 (53.7%) |
| 2-Person Household | 72 (96.0%) | 3 (4.0%) |
| 3-Person Household | 32 (100.0%) | 0 (0.0%) |
| 4+ Person Household | 25 (100.0%) | 0 (0.0%) |
| Total Housing Units | 179 (74.6%) | 61 (25.4%) |
Occupancy by Educational Attainment in North Woodstock
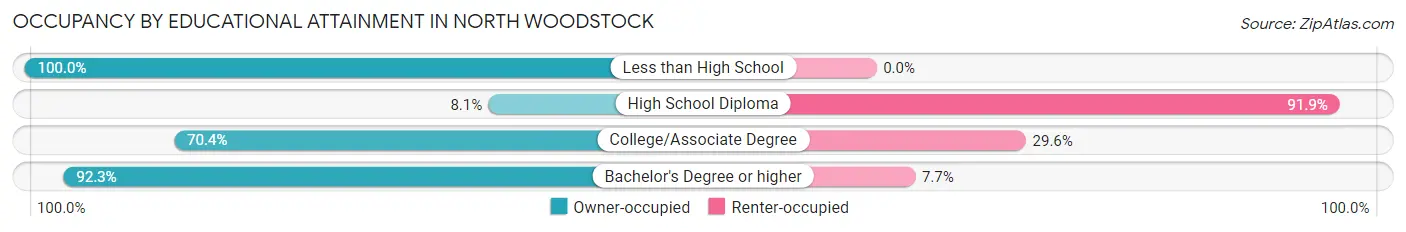
| Household Size | Owner-occupied | Renter-occupied |
| Less than High School | 6 (100.0%) | 0 (0.0%) |
| High School Diploma | 3 (8.1%) | 34 (91.9%) |
| College/Associate Degree | 38 (70.4%) | 16 (29.6%) |
| Bachelor's Degree or higher | 132 (92.3%) | 11 (7.7%) |
Occupancy by Age of Householder in North Woodstock
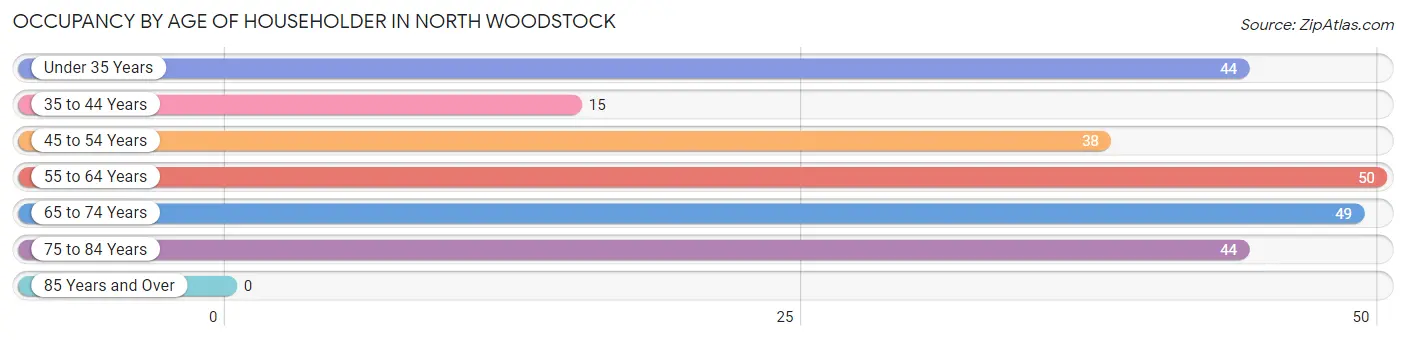
| Age Bracket | # Households | % Households |
| Under 35 Years | 44 | 18.3% |
| 35 to 44 Years | 15 | 6.2% |
| 45 to 54 Years | 38 | 15.8% |
| 55 to 64 Years | 50 | 20.8% |
| 65 to 74 Years | 49 | 20.4% |
| 75 to 84 Years | 44 | 18.3% |
| 85 Years and Over | 0 | 0.0% |
| Total | 240 | 100.0% |
Housing Finances in North Woodstock
Median Income by Occupancy in North Woodstock
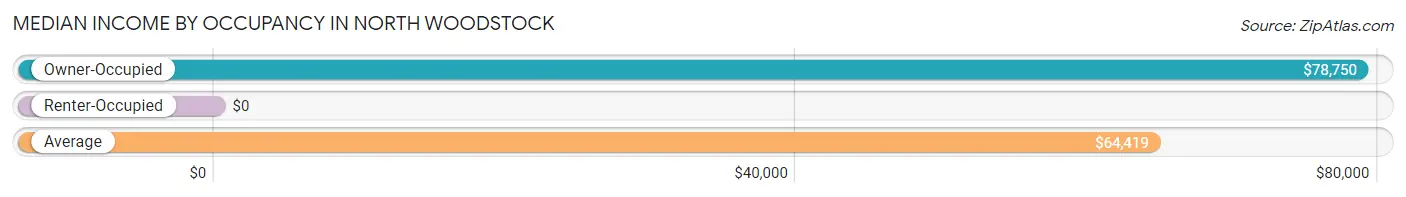
| Occupancy Type | # Households | Median Income |
| Owner-Occupied | 179 (74.6%) | $78,750 |
| Renter-Occupied | 61 (25.4%) | $0 |
| Average | 240 (100.0%) | $64,419 |
Occupancy by Householder Income Bracket in North Woodstock
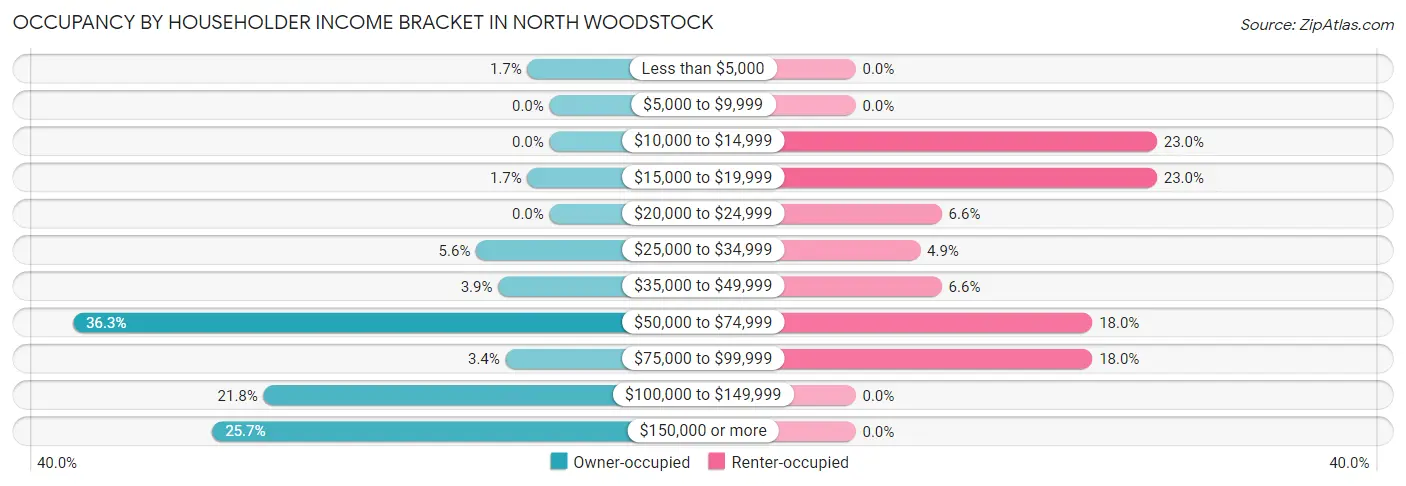
| Income Bracket | Owner-occupied | Renter-occupied |
| Less than $5,000 | 3 (1.7%) | 0 (0.0%) |
| $5,000 to $9,999 | 0 (0.0%) | 0 (0.0%) |
| $10,000 to $14,999 | 0 (0.0%) | 14 (23.0%) |
| $15,000 to $19,999 | 3 (1.7%) | 14 (23.0%) |
| $20,000 to $24,999 | 0 (0.0%) | 4 (6.6%) |
| $25,000 to $34,999 | 10 (5.6%) | 3 (4.9%) |
| $35,000 to $49,999 | 7 (3.9%) | 4 (6.6%) |
| $50,000 to $74,999 | 65 (36.3%) | 11 (18.0%) |
| $75,000 to $99,999 | 6 (3.4%) | 11 (18.0%) |
| $100,000 to $149,999 | 39 (21.8%) | 0 (0.0%) |
| $150,000 or more | 46 (25.7%) | 0 (0.0%) |
| Total | 179 (100.0%) | 61 (100.0%) |
Monthly Housing Cost Tiers in North Woodstock
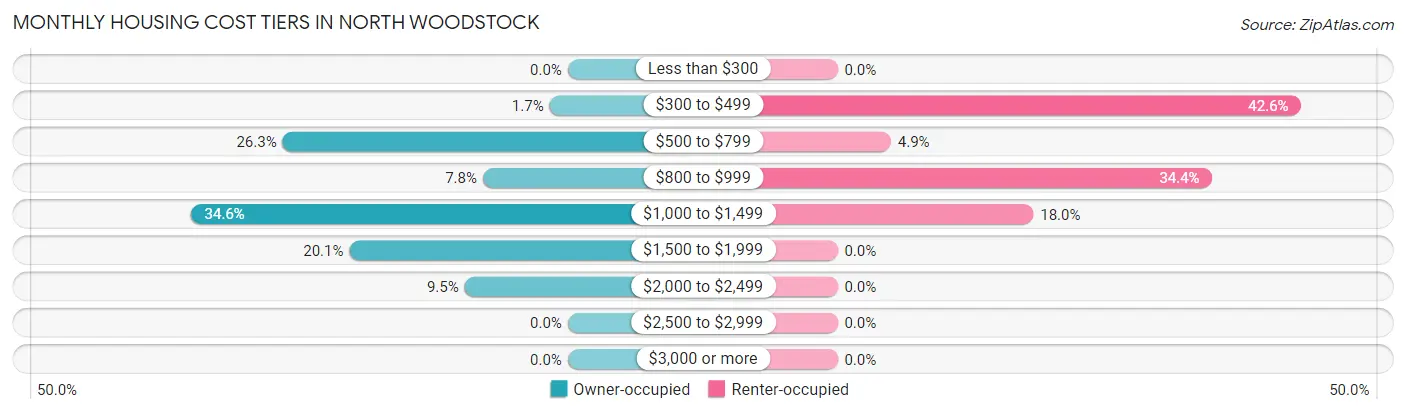
| Monthly Cost | Owner-occupied | Renter-occupied |
| Less than $300 | 0 (0.0%) | 0 (0.0%) |
| $300 to $499 | 3 (1.7%) | 26 (42.6%) |
| $500 to $799 | 47 (26.3%) | 3 (4.9%) |
| $800 to $999 | 14 (7.8%) | 21 (34.4%) |
| $1,000 to $1,499 | 62 (34.6%) | 11 (18.0%) |
| $1,500 to $1,999 | 36 (20.1%) | 0 (0.0%) |
| $2,000 to $2,499 | 17 (9.5%) | 0 (0.0%) |
| $2,500 to $2,999 | 0 (0.0%) | 0 (0.0%) |
| $3,000 or more | 0 (0.0%) | 0 (0.0%) |
| Total | 179 (100.0%) | 61 (100.0%) |
Physical Housing Characteristics in North Woodstock
Housing Structures in North Woodstock
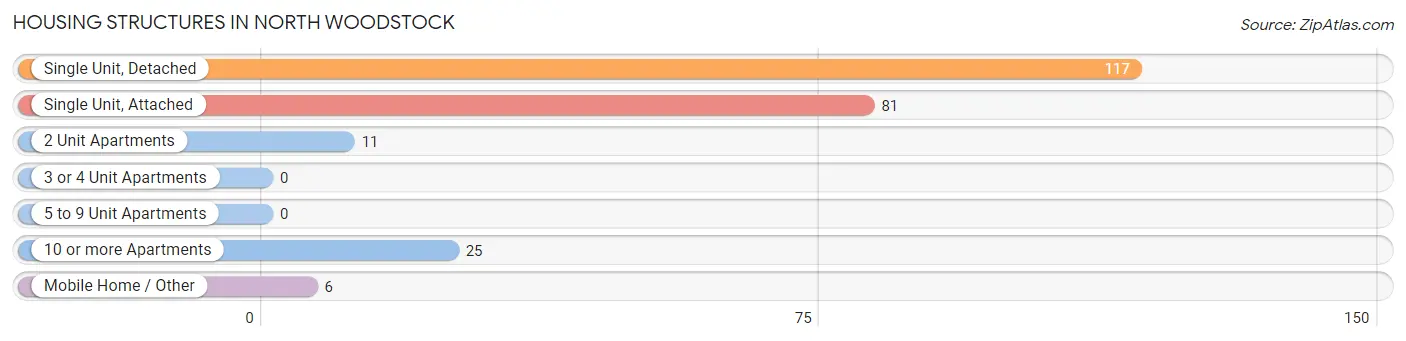
| Structure Type | # Housing Units | % Housing Units |
| Single Unit, Detached | 117 | 48.7% |
| Single Unit, Attached | 81 | 33.8% |
| 2 Unit Apartments | 11 | 4.6% |
| 3 or 4 Unit Apartments | 0 | 0.0% |
| 5 to 9 Unit Apartments | 0 | 0.0% |
| 10 or more Apartments | 25 | 10.4% |
| Mobile Home / Other | 6 | 2.5% |
| Total | 240 | 100.0% |
Housing Structures by Occupancy in North Woodstock
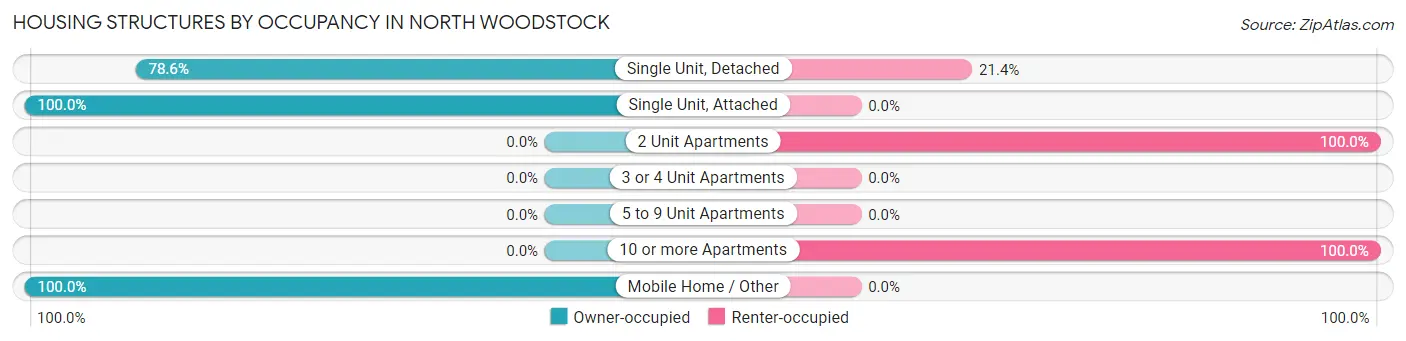
| Structure Type | Owner-occupied | Renter-occupied |
| Single Unit, Detached | 92 (78.6%) | 25 (21.4%) |
| Single Unit, Attached | 81 (100.0%) | 0 (0.0%) |
| 2 Unit Apartments | 0 (0.0%) | 11 (100.0%) |
| 3 or 4 Unit Apartments | 0 (0.0%) | 0 (0.0%) |
| 5 to 9 Unit Apartments | 0 (0.0%) | 0 (0.0%) |
| 10 or more Apartments | 0 (0.0%) | 25 (100.0%) |
| Mobile Home / Other | 6 (100.0%) | 0 (0.0%) |
| Total | 179 (74.6%) | 61 (25.4%) |
Housing Structures by Number of Rooms in North Woodstock
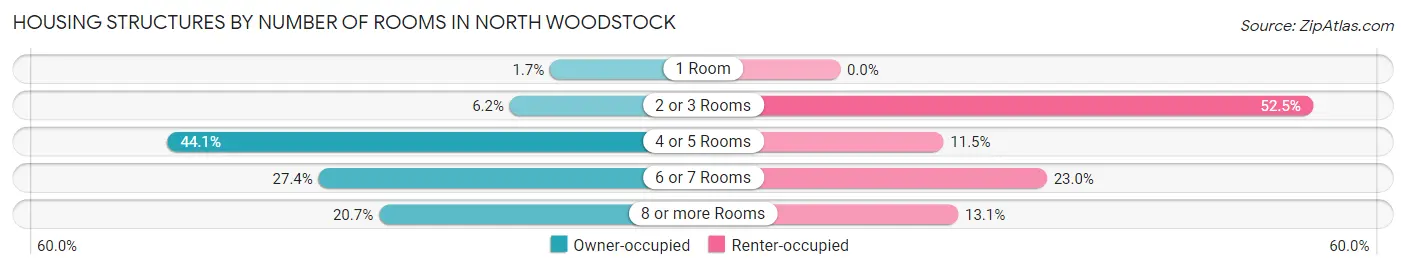
| Number of Rooms | Owner-occupied | Renter-occupied |
| 1 Room | 3 (1.7%) | 0 (0.0%) |
| 2 or 3 Rooms | 11 (6.1%) | 32 (52.5%) |
| 4 or 5 Rooms | 79 (44.1%) | 7 (11.5%) |
| 6 or 7 Rooms | 49 (27.4%) | 14 (23.0%) |
| 8 or more Rooms | 37 (20.7%) | 8 (13.1%) |
| Total | 179 (100.0%) | 61 (100.0%) |
Housing Structure by Heating Type in North Woodstock
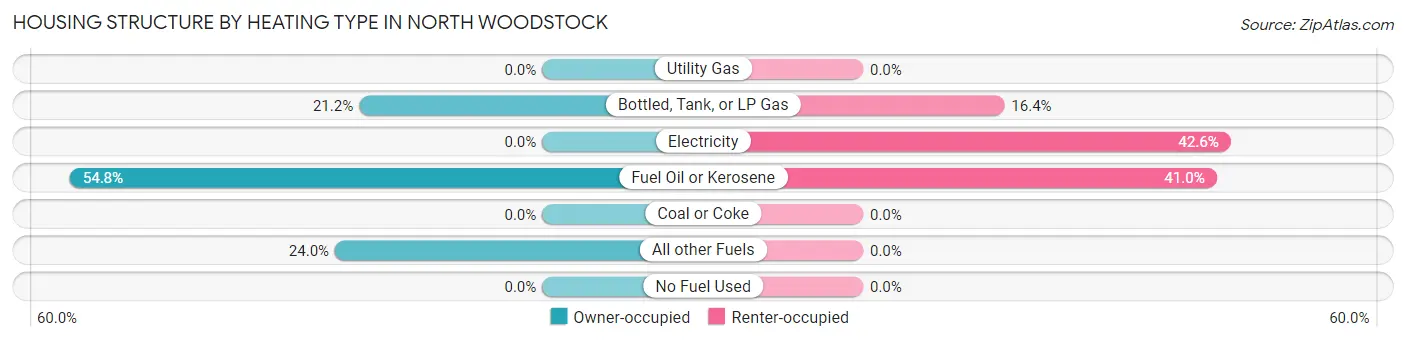
| Heating Type | Owner-occupied | Renter-occupied |
| Utility Gas | 0 (0.0%) | 0 (0.0%) |
| Bottled, Tank, or LP Gas | 38 (21.2%) | 10 (16.4%) |
| Electricity | 0 (0.0%) | 26 (42.6%) |
| Fuel Oil or Kerosene | 98 (54.7%) | 25 (41.0%) |
| Coal or Coke | 0 (0.0%) | 0 (0.0%) |
| All other Fuels | 43 (24.0%) | 0 (0.0%) |
| No Fuel Used | 0 (0.0%) | 0 (0.0%) |
| Total | 179 (100.0%) | 61 (100.0%) |
Household Vehicle Usage in North Woodstock
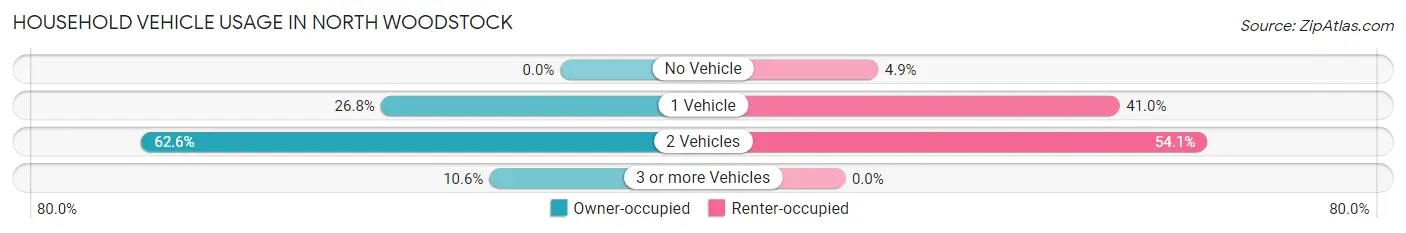
| Vehicles per Household | Owner-occupied | Renter-occupied |
| No Vehicle | 0 (0.0%) | 3 (4.9%) |
| 1 Vehicle | 48 (26.8%) | 25 (41.0%) |
| 2 Vehicles | 112 (62.6%) | 33 (54.1%) |
| 3 or more Vehicles | 19 (10.6%) | 0 (0.0%) |
| Total | 179 (100.0%) | 61 (100.0%) |
Real Estate & Mortgages in North Woodstock
Real Estate and Mortgage Overview in North Woodstock
| Characteristic | Without Mortgage | With Mortgage |
| Housing Units | 104 | 75 |
| Median Property Value | $310,300 | $268,800 |
| Median Household Income | $63,594 | $22 |
| Monthly Housing Costs | $850 | $0 |
| Real Estate Taxes | $4,720 | $0 |
Property Value by Mortgage Status in North Woodstock
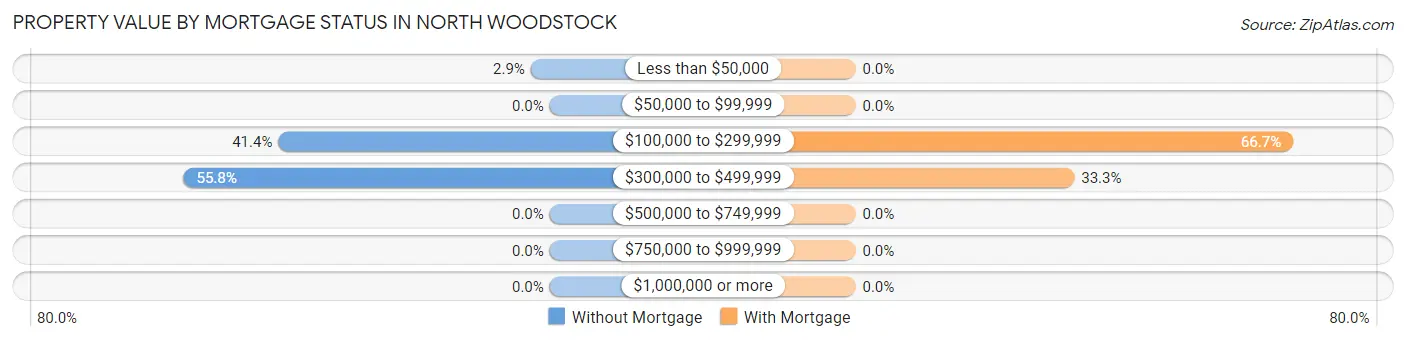
| Property Value | Without Mortgage | With Mortgage |
| Less than $50,000 | 3 (2.9%) | 0 (0.0%) |
| $50,000 to $99,999 | 0 (0.0%) | 0 (0.0%) |
| $100,000 to $299,999 | 43 (41.3%) | 50 (66.7%) |
| $300,000 to $499,999 | 58 (55.8%) | 25 (33.3%) |
| $500,000 to $749,999 | 0 (0.0%) | 0 (0.0%) |
| $750,000 to $999,999 | 0 (0.0%) | 0 (0.0%) |
| $1,000,000 or more | 0 (0.0%) | 0 (0.0%) |
| Total | 104 (100.0%) | 75 (100.0%) |
Household Income by Mortgage Status in North Woodstock
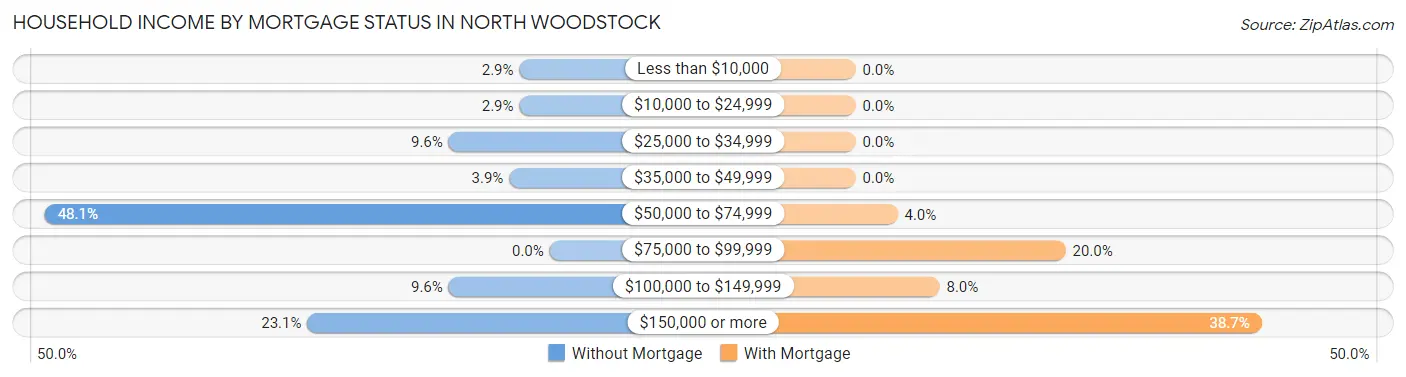
| Household Income | Without Mortgage | With Mortgage |
| Less than $10,000 | 3 (2.9%) | 0 (0.0%) |
| $10,000 to $24,999 | 3 (2.9%) | 0 (0.0%) |
| $25,000 to $34,999 | 10 (9.6%) | 0 (0.0%) |
| $35,000 to $49,999 | 4 (3.8%) | 0 (0.0%) |
| $50,000 to $74,999 | 50 (48.1%) | 3 (4.0%) |
| $75,000 to $99,999 | 0 (0.0%) | 15 (20.0%) |
| $100,000 to $149,999 | 10 (9.6%) | 6 (8.0%) |
| $150,000 or more | 24 (23.1%) | 29 (38.7%) |
| Total | 104 (100.0%) | 75 (100.0%) |
Property Value to Household Income Ratio in North Woodstock
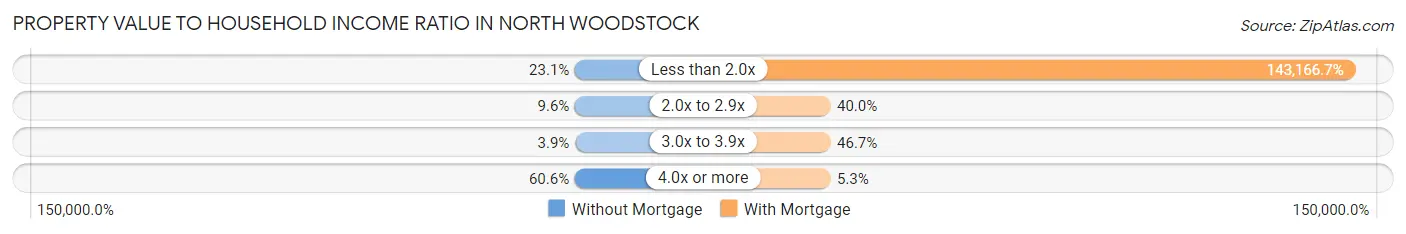
| Value-to-Income Ratio | Without Mortgage | With Mortgage |
| Less than 2.0x | 24 (23.1%) | 107,375 (143,166.7%) |
| 2.0x to 2.9x | 10 (9.6%) | 30 (40.0%) |
| 3.0x to 3.9x | 4 (3.8%) | 35 (46.7%) |
| 4.0x or more | 63 (60.6%) | 4 (5.3%) |
| Total | 104 (100.0%) | 75 (100.0%) |
Real Estate Taxes by Mortgage Status in North Woodstock
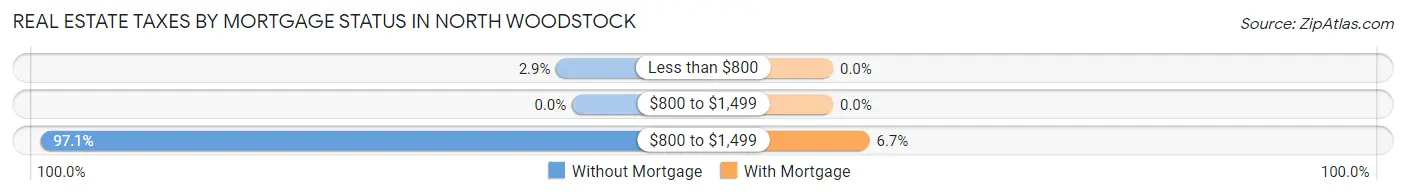
| Property Taxes | Without Mortgage | With Mortgage |
| Less than $800 | 3 (2.9%) | 0 (0.0%) |
| $800 to $1,499 | 0 (0.0%) | 0 (0.0%) |
| $800 to $1,499 | 101 (97.1%) | 5 (6.7%) |
| Total | 104 (100.0%) | 75 (100.0%) |
Health & Disability in North Woodstock
Health Insurance Coverage by Age in North Woodstock
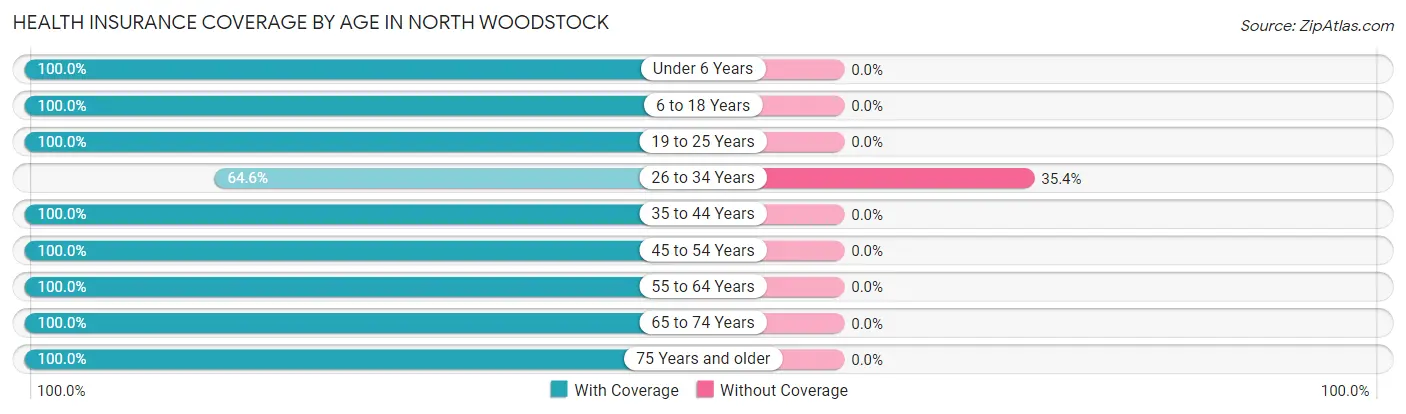
| Age Bracket | With Coverage | Without Coverage |
| Under 6 Years | 4 (100.0%) | 0 (0.0%) |
| 6 to 18 Years | 84 (100.0%) | 0 (0.0%) |
| 19 to 25 Years | 6 (100.0%) | 0 (0.0%) |
| 26 to 34 Years | 51 (64.6%) | 28 (35.4%) |
| 35 to 44 Years | 33 (100.0%) | 0 (0.0%) |
| 45 to 54 Years | 58 (100.0%) | 0 (0.0%) |
| 55 to 64 Years | 124 (100.0%) | 0 (0.0%) |
| 65 to 74 Years | 78 (100.0%) | 0 (0.0%) |
| 75 Years and older | 66 (100.0%) | 0 (0.0%) |
| Total | 504 (94.7%) | 28 (5.3%) |
Health Insurance Coverage by Citizenship Status in North Woodstock
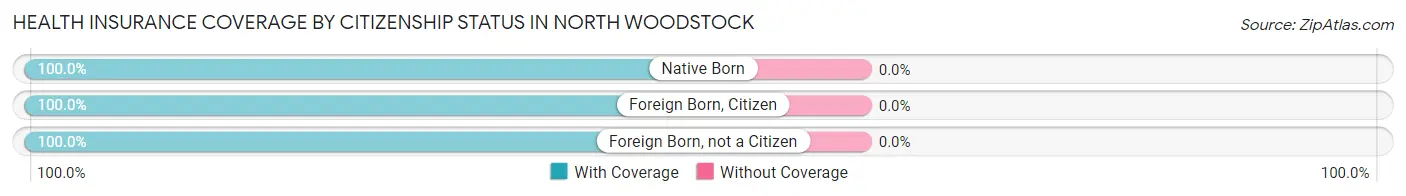
| Citizenship Status | With Coverage | Without Coverage |
| Native Born | 4 (100.0%) | 0 (0.0%) |
| Foreign Born, Citizen | 84 (100.0%) | 0 (0.0%) |
| Foreign Born, not a Citizen | 6 (100.0%) | 0 (0.0%) |
Health Insurance Coverage by Household Income in North Woodstock
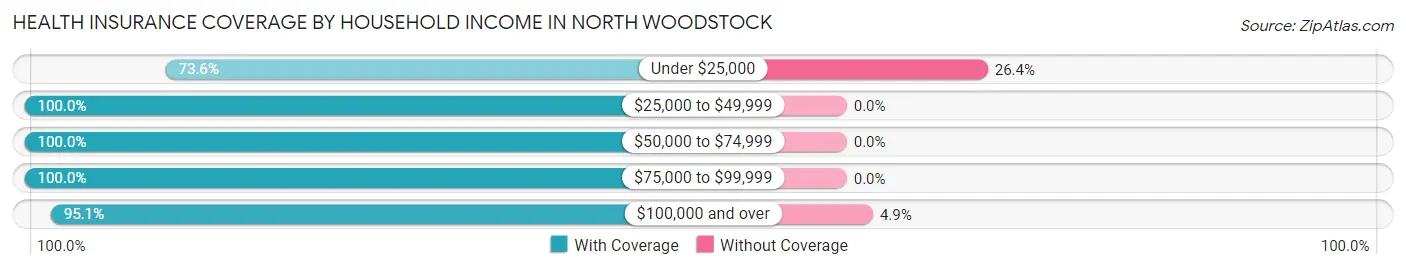
| Household Income | With Coverage | Without Coverage |
| Under $25,000 | 39 (73.6%) | 14 (26.4%) |
| $25,000 to $49,999 | 35 (100.0%) | 0 (0.0%) |
| $50,000 to $74,999 | 132 (100.0%) | 0 (0.0%) |
| $75,000 to $99,999 | 27 (100.0%) | 0 (0.0%) |
| $100,000 and over | 271 (95.1%) | 14 (4.9%) |
Public vs Private Health Insurance Coverage by Age in North Woodstock
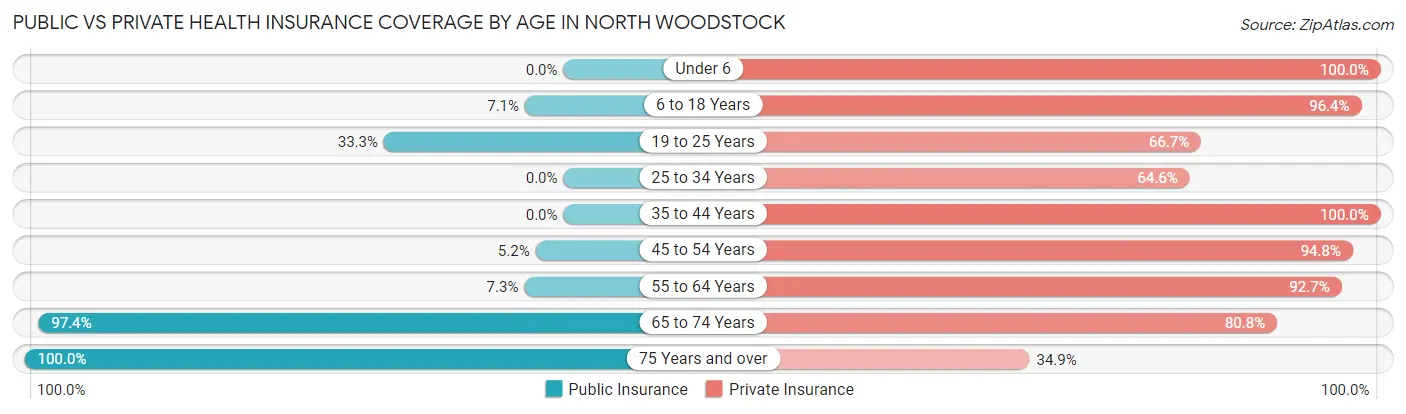
| Age Bracket | Public Insurance | Private Insurance |
| Under 6 | 0 (0.0%) | 4 (100.0%) |
| 6 to 18 Years | 6 (7.1%) | 81 (96.4%) |
| 19 to 25 Years | 2 (33.3%) | 4 (66.7%) |
| 25 to 34 Years | 0 (0.0%) | 51 (64.6%) |
| 35 to 44 Years | 0 (0.0%) | 33 (100.0%) |
| 45 to 54 Years | 3 (5.2%) | 55 (94.8%) |
| 55 to 64 Years | 9 (7.3%) | 115 (92.7%) |
| 65 to 74 Years | 76 (97.4%) | 63 (80.8%) |
| 75 Years and over | 66 (100.0%) | 23 (34.8%) |
| Total | 162 (30.4%) | 429 (80.6%) |
Disability Status by Sex by Age in North Woodstock
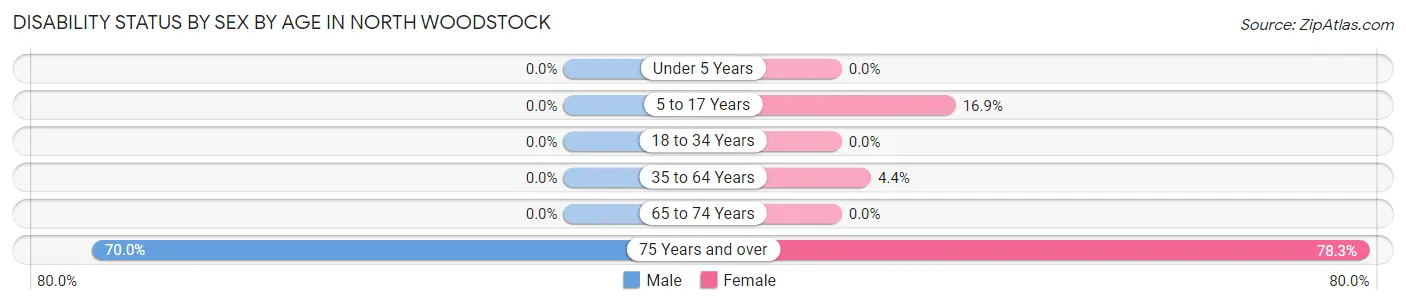
| Age Bracket | Male | Female |
| Under 5 Years | 0 (0.0%) | 0 (0.0%) |
| 5 to 17 Years | 0 (0.0%) | 11 (16.9%) |
| 18 to 34 Years | 0 (0.0%) | 0 (0.0%) |
| 35 to 64 Years | 0 (0.0%) | 4 (4.3%) |
| 65 to 74 Years | 0 (0.0%) | 0 (0.0%) |
| 75 Years and over | 14 (70.0%) | 36 (78.3%) |
Disability Class by Sex by Age in North Woodstock
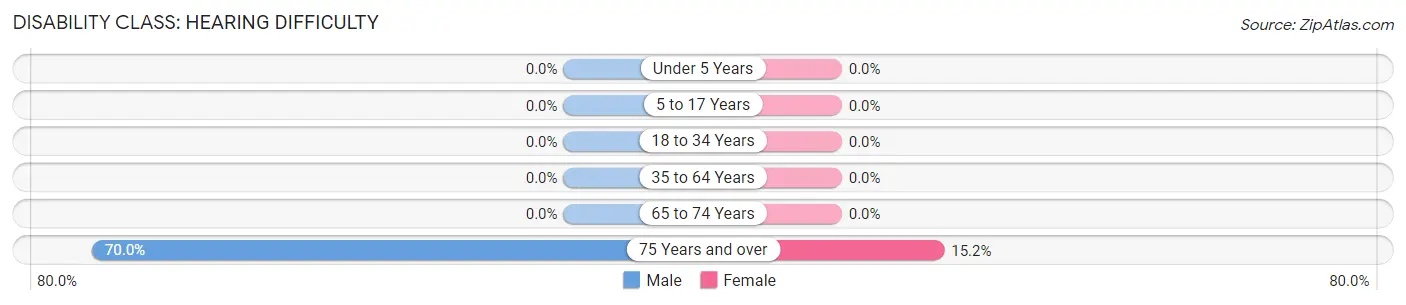
Disability Class: Hearing Difficulty
| Age Bracket | Male | Female |
| Under 5 Years | 0 (0.0%) | 0 (0.0%) |
| 5 to 17 Years | 0 (0.0%) | 0 (0.0%) |
| 18 to 34 Years | 0 (0.0%) | 0 (0.0%) |
| 35 to 64 Years | 0 (0.0%) | 0 (0.0%) |
| 65 to 74 Years | 0 (0.0%) | 0 (0.0%) |
| 75 Years and over | 14 (70.0%) | 7 (15.2%) |
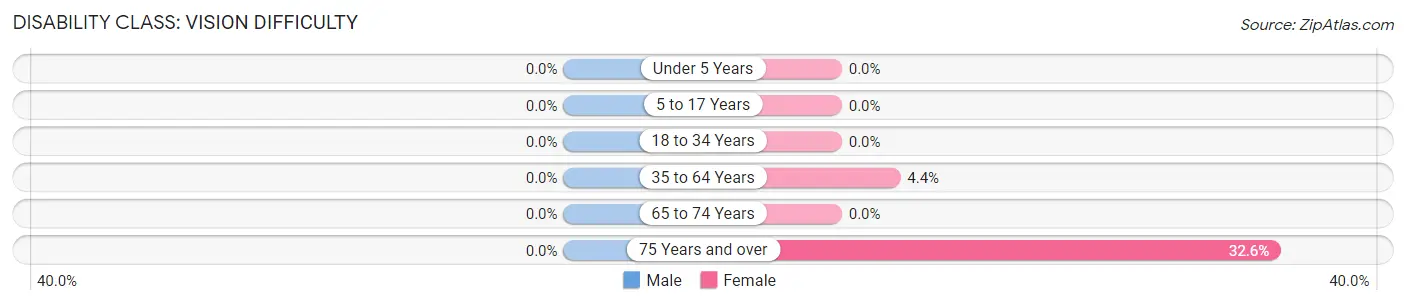
Disability Class: Vision Difficulty
| Age Bracket | Male | Female |
| Under 5 Years | 0 (0.0%) | 0 (0.0%) |
| 5 to 17 Years | 0 (0.0%) | 0 (0.0%) |
| 18 to 34 Years | 0 (0.0%) | 0 (0.0%) |
| 35 to 64 Years | 0 (0.0%) | 4 (4.3%) |
| 65 to 74 Years | 0 (0.0%) | 0 (0.0%) |
| 75 Years and over | 0 (0.0%) | 15 (32.6%) |
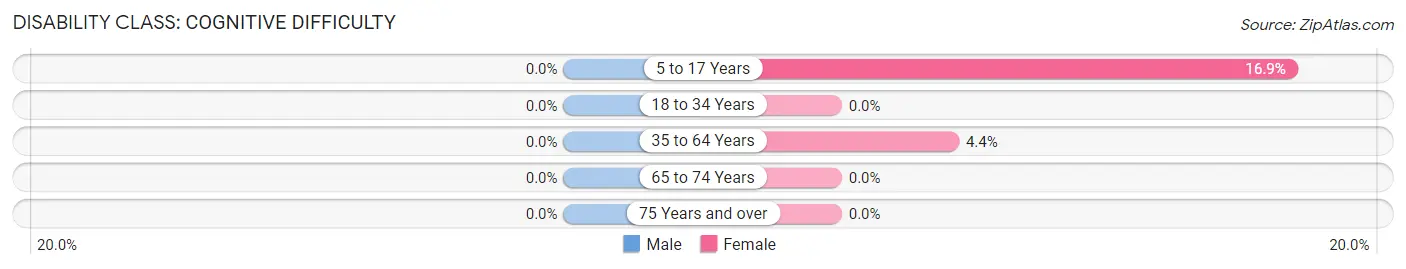
Disability Class: Cognitive Difficulty
| Age Bracket | Male | Female |
| 5 to 17 Years | 0 (0.0%) | 11 (16.9%) |
| 18 to 34 Years | 0 (0.0%) | 0 (0.0%) |
| 35 to 64 Years | 0 (0.0%) | 4 (4.3%) |
| 65 to 74 Years | 0 (0.0%) | 0 (0.0%) |
| 75 Years and over | 0 (0.0%) | 0 (0.0%) |
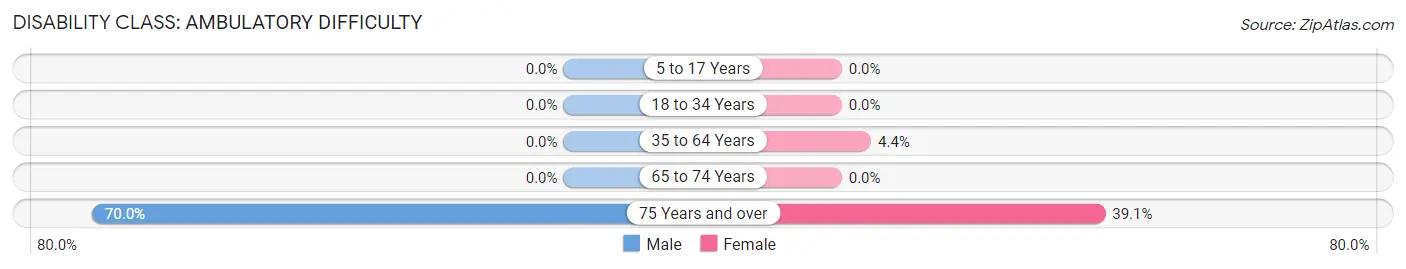
Disability Class: Ambulatory Difficulty
| Age Bracket | Male | Female |
| 5 to 17 Years | 0 (0.0%) | 0 (0.0%) |
| 18 to 34 Years | 0 (0.0%) | 0 (0.0%) |
| 35 to 64 Years | 0 (0.0%) | 4 (4.3%) |
| 65 to 74 Years | 0 (0.0%) | 0 (0.0%) |
| 75 Years and over | 14 (70.0%) | 18 (39.1%) |
Disability Class: Self-Care Difficulty
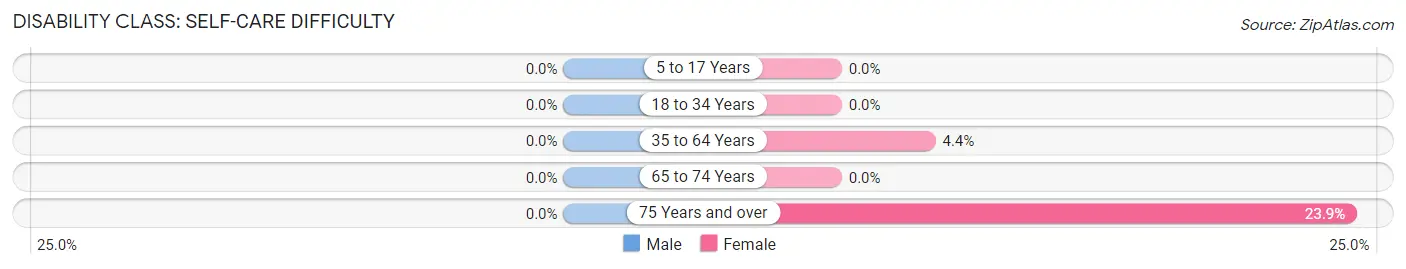
| Age Bracket | Male | Female |
| 5 to 17 Years | 0 (0.0%) | 0 (0.0%) |
| 18 to 34 Years | 0 (0.0%) | 0 (0.0%) |
| 35 to 64 Years | 0 (0.0%) | 4 (4.3%) |
| 65 to 74 Years | 0 (0.0%) | 0 (0.0%) |
| 75 Years and over | 0 (0.0%) | 11 (23.9%) |
Technology Access in North Woodstock
Computing Device Access in North Woodstock
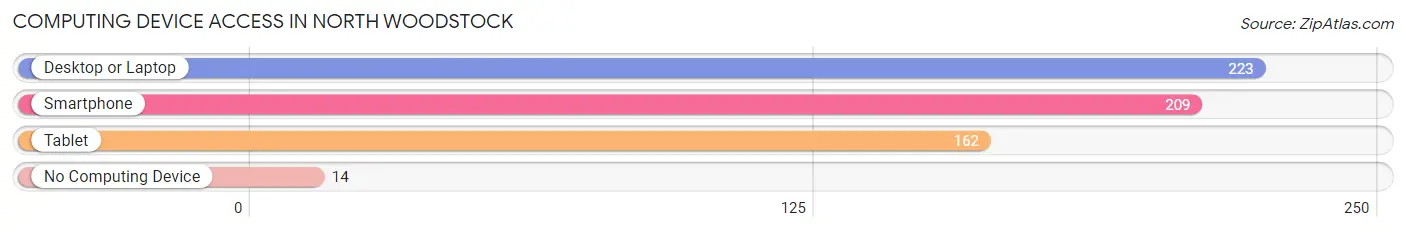
| Device Type | # Households | % Households |
| Desktop or Laptop | 223 | 92.9% |
| Smartphone | 209 | 87.1% |
| Tablet | 162 | 67.5% |
| No Computing Device | 14 | 5.8% |
| Total | 240 | 100.0% |
Internet Access in North Woodstock
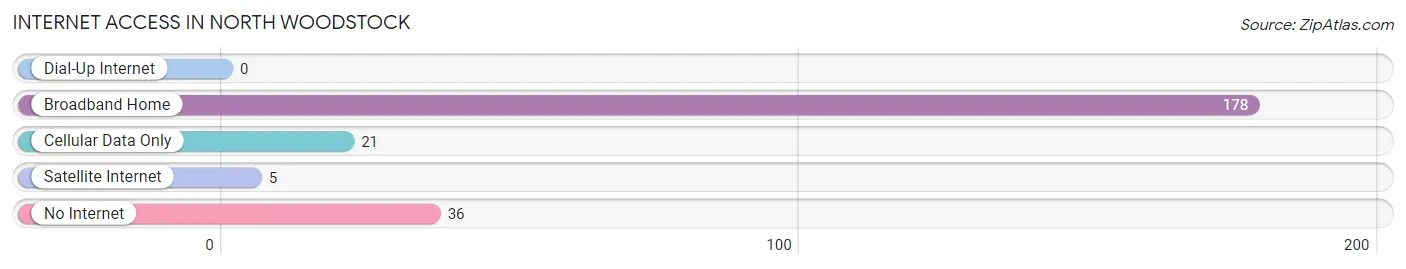
| Internet Type | # Households | % Households |
| Dial-Up Internet | 0 | 0.0% |
| Broadband Home | 178 | 74.2% |
| Cellular Data Only | 21 | 8.7% |
| Satellite Internet | 5 | 2.1% |
| No Internet | 36 | 15.0% |
| Total | 240 | 100.0% |
North Woodstock Summary
Woodstock, New Hampshire is a small town located in the White Mountains region of the state. It is situated in the western part of Grafton County, and is bordered by the towns of Lincoln, Thornton, and Campton. The town has a population of approximately 1,500 people, and is home to a variety of businesses, including a ski resort, a golf course, and a number of restaurants and shops.
History
Woodstock was first settled in 1764 by a group of settlers from Massachusetts. The town was originally known as “New Woodstock”, and was part of the town of Thornton until it was incorporated in 1773. The town was named after Woodstock, Connecticut, which was the hometown of many of the settlers.
The town was an important center of industry in the 19th century, with several mills and factories located in the area. The most important of these was the Woodstock Woolen Mill, which was established in 1845 and produced woolen goods for over a century. The mill was eventually closed in the 1950s, but the building still stands today and is listed on the National Register of Historic Places.
Geography
Woodstock is located in the White Mountains region of New Hampshire, and is situated in the western part of Grafton County. The town is bordered by the towns of Lincoln, Thornton, and Campton. The town is located in the Pemigewasset River Valley, and is surrounded by the White Mountain National Forest. The highest point in the town is the summit of Mount Moosilauke, which has an elevation of 4,802 feet.
The town has a total area of 33.2 square miles, of which 32.9 square miles is land and 0.3 square miles is water. The town is home to several bodies of water, including the Pemigewasset River, the Mad River, and the Baker River.
Economy
Woodstock’s economy is largely based on tourism, with a number of businesses catering to visitors to the area. The town is home to a ski resort, a golf course, and a variety of restaurants and shops. The town is also home to a number of small businesses, including a lumber mill, a sawmill, and a furniture factory.
Demographics
As of the 2010 census, Woodstock had a population of 1,521 people. The racial makeup of the town was 97.2% White, 0.7% African American, 0.3% Native American, 0.3% Asian, 0.2% from other races, and 1.5% from two or more races. Hispanic or Latino of any race were 0.7% of the population.
The median income for a household in the town was $45,000, and the median income for a family was $50,000. The per capita income for the town was $21,000. About 8.3% of families and 10.2% of the population were below the poverty line, including 11.3% of those under age 18 and 8.2% of those age 65 or over.
Common Questions
What is Per Capita Income in North Woodstock?
Per Capita income in North Woodstock is $62,304.
What is the Median Household income in North Woodstock?
Median Household Income in North Woodstock is $64,419.
What is Income or Wage Gap in North Woodstock?
Income or Wage Gap in North Woodstock is 64.8%.
Women in North Woodstock earn 35.2 cents for every dollar earned by a man.
What is Inequality or Gini Index in North Woodstock?
Inequality or Gini Index in North Woodstock is 0.50.
What is the Total Population of North Woodstock?
Total Population of North Woodstock is 532.
What is the Total Male Population of North Woodstock?
Total Male Population of North Woodstock is 247.
What is the Total Female Population of North Woodstock?
Total Female Population of North Woodstock is 285.
What is the Ratio of Males per 100 Females in North Woodstock?
There are 86.67 Males per 100 Females in North Woodstock.
What is the Ratio of Females per 100 Males in North Woodstock?
There are 115.38 Females per 100 Males in North Woodstock.
What is the Median Population Age in North Woodstock?
Median Population Age in North Woodstock is 55.4 Years.
What is the Average Family Size in North Woodstock
Average Family Size in North Woodstock is 3.0 People.
What is the Average Household Size in North Woodstock
Average Household Size in North Woodstock is 2.2 People.
How Large is the Labor Force in North Woodstock?
There are 290 People in the Labor Forcein in North Woodstock.
What is the Percentage of People in the Labor Force in North Woodstock?
63.2% of People are in the Labor Force in North Woodstock.
What is the Unemployment Rate in North Woodstock?
Unemployment Rate in North Woodstock is 2.8%.