West Swanzey, NH Map & Demographics
West Swanzey Map
West Swanzey Overview
$29,273
PER CAPITA INCOME
$65,071
AVG FAMILY INCOME
$57,762
AVG HOUSEHOLD INCOME
0.30
INEQUALITY / GINI INDEX
1,200
TOTAL POPULATION
506
MALE POPULATION
694
FEMALE POPULATION
72.91
MALES / 100 FEMALES
137.15
FEMALES / 100 MALES
38.5
MEDIAN AGE
2.7
AVG FAMILY SIZE
2.1
AVG HOUSEHOLD SIZE
534
LABOR FORCE [ PEOPLE ]
60.1%
PERCENT IN LABOR FORCE
5.4%
UNEMPLOYMENT RATE
West Swanzey Area Codes
Income in West Swanzey
Income Overview in West Swanzey
Per Capita Income in West Swanzey is $29,273, while median incomes of families and households are $65,071 and $57,762 respectively.
| Characteristic | Number | Measure |
| Per Capita Income | 1,200 | $29,273 |
| Median Family Income | 342 | $65,071 |
| Mean Family Income | 342 | $71,803 |
| Median Household Income | 565 | $57,762 |
| Mean Household Income | 565 | $62,669 |
| Income Deficit | 342 | $0 |
| Wage / Income Gap (%) | 1,200 | 0.00% |
| Wage / Income Gap ($) | 1,200 | 100.00¢ per $1 |
| Gini / Inequality Index | 1,200 | 0.30 |
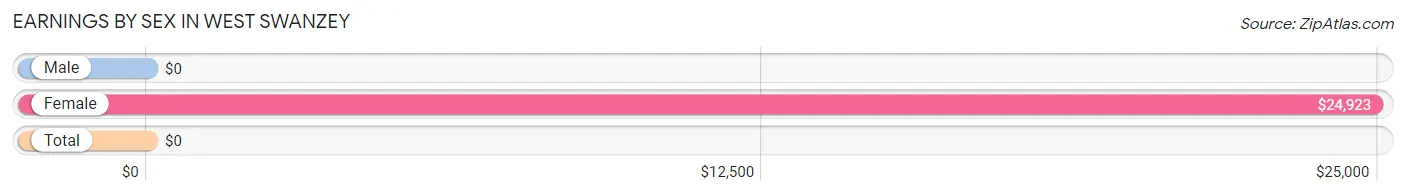
Earnings by Sex in West Swanzey
| Sex | Number | Average Earnings |
| Male | 295 (51.0%) | $0 |
| Female | 283 (49.0%) | $24,923 |
| Total | 578 (100.0%) | $0 |
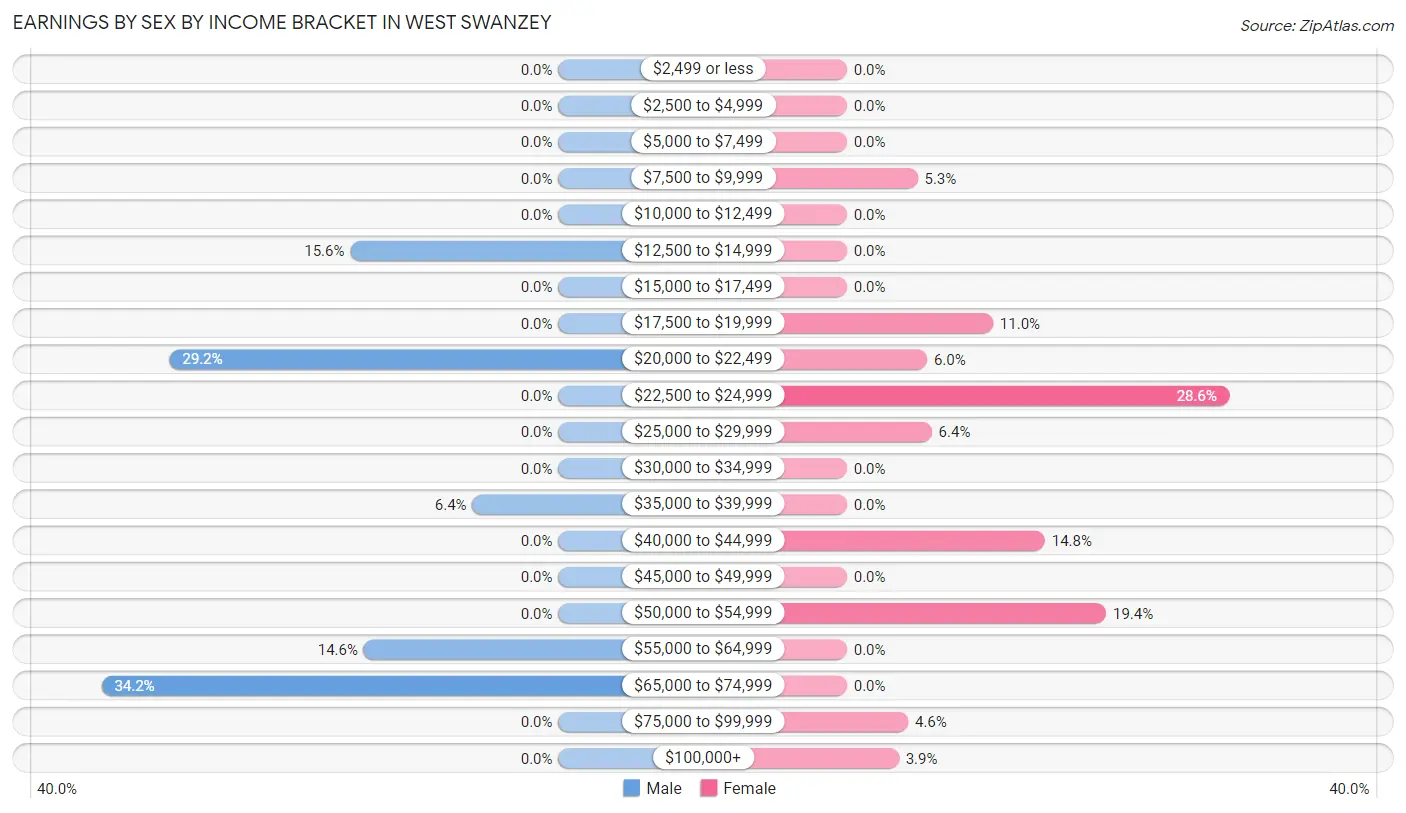
Earnings by Sex by Income Bracket in West Swanzey
The most common earnings brackets in West Swanzey are $65,000 to $74,999 for men (101 | 34.2%) and $22,500 to $24,999 for women (81 | 28.6%).
| Income | Male | Female |
| $2,499 or less | 0 (0.0%) | 0 (0.0%) |
| $2,500 to $4,999 | 0 (0.0%) | 0 (0.0%) |
| $5,000 to $7,499 | 0 (0.0%) | 0 (0.0%) |
| $7,500 to $9,999 | 0 (0.0%) | 15 (5.3%) |
| $10,000 to $12,499 | 0 (0.0%) | 0 (0.0%) |
| $12,500 to $14,999 | 46 (15.6%) | 0 (0.0%) |
| $15,000 to $17,499 | 0 (0.0%) | 0 (0.0%) |
| $17,500 to $19,999 | 0 (0.0%) | 31 (11.0%) |
| $20,000 to $22,499 | 86 (29.1%) | 17 (6.0%) |
| $22,500 to $24,999 | 0 (0.0%) | 81 (28.6%) |
| $25,000 to $29,999 | 0 (0.0%) | 18 (6.4%) |
| $30,000 to $34,999 | 0 (0.0%) | 0 (0.0%) |
| $35,000 to $39,999 | 19 (6.4%) | 0 (0.0%) |
| $40,000 to $44,999 | 0 (0.0%) | 42 (14.8%) |
| $45,000 to $49,999 | 0 (0.0%) | 0 (0.0%) |
| $50,000 to $54,999 | 0 (0.0%) | 55 (19.4%) |
| $55,000 to $64,999 | 43 (14.6%) | 0 (0.0%) |
| $65,000 to $74,999 | 101 (34.2%) | 0 (0.0%) |
| $75,000 to $99,999 | 0 (0.0%) | 13 (4.6%) |
| $100,000+ | 0 (0.0%) | 11 (3.9%) |
| Total | 295 (100.0%) | 283 (100.0%) |
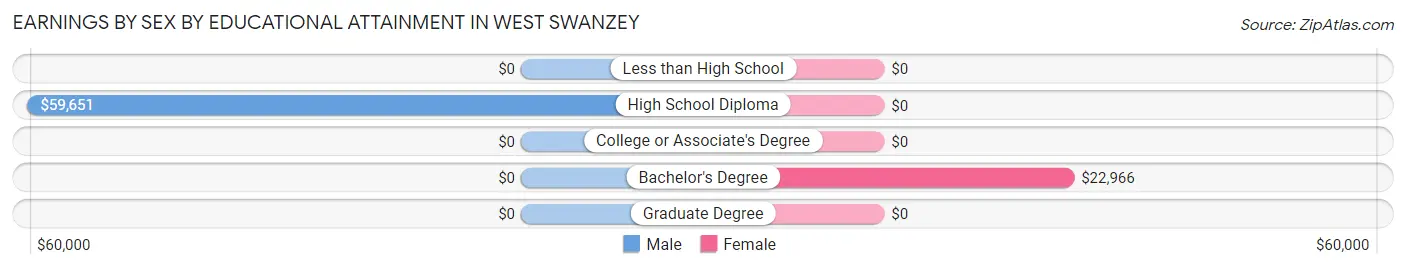
Earnings by Sex by Educational Attainment in West Swanzey
Average earnings in West Swanzey are $57,936 for men and $24,923 for women, a difference of 57.0%. Men with an educational attainment of high school diploma enjoy the highest average annual earnings of $59,651, while those with high school diploma education earn the least with $59,651. Women with an educational attainment of bachelor's degree earn the most with the average annual earnings of $22,966, while those with bachelor's degree education have the smallest earnings of $22,966.
| Educational Attainment | Male Income | Female Income |
| Less than High School | - | - |
| High School Diploma | $59,651 | $0 |
| College or Associate's Degree | - | - |
| Bachelor's Degree | - | - |
| Graduate Degree | - | - |
| Total | $57,936 | $24,923 |
Family Income in West Swanzey
Family Income Brackets in West Swanzey
According to the West Swanzey family income data, there are 110 families falling into the $35,000 to $49,999 income range, which is the most common income bracket and makes up 32.2% of all families.
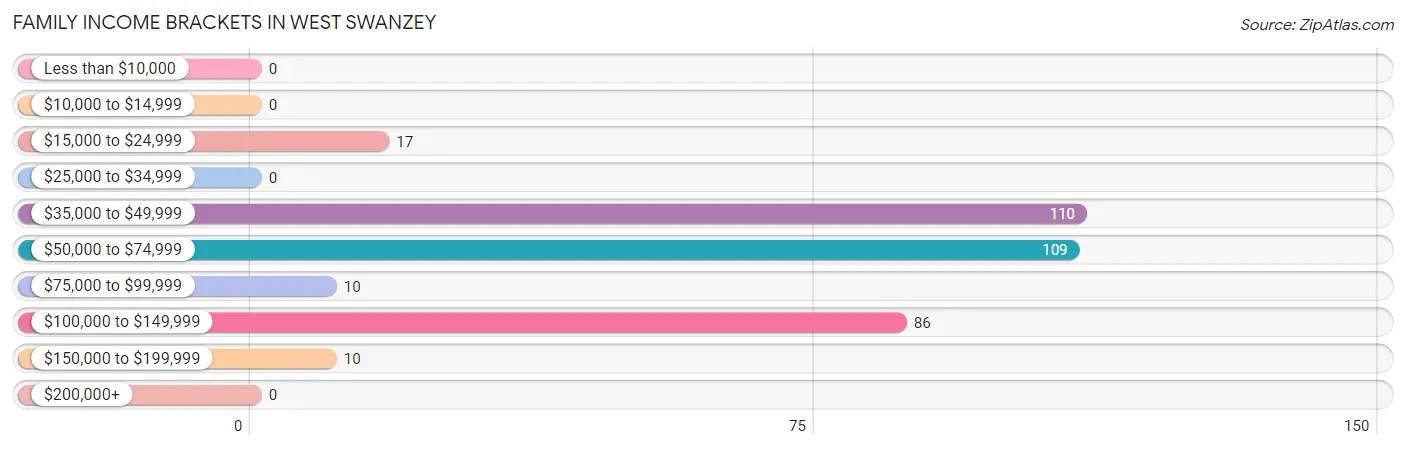
| Income Bracket | # Families | % Families |
| Less than $10,000 | 0 | 0.0% |
| $10,000 to $14,999 | 0 | 0.0% |
| $15,000 to $24,999 | 17 | 5.0% |
| $25,000 to $34,999 | 0 | 0.0% |
| $35,000 to $49,999 | 110 | 32.2% |
| $50,000 to $74,999 | 109 | 31.9% |
| $75,000 to $99,999 | 10 | 2.9% |
| $100,000 to $149,999 | 86 | 25.1% |
| $150,000 to $199,999 | 10 | 2.9% |
| $200,000+ | 0 | 0.0% |
Family Income by Famaliy Size in West Swanzey
2-person families (180 | 52.6%) account for the highest median family income in West Swanzey with $68,065 per family, while 2-person families (180 | 52.6%) have the highest median income of $34,032 per family member.
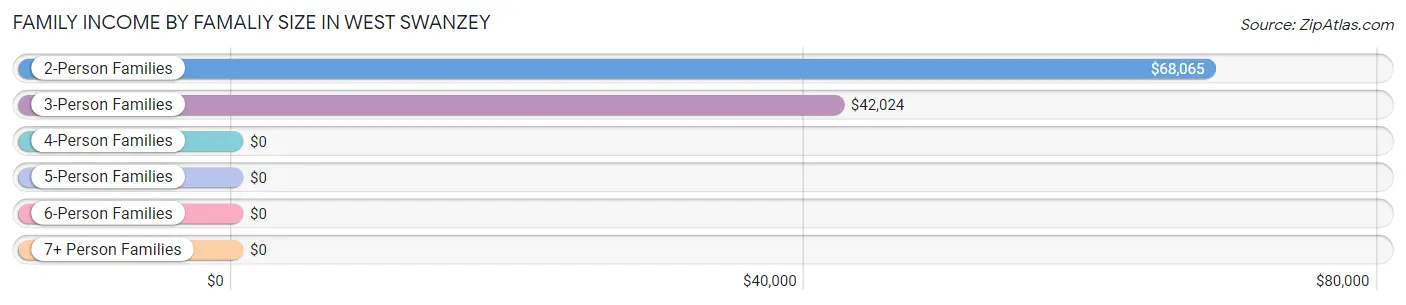
| Income Bracket | # Families | Median Income |
| 2-Person Families | 180 (52.6%) | $68,065 |
| 3-Person Families | 102 (29.8%) | $42,024 |
| 4-Person Families | 60 (17.5%) | $0 |
| 5-Person Families | 0 (0.0%) | $0 |
| 6-Person Families | 0 (0.0%) | $0 |
| 7+ Person Families | 0 (0.0%) | $0 |
| Total | 342 (100.0%) | $65,071 |
Family Income by Number of Earners in West Swanzey
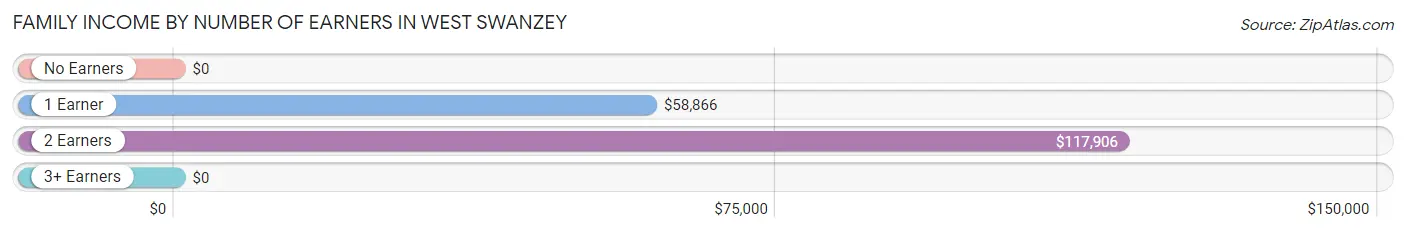
| Number of Earners | # Families | Median Income |
| No Earners | 28 (8.2%) | $0 |
| 1 Earner | 227 (66.4%) | $58,866 |
| 2 Earners | 87 (25.4%) | $117,906 |
| 3+ Earners | 0 (0.0%) | $0 |
| Total | 342 (100.0%) | $65,071 |
Household Income in West Swanzey
Household Income Brackets in West Swanzey
With 133 households falling in the category, the $50,000 to $74,999 income range is the most frequent in West Swanzey, accounting for 23.5% of all households.
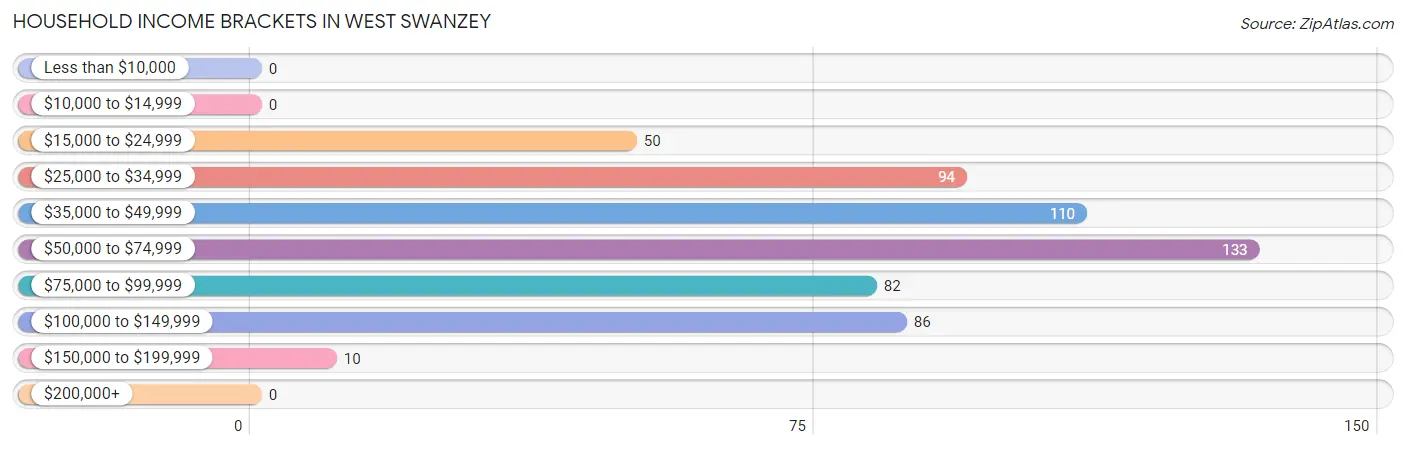
| Income Bracket | # Households | % Households |
| Less than $10,000 | 0 | 0.0% |
| $10,000 to $14,999 | 0 | 0.0% |
| $15,000 to $24,999 | 50 | 8.8% |
| $25,000 to $34,999 | 94 | 16.6% |
| $35,000 to $49,999 | 110 | 19.5% |
| $50,000 to $74,999 | 133 | 23.5% |
| $75,000 to $99,999 | 82 | 14.5% |
| $100,000 to $149,999 | 86 | 15.2% |
| $150,000 to $199,999 | 10 | 1.8% |
| $200,000+ | 0 | 0.0% |
Household Income by Householder Age in West Swanzey
The median household income in West Swanzey is $57,762, with the highest median household income of $90,148 found in the 25 to 44 years age bracket for the primary householder. A total of 211 households (37.3%) fall into this category.
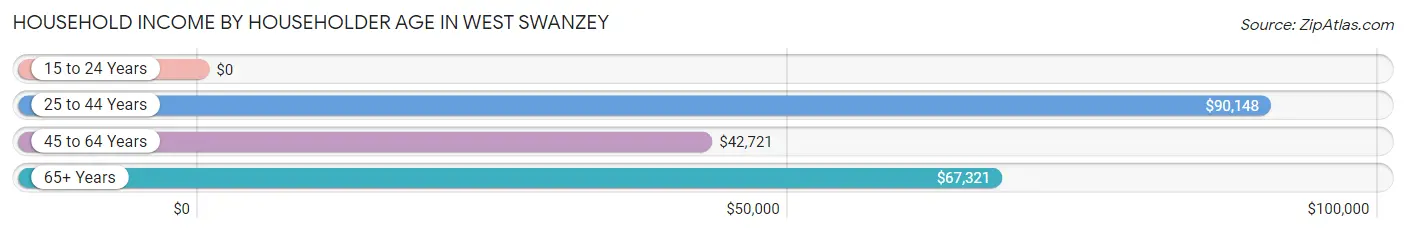
| Income Bracket | # Households | Median Income |
| 15 to 24 Years | 0 (0.0%) | $0 |
| 25 to 44 Years | 211 (37.3%) | $90,148 |
| 45 to 64 Years | 175 (31.0%) | $42,721 |
| 65+ Years | 179 (31.7%) | $67,321 |
| Total | 565 (100.0%) | $57,762 |
Poverty in West Swanzey
Income Below Poverty by Sex and Age in West Swanzey
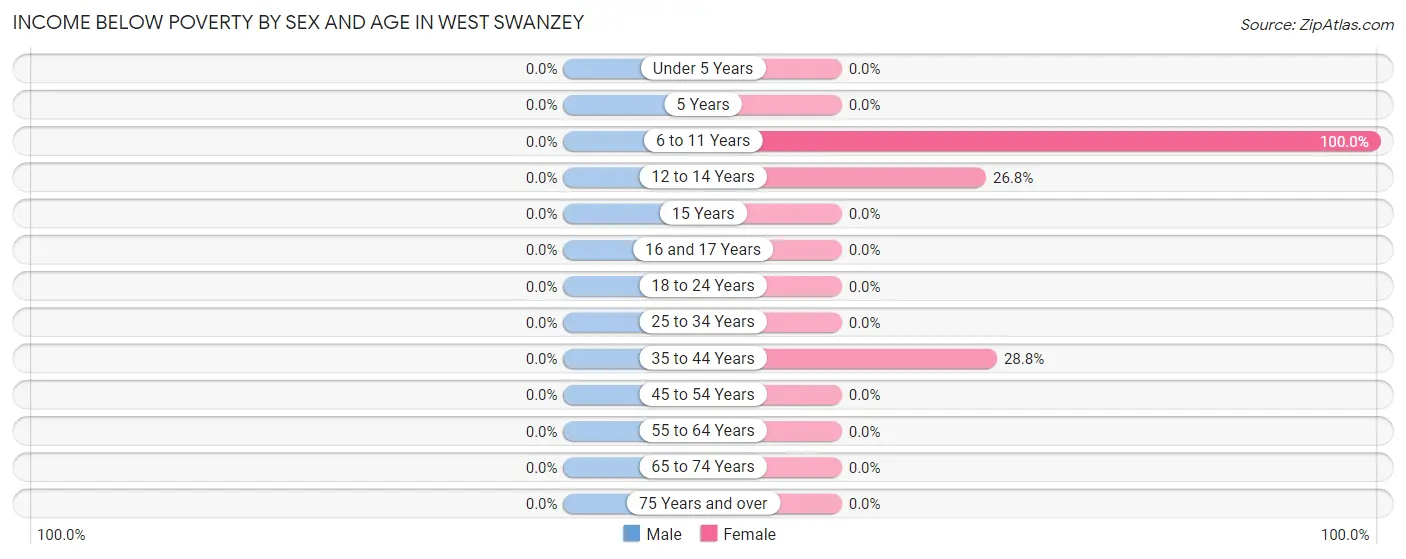
| Age Bracket | Male | Female |
| Under 5 Years | 0 (0.0%) | 0 (0.0%) |
| 5 Years | 0 (0.0%) | 0 (0.0%) |
| 6 to 11 Years | 0 (0.0%) | 15 (100.0%) |
| 12 to 14 Years | 0 (0.0%) | 15 (26.8%) |
| 15 Years | 0 (0.0%) | 0 (0.0%) |
| 16 and 17 Years | 0 (0.0%) | 0 (0.0%) |
| 18 to 24 Years | 0 (0.0%) | 0 (0.0%) |
| 25 to 34 Years | 0 (0.0%) | 0 (0.0%) |
| 35 to 44 Years | 0 (0.0%) | 17 (28.8%) |
| 45 to 54 Years | 0 (0.0%) | 0 (0.0%) |
| 55 to 64 Years | 0 (0.0%) | 0 (0.0%) |
| 65 to 74 Years | 0 (0.0%) | 0 (0.0%) |
| 75 Years and over | 0 (0.0%) | 0 (0.0%) |
| Total | 0 (0.0%) | 47 (6.8%) |
Income Above Poverty by Sex and Age in West Swanzey
According to the poverty statistics in West Swanzey, males aged under 5 years and females aged under 5 years are the age groups that are most secure financially, with 100.0% of males and 100.0% of females in these age groups living above the poverty line.
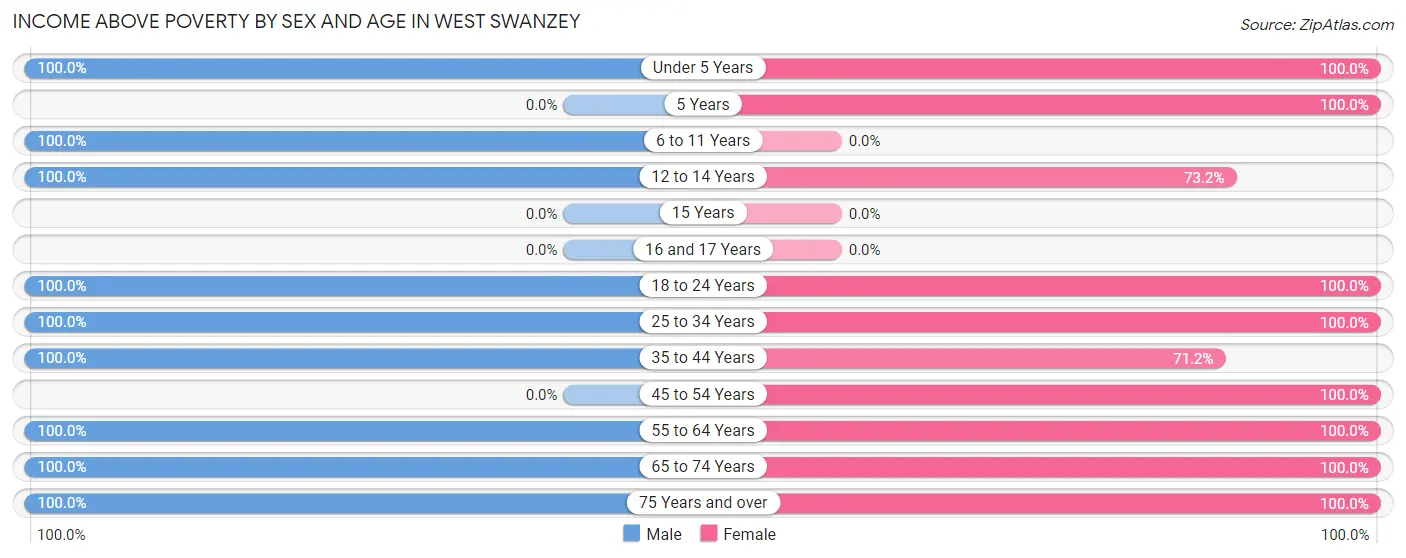
| Age Bracket | Male | Female |
| Under 5 Years | 49 (100.0%) | 78 (100.0%) |
| 5 Years | 0 (0.0%) | 40 (100.0%) |
| 6 to 11 Years | 38 (100.0%) | 0 (0.0%) |
| 12 to 14 Years | 35 (100.0%) | 41 (73.2%) |
| 15 Years | 0 (0.0%) | 0 (0.0%) |
| 16 and 17 Years | 0 (0.0%) | 0 (0.0%) |
| 18 to 24 Years | 22 (100.0%) | 29 (100.0%) |
| 25 to 34 Years | 101 (100.0%) | 114 (100.0%) |
| 35 to 44 Years | 43 (100.0%) | 42 (71.2%) |
| 45 to 54 Years | 0 (0.0%) | 61 (100.0%) |
| 55 to 64 Years | 86 (100.0%) | 95 (100.0%) |
| 65 to 74 Years | 64 (100.0%) | 74 (100.0%) |
| 75 Years and over | 68 (100.0%) | 73 (100.0%) |
| Total | 506 (100.0%) | 647 (93.2%) |
Income Below Poverty Among Married-Couple Families in West Swanzey
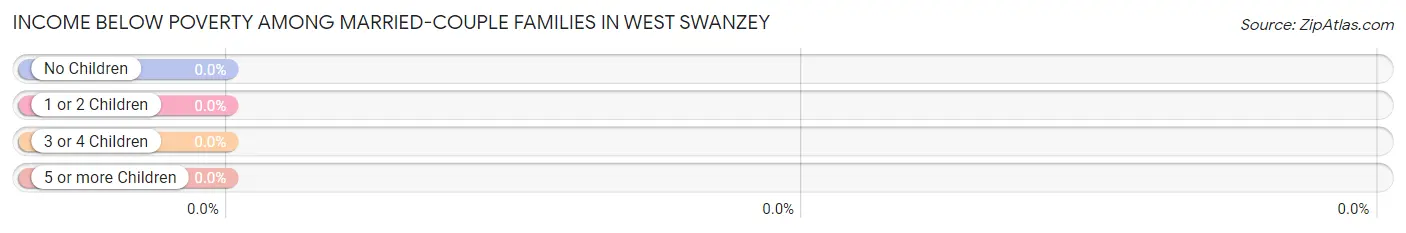
| Children | Above Poverty | Below Poverty |
| No Children | 180 (100.0%) | 0 (0.0%) |
| 1 or 2 Children | 40 (100.0%) | 0 (0.0%) |
| 3 or 4 Children | 0 (0.0%) | 0 (0.0%) |
| 5 or more Children | 0 (0.0%) | 0 (0.0%) |
| Total | 220 (100.0%) | 0 (0.0%) |
Income Below Poverty Among Single-Parent Households in West Swanzey
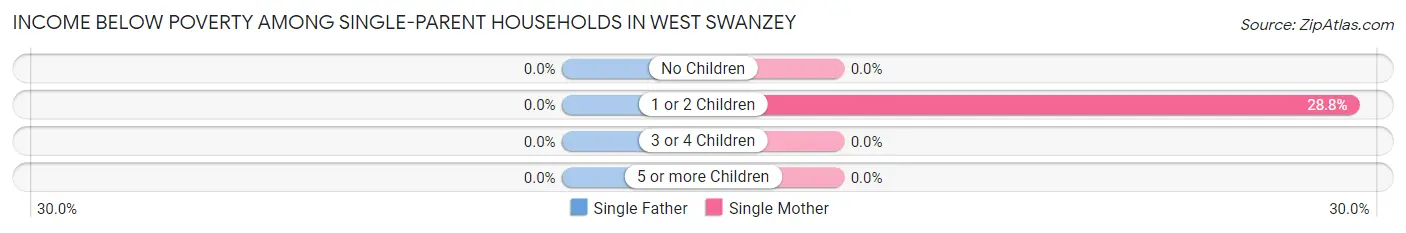
| Children | Single Father | Single Mother |
| No Children | 0 (0.0%) | 0 (0.0%) |
| 1 or 2 Children | 0 (0.0%) | 17 (28.8%) |
| 3 or 4 Children | 0 (0.0%) | 0 (0.0%) |
| 5 or more Children | 0 (0.0%) | 0 (0.0%) |
| Total | 0 (0.0%) | 17 (28.8%) |
Income Below Poverty Among Married-Couple vs Single-Parent Households in West Swanzey
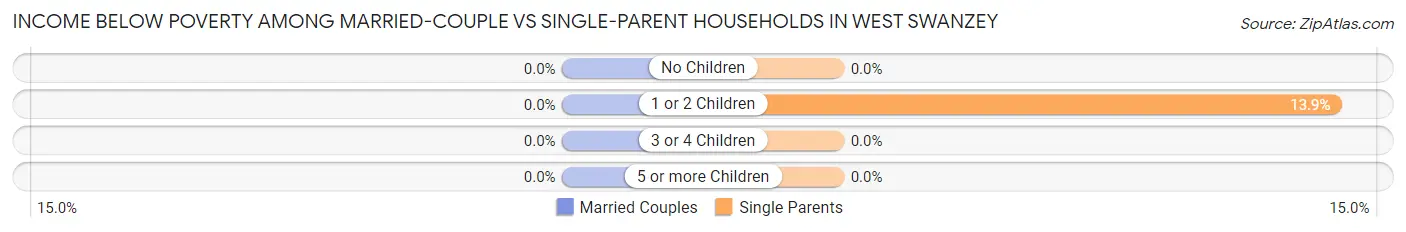
| Children | Married-Couple Families | Single-Parent Households |
| No Children | 0 (0.0%) | 0 (0.0%) |
| 1 or 2 Children | 0 (0.0%) | 17 (13.9%) |
| 3 or 4 Children | 0 (0.0%) | 0 (0.0%) |
| 5 or more Children | 0 (0.0%) | 0 (0.0%) |
| Total | 0 (0.0%) | 17 (13.9%) |
Race in West Swanzey
The most populous races in West Swanzey are , and White / Caucasian (1,200 | 100.0%).
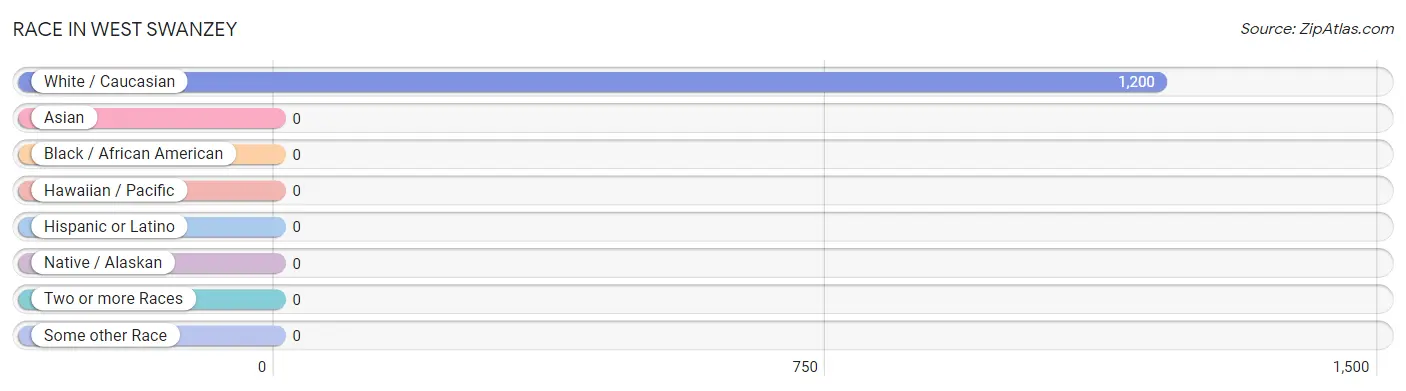
| Race | # Population | % Population |
| Asian | 0 | 0.0% |
| Black / African American | 0 | 0.0% |
| Hawaiian / Pacific | 0 | 0.0% |
| Hispanic or Latino | 0 | 0.0% |
| Native / Alaskan | 0 | 0.0% |
| White / Caucasian | 1,200 | 100.0% |
| Two or more Races | 0 | 0.0% |
| Some other Race | 0 | 0.0% |
| Total | 1,200 | 100.0% |
Ancestry in West Swanzey
The most populous ancestries reported in West Swanzey are French (324 | 27.0%), Irish (311 | 25.9%), Italian (179 | 14.9%), Austrian (122 | 10.2%), and Russian (108 | 9.0%), together accounting for 87.0% of all West Swanzey residents.
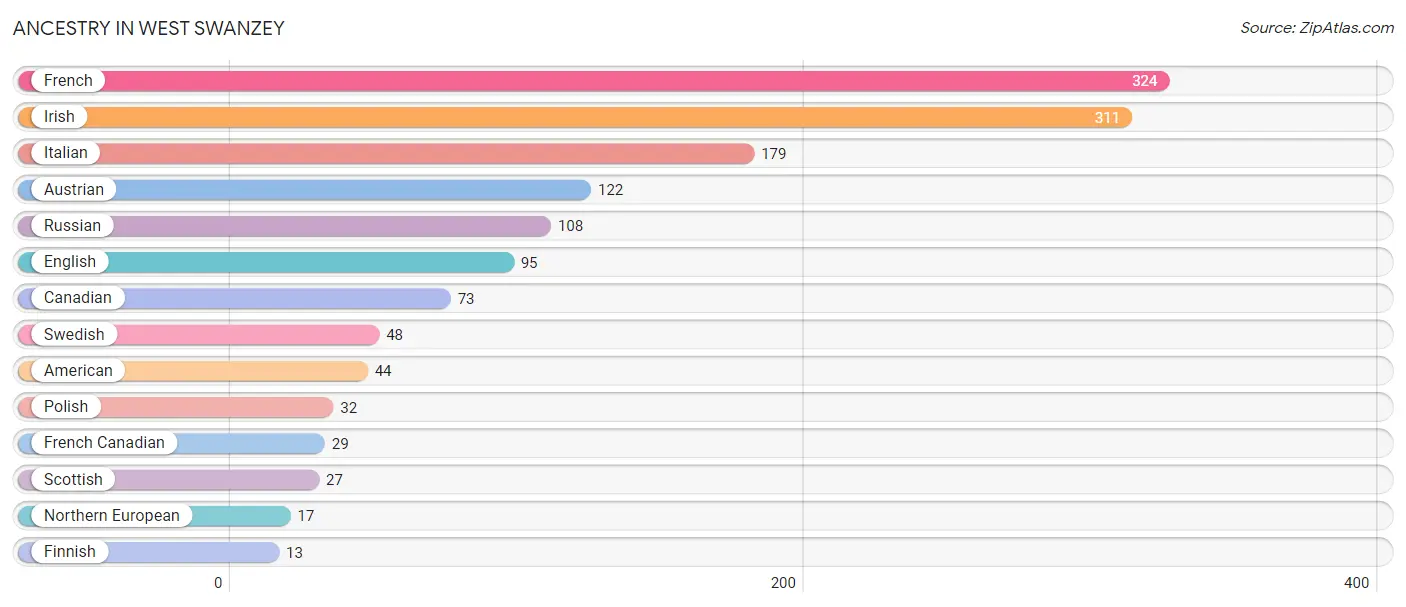
| Ancestry | # Population | % Population |
| American | 44 | 3.7% |
| Austrian | 122 | 10.2% |
| Canadian | 73 | 6.1% |
| English | 95 | 7.9% |
| Finnish | 13 | 1.1% |
| French | 324 | 27.0% |
| French Canadian | 29 | 2.4% |
| Irish | 311 | 25.9% |
| Italian | 179 | 14.9% |
| Northern European | 17 | 1.4% |
| Polish | 32 | 2.7% |
| Russian | 108 | 9.0% |
| Scottish | 27 | 2.2% |
| Swedish | 48 | 4.0% | View All 14 Rows |
Immigrants in West Swanzey
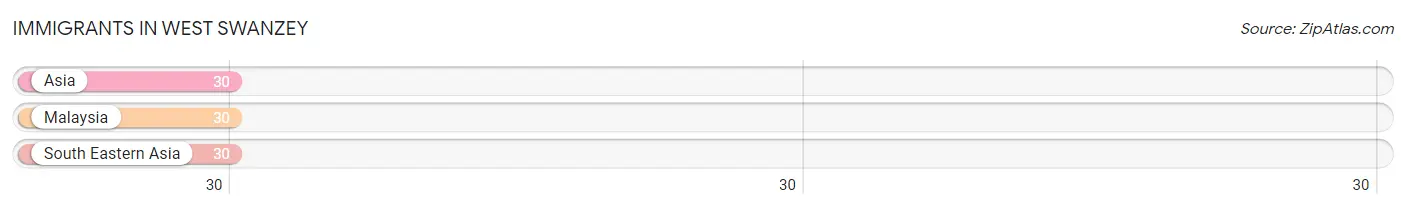
The most numerous immigrant groups reported in West Swanzey came from Asia (30 | 2.5%), Malaysia (30 | 2.5%), and South Eastern Asia (30 | 2.5%), together accounting for 7.5% of all West Swanzey residents.
| Immigration Origin | # Population | % Population |
| Asia | 30 | 2.5% |
| Malaysia | 30 | 2.5% |
| South Eastern Asia | 30 | 2.5% | View All 3 Rows |
Sex and Age in West Swanzey
Sex and Age in West Swanzey
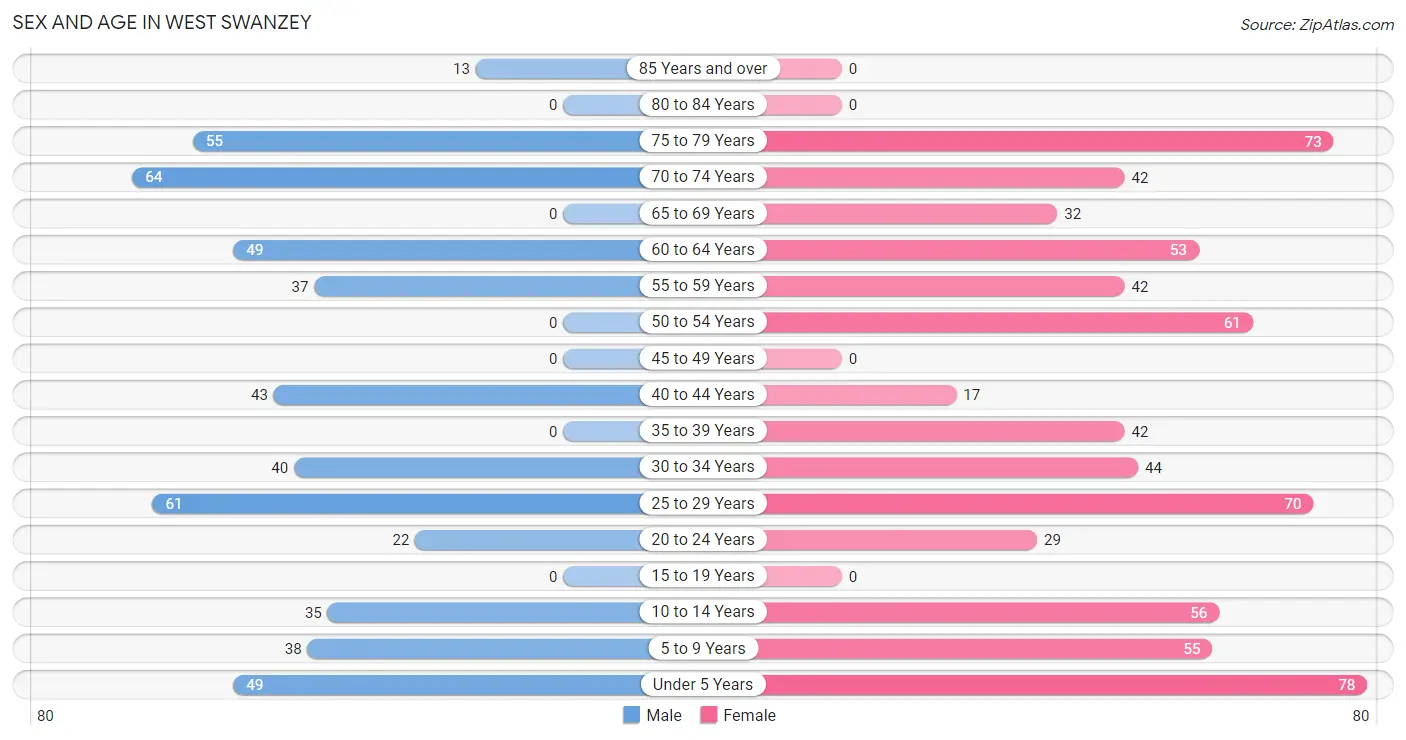
The most populous age groups in West Swanzey are 70 to 74 Years (64 | 12.7%) for men and Under 5 Years (78 | 11.2%) for women.
| Age Bracket | Male | Female |
| Under 5 Years | 49 (9.7%) | 78 (11.2%) |
| 5 to 9 Years | 38 (7.5%) | 55 (7.9%) |
| 10 to 14 Years | 35 (6.9%) | 56 (8.1%) |
| 15 to 19 Years | 0 (0.0%) | 0 (0.0%) |
| 20 to 24 Years | 22 (4.3%) | 29 (4.2%) |
| 25 to 29 Years | 61 (12.1%) | 70 (10.1%) |
| 30 to 34 Years | 40 (7.9%) | 44 (6.3%) |
| 35 to 39 Years | 0 (0.0%) | 42 (6.0%) |
| 40 to 44 Years | 43 (8.5%) | 17 (2.5%) |
| 45 to 49 Years | 0 (0.0%) | 0 (0.0%) |
| 50 to 54 Years | 0 (0.0%) | 61 (8.8%) |
| 55 to 59 Years | 37 (7.3%) | 42 (6.0%) |
| 60 to 64 Years | 49 (9.7%) | 53 (7.6%) |
| 65 to 69 Years | 0 (0.0%) | 32 (4.6%) |
| 70 to 74 Years | 64 (12.7%) | 42 (6.0%) |
| 75 to 79 Years | 55 (10.9%) | 73 (10.5%) |
| 80 to 84 Years | 0 (0.0%) | 0 (0.0%) |
| 85 Years and over | 13 (2.6%) | 0 (0.0%) |
| Total | 506 (100.0%) | 694 (100.0%) |
Families and Households in West Swanzey
Median Family Size in West Swanzey
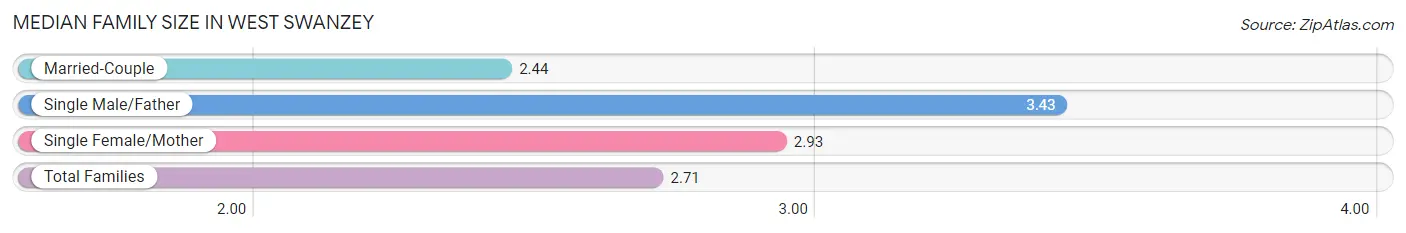
The median family size in West Swanzey is 2.71 persons per family, with single male/father families (63 | 18.4%) accounting for the largest median family size of 3.43 persons per family. On the other hand, married-couple families (220 | 64.3%) represent the smallest median family size with 2.44 persons per family.
| Family Type | # Families | Family Size |
| Married-Couple | 220 (64.3%) | 2.44 |
| Single Male/Father | 63 (18.4%) | 3.43 |
| Single Female/Mother | 59 (17.2%) | 2.93 |
| Total Families | 342 (100.0%) | 2.71 |
Median Household Size in West Swanzey
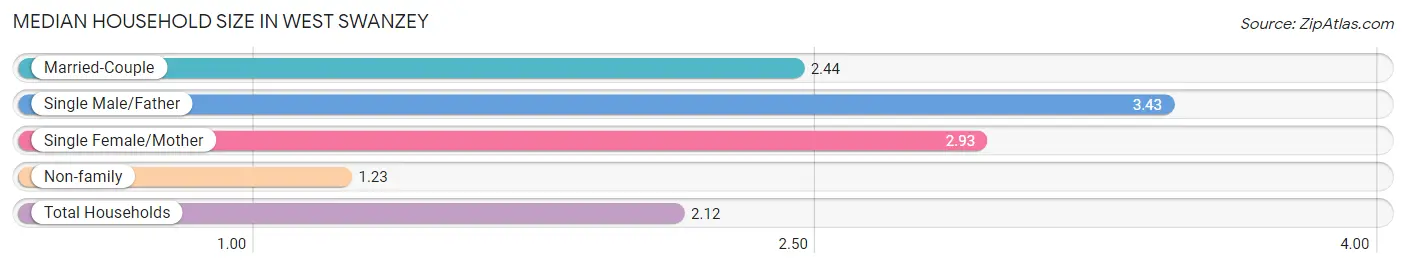
The median household size in West Swanzey is 2.12 persons per household, with single male/father households (63 | 11.2%) accounting for the largest median household size of 3.43 persons per household. non-family households (223 | 39.5%) represent the smallest median household size with 1.23 persons per household.
| Household Type | # Households | Household Size |
| Married-Couple | 220 (38.9%) | 2.44 |
| Single Male/Father | 63 (11.2%) | 3.43 |
| Single Female/Mother | 59 (10.4%) | 2.93 |
| Non-family | 223 (39.5%) | 1.23 |
| Total Households | 565 (100.0%) | 2.12 |
Household Size by Marriage Status in West Swanzey
Out of a total of 565 households in West Swanzey, 342 (60.5%) are family households, while 223 (39.5%) are nonfamily households. The most numerous type of family households are 2-person households, comprising 180, and the most common type of nonfamily households are 1-person households, comprising 164.
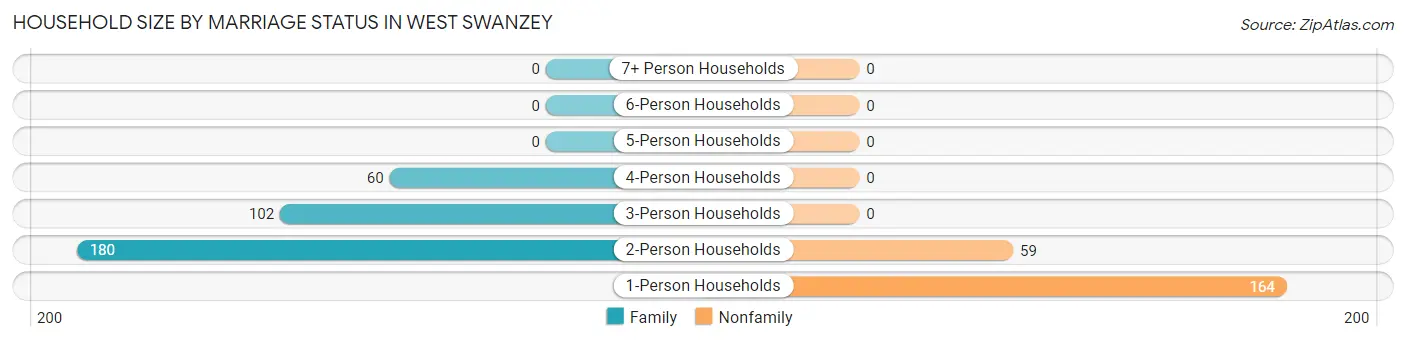
| Household Size | Family Households | Nonfamily Households |
| 1-Person Households | - | 164 (29.0%) |
| 2-Person Households | 180 (31.9%) | 59 (10.4%) |
| 3-Person Households | 102 (18.0%) | 0 (0.0%) |
| 4-Person Households | 60 (10.6%) | 0 (0.0%) |
| 5-Person Households | 0 (0.0%) | 0 (0.0%) |
| 6-Person Households | 0 (0.0%) | 0 (0.0%) |
| 7+ Person Households | 0 (0.0%) | 0 (0.0%) |
| Total | 342 (60.5%) | 223 (39.5%) |
Female Fertility in West Swanzey
Fertility by Age in West Swanzey
Average fertility rate in West Swanzey is 144.0 births per 1,000 women. Women in the age bracket of 20 to 34 years have the highest fertility rate with 203.0 births per 1,000 women. Women in the age bracket of 20 to 34 years acount for 100.0% of all women with births.
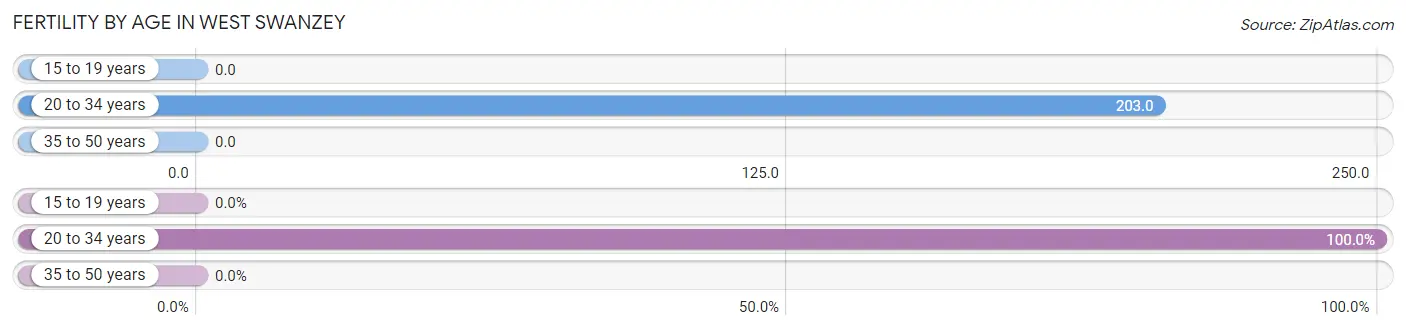
| Age Bracket | Women with Births | Births / 1,000 Women |
| 15 to 19 years | 0 (0.0%) | 0.0 |
| 20 to 34 years | 29 (100.0%) | 203.0 |
| 35 to 50 years | 0 (0.0%) | 0.0 |
| Total | 29 (100.0%) | 144.0 |
Fertility by Age by Marriage Status in West Swanzey
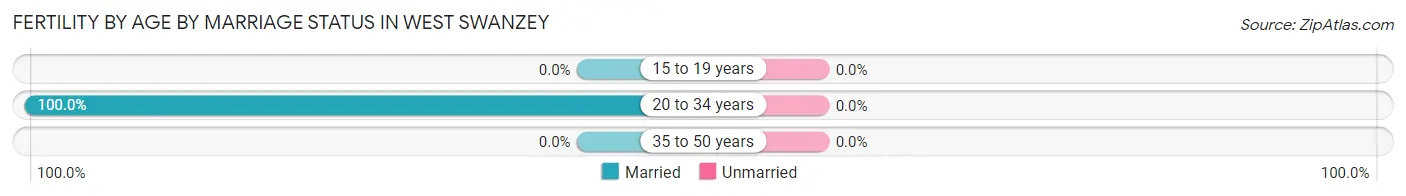
| Age Bracket | Married | Unmarried |
| 15 to 19 years | 0 (0.0%) | 0 (0.0%) |
| 20 to 34 years | 29 (100.0%) | 0 (0.0%) |
| 35 to 50 years | 0 (0.0%) | 0 (0.0%) |
| Total | 29 (100.0%) | 0 (0.0%) |
Fertility by Education in West Swanzey
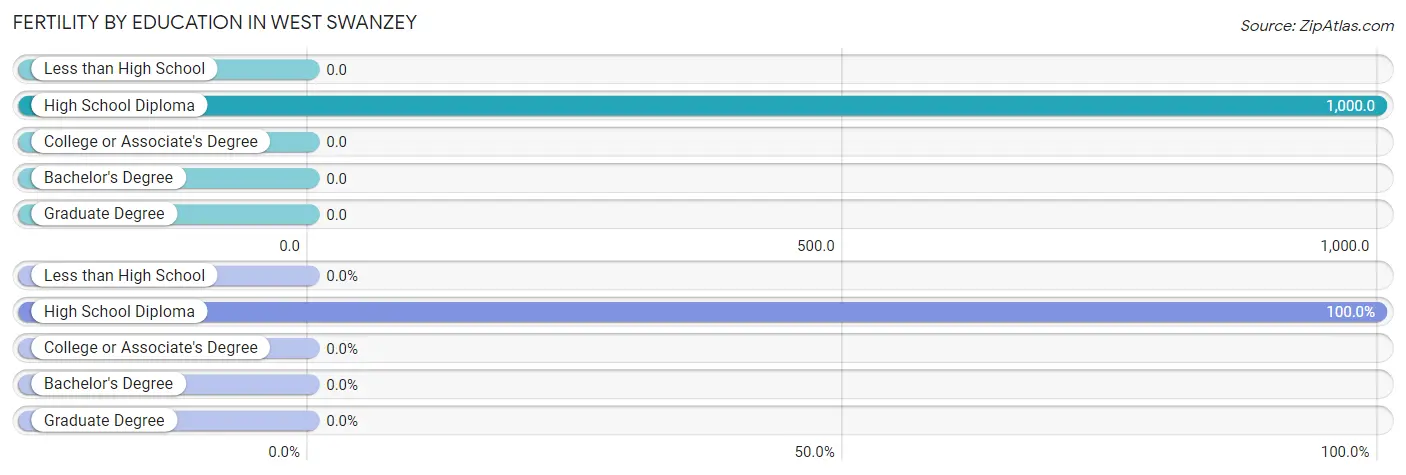
| Educational Attainment | Women with Births | Births / 1,000 Women |
| Less than High School | 0 (0.0%) | 0.0 |
| High School Diploma | 29 (100.0%) | 1,000.0 |
| College or Associate's Degree | 0 (0.0%) | 0.0 |
| Bachelor's Degree | 0 (0.0%) | 0.0 |
| Graduate Degree | 0 (0.0%) | 0.0 |
| Total | 29 (100.0%) | 144.0 |
Fertility by Education by Marriage Status in West Swanzey
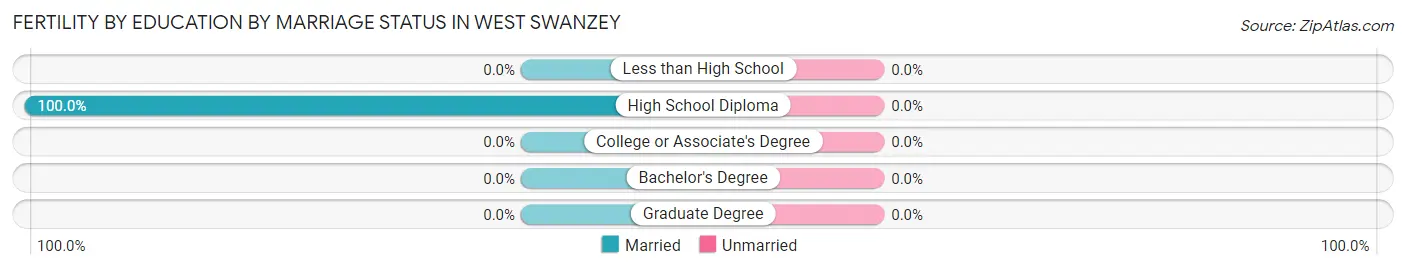
| Educational Attainment | Married | Unmarried |
| Less than High School | 0 (0.0%) | 0 (0.0%) |
| High School Diploma | 29 (100.0%) | 0 (0.0%) |
| College or Associate's Degree | 0 (0.0%) | 0 (0.0%) |
| Bachelor's Degree | 0 (0.0%) | 0 (0.0%) |
| Graduate Degree | 0 (0.0%) | 0 (0.0%) |
| Total | 29 (100.0%) | 0 (0.0%) |
Employment Characteristics in West Swanzey
Employment by Class of Employer in West Swanzey
Among the 505 employed individuals in West Swanzey, private company employees (356 | 70.5%), local government employees (56 | 11.1%), and not-for-profit organizations (33 | 6.5%) make up the most common classes of employment.
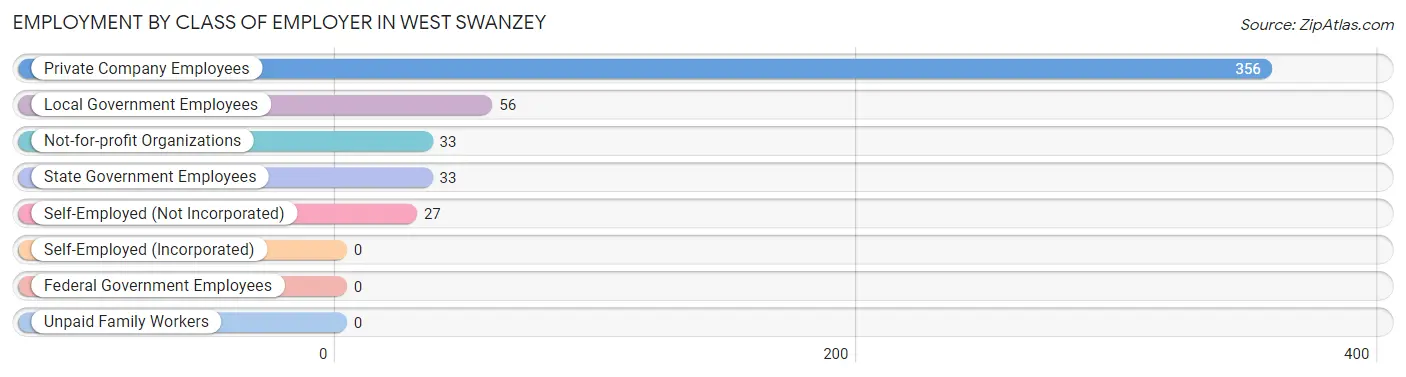
| Employer Class | # Employees | % Employees |
| Private Company Employees | 356 | 70.5% |
| Self-Employed (Incorporated) | 0 | 0.0% |
| Self-Employed (Not Incorporated) | 27 | 5.3% |
| Not-for-profit Organizations | 33 | 6.5% |
| Local Government Employees | 56 | 11.1% |
| State Government Employees | 33 | 6.5% |
| Federal Government Employees | 0 | 0.0% |
| Unpaid Family Workers | 0 | 0.0% |
| Total | 505 | 100.0% |
Employment Status by Age in West Swanzey
According to the labor force statistics for West Swanzey, out of the total population over 16 years of age (889), 60.1% or 534 individuals are in the labor force, with 5.4% or 29 of them unemployed. The age group with the highest labor force participation rate is 25 to 29 years, with 100.0% or 131 individuals in the labor force. Within the labor force, the 20 to 24 years age range has the highest percentage of unemployed individuals, with 100.0% or 29 of them being unemployed.
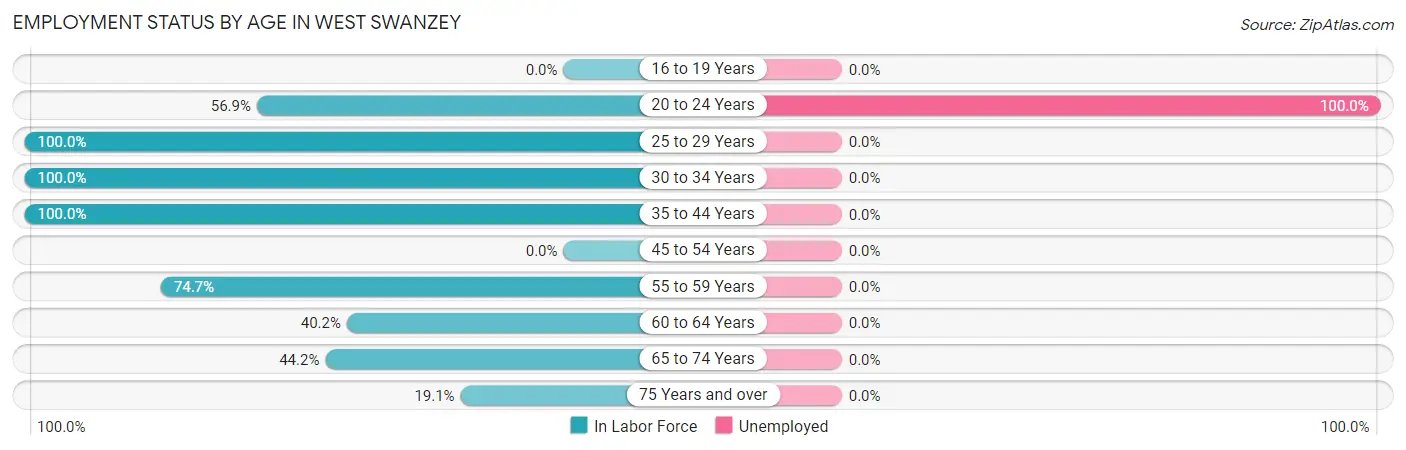
| Age Bracket | In Labor Force | Unemployed |
| 16 to 19 Years | 0 (0.0%) | 0 (0.0%) |
| 20 to 24 Years | 29 (56.9%) | 29 (100.0%) |
| 25 to 29 Years | 131 (100.0%) | 0 (0.0%) |
| 30 to 34 Years | 84 (100.0%) | 0 (0.0%) |
| 35 to 44 Years | 102 (100.0%) | 0 (0.0%) |
| 45 to 54 Years | 0 (0.0%) | 0 (0.0%) |
| 55 to 59 Years | 59 (74.7%) | 0 (0.0%) |
| 60 to 64 Years | 41 (40.2%) | 0 (0.0%) |
| 65 to 74 Years | 61 (44.2%) | 0 (0.0%) |
| 75 Years and over | 27 (19.1%) | 0 (0.0%) |
| Total | 534 (60.1%) | 29 (5.4%) |
Employment Status by Educational Attainment in West Swanzey
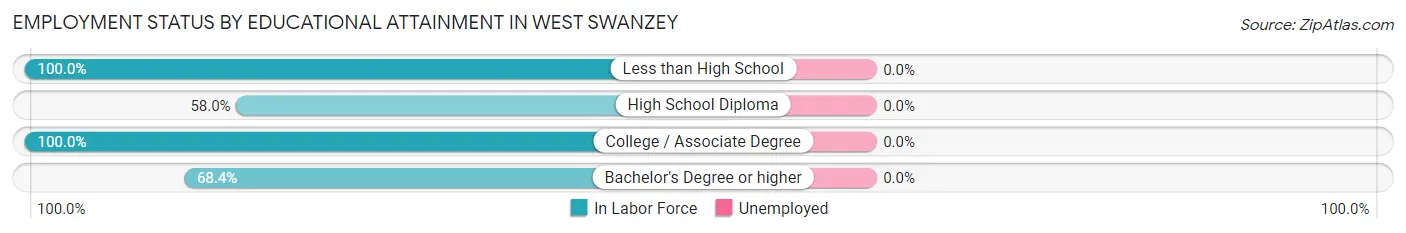
| Educational Attainment | In Labor Force | Unemployed |
| Less than High School | 30 (100.0%) | 0 (0.0%) |
| High School Diploma | 112 (58.0%) | 0 (0.0%) |
| College / Associate Degree | 143 (100.0%) | 0 (0.0%) |
| Bachelor's Degree or higher | 132 (68.4%) | 0 (0.0%) |
| Total | 417 (74.6%) | 0 (0.0%) |
Employment Occupations by Sex in West Swanzey
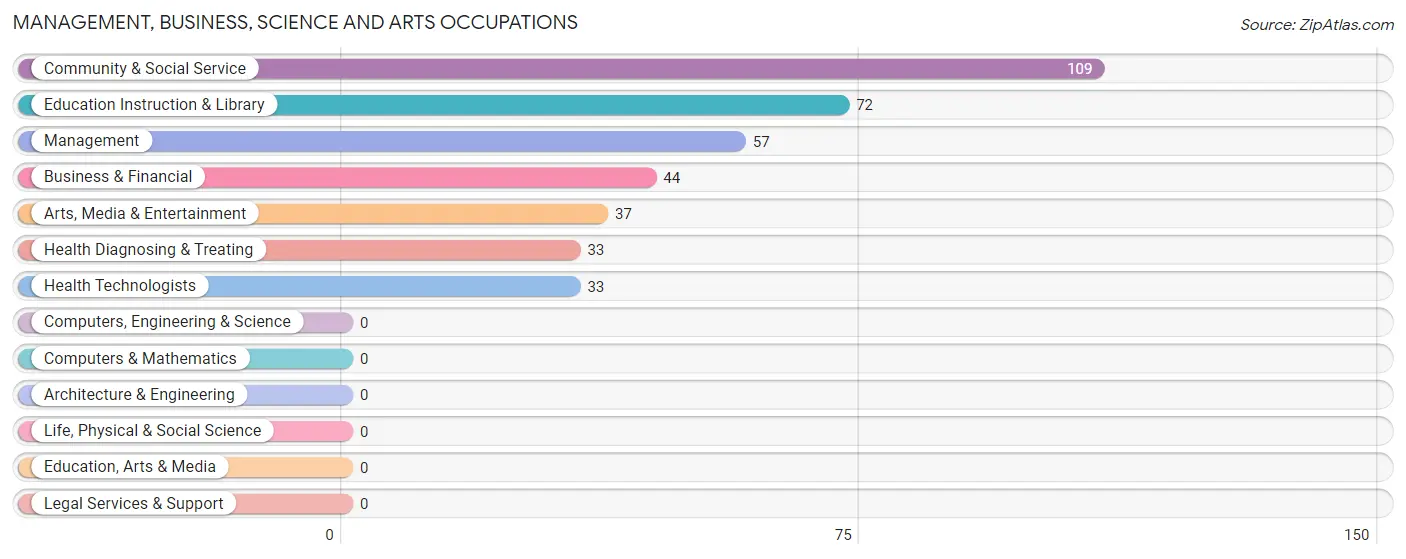
Management, Business, Science and Arts Occupations
The most common Management, Business, Science and Arts occupations in West Swanzey are Community & Social Service (109 | 21.6%), Education Instruction & Library (72 | 14.3%), Management (57 | 11.3%), Business & Financial (44 | 8.7%), and Arts, Media & Entertainment (37 | 7.3%).
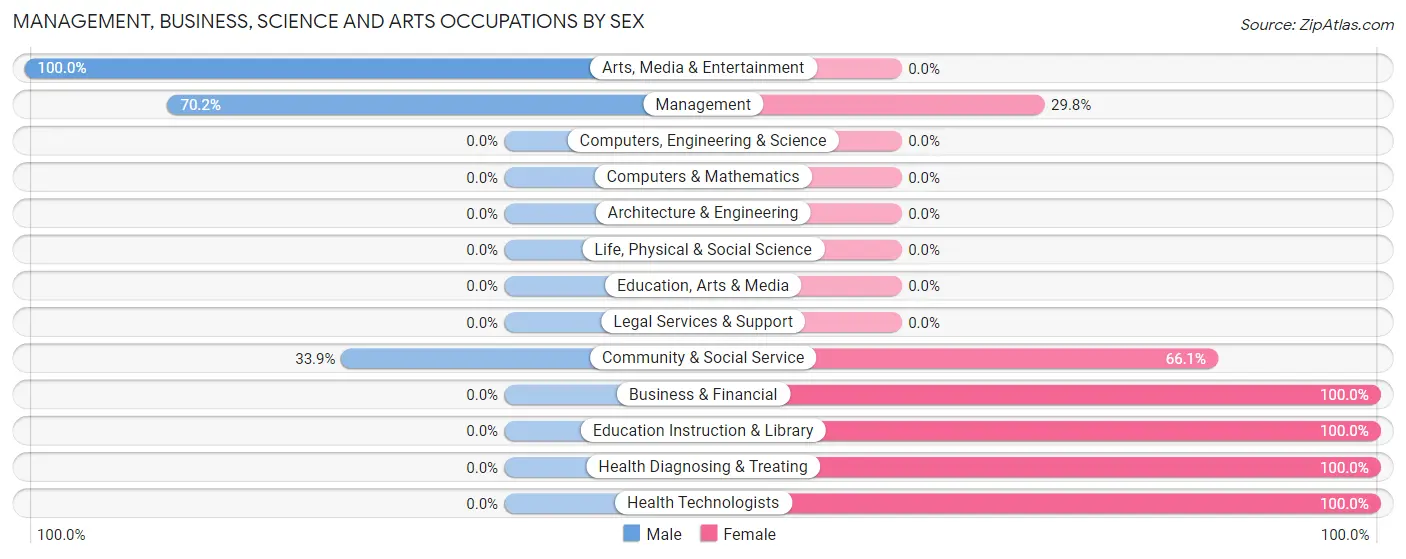
Management, Business, Science and Arts Occupations by Sex
Within the Management, Business, Science and Arts occupations in West Swanzey, the most male-oriented occupations are Arts, Media & Entertainment (100.0%), Management (70.2%), and Community & Social Service (33.9%), while the most female-oriented occupations are Business & Financial (100.0%), Education Instruction & Library (100.0%), and Health Diagnosing & Treating (100.0%).
| Occupation | Male | Female |
| Management | 40 (70.2%) | 17 (29.8%) |
| Business & Financial | 0 (0.0%) | 44 (100.0%) |
| Computers, Engineering & Science | 0 (0.0%) | 0 (0.0%) |
| Computers & Mathematics | 0 (0.0%) | 0 (0.0%) |
| Architecture & Engineering | 0 (0.0%) | 0 (0.0%) |
| Life, Physical & Social Science | 0 (0.0%) | 0 (0.0%) |
| Community & Social Service | 37 (33.9%) | 72 (66.1%) |
| Education, Arts & Media | 0 (0.0%) | 0 (0.0%) |
| Legal Services & Support | 0 (0.0%) | 0 (0.0%) |
| Education Instruction & Library | 0 (0.0%) | 72 (100.0%) |
| Arts, Media & Entertainment | 37 (100.0%) | 0 (0.0%) |
| Health Diagnosing & Treating | 0 (0.0%) | 33 (100.0%) |
| Health Technologists | 0 (0.0%) | 33 (100.0%) |
| Total (Category) | 77 (31.7%) | 166 (68.3%) |
| Total (Overall) | 253 (50.1%) | 252 (49.9%) |
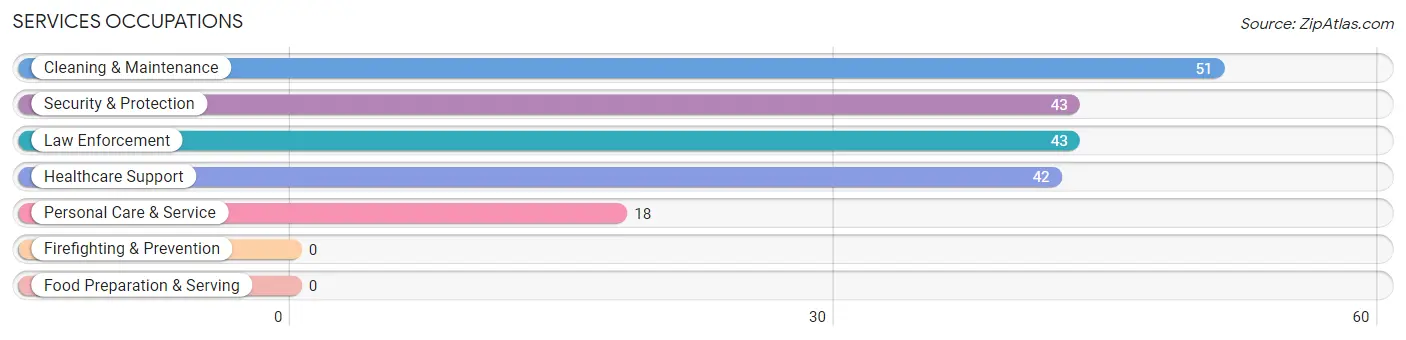
Services Occupations
The most common Services occupations in West Swanzey are Cleaning & Maintenance (51 | 10.1%), Security & Protection (43 | 8.5%), Law Enforcement (43 | 8.5%), Healthcare Support (42 | 8.3%), and Personal Care & Service (18 | 3.6%).
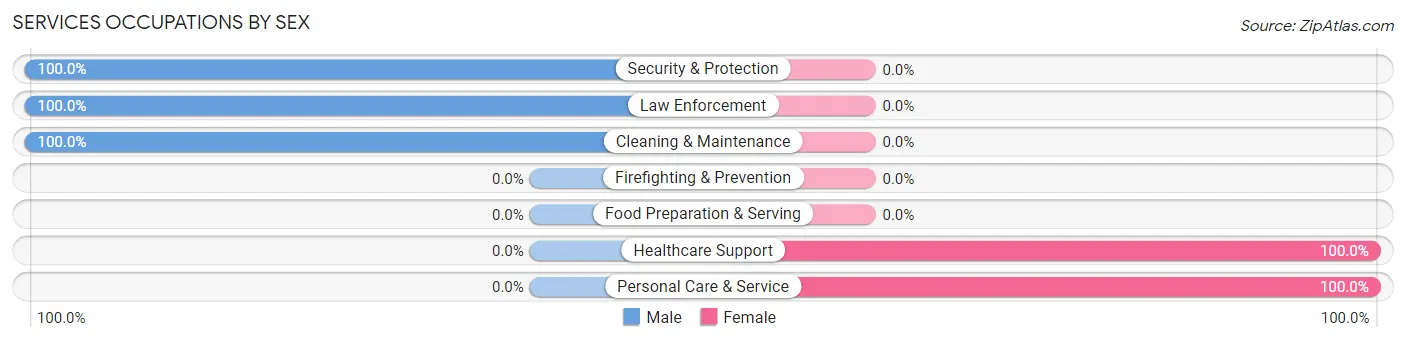
Services Occupations by Sex
Within the Services occupations in West Swanzey, the most male-oriented occupations are Security & Protection (100.0%), Law Enforcement (100.0%), and Cleaning & Maintenance (100.0%), while the most female-oriented occupations are Healthcare Support (100.0%), and Personal Care & Service (100.0%).
| Occupation | Male | Female |
| Healthcare Support | 0 (0.0%) | 42 (100.0%) |
| Security & Protection | 43 (100.0%) | 0 (0.0%) |
| Firefighting & Prevention | 0 (0.0%) | 0 (0.0%) |
| Law Enforcement | 43 (100.0%) | 0 (0.0%) |
| Food Preparation & Serving | 0 (0.0%) | 0 (0.0%) |
| Cleaning & Maintenance | 51 (100.0%) | 0 (0.0%) |
| Personal Care & Service | 0 (0.0%) | 18 (100.0%) |
| Total (Category) | 94 (61.0%) | 60 (39.0%) |
| Total (Overall) | 253 (50.1%) | 252 (49.9%) |
Sales and Office Occupations
The most common Sales and Office occupations in West Swanzey are , and Office & Administration (28 | 5.5%).
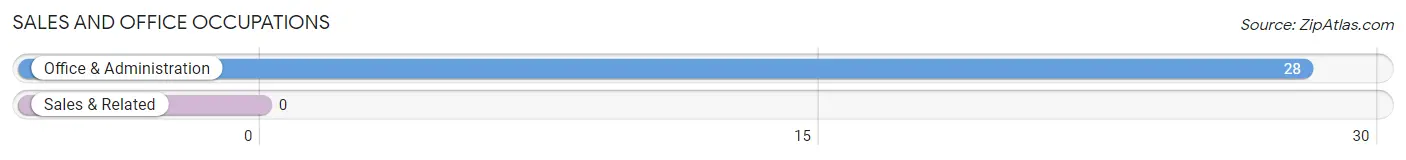
Sales and Office Occupations by Sex
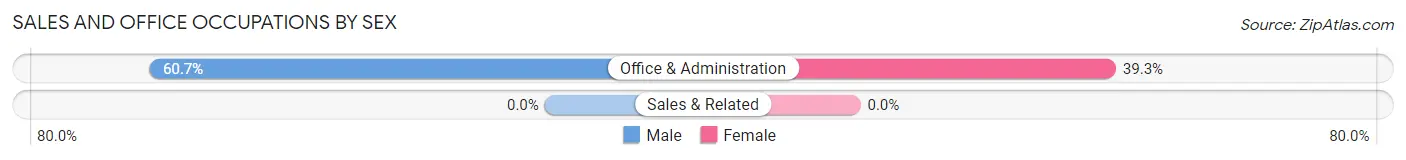
| Occupation | Male | Female |
| Sales & Related | 0 (0.0%) | 0 (0.0%) |
| Office & Administration | 17 (60.7%) | 11 (39.3%) |
| Total (Category) | 17 (60.7%) | 11 (39.3%) |
| Total (Overall) | 253 (50.1%) | 252 (49.9%) |
Natural Resources, Construction and Maintenance Occupations
The most common Natural Resources, Construction and Maintenance occupations in West Swanzey are , and Construction & Extraction (15 | 3.0%).
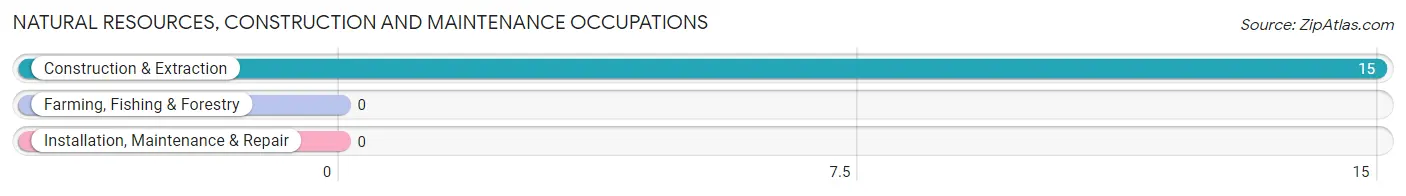
Natural Resources, Construction and Maintenance Occupations by Sex
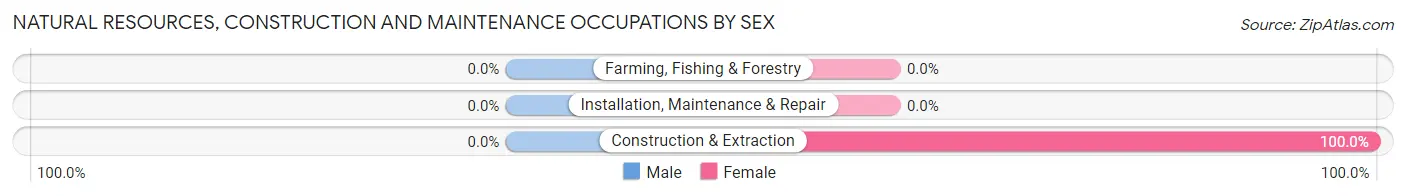
| Occupation | Male | Female |
| Farming, Fishing & Forestry | 0 (0.0%) | 0 (0.0%) |
| Construction & Extraction | 0 (0.0%) | 15 (100.0%) |
| Installation, Maintenance & Repair | 0 (0.0%) | 0 (0.0%) |
| Total (Category) | 0 (0.0%) | 15 (100.0%) |
| Total (Overall) | 253 (50.1%) | 252 (49.9%) |
Production, Transportation and Moving Occupations
The most common Production, Transportation and Moving occupations in West Swanzey are , and Transportation (65 | 12.9%).
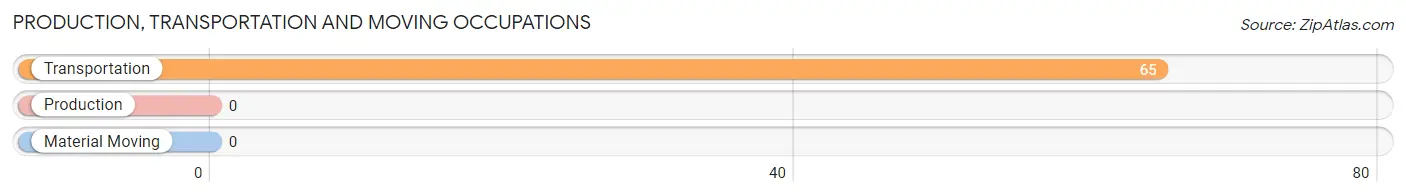
Production, Transportation and Moving Occupations by Sex
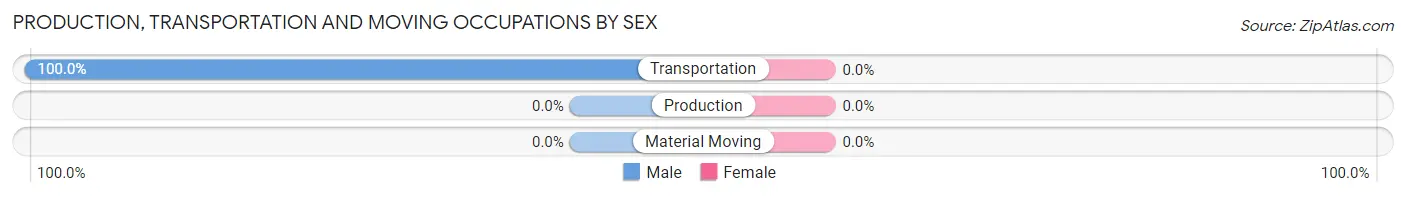
| Occupation | Male | Female |
| Production | 0 (0.0%) | 0 (0.0%) |
| Transportation | 65 (100.0%) | 0 (0.0%) |
| Material Moving | 0 (0.0%) | 0 (0.0%) |
| Total (Category) | 65 (100.0%) | 0 (0.0%) |
| Total (Overall) | 253 (50.1%) | 252 (49.9%) |
Employment Industries by Sex in West Swanzey
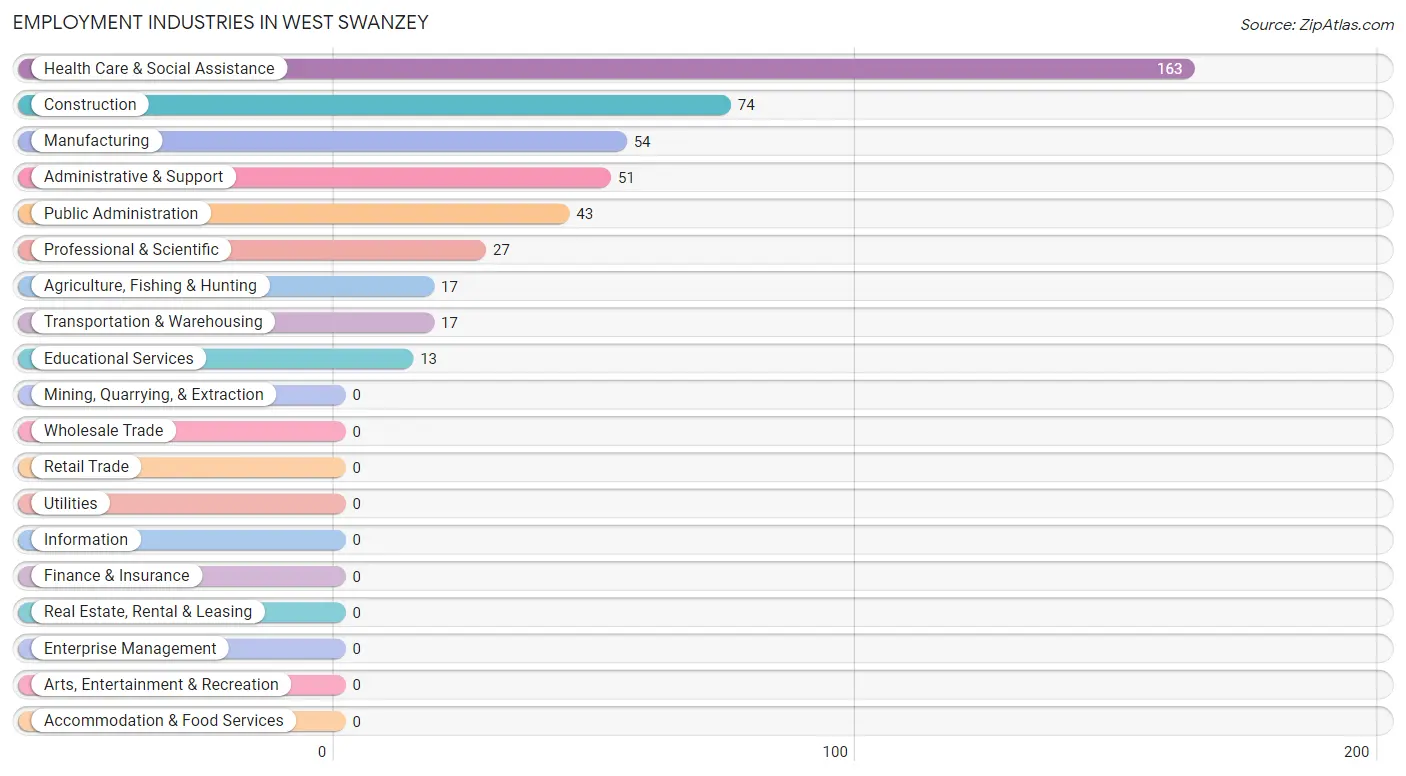
Employment Industries in West Swanzey
The major employment industries in West Swanzey include Health Care & Social Assistance (163 | 32.3%), Construction (74 | 14.6%), Manufacturing (54 | 10.7%), Administrative & Support (51 | 10.1%), and Public Administration (43 | 8.5%).
Employment Industries by Sex in West Swanzey
The West Swanzey industries that see more men than women are Transportation & Warehousing (100.0%), Professional & Scientific (100.0%), and Administrative & Support (100.0%), whereas the industries that tend to have a higher number of women are Agriculture, Fishing & Hunting (100.0%), Educational Services (100.0%), and Health Care & Social Assistance (100.0%).
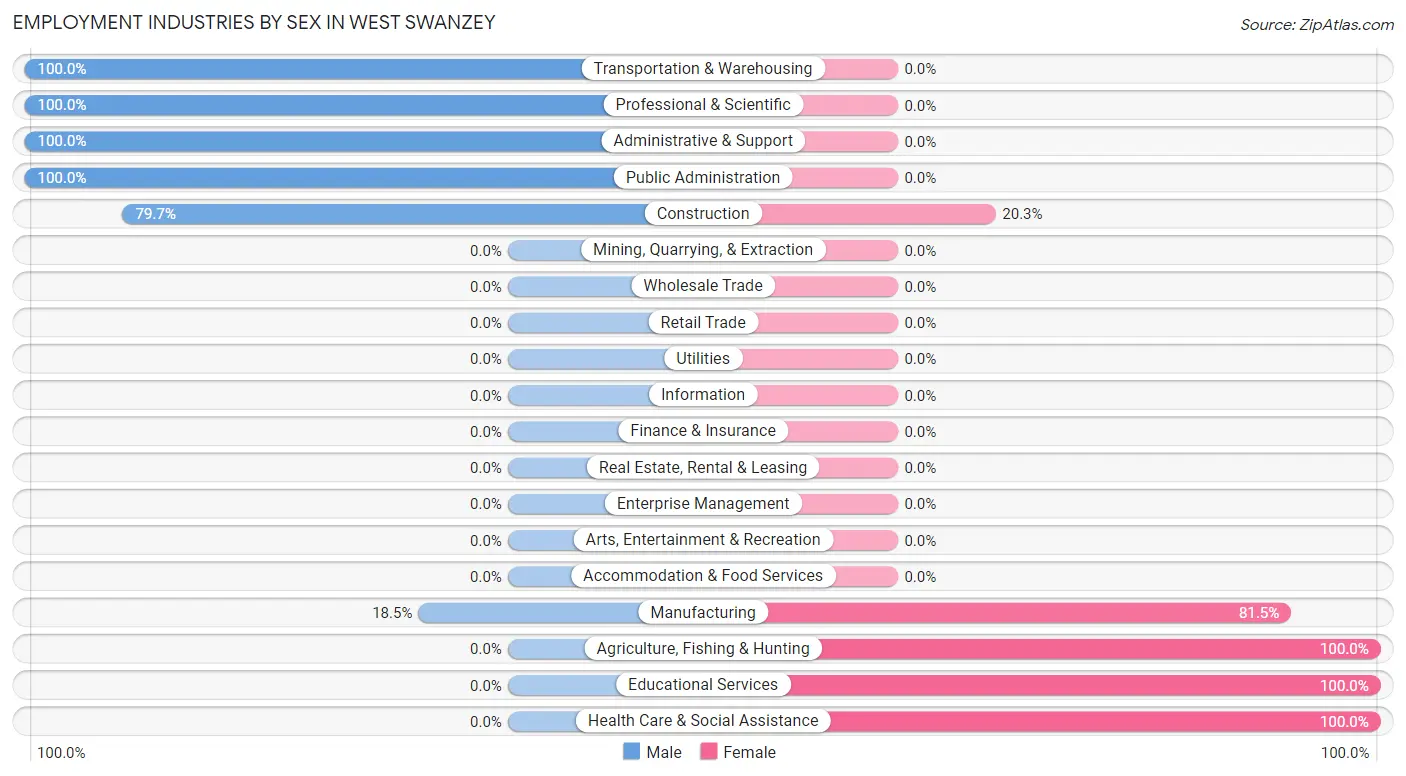
| Industry | Male | Female |
| Agriculture, Fishing & Hunting | 0 (0.0%) | 17 (100.0%) |
| Mining, Quarrying, & Extraction | 0 (0.0%) | 0 (0.0%) |
| Construction | 59 (79.7%) | 15 (20.3%) |
| Manufacturing | 10 (18.5%) | 44 (81.5%) |
| Wholesale Trade | 0 (0.0%) | 0 (0.0%) |
| Retail Trade | 0 (0.0%) | 0 (0.0%) |
| Transportation & Warehousing | 17 (100.0%) | 0 (0.0%) |
| Utilities | 0 (0.0%) | 0 (0.0%) |
| Information | 0 (0.0%) | 0 (0.0%) |
| Finance & Insurance | 0 (0.0%) | 0 (0.0%) |
| Real Estate, Rental & Leasing | 0 (0.0%) | 0 (0.0%) |
| Professional & Scientific | 27 (100.0%) | 0 (0.0%) |
| Enterprise Management | 0 (0.0%) | 0 (0.0%) |
| Administrative & Support | 51 (100.0%) | 0 (0.0%) |
| Educational Services | 0 (0.0%) | 13 (100.0%) |
| Health Care & Social Assistance | 0 (0.0%) | 163 (100.0%) |
| Arts, Entertainment & Recreation | 0 (0.0%) | 0 (0.0%) |
| Accommodation & Food Services | 0 (0.0%) | 0 (0.0%) |
| Public Administration | 43 (100.0%) | 0 (0.0%) |
| Total | 253 (50.1%) | 252 (49.9%) |
Education in West Swanzey
School Enrollment in West Swanzey
The most common levels of schooling among the 187 students in West Swanzey are middle school (91 | 48.7%), elementary school (53 | 28.3%), and college / undergraduate (43 | 23.0%).
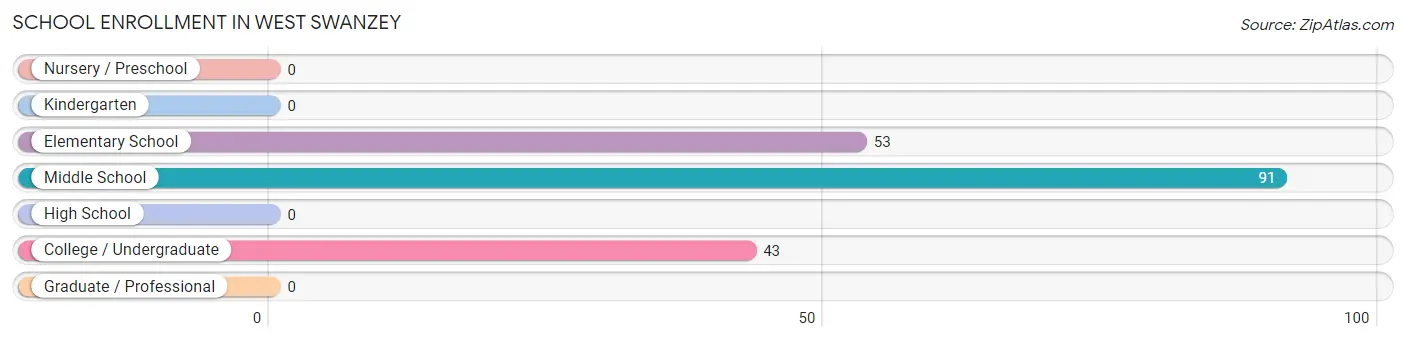
| School Level | # Students | % Students |
| Nursery / Preschool | 0 | 0.0% |
| Kindergarten | 0 | 0.0% |
| Elementary School | 53 | 28.3% |
| Middle School | 91 | 48.7% |
| High School | 0 | 0.0% |
| College / Undergraduate | 43 | 23.0% |
| Graduate / Professional | 0 | 0.0% |
| Total | 187 | 100.0% |
School Enrollment by Age by Funding Source in West Swanzey
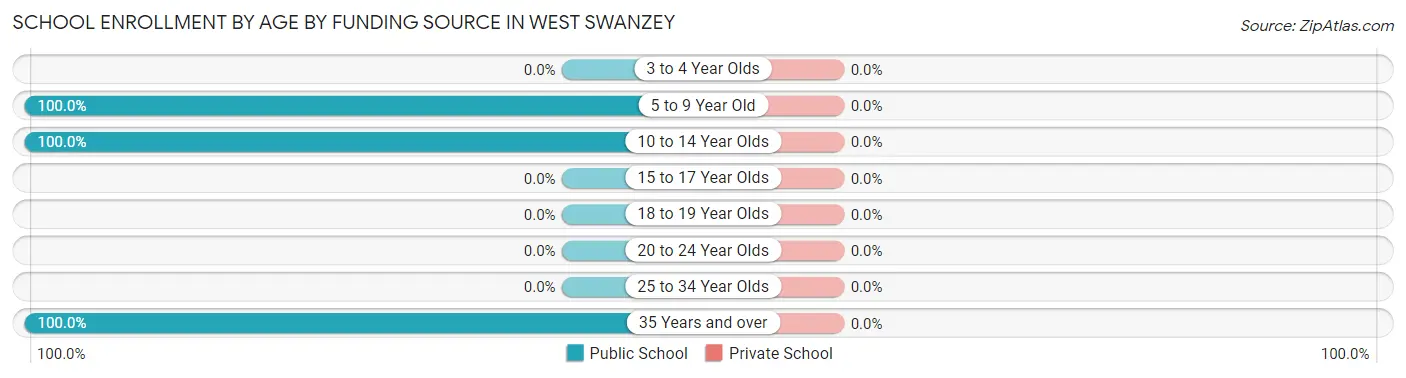
| Age Bracket | Public School | Private School |
| 3 to 4 Year Olds | 0 (0.0%) | 0 (0.0%) |
| 5 to 9 Year Old | 53 (100.0%) | 0 (0.0%) |
| 10 to 14 Year Olds | 91 (100.0%) | 0 (0.0%) |
| 15 to 17 Year Olds | 0 (0.0%) | 0 (0.0%) |
| 18 to 19 Year Olds | 0 (0.0%) | 0 (0.0%) |
| 20 to 24 Year Olds | 0 (0.0%) | 0 (0.0%) |
| 25 to 34 Year Olds | 0 (0.0%) | 0 (0.0%) |
| 35 Years and over | 43 (100.0%) | 0 (0.0%) |
| Total | 187 (100.0%) | 0 (0.0%) |
Educational Attainment by Field of Study in West Swanzey
Psychology (72 | 20.3%), liberal arts & history (72 | 20.3%), education (69 | 19.4%), arts & humanities (44 | 12.4%), and visual & performing arts (27 | 7.6%) are the most common fields of study among 355 individuals in West Swanzey who have obtained a bachelor's degree or higher.
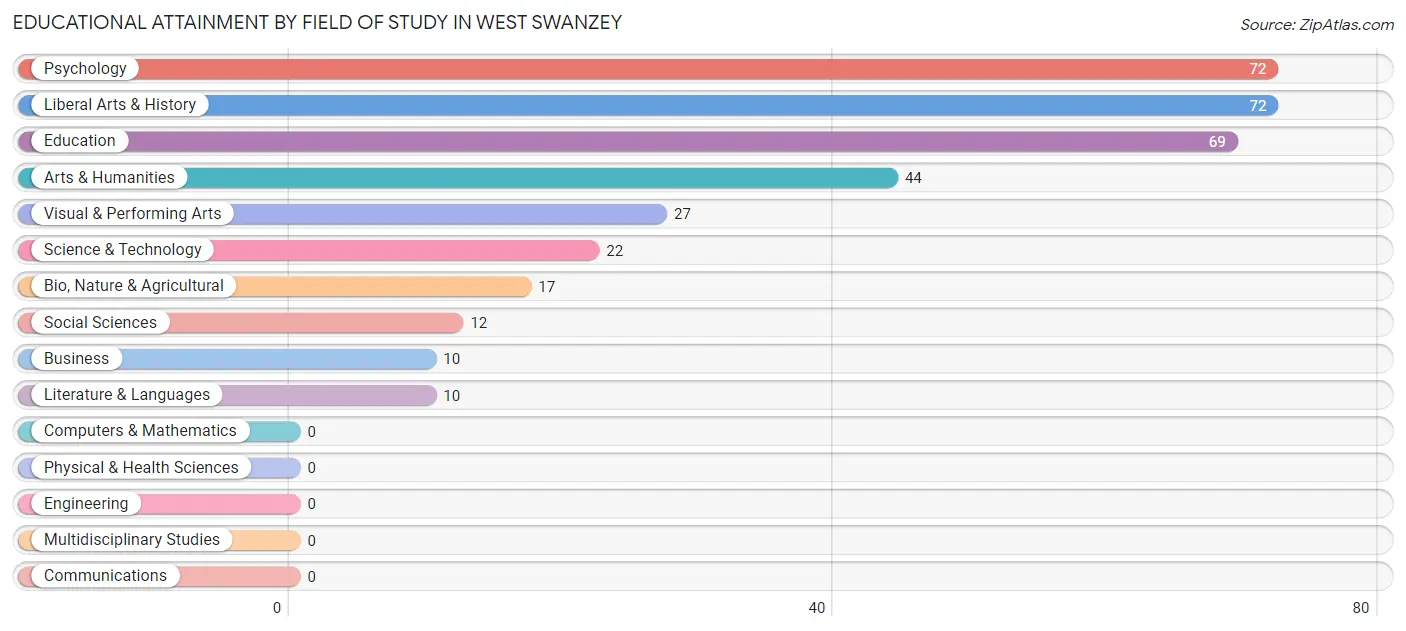
| Field of Study | # Graduates | % Graduates |
| Computers & Mathematics | 0 | 0.0% |
| Bio, Nature & Agricultural | 17 | 4.8% |
| Physical & Health Sciences | 0 | 0.0% |
| Psychology | 72 | 20.3% |
| Social Sciences | 12 | 3.4% |
| Engineering | 0 | 0.0% |
| Multidisciplinary Studies | 0 | 0.0% |
| Science & Technology | 22 | 6.2% |
| Business | 10 | 2.8% |
| Education | 69 | 19.4% |
| Literature & Languages | 10 | 2.8% |
| Liberal Arts & History | 72 | 20.3% |
| Visual & Performing Arts | 27 | 7.6% |
| Communications | 0 | 0.0% |
| Arts & Humanities | 44 | 12.4% |
| Total | 355 | 100.0% |
Transportation & Commute in West Swanzey
Vehicle Availability by Sex in West Swanzey
The most prevalent vehicle ownership categories in West Swanzey are males with 2 vehicles (207, accounting for 81.8%) and females with 2 vehicles (145, making up 82.1%).
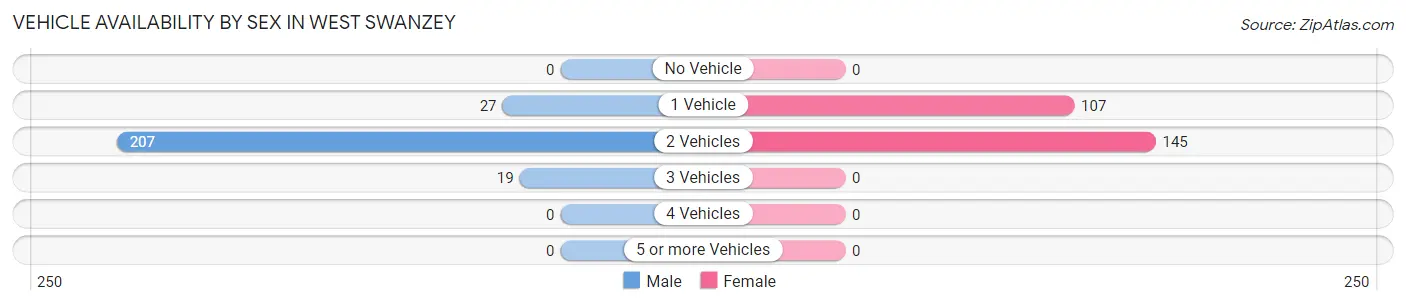
| Vehicles Available | Male | Female |
| No Vehicle | 0 (0.0%) | 0 (0.0%) |
| 1 Vehicle | 27 (10.7%) | 107 (42.5%) |
| 2 Vehicles | 207 (81.8%) | 145 (57.5%) |
| 3 Vehicles | 19 (7.5%) | 0 (0.0%) |
| 4 Vehicles | 0 (0.0%) | 0 (0.0%) |
| 5 or more Vehicles | 0 (0.0%) | 0 (0.0%) |
| Total | 253 (100.0%) | 252 (100.0%) |
Commute Time in West Swanzey
The most frequently occuring commute durations in West Swanzey are 10 to 14 minutes (178 commuters, 35.2%), 15 to 19 minutes (130 commuters, 25.7%), and 25 to 29 minutes (59 commuters, 11.7%).
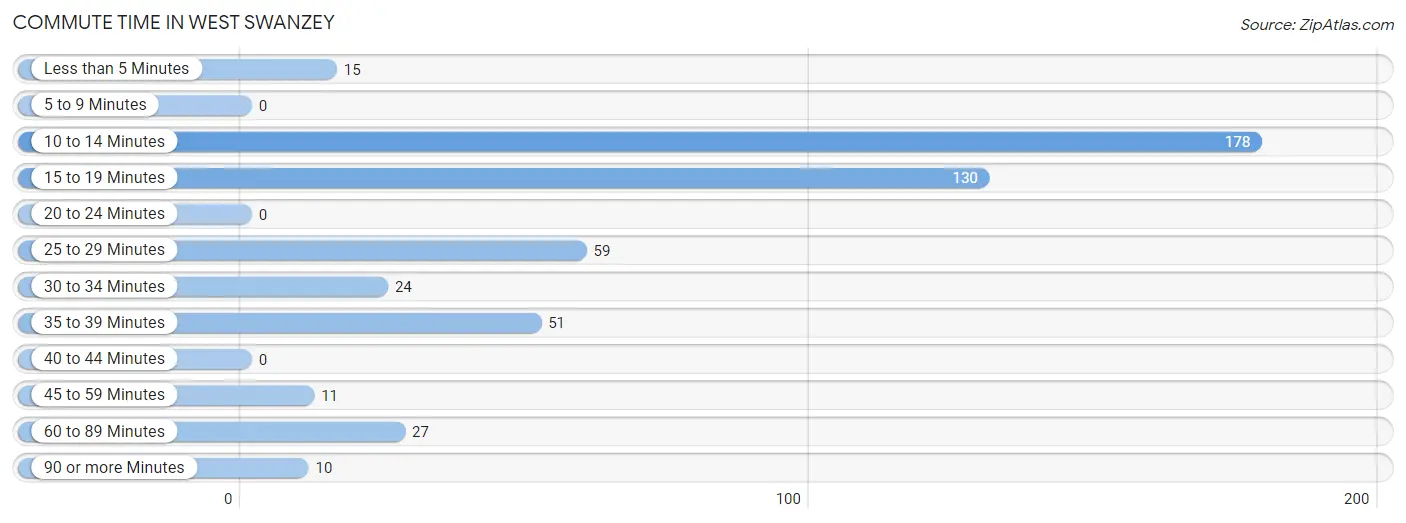
| Commute Time | # Commuters | % Commuters |
| Less than 5 Minutes | 15 | 3.0% |
| 5 to 9 Minutes | 0 | 0.0% |
| 10 to 14 Minutes | 178 | 35.2% |
| 15 to 19 Minutes | 130 | 25.7% |
| 20 to 24 Minutes | 0 | 0.0% |
| 25 to 29 Minutes | 59 | 11.7% |
| 30 to 34 Minutes | 24 | 4.8% |
| 35 to 39 Minutes | 51 | 10.1% |
| 40 to 44 Minutes | 0 | 0.0% |
| 45 to 59 Minutes | 11 | 2.2% |
| 60 to 89 Minutes | 27 | 5.3% |
| 90 or more Minutes | 10 | 2.0% |
Commute Time by Sex in West Swanzey
The most common commute times in West Swanzey are 15 to 19 minutes (108 commuters, 42.7%) for males and 10 to 14 minutes (121 commuters, 48.0%) for females.
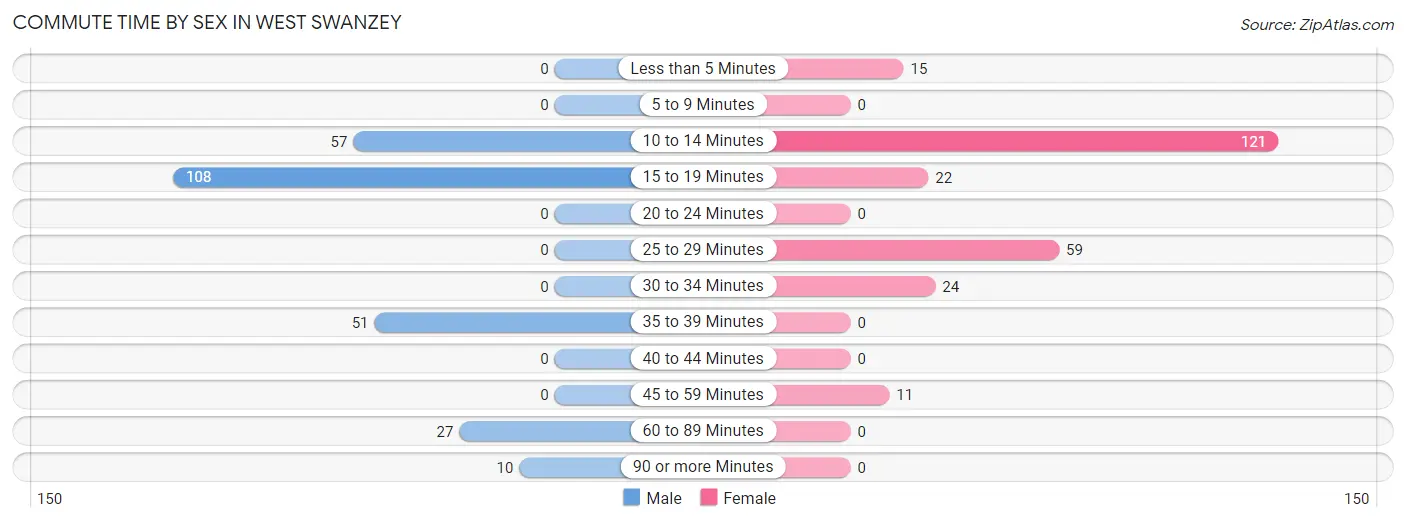
| Commute Time | Male | Female |
| Less than 5 Minutes | 0 (0.0%) | 15 (5.9%) |
| 5 to 9 Minutes | 0 (0.0%) | 0 (0.0%) |
| 10 to 14 Minutes | 57 (22.5%) | 121 (48.0%) |
| 15 to 19 Minutes | 108 (42.7%) | 22 (8.7%) |
| 20 to 24 Minutes | 0 (0.0%) | 0 (0.0%) |
| 25 to 29 Minutes | 0 (0.0%) | 59 (23.4%) |
| 30 to 34 Minutes | 0 (0.0%) | 24 (9.5%) |
| 35 to 39 Minutes | 51 (20.2%) | 0 (0.0%) |
| 40 to 44 Minutes | 0 (0.0%) | 0 (0.0%) |
| 45 to 59 Minutes | 0 (0.0%) | 11 (4.4%) |
| 60 to 89 Minutes | 27 (10.7%) | 0 (0.0%) |
| 90 or more Minutes | 10 (4.0%) | 0 (0.0%) |
Time of Departure to Work by Sex in West Swanzey
The most frequent times of departure to work in West Swanzey are 6:00 AM to 6:29 AM (51, 20.2%) for males and 7:30 AM to 7:59 AM (118, 46.8%) for females.
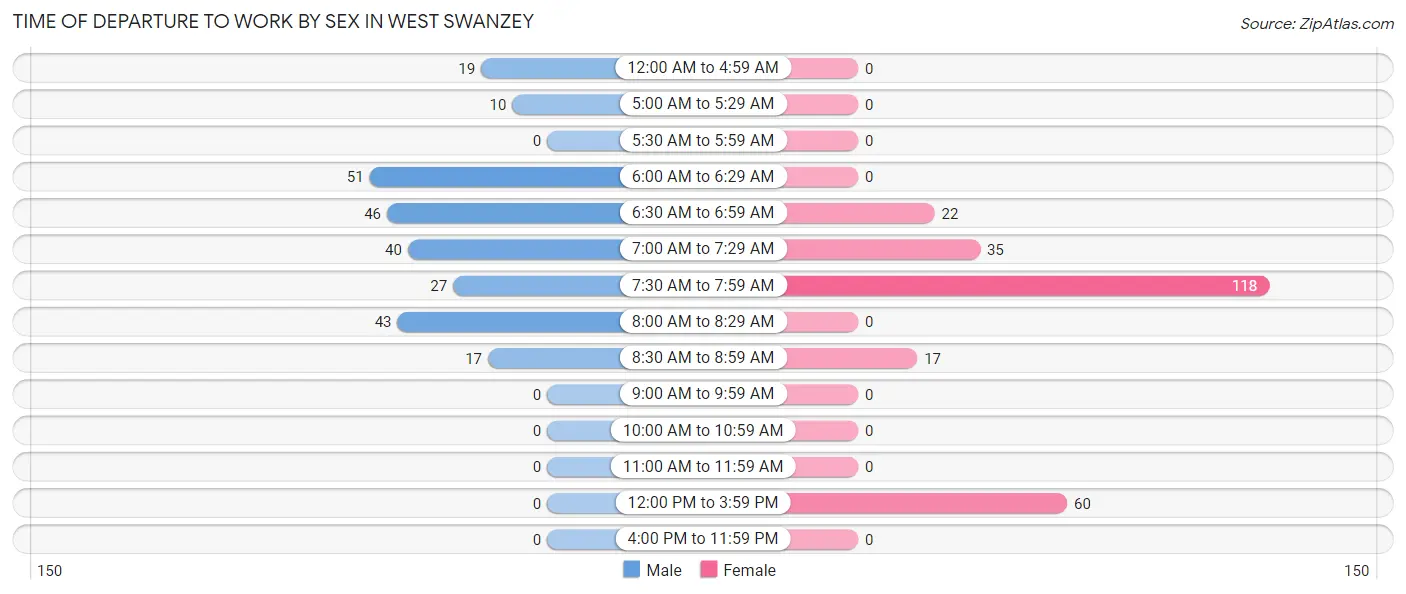
| Time of Departure | Male | Female |
| 12:00 AM to 4:59 AM | 19 (7.5%) | 0 (0.0%) |
| 5:00 AM to 5:29 AM | 10 (4.0%) | 0 (0.0%) |
| 5:30 AM to 5:59 AM | 0 (0.0%) | 0 (0.0%) |
| 6:00 AM to 6:29 AM | 51 (20.2%) | 0 (0.0%) |
| 6:30 AM to 6:59 AM | 46 (18.2%) | 22 (8.7%) |
| 7:00 AM to 7:29 AM | 40 (15.8%) | 35 (13.9%) |
| 7:30 AM to 7:59 AM | 27 (10.7%) | 118 (46.8%) |
| 8:00 AM to 8:29 AM | 43 (17.0%) | 0 (0.0%) |
| 8:30 AM to 8:59 AM | 17 (6.7%) | 17 (6.8%) |
| 9:00 AM to 9:59 AM | 0 (0.0%) | 0 (0.0%) |
| 10:00 AM to 10:59 AM | 0 (0.0%) | 0 (0.0%) |
| 11:00 AM to 11:59 AM | 0 (0.0%) | 0 (0.0%) |
| 12:00 PM to 3:59 PM | 0 (0.0%) | 60 (23.8%) |
| 4:00 PM to 11:59 PM | 0 (0.0%) | 0 (0.0%) |
| Total | 253 (100.0%) | 252 (100.0%) |
Housing Occupancy in West Swanzey
Occupancy by Ownership in West Swanzey
Of the total 565 dwellings in West Swanzey, owner-occupied units account for 216 (38.2%), while renter-occupied units make up 349 (61.8%).
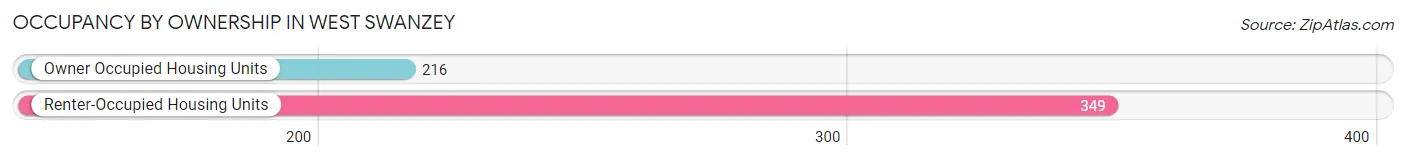
| Occupancy | # Housing Units | % Housing Units |
| Owner Occupied Housing Units | 216 | 38.2% |
| Renter-Occupied Housing Units | 349 | 61.8% |
| Total Occupied Housing Units | 565 | 100.0% |
Occupancy by Household Size in West Swanzey
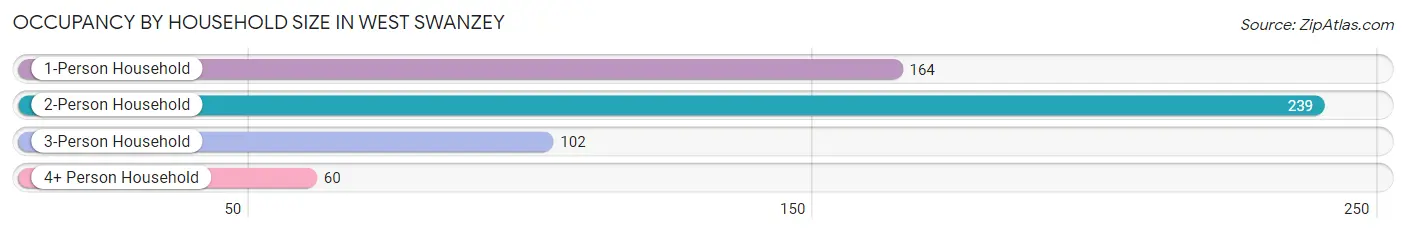
| Household Size | # Housing Units | % Housing Units |
| 1-Person Household | 164 | 29.0% |
| 2-Person Household | 239 | 42.3% |
| 3-Person Household | 102 | 18.0% |
| 4+ Person Household | 60 | 10.6% |
| Total Housing Units | 565 | 100.0% |
Occupancy by Ownership by Household Size in West Swanzey
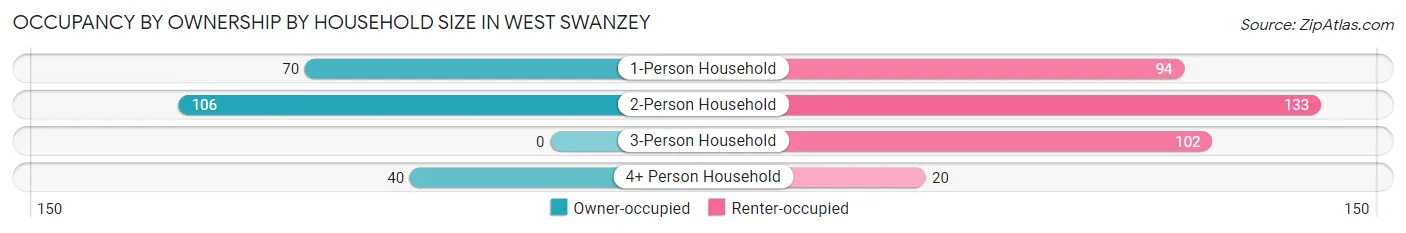
| Household Size | Owner-occupied | Renter-occupied |
| 1-Person Household | 70 (42.7%) | 94 (57.3%) |
| 2-Person Household | 106 (44.4%) | 133 (55.6%) |
| 3-Person Household | 0 (0.0%) | 102 (100.0%) |
| 4+ Person Household | 40 (66.7%) | 20 (33.3%) |
| Total Housing Units | 216 (38.2%) | 349 (61.8%) |
Occupancy by Educational Attainment in West Swanzey
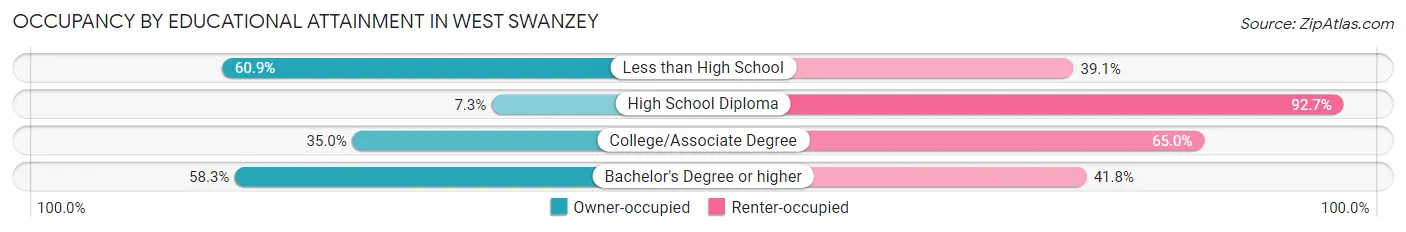
| Household Size | Owner-occupied | Renter-occupied |
| Less than High School | 28 (60.9%) | 18 (39.1%) |
| High School Diploma | 11 (7.3%) | 139 (92.7%) |
| College/Associate Degree | 57 (35.0%) | 106 (65.0%) |
| Bachelor's Degree or higher | 120 (58.3%) | 86 (41.7%) |
Occupancy by Age of Householder in West Swanzey
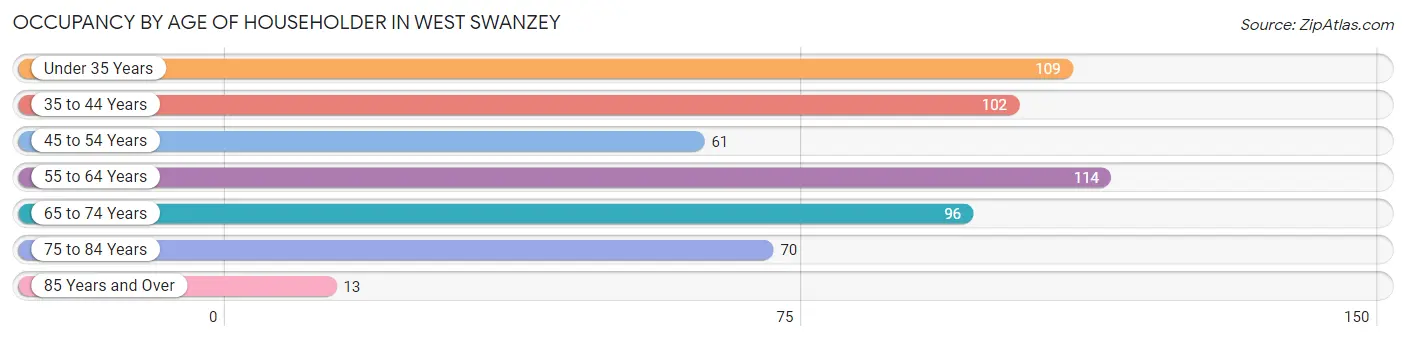
| Age Bracket | # Households | % Households |
| Under 35 Years | 109 | 19.3% |
| 35 to 44 Years | 102 | 18.0% |
| 45 to 54 Years | 61 | 10.8% |
| 55 to 64 Years | 114 | 20.2% |
| 65 to 74 Years | 96 | 17.0% |
| 75 to 84 Years | 70 | 12.4% |
| 85 Years and Over | 13 | 2.3% |
| Total | 565 | 100.0% |
Housing Finances in West Swanzey
Median Income by Occupancy in West Swanzey
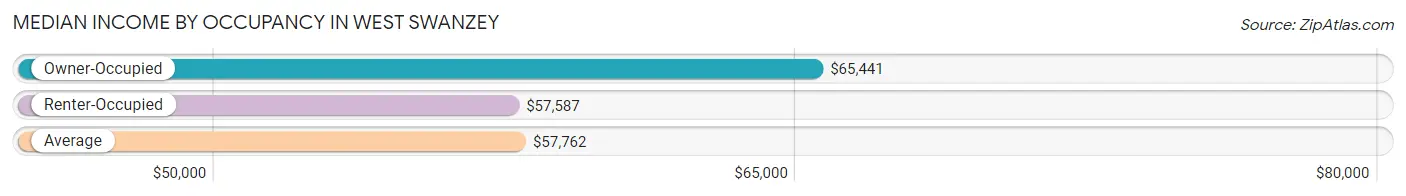
| Occupancy Type | # Households | Median Income |
| Owner-Occupied | 216 (38.2%) | $65,441 |
| Renter-Occupied | 349 (61.8%) | $57,587 |
| Average | 565 (100.0%) | $57,762 |
Occupancy by Householder Income Bracket in West Swanzey
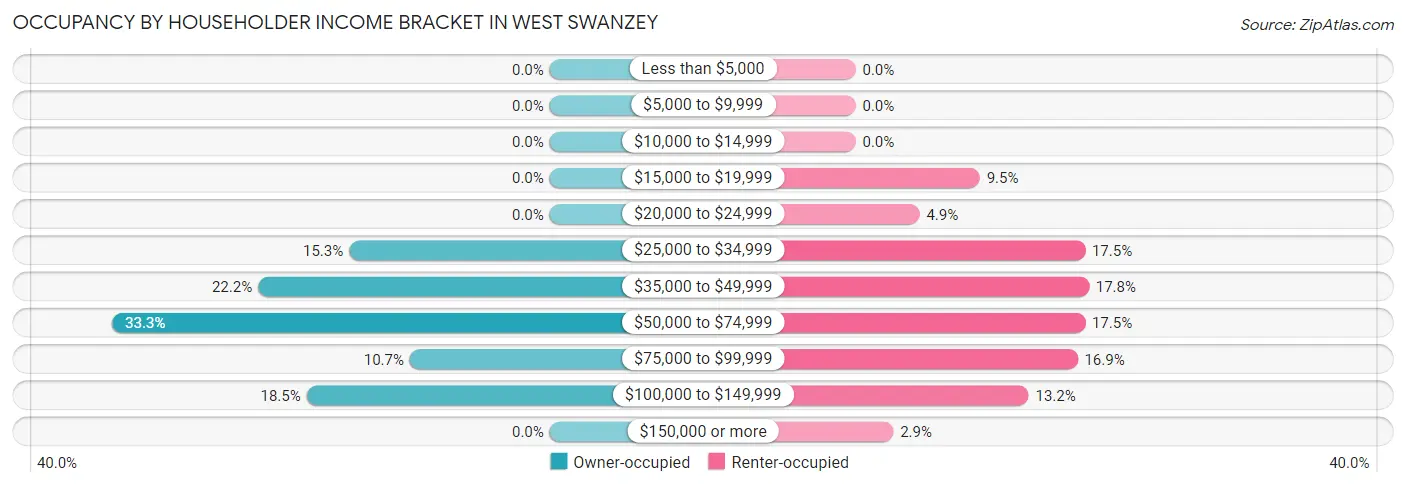
| Income Bracket | Owner-occupied | Renter-occupied |
| Less than $5,000 | 0 (0.0%) | 0 (0.0%) |
| $5,000 to $9,999 | 0 (0.0%) | 0 (0.0%) |
| $10,000 to $14,999 | 0 (0.0%) | 0 (0.0%) |
| $15,000 to $19,999 | 0 (0.0%) | 33 (9.5%) |
| $20,000 to $24,999 | 0 (0.0%) | 17 (4.9%) |
| $25,000 to $34,999 | 33 (15.3%) | 61 (17.5%) |
| $35,000 to $49,999 | 48 (22.2%) | 62 (17.8%) |
| $50,000 to $74,999 | 72 (33.3%) | 61 (17.5%) |
| $75,000 to $99,999 | 23 (10.6%) | 59 (16.9%) |
| $100,000 to $149,999 | 40 (18.5%) | 46 (13.2%) |
| $150,000 or more | 0 (0.0%) | 10 (2.9%) |
| Total | 216 (100.0%) | 349 (100.0%) |
Monthly Housing Cost Tiers in West Swanzey
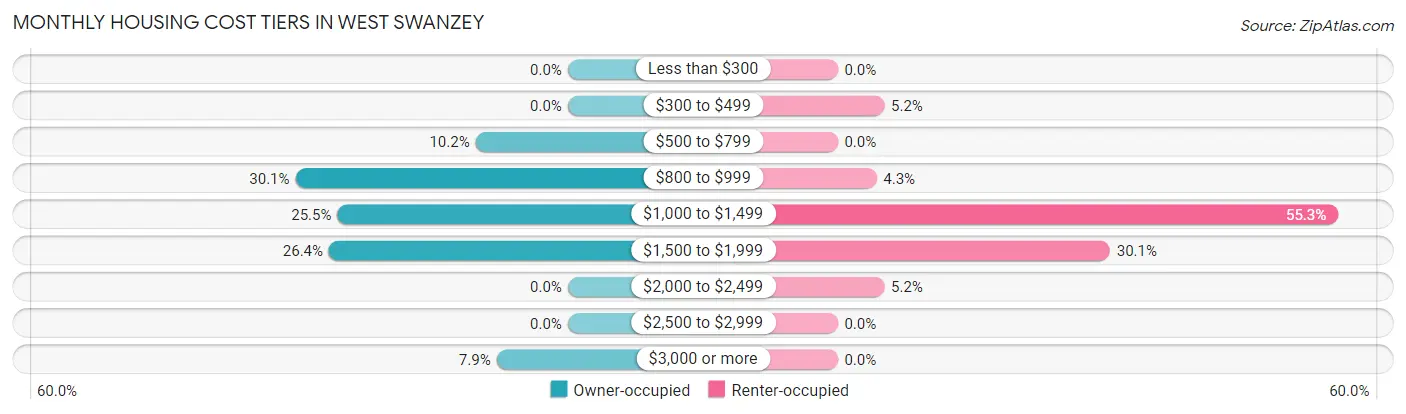
| Monthly Cost | Owner-occupied | Renter-occupied |
| Less than $300 | 0 (0.0%) | 0 (0.0%) |
| $300 to $499 | 0 (0.0%) | 18 (5.2%) |
| $500 to $799 | 22 (10.2%) | 0 (0.0%) |
| $800 to $999 | 65 (30.1%) | 15 (4.3%) |
| $1,000 to $1,499 | 55 (25.5%) | 193 (55.3%) |
| $1,500 to $1,999 | 57 (26.4%) | 105 (30.1%) |
| $2,000 to $2,499 | 0 (0.0%) | 18 (5.2%) |
| $2,500 to $2,999 | 0 (0.0%) | 0 (0.0%) |
| $3,000 or more | 17 (7.9%) | 0 (0.0%) |
| Total | 216 (100.0%) | 349 (100.0%) |
Physical Housing Characteristics in West Swanzey
Housing Structures in West Swanzey
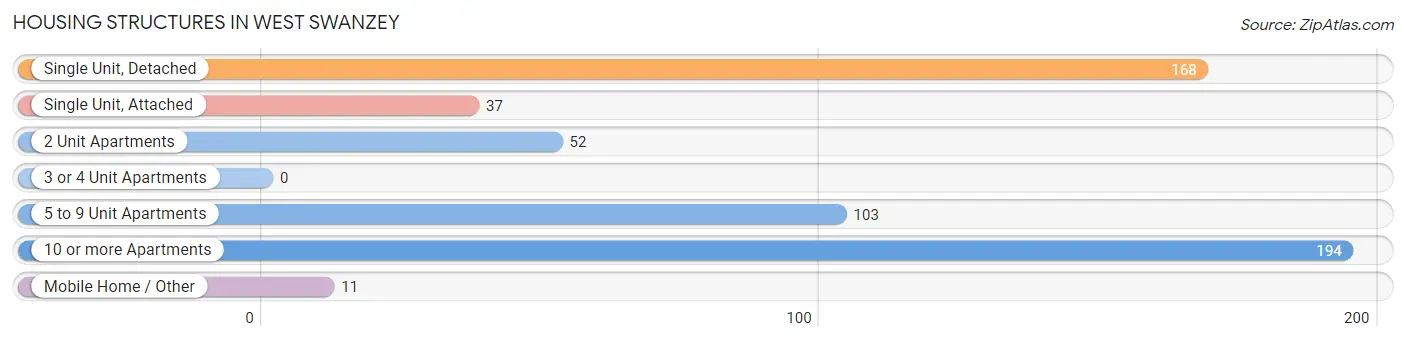
| Structure Type | # Housing Units | % Housing Units |
| Single Unit, Detached | 168 | 29.7% |
| Single Unit, Attached | 37 | 6.6% |
| 2 Unit Apartments | 52 | 9.2% |
| 3 or 4 Unit Apartments | 0 | 0.0% |
| 5 to 9 Unit Apartments | 103 | 18.2% |
| 10 or more Apartments | 194 | 34.3% |
| Mobile Home / Other | 11 | 1.9% |
| Total | 565 | 100.0% |
Housing Structures by Occupancy in West Swanzey
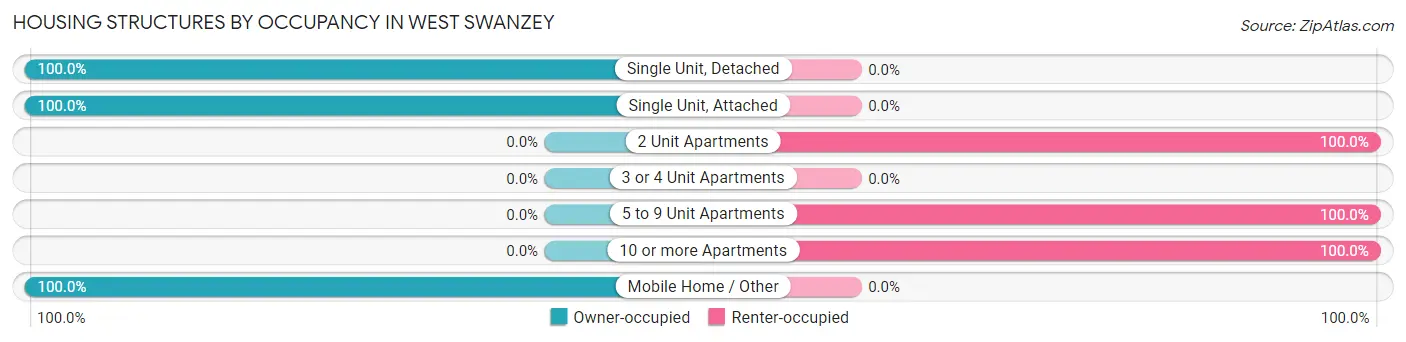
| Structure Type | Owner-occupied | Renter-occupied |
| Single Unit, Detached | 168 (100.0%) | 0 (0.0%) |
| Single Unit, Attached | 37 (100.0%) | 0 (0.0%) |
| 2 Unit Apartments | 0 (0.0%) | 52 (100.0%) |
| 3 or 4 Unit Apartments | 0 (0.0%) | 0 (0.0%) |
| 5 to 9 Unit Apartments | 0 (0.0%) | 103 (100.0%) |
| 10 or more Apartments | 0 (0.0%) | 194 (100.0%) |
| Mobile Home / Other | 11 (100.0%) | 0 (0.0%) |
| Total | 216 (38.2%) | 349 (61.8%) |
Housing Structures by Number of Rooms in West Swanzey
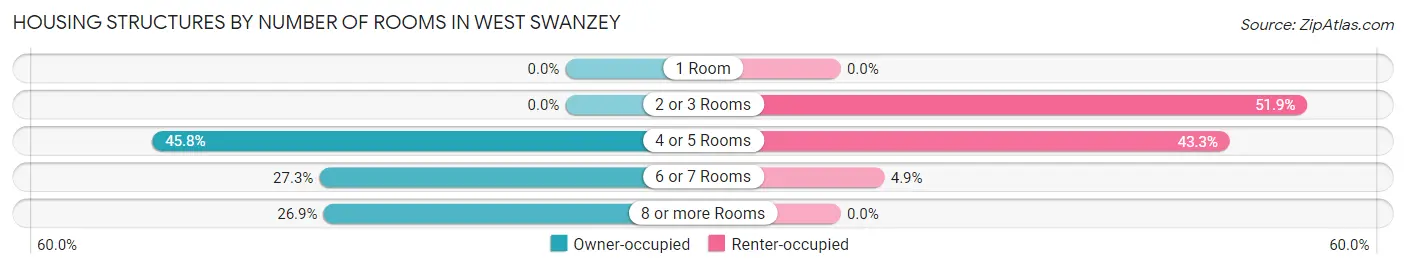
| Number of Rooms | Owner-occupied | Renter-occupied |
| 1 Room | 0 (0.0%) | 0 (0.0%) |
| 2 or 3 Rooms | 0 (0.0%) | 181 (51.9%) |
| 4 or 5 Rooms | 99 (45.8%) | 151 (43.3%) |
| 6 or 7 Rooms | 59 (27.3%) | 17 (4.9%) |
| 8 or more Rooms | 58 (26.9%) | 0 (0.0%) |
| Total | 216 (100.0%) | 349 (100.0%) |
Housing Structure by Heating Type in West Swanzey
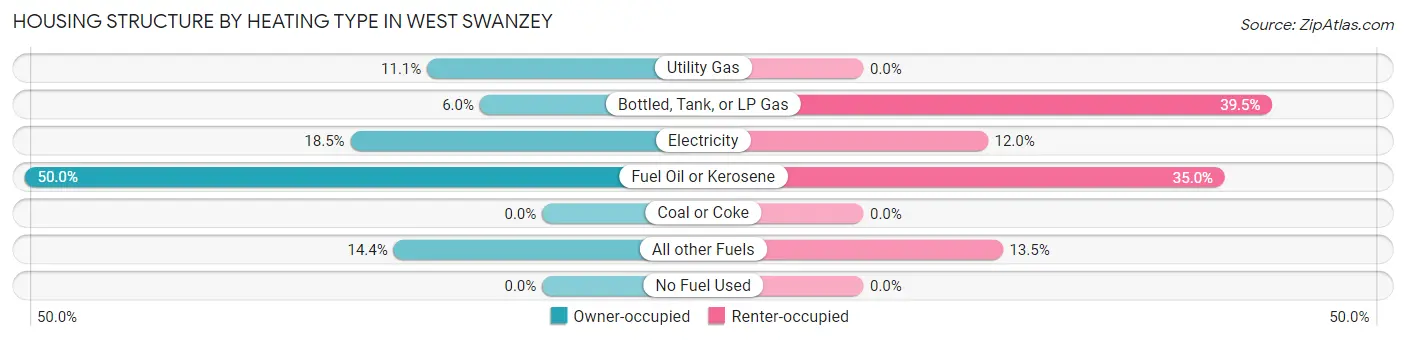
| Heating Type | Owner-occupied | Renter-occupied |
| Utility Gas | 24 (11.1%) | 0 (0.0%) |
| Bottled, Tank, or LP Gas | 13 (6.0%) | 138 (39.5%) |
| Electricity | 40 (18.5%) | 42 (12.0%) |
| Fuel Oil or Kerosene | 108 (50.0%) | 122 (35.0%) |
| Coal or Coke | 0 (0.0%) | 0 (0.0%) |
| All other Fuels | 31 (14.3%) | 47 (13.5%) |
| No Fuel Used | 0 (0.0%) | 0 (0.0%) |
| Total | 216 (100.0%) | 349 (100.0%) |
Household Vehicle Usage in West Swanzey
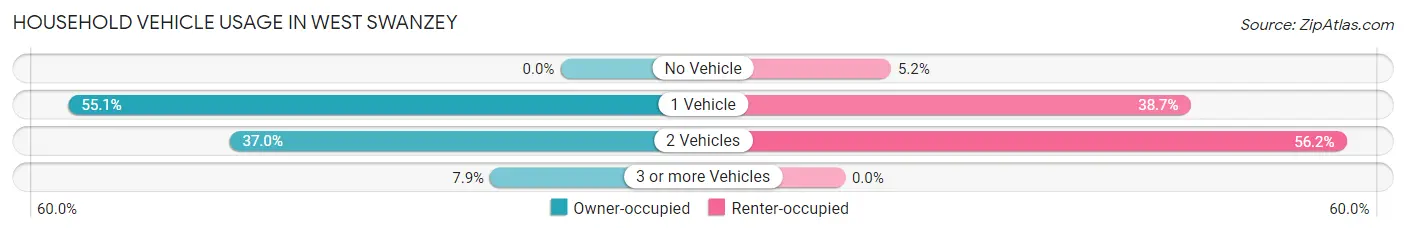
| Vehicles per Household | Owner-occupied | Renter-occupied |
| No Vehicle | 0 (0.0%) | 18 (5.2%) |
| 1 Vehicle | 119 (55.1%) | 135 (38.7%) |
| 2 Vehicles | 80 (37.0%) | 196 (56.2%) |
| 3 or more Vehicles | 17 (7.9%) | 0 (0.0%) |
| Total | 216 (100.0%) | 349 (100.0%) |
Real Estate & Mortgages in West Swanzey
Real Estate and Mortgage Overview in West Swanzey
| Characteristic | Without Mortgage | With Mortgage |
| Housing Units | 104 | 112 |
| Median Property Value | $207,300 | $180,900 |
| Median Household Income | $65,882 | $0 |
| Monthly Housing Costs | $915 | $0 |
| Real Estate Taxes | $4,686 | $0 |
Property Value by Mortgage Status in West Swanzey
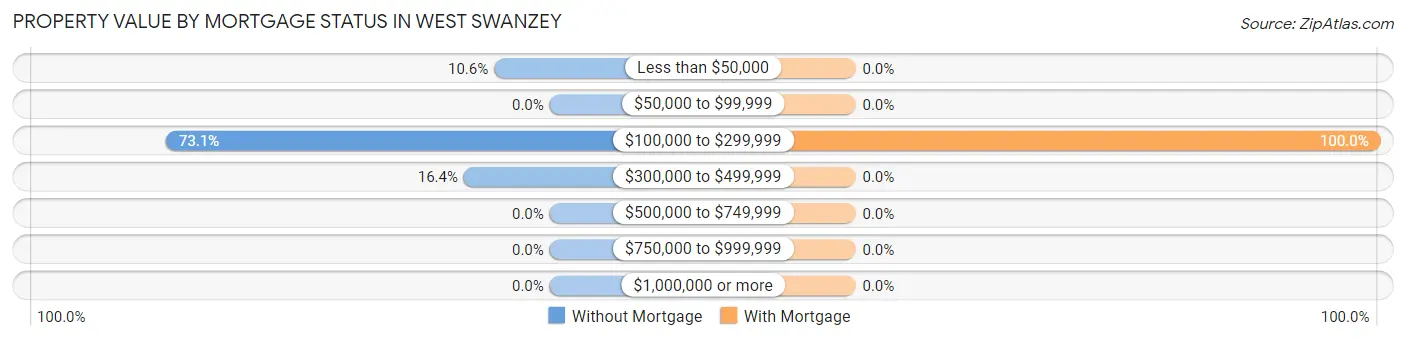
| Property Value | Without Mortgage | With Mortgage |
| Less than $50,000 | 11 (10.6%) | 0 (0.0%) |
| $50,000 to $99,999 | 0 (0.0%) | 0 (0.0%) |
| $100,000 to $299,999 | 76 (73.1%) | 112 (100.0%) |
| $300,000 to $499,999 | 17 (16.4%) | 0 (0.0%) |
| $500,000 to $749,999 | 0 (0.0%) | 0 (0.0%) |
| $750,000 to $999,999 | 0 (0.0%) | 0 (0.0%) |
| $1,000,000 or more | 0 (0.0%) | 0 (0.0%) |
| Total | 104 (100.0%) | 112 (100.0%) |
Household Income by Mortgage Status in West Swanzey
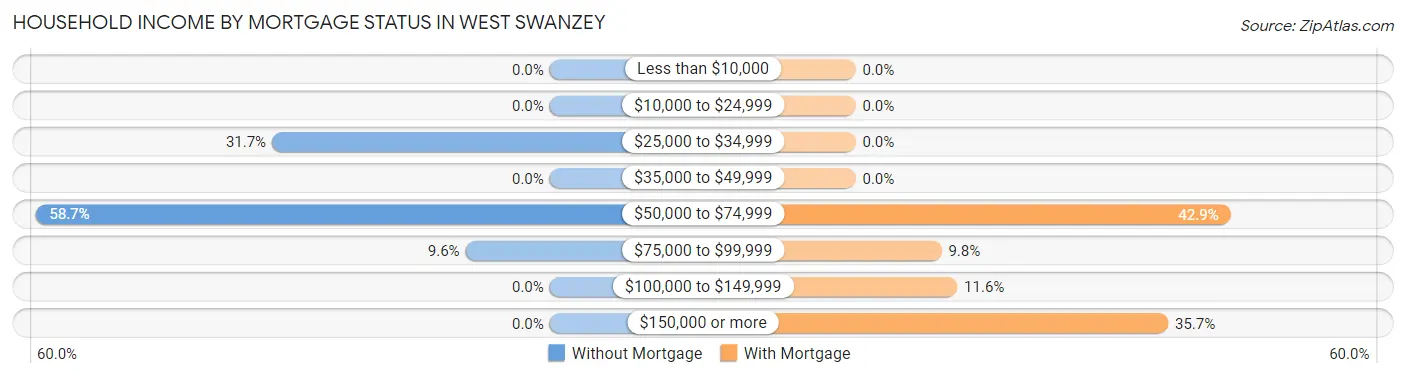
| Household Income | Without Mortgage | With Mortgage |
| Less than $10,000 | 0 (0.0%) | 0 (0.0%) |
| $10,000 to $24,999 | 0 (0.0%) | 0 (0.0%) |
| $25,000 to $34,999 | 33 (31.7%) | 0 (0.0%) |
| $35,000 to $49,999 | 0 (0.0%) | 0 (0.0%) |
| $50,000 to $74,999 | 61 (58.7%) | 48 (42.9%) |
| $75,000 to $99,999 | 10 (9.6%) | 11 (9.8%) |
| $100,000 to $149,999 | 0 (0.0%) | 13 (11.6%) |
| $150,000 or more | 0 (0.0%) | 40 (35.7%) |
| Total | 104 (100.0%) | 112 (100.0%) |
Property Value to Household Income Ratio in West Swanzey
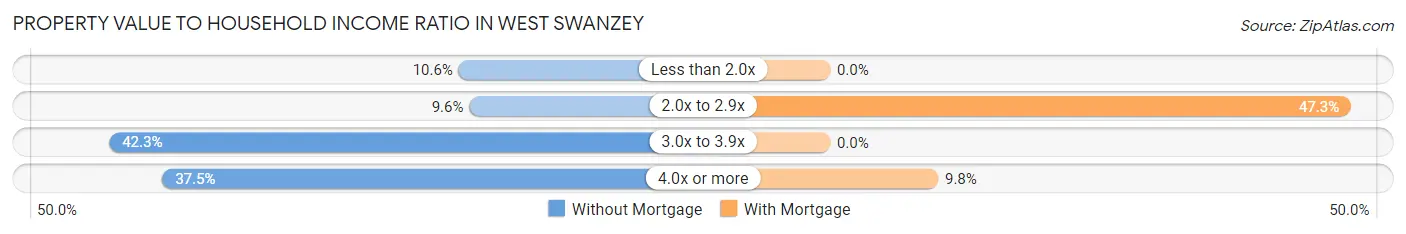
| Value-to-Income Ratio | Without Mortgage | With Mortgage |
| Less than 2.0x | 11 (10.6%) | 0 (0.0%) |
| 2.0x to 2.9x | 10 (9.6%) | 53 (47.3%) |
| 3.0x to 3.9x | 44 (42.3%) | 0 (0.0%) |
| 4.0x or more | 39 (37.5%) | 11 (9.8%) |
| Total | 104 (100.0%) | 112 (100.0%) |
Real Estate Taxes by Mortgage Status in West Swanzey
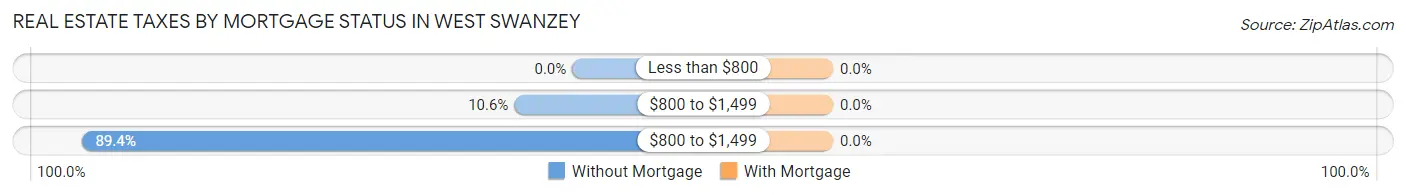
| Property Taxes | Without Mortgage | With Mortgage |
| Less than $800 | 0 (0.0%) | 0 (0.0%) |
| $800 to $1,499 | 11 (10.6%) | 0 (0.0%) |
| $800 to $1,499 | 93 (89.4%) | 0 (0.0%) |
| Total | 104 (100.0%) | 112 (100.0%) |
Health & Disability in West Swanzey
Health Insurance Coverage by Age in West Swanzey
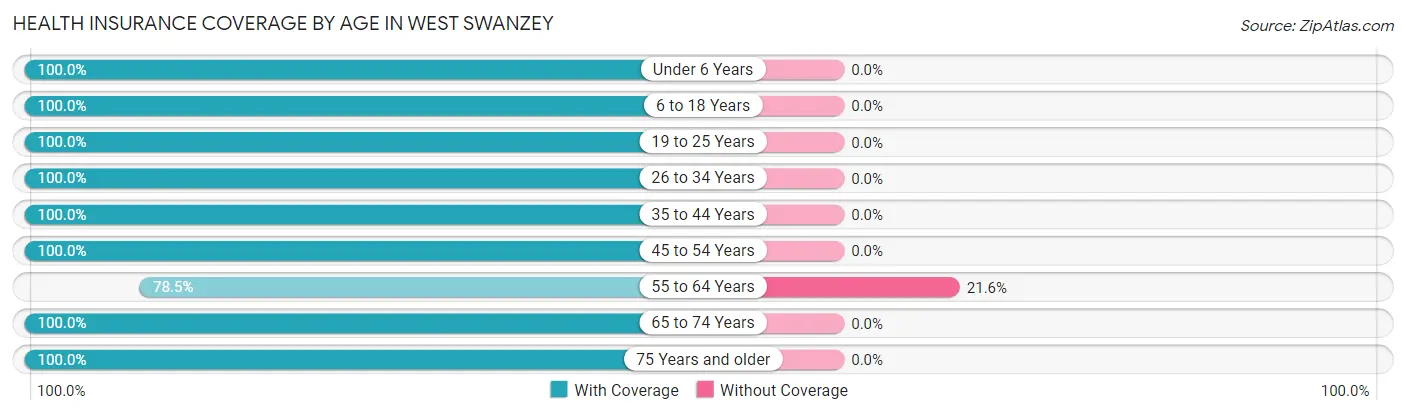
| Age Bracket | With Coverage | Without Coverage |
| Under 6 Years | 167 (100.0%) | 0 (0.0%) |
| 6 to 18 Years | 144 (100.0%) | 0 (0.0%) |
| 19 to 25 Years | 51 (100.0%) | 0 (0.0%) |
| 26 to 34 Years | 215 (100.0%) | 0 (0.0%) |
| 35 to 44 Years | 102 (100.0%) | 0 (0.0%) |
| 45 to 54 Years | 61 (100.0%) | 0 (0.0%) |
| 55 to 64 Years | 142 (78.4%) | 39 (21.5%) |
| 65 to 74 Years | 138 (100.0%) | 0 (0.0%) |
| 75 Years and older | 141 (100.0%) | 0 (0.0%) |
| Total | 1,161 (96.8%) | 39 (3.3%) |
Health Insurance Coverage by Citizenship Status in West Swanzey
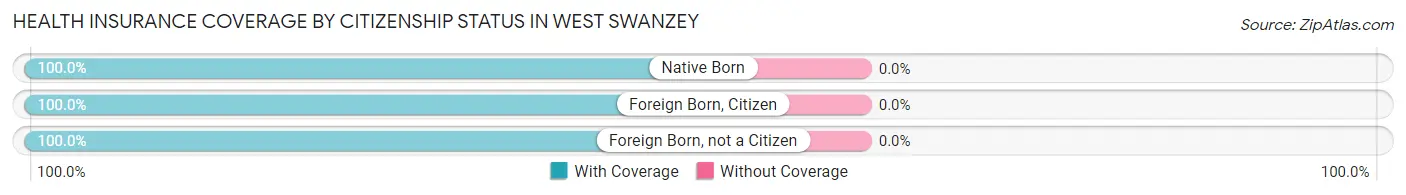
| Citizenship Status | With Coverage | Without Coverage |
| Native Born | 167 (100.0%) | 0 (0.0%) |
| Foreign Born, Citizen | 144 (100.0%) | 0 (0.0%) |
| Foreign Born, not a Citizen | 51 (100.0%) | 0 (0.0%) |
Health Insurance Coverage by Household Income in West Swanzey
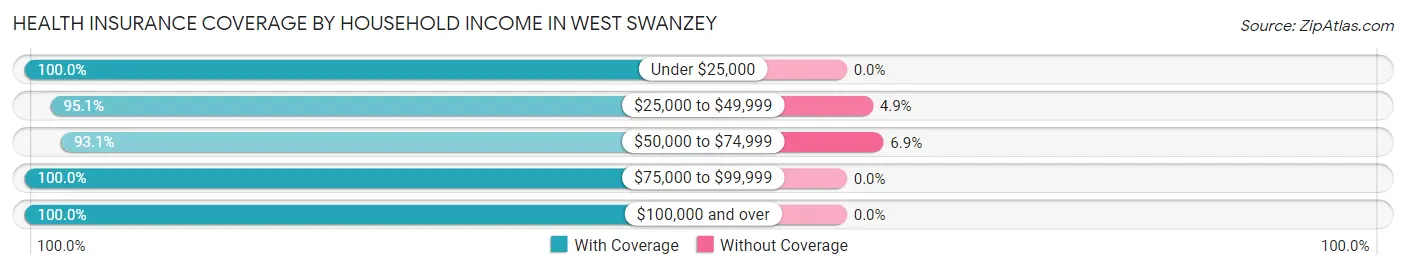
| Household Income | With Coverage | Without Coverage |
| Under $25,000 | 80 (100.0%) | 0 (0.0%) |
| $25,000 to $49,999 | 390 (95.1%) | 20 (4.9%) |
| $50,000 to $74,999 | 258 (93.1%) | 19 (6.9%) |
| $75,000 to $99,999 | 145 (100.0%) | 0 (0.0%) |
| $100,000 and over | 288 (100.0%) | 0 (0.0%) |
Public vs Private Health Insurance Coverage by Age in West Swanzey
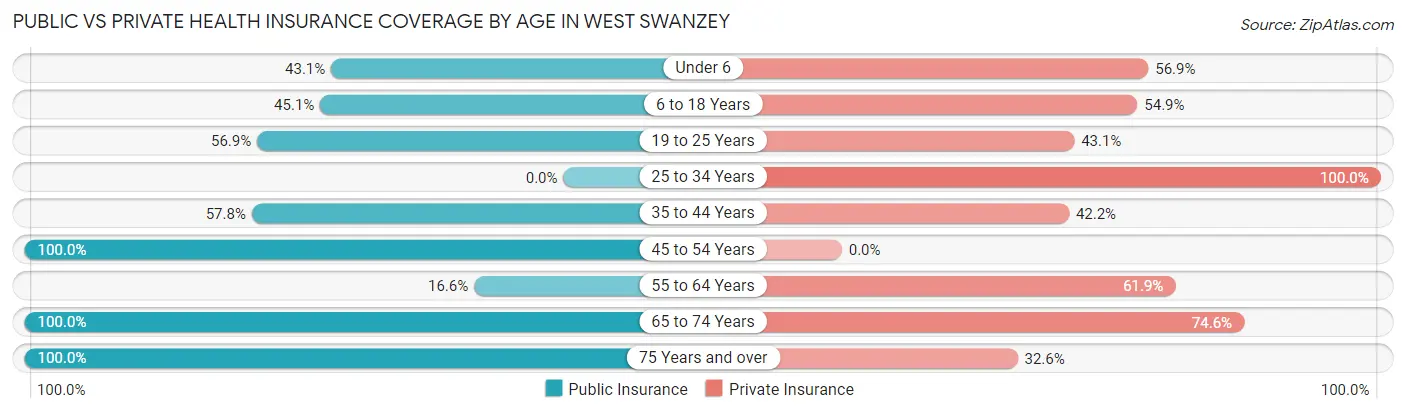
| Age Bracket | Public Insurance | Private Insurance |
| Under 6 | 72 (43.1%) | 95 (56.9%) |
| 6 to 18 Years | 65 (45.1%) | 79 (54.9%) |
| 19 to 25 Years | 29 (56.9%) | 22 (43.1%) |
| 25 to 34 Years | 0 (0.0%) | 215 (100.0%) |
| 35 to 44 Years | 59 (57.8%) | 43 (42.2%) |
| 45 to 54 Years | 61 (100.0%) | 0 (0.0%) |
| 55 to 64 Years | 30 (16.6%) | 112 (61.9%) |
| 65 to 74 Years | 138 (100.0%) | 103 (74.6%) |
| 75 Years and over | 141 (100.0%) | 46 (32.6%) |
| Total | 595 (49.6%) | 715 (59.6%) |
Disability Status by Sex by Age in West Swanzey
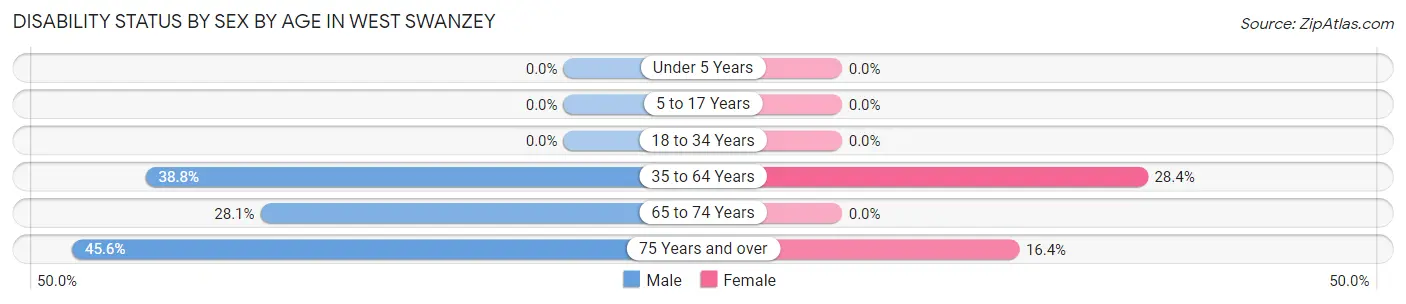
| Age Bracket | Male | Female |
| Under 5 Years | 0 (0.0%) | 0 (0.0%) |
| 5 to 17 Years | 0 (0.0%) | 0 (0.0%) |
| 18 to 34 Years | 0 (0.0%) | 0 (0.0%) |
| 35 to 64 Years | 50 (38.8%) | 61 (28.4%) |
| 65 to 74 Years | 18 (28.1%) | 0 (0.0%) |
| 75 Years and over | 31 (45.6%) | 12 (16.4%) |
Disability Class by Sex by Age in West Swanzey
Disability Class: Hearing Difficulty
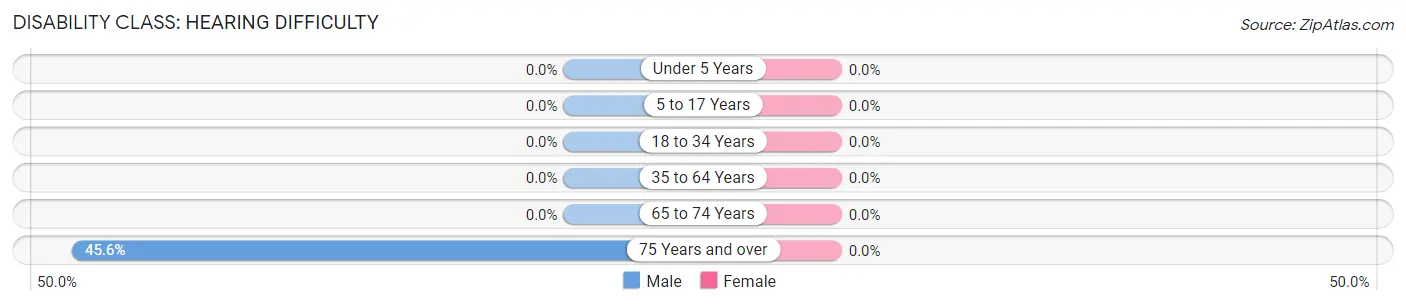
| Age Bracket | Male | Female |
| Under 5 Years | 0 (0.0%) | 0 (0.0%) |
| 5 to 17 Years | 0 (0.0%) | 0 (0.0%) |
| 18 to 34 Years | 0 (0.0%) | 0 (0.0%) |
| 35 to 64 Years | 0 (0.0%) | 0 (0.0%) |
| 65 to 74 Years | 0 (0.0%) | 0 (0.0%) |
| 75 Years and over | 31 (45.6%) | 0 (0.0%) |
Disability Class: Vision Difficulty
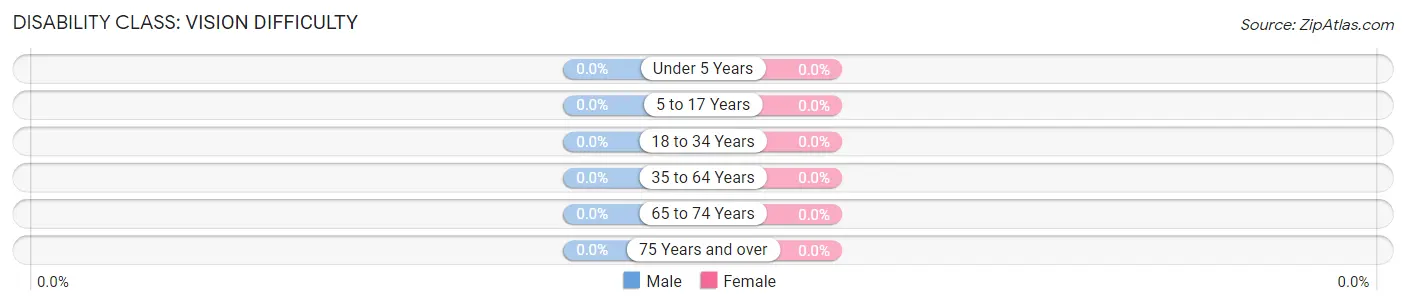
| Age Bracket | Male | Female |
| Under 5 Years | 0 (0.0%) | 0 (0.0%) |
| 5 to 17 Years | 0 (0.0%) | 0 (0.0%) |
| 18 to 34 Years | 0 (0.0%) | 0 (0.0%) |
| 35 to 64 Years | 0 (0.0%) | 0 (0.0%) |
| 65 to 74 Years | 0 (0.0%) | 0 (0.0%) |
| 75 Years and over | 0 (0.0%) | 0 (0.0%) |
Disability Class: Cognitive Difficulty
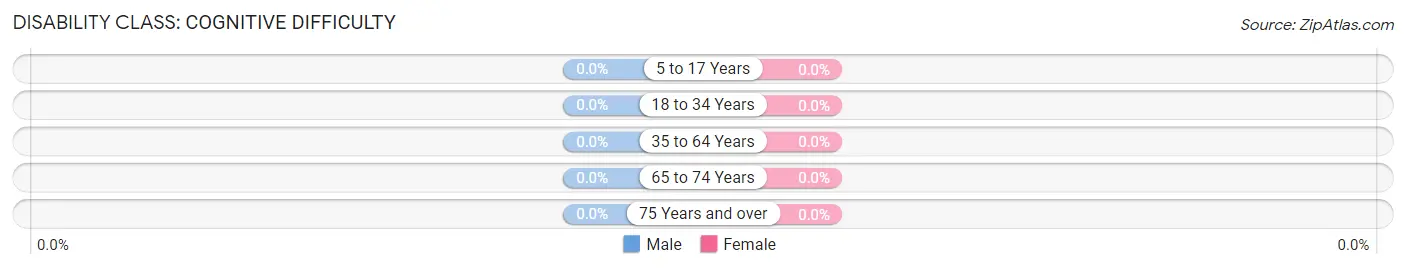
| Age Bracket | Male | Female |
| 5 to 17 Years | 0 (0.0%) | 0 (0.0%) |
| 18 to 34 Years | 0 (0.0%) | 0 (0.0%) |
| 35 to 64 Years | 0 (0.0%) | 0 (0.0%) |
| 65 to 74 Years | 0 (0.0%) | 0 (0.0%) |
| 75 Years and over | 0 (0.0%) | 0 (0.0%) |
Disability Class: Ambulatory Difficulty
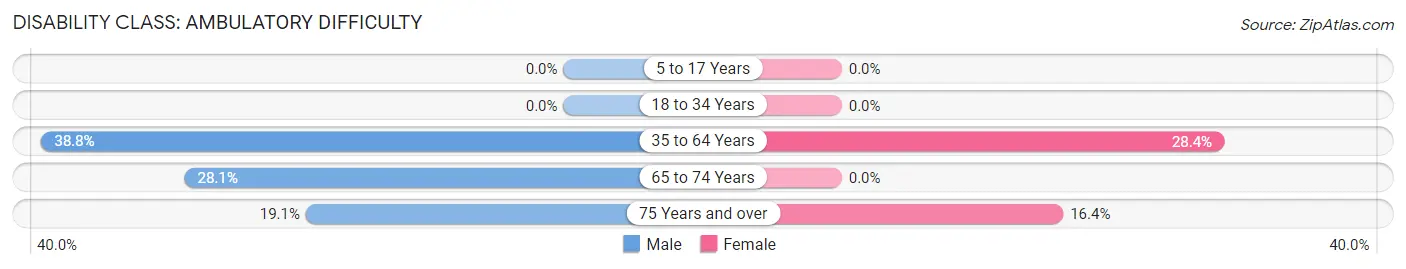
| Age Bracket | Male | Female |
| 5 to 17 Years | 0 (0.0%) | 0 (0.0%) |
| 18 to 34 Years | 0 (0.0%) | 0 (0.0%) |
| 35 to 64 Years | 50 (38.8%) | 61 (28.4%) |
| 65 to 74 Years | 18 (28.1%) | 0 (0.0%) |
| 75 Years and over | 13 (19.1%) | 12 (16.4%) |
Disability Class: Self-Care Difficulty
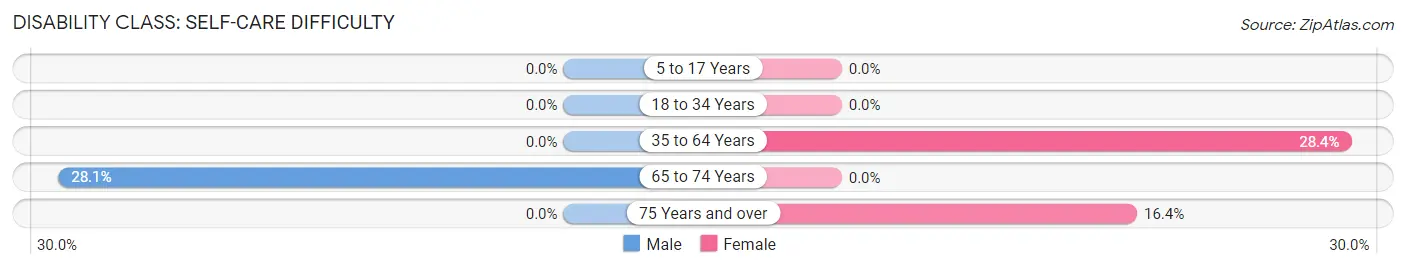
| Age Bracket | Male | Female |
| 5 to 17 Years | 0 (0.0%) | 0 (0.0%) |
| 18 to 34 Years | 0 (0.0%) | 0 (0.0%) |
| 35 to 64 Years | 0 (0.0%) | 61 (28.4%) |
| 65 to 74 Years | 18 (28.1%) | 0 (0.0%) |
| 75 Years and over | 0 (0.0%) | 12 (16.4%) |
Technology Access in West Swanzey
Computing Device Access in West Swanzey
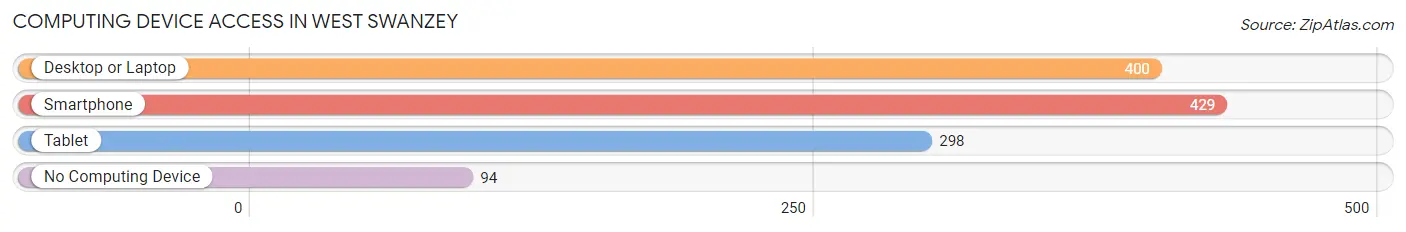
| Device Type | # Households | % Households |
| Desktop or Laptop | 400 | 70.8% |
| Smartphone | 429 | 75.9% |
| Tablet | 298 | 52.7% |
| No Computing Device | 94 | 16.6% |
| Total | 565 | 100.0% |
Internet Access in West Swanzey
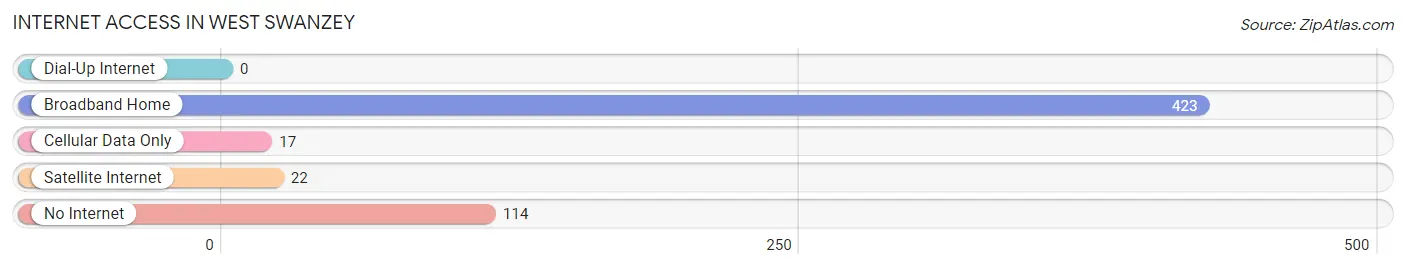
| Internet Type | # Households | % Households |
| Dial-Up Internet | 0 | 0.0% |
| Broadband Home | 423 | 74.9% |
| Cellular Data Only | 17 | 3.0% |
| Satellite Internet | 22 | 3.9% |
| No Internet | 114 | 20.2% |
| Total | 565 | 100.0% |
West Swanzey Summary
Swanzey is a town located in Cheshire County, New Hampshire, United States. The population was 6,819 at the 2010 census. It is situated in the southwestern corner of the state, along the Connecticut River, which forms the state boundary with Vermont.
History
Swanzey was first settled in 1734 by a group of settlers from Massachusetts. The town was originally part of the town of Keene, and was known as West Keene. In 1753, the town was incorporated as West Swanzey, and in 1764, the name was changed to Swanzey.
The town was an important center of industry in the 19th century, with several mills located along the Connecticut River. The town was also home to several iron foundries, which produced a variety of products, including stoves, tools, and farm implements.
Geography
Swanzey is located in southwestern New Hampshire, in the Connecticut River Valley. The town is bordered to the north by the town of Keene, to the east by the town of Troy, to the south by the town of Winchester, and to the west by the state of Vermont.
The town is located at the confluence of the Ashuelot and Connecticut Rivers. The town is located in the Monadnock Region of New Hampshire, and is part of the Connecticut River Valley National Heritage Area.
The town has a total area of 33.2 square miles, of which 32.9 square miles is land and 0.3 square miles is water. The highest point in the town is the summit of Mount Monadnock, which has an elevation of 3,165 feet.
Economy
Swanzey is a rural town, and the economy is largely based on agriculture and tourism. The town is home to several small businesses, including a number of antique shops, a winery, and a brewery.
The town is also home to several manufacturing companies, including a paper mill, a plastics manufacturer, and a machine shop. The town is also home to a number of small farms, which produce a variety of products, including dairy, beef, and vegetables.
Demographics
As of the 2010 census, there were 6,819 people, 2,717 households, and 1,845 families residing in the town. The population density was 207.7 people per square mile. There were 2,945 housing units, of which 2,717 were occupied.
The racial makeup of the town was 97.2% White, 0.5% African American, 0.3% Native American, 0.4% Asian, 0.1% Pacific Islander, 0.3% from other races, and 1.2% from two or more races. Hispanic or Latino of any race were 1.2% of the population.
The median age in the town was 43.2 years. 22.2% of residents were under the age of 18; 6.7% were between the ages of 18 and 24; 22.7% were from 25 to 44; 33.2% were from 45 to 64; and 15.2% were 65 years of age or older. The gender makeup of the town was 48.7% male and 51.3% female.
The median income for a household in the town was $50,902, and the median income for a family was $60,902. The per capita income for the town was $25,902. About 6.2% of families and 8.2% of the population were below the poverty line, including 10.2% of those under age 18 and 5.2% of those age 65 or over.
Common Questions
What is Per Capita Income in West Swanzey?
Per Capita income in West Swanzey is $29,273.
What is the Median Family Income in West Swanzey?
Median Family Income in West Swanzey is $65,071.
What is the Median Household income in West Swanzey?
Median Household Income in West Swanzey is $57,762.
What is Inequality or Gini Index in West Swanzey?
Inequality or Gini Index in West Swanzey is 0.30.
What is the Total Population of West Swanzey?
Total Population of West Swanzey is 1,200.
What is the Total Male Population of West Swanzey?
Total Male Population of West Swanzey is 506.
What is the Total Female Population of West Swanzey?
Total Female Population of West Swanzey is 694.
What is the Ratio of Males per 100 Females in West Swanzey?
There are 72.91 Males per 100 Females in West Swanzey.
What is the Ratio of Females per 100 Males in West Swanzey?
There are 137.15 Females per 100 Males in West Swanzey.
What is the Median Population Age in West Swanzey?
Median Population Age in West Swanzey is 38.5 Years.
What is the Average Family Size in West Swanzey
Average Family Size in West Swanzey is 2.7 People.
What is the Average Household Size in West Swanzey
Average Household Size in West Swanzey is 2.1 People.
How Large is the Labor Force in West Swanzey?
There are 534 People in the Labor Forcein in West Swanzey.
What is the Percentage of People in the Labor Force in West Swanzey?
60.1% of People are in the Labor Force in West Swanzey.
What is the Unemployment Rate in West Swanzey?
Unemployment Rate in West Swanzey is 5.4%.