Charlestown, NH Map & Demographics
Charlestown Map
Charlestown Overview
$28,258
PER CAPITA INCOME
0.63
INEQUALITY / GINI INDEX
934
TOTAL POPULATION
450
MALE POPULATION
484
FEMALE POPULATION
92.98
MALES / 100 FEMALES
107.56
FEMALES / 100 MALES
38.0
MEDIAN AGE
2.9
AVG FAMILY SIZE
2.1
AVG HOUSEHOLD SIZE
278
LABOR FORCE [ PEOPLE ]
40.0%
PERCENT IN LABOR FORCE
Charlestown Zip Codes
Charlestown Area Codes
Income in Charlestown
Income Overview in Charlestown
| Characteristic | Number | Measure |
| Per Capita Income | 934 | $28,258 |
| Median Family Income | 227 | $0 |
| Mean Family Income | 227 | $81,953 |
| Median Household Income | 443 | $0 |
| Mean Household Income | 443 | $55,325 |
| Income Deficit | 227 | $0 |
| Wage / Income Gap (%) | 934 | 0.00% |
| Wage / Income Gap ($) | 934 | 100.00¢ per $1 |
| Gini / Inequality Index | 934 | 0.63 |
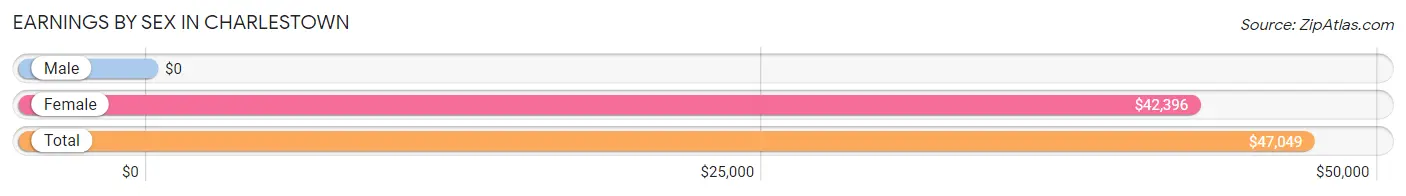
Earnings by Sex in Charlestown
| Sex | Number | Average Earnings |
| Male | 119 (42.6%) | $0 |
| Female | 160 (57.4%) | $42,396 |
| Total | 279 (100.0%) | $47,049 |
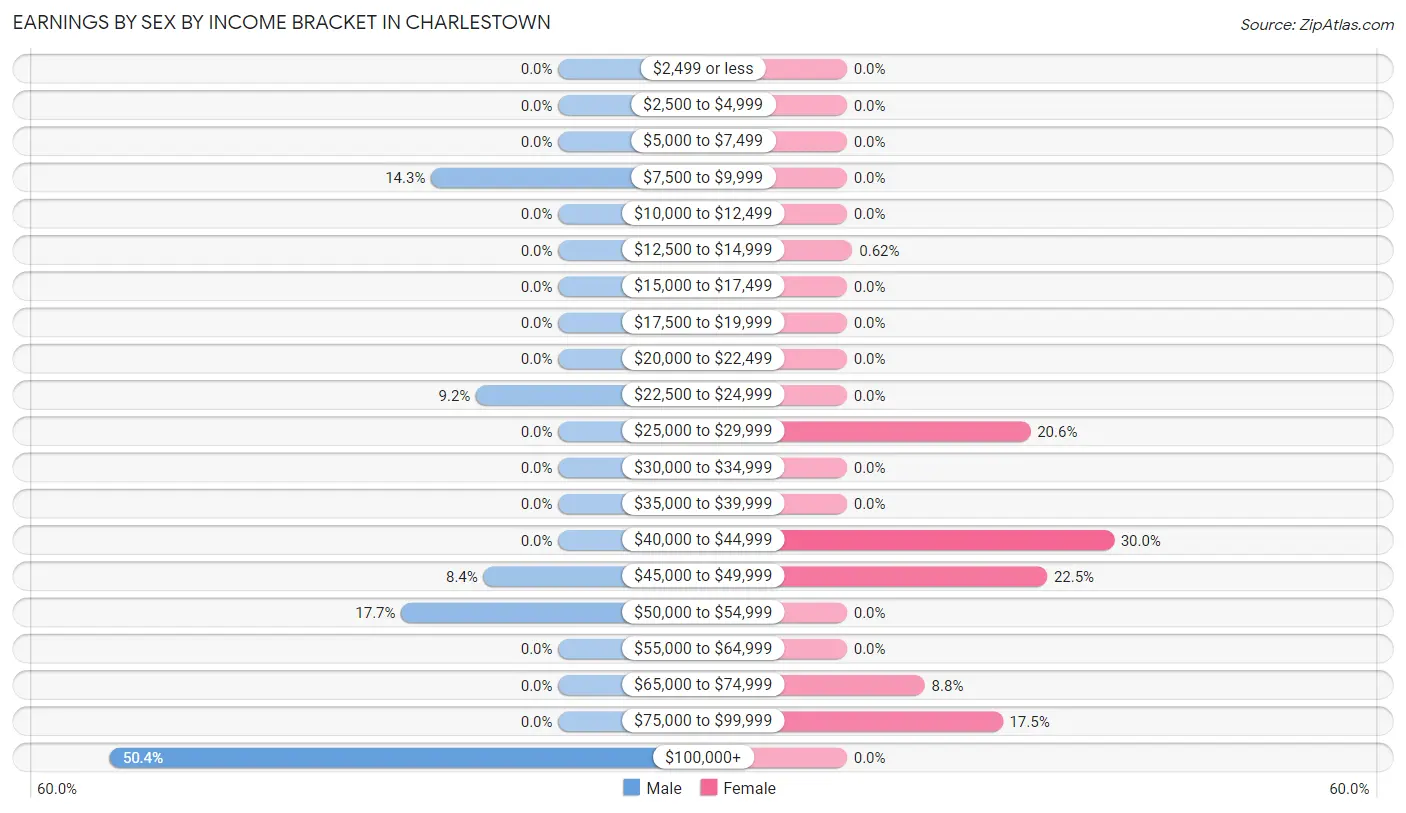
Earnings by Sex by Income Bracket in Charlestown
The most common earnings brackets in Charlestown are $100,000+ for men (60 | 50.4%) and $40,000 to $44,999 for women (48 | 30.0%).
| Income | Male | Female |
| $2,499 or less | 0 (0.0%) | 0 (0.0%) |
| $2,500 to $4,999 | 0 (0.0%) | 0 (0.0%) |
| $5,000 to $7,499 | 0 (0.0%) | 0 (0.0%) |
| $7,500 to $9,999 | 17 (14.3%) | 0 (0.0%) |
| $10,000 to $12,499 | 0 (0.0%) | 0 (0.0%) |
| $12,500 to $14,999 | 0 (0.0%) | 1 (0.6%) |
| $15,000 to $17,499 | 0 (0.0%) | 0 (0.0%) |
| $17,500 to $19,999 | 0 (0.0%) | 0 (0.0%) |
| $20,000 to $22,499 | 0 (0.0%) | 0 (0.0%) |
| $22,500 to $24,999 | 11 (9.2%) | 0 (0.0%) |
| $25,000 to $29,999 | 0 (0.0%) | 33 (20.6%) |
| $30,000 to $34,999 | 0 (0.0%) | 0 (0.0%) |
| $35,000 to $39,999 | 0 (0.0%) | 0 (0.0%) |
| $40,000 to $44,999 | 0 (0.0%) | 48 (30.0%) |
| $45,000 to $49,999 | 10 (8.4%) | 36 (22.5%) |
| $50,000 to $54,999 | 21 (17.6%) | 0 (0.0%) |
| $55,000 to $64,999 | 0 (0.0%) | 0 (0.0%) |
| $65,000 to $74,999 | 0 (0.0%) | 14 (8.7%) |
| $75,000 to $99,999 | 0 (0.0%) | 28 (17.5%) |
| $100,000+ | 60 (50.4%) | 0 (0.0%) |
| Total | 119 (100.0%) | 160 (100.0%) |
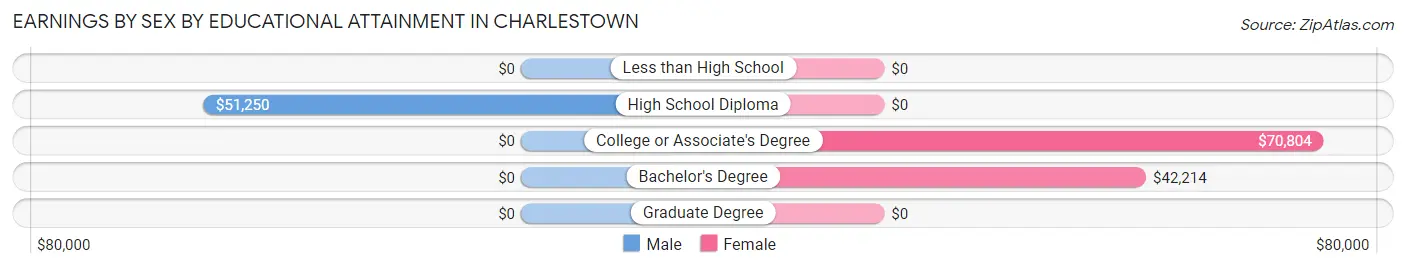
Earnings by Sex by Educational Attainment in Charlestown
| Educational Attainment | Male Income | Female Income |
| Less than High School | - | - |
| High School Diploma | $51,250 | $0 |
| College or Associate's Degree | - | - |
| Bachelor's Degree | - | - |
| Graduate Degree | - | - |
| Total | - | - |
Family Income in Charlestown
Family Income Brackets in Charlestown
According to the Charlestown family income data, there are 69 families falling into the $100,000 to $149,999 income range, which is the most common income bracket and makes up 30.4% of all families.
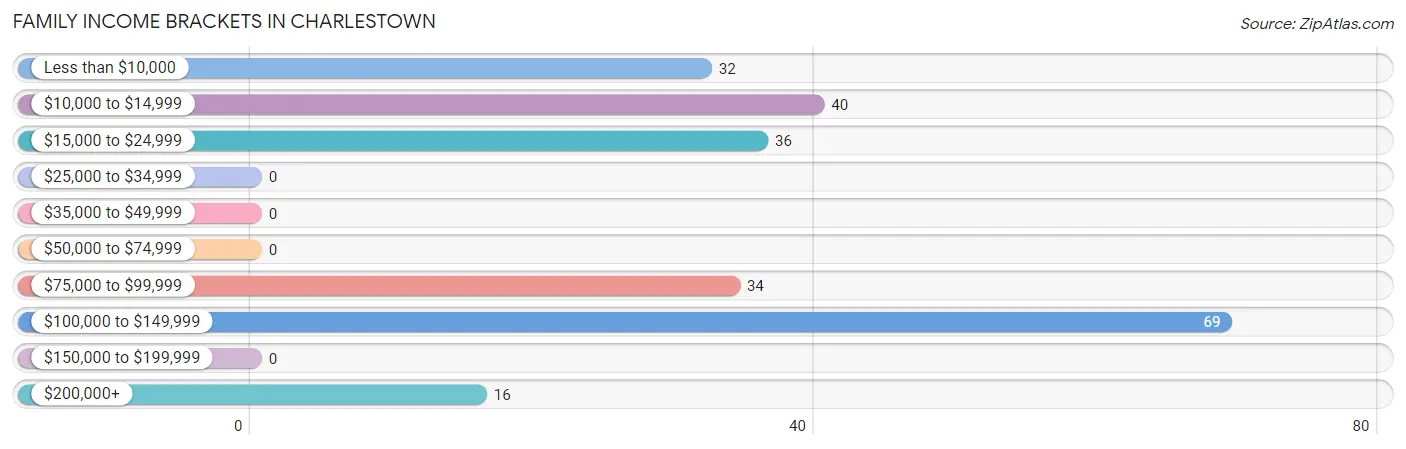
| Income Bracket | # Families | % Families |
| Less than $10,000 | 32 | 14.1% |
| $10,000 to $14,999 | 40 | 17.6% |
| $15,000 to $24,999 | 36 | 15.9% |
| $25,000 to $34,999 | 0 | 0.0% |
| $35,000 to $49,999 | 0 | 0.0% |
| $50,000 to $74,999 | 0 | 0.0% |
| $75,000 to $99,999 | 34 | 15.0% |
| $100,000 to $149,999 | 69 | 30.4% |
| $150,000 to $199,999 | 0 | 0.0% |
| $200,000+ | 16 | 7.0% |
Family Income by Famaliy Size in Charlestown
| Income Bracket | # Families | Median Income |
| 2-Person Families | 156 (68.7%) | $0 |
| 3-Person Families | 17 (7.5%) | $0 |
| 4-Person Families | 40 (17.6%) | $0 |
| 5-Person Families | 14 (6.2%) | $0 |
| 6-Person Families | 0 (0.0%) | $0 |
| 7+ Person Families | 0 (0.0%) | $0 |
| Total | 227 (100.0%) | $0 |
Family Income by Number of Earners in Charlestown
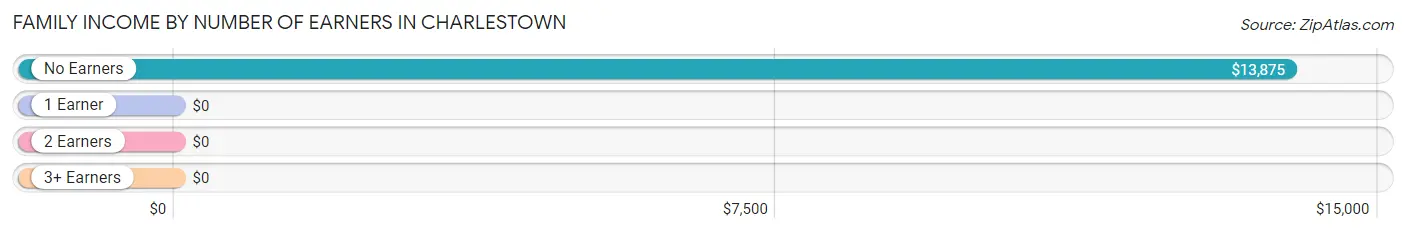
| Number of Earners | # Families | Median Income |
| No Earners | 108 (47.6%) | $13,875 |
| 1 Earner | 41 (18.1%) | $0 |
| 2 Earners | 61 (26.9%) | $0 |
| 3+ Earners | 17 (7.5%) | $0 |
| Total | 227 (100.0%) | $0 |
Household Income in Charlestown
Household Income Brackets in Charlestown
With 97 households falling in the category, the $10,000 to $14,999 income range is the most frequent in Charlestown, accounting for 21.9% of all households.
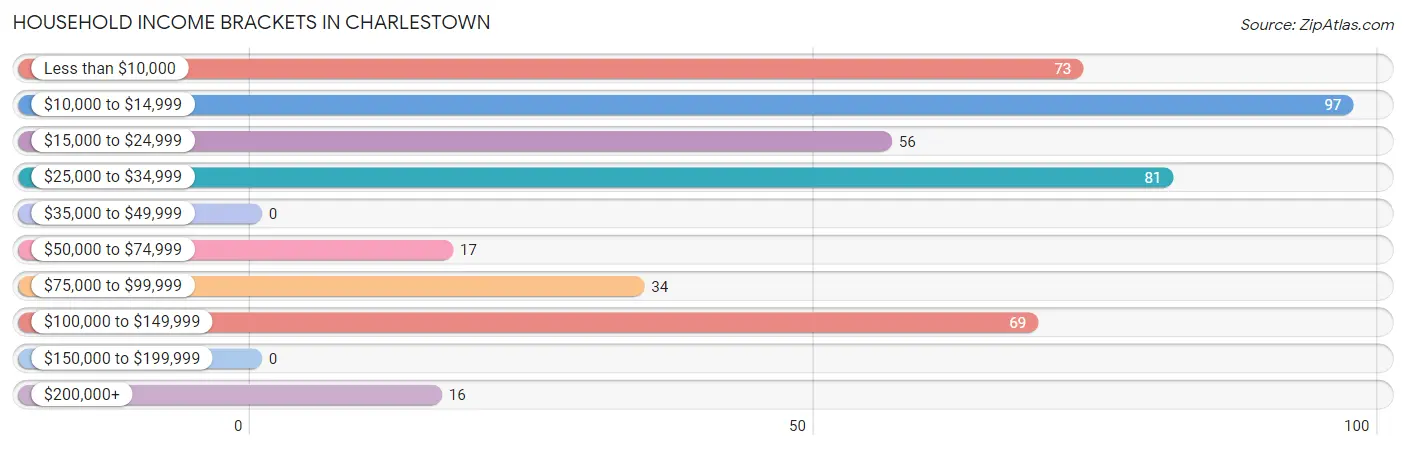
| Income Bracket | # Households | % Households |
| Less than $10,000 | 73 | 16.5% |
| $10,000 to $14,999 | 97 | 21.9% |
| $15,000 to $24,999 | 56 | 12.6% |
| $25,000 to $34,999 | 81 | 18.3% |
| $35,000 to $49,999 | 0 | 0.0% |
| $50,000 to $74,999 | 17 | 3.8% |
| $75,000 to $99,999 | 34 | 7.7% |
| $100,000 to $149,999 | 69 | 15.6% |
| $150,000 to $199,999 | 0 | 0.0% |
| $200,000+ | 16 | 3.6% |
Household Income by Householder Age in Charlestown
The median household income in Charlestown is $0, with the highest median household income of $29,000 found in the 65+ years age bracket for the primary householder. A total of 154 households (34.8%) fall into this category.
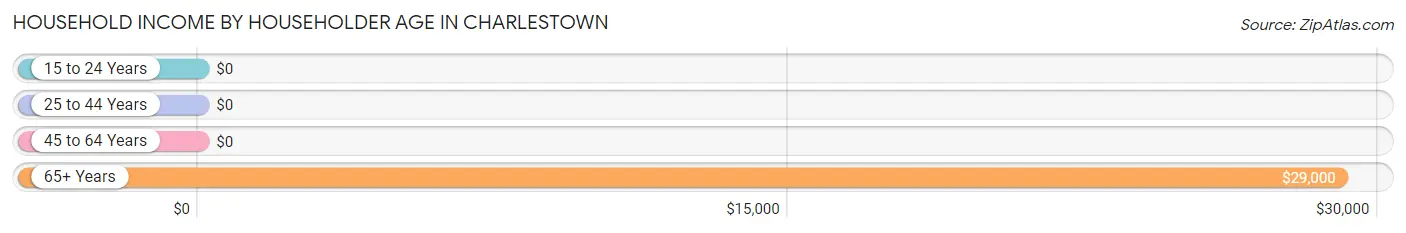
| Income Bracket | # Households | Median Income |
| 15 to 24 Years | 0 (0.0%) | $0 |
| 25 to 44 Years | 179 (40.4%) | $0 |
| 45 to 64 Years | 110 (24.8%) | $0 |
| 65+ Years | 154 (34.8%) | $29,000 |
| Total | 443 (100.0%) | $0 |
Poverty in Charlestown
Income Below Poverty by Sex and Age in Charlestown
With 49.2% poverty level for males and 25.4% for females among the residents of Charlestown, under 5 year old males and 6 to 11 year old females are the most vulnerable to poverty, with 92 males (100.0%) and 47 females (77.0%) in their respective age groups living below the poverty level.
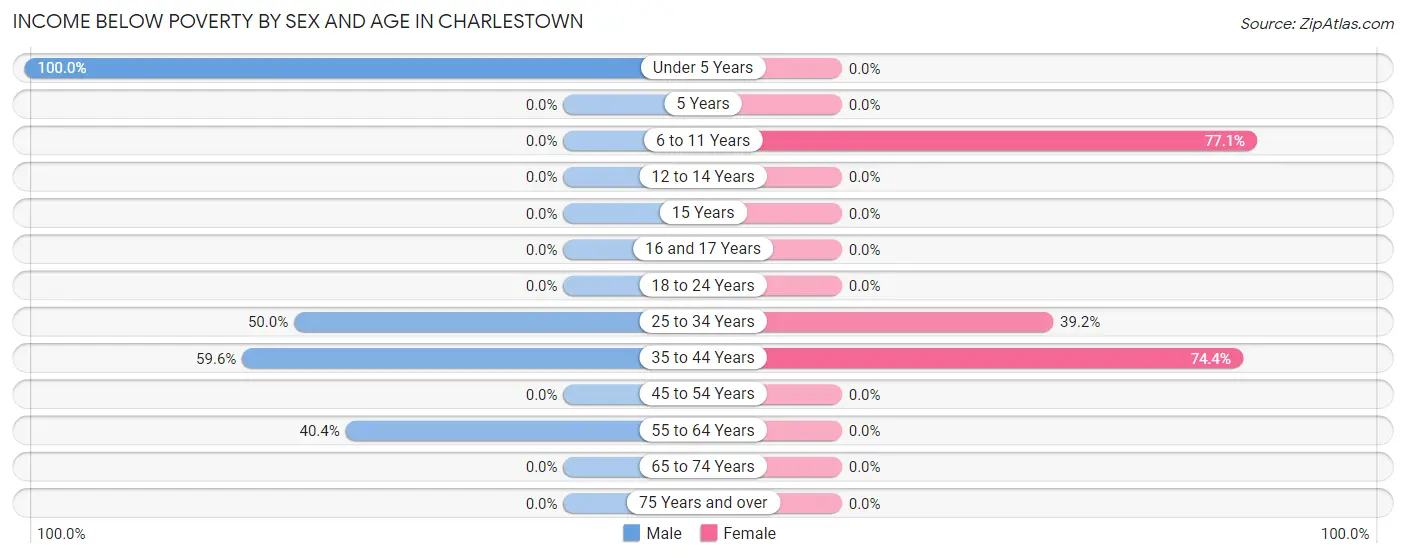
| Age Bracket | Male | Female |
| Under 5 Years | 92 (100.0%) | 0 (0.0%) |
| 5 Years | 0 (0.0%) | 0 (0.0%) |
| 6 to 11 Years | 0 (0.0%) | 47 (77.0%) |
| 12 to 14 Years | 0 (0.0%) | 0 (0.0%) |
| 15 Years | 0 (0.0%) | 0 (0.0%) |
| 16 and 17 Years | 0 (0.0%) | 0 (0.0%) |
| 18 to 24 Years | 0 (0.0%) | 0 (0.0%) |
| 25 to 34 Years | 41 (50.0%) | 40 (39.2%) |
| 35 to 44 Years | 31 (59.6%) | 32 (74.4%) |
| 45 to 54 Years | 0 (0.0%) | 0 (0.0%) |
| 55 to 64 Years | 57 (40.4%) | 0 (0.0%) |
| 65 to 74 Years | 0 (0.0%) | 0 (0.0%) |
| 75 Years and over | 0 (0.0%) | 0 (0.0%) |
| Total | 221 (49.2%) | 119 (25.4%) |
Income Above Poverty by Sex and Age in Charlestown
According to the poverty statistics in Charlestown, males aged 65 to 74 years and females aged 5 years are the age groups that are most secure financially, with 100.0% of males and 100.0% of females in these age groups living above the poverty line.
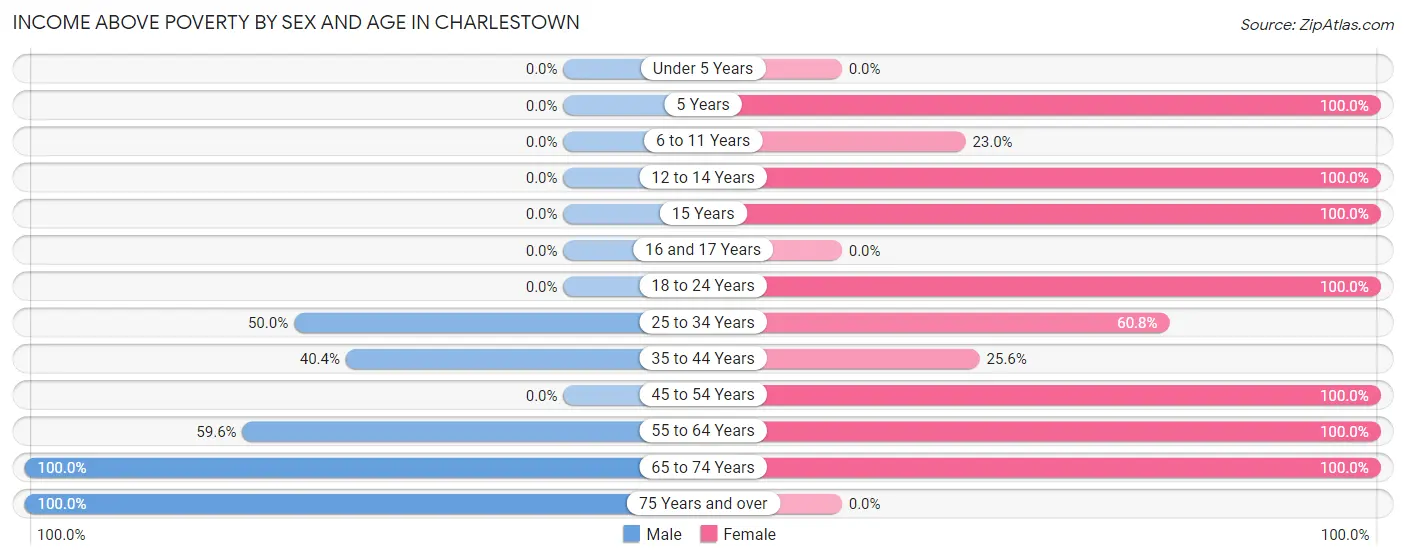
| Age Bracket | Male | Female |
| Under 5 Years | 0 (0.0%) | 0 (0.0%) |
| 5 Years | 0 (0.0%) | 59 (100.0%) |
| 6 to 11 Years | 0 (0.0%) | 14 (23.0%) |
| 12 to 14 Years | 0 (0.0%) | 15 (100.0%) |
| 15 Years | 0 (0.0%) | 12 (100.0%) |
| 16 and 17 Years | 0 (0.0%) | 0 (0.0%) |
| 18 to 24 Years | 0 (0.0%) | 33 (100.0%) |
| 25 to 34 Years | 41 (50.0%) | 62 (60.8%) |
| 35 to 44 Years | 21 (40.4%) | 11 (25.6%) |
| 45 to 54 Years | 0 (0.0%) | 37 (100.0%) |
| 55 to 64 Years | 84 (59.6%) | 16 (100.0%) |
| 65 to 74 Years | 65 (100.0%) | 91 (100.0%) |
| 75 Years and over | 17 (100.0%) | 0 (0.0%) |
| Total | 228 (50.8%) | 350 (74.6%) |
Income Below Poverty Among Married-Couple Families in Charlestown
The poverty statistics for married-couple families in Charlestown show that 21.9% or 32 of the total 146 families live below the poverty line. Families with no children have the highest poverty rate of 24.2%, comprising of 32 families. On the other hand, families with 3 or 4 children have the lowest poverty rate of 0.0%, which includes 0 families.
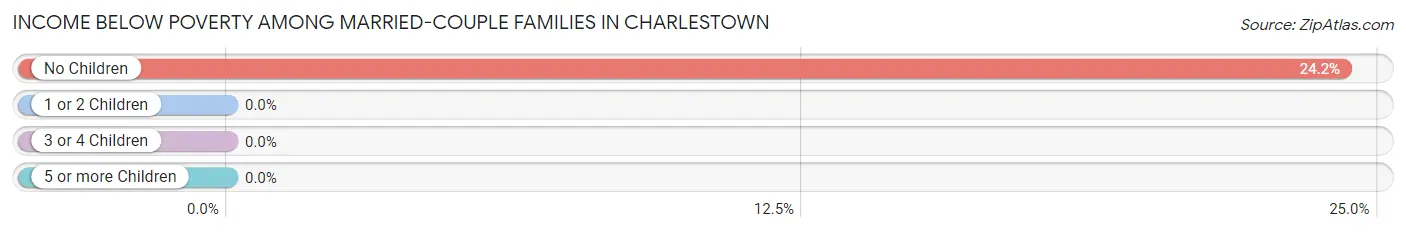
| Children | Above Poverty | Below Poverty |
| No Children | 100 (75.8%) | 32 (24.2%) |
| 1 or 2 Children | 0 (0.0%) | 0 (0.0%) |
| 3 or 4 Children | 14 (100.0%) | 0 (0.0%) |
| 5 or more Children | 0 (0.0%) | 0 (0.0%) |
| Total | 114 (78.1%) | 32 (21.9%) |
Income Below Poverty Among Single-Parent Households in Charlestown
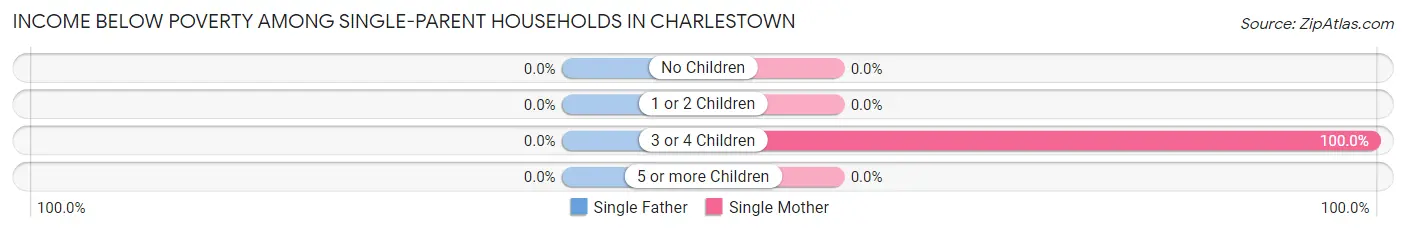
| Children | Single Father | Single Mother |
| No Children | 0 (0.0%) | 0 (0.0%) |
| 1 or 2 Children | 0 (0.0%) | 0 (0.0%) |
| 3 or 4 Children | 0 (0.0%) | 40 (100.0%) |
| 5 or more Children | 0 (0.0%) | 0 (0.0%) |
| Total | 0 (0.0%) | 40 (100.0%) |
Income Below Poverty Among Married-Couple vs Single-Parent Households in Charlestown
The poverty data for Charlestown shows that 32 of the married-couple family households (21.9%) and 40 of the single-parent households (49.4%) are living below the poverty level. Within the married-couple family households, those with no children have the highest poverty rate, with 32 households (24.2%) falling below the poverty line. Among the single-parent households, those with 3 or 4 children have the highest poverty rate, with 40 household (100.0%) living below poverty.
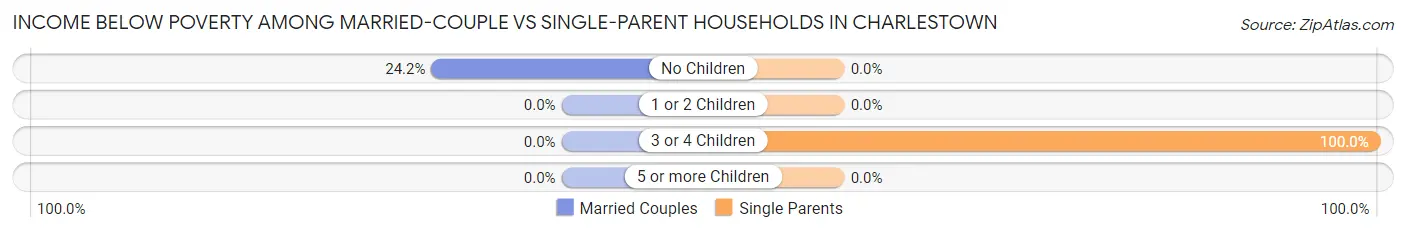
| Children | Married-Couple Families | Single-Parent Households |
| No Children | 32 (24.2%) | 0 (0.0%) |
| 1 or 2 Children | 0 (0.0%) | 0 (0.0%) |
| 3 or 4 Children | 0 (0.0%) | 40 (100.0%) |
| 5 or more Children | 0 (0.0%) | 0 (0.0%) |
| Total | 32 (21.9%) | 40 (49.4%) |
Race in Charlestown
The most populous races in Charlestown are White / Caucasian (877 | 93.9%), and Two or more Races (57 | 6.1%).
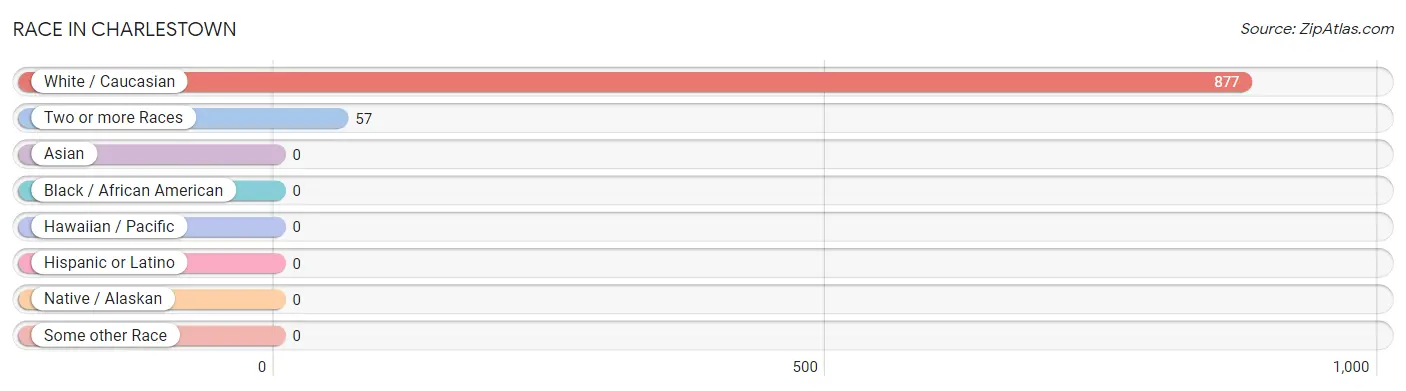
| Race | # Population | % Population |
| Asian | 0 | 0.0% |
| Black / African American | 0 | 0.0% |
| Hawaiian / Pacific | 0 | 0.0% |
| Hispanic or Latino | 0 | 0.0% |
| Native / Alaskan | 0 | 0.0% |
| White / Caucasian | 877 | 93.9% |
| Two or more Races | 57 | 6.1% |
| Some other Race | 0 | 0.0% |
| Total | 934 | 100.0% |
Ancestry in Charlestown
The most populous ancestries reported in Charlestown are English (203 | 21.7%), French (158 | 16.9%), Irish (114 | 12.2%), Scotch-Irish (59 | 6.3%), and French Canadian (48 | 5.1%), together accounting for 62.3% of all Charlestown residents.
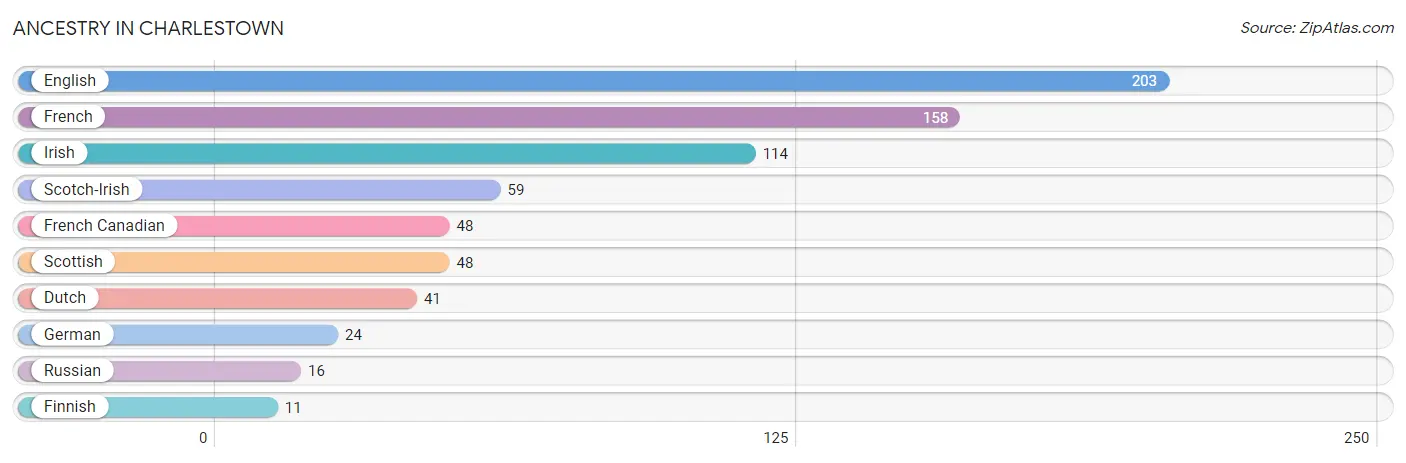
| Ancestry | # Population | % Population |
| Dutch | 41 | 4.4% |
| English | 203 | 21.7% |
| Finnish | 11 | 1.2% |
| French | 158 | 16.9% |
| French Canadian | 48 | 5.1% |
| German | 24 | 2.6% |
| Irish | 114 | 12.2% |
| Russian | 16 | 1.7% |
| Scotch-Irish | 59 | 6.3% |
| Scottish | 48 | 5.1% | View All 10 Rows |
Immigrants in Charlestown

| Immigration Origin | # Population | % Population | View All 0 Rows |
Sex and Age in Charlestown
Sex and Age in Charlestown
The most populous age groups in Charlestown are 55 to 59 Years (95 | 21.1%) for men and 5 to 9 Years (106 | 21.9%) for women.
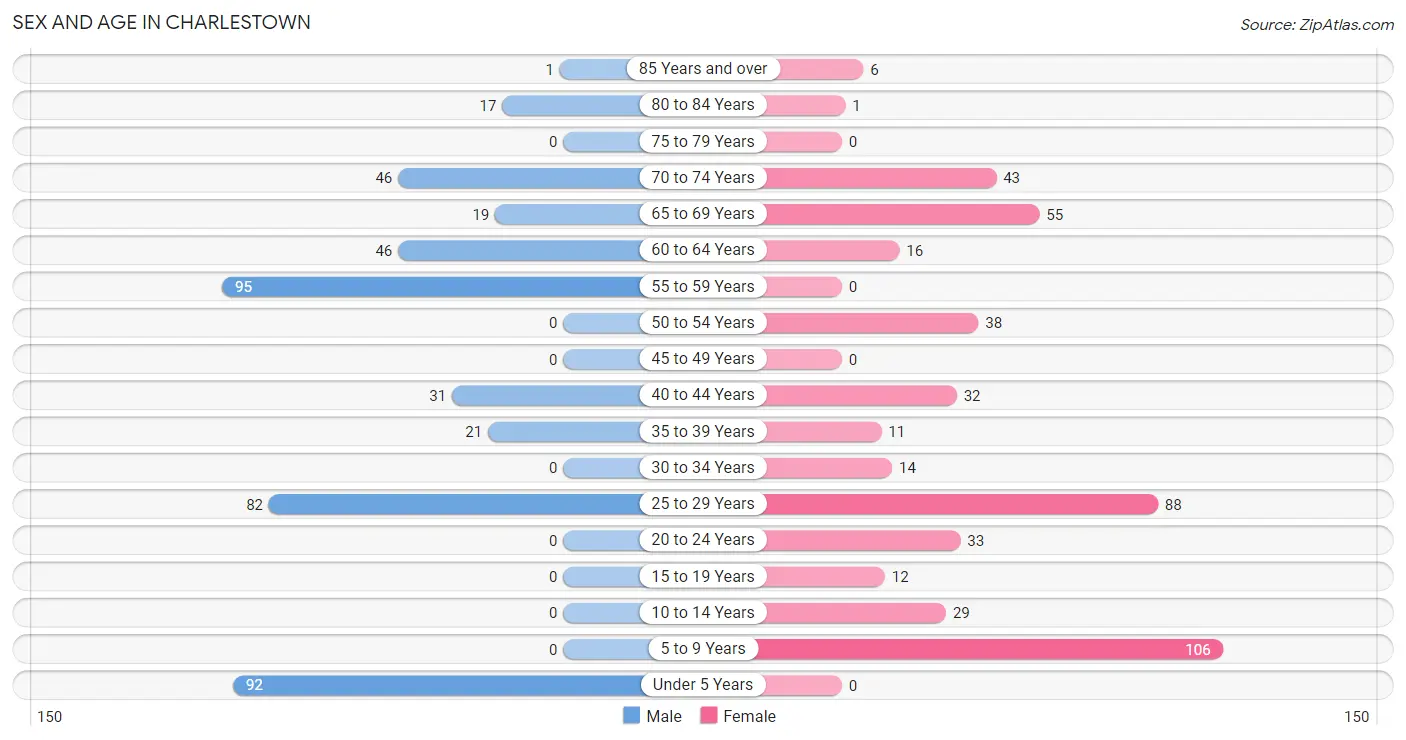
| Age Bracket | Male | Female |
| Under 5 Years | 92 (20.4%) | 0 (0.0%) |
| 5 to 9 Years | 0 (0.0%) | 106 (21.9%) |
| 10 to 14 Years | 0 (0.0%) | 29 (6.0%) |
| 15 to 19 Years | 0 (0.0%) | 12 (2.5%) |
| 20 to 24 Years | 0 (0.0%) | 33 (6.8%) |
| 25 to 29 Years | 82 (18.2%) | 88 (18.2%) |
| 30 to 34 Years | 0 (0.0%) | 14 (2.9%) |
| 35 to 39 Years | 21 (4.7%) | 11 (2.3%) |
| 40 to 44 Years | 31 (6.9%) | 32 (6.6%) |
| 45 to 49 Years | 0 (0.0%) | 0 (0.0%) |
| 50 to 54 Years | 0 (0.0%) | 38 (7.9%) |
| 55 to 59 Years | 95 (21.1%) | 0 (0.0%) |
| 60 to 64 Years | 46 (10.2%) | 16 (3.3%) |
| 65 to 69 Years | 19 (4.2%) | 55 (11.4%) |
| 70 to 74 Years | 46 (10.2%) | 43 (8.9%) |
| 75 to 79 Years | 0 (0.0%) | 0 (0.0%) |
| 80 to 84 Years | 17 (3.8%) | 1 (0.2%) |
| 85 Years and over | 1 (0.2%) | 6 (1.2%) |
| Total | 450 (100.0%) | 484 (100.0%) |
Families and Households in Charlestown
Median Family Size in Charlestown
The median family size in Charlestown is 2.88 persons per family, with single female/mother families (40 | 17.6%) accounting for the largest median family size of 4.48 persons per family. On the other hand, single male/father families (41 | 18.1%) represent the smallest median family size with 2.44 persons per family.
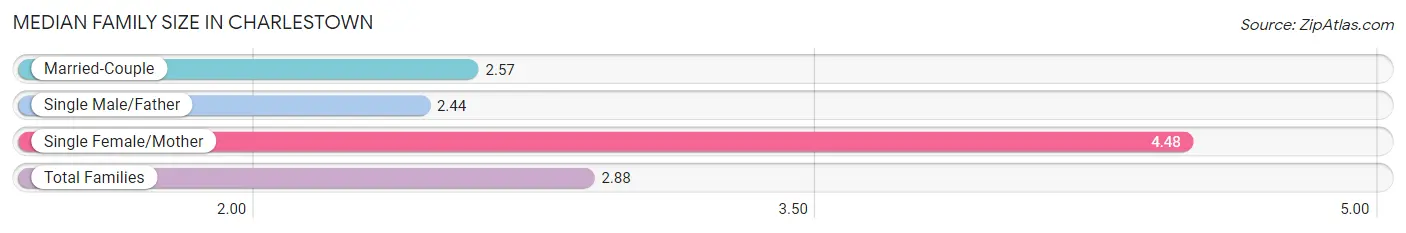
| Family Type | # Families | Family Size |
| Married-Couple | 146 (64.3%) | 2.57 |
| Single Male/Father | 41 (18.1%) | 2.44 |
| Single Female/Mother | 40 (17.6%) | 4.48 |
| Total Families | 227 (100.0%) | 2.88 |
Median Household Size in Charlestown
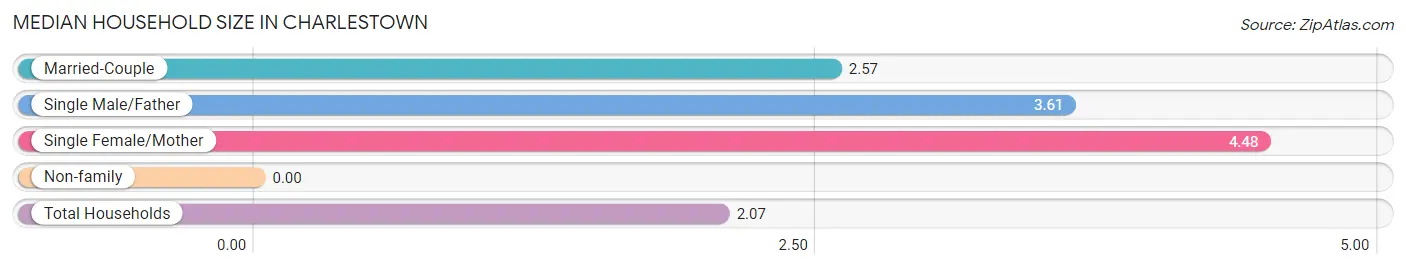
| Household Type | # Households | Household Size |
| Married-Couple | 146 (33.0%) | 2.57 |
| Single Male/Father | 41 (9.3%) | 3.61 |
| Single Female/Mother | 40 (9.0%) | 4.48 |
| Non-family | 216 (48.8%) | - |
| Total Households | 443 (100.0%) | 2.07 |
Household Size by Marriage Status in Charlestown
Out of a total of 443 households in Charlestown, 227 (51.2%) are family households, while 216 (48.8%) are nonfamily households. The most numerous type of family households are 2-person households, comprising 115, and the most common type of nonfamily households are 1-person households, comprising 216.
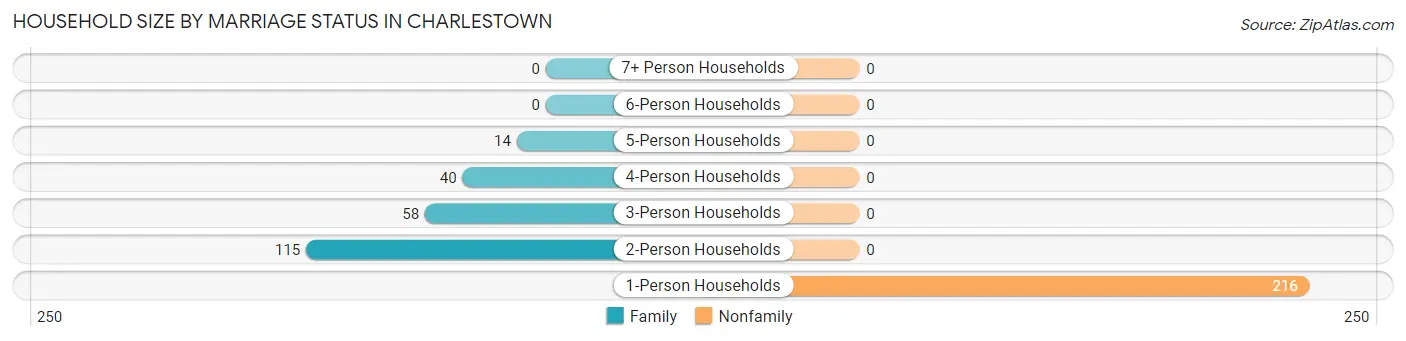
| Household Size | Family Households | Nonfamily Households |
| 1-Person Households | - | 216 (48.8%) |
| 2-Person Households | 115 (26.0%) | 0 (0.0%) |
| 3-Person Households | 58 (13.1%) | 0 (0.0%) |
| 4-Person Households | 40 (9.0%) | 0 (0.0%) |
| 5-Person Households | 14 (3.2%) | 0 (0.0%) |
| 6-Person Households | 0 (0.0%) | 0 (0.0%) |
| 7+ Person Households | 0 (0.0%) | 0 (0.0%) |
| Total | 227 (51.2%) | 216 (48.8%) |
Female Fertility in Charlestown
Fertility by Age in Charlestown
Average fertility rate in Charlestown is 209.0 births per 1,000 women. Women in the age bracket of 20 to 34 years have the highest fertility rate with 296.0 births per 1,000 women. Women in the age bracket of 20 to 34 years acount for 100.0% of all women with births.
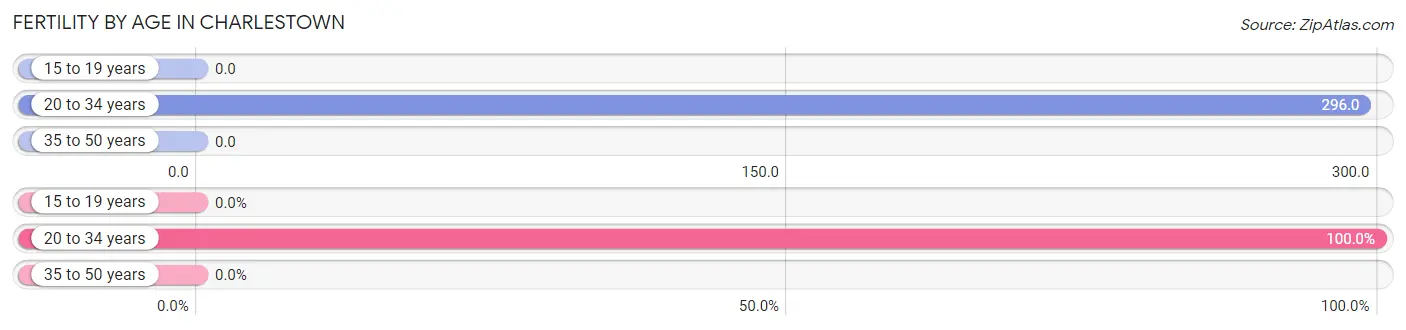
| Age Bracket | Women with Births | Births / 1,000 Women |
| 15 to 19 years | 0 (0.0%) | 0.0 |
| 20 to 34 years | 40 (100.0%) | 296.0 |
| 35 to 50 years | 0 (0.0%) | 0.0 |
| Total | 40 (100.0%) | 209.0 |
Fertility by Age by Marriage Status in Charlestown
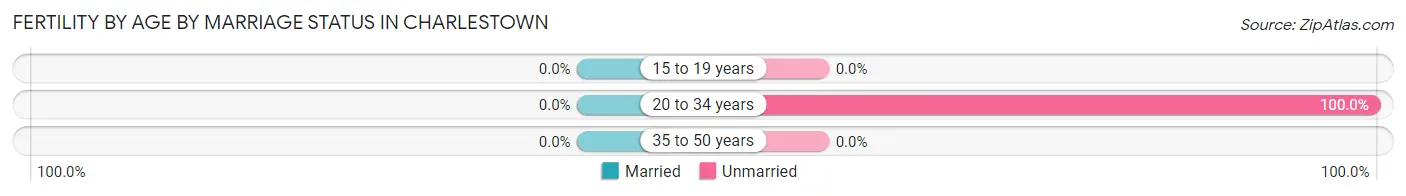
| Age Bracket | Married | Unmarried |
| 15 to 19 years | 0 (0.0%) | 0 (0.0%) |
| 20 to 34 years | 0 (0.0%) | 40 (100.0%) |
| 35 to 50 years | 0 (0.0%) | 0 (0.0%) |
| Total | 0 (0.0%) | 40 (100.0%) |
Fertility by Education in Charlestown
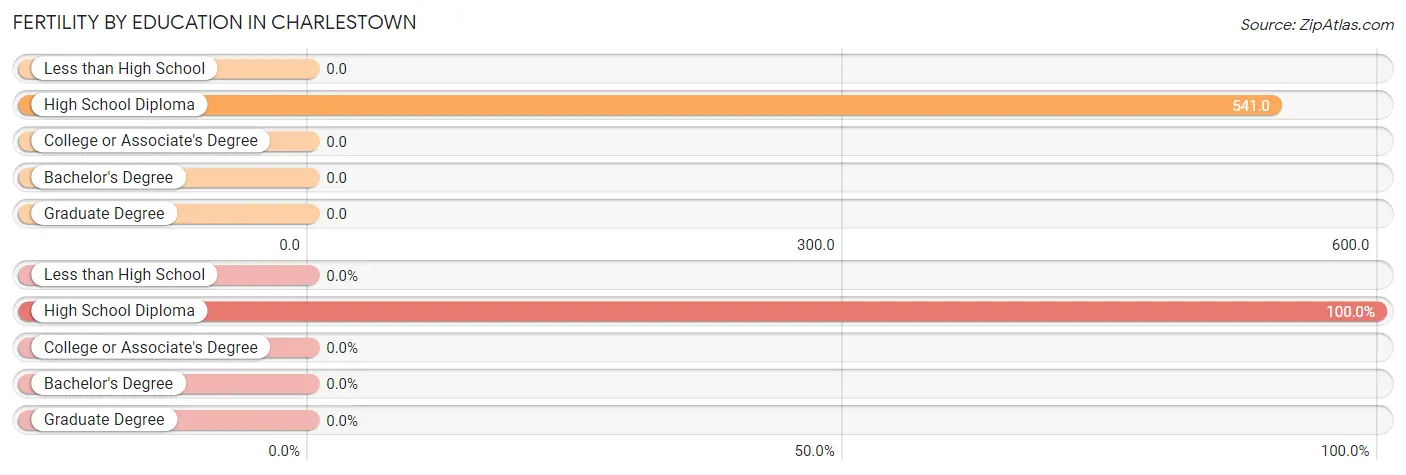
| Educational Attainment | Women with Births | Births / 1,000 Women |
| Less than High School | 0 (0.0%) | 0.0 |
| High School Diploma | 40 (100.0%) | 541.0 |
| College or Associate's Degree | 0 (0.0%) | 0.0 |
| Bachelor's Degree | 0 (0.0%) | 0.0 |
| Graduate Degree | 0 (0.0%) | 0.0 |
| Total | 40 (100.0%) | 209.0 |
Fertility by Education by Marriage Status in Charlestown
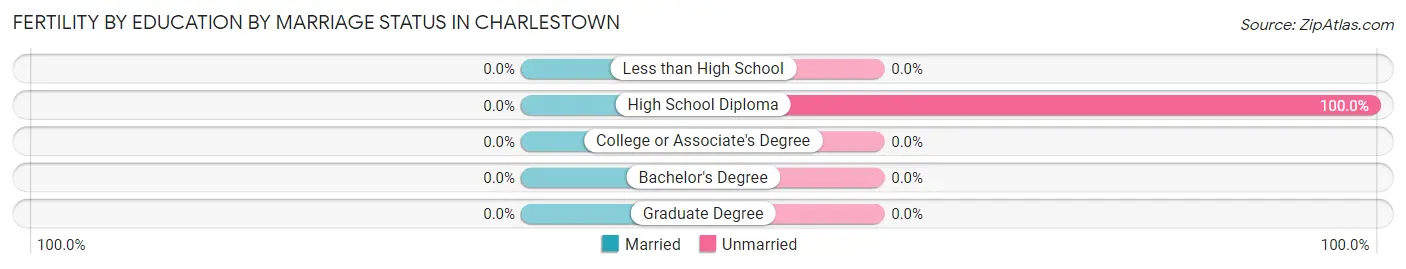
| Educational Attainment | Married | Unmarried |
| Less than High School | 0 (0.0%) | 0 (0.0%) |
| High School Diploma | 0 (0.0%) | 40 (100.0%) |
| College or Associate's Degree | 0 (0.0%) | 0 (0.0%) |
| Bachelor's Degree | 0 (0.0%) | 0 (0.0%) |
| Graduate Degree | 0 (0.0%) | 0 (0.0%) |
| Total | 0 (0.0%) | 40 (100.0%) |
Employment Characteristics in Charlestown
Employment by Class of Employer in Charlestown
Among the 278 employed individuals in Charlestown, private company employees (197 | 70.9%), not-for-profit organizations (31 | 11.2%), and local government employees (31 | 11.2%) make up the most common classes of employment.
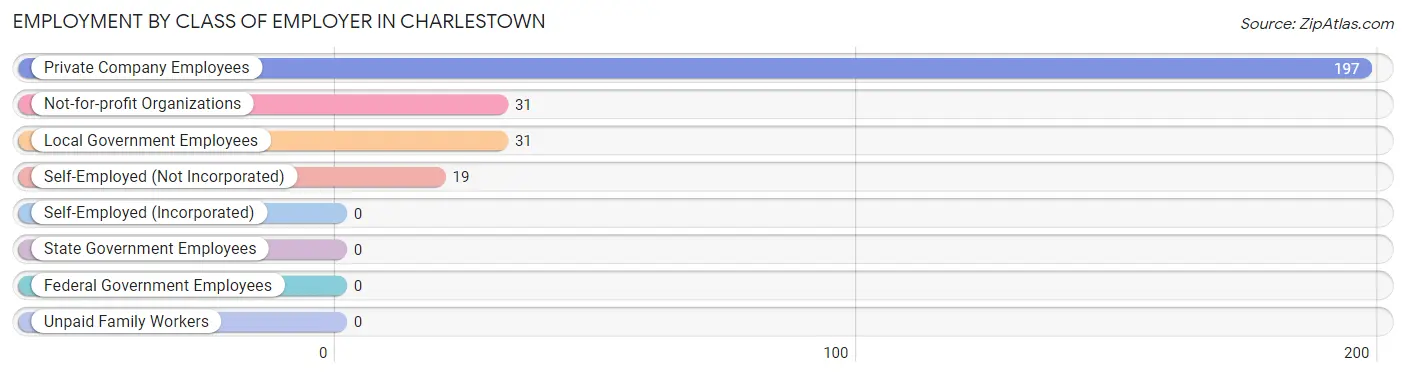
| Employer Class | # Employees | % Employees |
| Private Company Employees | 197 | 70.9% |
| Self-Employed (Incorporated) | 0 | 0.0% |
| Self-Employed (Not Incorporated) | 19 | 6.8% |
| Not-for-profit Organizations | 31 | 11.2% |
| Local Government Employees | 31 | 11.2% |
| State Government Employees | 0 | 0.0% |
| Federal Government Employees | 0 | 0.0% |
| Unpaid Family Workers | 0 | 0.0% |
| Total | 278 | 100.0% |
Employment Status by Age in Charlestown
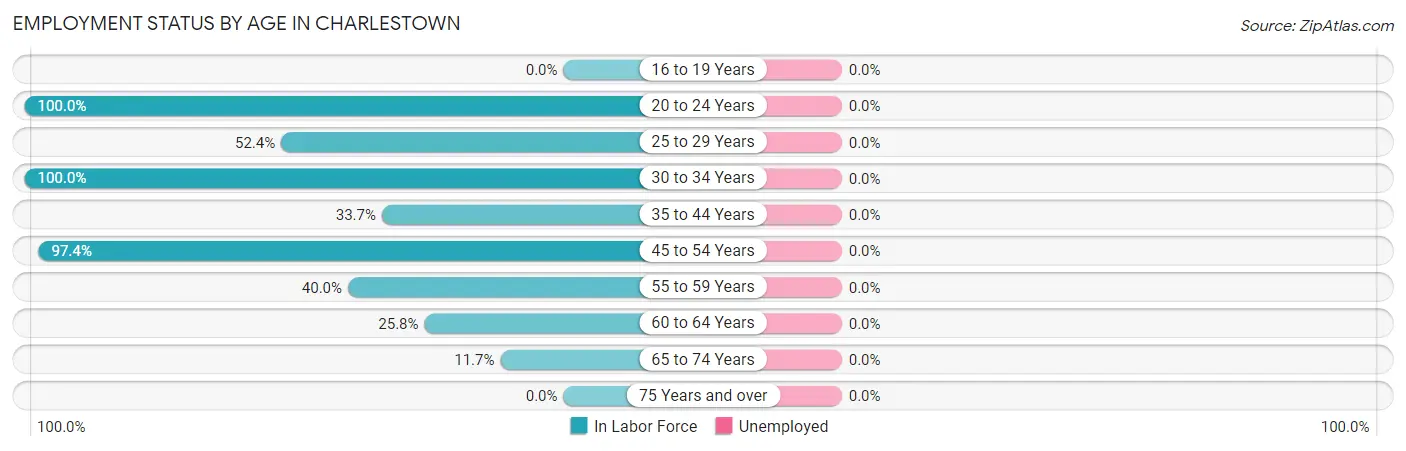
| Age Bracket | In Labor Force | Unemployed |
| 16 to 19 Years | 0 (0.0%) | 0 (0.0%) |
| 20 to 24 Years | 33 (100.0%) | 0 (0.0%) |
| 25 to 29 Years | 89 (52.4%) | 0 (0.0%) |
| 30 to 34 Years | 14 (100.0%) | 0 (0.0%) |
| 35 to 44 Years | 32 (33.7%) | 0 (0.0%) |
| 45 to 54 Years | 37 (97.4%) | 0 (0.0%) |
| 55 to 59 Years | 38 (40.0%) | 0 (0.0%) |
| 60 to 64 Years | 16 (25.8%) | 0 (0.0%) |
| 65 to 74 Years | 19 (11.7%) | 0 (0.0%) |
| 75 Years and over | 0 (0.0%) | 0 (0.0%) |
| Total | 278 (40.0%) | 0 (0.0%) |
Employment Status by Educational Attainment in Charlestown
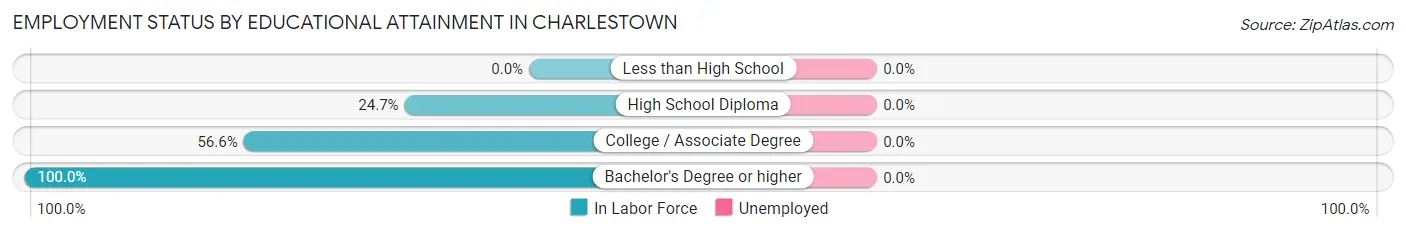
| Educational Attainment | In Labor Force | Unemployed |
| Less than High School | 0 (0.0%) | 0 (0.0%) |
| High School Diploma | 42 (24.7%) | 0 (0.0%) |
| College / Associate Degree | 82 (56.6%) | 0 (0.0%) |
| Bachelor's Degree or higher | 102 (100.0%) | 0 (0.0%) |
| Total | 226 (47.7%) | 0 (0.0%) |
Employment Occupations by Sex in Charlestown
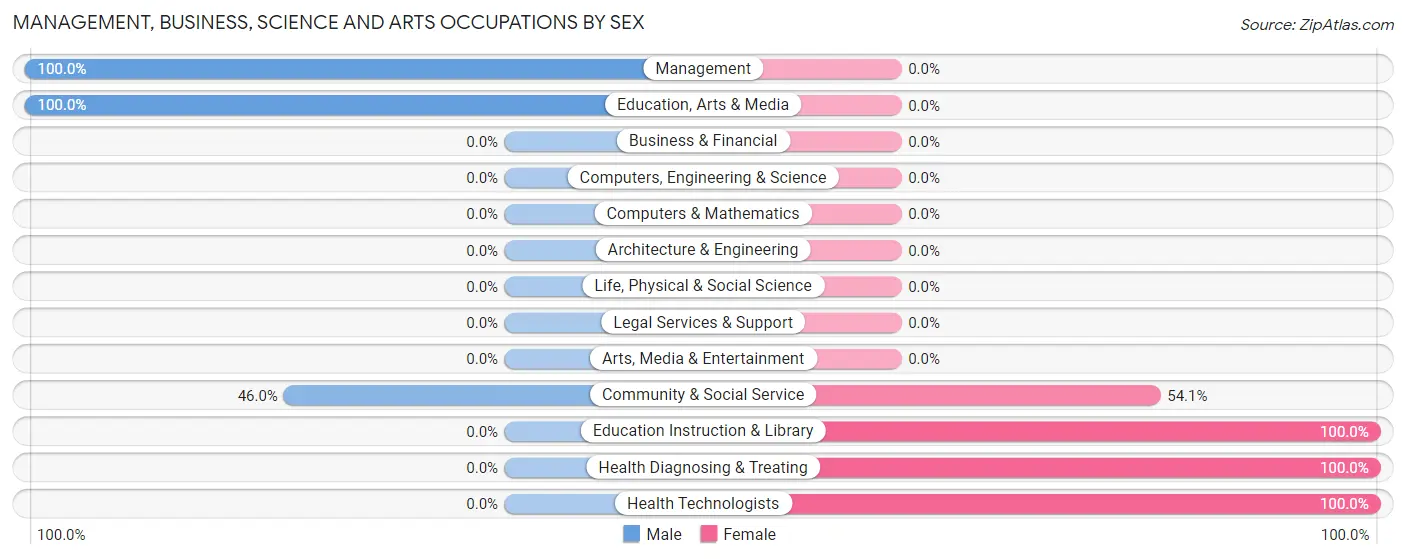
Management, Business, Science and Arts Occupations
The most common Management, Business, Science and Arts occupations in Charlestown are Management (52 | 18.7%), Health Diagnosing & Treating (42 | 15.1%), Health Technologists (42 | 15.1%), Community & Social Service (37 | 13.3%), and Education Instruction & Library (20 | 7.2%).
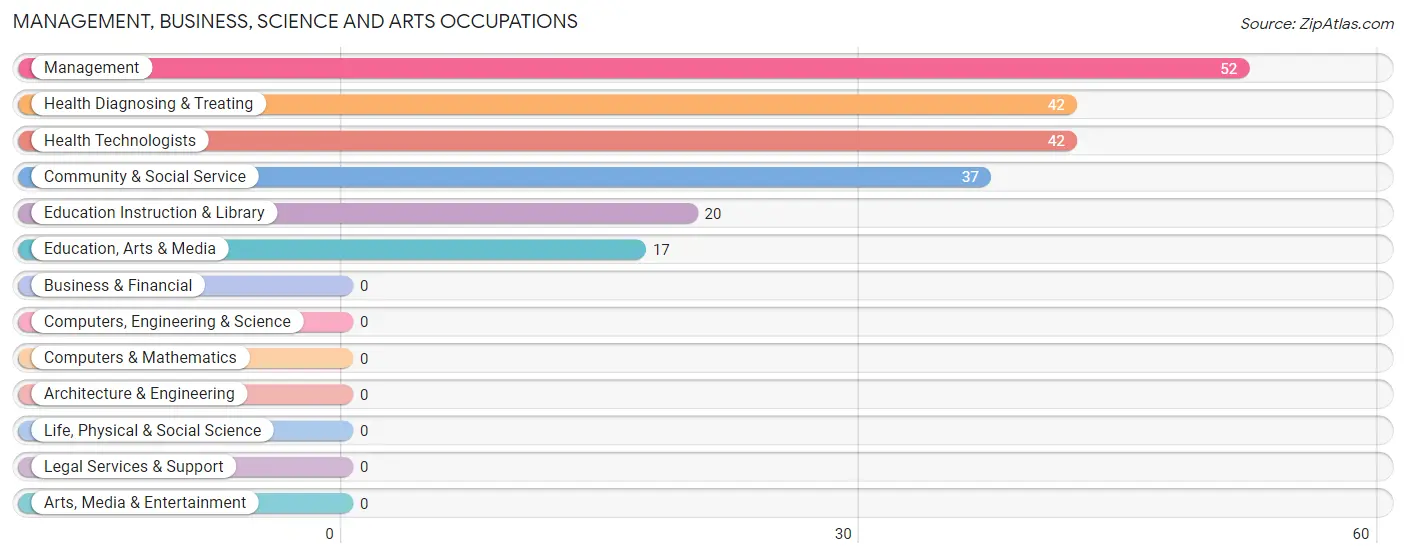
Management, Business, Science and Arts Occupations by Sex
Within the Management, Business, Science and Arts occupations in Charlestown, the most male-oriented occupations are Management (100.0%), Education, Arts & Media (100.0%), and Community & Social Service (46.0%), while the most female-oriented occupations are Education Instruction & Library (100.0%), Health Diagnosing & Treating (100.0%), and Health Technologists (100.0%).
| Occupation | Male | Female |
| Management | 52 (100.0%) | 0 (0.0%) |
| Business & Financial | 0 (0.0%) | 0 (0.0%) |
| Computers, Engineering & Science | 0 (0.0%) | 0 (0.0%) |
| Computers & Mathematics | 0 (0.0%) | 0 (0.0%) |
| Architecture & Engineering | 0 (0.0%) | 0 (0.0%) |
| Life, Physical & Social Science | 0 (0.0%) | 0 (0.0%) |
| Community & Social Service | 17 (46.0%) | 20 (54.0%) |
| Education, Arts & Media | 17 (100.0%) | 0 (0.0%) |
| Legal Services & Support | 0 (0.0%) | 0 (0.0%) |
| Education Instruction & Library | 0 (0.0%) | 20 (100.0%) |
| Arts, Media & Entertainment | 0 (0.0%) | 0 (0.0%) |
| Health Diagnosing & Treating | 0 (0.0%) | 42 (100.0%) |
| Health Technologists | 0 (0.0%) | 42 (100.0%) |
| Total (Category) | 69 (52.7%) | 62 (47.3%) |
| Total (Overall) | 119 (42.8%) | 159 (57.2%) |
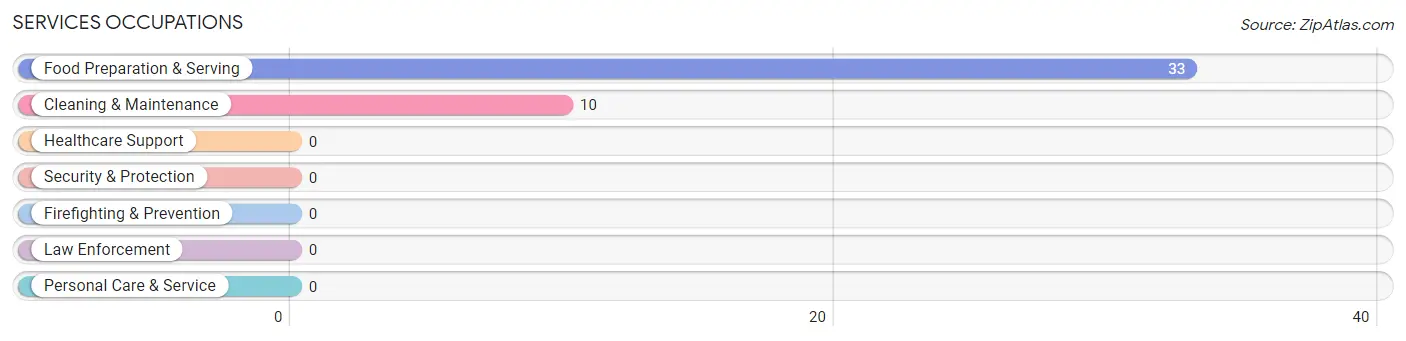
Services Occupations
The most common Services occupations in Charlestown are Food Preparation & Serving (33 | 11.9%), and Cleaning & Maintenance (10 | 3.6%).
Services Occupations by Sex
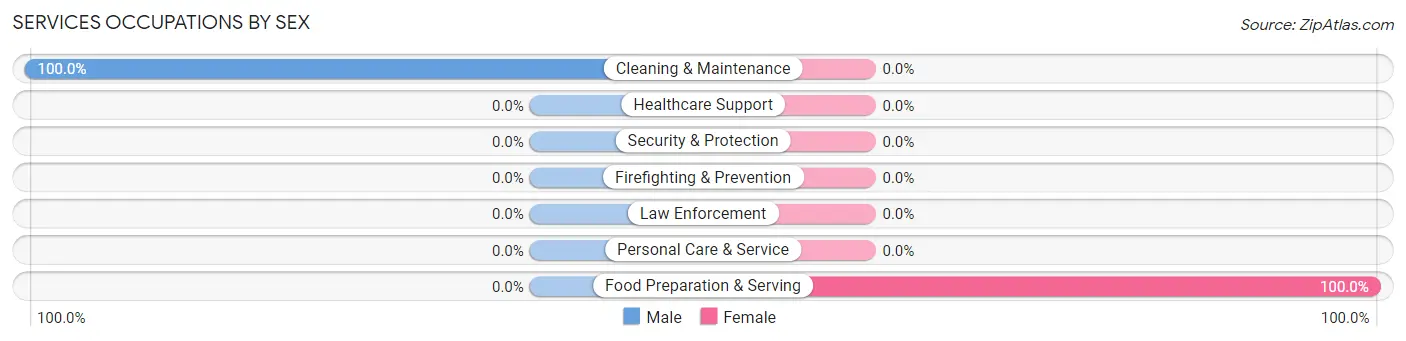
| Occupation | Male | Female |
| Healthcare Support | 0 (0.0%) | 0 (0.0%) |
| Security & Protection | 0 (0.0%) | 0 (0.0%) |
| Firefighting & Prevention | 0 (0.0%) | 0 (0.0%) |
| Law Enforcement | 0 (0.0%) | 0 (0.0%) |
| Food Preparation & Serving | 0 (0.0%) | 33 (100.0%) |
| Cleaning & Maintenance | 10 (100.0%) | 0 (0.0%) |
| Personal Care & Service | 0 (0.0%) | 0 (0.0%) |
| Total (Category) | 10 (23.3%) | 33 (76.7%) |
| Total (Overall) | 119 (42.8%) | 159 (57.2%) |
Sales and Office Occupations
The most common Sales and Office occupations in Charlestown are Sales & Related (19 | 6.8%), and Office & Administration (16 | 5.8%).
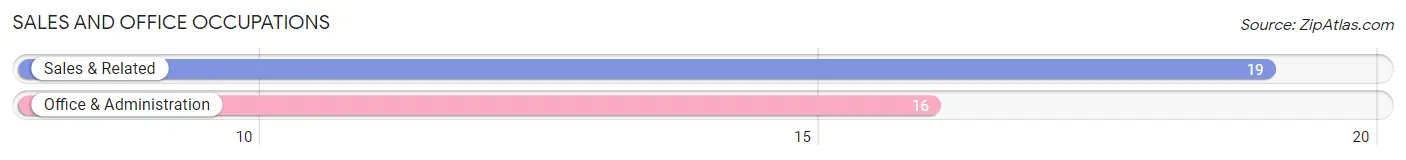
Sales and Office Occupations by Sex
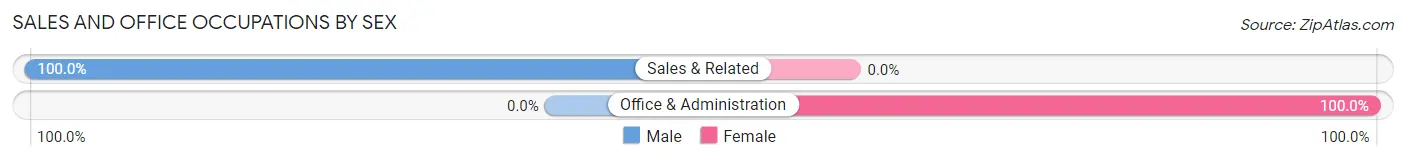
| Occupation | Male | Female |
| Sales & Related | 19 (100.0%) | 0 (0.0%) |
| Office & Administration | 0 (0.0%) | 16 (100.0%) |
| Total (Category) | 19 (54.3%) | 16 (45.7%) |
| Total (Overall) | 119 (42.8%) | 159 (57.2%) |
Natural Resources, Construction and Maintenance Occupations
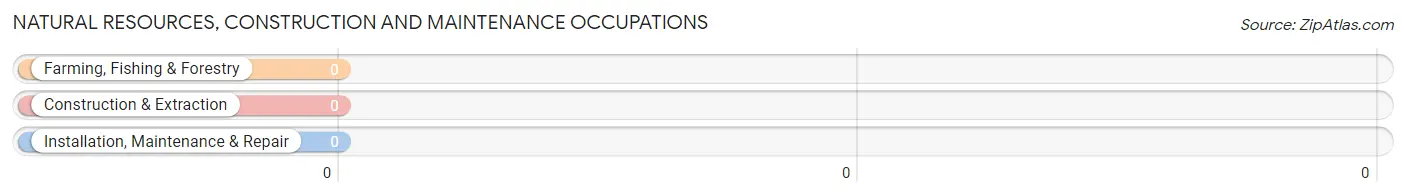
Natural Resources, Construction and Maintenance Occupations by Sex
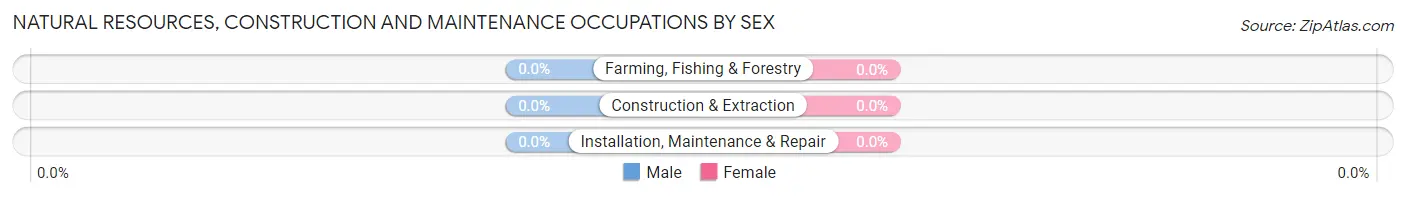
| Occupation | Male | Female |
| Farming, Fishing & Forestry | 0 (0.0%) | 0 (0.0%) |
| Construction & Extraction | 0 (0.0%) | 0 (0.0%) |
| Installation, Maintenance & Repair | 0 (0.0%) | 0 (0.0%) |
| Total (Category) | 0 (0.0%) | 0 (0.0%) |
| Total (Overall) | 119 (42.8%) | 159 (57.2%) |
Production, Transportation and Moving Occupations
The most common Production, Transportation and Moving occupations in Charlestown are , and Production (69 | 24.8%).
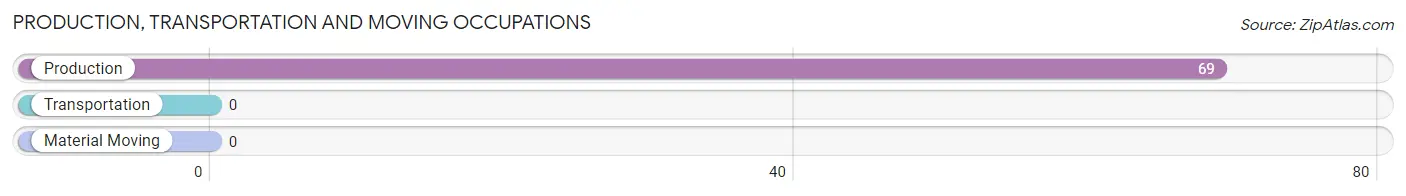
Production, Transportation and Moving Occupations by Sex
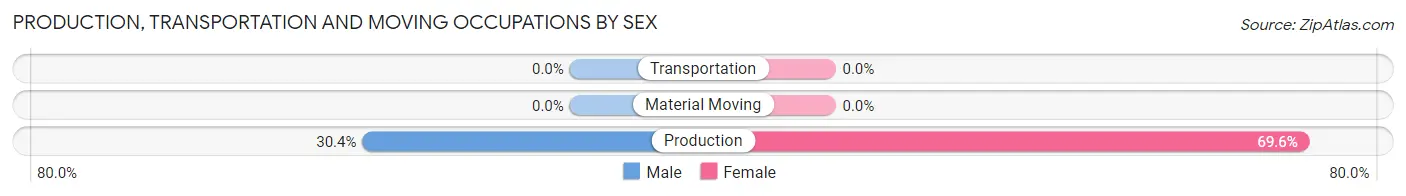
| Occupation | Male | Female |
| Production | 21 (30.4%) | 48 (69.6%) |
| Transportation | 0 (0.0%) | 0 (0.0%) |
| Material Moving | 0 (0.0%) | 0 (0.0%) |
| Total (Category) | 21 (30.4%) | 48 (69.6%) |
| Total (Overall) | 119 (42.8%) | 159 (57.2%) |
Employment Industries by Sex in Charlestown
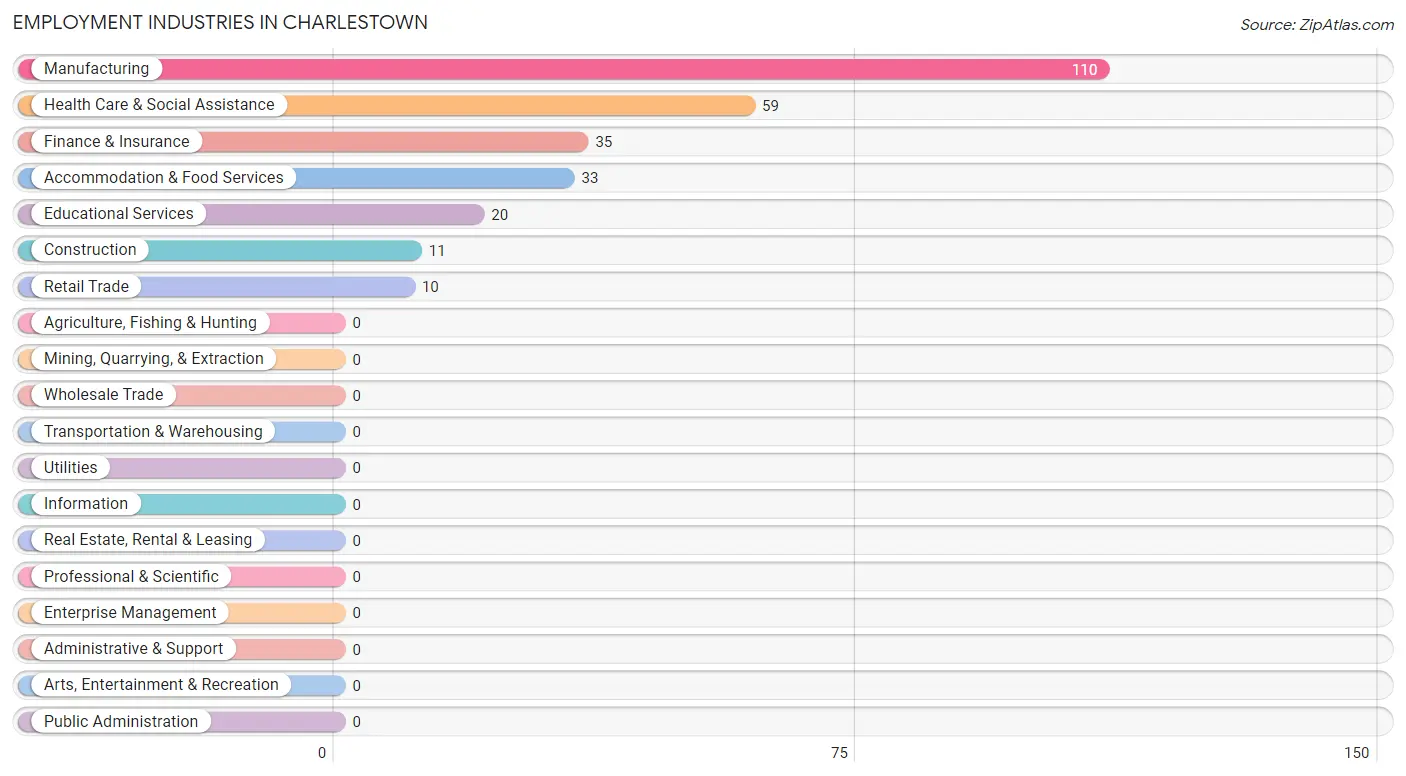
Employment Industries in Charlestown
The major employment industries in Charlestown include Manufacturing (110 | 39.6%), Health Care & Social Assistance (59 | 21.2%), Finance & Insurance (35 | 12.6%), Accommodation & Food Services (33 | 11.9%), and Educational Services (20 | 7.2%).
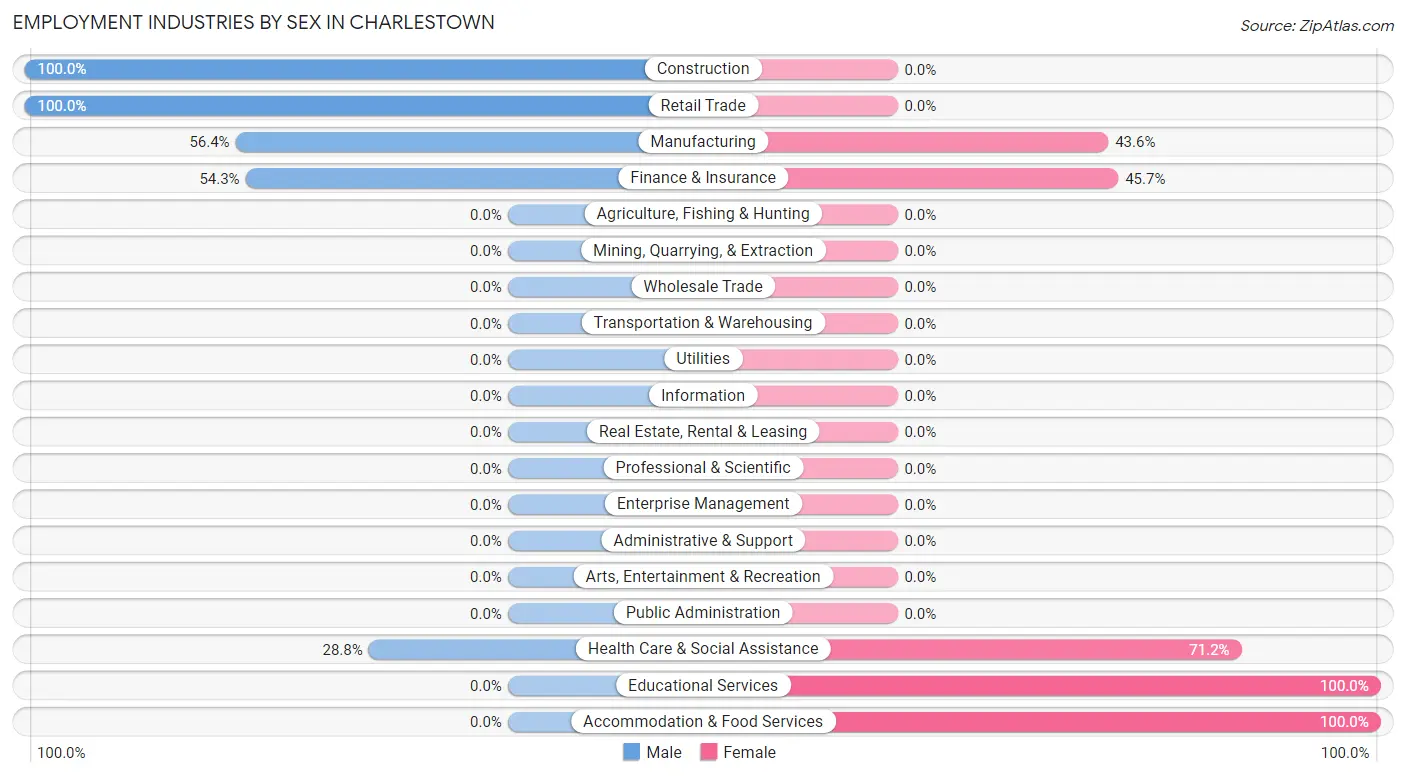
Employment Industries by Sex in Charlestown
The Charlestown industries that see more men than women are Construction (100.0%), Retail Trade (100.0%), and Manufacturing (56.4%), whereas the industries that tend to have a higher number of women are Educational Services (100.0%), Accommodation & Food Services (100.0%), and Health Care & Social Assistance (71.2%).
| Industry | Male | Female |
| Agriculture, Fishing & Hunting | 0 (0.0%) | 0 (0.0%) |
| Mining, Quarrying, & Extraction | 0 (0.0%) | 0 (0.0%) |
| Construction | 11 (100.0%) | 0 (0.0%) |
| Manufacturing | 62 (56.4%) | 48 (43.6%) |
| Wholesale Trade | 0 (0.0%) | 0 (0.0%) |
| Retail Trade | 10 (100.0%) | 0 (0.0%) |
| Transportation & Warehousing | 0 (0.0%) | 0 (0.0%) |
| Utilities | 0 (0.0%) | 0 (0.0%) |
| Information | 0 (0.0%) | 0 (0.0%) |
| Finance & Insurance | 19 (54.3%) | 16 (45.7%) |
| Real Estate, Rental & Leasing | 0 (0.0%) | 0 (0.0%) |
| Professional & Scientific | 0 (0.0%) | 0 (0.0%) |
| Enterprise Management | 0 (0.0%) | 0 (0.0%) |
| Administrative & Support | 0 (0.0%) | 0 (0.0%) |
| Educational Services | 0 (0.0%) | 20 (100.0%) |
| Health Care & Social Assistance | 17 (28.8%) | 42 (71.2%) |
| Arts, Entertainment & Recreation | 0 (0.0%) | 0 (0.0%) |
| Accommodation & Food Services | 0 (0.0%) | 33 (100.0%) |
| Public Administration | 0 (0.0%) | 0 (0.0%) |
| Total | 119 (42.8%) | 159 (57.2%) |
Education in Charlestown
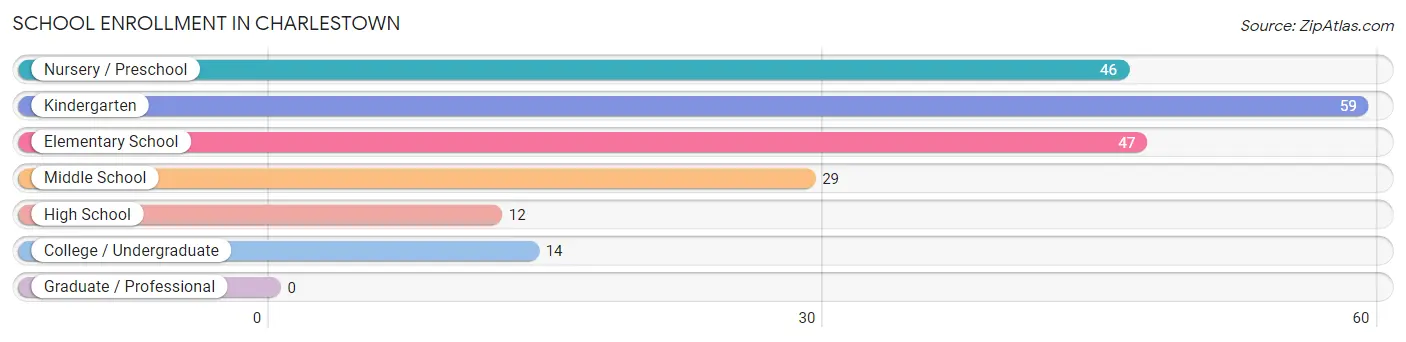
School Enrollment in Charlestown
The most common levels of schooling among the 207 students in Charlestown are kindergarten (59 | 28.5%), elementary school (47 | 22.7%), and nursery / preschool (46 | 22.2%).
| School Level | # Students | % Students |
| Nursery / Preschool | 46 | 22.2% |
| Kindergarten | 59 | 28.5% |
| Elementary School | 47 | 22.7% |
| Middle School | 29 | 14.0% |
| High School | 12 | 5.8% |
| College / Undergraduate | 14 | 6.8% |
| Graduate / Professional | 0 | 0.0% |
| Total | 207 | 100.0% |
School Enrollment by Age by Funding Source in Charlestown
Out of a total of 207 students who are enrolled in schools in Charlestown, 14 (6.8%) attend a private institution, while the remaining 193 (93.2%) are enrolled in public schools. The age group of 25 to 34 year olds has the highest likelihood of being enrolled in private schools, with 14 (100.0% in the age bracket) enrolled. Conversely, the age group of 3 to 4 year olds has the lowest likelihood of being enrolled in a private school, with 46 (100.0% in the age bracket) attending a public institution.
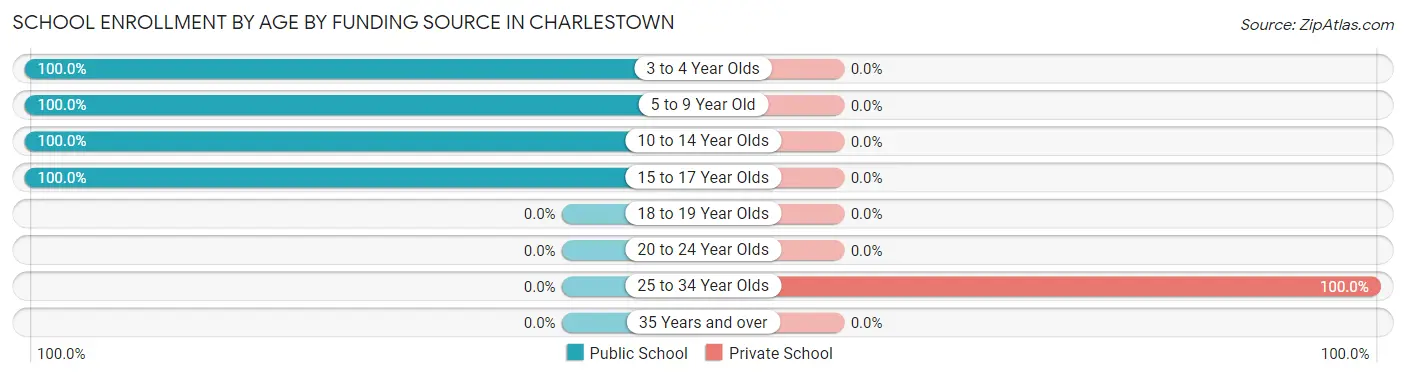
| Age Bracket | Public School | Private School |
| 3 to 4 Year Olds | 46 (100.0%) | 0 (0.0%) |
| 5 to 9 Year Old | 106 (100.0%) | 0 (0.0%) |
| 10 to 14 Year Olds | 29 (100.0%) | 0 (0.0%) |
| 15 to 17 Year Olds | 12 (100.0%) | 0 (0.0%) |
| 18 to 19 Year Olds | 0 (0.0%) | 0 (0.0%) |
| 20 to 24 Year Olds | 0 (0.0%) | 0 (0.0%) |
| 25 to 34 Year Olds | 0 (0.0%) | 14 (100.0%) |
| 35 Years and over | 0 (0.0%) | 0 (0.0%) |
| Total | 193 (93.2%) | 14 (6.8%) |
Educational Attainment by Field of Study in Charlestown
Bio, nature & agricultural (48 | 30.0%), science & technology (38 | 23.7%), literature & languages (20 | 12.5%), business (19 | 11.9%), and liberal arts & history (17 | 10.6%) are the most common fields of study among 160 individuals in Charlestown who have obtained a bachelor's degree or higher.
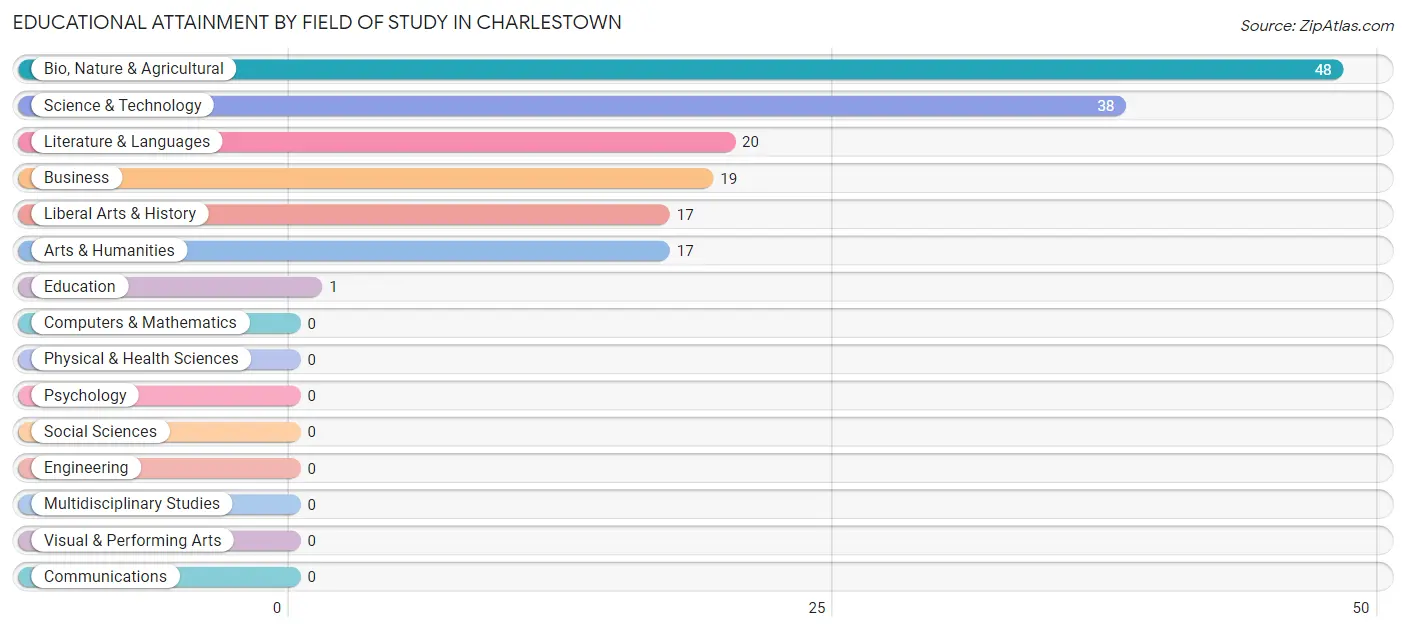
| Field of Study | # Graduates | % Graduates |
| Computers & Mathematics | 0 | 0.0% |
| Bio, Nature & Agricultural | 48 | 30.0% |
| Physical & Health Sciences | 0 | 0.0% |
| Psychology | 0 | 0.0% |
| Social Sciences | 0 | 0.0% |
| Engineering | 0 | 0.0% |
| Multidisciplinary Studies | 0 | 0.0% |
| Science & Technology | 38 | 23.7% |
| Business | 19 | 11.9% |
| Education | 1 | 0.6% |
| Literature & Languages | 20 | 12.5% |
| Liberal Arts & History | 17 | 10.6% |
| Visual & Performing Arts | 0 | 0.0% |
| Communications | 0 | 0.0% |
| Arts & Humanities | 17 | 10.6% |
| Total | 160 | 100.0% |
Transportation & Commute in Charlestown
Vehicle Availability by Sex in Charlestown
The most prevalent vehicle ownership categories in Charlestown are males with 2 vehicles (87, accounting for 73.1%) and females with 2 vehicles (125, making up 54.7%).
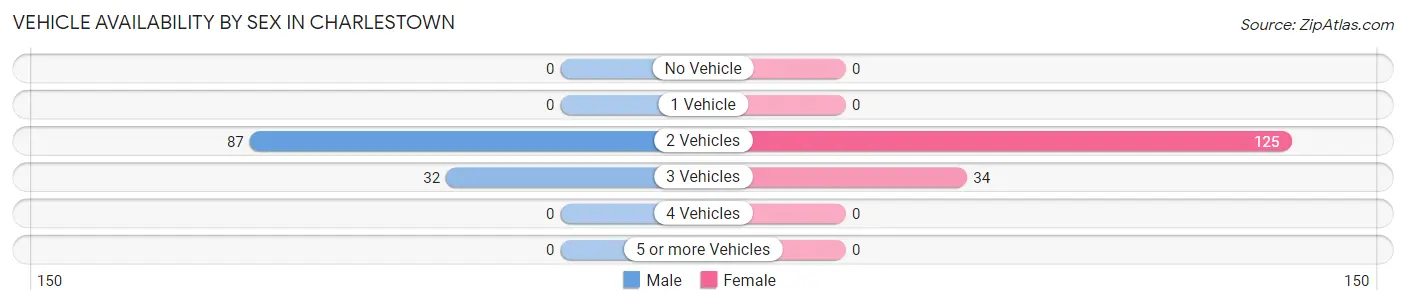
| Vehicles Available | Male | Female |
| No Vehicle | 0 (0.0%) | 0 (0.0%) |
| 1 Vehicle | 0 (0.0%) | 0 (0.0%) |
| 2 Vehicles | 87 (73.1%) | 125 (78.6%) |
| 3 Vehicles | 32 (26.9%) | 34 (21.4%) |
| 4 Vehicles | 0 (0.0%) | 0 (0.0%) |
| 5 or more Vehicles | 0 (0.0%) | 0 (0.0%) |
| Total | 119 (100.0%) | 159 (100.0%) |
Commute Time in Charlestown
The most frequently occuring commute durations in Charlestown are 40 to 44 minutes (89 commuters, 34.1%), 20 to 24 minutes (64 commuters, 24.5%), and less than 5 minutes (35 commuters, 13.4%).
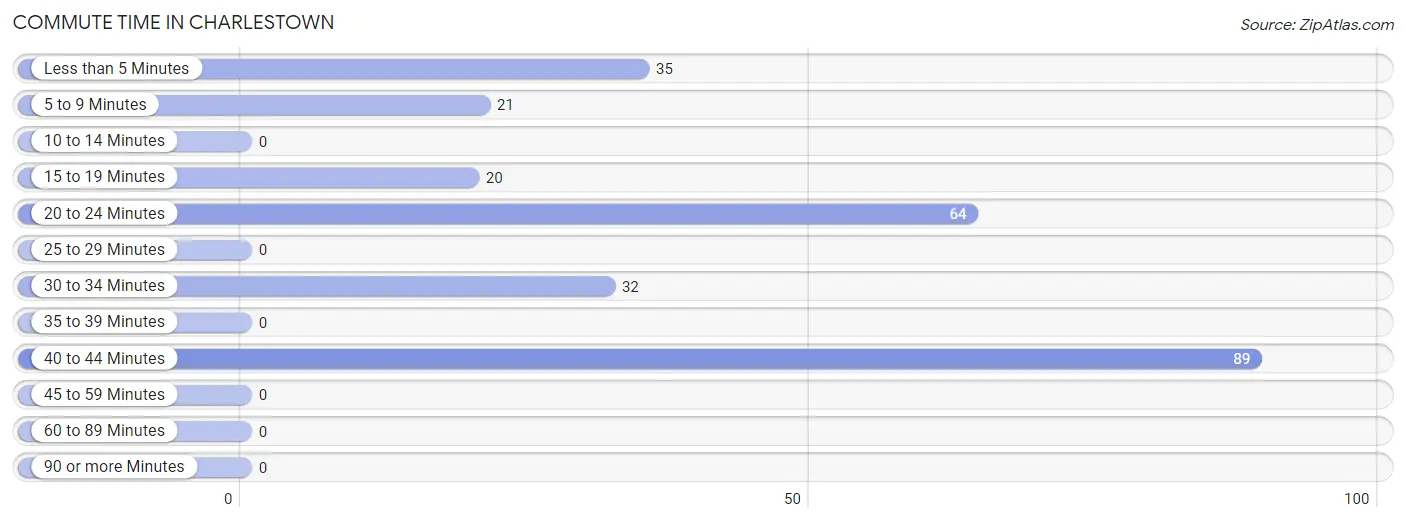
| Commute Time | # Commuters | % Commuters |
| Less than 5 Minutes | 35 | 13.4% |
| 5 to 9 Minutes | 21 | 8.1% |
| 10 to 14 Minutes | 0 | 0.0% |
| 15 to 19 Minutes | 20 | 7.7% |
| 20 to 24 Minutes | 64 | 24.5% |
| 25 to 29 Minutes | 0 | 0.0% |
| 30 to 34 Minutes | 32 | 12.3% |
| 35 to 39 Minutes | 0 | 0.0% |
| 40 to 44 Minutes | 89 | 34.1% |
| 45 to 59 Minutes | 0 | 0.0% |
| 60 to 89 Minutes | 0 | 0.0% |
| 90 or more Minutes | 0 | 0.0% |
Commute Time by Sex in Charlestown
The most common commute times in Charlestown are 40 to 44 minutes (41 commuters, 34.4%) for males and 40 to 44 minutes (48 commuters, 33.8%) for females.
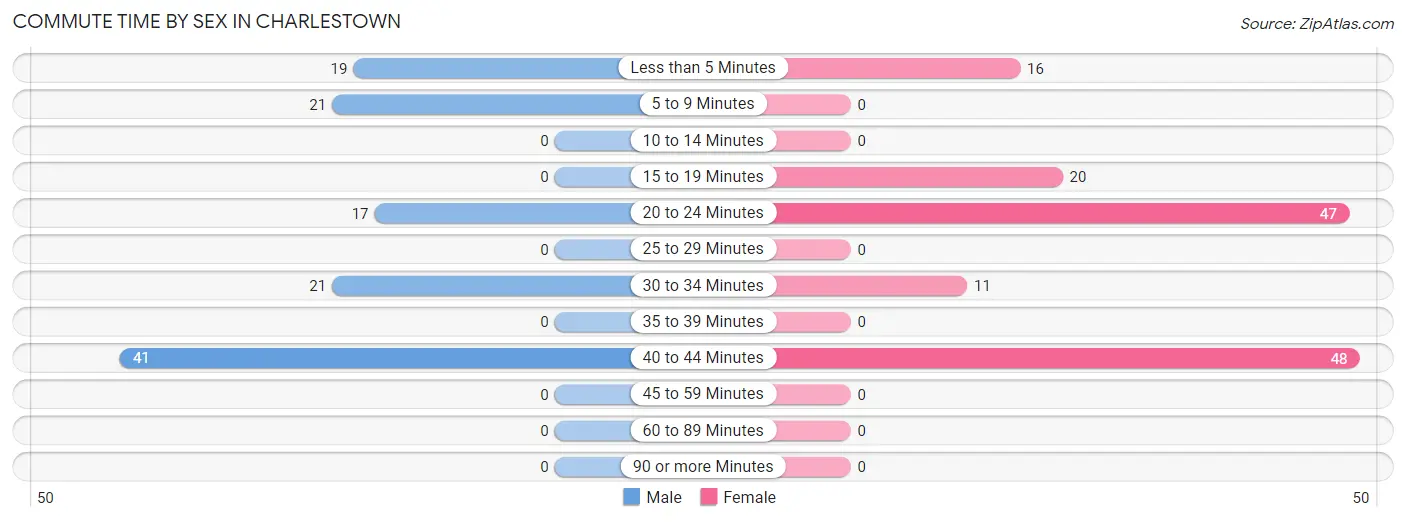
| Commute Time | Male | Female |
| Less than 5 Minutes | 19 (16.0%) | 16 (11.3%) |
| 5 to 9 Minutes | 21 (17.6%) | 0 (0.0%) |
| 10 to 14 Minutes | 0 (0.0%) | 0 (0.0%) |
| 15 to 19 Minutes | 0 (0.0%) | 20 (14.1%) |
| 20 to 24 Minutes | 17 (14.3%) | 47 (33.1%) |
| 25 to 29 Minutes | 0 (0.0%) | 0 (0.0%) |
| 30 to 34 Minutes | 21 (17.6%) | 11 (7.7%) |
| 35 to 39 Minutes | 0 (0.0%) | 0 (0.0%) |
| 40 to 44 Minutes | 41 (34.4%) | 48 (33.8%) |
| 45 to 59 Minutes | 0 (0.0%) | 0 (0.0%) |
| 60 to 89 Minutes | 0 (0.0%) | 0 (0.0%) |
| 90 or more Minutes | 0 (0.0%) | 0 (0.0%) |
Time of Departure to Work by Sex in Charlestown
The most frequent times of departure to work in Charlestown are 7:00 AM to 7:29 AM (81, 68.1%) for males and 6:00 AM to 6:29 AM (95, 66.9%) for females.
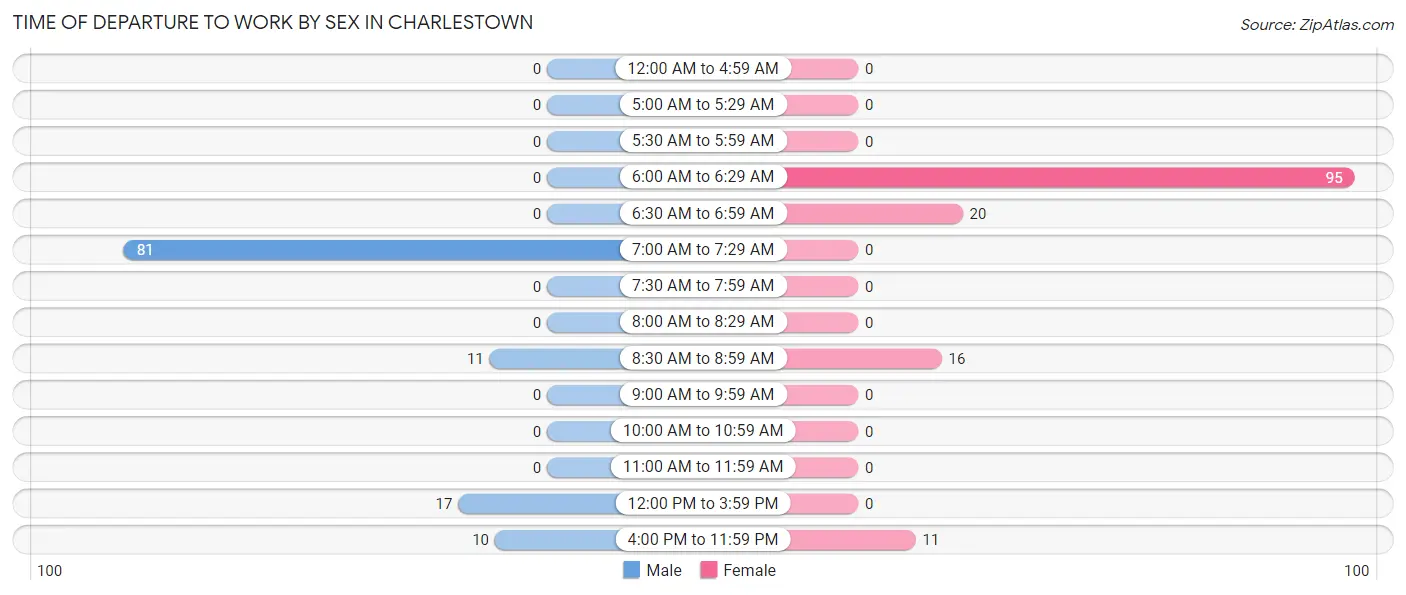
| Time of Departure | Male | Female |
| 12:00 AM to 4:59 AM | 0 (0.0%) | 0 (0.0%) |
| 5:00 AM to 5:29 AM | 0 (0.0%) | 0 (0.0%) |
| 5:30 AM to 5:59 AM | 0 (0.0%) | 0 (0.0%) |
| 6:00 AM to 6:29 AM | 0 (0.0%) | 95 (66.9%) |
| 6:30 AM to 6:59 AM | 0 (0.0%) | 20 (14.1%) |
| 7:00 AM to 7:29 AM | 81 (68.1%) | 0 (0.0%) |
| 7:30 AM to 7:59 AM | 0 (0.0%) | 0 (0.0%) |
| 8:00 AM to 8:29 AM | 0 (0.0%) | 0 (0.0%) |
| 8:30 AM to 8:59 AM | 11 (9.2%) | 16 (11.3%) |
| 9:00 AM to 9:59 AM | 0 (0.0%) | 0 (0.0%) |
| 10:00 AM to 10:59 AM | 0 (0.0%) | 0 (0.0%) |
| 11:00 AM to 11:59 AM | 0 (0.0%) | 0 (0.0%) |
| 12:00 PM to 3:59 PM | 17 (14.3%) | 0 (0.0%) |
| 4:00 PM to 11:59 PM | 10 (8.4%) | 11 (7.7%) |
| Total | 119 (100.0%) | 142 (100.0%) |
Housing Occupancy in Charlestown
Occupancy by Ownership in Charlestown
Of the total 443 dwellings in Charlestown, owner-occupied units account for 234 (52.8%), while renter-occupied units make up 209 (47.2%).
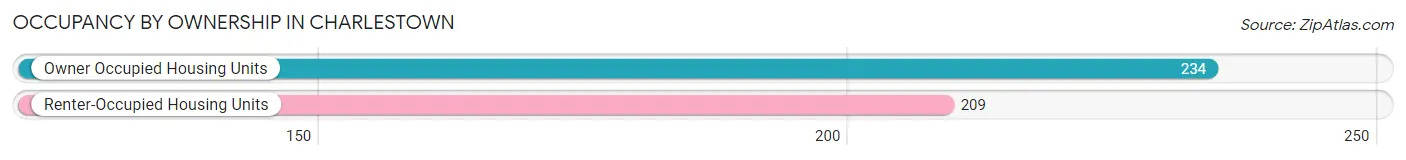
| Occupancy | # Housing Units | % Housing Units |
| Owner Occupied Housing Units | 234 | 52.8% |
| Renter-Occupied Housing Units | 209 | 47.2% |
| Total Occupied Housing Units | 443 | 100.0% |
Occupancy by Household Size in Charlestown
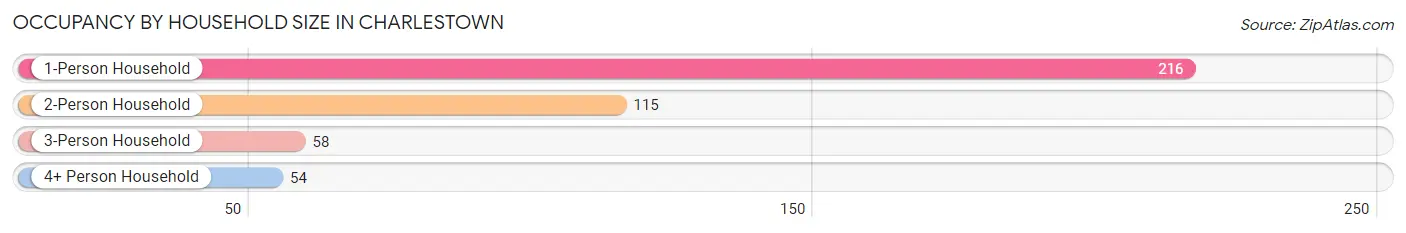
| Household Size | # Housing Units | % Housing Units |
| 1-Person Household | 216 | 48.8% |
| 2-Person Household | 115 | 26.0% |
| 3-Person Household | 58 | 13.1% |
| 4+ Person Household | 54 | 12.2% |
| Total Housing Units | 443 | 100.0% |
Occupancy by Ownership by Household Size in Charlestown
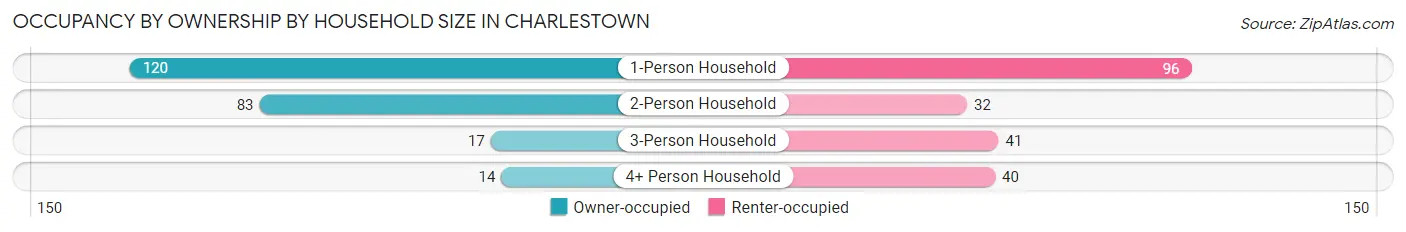
| Household Size | Owner-occupied | Renter-occupied |
| 1-Person Household | 120 (55.6%) | 96 (44.4%) |
| 2-Person Household | 83 (72.2%) | 32 (27.8%) |
| 3-Person Household | 17 (29.3%) | 41 (70.7%) |
| 4+ Person Household | 14 (25.9%) | 40 (74.1%) |
| Total Housing Units | 234 (52.8%) | 209 (47.2%) |
Occupancy by Educational Attainment in Charlestown
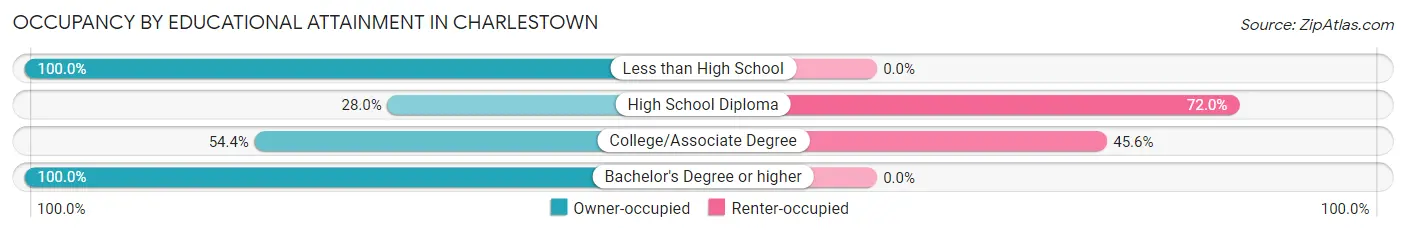
| Household Size | Owner-occupied | Renter-occupied |
| Less than High School | 57 (100.0%) | 0 (0.0%) |
| High School Diploma | 53 (28.0%) | 136 (72.0%) |
| College/Associate Degree | 87 (54.4%) | 73 (45.6%) |
| Bachelor's Degree or higher | 37 (100.0%) | 0 (0.0%) |
Occupancy by Age of Householder in Charlestown
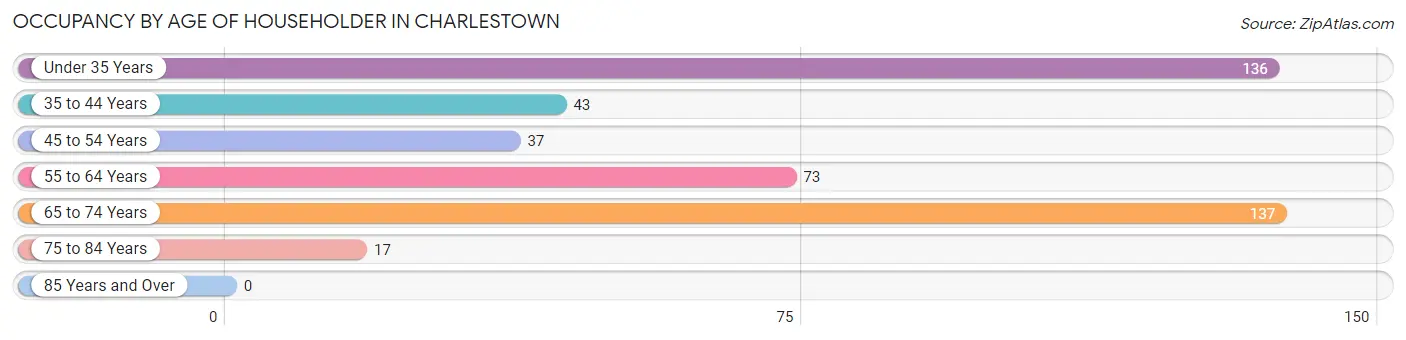
| Age Bracket | # Households | % Households |
| Under 35 Years | 136 | 30.7% |
| 35 to 44 Years | 43 | 9.7% |
| 45 to 54 Years | 37 | 8.4% |
| 55 to 64 Years | 73 | 16.5% |
| 65 to 74 Years | 137 | 30.9% |
| 75 to 84 Years | 17 | 3.8% |
| 85 Years and Over | 0 | 0.0% |
| Total | 443 | 100.0% |
Housing Finances in Charlestown
Median Income by Occupancy in Charlestown
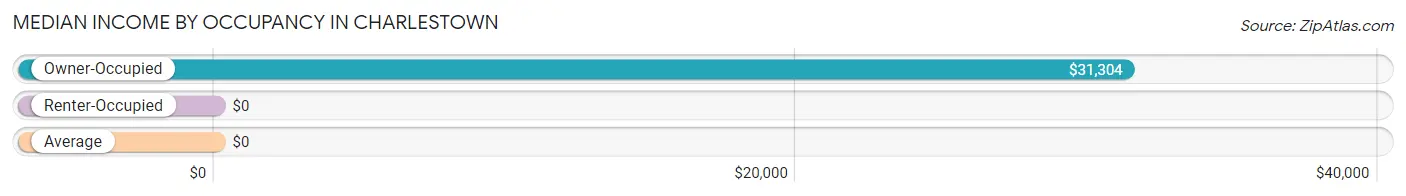
| Occupancy Type | # Households | Median Income |
| Owner-Occupied | 234 (52.8%) | $31,304 |
| Renter-Occupied | 209 (47.2%) | $0 |
| Average | 443 (100.0%) | $0 |
Occupancy by Householder Income Bracket in Charlestown
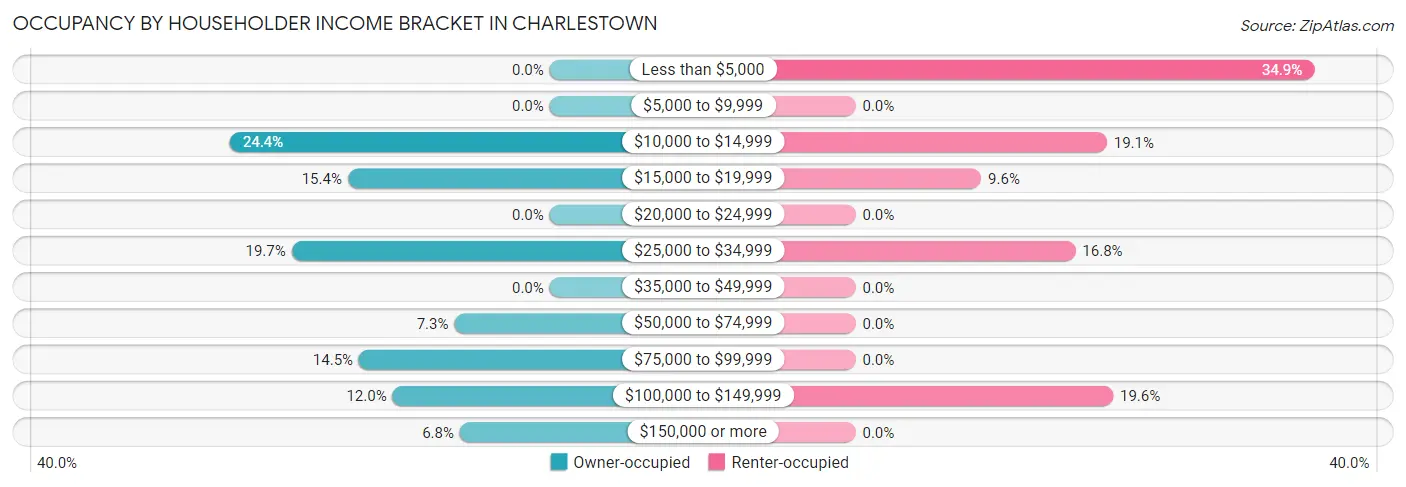
| Income Bracket | Owner-occupied | Renter-occupied |
| Less than $5,000 | 0 (0.0%) | 73 (34.9%) |
| $5,000 to $9,999 | 0 (0.0%) | 0 (0.0%) |
| $10,000 to $14,999 | 57 (24.4%) | 40 (19.1%) |
| $15,000 to $19,999 | 36 (15.4%) | 20 (9.6%) |
| $20,000 to $24,999 | 0 (0.0%) | 0 (0.0%) |
| $25,000 to $34,999 | 46 (19.7%) | 35 (16.8%) |
| $35,000 to $49,999 | 0 (0.0%) | 0 (0.0%) |
| $50,000 to $74,999 | 17 (7.3%) | 0 (0.0%) |
| $75,000 to $99,999 | 34 (14.5%) | 0 (0.0%) |
| $100,000 to $149,999 | 28 (12.0%) | 41 (19.6%) |
| $150,000 or more | 16 (6.8%) | 0 (0.0%) |
| Total | 234 (100.0%) | 209 (100.0%) |
Monthly Housing Cost Tiers in Charlestown
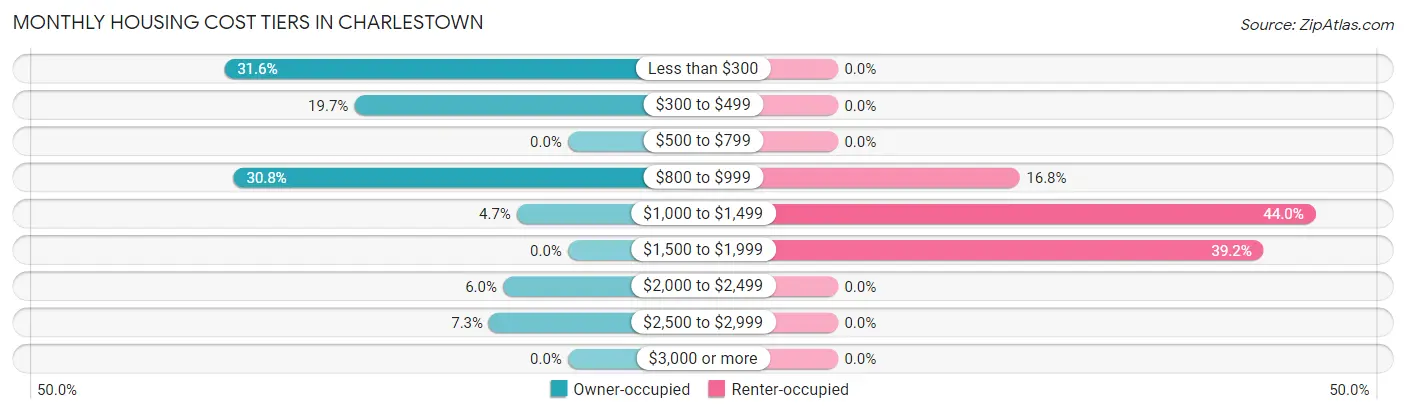
| Monthly Cost | Owner-occupied | Renter-occupied |
| Less than $300 | 74 (31.6%) | 0 (0.0%) |
| $300 to $499 | 46 (19.7%) | 0 (0.0%) |
| $500 to $799 | 0 (0.0%) | 0 (0.0%) |
| $800 to $999 | 72 (30.8%) | 35 (16.8%) |
| $1,000 to $1,499 | 11 (4.7%) | 92 (44.0%) |
| $1,500 to $1,999 | 0 (0.0%) | 82 (39.2%) |
| $2,000 to $2,499 | 14 (6.0%) | 0 (0.0%) |
| $2,500 to $2,999 | 17 (7.3%) | 0 (0.0%) |
| $3,000 or more | 0 (0.0%) | 0 (0.0%) |
| Total | 234 (100.0%) | 209 (100.0%) |
Physical Housing Characteristics in Charlestown
Housing Structures in Charlestown
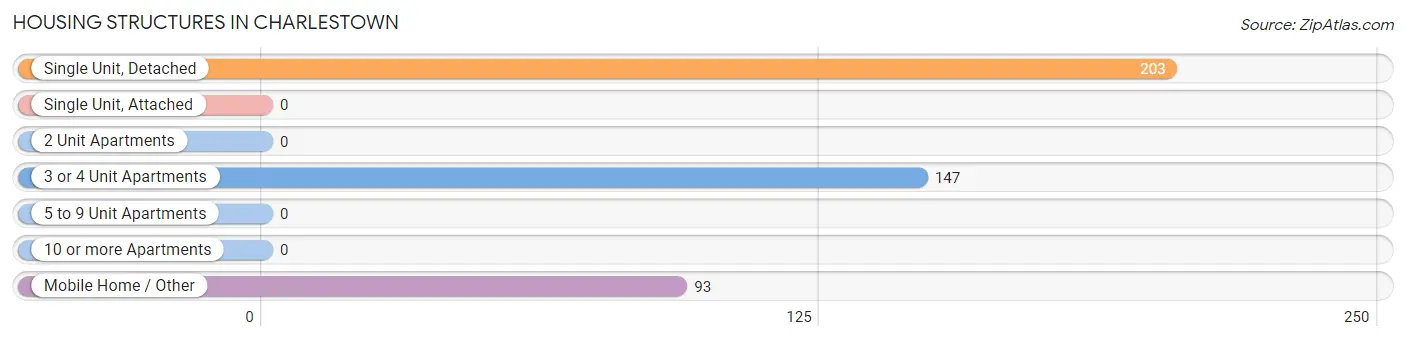
| Structure Type | # Housing Units | % Housing Units |
| Single Unit, Detached | 203 | 45.8% |
| Single Unit, Attached | 0 | 0.0% |
| 2 Unit Apartments | 0 | 0.0% |
| 3 or 4 Unit Apartments | 147 | 33.2% |
| 5 to 9 Unit Apartments | 0 | 0.0% |
| 10 or more Apartments | 0 | 0.0% |
| Mobile Home / Other | 93 | 21.0% |
| Total | 443 | 100.0% |
Housing Structures by Occupancy in Charlestown
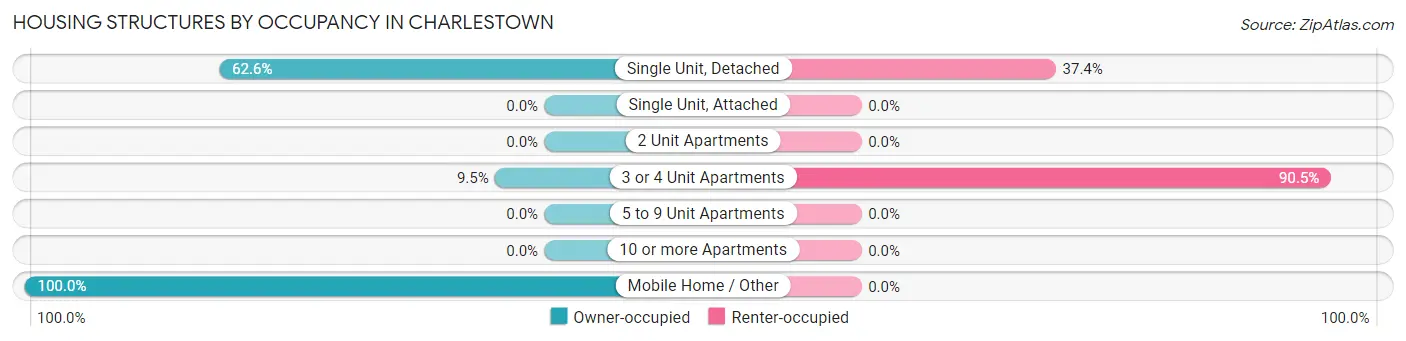
| Structure Type | Owner-occupied | Renter-occupied |
| Single Unit, Detached | 127 (62.6%) | 76 (37.4%) |
| Single Unit, Attached | 0 (0.0%) | 0 (0.0%) |
| 2 Unit Apartments | 0 (0.0%) | 0 (0.0%) |
| 3 or 4 Unit Apartments | 14 (9.5%) | 133 (90.5%) |
| 5 to 9 Unit Apartments | 0 (0.0%) | 0 (0.0%) |
| 10 or more Apartments | 0 (0.0%) | 0 (0.0%) |
| Mobile Home / Other | 93 (100.0%) | 0 (0.0%) |
| Total | 234 (52.8%) | 209 (47.2%) |
Housing Structures by Number of Rooms in Charlestown
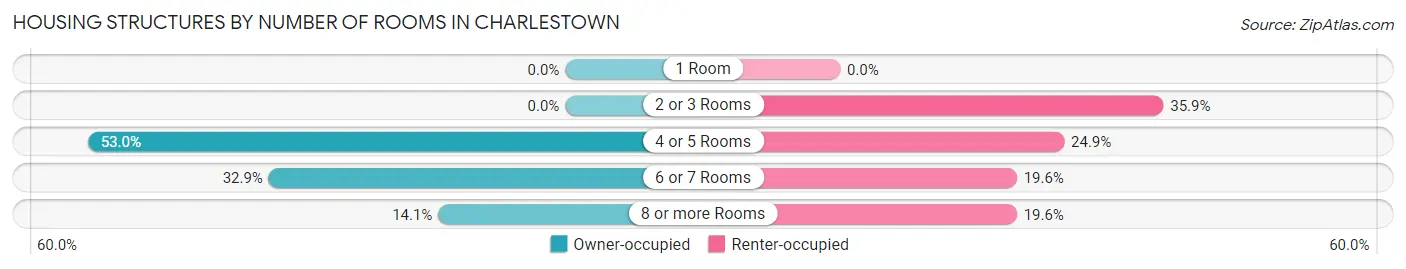
| Number of Rooms | Owner-occupied | Renter-occupied |
| 1 Room | 0 (0.0%) | 0 (0.0%) |
| 2 or 3 Rooms | 0 (0.0%) | 75 (35.9%) |
| 4 or 5 Rooms | 124 (53.0%) | 52 (24.9%) |
| 6 or 7 Rooms | 77 (32.9%) | 41 (19.6%) |
| 8 or more Rooms | 33 (14.1%) | 41 (19.6%) |
| Total | 234 (100.0%) | 209 (100.0%) |
Housing Structure by Heating Type in Charlestown
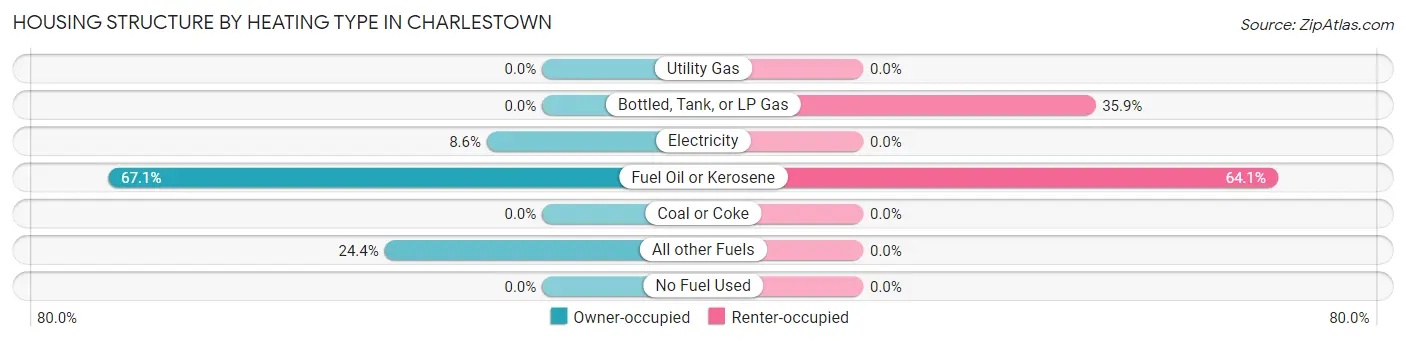
| Heating Type | Owner-occupied | Renter-occupied |
| Utility Gas | 0 (0.0%) | 0 (0.0%) |
| Bottled, Tank, or LP Gas | 0 (0.0%) | 75 (35.9%) |
| Electricity | 20 (8.6%) | 0 (0.0%) |
| Fuel Oil or Kerosene | 157 (67.1%) | 134 (64.1%) |
| Coal or Coke | 0 (0.0%) | 0 (0.0%) |
| All other Fuels | 57 (24.4%) | 0 (0.0%) |
| No Fuel Used | 0 (0.0%) | 0 (0.0%) |
| Total | 234 (100.0%) | 209 (100.0%) |
Household Vehicle Usage in Charlestown
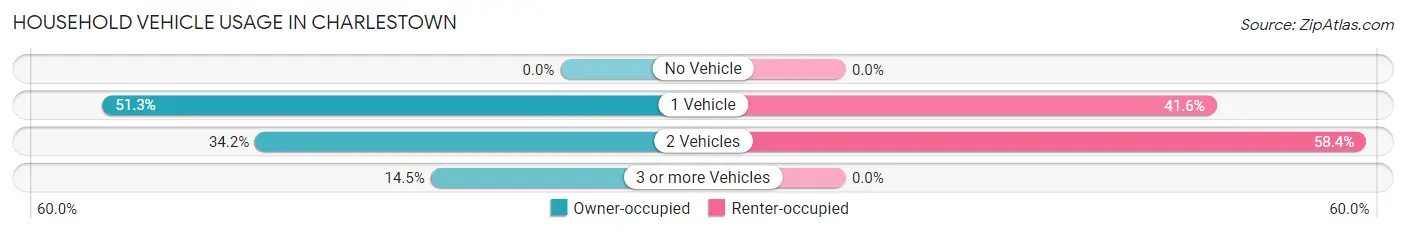
| Vehicles per Household | Owner-occupied | Renter-occupied |
| No Vehicle | 0 (0.0%) | 0 (0.0%) |
| 1 Vehicle | 120 (51.3%) | 87 (41.6%) |
| 2 Vehicles | 80 (34.2%) | 122 (58.4%) |
| 3 or more Vehicles | 34 (14.5%) | 0 (0.0%) |
| Total | 234 (100.0%) | 209 (100.0%) |
Real Estate & Mortgages in Charlestown
Real Estate and Mortgage Overview in Charlestown
| Characteristic | Without Mortgage | With Mortgage |
| Housing Units | 172 | 62 |
| Median Property Value | $85,800 | $0 |
| Median Household Income | - | - |
| Monthly Housing Costs | - | - |
| Real Estate Taxes | $3,489 | $0 |
Property Value by Mortgage Status in Charlestown
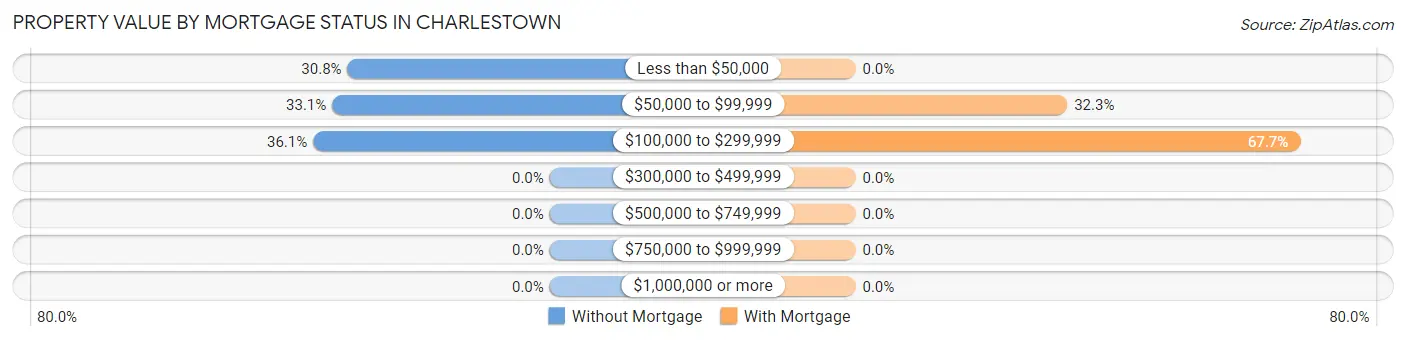
| Property Value | Without Mortgage | With Mortgage |
| Less than $50,000 | 53 (30.8%) | 0 (0.0%) |
| $50,000 to $99,999 | 57 (33.1%) | 20 (32.3%) |
| $100,000 to $299,999 | 62 (36.0%) | 42 (67.7%) |
| $300,000 to $499,999 | 0 (0.0%) | 0 (0.0%) |
| $500,000 to $749,999 | 0 (0.0%) | 0 (0.0%) |
| $750,000 to $999,999 | 0 (0.0%) | 0 (0.0%) |
| $1,000,000 or more | 0 (0.0%) | 0 (0.0%) |
| Total | 172 (100.0%) | 62 (100.0%) |
Household Income by Mortgage Status in Charlestown
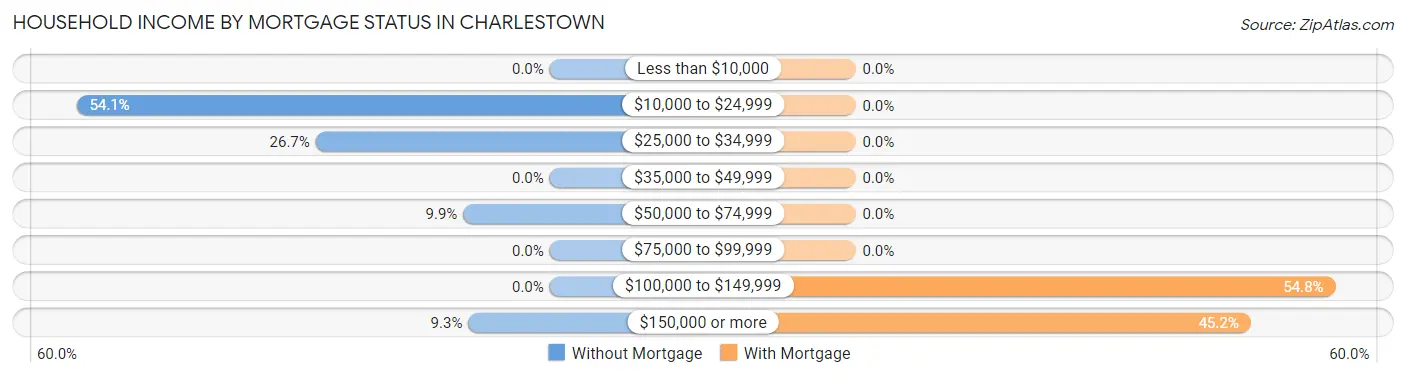
| Household Income | Without Mortgage | With Mortgage |
| Less than $10,000 | 0 (0.0%) | 0 (0.0%) |
| $10,000 to $24,999 | 93 (54.1%) | 0 (0.0%) |
| $25,000 to $34,999 | 46 (26.7%) | 0 (0.0%) |
| $35,000 to $49,999 | 0 (0.0%) | 0 (0.0%) |
| $50,000 to $74,999 | 17 (9.9%) | 0 (0.0%) |
| $75,000 to $99,999 | 0 (0.0%) | 0 (0.0%) |
| $100,000 to $149,999 | 0 (0.0%) | 34 (54.8%) |
| $150,000 or more | 16 (9.3%) | 28 (45.2%) |
| Total | 172 (100.0%) | 62 (100.0%) |
Property Value to Household Income Ratio in Charlestown
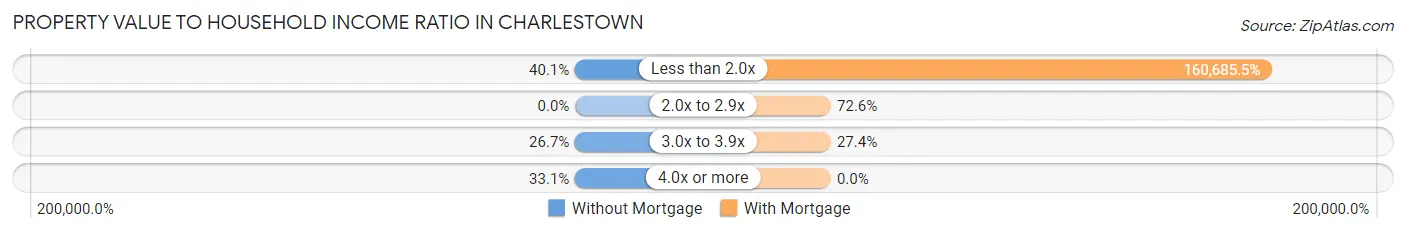
| Value-to-Income Ratio | Without Mortgage | With Mortgage |
| Less than 2.0x | 69 (40.1%) | 99,625 (160,685.5%) |
| 2.0x to 2.9x | 0 (0.0%) | 45 (72.6%) |
| 3.0x to 3.9x | 46 (26.7%) | 17 (27.4%) |
| 4.0x or more | 57 (33.1%) | 0 (0.0%) |
| Total | 172 (100.0%) | 62 (100.0%) |
Real Estate Taxes by Mortgage Status in Charlestown
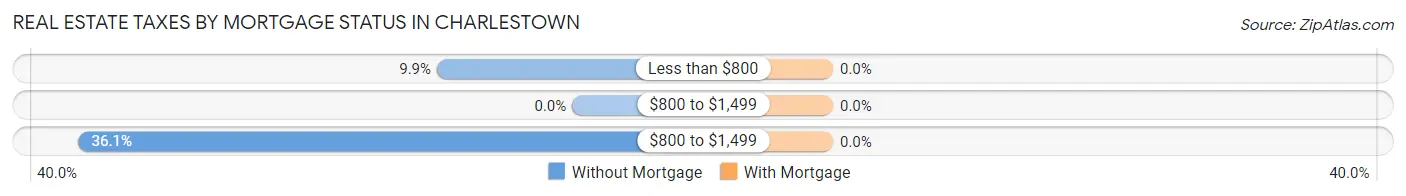
| Property Taxes | Without Mortgage | With Mortgage |
| Less than $800 | 17 (9.9%) | 0 (0.0%) |
| $800 to $1,499 | 0 (0.0%) | 0 (0.0%) |
| $800 to $1,499 | 62 (36.0%) | 0 (0.0%) |
| Total | 172 (100.0%) | 62 (100.0%) |
Health & Disability in Charlestown
Health Insurance Coverage by Age in Charlestown
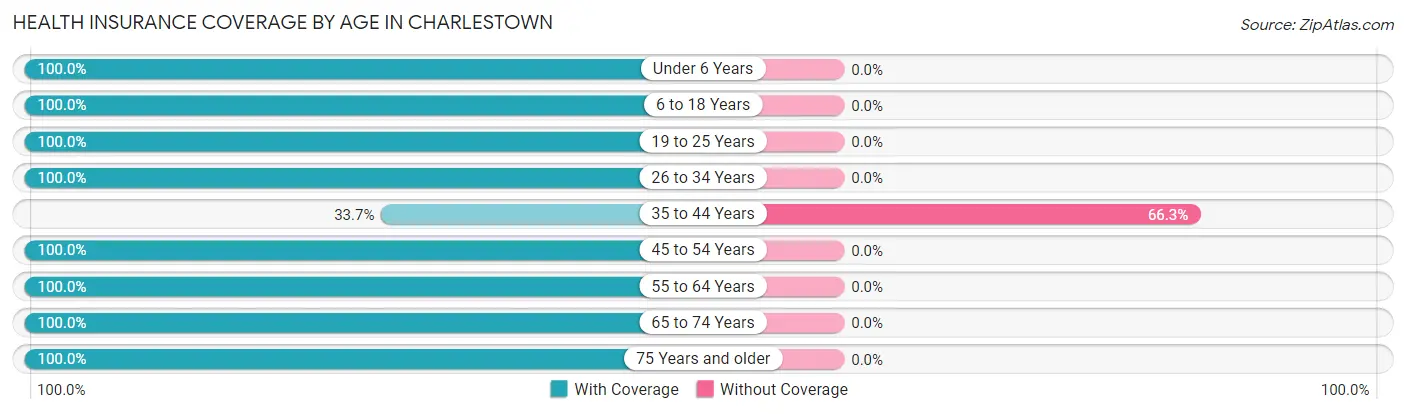
| Age Bracket | With Coverage | Without Coverage |
| Under 6 Years | 151 (100.0%) | 0 (0.0%) |
| 6 to 18 Years | 88 (100.0%) | 0 (0.0%) |
| 19 to 25 Years | 74 (100.0%) | 0 (0.0%) |
| 26 to 34 Years | 143 (100.0%) | 0 (0.0%) |
| 35 to 44 Years | 32 (33.7%) | 63 (66.3%) |
| 45 to 54 Years | 37 (100.0%) | 0 (0.0%) |
| 55 to 64 Years | 157 (100.0%) | 0 (0.0%) |
| 65 to 74 Years | 156 (100.0%) | 0 (0.0%) |
| 75 Years and older | 17 (100.0%) | 0 (0.0%) |
| Total | 855 (93.1%) | 63 (6.9%) |
Health Insurance Coverage by Citizenship Status in Charlestown
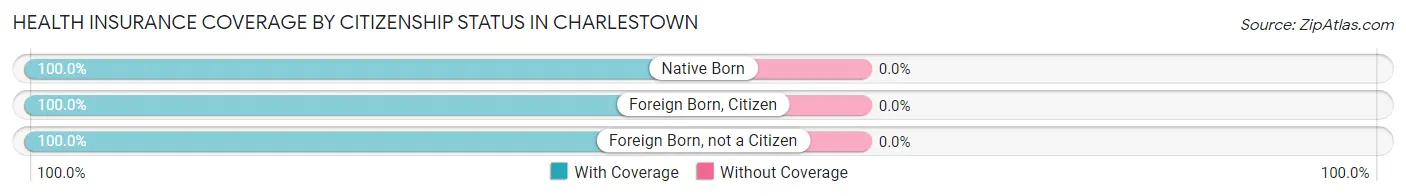
| Citizenship Status | With Coverage | Without Coverage |
| Native Born | 151 (100.0%) | 0 (0.0%) |
| Foreign Born, Citizen | 88 (100.0%) | 0 (0.0%) |
| Foreign Born, not a Citizen | 74 (100.0%) | 0 (0.0%) |
Health Insurance Coverage by Household Income in Charlestown
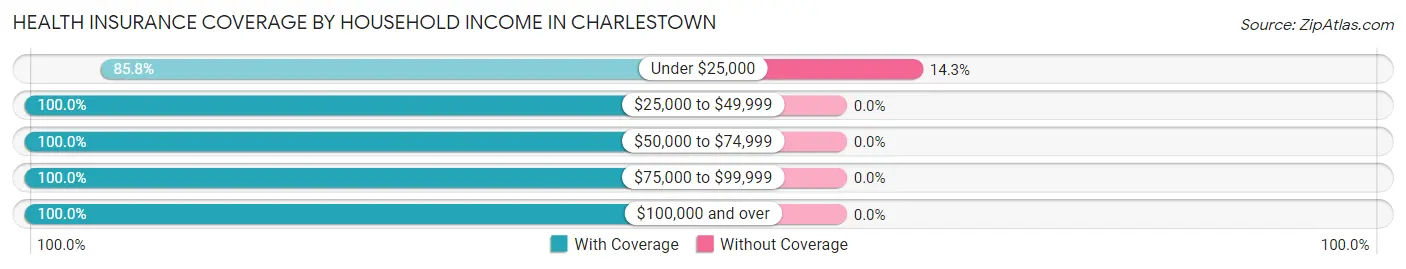
| Household Income | With Coverage | Without Coverage |
| Under $25,000 | 379 (85.8%) | 63 (14.2%) |
| $25,000 to $49,999 | 81 (100.0%) | 0 (0.0%) |
| $50,000 to $74,999 | 17 (100.0%) | 0 (0.0%) |
| $75,000 to $99,999 | 107 (100.0%) | 0 (0.0%) |
| $100,000 and over | 271 (100.0%) | 0 (0.0%) |
Public vs Private Health Insurance Coverage by Age in Charlestown
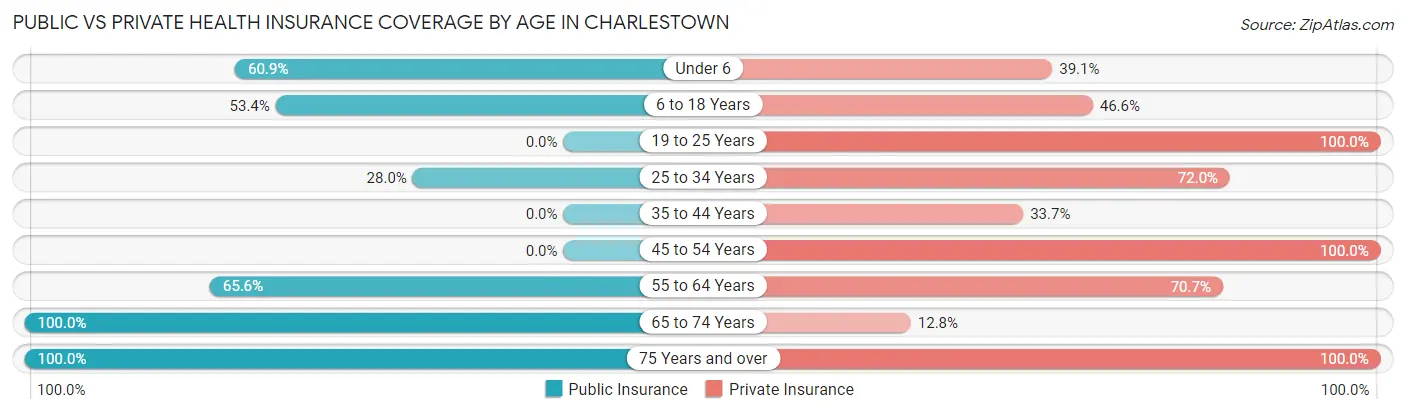
| Age Bracket | Public Insurance | Private Insurance |
| Under 6 | 92 (60.9%) | 59 (39.1%) |
| 6 to 18 Years | 47 (53.4%) | 41 (46.6%) |
| 19 to 25 Years | 0 (0.0%) | 74 (100.0%) |
| 25 to 34 Years | 40 (28.0%) | 103 (72.0%) |
| 35 to 44 Years | 0 (0.0%) | 32 (33.7%) |
| 45 to 54 Years | 0 (0.0%) | 37 (100.0%) |
| 55 to 64 Years | 103 (65.6%) | 111 (70.7%) |
| 65 to 74 Years | 156 (100.0%) | 20 (12.8%) |
| 75 Years and over | 17 (100.0%) | 17 (100.0%) |
| Total | 455 (49.6%) | 494 (53.8%) |
Disability Status by Sex by Age in Charlestown
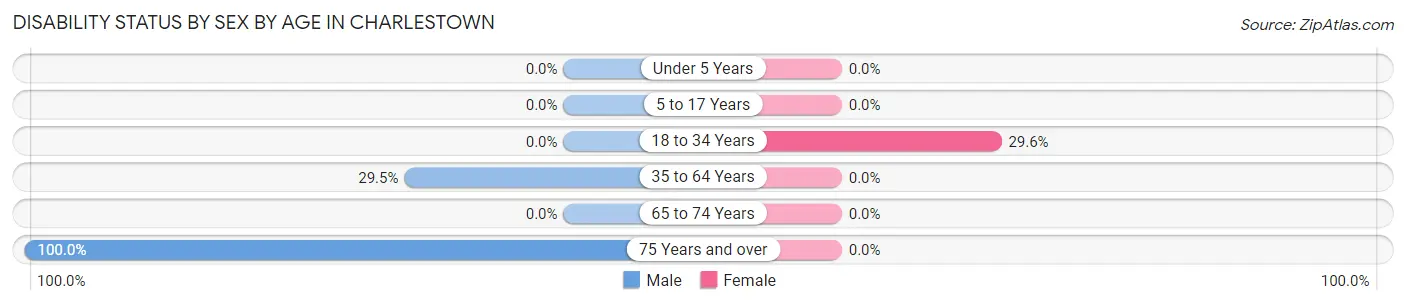
| Age Bracket | Male | Female |
| Under 5 Years | 0 (0.0%) | 0 (0.0%) |
| 5 to 17 Years | 0 (0.0%) | 0 (0.0%) |
| 18 to 34 Years | 0 (0.0%) | 40 (29.6%) |
| 35 to 64 Years | 57 (29.5%) | 0 (0.0%) |
| 65 to 74 Years | 0 (0.0%) | 0 (0.0%) |
| 75 Years and over | 17 (100.0%) | 0 (0.0%) |
Disability Class by Sex by Age in Charlestown
Disability Class: Hearing Difficulty
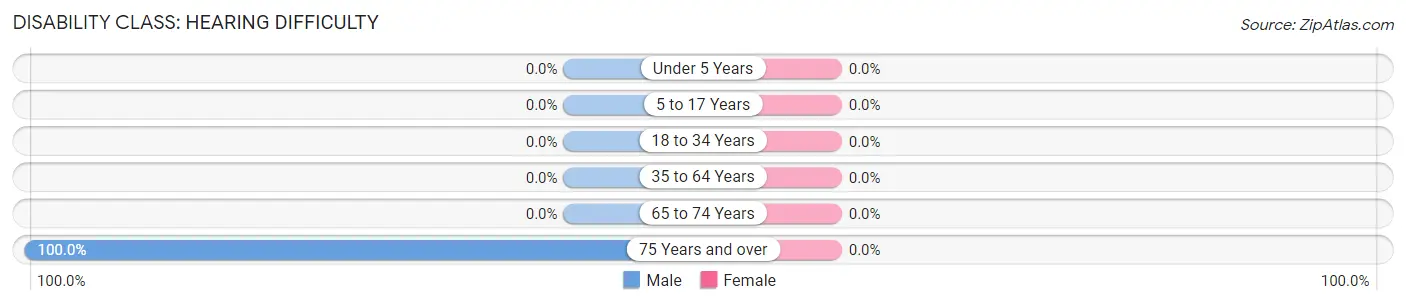
| Age Bracket | Male | Female |
| Under 5 Years | 0 (0.0%) | 0 (0.0%) |
| 5 to 17 Years | 0 (0.0%) | 0 (0.0%) |
| 18 to 34 Years | 0 (0.0%) | 0 (0.0%) |
| 35 to 64 Years | 0 (0.0%) | 0 (0.0%) |
| 65 to 74 Years | 0 (0.0%) | 0 (0.0%) |
| 75 Years and over | 17 (100.0%) | 0 (0.0%) |
Disability Class: Vision Difficulty
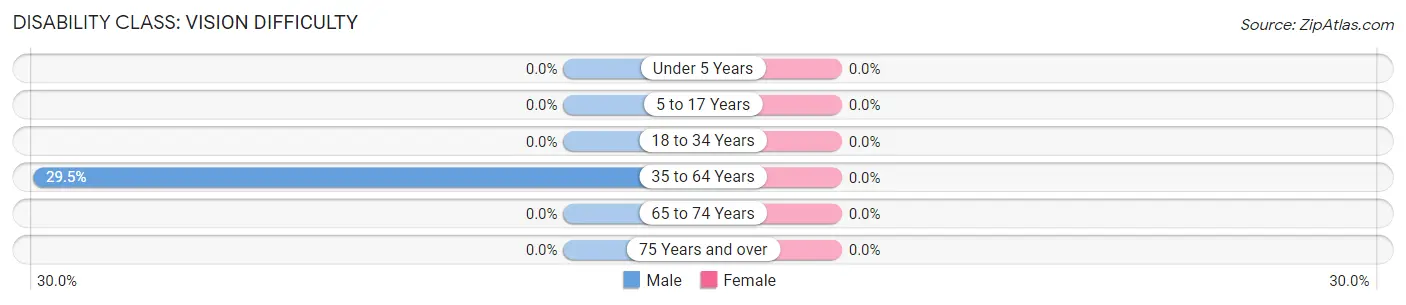
| Age Bracket | Male | Female |
| Under 5 Years | 0 (0.0%) | 0 (0.0%) |
| 5 to 17 Years | 0 (0.0%) | 0 (0.0%) |
| 18 to 34 Years | 0 (0.0%) | 0 (0.0%) |
| 35 to 64 Years | 57 (29.5%) | 0 (0.0%) |
| 65 to 74 Years | 0 (0.0%) | 0 (0.0%) |
| 75 Years and over | 0 (0.0%) | 0 (0.0%) |
Disability Class: Cognitive Difficulty
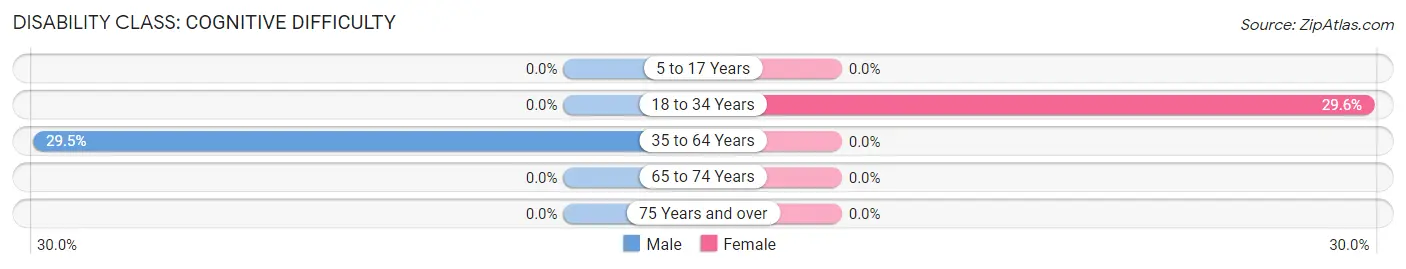
| Age Bracket | Male | Female |
| 5 to 17 Years | 0 (0.0%) | 0 (0.0%) |
| 18 to 34 Years | 0 (0.0%) | 40 (29.6%) |
| 35 to 64 Years | 57 (29.5%) | 0 (0.0%) |
| 65 to 74 Years | 0 (0.0%) | 0 (0.0%) |
| 75 Years and over | 0 (0.0%) | 0 (0.0%) |
Disability Class: Ambulatory Difficulty
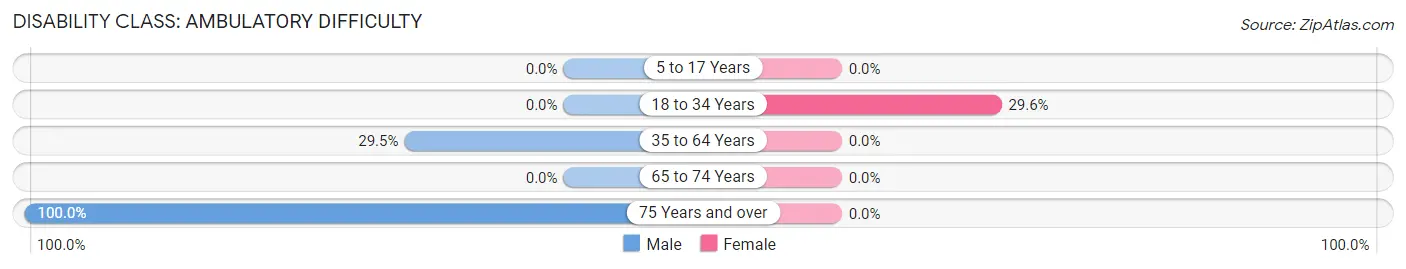
| Age Bracket | Male | Female |
| 5 to 17 Years | 0 (0.0%) | 0 (0.0%) |
| 18 to 34 Years | 0 (0.0%) | 40 (29.6%) |
| 35 to 64 Years | 57 (29.5%) | 0 (0.0%) |
| 65 to 74 Years | 0 (0.0%) | 0 (0.0%) |
| 75 Years and over | 17 (100.0%) | 0 (0.0%) |
Disability Class: Self-Care Difficulty
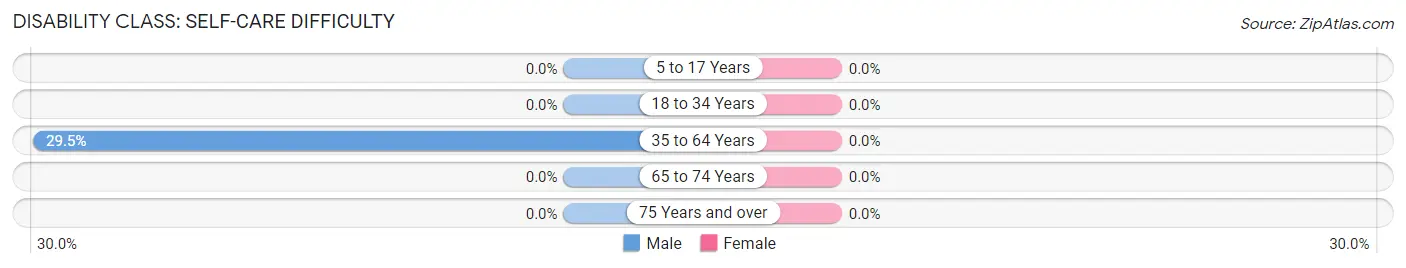
| Age Bracket | Male | Female |
| 5 to 17 Years | 0 (0.0%) | 0 (0.0%) |
| 18 to 34 Years | 0 (0.0%) | 0 (0.0%) |
| 35 to 64 Years | 57 (29.5%) | 0 (0.0%) |
| 65 to 74 Years | 0 (0.0%) | 0 (0.0%) |
| 75 Years and over | 0 (0.0%) | 0 (0.0%) |
Technology Access in Charlestown
Computing Device Access in Charlestown
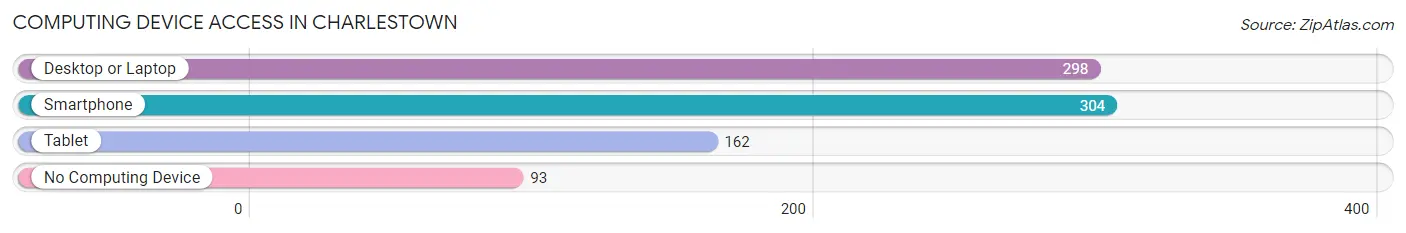
| Device Type | # Households | % Households |
| Desktop or Laptop | 298 | 67.3% |
| Smartphone | 304 | 68.6% |
| Tablet | 162 | 36.6% |
| No Computing Device | 93 | 21.0% |
| Total | 443 | 100.0% |
Internet Access in Charlestown
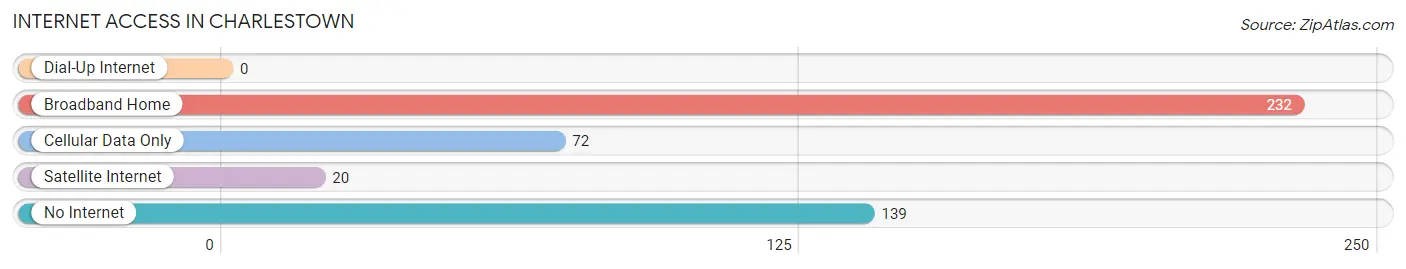
| Internet Type | # Households | % Households |
| Dial-Up Internet | 0 | 0.0% |
| Broadband Home | 232 | 52.4% |
| Cellular Data Only | 72 | 16.3% |
| Satellite Internet | 20 | 4.5% |
| No Internet | 139 | 31.4% |
| Total | 443 | 100.0% |
Charlestown Summary
Charlestown, New Hampshire is a small town located in Sullivan County, in the southwestern corner of the state. It is bordered by the Connecticut River to the west, and the towns of Walpole and Langdon to the north and east, respectively. The town has a population of approximately 2,500 people, and is part of the larger Keene-Claremont-Lebanon metropolitan area.
History
Charlestown was first settled in 1753 by a group of settlers from Massachusetts. The town was named after Charles Townshend, the British Chancellor of the Exchequer at the time. The town was incorporated in 1765, and was the first town in Sullivan County to be incorporated.
In the late 18th century, Charlestown was a major center of the Revolutionary War. The town was the site of the Battle of Charlestown, which was fought between the British and American forces in 1777. The battle was a major victory for the Americans, and helped to turn the tide of the war in their favor.
In the 19th century, Charlestown was an important center of industry. The town was home to several mills, including a paper mill, a woolen mill, and a grist mill. The town also had a thriving lumber industry, and was home to several sawmills.
Geography
Charlestown is located in the southwestern corner of Sullivan County, in the southwestern corner of New Hampshire. The town is bordered by the Connecticut River to the west, and the towns of Walpole and Langdon to the north and east, respectively. The town has a total area of 24.2 square miles, of which 24.1 square miles is land and 0.1 square miles is water.
The town is located in the Connecticut River Valley, and is surrounded by rolling hills and forests. The town is home to several small lakes, including Lake Massasecum, which is the largest lake in the town.
Economy
Charlestown has a diverse economy, with a mix of manufacturing, retail, and service industries. The town is home to several manufacturing companies, including a paper mill, a woolen mill, and a grist mill. The town also has a thriving lumber industry, and is home to several sawmills.
The town is also home to several retail businesses, including several antique stores, a grocery store, and a hardware store. The town also has several restaurants, including a diner and a pizza shop.
Demographics
As of the 2010 census, Charlestown had a population of 2,500 people. The racial makeup of the town was 97.2% White, 0.8% African American, 0.4% Native American, 0.4% Asian, and 0.2% from other races. Hispanic or Latino of any race were 0.8% of the population.
The median household income in Charlestown was $45,000, and the median family income was $50,000. The per capita income for the town was $20,000. About 8.5% of families and 10.2% of the population were below the poverty line, including 14.3% of those under age 18 and 5.2% of those age 65 or over.
Common Questions
What is Per Capita Income in Charlestown?
Per Capita income in Charlestown is $28,258.
What is Inequality or Gini Index in Charlestown?
Inequality or Gini Index in Charlestown is 0.63.
What is the Total Population of Charlestown?
Total Population of Charlestown is 934.
What is the Total Male Population of Charlestown?
Total Male Population of Charlestown is 450.
What is the Total Female Population of Charlestown?
Total Female Population of Charlestown is 484.
What is the Ratio of Males per 100 Females in Charlestown?
There are 92.98 Males per 100 Females in Charlestown.
What is the Ratio of Females per 100 Males in Charlestown?
There are 107.56 Females per 100 Males in Charlestown.
What is the Median Population Age in Charlestown?
Median Population Age in Charlestown is 38.0 Years.
What is the Average Family Size in Charlestown
Average Family Size in Charlestown is 2.9 People.
What is the Average Household Size in Charlestown
Average Household Size in Charlestown is 2.1 People.
How Large is the Labor Force in Charlestown?
There are 278 People in the Labor Forcein in Charlestown.
What is the Percentage of People in the Labor Force in Charlestown?
40.0% of People are in the Labor Force in Charlestown.