Hillsborough, NH Map & Demographics
Hillsborough Map
Hillsborough Overview
$36,668
PER CAPITA INCOME
$74,402
AVG FAMILY INCOME
$63,854
AVG HOUSEHOLD INCOME
41.4%
WAGE / INCOME GAP [ % ]
58.6¢/ $1
WAGE / INCOME GAP [ $ ]
0.43
INEQUALITY / GINI INDEX
1,567
TOTAL POPULATION
742
MALE POPULATION
825
FEMALE POPULATION
89.94
MALES / 100 FEMALES
111.19
FEMALES / 100 MALES
50.6
MEDIAN AGE
2.7
AVG FAMILY SIZE
1.9
AVG HOUSEHOLD SIZE
778
LABOR FORCE [ PEOPLE ]
55.2%
PERCENT IN LABOR FORCE
Hillsborough Zip Codes
Hillsborough Area Codes
Income in Hillsborough
Income Overview in Hillsborough
Per Capita Income in Hillsborough is $36,668, while median incomes of families and households are $74,402 and $63,854 respectively.
| Characteristic | Number | Measure |
| Per Capita Income | 1,567 | $36,668 |
| Median Family Income | 385 | $74,402 |
| Mean Family Income | 385 | $78,125 |
| Median Household Income | 782 | $63,854 |
| Mean Household Income | 782 | $69,481 |
| Income Deficit | 385 | $0 |
| Wage / Income Gap (%) | 1,567 | 41.42% |
| Wage / Income Gap ($) | 1,567 | 58.58¢ per $1 |
| Gini / Inequality Index | 1,567 | 0.43 |
Earnings by Sex in Hillsborough
Average Earnings in Hillsborough are $44,367, $61,569 for men and $36,067 for women, a difference of 41.4%.
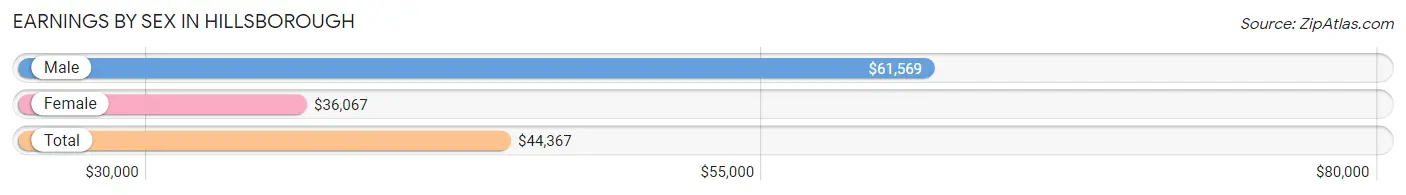
| Sex | Number | Average Earnings |
| Male | 399 (45.3%) | $61,569 |
| Female | 482 (54.7%) | $36,067 |
| Total | 881 (100.0%) | $44,367 |
Earnings by Sex by Income Bracket in Hillsborough
The most common earnings brackets in Hillsborough are $55,000 to $64,999 for men (112 | 28.1%) and $35,000 to $39,999 for women (94 | 19.5%).
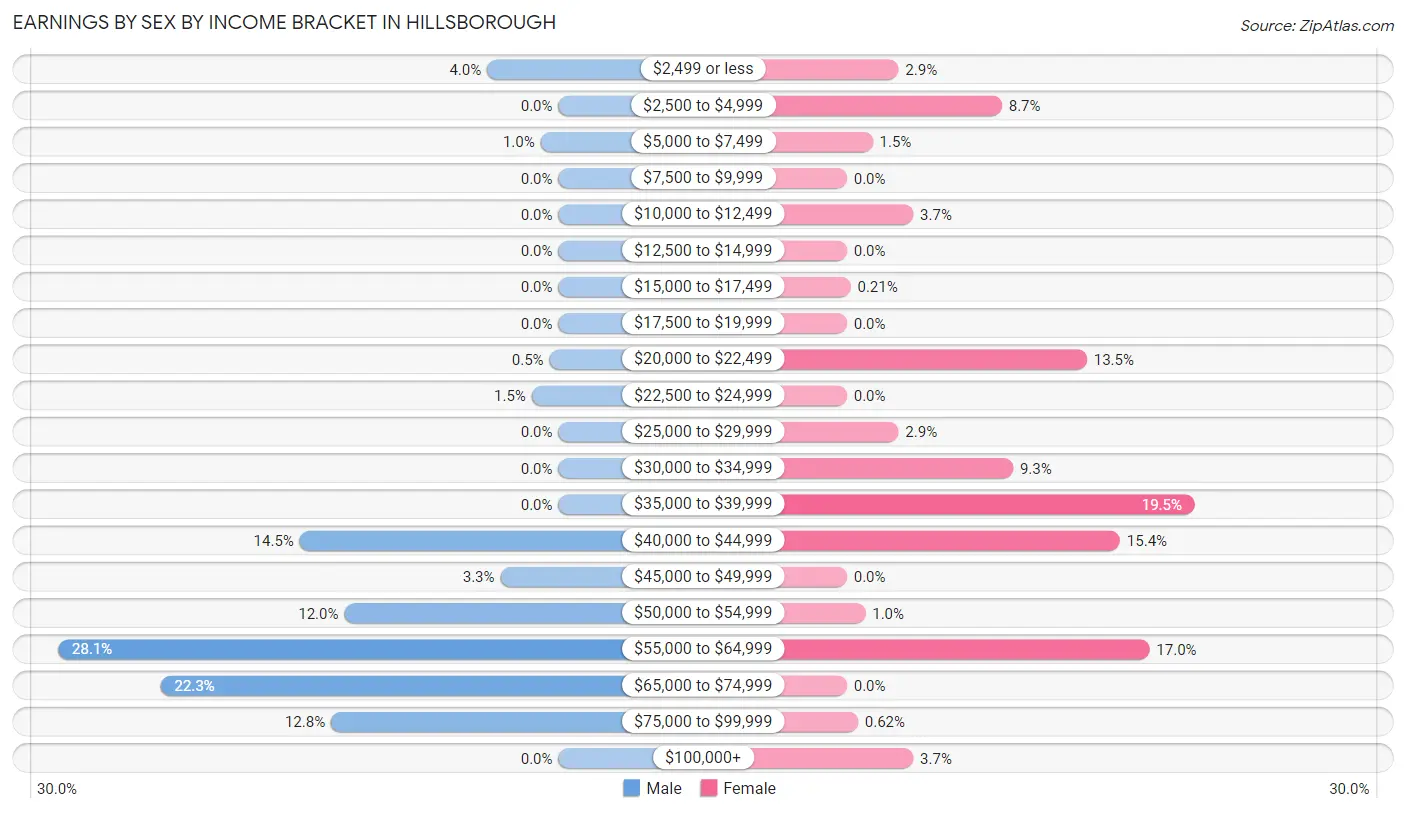
| Income | Male | Female |
| $2,499 or less | 16 (4.0%) | 14 (2.9%) |
| $2,500 to $4,999 | 0 (0.0%) | 42 (8.7%) |
| $5,000 to $7,499 | 4 (1.0%) | 7 (1.5%) |
| $7,500 to $9,999 | 0 (0.0%) | 0 (0.0%) |
| $10,000 to $12,499 | 0 (0.0%) | 18 (3.7%) |
| $12,500 to $14,999 | 0 (0.0%) | 0 (0.0%) |
| $15,000 to $17,499 | 0 (0.0%) | 1 (0.2%) |
| $17,500 to $19,999 | 0 (0.0%) | 0 (0.0%) |
| $20,000 to $22,499 | 2 (0.5%) | 65 (13.5%) |
| $22,500 to $24,999 | 6 (1.5%) | 0 (0.0%) |
| $25,000 to $29,999 | 0 (0.0%) | 14 (2.9%) |
| $30,000 to $34,999 | 0 (0.0%) | 45 (9.3%) |
| $35,000 to $39,999 | 0 (0.0%) | 94 (19.5%) |
| $40,000 to $44,999 | 58 (14.5%) | 74 (15.3%) |
| $45,000 to $49,999 | 13 (3.3%) | 0 (0.0%) |
| $50,000 to $54,999 | 48 (12.0%) | 5 (1.0%) |
| $55,000 to $64,999 | 112 (28.1%) | 82 (17.0%) |
| $65,000 to $74,999 | 89 (22.3%) | 0 (0.0%) |
| $75,000 to $99,999 | 51 (12.8%) | 3 (0.6%) |
| $100,000+ | 0 (0.0%) | 18 (3.7%) |
| Total | 399 (100.0%) | 482 (100.0%) |
Earnings by Sex by Educational Attainment in Hillsborough
Average earnings in Hillsborough are $62,340 for men and $36,387 for women, a difference of 41.6%. Men with an educational attainment of high school diploma enjoy the highest average annual earnings of $64,345, while those with college or associate's degree education earn the least with $57,083. Women with an educational attainment of bachelor's degree earn the most with the average annual earnings of $55,588, while those with college or associate's degree education have the smallest earnings of $35,655.
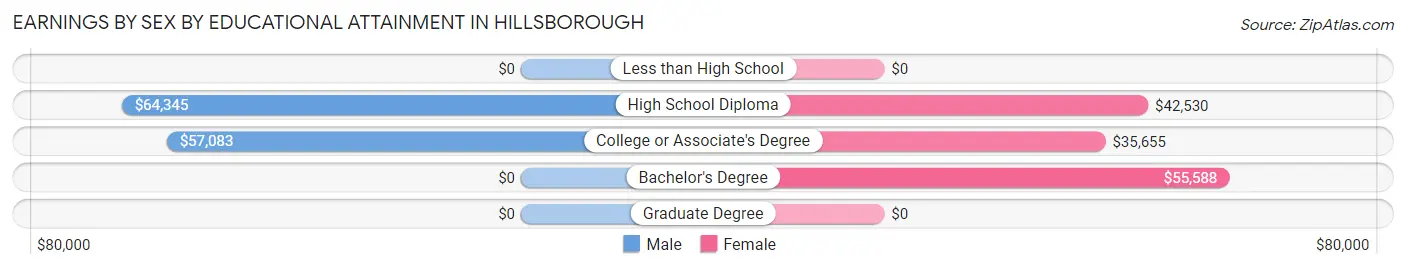
| Educational Attainment | Male Income | Female Income |
| Less than High School | - | - |
| High School Diploma | $64,345 | $42,530 |
| College or Associate's Degree | $57,083 | $35,655 |
| Bachelor's Degree | - | - |
| Graduate Degree | - | - |
| Total | $62,340 | $36,387 |
Family Income in Hillsborough
Family Income Brackets in Hillsborough
According to the Hillsborough family income data, there are 144 families falling into the $100,000 to $149,999 income range, which is the most common income bracket and makes up 37.4% of all families.
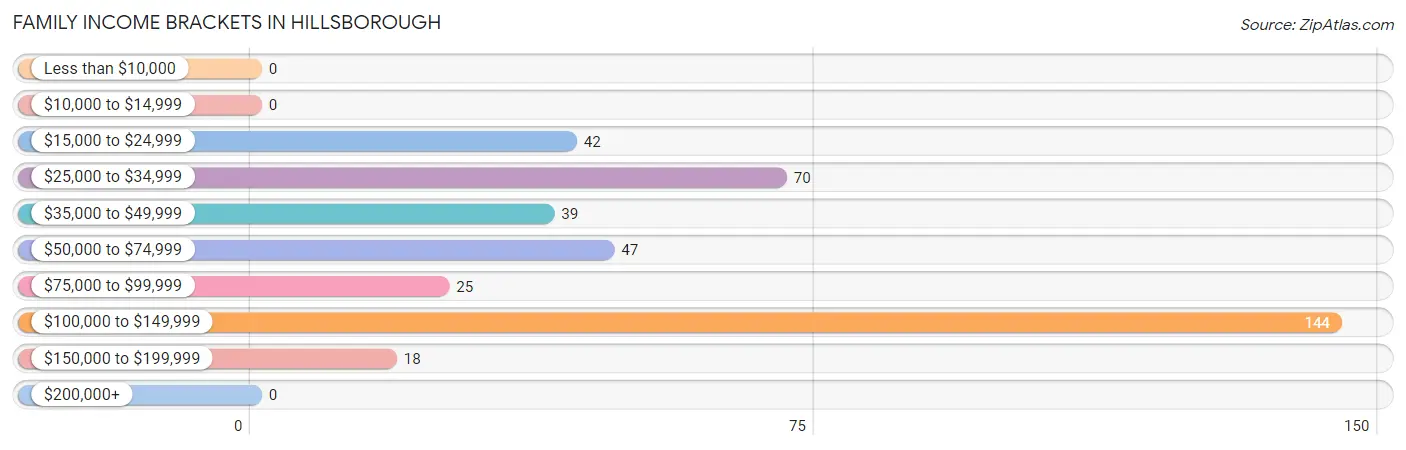
| Income Bracket | # Families | % Families |
| Less than $10,000 | 0 | 0.0% |
| $10,000 to $14,999 | 0 | 0.0% |
| $15,000 to $24,999 | 42 | 10.9% |
| $25,000 to $34,999 | 70 | 18.2% |
| $35,000 to $49,999 | 39 | 10.1% |
| $50,000 to $74,999 | 47 | 12.2% |
| $75,000 to $99,999 | 25 | 6.5% |
| $100,000 to $149,999 | 144 | 37.4% |
| $150,000 to $199,999 | 18 | 4.7% |
| $200,000+ | 0 | 0.0% |
Family Income by Famaliy Size in Hillsborough
5-person families (45 | 11.7%) account for the highest median family income in Hillsborough with $148,594 per family, while 5-person families (45 | 11.7%) have the highest median income of $29,719 per family member.
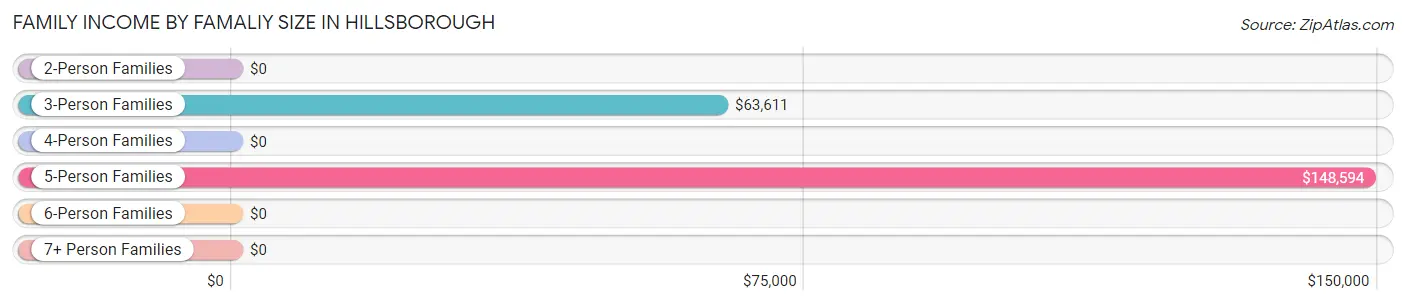
| Income Bracket | # Families | Median Income |
| 2-Person Families | 262 (68.0%) | $0 |
| 3-Person Families | 66 (17.1%) | $63,611 |
| 4-Person Families | 12 (3.1%) | $0 |
| 5-Person Families | 45 (11.7%) | $148,594 |
| 6-Person Families | 0 (0.0%) | $0 |
| 7+ Person Families | 0 (0.0%) | $0 |
| Total | 385 (100.0%) | $74,402 |
Family Income by Number of Earners in Hillsborough
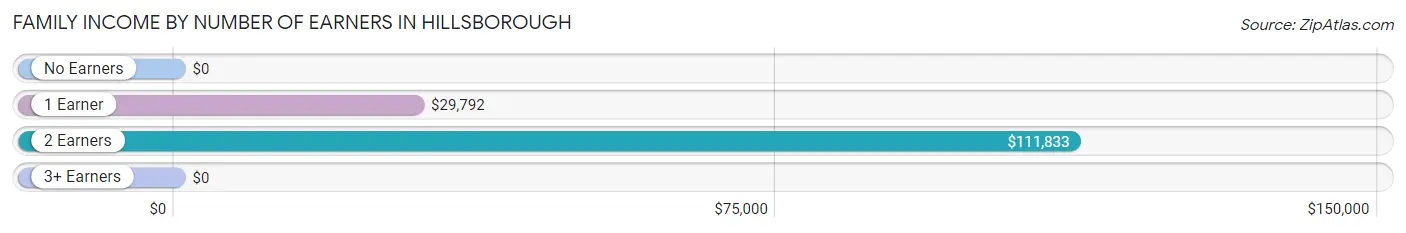
| Number of Earners | # Families | Median Income |
| No Earners | 58 (15.1%) | $0 |
| 1 Earner | 106 (27.5%) | $29,792 |
| 2 Earners | 208 (54.0%) | $111,833 |
| 3+ Earners | 13 (3.4%) | $0 |
| Total | 385 (100.0%) | $74,402 |
Household Income in Hillsborough
Household Income Brackets in Hillsborough
With 147 households falling in the category, the $100,000 to $149,999 income range is the most frequent in Hillsborough, accounting for 18.8% of all households. In contrast, only 14 households (1.8%) fall into the $200,000+ income bracket, making it the least populous group.
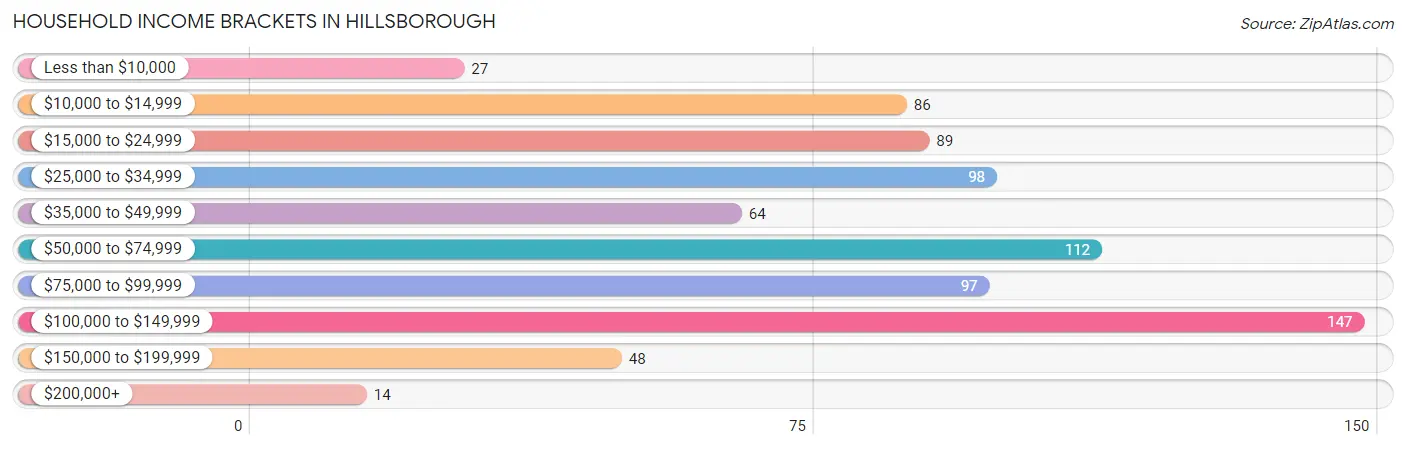
| Income Bracket | # Households | % Households |
| Less than $10,000 | 27 | 3.5% |
| $10,000 to $14,999 | 86 | 11.0% |
| $15,000 to $24,999 | 89 | 11.4% |
| $25,000 to $34,999 | 98 | 12.5% |
| $35,000 to $49,999 | 64 | 8.2% |
| $50,000 to $74,999 | 112 | 14.3% |
| $75,000 to $99,999 | 97 | 12.4% |
| $100,000 to $149,999 | 147 | 18.8% |
| $150,000 to $199,999 | 48 | 6.1% |
| $200,000+ | 14 | 1.8% |
Household Income by Householder Age in Hillsborough
The median household income in Hillsborough is $63,854, with the highest median household income of $74,022 found in the 25 to 44 years age bracket for the primary householder. A total of 208 households (26.6%) fall into this category. Meanwhile, the 15 to 24 years age bracket for the primary householder has the lowest median household income of $0, with 25 households (3.2%) in this group.
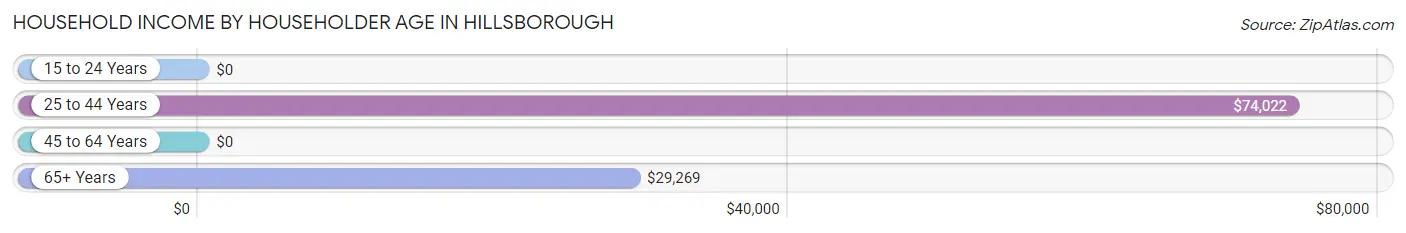
| Income Bracket | # Households | Median Income |
| 15 to 24 Years | 25 (3.2%) | $0 |
| 25 to 44 Years | 208 (26.6%) | $74,022 |
| 45 to 64 Years | 226 (28.9%) | $0 |
| 65+ Years | 323 (41.3%) | $29,269 |
| Total | 782 (100.0%) | $63,854 |
Poverty in Hillsborough
Income Below Poverty by Sex and Age in Hillsborough
With 2.8% poverty level for males and 12.3% for females among the residents of Hillsborough, 65 to 74 year old males and 35 to 44 year old females are the most vulnerable to poverty, with 17 males (17.9%) and 66 females (54.5%) in their respective age groups living below the poverty level.
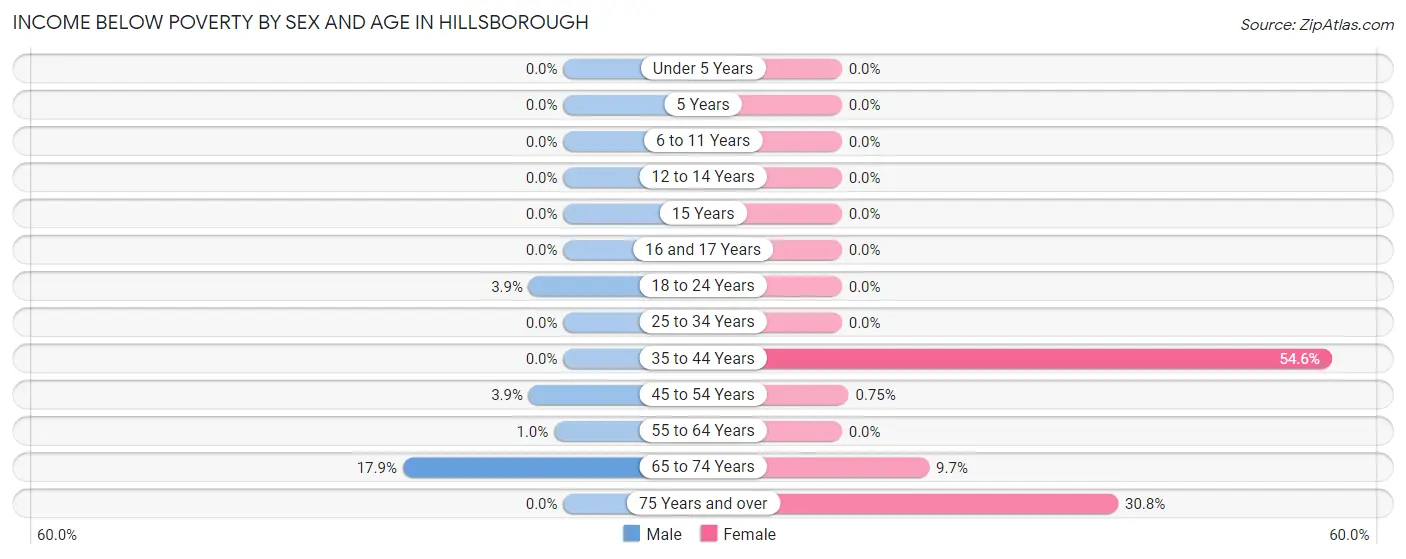
| Age Bracket | Male | Female |
| Under 5 Years | 0 (0.0%) | 0 (0.0%) |
| 5 Years | 0 (0.0%) | 0 (0.0%) |
| 6 to 11 Years | 0 (0.0%) | 0 (0.0%) |
| 12 to 14 Years | 0 (0.0%) | 0 (0.0%) |
| 15 Years | 0 (0.0%) | 0 (0.0%) |
| 16 and 17 Years | 0 (0.0%) | 0 (0.0%) |
| 18 to 24 Years | 1 (3.8%) | 0 (0.0%) |
| 25 to 34 Years | 0 (0.0%) | 0 (0.0%) |
| 35 to 44 Years | 0 (0.0%) | 66 (54.5%) |
| 45 to 54 Years | 1 (3.8%) | 1 (0.7%) |
| 55 to 64 Years | 2 (1.0%) | 0 (0.0%) |
| 65 to 74 Years | 17 (17.9%) | 11 (9.7%) |
| 75 Years and over | 0 (0.0%) | 20 (30.8%) |
| Total | 21 (2.8%) | 98 (12.3%) |
Income Above Poverty by Sex and Age in Hillsborough
According to the poverty statistics in Hillsborough, males aged under 5 years and females aged under 5 years are the age groups that are most secure financially, with 100.0% of males and 100.0% of females in these age groups living above the poverty line.
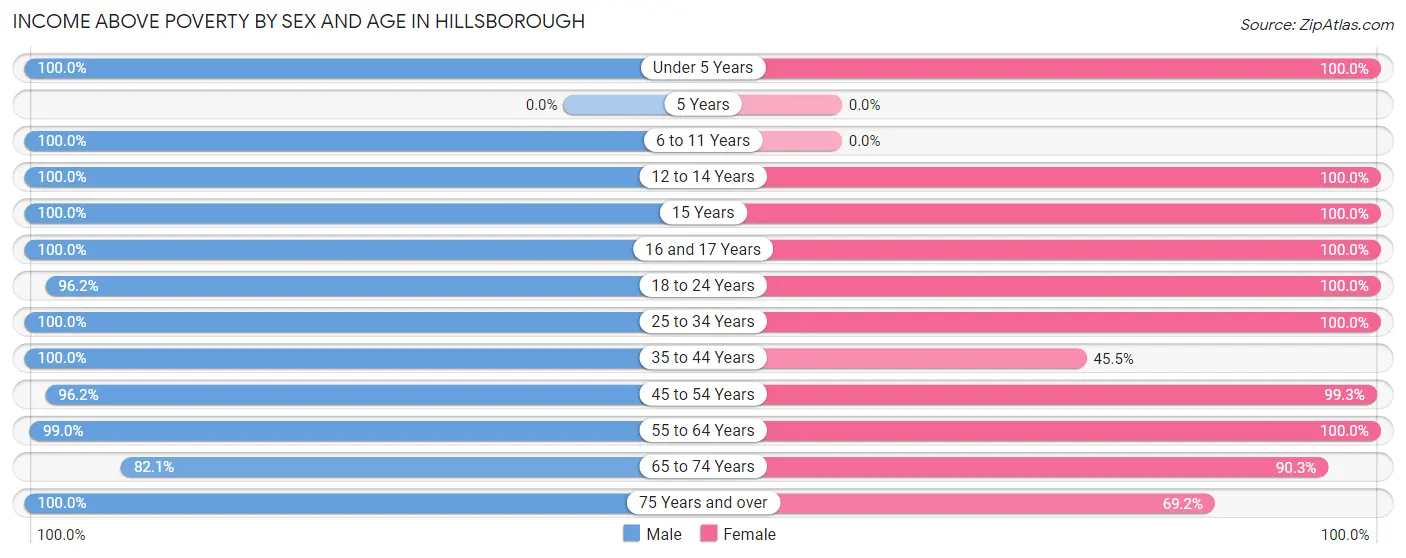
| Age Bracket | Male | Female |
| Under 5 Years | 18 (100.0%) | 13 (100.0%) |
| 5 Years | 0 (0.0%) | 0 (0.0%) |
| 6 to 11 Years | 61 (100.0%) | 0 (0.0%) |
| 12 to 14 Years | 24 (100.0%) | 32 (100.0%) |
| 15 Years | 4 (100.0%) | 6 (100.0%) |
| 16 and 17 Years | 4 (100.0%) | 32 (100.0%) |
| 18 to 24 Years | 25 (96.2%) | 7 (100.0%) |
| 25 to 34 Years | 85 (100.0%) | 174 (100.0%) |
| 35 to 44 Years | 62 (100.0%) | 55 (45.5%) |
| 45 to 54 Years | 25 (96.2%) | 133 (99.3%) |
| 55 to 64 Years | 193 (99.0%) | 98 (100.0%) |
| 65 to 74 Years | 78 (82.1%) | 102 (90.3%) |
| 75 Years and over | 142 (100.0%) | 45 (69.2%) |
| Total | 721 (97.2%) | 697 (87.7%) |
Income Below Poverty Among Married-Couple Families in Hillsborough
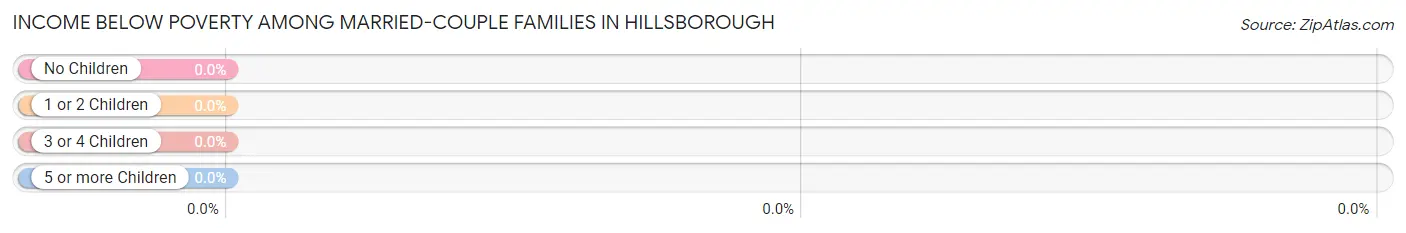
| Children | Above Poverty | Below Poverty |
| No Children | 181 (100.0%) | 0 (0.0%) |
| 1 or 2 Children | 74 (100.0%) | 0 (0.0%) |
| 3 or 4 Children | 23 (100.0%) | 0 (0.0%) |
| 5 or more Children | 0 (0.0%) | 0 (0.0%) |
| Total | 278 (100.0%) | 0 (0.0%) |
Income Below Poverty Among Single-Parent Households in Hillsborough
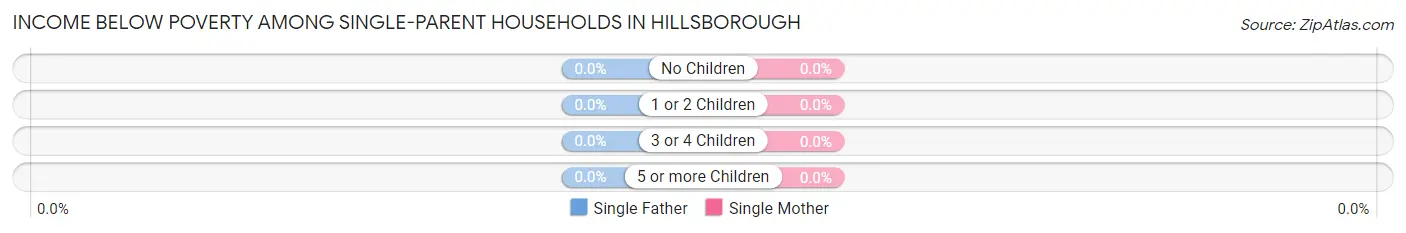
| Children | Single Father | Single Mother |
| No Children | 0 (0.0%) | 0 (0.0%) |
| 1 or 2 Children | 0 (0.0%) | 0 (0.0%) |
| 3 or 4 Children | 0 (0.0%) | 0 (0.0%) |
| 5 or more Children | 0 (0.0%) | 0 (0.0%) |
| Total | 0 (0.0%) | 0 (0.0%) |
Income Below Poverty Among Married-Couple vs Single-Parent Households in Hillsborough
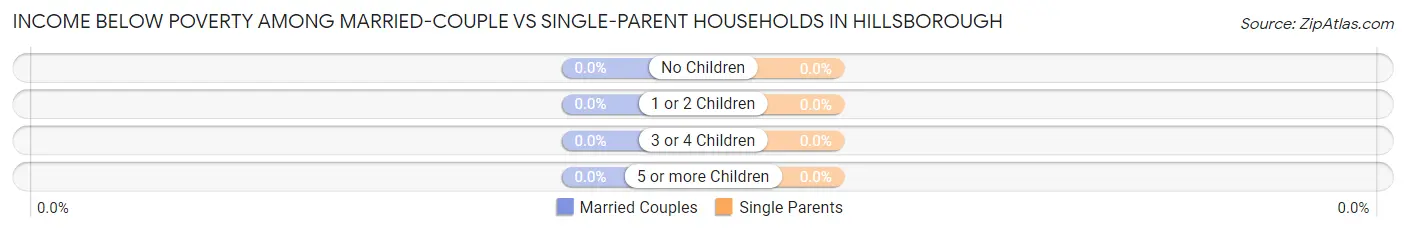
| Children | Married-Couple Families | Single-Parent Households |
| No Children | 0 (0.0%) | 0 (0.0%) |
| 1 or 2 Children | 0 (0.0%) | 0 (0.0%) |
| 3 or 4 Children | 0 (0.0%) | 0 (0.0%) |
| 5 or more Children | 0 (0.0%) | 0 (0.0%) |
| Total | 0 (0.0%) | 0 (0.0%) |
Race in Hillsborough
The most populous races in Hillsborough are White / Caucasian (1,310 | 83.6%), Two or more Races (257 | 16.4%), and Hispanic or Latino (69 | 4.4%).
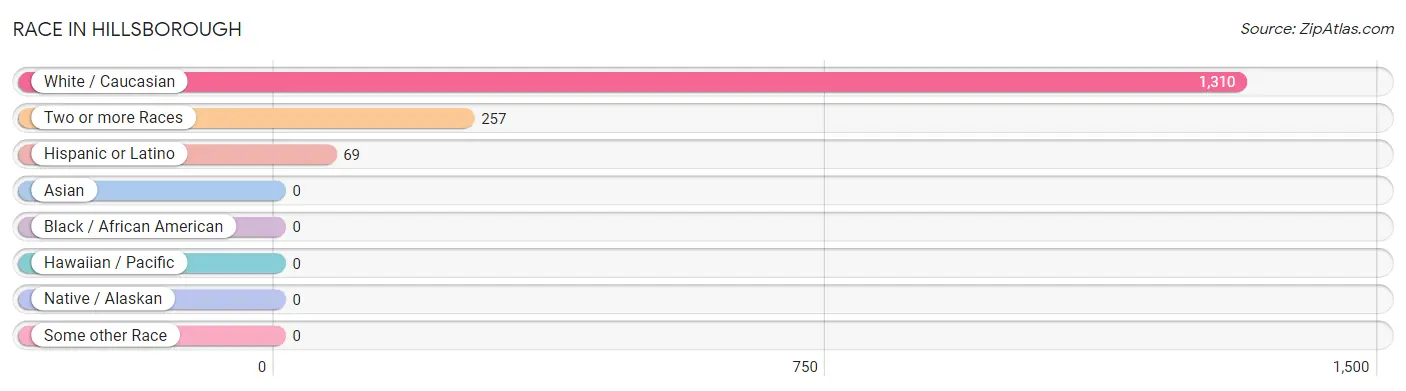
| Race | # Population | % Population |
| Asian | 0 | 0.0% |
| Black / African American | 0 | 0.0% |
| Hawaiian / Pacific | 0 | 0.0% |
| Hispanic or Latino | 69 | 4.4% |
| Native / Alaskan | 0 | 0.0% |
| White / Caucasian | 1,310 | 83.6% |
| Two or more Races | 257 | 16.4% |
| Some other Race | 0 | 0.0% |
| Total | 1,567 | 100.0% |
Ancestry in Hillsborough
The most populous ancestries reported in Hillsborough are English (443 | 28.3%), Irish (304 | 19.4%), German (187 | 11.9%), French (135 | 8.6%), and Scottish (123 | 7.9%), together accounting for 76.1% of all Hillsborough residents.
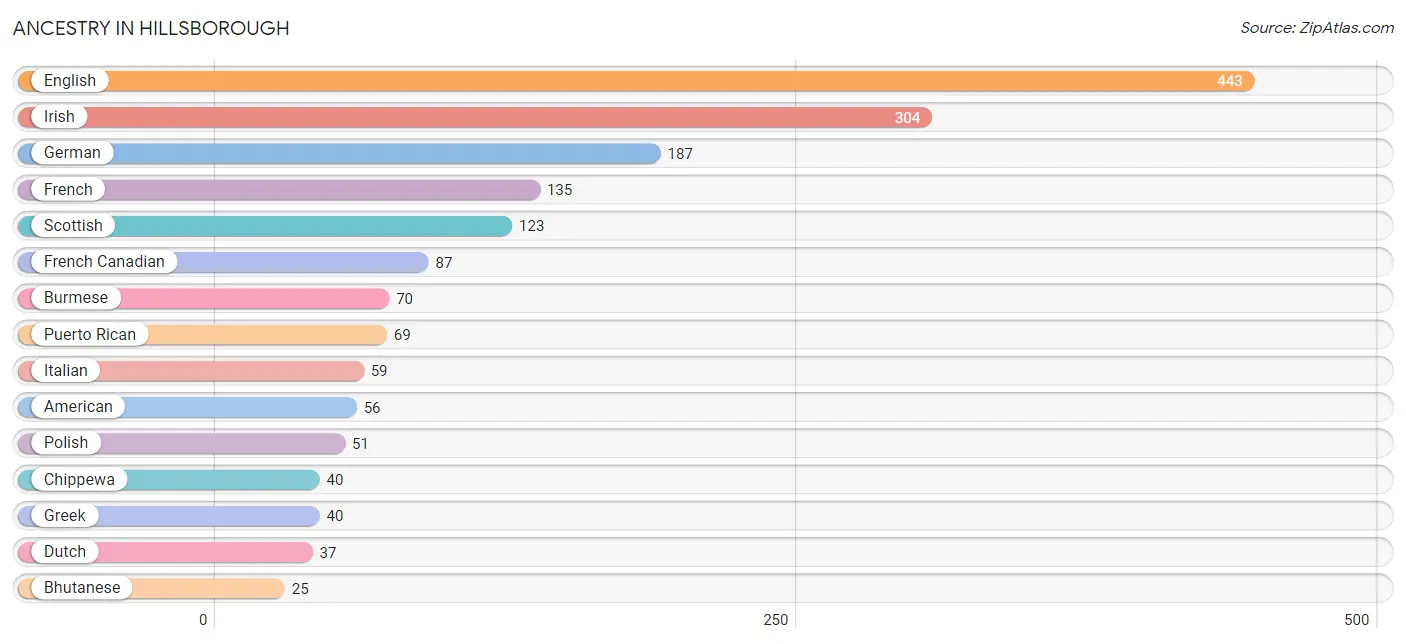
| Ancestry | # Population | % Population |
| American | 56 | 3.6% |
| Bhutanese | 25 | 1.6% |
| British | 15 | 1.0% |
| Burmese | 70 | 4.5% |
| Chippewa | 40 | 2.5% |
| Dutch | 37 | 2.4% |
| English | 443 | 28.3% |
| European | 1 | 0.1% |
| French | 135 | 8.6% |
| French Canadian | 87 | 5.6% |
| German | 187 | 11.9% |
| Greek | 40 | 2.5% |
| Irish | 304 | 19.4% |
| Italian | 59 | 3.8% |
| Polish | 51 | 3.3% |
| Portuguese | 22 | 1.4% |
| Puerto Rican | 69 | 4.4% |
| Scotch-Irish | 16 | 1.0% |
| Scottish | 123 | 7.9% | View All 19 Rows |
Immigrants in Hillsborough
The most numerous immigrant groups reported in Hillsborough came from Europe (15 | 1.0%), and Northern Europe (15 | 1.0%), together accounting for 1.9% of all Hillsborough residents.
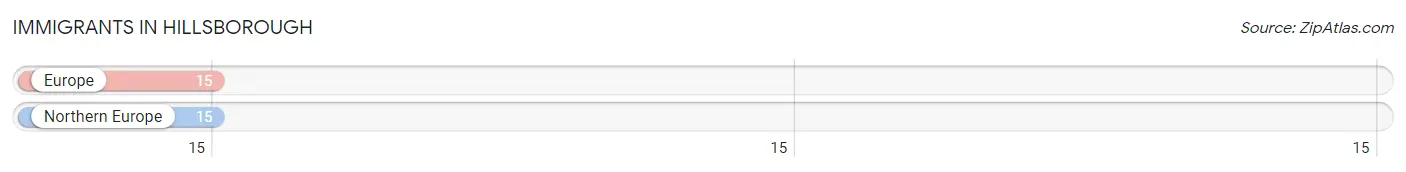
| Immigration Origin | # Population | % Population |
| Europe | 15 | 1.0% |
| Northern Europe | 15 | 1.0% | View All 2 Rows |
Sex and Age in Hillsborough
Sex and Age in Hillsborough
The most populous age groups in Hillsborough are 55 to 59 Years (146 | 19.7%) for men and 25 to 29 Years (103 | 12.5%) for women.
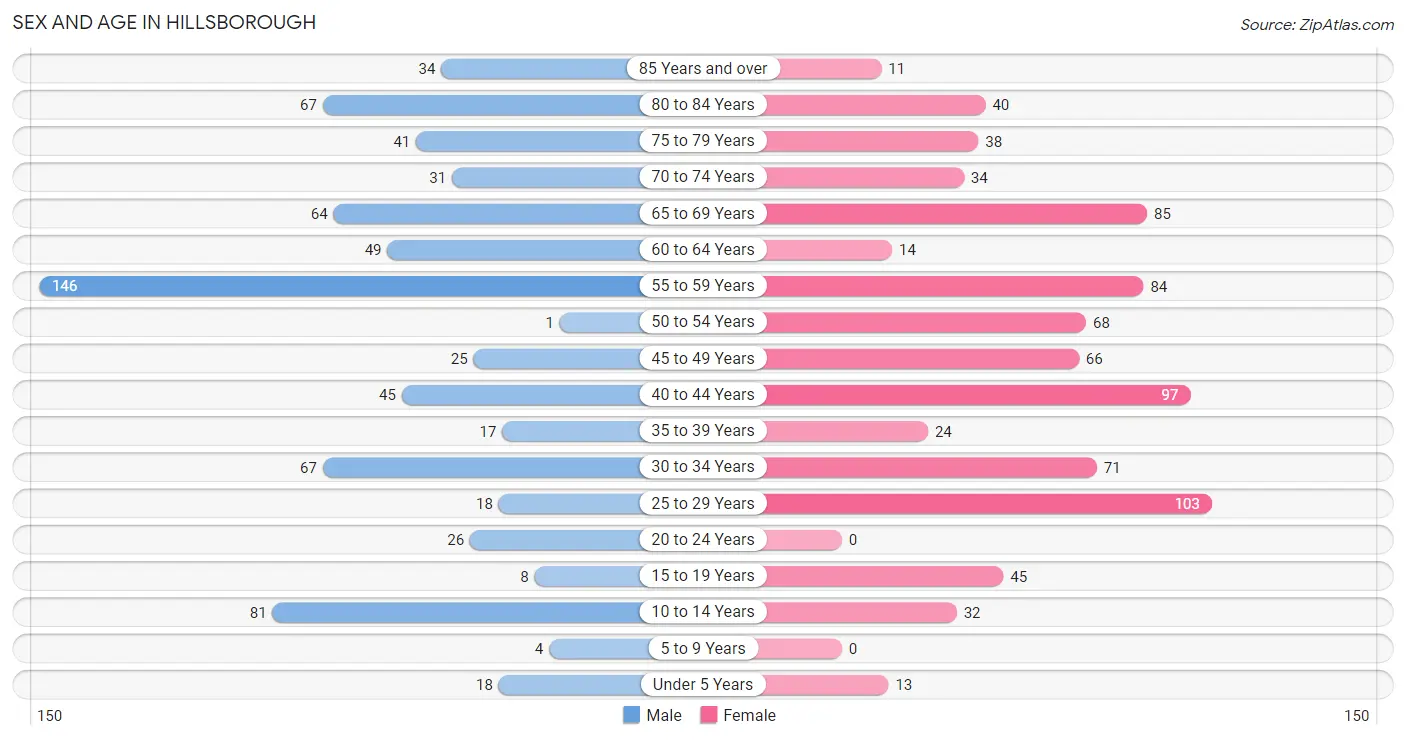
| Age Bracket | Male | Female |
| Under 5 Years | 18 (2.4%) | 13 (1.6%) |
| 5 to 9 Years | 4 (0.5%) | 0 (0.0%) |
| 10 to 14 Years | 81 (10.9%) | 32 (3.9%) |
| 15 to 19 Years | 8 (1.1%) | 45 (5.4%) |
| 20 to 24 Years | 26 (3.5%) | 0 (0.0%) |
| 25 to 29 Years | 18 (2.4%) | 103 (12.5%) |
| 30 to 34 Years | 67 (9.0%) | 71 (8.6%) |
| 35 to 39 Years | 17 (2.3%) | 24 (2.9%) |
| 40 to 44 Years | 45 (6.1%) | 97 (11.8%) |
| 45 to 49 Years | 25 (3.4%) | 66 (8.0%) |
| 50 to 54 Years | 1 (0.1%) | 68 (8.2%) |
| 55 to 59 Years | 146 (19.7%) | 84 (10.2%) |
| 60 to 64 Years | 49 (6.6%) | 14 (1.7%) |
| 65 to 69 Years | 64 (8.6%) | 85 (10.3%) |
| 70 to 74 Years | 31 (4.2%) | 34 (4.1%) |
| 75 to 79 Years | 41 (5.5%) | 38 (4.6%) |
| 80 to 84 Years | 67 (9.0%) | 40 (4.9%) |
| 85 Years and over | 34 (4.6%) | 11 (1.3%) |
| Total | 742 (100.0%) | 825 (100.0%) |
Families and Households in Hillsborough
Median Family Size in Hillsborough
The median family size in Hillsborough is 2.67 persons per family, with single female/mother families (81 | 21.0%) accounting for the largest median family size of 3.17 persons per family. On the other hand, single male/father families (26 | 6.8%) represent the smallest median family size with 2.12 persons per family.
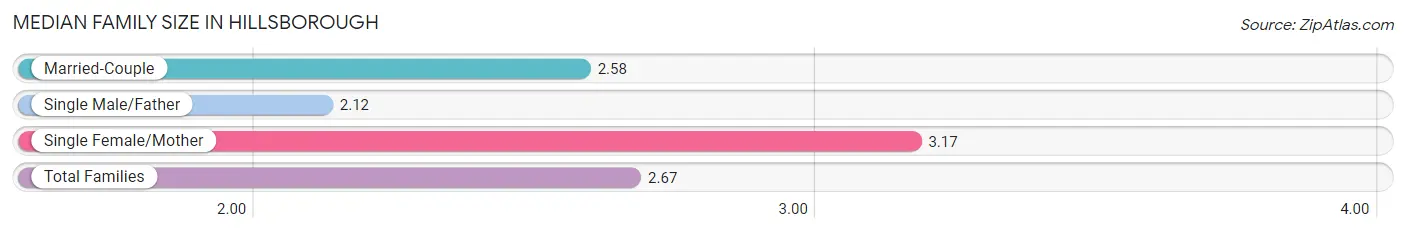
| Family Type | # Families | Family Size |
| Married-Couple | 278 (72.2%) | 2.58 |
| Single Male/Father | 26 (6.8%) | 2.12 |
| Single Female/Mother | 81 (21.0%) | 3.17 |
| Total Families | 385 (100.0%) | 2.67 |
Median Household Size in Hillsborough
The median household size in Hillsborough is 1.95 persons per household, with single female/mother households (81 | 10.4%) accounting for the largest median household size of 3.17 persons per household. non-family households (397 | 50.8%) represent the smallest median household size with 1.14 persons per household.
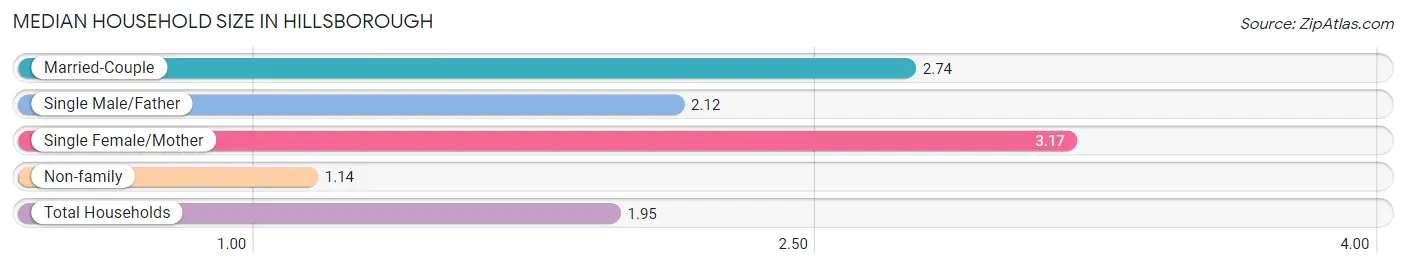
| Household Type | # Households | Household Size |
| Married-Couple | 278 (35.5%) | 2.74 |
| Single Male/Father | 26 (3.3%) | 2.12 |
| Single Female/Mother | 81 (10.4%) | 3.17 |
| Non-family | 397 (50.8%) | 1.14 |
| Total Households | 782 (100.0%) | 1.95 |
Household Size by Marriage Status in Hillsborough
Out of a total of 782 households in Hillsborough, 385 (49.2%) are family households, while 397 (50.8%) are nonfamily households. The most numerous type of family households are 2-person households, comprising 219, and the most common type of nonfamily households are 1-person households, comprising 335.
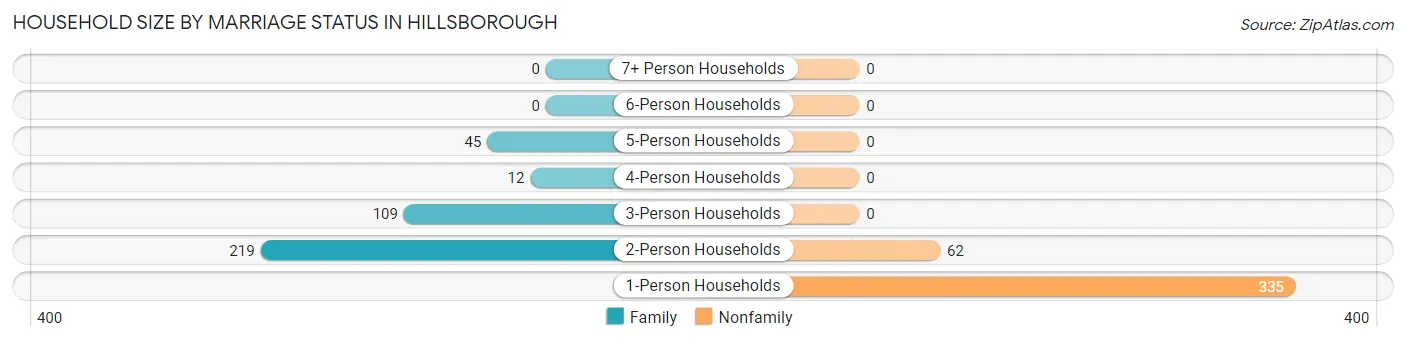
| Household Size | Family Households | Nonfamily Households |
| 1-Person Households | - | 335 (42.8%) |
| 2-Person Households | 219 (28.0%) | 62 (7.9%) |
| 3-Person Households | 109 (13.9%) | 0 (0.0%) |
| 4-Person Households | 12 (1.5%) | 0 (0.0%) |
| 5-Person Households | 45 (5.8%) | 0 (0.0%) |
| 6-Person Households | 0 (0.0%) | 0 (0.0%) |
| 7+ Person Households | 0 (0.0%) | 0 (0.0%) |
| Total | 385 (49.2%) | 397 (50.8%) |
Female Fertility in Hillsborough
Fertility by Age in Hillsborough
Average fertility rate in Hillsborough is 33.0 births per 1,000 women. Women in the age bracket of 35 to 50 years have the highest fertility rate with 61.0 births per 1,000 women. Women in the age bracket of 35 to 50 years acount for 93.3% of all women with births.
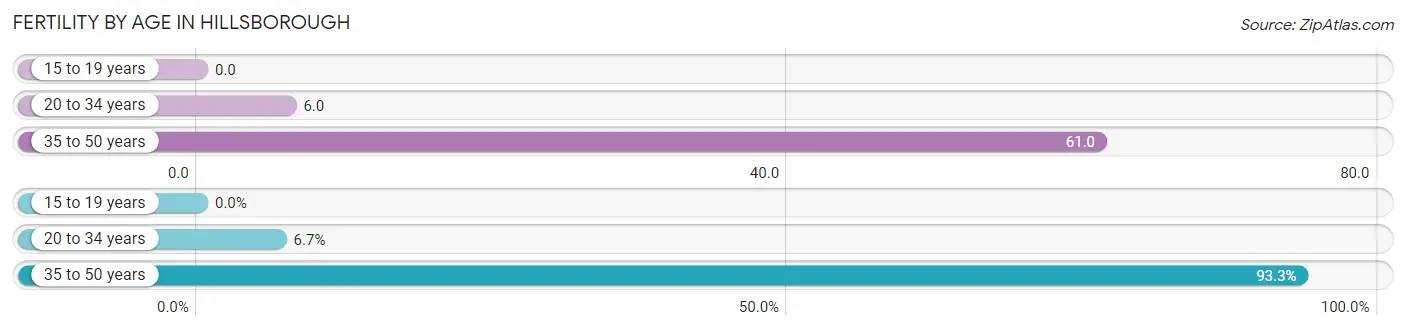
| Age Bracket | Women with Births | Births / 1,000 Women |
| 15 to 19 years | 0 (0.0%) | 0.0 |
| 20 to 34 years | 1 (6.7%) | 6.0 |
| 35 to 50 years | 14 (93.3%) | 61.0 |
| Total | 15 (100.0%) | 33.0 |
Fertility by Age by Marriage Status in Hillsborough
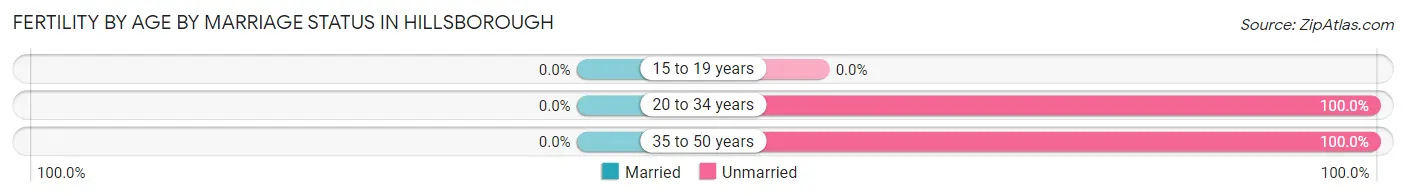
| Age Bracket | Married | Unmarried |
| 15 to 19 years | 0 (0.0%) | 0 (0.0%) |
| 20 to 34 years | 0 (0.0%) | 1 (100.0%) |
| 35 to 50 years | 0 (0.0%) | 14 (100.0%) |
| Total | 0 (0.0%) | 15 (100.0%) |
Fertility by Education in Hillsborough
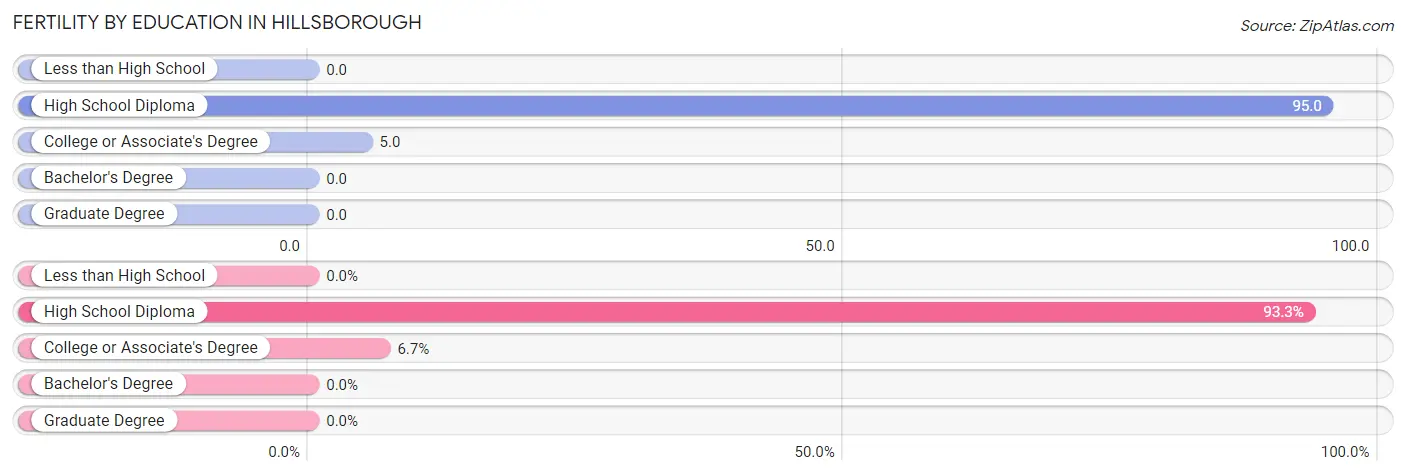
| Educational Attainment | Women with Births | Births / 1,000 Women |
| Less than High School | 0 (0.0%) | 0.0 |
| High School Diploma | 14 (93.3%) | 95.0 |
| College or Associate's Degree | 1 (6.7%) | 5.0 |
| Bachelor's Degree | 0 (0.0%) | 0.0 |
| Graduate Degree | 0 (0.0%) | 0.0 |
| Total | 15 (100.0%) | 33.0 |
Fertility by Education by Marriage Status in Hillsborough
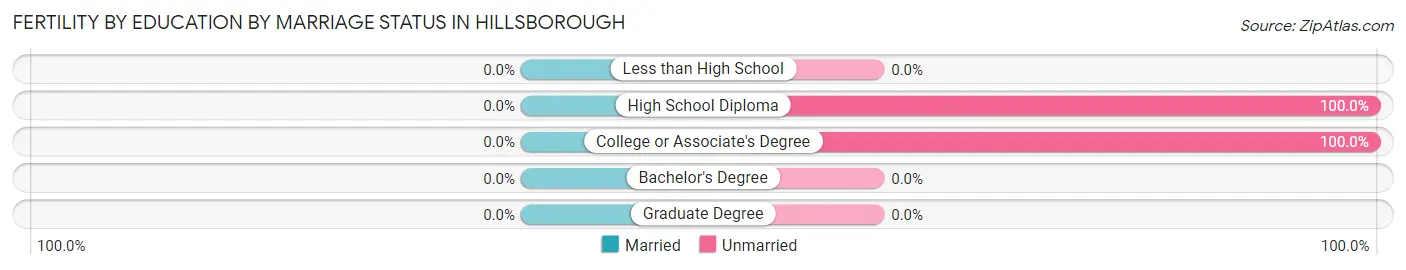
| Educational Attainment | Married | Unmarried |
| Less than High School | 0 (0.0%) | 0 (0.0%) |
| High School Diploma | 0 (0.0%) | 14 (100.0%) |
| College or Associate's Degree | 0 (0.0%) | 1 (100.0%) |
| Bachelor's Degree | 0 (0.0%) | 0 (0.0%) |
| Graduate Degree | 0 (0.0%) | 0 (0.0%) |
| Total | 0 (0.0%) | 15 (100.0%) |
Employment Characteristics in Hillsborough
Employment by Class of Employer in Hillsborough
Among the 778 employed individuals in Hillsborough, private company employees (603 | 77.5%), not-for-profit organizations (106 | 13.6%), and state government employees (31 | 4.0%) make up the most common classes of employment.
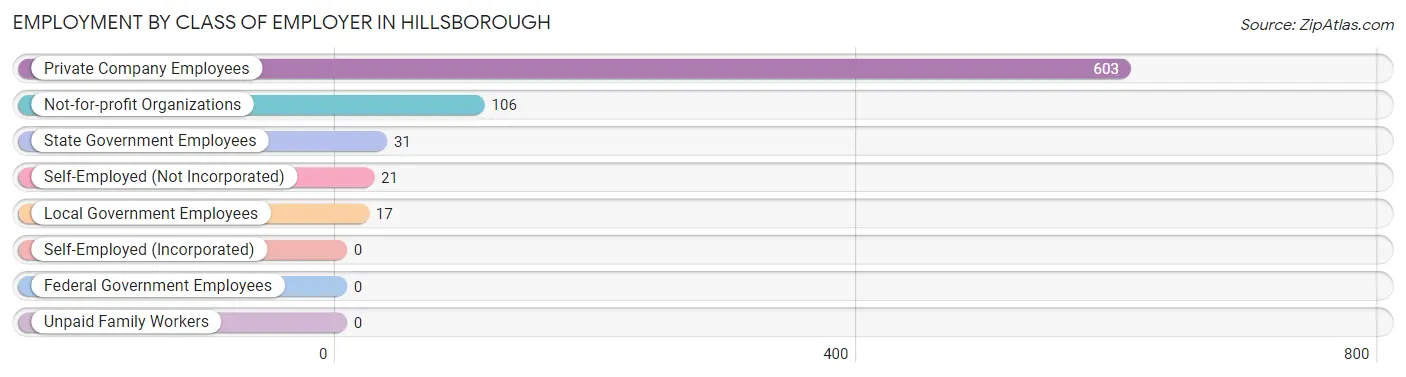
| Employer Class | # Employees | % Employees |
| Private Company Employees | 603 | 77.5% |
| Self-Employed (Incorporated) | 0 | 0.0% |
| Self-Employed (Not Incorporated) | 21 | 2.7% |
| Not-for-profit Organizations | 106 | 13.6% |
| Local Government Employees | 17 | 2.2% |
| State Government Employees | 31 | 4.0% |
| Federal Government Employees | 0 | 0.0% |
| Unpaid Family Workers | 0 | 0.0% |
| Total | 778 | 100.0% |
Employment Status by Age in Hillsborough
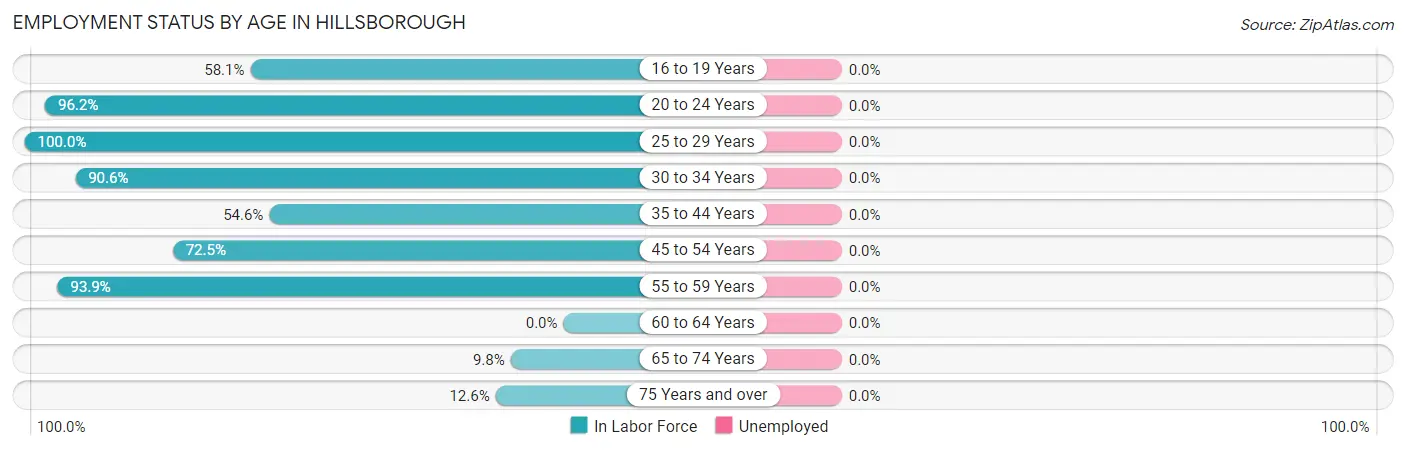
| Age Bracket | In Labor Force | Unemployed |
| 16 to 19 Years | 25 (58.1%) | 0 (0.0%) |
| 20 to 24 Years | 25 (96.2%) | 0 (0.0%) |
| 25 to 29 Years | 121 (100.0%) | 0 (0.0%) |
| 30 to 34 Years | 125 (90.6%) | 0 (0.0%) |
| 35 to 44 Years | 100 (54.6%) | 0 (0.0%) |
| 45 to 54 Years | 116 (72.5%) | 0 (0.0%) |
| 55 to 59 Years | 216 (93.9%) | 0 (0.0%) |
| 60 to 64 Years | 0 (0.0%) | 0 (0.0%) |
| 65 to 74 Years | 21 (9.8%) | 0 (0.0%) |
| 75 Years and over | 29 (12.6%) | 0 (0.0%) |
| Total | 778 (55.2%) | 0 (0.0%) |
Employment Status by Educational Attainment in Hillsborough
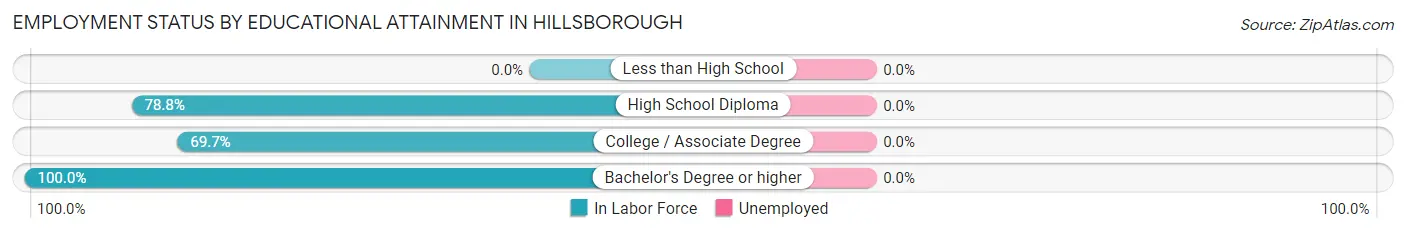
| Educational Attainment | In Labor Force | Unemployed |
| Less than High School | 0 (0.0%) | 0 (0.0%) |
| High School Diploma | 301 (78.8%) | 0 (0.0%) |
| College / Associate Degree | 267 (69.7%) | 0 (0.0%) |
| Bachelor's Degree or higher | 110 (100.0%) | 0 (0.0%) |
| Total | 678 (75.8%) | 0 (0.0%) |
Employment Occupations by Sex in Hillsborough
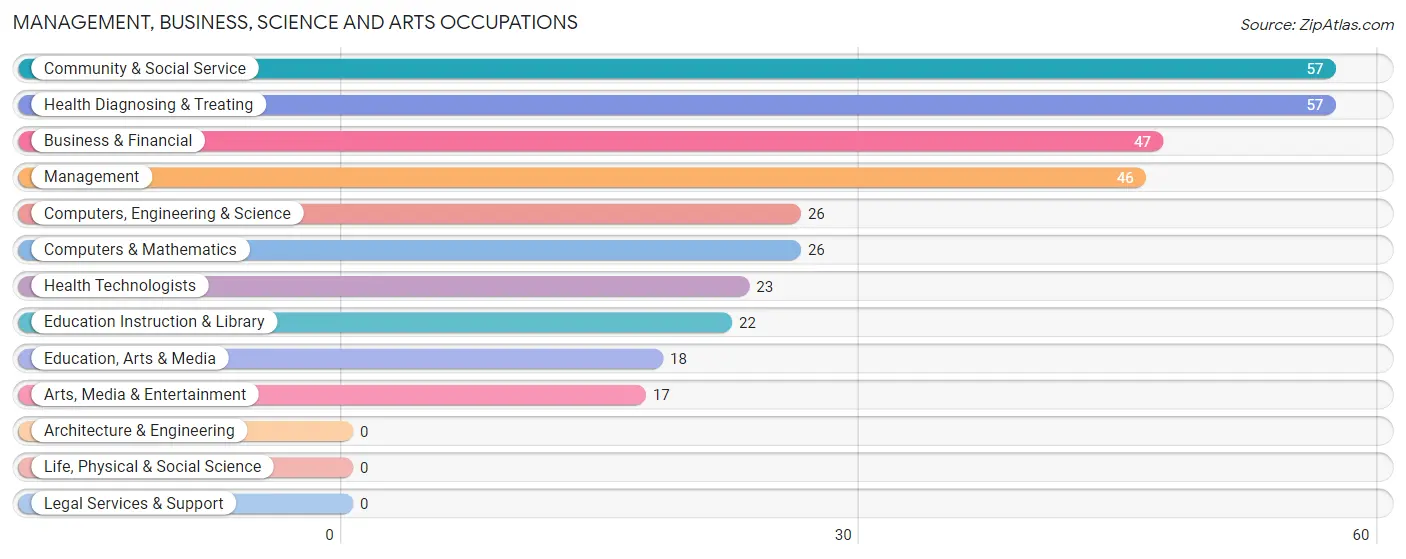
Management, Business, Science and Arts Occupations
The most common Management, Business, Science and Arts occupations in Hillsborough are Community & Social Service (57 | 7.3%), Health Diagnosing & Treating (57 | 7.3%), Business & Financial (47 | 6.0%), Management (46 | 5.9%), and Computers, Engineering & Science (26 | 3.3%).
Management, Business, Science and Arts Occupations by Sex
Within the Management, Business, Science and Arts occupations in Hillsborough, the most male-oriented occupations are Management (100.0%), Business & Financial (27.7%), and Health Technologists (21.7%), while the most female-oriented occupations are Computers, Engineering & Science (100.0%), Computers & Mathematics (100.0%), and Community & Social Service (100.0%).
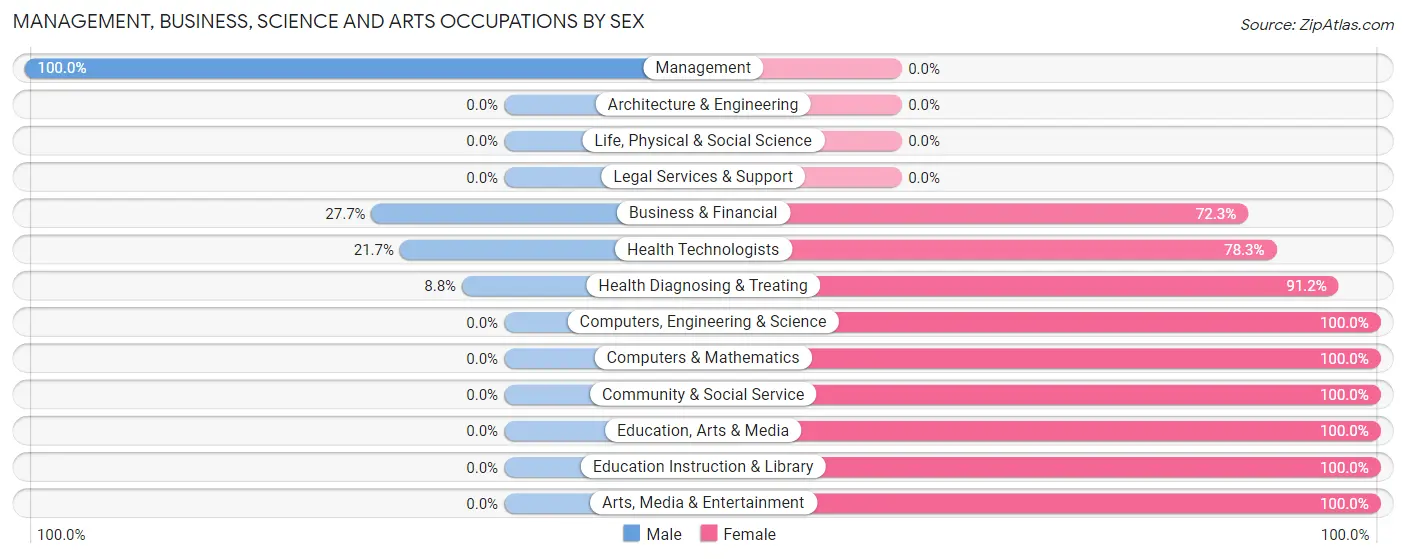
| Occupation | Male | Female |
| Management | 46 (100.0%) | 0 (0.0%) |
| Business & Financial | 13 (27.7%) | 34 (72.3%) |
| Computers, Engineering & Science | 0 (0.0%) | 26 (100.0%) |
| Computers & Mathematics | 0 (0.0%) | 26 (100.0%) |
| Architecture & Engineering | 0 (0.0%) | 0 (0.0%) |
| Life, Physical & Social Science | 0 (0.0%) | 0 (0.0%) |
| Community & Social Service | 0 (0.0%) | 57 (100.0%) |
| Education, Arts & Media | 0 (0.0%) | 18 (100.0%) |
| Legal Services & Support | 0 (0.0%) | 0 (0.0%) |
| Education Instruction & Library | 0 (0.0%) | 22 (100.0%) |
| Arts, Media & Entertainment | 0 (0.0%) | 17 (100.0%) |
| Health Diagnosing & Treating | 5 (8.8%) | 52 (91.2%) |
| Health Technologists | 5 (21.7%) | 18 (78.3%) |
| Total (Category) | 64 (27.5%) | 169 (72.5%) |
| Total (Overall) | 352 (45.2%) | 426 (54.8%) |
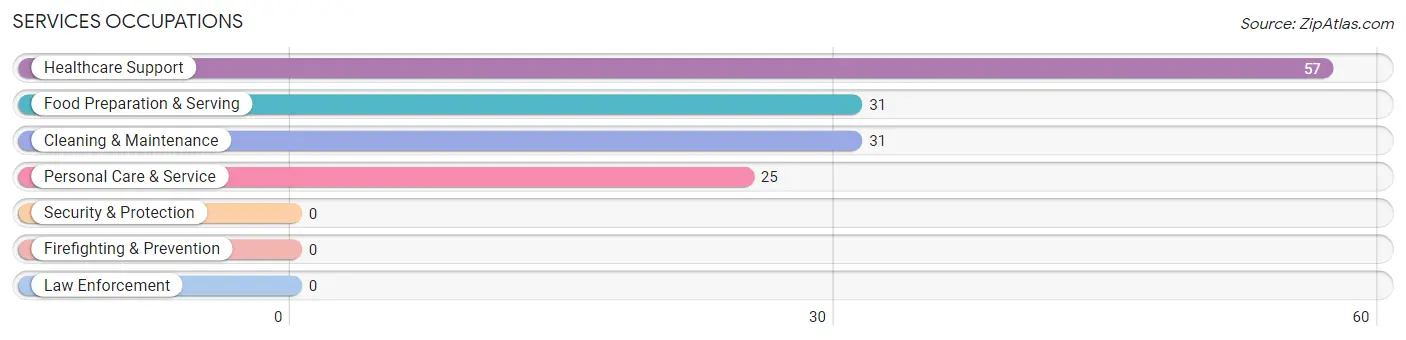
Services Occupations
The most common Services occupations in Hillsborough are Healthcare Support (57 | 7.3%), Food Preparation & Serving (31 | 4.0%), Cleaning & Maintenance (31 | 4.0%), and Personal Care & Service (25 | 3.2%).
Services Occupations by Sex
Within the Services occupations in Hillsborough, the most male-oriented occupations are Food Preparation & Serving (100.0%), Cleaning & Maintenance (74.2%), and Personal Care & Service (52.0%), while the most female-oriented occupations are Healthcare Support (100.0%), Personal Care & Service (48.0%), and Cleaning & Maintenance (25.8%).
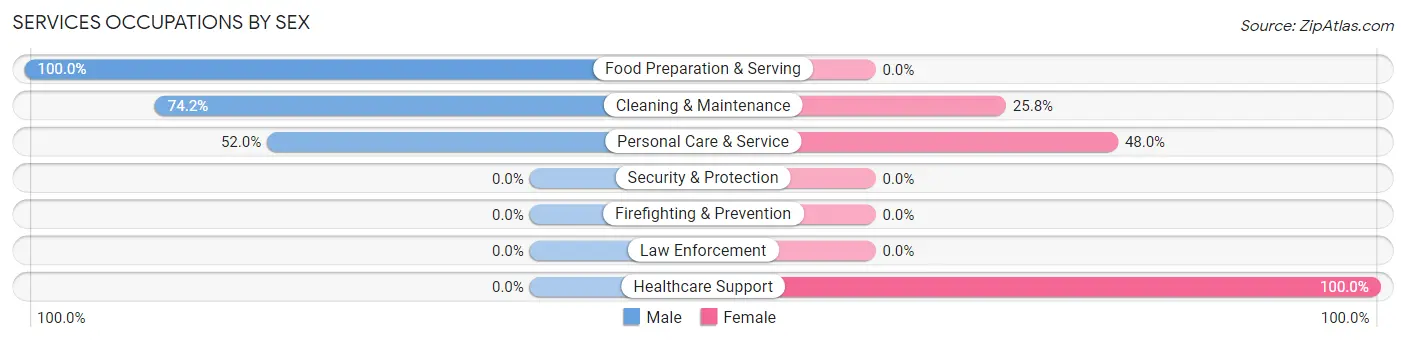
| Occupation | Male | Female |
| Healthcare Support | 0 (0.0%) | 57 (100.0%) |
| Security & Protection | 0 (0.0%) | 0 (0.0%) |
| Firefighting & Prevention | 0 (0.0%) | 0 (0.0%) |
| Law Enforcement | 0 (0.0%) | 0 (0.0%) |
| Food Preparation & Serving | 31 (100.0%) | 0 (0.0%) |
| Cleaning & Maintenance | 23 (74.2%) | 8 (25.8%) |
| Personal Care & Service | 13 (52.0%) | 12 (48.0%) |
| Total (Category) | 67 (46.5%) | 77 (53.5%) |
| Total (Overall) | 352 (45.2%) | 426 (54.8%) |
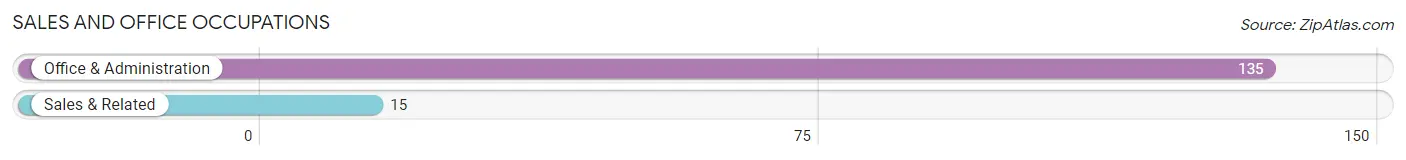
Sales and Office Occupations
The most common Sales and Office occupations in Hillsborough are Office & Administration (135 | 17.3%), and Sales & Related (15 | 1.9%).
Sales and Office Occupations by Sex
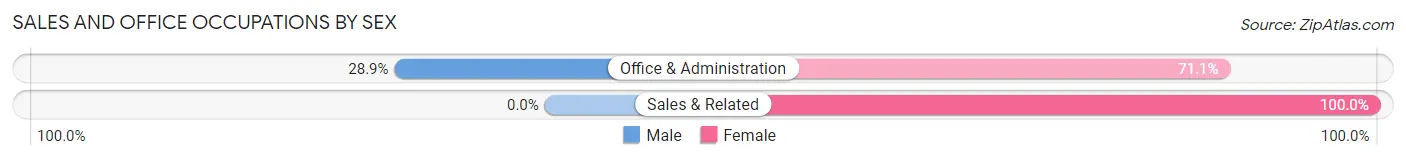
| Occupation | Male | Female |
| Sales & Related | 0 (0.0%) | 15 (100.0%) |
| Office & Administration | 39 (28.9%) | 96 (71.1%) |
| Total (Category) | 39 (26.0%) | 111 (74.0%) |
| Total (Overall) | 352 (45.2%) | 426 (54.8%) |
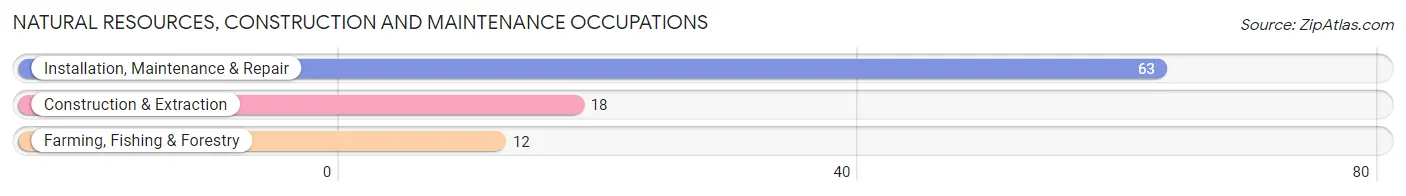
Natural Resources, Construction and Maintenance Occupations
The most common Natural Resources, Construction and Maintenance occupations in Hillsborough are Installation, Maintenance & Repair (63 | 8.1%), Construction & Extraction (18 | 2.3%), and Farming, Fishing & Forestry (12 | 1.5%).
Natural Resources, Construction and Maintenance Occupations by Sex
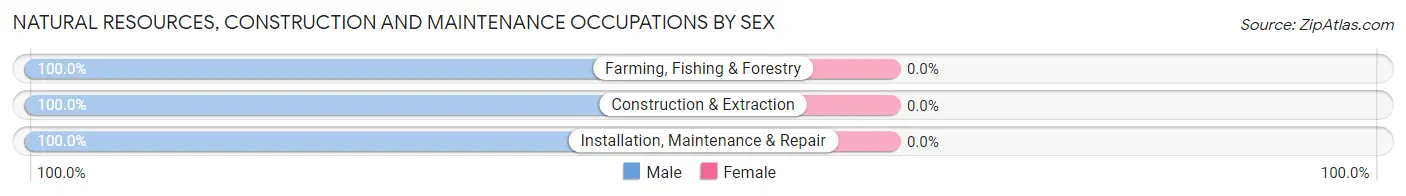
| Occupation | Male | Female |
| Farming, Fishing & Forestry | 12 (100.0%) | 0 (0.0%) |
| Construction & Extraction | 18 (100.0%) | 0 (0.0%) |
| Installation, Maintenance & Repair | 63 (100.0%) | 0 (0.0%) |
| Total (Category) | 93 (100.0%) | 0 (0.0%) |
| Total (Overall) | 352 (45.2%) | 426 (54.8%) |
Production, Transportation and Moving Occupations
The most common Production, Transportation and Moving occupations in Hillsborough are Production (89 | 11.4%), and Material Moving (69 | 8.9%).
Production, Transportation and Moving Occupations by Sex
| Occupation | Male | Female |
| Production | 89 (100.0%) | 0 (0.0%) |
| Transportation | 0 (0.0%) | 0 (0.0%) |
| Material Moving | 0 (0.0%) | 69 (100.0%) |
| Total (Category) | 89 (56.3%) | 69 (43.7%) |
| Total (Overall) | 352 (45.2%) | 426 (54.8%) |
Employment Industries by Sex in Hillsborough
Employment Industries in Hillsborough
The major employment industries in Hillsborough include Manufacturing (177 | 22.8%), Health Care & Social Assistance (176 | 22.6%), Retail Trade (139 | 17.9%), Public Administration (48 | 6.2%), and Accommodation & Food Services (44 | 5.7%).
Employment Industries by Sex in Hillsborough
The Hillsborough industries that see more men than women are Agriculture, Fishing & Hunting (100.0%), Construction (100.0%), and Finance & Insurance (100.0%), whereas the industries that tend to have a higher number of women are Retail Trade (100.0%), Professional & Scientific (100.0%), and Accommodation & Food Services (65.9%).
| Industry | Male | Female |
| Agriculture, Fishing & Hunting | 12 (100.0%) | 0 (0.0%) |
| Mining, Quarrying, & Extraction | 0 (0.0%) | 0 (0.0%) |
| Construction | 18 (100.0%) | 0 (0.0%) |
| Manufacturing | 116 (65.5%) | 61 (34.5%) |
| Wholesale Trade | 0 (0.0%) | 0 (0.0%) |
| Retail Trade | 0 (0.0%) | 139 (100.0%) |
| Transportation & Warehousing | 0 (0.0%) | 0 (0.0%) |
| Utilities | 0 (0.0%) | 0 (0.0%) |
| Information | 0 (0.0%) | 0 (0.0%) |
| Finance & Insurance | 13 (100.0%) | 0 (0.0%) |
| Real Estate, Rental & Leasing | 25 (100.0%) | 0 (0.0%) |
| Professional & Scientific | 0 (0.0%) | 41 (100.0%) |
| Enterprise Management | 0 (0.0%) | 0 (0.0%) |
| Administrative & Support | 23 (74.2%) | 8 (25.8%) |
| Educational Services | 21 (100.0%) | 0 (0.0%) |
| Health Care & Social Assistance | 63 (35.8%) | 113 (64.2%) |
| Arts, Entertainment & Recreation | 0 (0.0%) | 0 (0.0%) |
| Accommodation & Food Services | 15 (34.1%) | 29 (65.9%) |
| Public Administration | 31 (64.6%) | 17 (35.4%) |
| Total | 352 (45.2%) | 426 (54.8%) |
Education in Hillsborough
School Enrollment in Hillsborough
The most common levels of schooling among the 251 students in Hillsborough are middle school (105 | 41.8%), high school (61 | 24.3%), and college / undergraduate (60 | 23.9%).
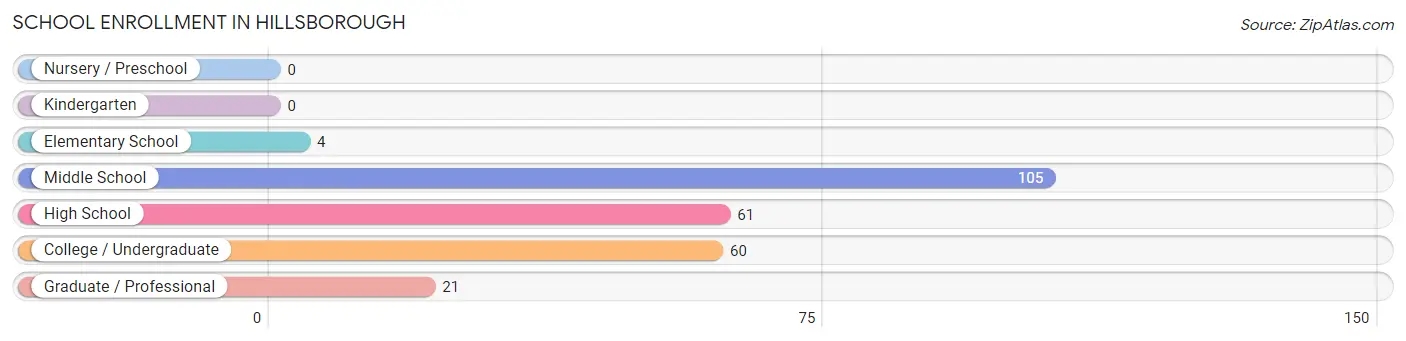
| School Level | # Students | % Students |
| Nursery / Preschool | 0 | 0.0% |
| Kindergarten | 0 | 0.0% |
| Elementary School | 4 | 1.6% |
| Middle School | 105 | 41.8% |
| High School | 61 | 24.3% |
| College / Undergraduate | 60 | 23.9% |
| Graduate / Professional | 21 | 8.4% |
| Total | 251 | 100.0% |
School Enrollment by Age by Funding Source in Hillsborough
Out of a total of 251 students who are enrolled in schools in Hillsborough, 40 (15.9%) attend a private institution, while the remaining 211 (84.1%) are enrolled in public schools. The age group of 25 to 34 year olds has the highest likelihood of being enrolled in private schools, with 16 (88.9% in the age bracket) enrolled. Conversely, the age group of 5 to 9 year old has the lowest likelihood of being enrolled in a private school, with 4 (100.0% in the age bracket) attending a public institution.
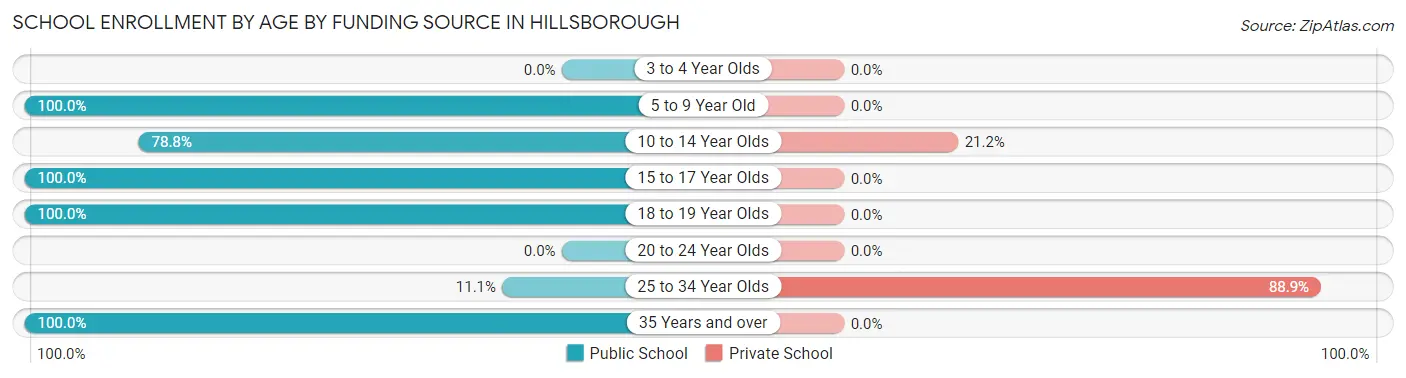
| Age Bracket | Public School | Private School |
| 3 to 4 Year Olds | 0 (0.0%) | 0 (0.0%) |
| 5 to 9 Year Old | 4 (100.0%) | 0 (0.0%) |
| 10 to 14 Year Olds | 89 (78.8%) | 24 (21.2%) |
| 15 to 17 Year Olds | 46 (100.0%) | 0 (0.0%) |
| 18 to 19 Year Olds | 7 (100.0%) | 0 (0.0%) |
| 20 to 24 Year Olds | 0 (0.0%) | 0 (0.0%) |
| 25 to 34 Year Olds | 2 (11.1%) | 16 (88.9%) |
| 35 Years and over | 63 (100.0%) | 0 (0.0%) |
| Total | 211 (84.1%) | 40 (15.9%) |
Educational Attainment by Field of Study in Hillsborough
Science & technology (43 | 31.4%), education (26 | 19.0%), literature & languages (25 | 18.2%), psychology (18 | 13.1%), and visual & performing arts (12 | 8.8%) are the most common fields of study among 137 individuals in Hillsborough who have obtained a bachelor's degree or higher.
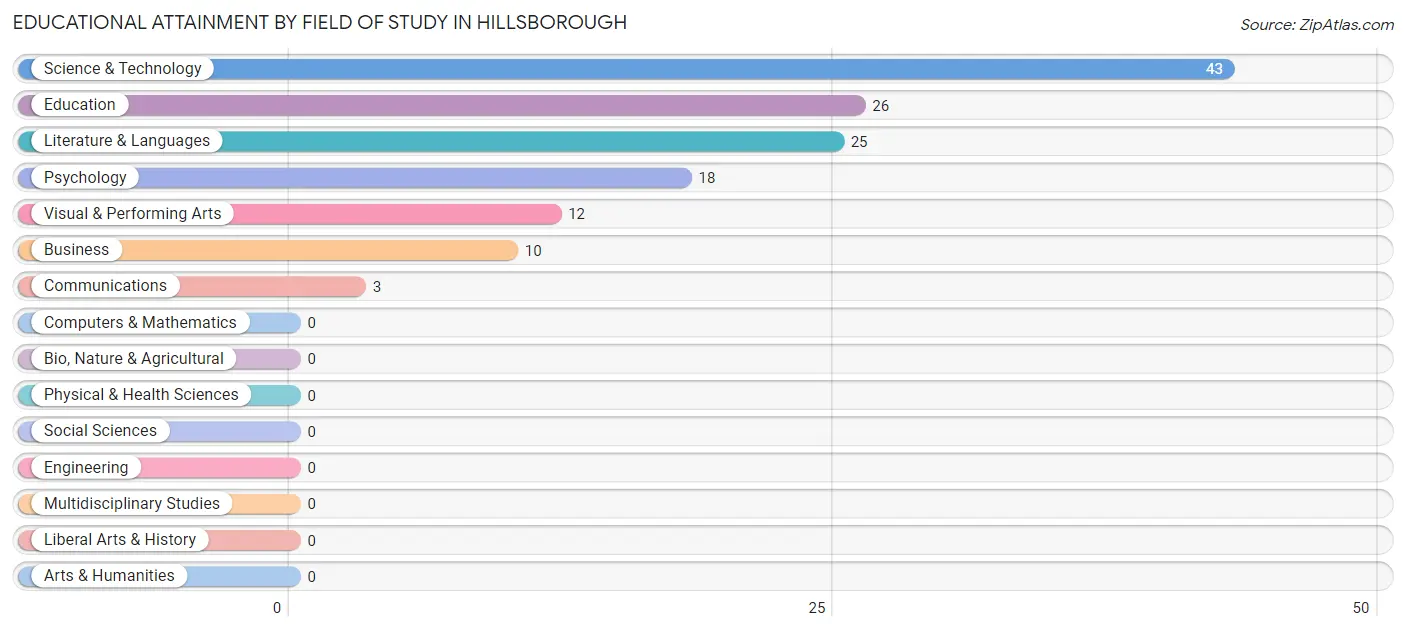
| Field of Study | # Graduates | % Graduates |
| Computers & Mathematics | 0 | 0.0% |
| Bio, Nature & Agricultural | 0 | 0.0% |
| Physical & Health Sciences | 0 | 0.0% |
| Psychology | 18 | 13.1% |
| Social Sciences | 0 | 0.0% |
| Engineering | 0 | 0.0% |
| Multidisciplinary Studies | 0 | 0.0% |
| Science & Technology | 43 | 31.4% |
| Business | 10 | 7.3% |
| Education | 26 | 19.0% |
| Literature & Languages | 25 | 18.2% |
| Liberal Arts & History | 0 | 0.0% |
| Visual & Performing Arts | 12 | 8.8% |
| Communications | 3 | 2.2% |
| Arts & Humanities | 0 | 0.0% |
| Total | 137 | 100.0% |
Transportation & Commute in Hillsborough
Vehicle Availability by Sex in Hillsborough
The most prevalent vehicle ownership categories in Hillsborough are males with 2 vehicles (189, accounting for 53.7%) and females with 2 vehicles (294, making up 44.5%).
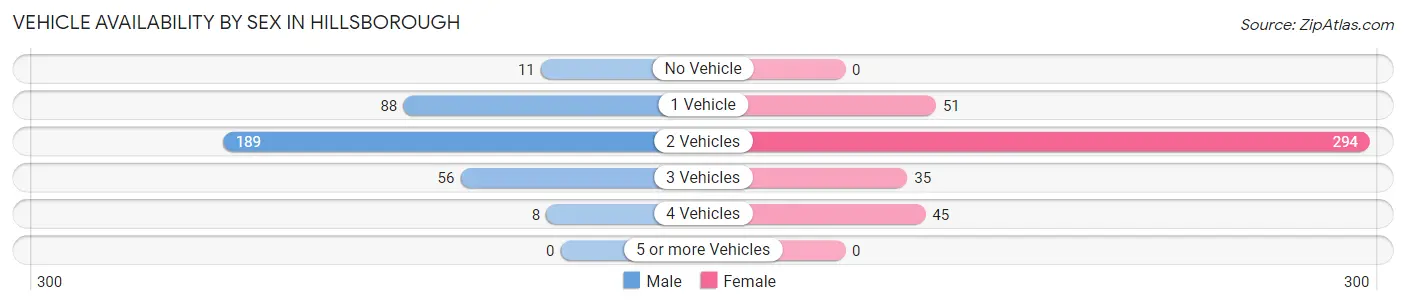
| Vehicles Available | Male | Female |
| No Vehicle | 11 (3.1%) | 0 (0.0%) |
| 1 Vehicle | 88 (25.0%) | 51 (12.0%) |
| 2 Vehicles | 189 (53.7%) | 294 (69.2%) |
| 3 Vehicles | 56 (15.9%) | 35 (8.2%) |
| 4 Vehicles | 8 (2.3%) | 45 (10.6%) |
| 5 or more Vehicles | 0 (0.0%) | 0 (0.0%) |
| Total | 352 (100.0%) | 425 (100.0%) |
Commute Time in Hillsborough
The most frequently occuring commute durations in Hillsborough are 60 to 89 minutes (145 commuters, 20.3%), 45 to 59 minutes (139 commuters, 19.5%), and 40 to 44 minutes (115 commuters, 16.1%).
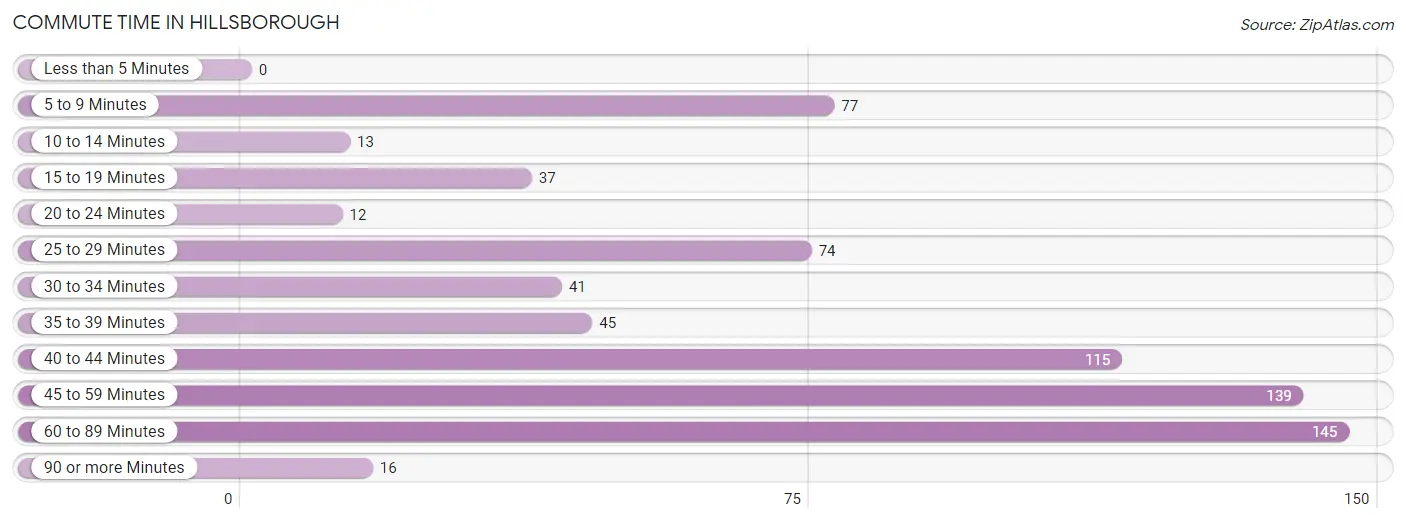
| Commute Time | # Commuters | % Commuters |
| Less than 5 Minutes | 0 | 0.0% |
| 5 to 9 Minutes | 77 | 10.8% |
| 10 to 14 Minutes | 13 | 1.8% |
| 15 to 19 Minutes | 37 | 5.2% |
| 20 to 24 Minutes | 12 | 1.7% |
| 25 to 29 Minutes | 74 | 10.4% |
| 30 to 34 Minutes | 41 | 5.7% |
| 35 to 39 Minutes | 45 | 6.3% |
| 40 to 44 Minutes | 115 | 16.1% |
| 45 to 59 Minutes | 139 | 19.5% |
| 60 to 89 Minutes | 145 | 20.3% |
| 90 or more Minutes | 16 | 2.2% |
Commute Time by Sex in Hillsborough
The most common commute times in Hillsborough are 45 to 59 minutes (121 commuters, 34.4%) for males and 60 to 89 minutes (104 commuters, 28.7%) for females.
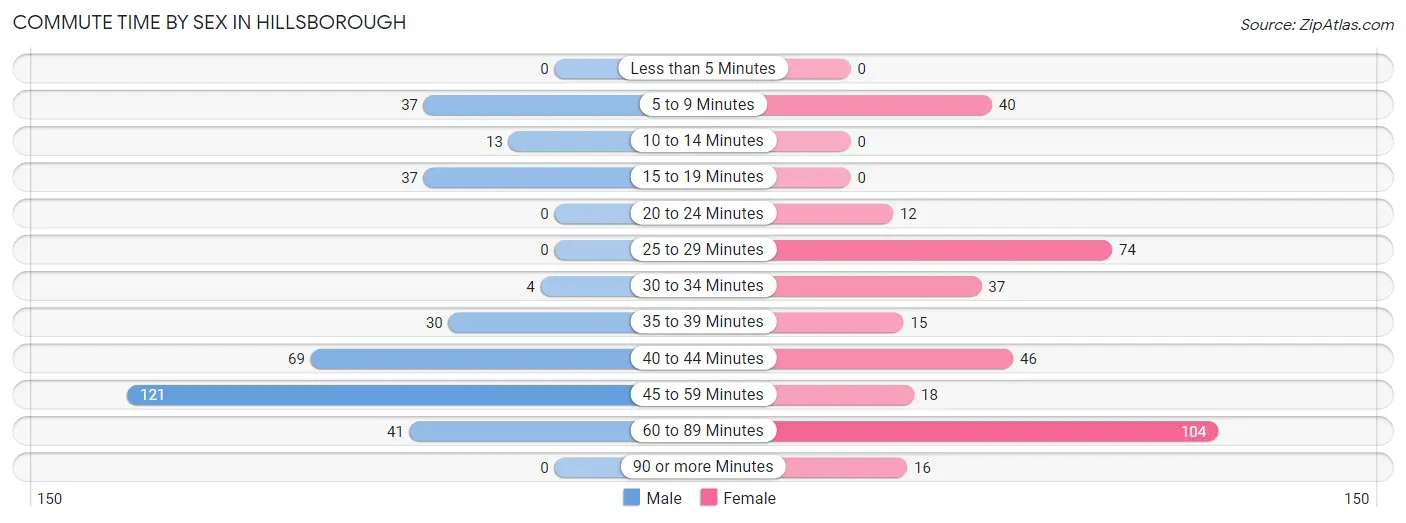
| Commute Time | Male | Female |
| Less than 5 Minutes | 0 (0.0%) | 0 (0.0%) |
| 5 to 9 Minutes | 37 (10.5%) | 40 (11.1%) |
| 10 to 14 Minutes | 13 (3.7%) | 0 (0.0%) |
| 15 to 19 Minutes | 37 (10.5%) | 0 (0.0%) |
| 20 to 24 Minutes | 0 (0.0%) | 12 (3.3%) |
| 25 to 29 Minutes | 0 (0.0%) | 74 (20.4%) |
| 30 to 34 Minutes | 4 (1.1%) | 37 (10.2%) |
| 35 to 39 Minutes | 30 (8.5%) | 15 (4.1%) |
| 40 to 44 Minutes | 69 (19.6%) | 46 (12.7%) |
| 45 to 59 Minutes | 121 (34.4%) | 18 (5.0%) |
| 60 to 89 Minutes | 41 (11.7%) | 104 (28.7%) |
| 90 or more Minutes | 0 (0.0%) | 16 (4.4%) |
Time of Departure to Work by Sex in Hillsborough
The most frequent times of departure to work in Hillsborough are 6:00 AM to 6:29 AM (88, 25.0%) for males and 12:00 PM to 3:59 PM (161, 44.5%) for females.
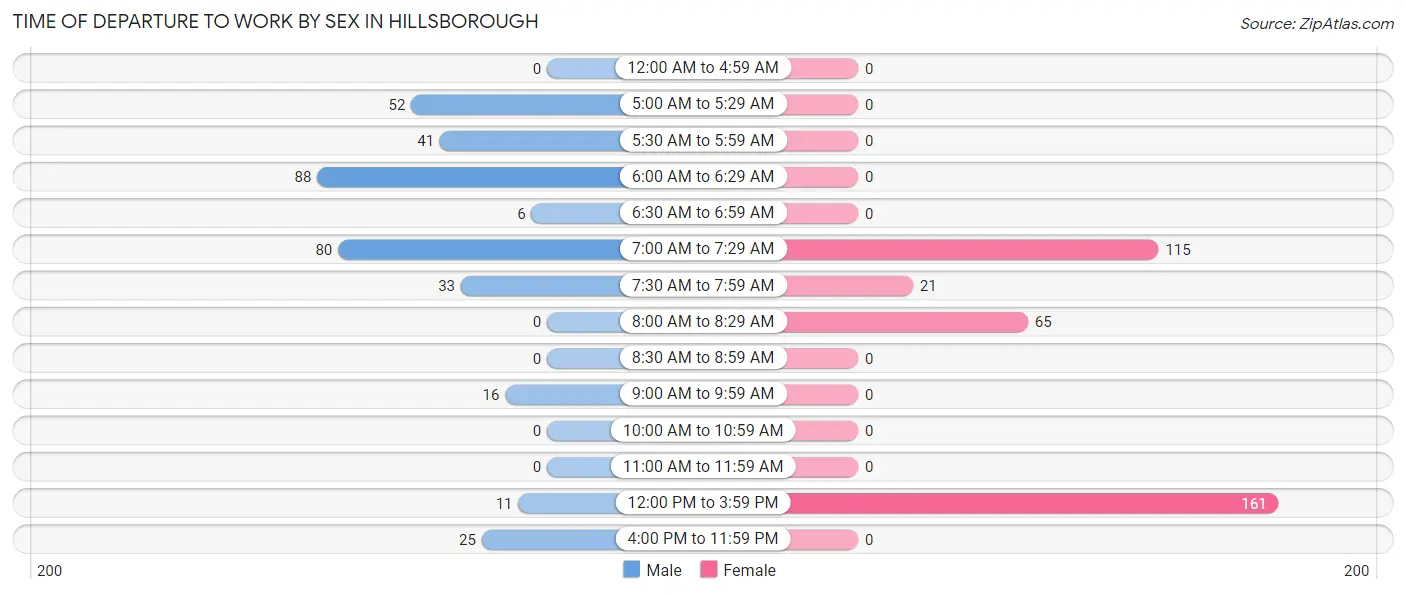
| Time of Departure | Male | Female |
| 12:00 AM to 4:59 AM | 0 (0.0%) | 0 (0.0%) |
| 5:00 AM to 5:29 AM | 52 (14.8%) | 0 (0.0%) |
| 5:30 AM to 5:59 AM | 41 (11.7%) | 0 (0.0%) |
| 6:00 AM to 6:29 AM | 88 (25.0%) | 0 (0.0%) |
| 6:30 AM to 6:59 AM | 6 (1.7%) | 0 (0.0%) |
| 7:00 AM to 7:29 AM | 80 (22.7%) | 115 (31.8%) |
| 7:30 AM to 7:59 AM | 33 (9.4%) | 21 (5.8%) |
| 8:00 AM to 8:29 AM | 0 (0.0%) | 65 (18.0%) |
| 8:30 AM to 8:59 AM | 0 (0.0%) | 0 (0.0%) |
| 9:00 AM to 9:59 AM | 16 (4.5%) | 0 (0.0%) |
| 10:00 AM to 10:59 AM | 0 (0.0%) | 0 (0.0%) |
| 11:00 AM to 11:59 AM | 0 (0.0%) | 0 (0.0%) |
| 12:00 PM to 3:59 PM | 11 (3.1%) | 161 (44.5%) |
| 4:00 PM to 11:59 PM | 25 (7.1%) | 0 (0.0%) |
| Total | 352 (100.0%) | 362 (100.0%) |
Housing Occupancy in Hillsborough
Occupancy by Ownership in Hillsborough
Of the total 782 dwellings in Hillsborough, owner-occupied units account for 606 (77.5%), while renter-occupied units make up 176 (22.5%).
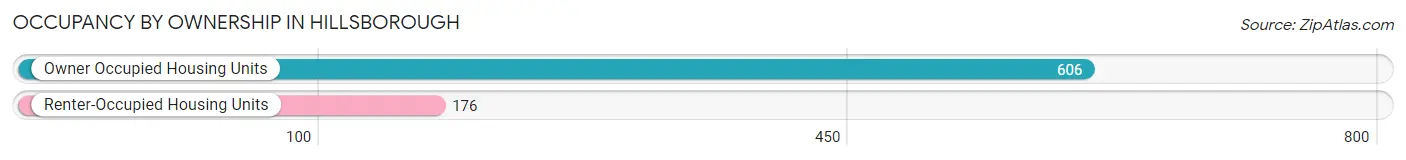
| Occupancy | # Housing Units | % Housing Units |
| Owner Occupied Housing Units | 606 | 77.5% |
| Renter-Occupied Housing Units | 176 | 22.5% |
| Total Occupied Housing Units | 782 | 100.0% |
Occupancy by Household Size in Hillsborough
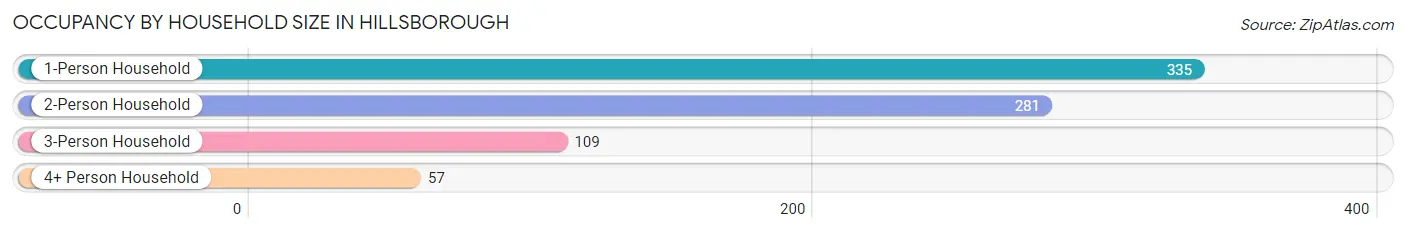
| Household Size | # Housing Units | % Housing Units |
| 1-Person Household | 335 | 42.8% |
| 2-Person Household | 281 | 35.9% |
| 3-Person Household | 109 | 13.9% |
| 4+ Person Household | 57 | 7.3% |
| Total Housing Units | 782 | 100.0% |
Occupancy by Ownership by Household Size in Hillsborough
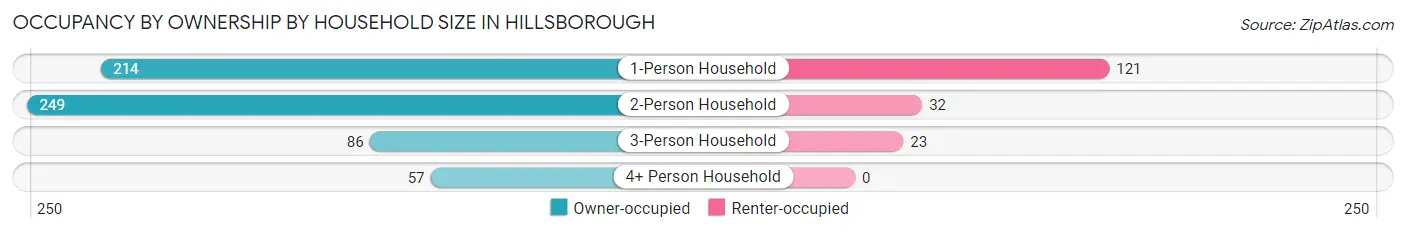
| Household Size | Owner-occupied | Renter-occupied |
| 1-Person Household | 214 (63.9%) | 121 (36.1%) |
| 2-Person Household | 249 (88.6%) | 32 (11.4%) |
| 3-Person Household | 86 (78.9%) | 23 (21.1%) |
| 4+ Person Household | 57 (100.0%) | 0 (0.0%) |
| Total Housing Units | 606 (77.5%) | 176 (22.5%) |
Occupancy by Educational Attainment in Hillsborough
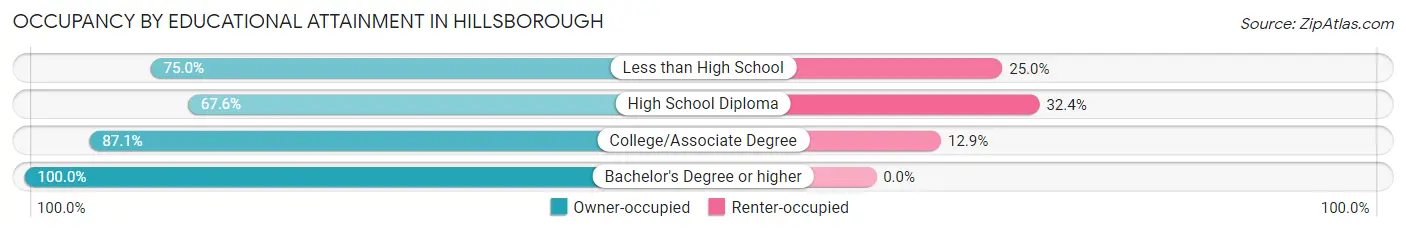
| Household Size | Owner-occupied | Renter-occupied |
| Less than High School | 75 (75.0%) | 25 (25.0%) |
| High School Diploma | 259 (67.6%) | 124 (32.4%) |
| College/Associate Degree | 183 (87.1%) | 27 (12.9%) |
| Bachelor's Degree or higher | 89 (100.0%) | 0 (0.0%) |
Occupancy by Age of Householder in Hillsborough
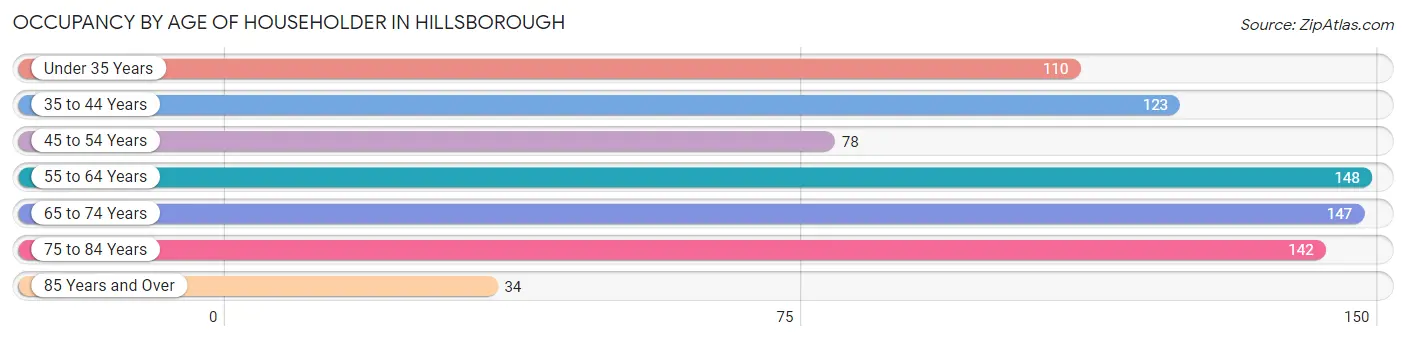
| Age Bracket | # Households | % Households |
| Under 35 Years | 110 | 14.1% |
| 35 to 44 Years | 123 | 15.7% |
| 45 to 54 Years | 78 | 10.0% |
| 55 to 64 Years | 148 | 18.9% |
| 65 to 74 Years | 147 | 18.8% |
| 75 to 84 Years | 142 | 18.2% |
| 85 Years and Over | 34 | 4.3% |
| Total | 782 | 100.0% |
Housing Finances in Hillsborough
Median Income by Occupancy in Hillsborough
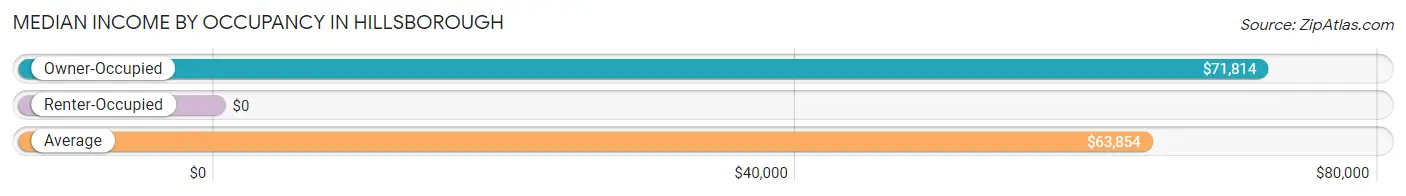
| Occupancy Type | # Households | Median Income |
| Owner-Occupied | 606 (77.5%) | $71,814 |
| Renter-Occupied | 176 (22.5%) | $0 |
| Average | 782 (100.0%) | $63,854 |
Occupancy by Householder Income Bracket in Hillsborough

| Income Bracket | Owner-occupied | Renter-occupied |
| Less than $5,000 | 0 (0.0%) | 10 (5.7%) |
| $5,000 to $9,999 | 17 (2.8%) | 0 (0.0%) |
| $10,000 to $14,999 | 0 (0.0%) | 86 (48.9%) |
| $15,000 to $19,999 | 34 (5.6%) | 0 (0.0%) |
| $20,000 to $24,999 | 55 (9.1%) | 0 (0.0%) |
| $25,000 to $34,999 | 83 (13.7%) | 15 (8.5%) |
| $35,000 to $49,999 | 39 (6.4%) | 25 (14.2%) |
| $50,000 to $74,999 | 89 (14.7%) | 23 (13.1%) |
| $75,000 to $99,999 | 80 (13.2%) | 17 (9.7%) |
| $100,000 to $149,999 | 147 (24.3%) | 0 (0.0%) |
| $150,000 or more | 62 (10.2%) | 0 (0.0%) |
| Total | 606 (100.0%) | 176 (100.0%) |
Monthly Housing Cost Tiers in Hillsborough
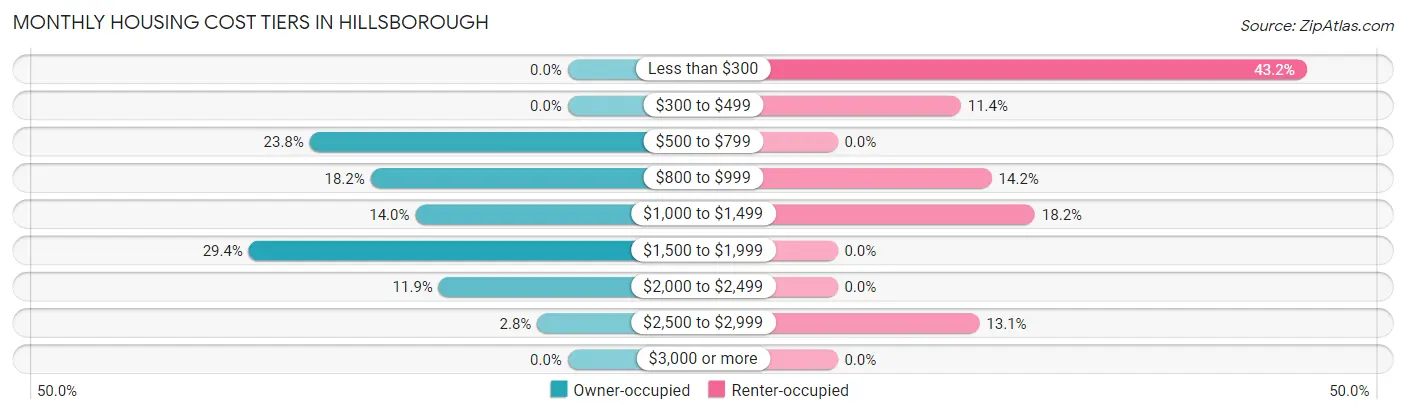
| Monthly Cost | Owner-occupied | Renter-occupied |
| Less than $300 | 0 (0.0%) | 76 (43.2%) |
| $300 to $499 | 0 (0.0%) | 20 (11.4%) |
| $500 to $799 | 144 (23.8%) | 0 (0.0%) |
| $800 to $999 | 110 (18.1%) | 25 (14.2%) |
| $1,000 to $1,499 | 85 (14.0%) | 32 (18.2%) |
| $1,500 to $1,999 | 178 (29.4%) | 0 (0.0%) |
| $2,000 to $2,499 | 72 (11.9%) | 0 (0.0%) |
| $2,500 to $2,999 | 17 (2.8%) | 23 (13.1%) |
| $3,000 or more | 0 (0.0%) | 0 (0.0%) |
| Total | 606 (100.0%) | 176 (100.0%) |
Physical Housing Characteristics in Hillsborough
Housing Structures in Hillsborough
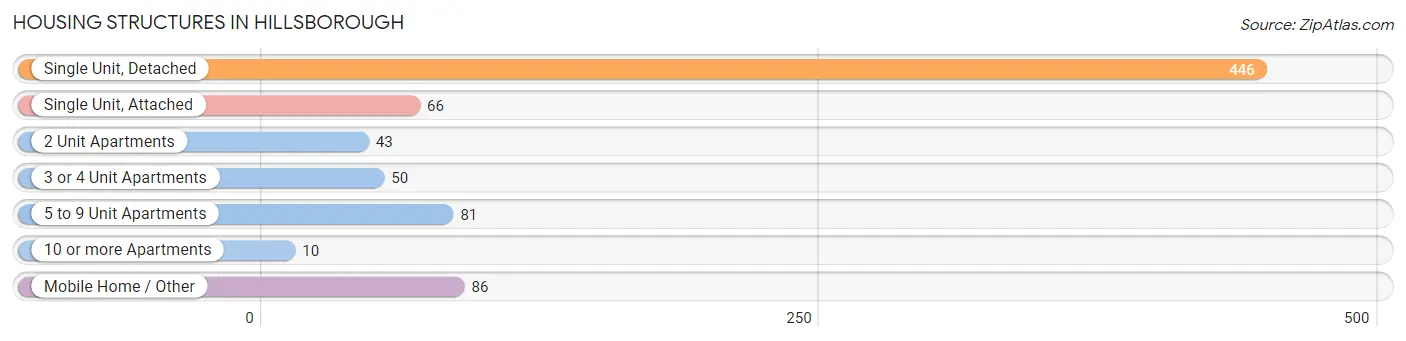
| Structure Type | # Housing Units | % Housing Units |
| Single Unit, Detached | 446 | 57.0% |
| Single Unit, Attached | 66 | 8.4% |
| 2 Unit Apartments | 43 | 5.5% |
| 3 or 4 Unit Apartments | 50 | 6.4% |
| 5 to 9 Unit Apartments | 81 | 10.4% |
| 10 or more Apartments | 10 | 1.3% |
| Mobile Home / Other | 86 | 11.0% |
| Total | 782 | 100.0% |
Housing Structures by Occupancy in Hillsborough
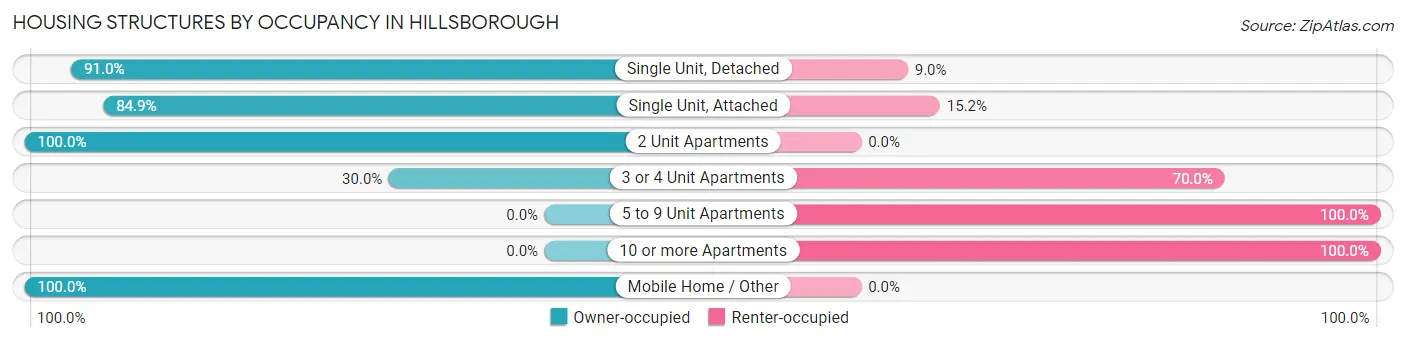
| Structure Type | Owner-occupied | Renter-occupied |
| Single Unit, Detached | 406 (91.0%) | 40 (9.0%) |
| Single Unit, Attached | 56 (84.9%) | 10 (15.1%) |
| 2 Unit Apartments | 43 (100.0%) | 0 (0.0%) |
| 3 or 4 Unit Apartments | 15 (30.0%) | 35 (70.0%) |
| 5 to 9 Unit Apartments | 0 (0.0%) | 81 (100.0%) |
| 10 or more Apartments | 0 (0.0%) | 10 (100.0%) |
| Mobile Home / Other | 86 (100.0%) | 0 (0.0%) |
| Total | 606 (77.5%) | 176 (22.5%) |
Housing Structures by Number of Rooms in Hillsborough
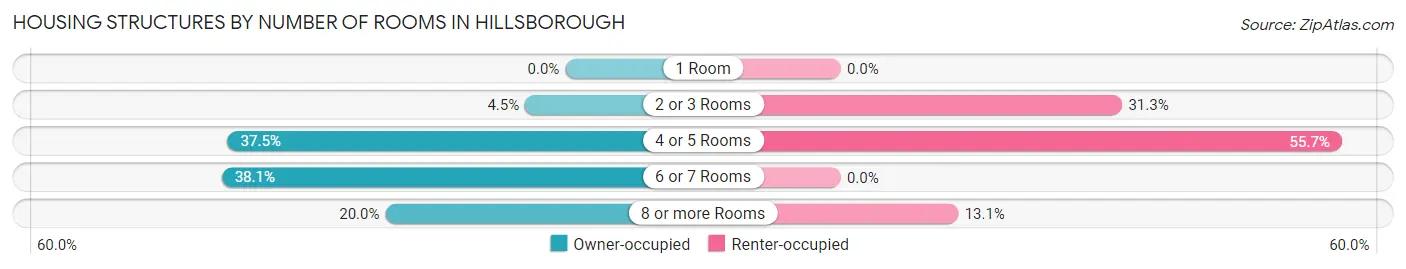
| Number of Rooms | Owner-occupied | Renter-occupied |
| 1 Room | 0 (0.0%) | 0 (0.0%) |
| 2 or 3 Rooms | 27 (4.5%) | 55 (31.2%) |
| 4 or 5 Rooms | 227 (37.5%) | 98 (55.7%) |
| 6 or 7 Rooms | 231 (38.1%) | 0 (0.0%) |
| 8 or more Rooms | 121 (20.0%) | 23 (13.1%) |
| Total | 606 (100.0%) | 176 (100.0%) |
Housing Structure by Heating Type in Hillsborough
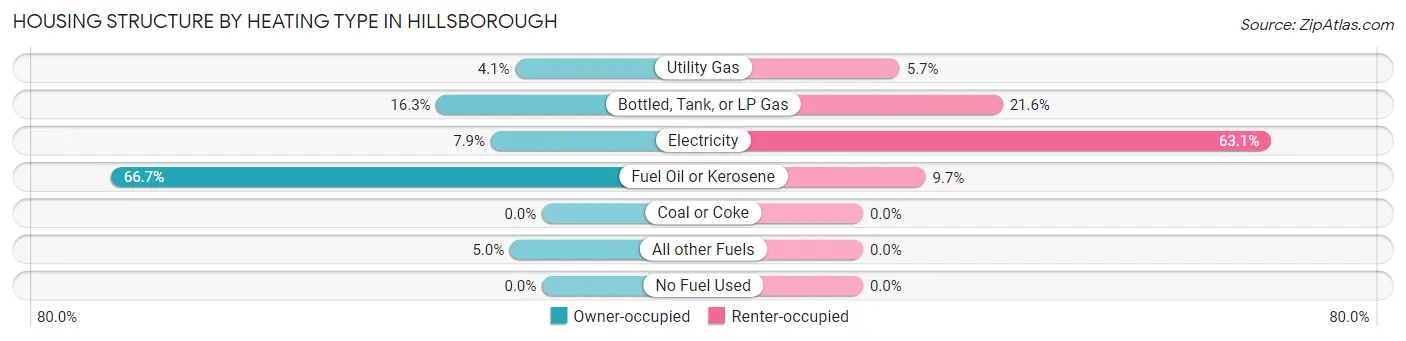
| Heating Type | Owner-occupied | Renter-occupied |
| Utility Gas | 25 (4.1%) | 10 (5.7%) |
| Bottled, Tank, or LP Gas | 99 (16.3%) | 38 (21.6%) |
| Electricity | 48 (7.9%) | 111 (63.1%) |
| Fuel Oil or Kerosene | 404 (66.7%) | 17 (9.7%) |
| Coal or Coke | 0 (0.0%) | 0 (0.0%) |
| All other Fuels | 30 (5.0%) | 0 (0.0%) |
| No Fuel Used | 0 (0.0%) | 0 (0.0%) |
| Total | 606 (100.0%) | 176 (100.0%) |
Household Vehicle Usage in Hillsborough
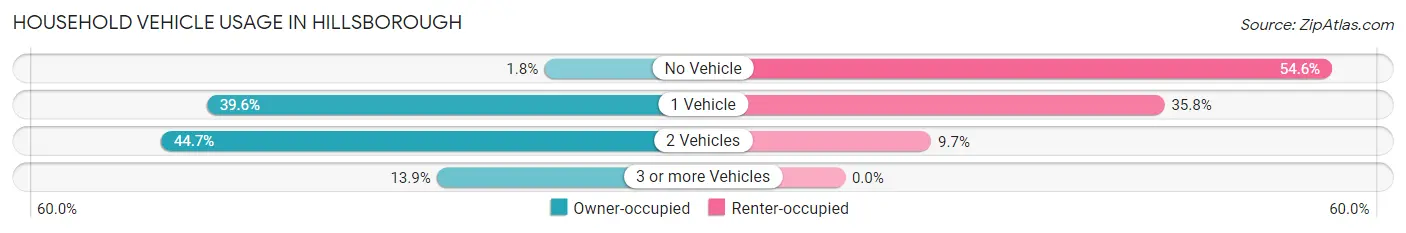
| Vehicles per Household | Owner-occupied | Renter-occupied |
| No Vehicle | 11 (1.8%) | 96 (54.5%) |
| 1 Vehicle | 240 (39.6%) | 63 (35.8%) |
| 2 Vehicles | 271 (44.7%) | 17 (9.7%) |
| 3 or more Vehicles | 84 (13.9%) | 0 (0.0%) |
| Total | 606 (100.0%) | 176 (100.0%) |
Real Estate & Mortgages in Hillsborough
Real Estate and Mortgage Overview in Hillsborough
| Characteristic | Without Mortgage | With Mortgage |
| Housing Units | 279 | 327 |
| Median Property Value | $191,500 | $169,000 |
| Median Household Income | - | - |
| Monthly Housing Costs | $793 | $0 |
| Real Estate Taxes | $4,625 | $0 |
Property Value by Mortgage Status in Hillsborough
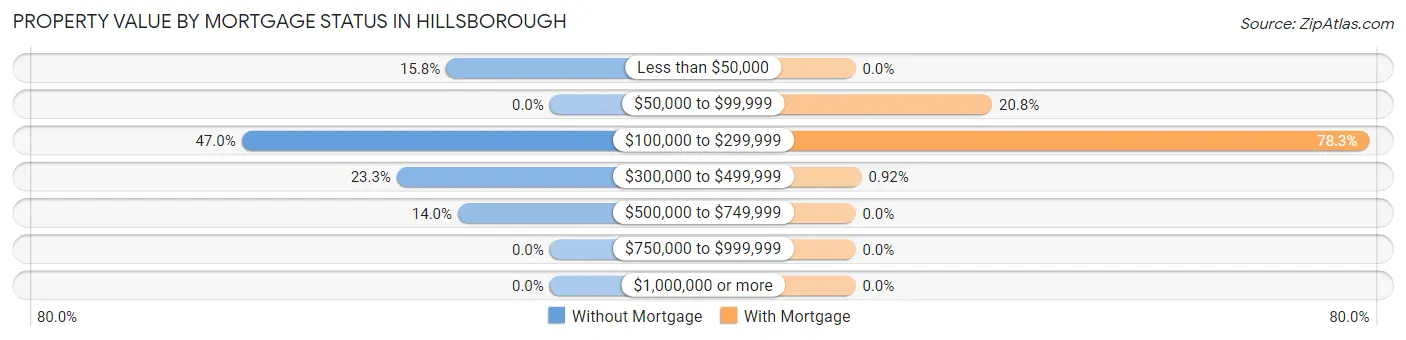
| Property Value | Without Mortgage | With Mortgage |
| Less than $50,000 | 44 (15.8%) | 0 (0.0%) |
| $50,000 to $99,999 | 0 (0.0%) | 68 (20.8%) |
| $100,000 to $299,999 | 131 (46.9%) | 256 (78.3%) |
| $300,000 to $499,999 | 65 (23.3%) | 3 (0.9%) |
| $500,000 to $749,999 | 39 (14.0%) | 0 (0.0%) |
| $750,000 to $999,999 | 0 (0.0%) | 0 (0.0%) |
| $1,000,000 or more | 0 (0.0%) | 0 (0.0%) |
| Total | 279 (100.0%) | 327 (100.0%) |
Household Income by Mortgage Status in Hillsborough
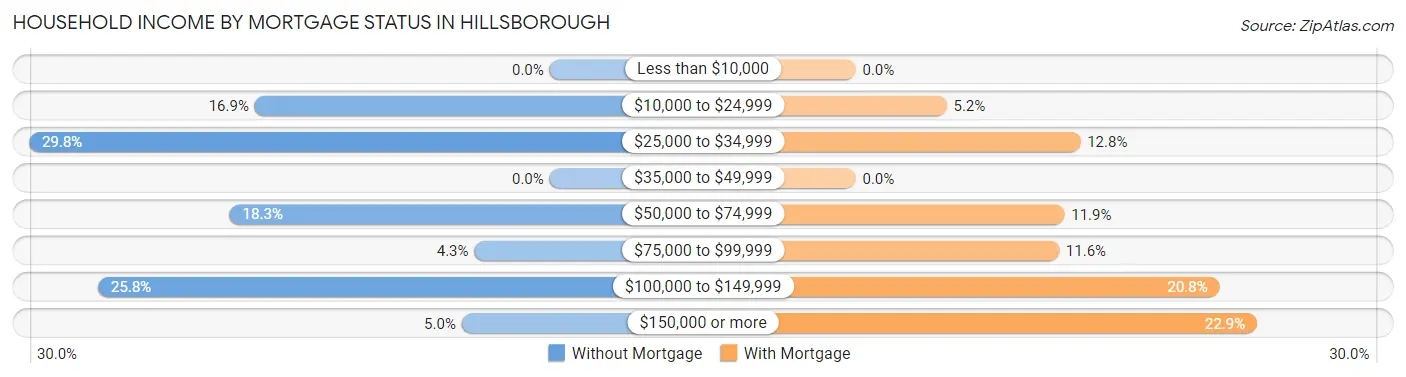
| Household Income | Without Mortgage | With Mortgage |
| Less than $10,000 | 0 (0.0%) | 0 (0.0%) |
| $10,000 to $24,999 | 47 (16.9%) | 17 (5.2%) |
| $25,000 to $34,999 | 83 (29.7%) | 42 (12.8%) |
| $35,000 to $49,999 | 0 (0.0%) | 0 (0.0%) |
| $50,000 to $74,999 | 51 (18.3%) | 39 (11.9%) |
| $75,000 to $99,999 | 12 (4.3%) | 38 (11.6%) |
| $100,000 to $149,999 | 72 (25.8%) | 68 (20.8%) |
| $150,000 or more | 14 (5.0%) | 75 (22.9%) |
| Total | 279 (100.0%) | 327 (100.0%) |
Property Value to Household Income Ratio in Hillsborough
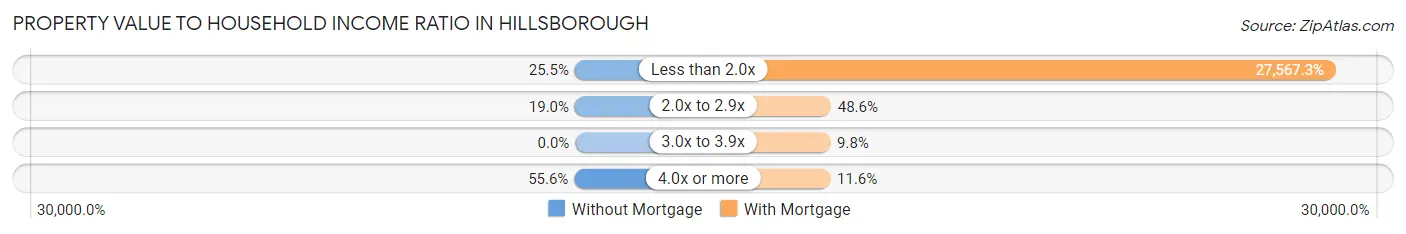
| Value-to-Income Ratio | Without Mortgage | With Mortgage |
| Less than 2.0x | 71 (25.5%) | 90,145 (27,567.3%) |
| 2.0x to 2.9x | 53 (19.0%) | 159 (48.6%) |
| 3.0x to 3.9x | 0 (0.0%) | 32 (9.8%) |
| 4.0x or more | 155 (55.6%) | 38 (11.6%) |
| Total | 279 (100.0%) | 327 (100.0%) |
Real Estate Taxes by Mortgage Status in Hillsborough
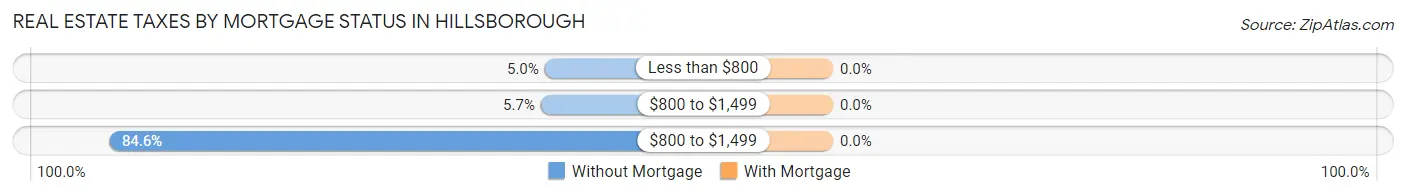
| Property Taxes | Without Mortgage | With Mortgage |
| Less than $800 | 14 (5.0%) | 0 (0.0%) |
| $800 to $1,499 | 16 (5.7%) | 0 (0.0%) |
| $800 to $1,499 | 236 (84.6%) | 0 (0.0%) |
| Total | 279 (100.0%) | 327 (100.0%) |
Health & Disability in Hillsborough
Health Insurance Coverage by Age in Hillsborough
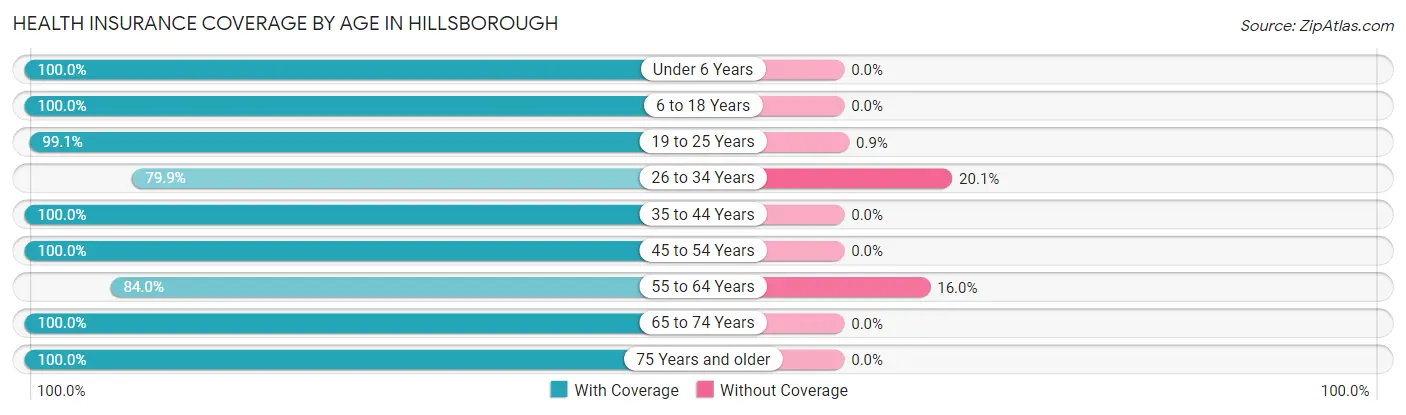
| Age Bracket | With Coverage | Without Coverage |
| Under 6 Years | 31 (100.0%) | 0 (0.0%) |
| 6 to 18 Years | 170 (100.0%) | 0 (0.0%) |
| 19 to 25 Years | 110 (99.1%) | 1 (0.9%) |
| 26 to 34 Years | 139 (79.9%) | 35 (20.1%) |
| 35 to 44 Years | 183 (100.0%) | 0 (0.0%) |
| 45 to 54 Years | 160 (100.0%) | 0 (0.0%) |
| 55 to 64 Years | 246 (84.0%) | 47 (16.0%) |
| 65 to 74 Years | 208 (100.0%) | 0 (0.0%) |
| 75 Years and older | 207 (100.0%) | 0 (0.0%) |
| Total | 1,454 (94.6%) | 83 (5.4%) |
Health Insurance Coverage by Citizenship Status in Hillsborough
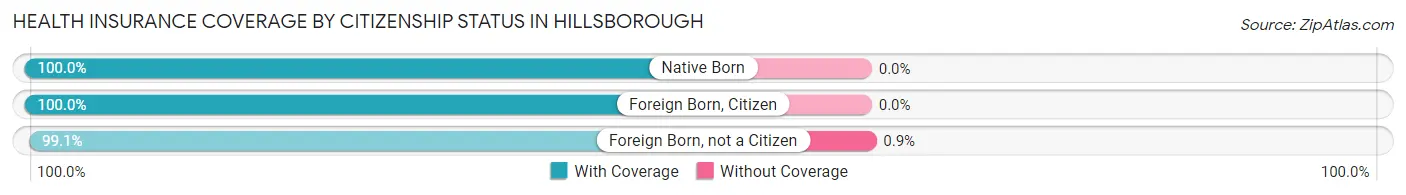
| Citizenship Status | With Coverage | Without Coverage |
| Native Born | 31 (100.0%) | 0 (0.0%) |
| Foreign Born, Citizen | 170 (100.0%) | 0 (0.0%) |
| Foreign Born, not a Citizen | 110 (99.1%) | 1 (0.9%) |
Health Insurance Coverage by Household Income in Hillsborough
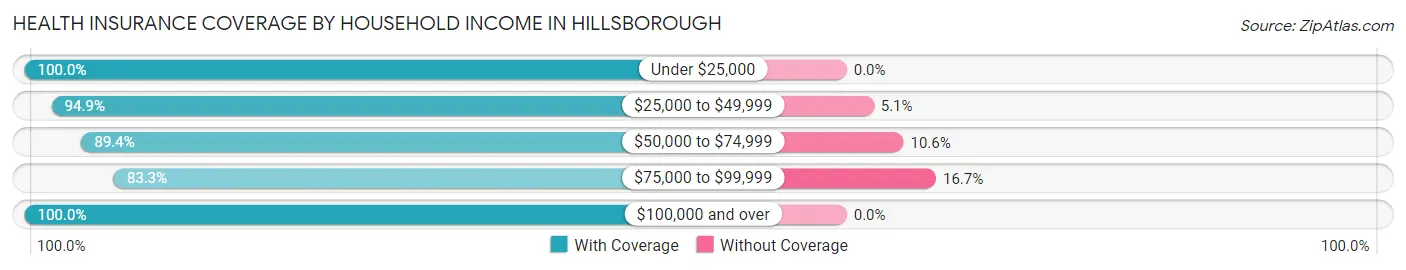
| Household Income | With Coverage | Without Coverage |
| Under $25,000 | 246 (100.0%) | 0 (0.0%) |
| $25,000 to $49,999 | 244 (94.9%) | 13 (5.1%) |
| $50,000 to $74,999 | 185 (89.4%) | 22 (10.6%) |
| $75,000 to $99,999 | 234 (83.3%) | 47 (16.7%) |
| $100,000 and over | 537 (100.0%) | 0 (0.0%) |
Public vs Private Health Insurance Coverage by Age in Hillsborough
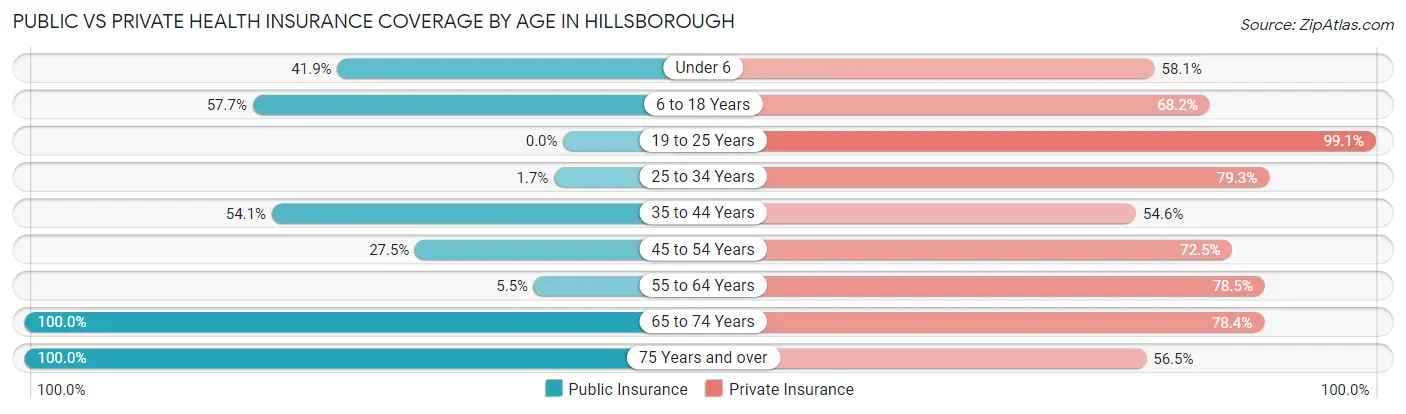
| Age Bracket | Public Insurance | Private Insurance |
| Under 6 | 13 (41.9%) | 18 (58.1%) |
| 6 to 18 Years | 98 (57.7%) | 116 (68.2%) |
| 19 to 25 Years | 0 (0.0%) | 110 (99.1%) |
| 25 to 34 Years | 3 (1.7%) | 138 (79.3%) |
| 35 to 44 Years | 99 (54.1%) | 100 (54.6%) |
| 45 to 54 Years | 44 (27.5%) | 116 (72.5%) |
| 55 to 64 Years | 16 (5.5%) | 230 (78.5%) |
| 65 to 74 Years | 208 (100.0%) | 163 (78.4%) |
| 75 Years and over | 207 (100.0%) | 117 (56.5%) |
| Total | 688 (44.8%) | 1,108 (72.1%) |
Disability Status by Sex by Age in Hillsborough
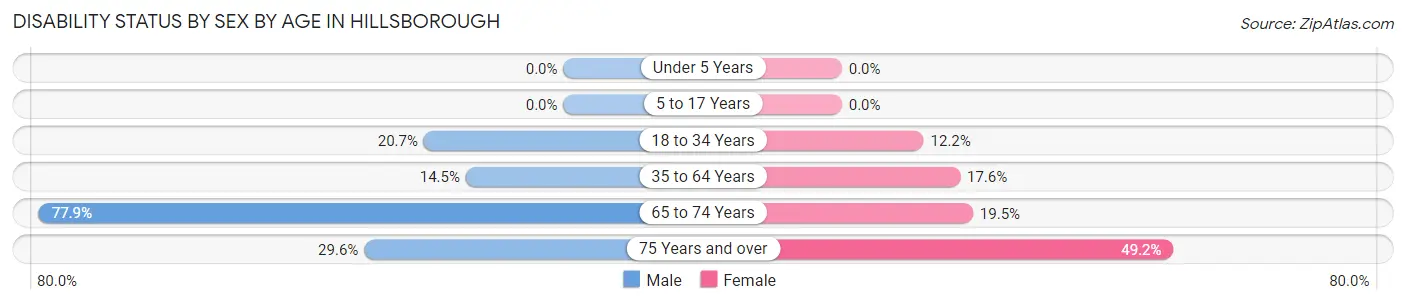
| Age Bracket | Male | Female |
| Under 5 Years | 0 (0.0%) | 0 (0.0%) |
| 5 to 17 Years | 0 (0.0%) | 0 (0.0%) |
| 18 to 34 Years | 23 (20.7%) | 22 (12.1%) |
| 35 to 64 Years | 41 (14.5%) | 62 (17.6%) |
| 65 to 74 Years | 74 (77.9%) | 22 (19.5%) |
| 75 Years and over | 42 (29.6%) | 32 (49.2%) |
Disability Class by Sex by Age in Hillsborough
Disability Class: Hearing Difficulty
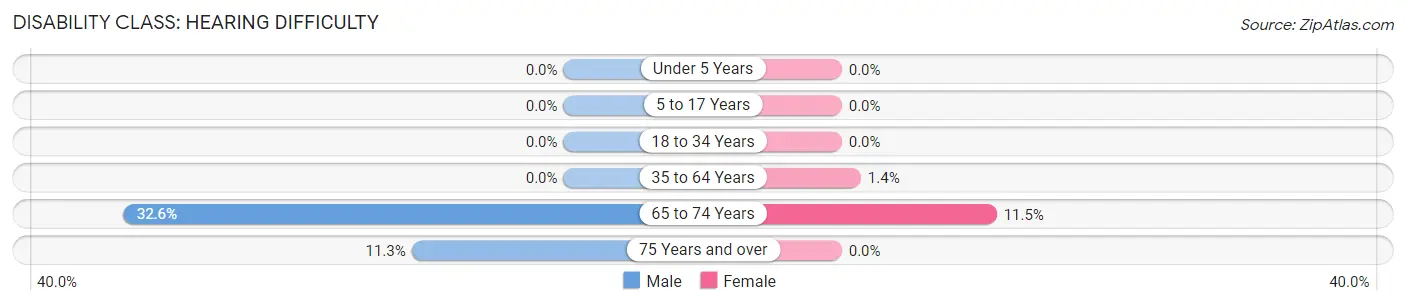
| Age Bracket | Male | Female |
| Under 5 Years | 0 (0.0%) | 0 (0.0%) |
| 5 to 17 Years | 0 (0.0%) | 0 (0.0%) |
| 18 to 34 Years | 0 (0.0%) | 0 (0.0%) |
| 35 to 64 Years | 0 (0.0%) | 5 (1.4%) |
| 65 to 74 Years | 31 (32.6%) | 13 (11.5%) |
| 75 Years and over | 16 (11.3%) | 0 (0.0%) |
Disability Class: Vision Difficulty
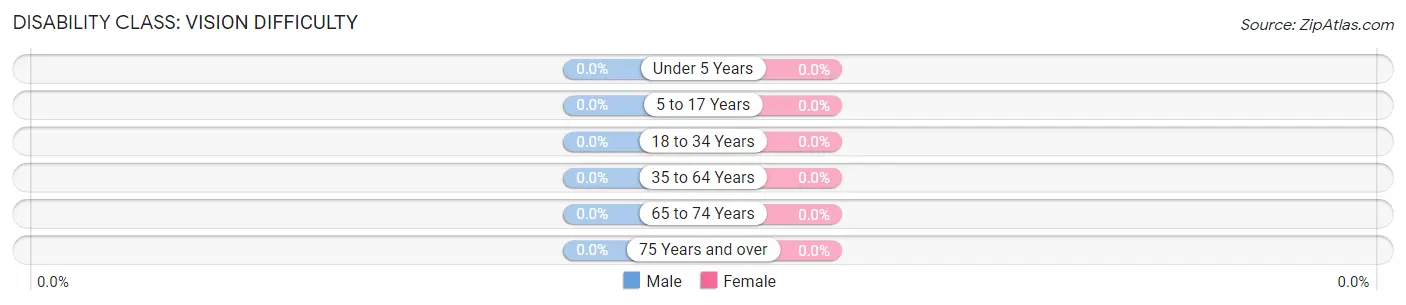
| Age Bracket | Male | Female |
| Under 5 Years | 0 (0.0%) | 0 (0.0%) |
| 5 to 17 Years | 0 (0.0%) | 0 (0.0%) |
| 18 to 34 Years | 0 (0.0%) | 0 (0.0%) |
| 35 to 64 Years | 0 (0.0%) | 0 (0.0%) |
| 65 to 74 Years | 0 (0.0%) | 0 (0.0%) |
| 75 Years and over | 0 (0.0%) | 0 (0.0%) |
Disability Class: Cognitive Difficulty
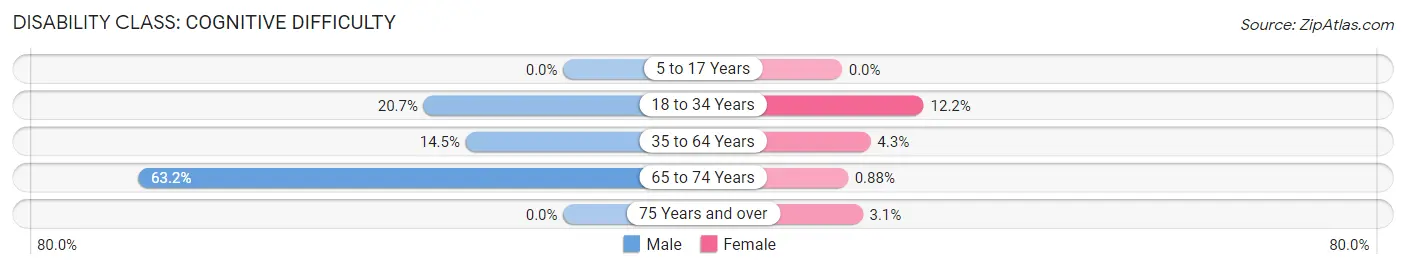
| Age Bracket | Male | Female |
| 5 to 17 Years | 0 (0.0%) | 0 (0.0%) |
| 18 to 34 Years | 23 (20.7%) | 22 (12.1%) |
| 35 to 64 Years | 41 (14.5%) | 15 (4.3%) |
| 65 to 74 Years | 60 (63.2%) | 1 (0.9%) |
| 75 Years and over | 0 (0.0%) | 2 (3.1%) |
Disability Class: Ambulatory Difficulty
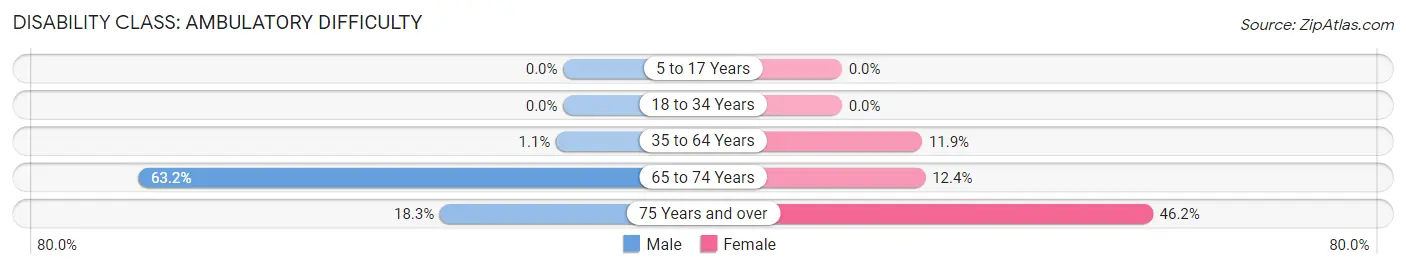
| Age Bracket | Male | Female |
| 5 to 17 Years | 0 (0.0%) | 0 (0.0%) |
| 18 to 34 Years | 0 (0.0%) | 0 (0.0%) |
| 35 to 64 Years | 3 (1.1%) | 42 (11.9%) |
| 65 to 74 Years | 60 (63.2%) | 14 (12.4%) |
| 75 Years and over | 26 (18.3%) | 30 (46.2%) |
Disability Class: Self-Care Difficulty
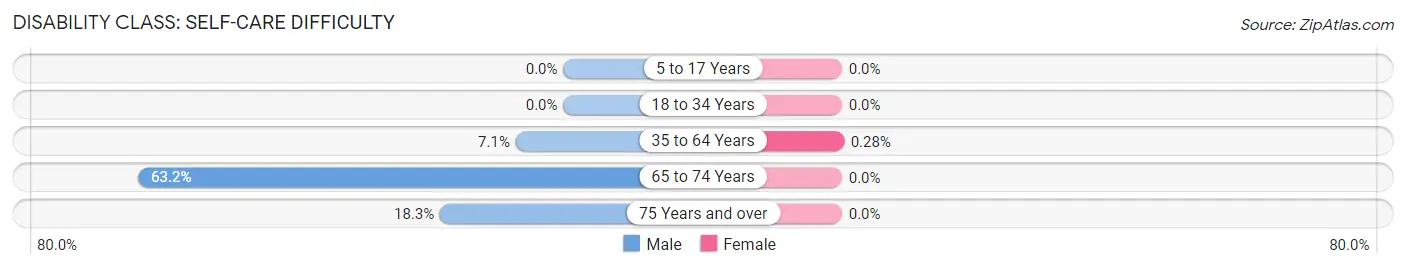
| Age Bracket | Male | Female |
| 5 to 17 Years | 0 (0.0%) | 0 (0.0%) |
| 18 to 34 Years | 0 (0.0%) | 0 (0.0%) |
| 35 to 64 Years | 20 (7.1%) | 1 (0.3%) |
| 65 to 74 Years | 60 (63.2%) | 0 (0.0%) |
| 75 Years and over | 26 (18.3%) | 0 (0.0%) |
Technology Access in Hillsborough
Computing Device Access in Hillsborough
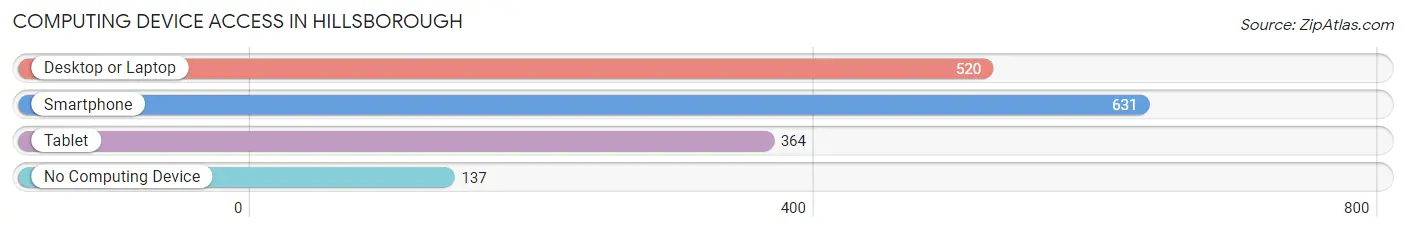
| Device Type | # Households | % Households |
| Desktop or Laptop | 520 | 66.5% |
| Smartphone | 631 | 80.7% |
| Tablet | 364 | 46.6% |
| No Computing Device | 137 | 17.5% |
| Total | 782 | 100.0% |
Internet Access in Hillsborough
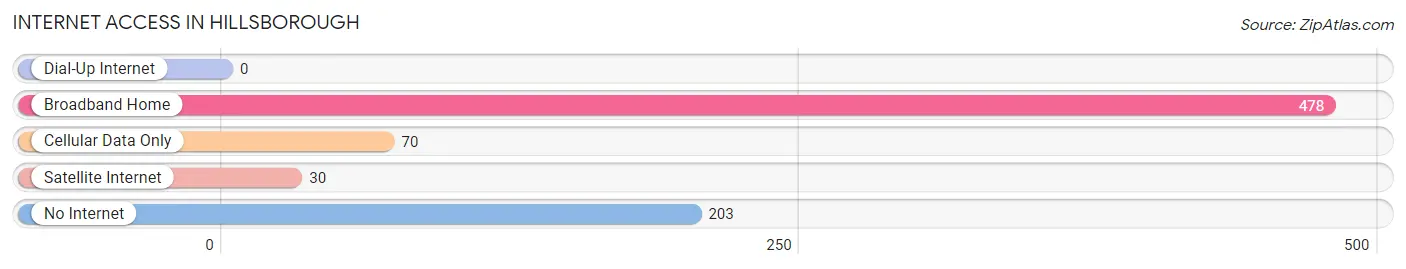
| Internet Type | # Households | % Households |
| Dial-Up Internet | 0 | 0.0% |
| Broadband Home | 478 | 61.1% |
| Cellular Data Only | 70 | 8.9% |
| Satellite Internet | 30 | 3.8% |
| No Internet | 203 | 26.0% |
| Total | 782 | 100.0% |
Hillsborough Summary
Hillsborough, New Hampshire is a small town located in Hillsborough County in the southwestern part of the state. It is situated on the banks of the Contoocook River and is bordered by the towns of Antrim, Bennington, Deering, Francestown, and Weare. The town has a population of 2,845 as of the 2010 census, and is part of the larger Manchester-Nashua metropolitan area.
Geography
Hillsborough is located in the southwestern part of Hillsborough County, New Hampshire. It is situated on the banks of the Contoocook River, which flows through the town from north to south. The town is bordered by the towns of Antrim, Bennington, Deering, Francestown, and Weare. The town has a total area of 24.2 square miles, of which 24.1 square miles is land and 0.1 square miles is water. The highest point in the town is the summit of Pack Monadnock, which has an elevation of 2,290 feet.
Climate
Hillsborough has a humid continental climate, with cold, snowy winters and warm, humid summers. The average annual temperature is 43.2°F, with an average high of 57.2°F in July and an average low of 28.2°F in January. The average annual precipitation is 43.2 inches, with an average of 4.3 inches of snowfall per year.
Demographics
As of the 2010 census, there were 2,845 people, 1,093 households, and 790 families residing in the town. The population density was 118.2 people per square mile. The racial makeup of the town was 97.2% White, 0.4% African American, 0.3% Native American, 0.4% Asian, 0.1% Pacific Islander, 0.3% from other races, and 1.3% from two or more races. Hispanic or Latino of any race were 1.2% of the population.
Economy
Hillsborough is a rural town with a largely agricultural economy. The town is home to several small businesses, including a few restaurants, a grocery store, and a few retail stores. The town is also home to several farms, which produce a variety of crops, including apples, corn, and hay. The town is also home to a few small manufacturing companies, which produce a variety of products, including furniture, clothing, and electronics.
The town is also home to a few small tourist attractions, including the Contoocook River Canoe Company, which offers canoe and kayak rentals, and the Hillsborough Historical Society, which offers tours of the town's historic sites.
Conclusion
Hillsborough, New Hampshire is a small town located in Hillsborough County in the southwestern part of the state. It is situated on the banks of the Contoocook River and is bordered by the towns of Antrim, Bennington, Deering, Francestown, and Weare. The town has a population of 2,845 as of the 2010 census, and is part of the larger Manchester-Nashua metropolitan area. The town has a humid continental climate, with cold, snowy winters and warm, humid summers. The town has a largely agricultural economy, with several small businesses, farms, and manufacturing companies. The town is also home to a few small tourist attractions, including the Contoocook River Canoe Company and the Hillsborough Historical Society.
Common Questions
What is Per Capita Income in Hillsborough?
Per Capita income in Hillsborough is $36,668.
What is the Median Family Income in Hillsborough?
Median Family Income in Hillsborough is $74,402.
What is the Median Household income in Hillsborough?
Median Household Income in Hillsborough is $63,854.
What is Income or Wage Gap in Hillsborough?
Income or Wage Gap in Hillsborough is 41.4%.
Women in Hillsborough earn 58.6 cents for every dollar earned by a man.
What is Inequality or Gini Index in Hillsborough?
Inequality or Gini Index in Hillsborough is 0.43.
What is the Total Population of Hillsborough?
Total Population of Hillsborough is 1,567.
What is the Total Male Population of Hillsborough?
Total Male Population of Hillsborough is 742.
What is the Total Female Population of Hillsborough?
Total Female Population of Hillsborough is 825.
What is the Ratio of Males per 100 Females in Hillsborough?
There are 89.94 Males per 100 Females in Hillsborough.
What is the Ratio of Females per 100 Males in Hillsborough?
There are 111.19 Females per 100 Males in Hillsborough.
What is the Median Population Age in Hillsborough?
Median Population Age in Hillsborough is 50.6 Years.
What is the Average Family Size in Hillsborough
Average Family Size in Hillsborough is 2.7 People.
What is the Average Household Size in Hillsborough
Average Household Size in Hillsborough is 1.9 People.
How Large is the Labor Force in Hillsborough?
There are 778 People in the Labor Forcein in Hillsborough.
What is the Percentage of People in the Labor Force in Hillsborough?
55.2% of People are in the Labor Force in Hillsborough.