Colebrook, NH Map & Demographics
Colebrook Map
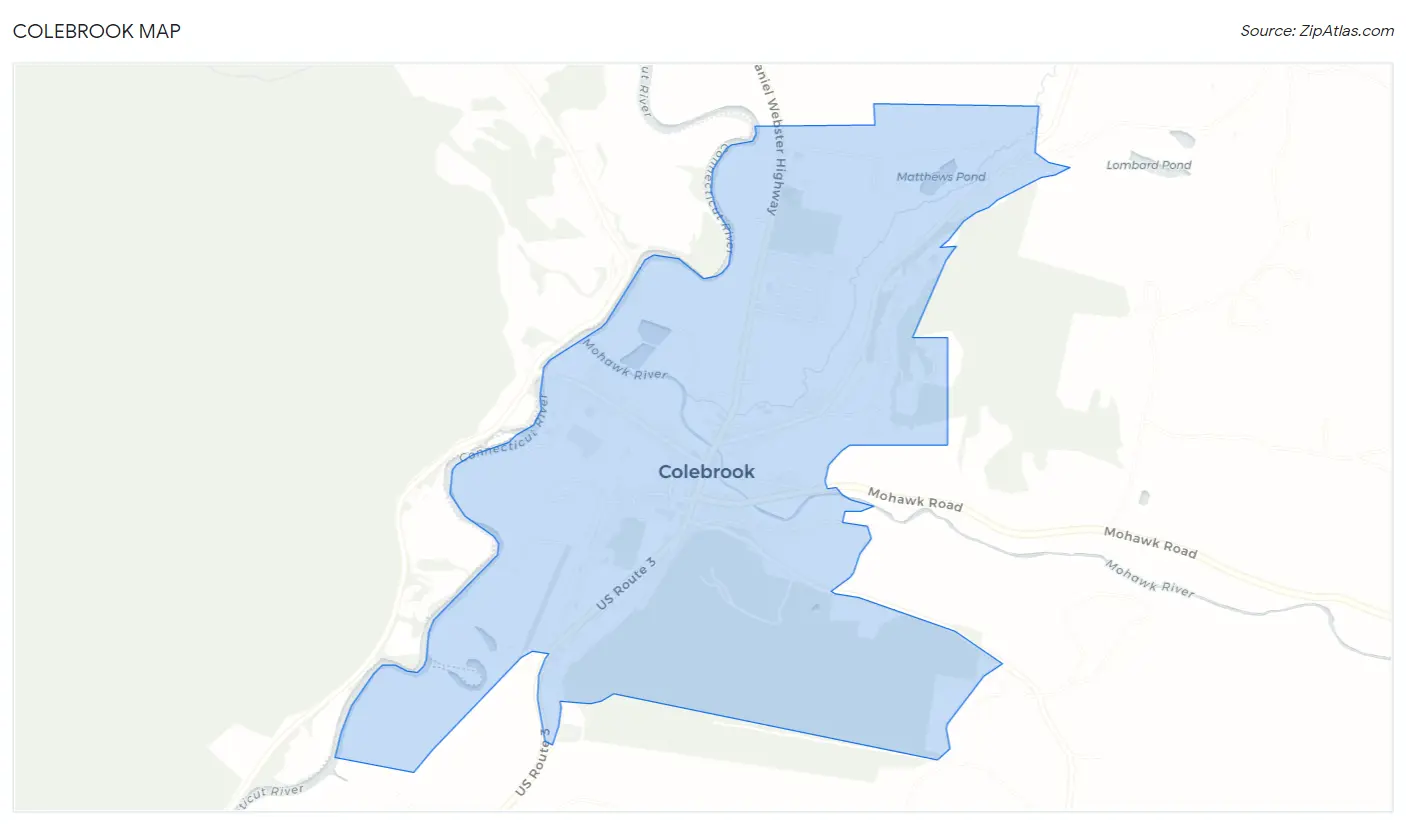
Colebrook Overview
$30,353
PER CAPITA INCOME
$54,567
AVG FAMILY INCOME
$42,500
AVG HOUSEHOLD INCOME
15.8%
WAGE / INCOME GAP [ % ]
84.2¢/ $1
WAGE / INCOME GAP [ $ ]
0.47
INEQUALITY / GINI INDEX
1,100
TOTAL POPULATION
566
MALE POPULATION
534
FEMALE POPULATION
105.99
MALES / 100 FEMALES
94.35
FEMALES / 100 MALES
53.8
MEDIAN AGE
2.6
AVG FAMILY SIZE
1.9
AVG HOUSEHOLD SIZE
491
LABOR FORCE [ PEOPLE ]
49.9%
PERCENT IN LABOR FORCE
0.2%
UNEMPLOYMENT RATE
Colebrook Zip Codes
Colebrook Area Codes
Income in Colebrook
Income Overview in Colebrook
Per Capita Income in Colebrook is $30,353, while median incomes of families and households are $54,567 and $42,500 respectively.
| Characteristic | Number | Measure |
| Per Capita Income | 1,100 | $30,353 |
| Median Family Income | 249 | $54,567 |
| Mean Family Income | 249 | $84,015 |
| Median Household Income | 568 | $42,500 |
| Mean Household Income | 568 | $60,094 |
| Income Deficit | 249 | $0 |
| Wage / Income Gap (%) | 1,100 | 15.84% |
| Wage / Income Gap ($) | 1,100 | 84.16¢ per $1 |
| Gini / Inequality Index | 1,100 | 0.47 |
Earnings by Sex in Colebrook
Average Earnings in Colebrook are $25,536, $28,621 for men and $24,088 for women, a difference of 15.8%.
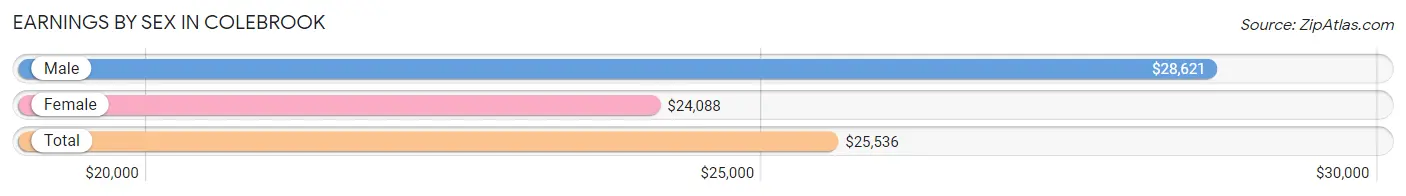
| Sex | Number | Average Earnings |
| Male | 274 (49.0%) | $28,621 |
| Female | 285 (51.0%) | $24,088 |
| Total | 559 (100.0%) | $25,536 |
Earnings by Sex by Income Bracket in Colebrook
The most common earnings brackets in Colebrook are $40,000 to $44,999 for men (53 | 19.3%) and $35,000 to $39,999 for women (51 | 17.9%).
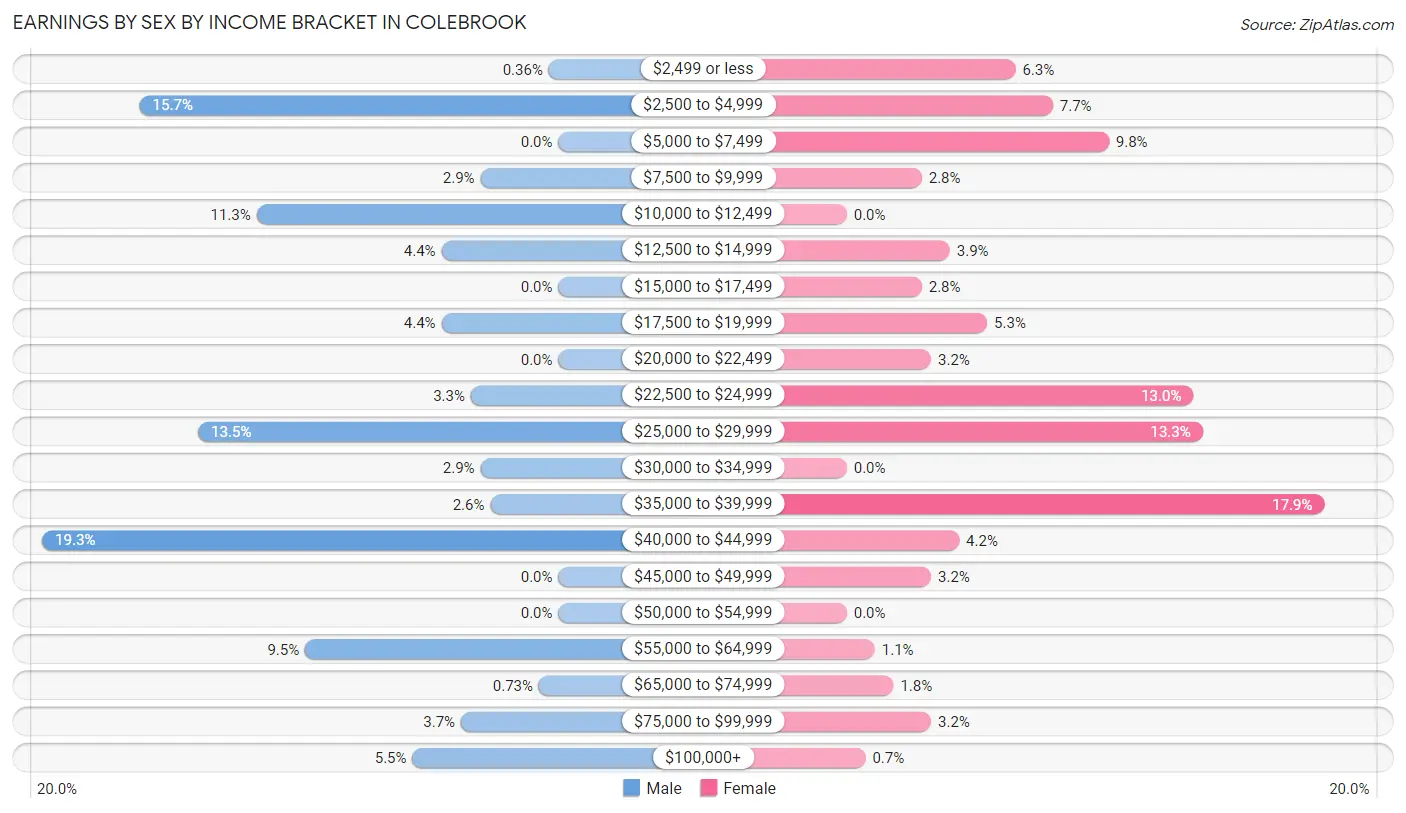
| Income | Male | Female |
| $2,499 or less | 1 (0.4%) | 18 (6.3%) |
| $2,500 to $4,999 | 43 (15.7%) | 22 (7.7%) |
| $5,000 to $7,499 | 0 (0.0%) | 28 (9.8%) |
| $7,500 to $9,999 | 8 (2.9%) | 8 (2.8%) |
| $10,000 to $12,499 | 31 (11.3%) | 0 (0.0%) |
| $12,500 to $14,999 | 12 (4.4%) | 11 (3.9%) |
| $15,000 to $17,499 | 0 (0.0%) | 8 (2.8%) |
| $17,500 to $19,999 | 12 (4.4%) | 15 (5.3%) |
| $20,000 to $22,499 | 0 (0.0%) | 9 (3.2%) |
| $22,500 to $24,999 | 9 (3.3%) | 37 (13.0%) |
| $25,000 to $29,999 | 37 (13.5%) | 38 (13.3%) |
| $30,000 to $34,999 | 8 (2.9%) | 0 (0.0%) |
| $35,000 to $39,999 | 7 (2.5%) | 51 (17.9%) |
| $40,000 to $44,999 | 53 (19.3%) | 12 (4.2%) |
| $45,000 to $49,999 | 0 (0.0%) | 9 (3.2%) |
| $50,000 to $54,999 | 0 (0.0%) | 0 (0.0%) |
| $55,000 to $64,999 | 26 (9.5%) | 3 (1.1%) |
| $65,000 to $74,999 | 2 (0.7%) | 5 (1.8%) |
| $75,000 to $99,999 | 10 (3.6%) | 9 (3.2%) |
| $100,000+ | 15 (5.5%) | 2 (0.7%) |
| Total | 274 (100.0%) | 285 (100.0%) |
Earnings by Sex by Educational Attainment in Colebrook
Average earnings in Colebrook are $29,052 for men and $24,122 for women, a difference of 17.0%. Men with an educational attainment of bachelor's degree enjoy the highest average annual earnings of $92,813, while those with college or associate's degree education earn the least with $28,026. Women with an educational attainment of less than high school earn the most with the average annual earnings of $38,636, while those with high school diploma education have the smallest earnings of $23,164.
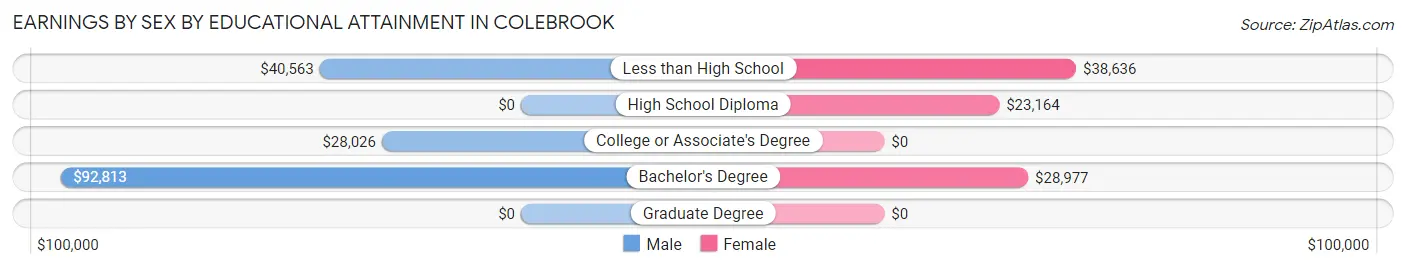
| Educational Attainment | Male Income | Female Income |
| Less than High School | $40,563 | $38,636 |
| High School Diploma | - | - |
| College or Associate's Degree | $28,026 | $0 |
| Bachelor's Degree | $92,813 | $28,977 |
| Graduate Degree | - | - |
| Total | $29,052 | $24,122 |
Family Income in Colebrook
Family Income Brackets in Colebrook
According to the Colebrook family income data, there are 74 families falling into the $50,000 to $74,999 income range, which is the most common income bracket and makes up 29.7% of all families.
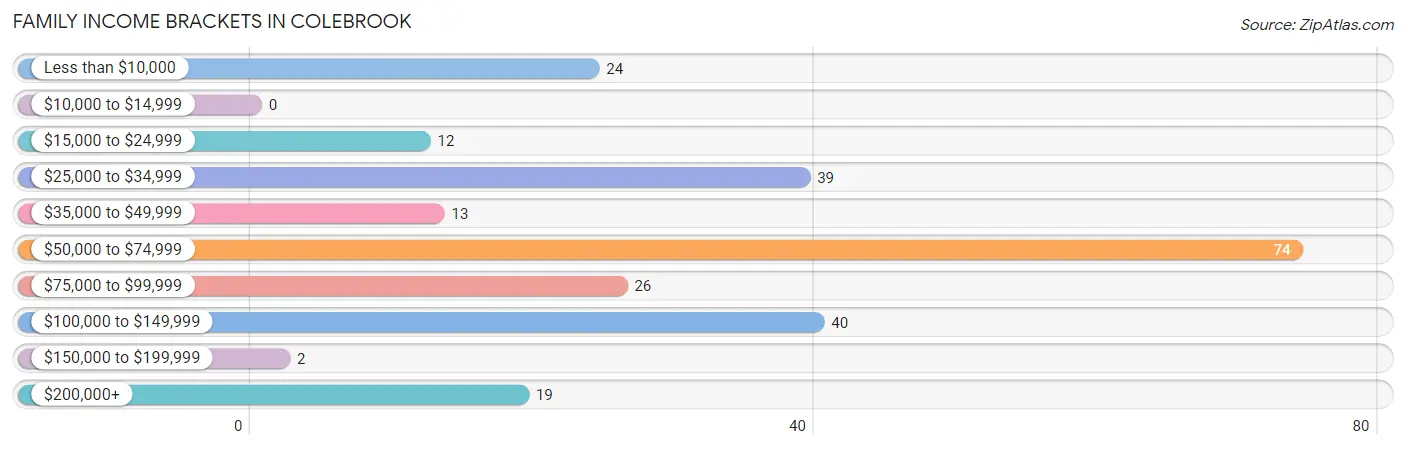
| Income Bracket | # Families | % Families |
| Less than $10,000 | 24 | 9.6% |
| $10,000 to $14,999 | 0 | 0.0% |
| $15,000 to $24,999 | 12 | 4.8% |
| $25,000 to $34,999 | 39 | 15.7% |
| $35,000 to $49,999 | 13 | 5.2% |
| $50,000 to $74,999 | 74 | 29.7% |
| $75,000 to $99,999 | 26 | 10.4% |
| $100,000 to $149,999 | 40 | 16.1% |
| $150,000 to $199,999 | 2 | 0.8% |
| $200,000+ | 19 | 7.6% |
Family Income by Famaliy Size in Colebrook
4-person families (23 | 9.2%) account for the highest median family income in Colebrook with $77,969 per family, while 4-person families (23 | 9.2%) have the highest median income of $19,492 per family member.
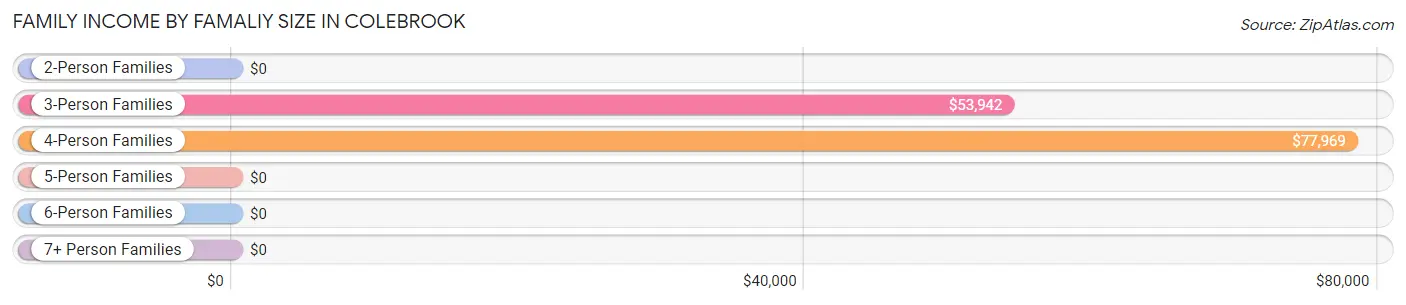
| Income Bracket | # Families | Median Income |
| 2-Person Families | 136 (54.6%) | $0 |
| 3-Person Families | 90 (36.1%) | $53,942 |
| 4-Person Families | 23 (9.2%) | $77,969 |
| 5-Person Families | 0 (0.0%) | $0 |
| 6-Person Families | 0 (0.0%) | $0 |
| 7+ Person Families | 0 (0.0%) | $0 |
| Total | 249 (100.0%) | $54,567 |
Family Income by Number of Earners in Colebrook
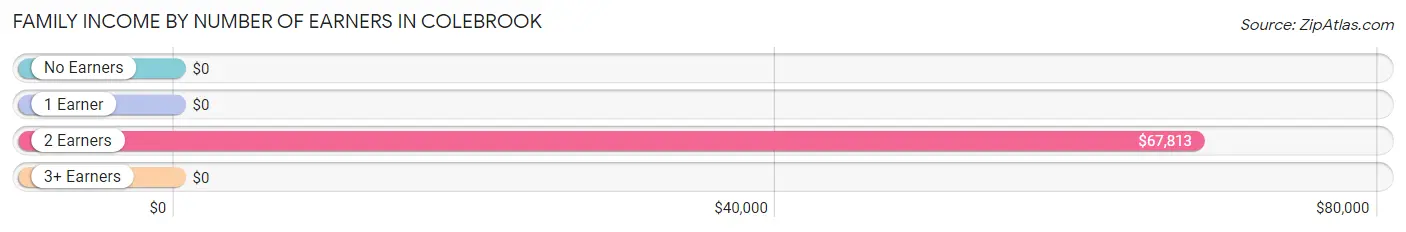
| Number of Earners | # Families | Median Income |
| No Earners | 73 (29.3%) | $0 |
| 1 Earner | 47 (18.9%) | $0 |
| 2 Earners | 111 (44.6%) | $67,813 |
| 3+ Earners | 18 (7.2%) | $0 |
| Total | 249 (100.0%) | $54,567 |
Household Income in Colebrook
Household Income Brackets in Colebrook
With 130 households falling in the category, the $50,000 to $74,999 income range is the most frequent in Colebrook, accounting for 22.9% of all households. In contrast, only 2 households (0.4%) fall into the $150,000 to $199,999 income bracket, making it the least populous group.
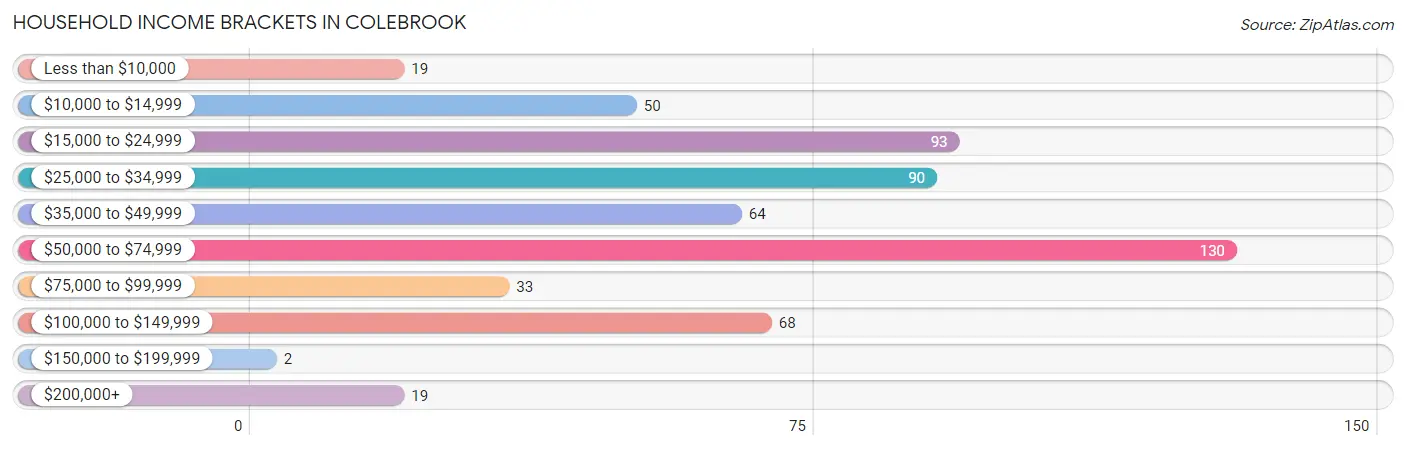
| Income Bracket | # Households | % Households |
| Less than $10,000 | 19 | 3.3% |
| $10,000 to $14,999 | 50 | 8.8% |
| $15,000 to $24,999 | 93 | 16.4% |
| $25,000 to $34,999 | 90 | 15.8% |
| $35,000 to $49,999 | 64 | 11.3% |
| $50,000 to $74,999 | 130 | 22.9% |
| $75,000 to $99,999 | 33 | 5.8% |
| $100,000 to $149,999 | 68 | 12.0% |
| $150,000 to $199,999 | 2 | 0.4% |
| $200,000+ | 19 | 3.3% |
Household Income by Householder Age in Colebrook
The median household income in Colebrook is $42,500, with the highest median household income of $52,548 found in the 45 to 64 years age bracket for the primary householder. A total of 271 households (47.7%) fall into this category. Meanwhile, the 15 to 24 years age bracket for the primary householder has the lowest median household income of $0, with 27 households (4.8%) in this group.
| Income Bracket | # Households | Median Income |
| 15 to 24 Years | 27 (4.8%) | $0 |
| 25 to 44 Years | 46 (8.1%) | $31,667 |
| 45 to 64 Years | 271 (47.7%) | $52,548 |
| 65+ Years | 224 (39.4%) | $37,250 |
| Total | 568 (100.0%) | $42,500 |
Poverty in Colebrook
Income Below Poverty by Sex and Age in Colebrook
With 18.2% poverty level for males and 18.7% for females among the residents of Colebrook, 12 to 14 year old males and under 5 year old females are the most vulnerable to poverty, with 1 males (100.0%) and 16 females (66.7%) in their respective age groups living below the poverty level.
| Age Bracket | Male | Female |
| Under 5 Years | 5 (14.7%) | 16 (66.7%) |
| 5 Years | 0 (0.0%) | 0 (0.0%) |
| 6 to 11 Years | 6 (60.0%) | 1 (7.7%) |
| 12 to 14 Years | 1 (100.0%) | 0 (0.0%) |
| 15 Years | 0 (0.0%) | 0 (0.0%) |
| 16 and 17 Years | 0 (0.0%) | 0 (0.0%) |
| 18 to 24 Years | 0 (0.0%) | 0 (0.0%) |
| 25 to 34 Years | 51 (58.0%) | 23 (42.6%) |
| 35 to 44 Years | 0 (0.0%) | 0 (0.0%) |
| 45 to 54 Years | 8 (5.4%) | 10 (27.0%) |
| 55 to 64 Years | 29 (26.9%) | 19 (14.2%) |
| 65 to 74 Years | 3 (3.1%) | 14 (14.0%) |
| 75 Years and over | 0 (0.0%) | 17 (23.6%) |
| Total | 103 (18.2%) | 100 (18.7%) |
Income Above Poverty by Sex and Age in Colebrook
According to the poverty statistics in Colebrook, males aged 5 years and females aged 5 years are the age groups that are most secure financially, with 100.0% of males and 100.0% of females in these age groups living above the poverty line.
| Age Bracket | Male | Female |
| Under 5 Years | 29 (85.3%) | 8 (33.3%) |
| 5 Years | 3 (100.0%) | 12 (100.0%) |
| 6 to 11 Years | 4 (40.0%) | 12 (92.3%) |
| 12 to 14 Years | 0 (0.0%) | 0 (0.0%) |
| 15 Years | 19 (100.0%) | 0 (0.0%) |
| 16 and 17 Years | 5 (100.0%) | 13 (100.0%) |
| 18 to 24 Years | 17 (100.0%) | 42 (100.0%) |
| 25 to 34 Years | 37 (42.0%) | 31 (57.4%) |
| 35 to 44 Years | 10 (100.0%) | 33 (100.0%) |
| 45 to 54 Years | 139 (94.6%) | 27 (73.0%) |
| 55 to 64 Years | 79 (73.2%) | 115 (85.8%) |
| 65 to 74 Years | 95 (96.9%) | 86 (86.0%) |
| 75 Years and over | 26 (100.0%) | 55 (76.4%) |
| Total | 463 (81.8%) | 434 (81.3%) |
Income Below Poverty Among Married-Couple Families in Colebrook
The poverty statistics for married-couple families in Colebrook show that 3.1% or 6 of the total 193 families live below the poverty line. Families with no children have the highest poverty rate of 4.3%, comprising of 6 families. On the other hand, families with 1 or 2 children have the lowest poverty rate of 0.0%, which includes 0 families.
| Children | Above Poverty | Below Poverty |
| No Children | 133 (95.7%) | 6 (4.3%) |
| 1 or 2 Children | 54 (100.0%) | 0 (0.0%) |
| 3 or 4 Children | 0 (0.0%) | 0 (0.0%) |
| 5 or more Children | 0 (0.0%) | 0 (0.0%) |
| Total | 187 (96.9%) | 6 (3.1%) |
Income Below Poverty Among Single-Parent Households in Colebrook
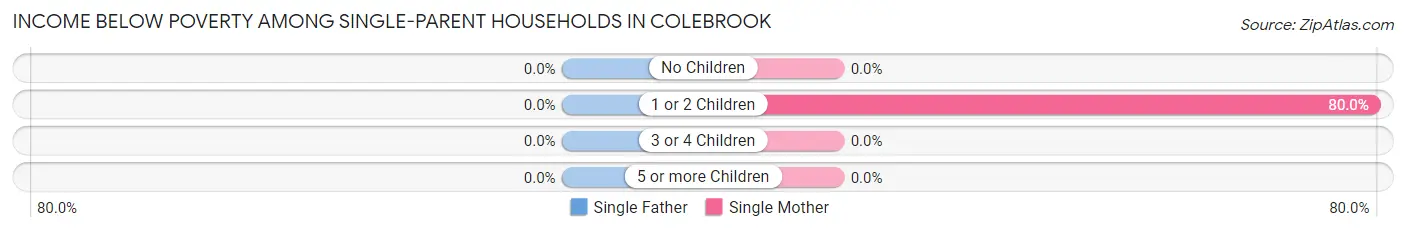
| Children | Single Father | Single Mother |
| No Children | 0 (0.0%) | 0 (0.0%) |
| 1 or 2 Children | 0 (0.0%) | 24 (80.0%) |
| 3 or 4 Children | 0 (0.0%) | 0 (0.0%) |
| 5 or more Children | 0 (0.0%) | 0 (0.0%) |
| Total | 0 (0.0%) | 24 (57.1%) |
Income Below Poverty Among Married-Couple vs Single-Parent Households in Colebrook
The poverty data for Colebrook shows that 6 of the married-couple family households (3.1%) and 24 of the single-parent households (42.9%) are living below the poverty level. Within the married-couple family households, those with no children have the highest poverty rate, with 6 households (4.3%) falling below the poverty line. Among the single-parent households, those with 1 or 2 children have the highest poverty rate, with 24 household (54.5%) living below poverty.
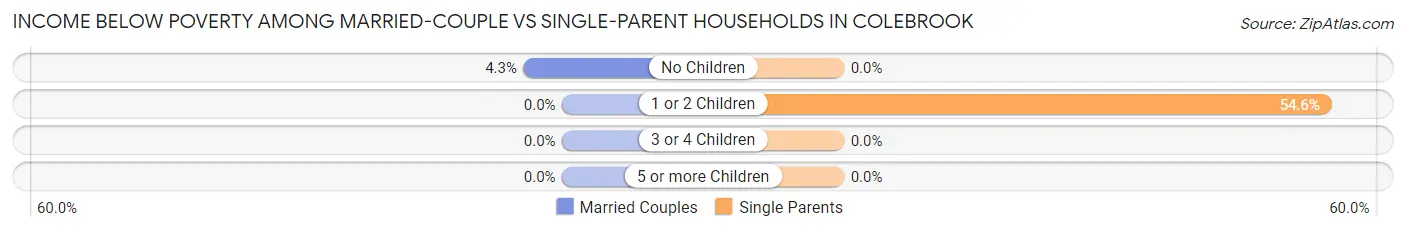
| Children | Married-Couple Families | Single-Parent Households |
| No Children | 6 (4.3%) | 0 (0.0%) |
| 1 or 2 Children | 0 (0.0%) | 24 (54.5%) |
| 3 or 4 Children | 0 (0.0%) | 0 (0.0%) |
| 5 or more Children | 0 (0.0%) | 0 (0.0%) |
| Total | 6 (3.1%) | 24 (42.9%) |
Race in Colebrook
The most populous races in Colebrook are White / Caucasian (1,075 | 97.7%), Two or more Races (23 | 2.1%), and Hispanic or Latino (5 | 0.4%).
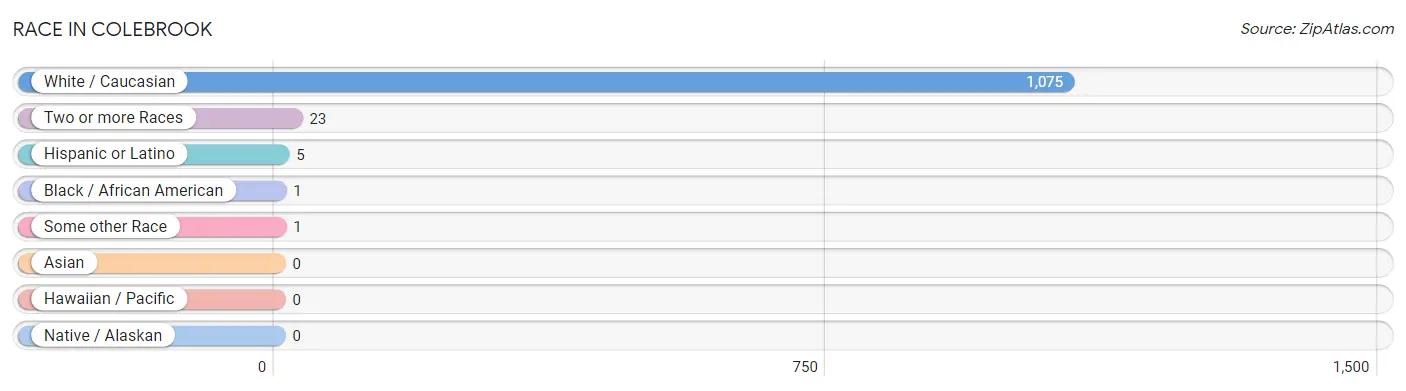
| Race | # Population | % Population |
| Asian | 0 | 0.0% |
| Black / African American | 1 | 0.1% |
| Hawaiian / Pacific | 0 | 0.0% |
| Hispanic or Latino | 5 | 0.4% |
| Native / Alaskan | 0 | 0.0% |
| White / Caucasian | 1,075 | 97.7% |
| Two or more Races | 23 | 2.1% |
| Some other Race | 1 | 0.1% |
| Total | 1,100 | 100.0% |
Ancestry in Colebrook
The most populous ancestries reported in Colebrook are Irish (165 | 15.0%), English (132 | 12.0%), French (112 | 10.2%), French Canadian (98 | 8.9%), and American (79 | 7.2%), together accounting for 53.3% of all Colebrook residents.
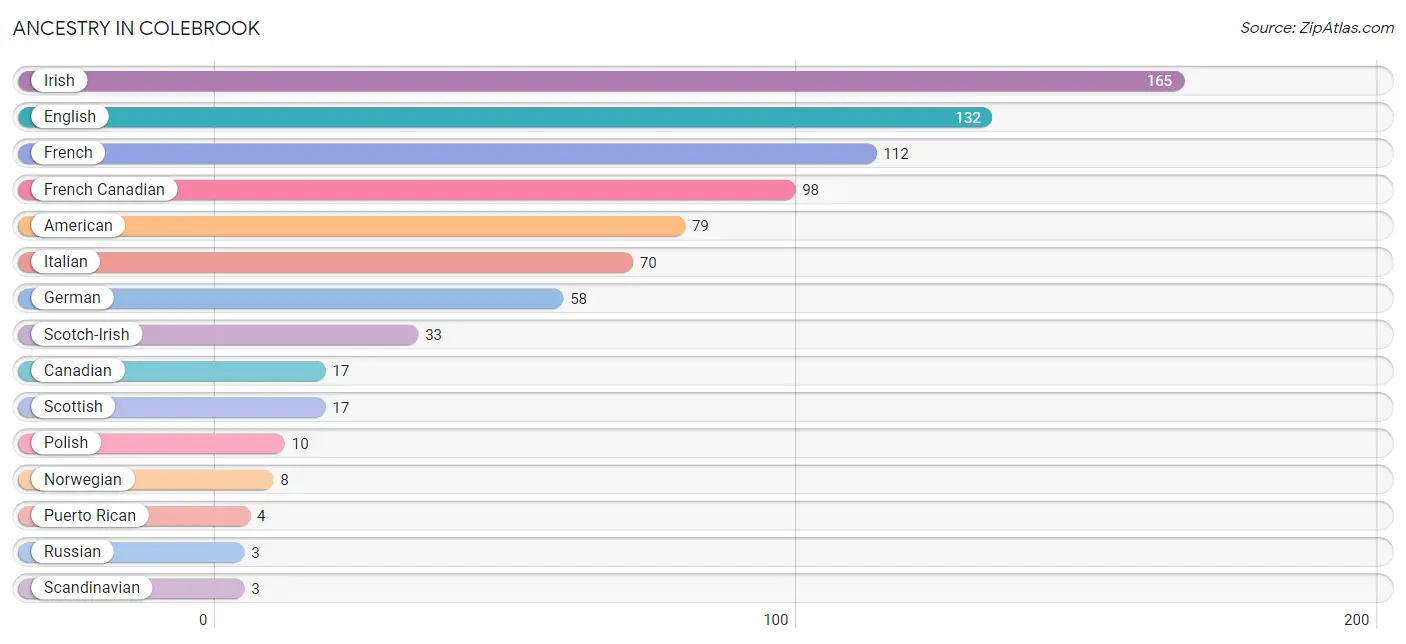
| Ancestry | # Population | % Population |
| American | 79 | 7.2% |
| Canadian | 17 | 1.5% |
| English | 132 | 12.0% |
| French | 112 | 10.2% |
| French Canadian | 98 | 8.9% |
| German | 58 | 5.3% |
| Irish | 165 | 15.0% |
| Italian | 70 | 6.4% |
| Mexican | 1 | 0.1% |
| Norwegian | 8 | 0.7% |
| Polish | 10 | 0.9% |
| Puerto Rican | 4 | 0.4% |
| Russian | 3 | 0.3% |
| Scandinavian | 3 | 0.3% |
| Scotch-Irish | 33 | 3.0% |
| Scottish | 17 | 1.5% |
| Welsh | 2 | 0.2% | View All 17 Rows |
Immigrants in Colebrook
The most numerous immigrant groups reported in Colebrook came from , and Canada (21 | 1.9%), together accounting for 1.9% of all Colebrook residents.

| Immigration Origin | # Population | % Population |
| Canada | 21 | 1.9% | View All 1 Rows |
Sex and Age in Colebrook
Sex and Age in Colebrook
The most populous age groups in Colebrook are 45 to 49 Years (89 | 15.7%) for men and 60 to 64 Years (84 | 15.7%) for women.
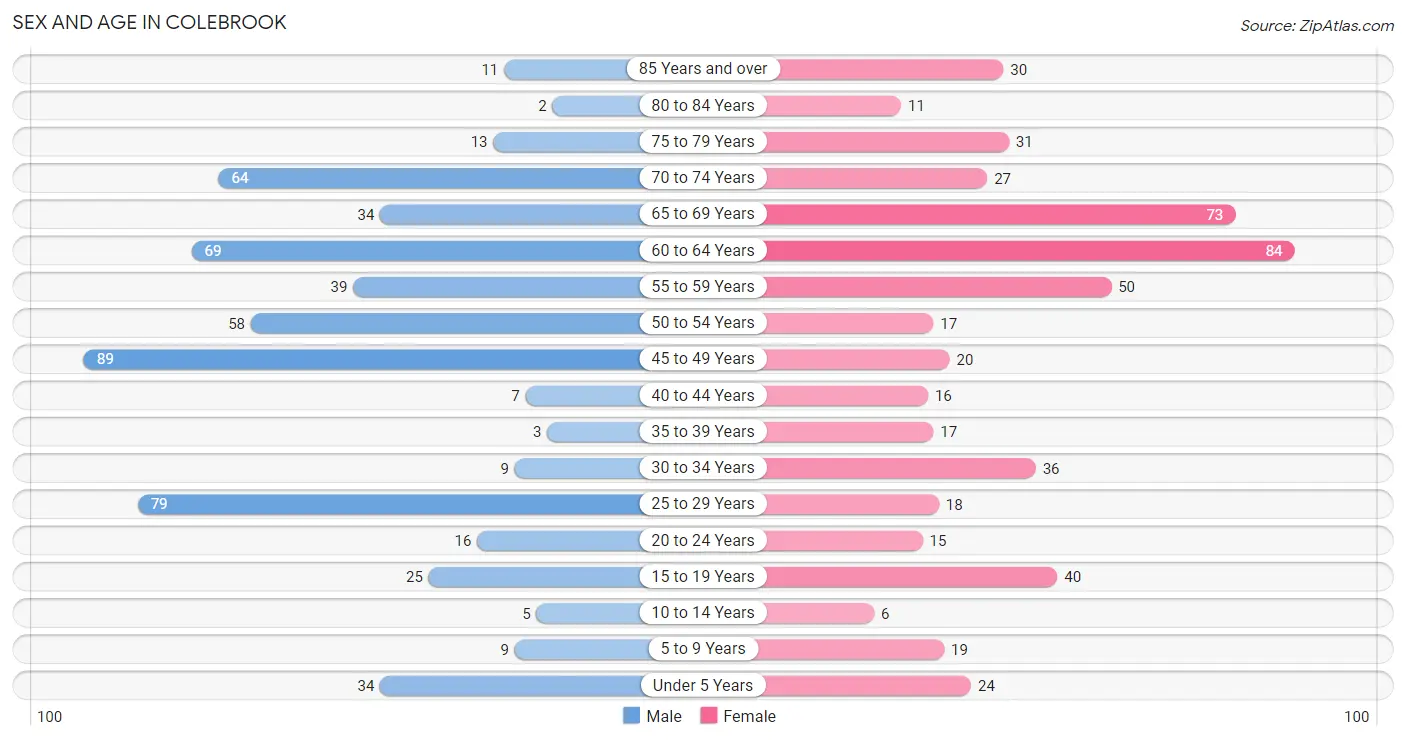
| Age Bracket | Male | Female |
| Under 5 Years | 34 (6.0%) | 24 (4.5%) |
| 5 to 9 Years | 9 (1.6%) | 19 (3.6%) |
| 10 to 14 Years | 5 (0.9%) | 6 (1.1%) |
| 15 to 19 Years | 25 (4.4%) | 40 (7.5%) |
| 20 to 24 Years | 16 (2.8%) | 15 (2.8%) |
| 25 to 29 Years | 79 (14.0%) | 18 (3.4%) |
| 30 to 34 Years | 9 (1.6%) | 36 (6.7%) |
| 35 to 39 Years | 3 (0.5%) | 17 (3.2%) |
| 40 to 44 Years | 7 (1.2%) | 16 (3.0%) |
| 45 to 49 Years | 89 (15.7%) | 20 (3.7%) |
| 50 to 54 Years | 58 (10.2%) | 17 (3.2%) |
| 55 to 59 Years | 39 (6.9%) | 50 (9.4%) |
| 60 to 64 Years | 69 (12.2%) | 84 (15.7%) |
| 65 to 69 Years | 34 (6.0%) | 73 (13.7%) |
| 70 to 74 Years | 64 (11.3%) | 27 (5.1%) |
| 75 to 79 Years | 13 (2.3%) | 31 (5.8%) |
| 80 to 84 Years | 2 (0.4%) | 11 (2.1%) |
| 85 Years and over | 11 (1.9%) | 30 (5.6%) |
| Total | 566 (100.0%) | 534 (100.0%) |
Families and Households in Colebrook
Median Family Size in Colebrook
The median family size in Colebrook is 2.61 persons per family, with single male/father families (14 | 5.6%) accounting for the largest median family size of 2.93 persons per family. On the other hand, single female/mother families (42 | 16.9%) represent the smallest median family size with 2.29 persons per family.
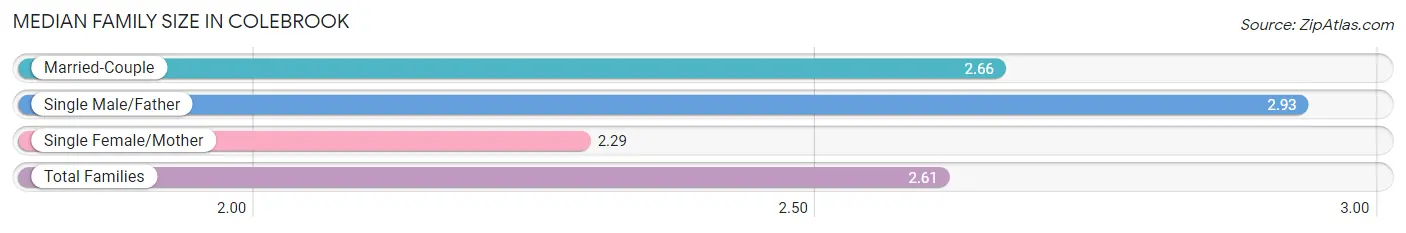
| Family Type | # Families | Family Size |
| Married-Couple | 193 (77.5%) | 2.66 |
| Single Male/Father | 14 (5.6%) | 2.93 |
| Single Female/Mother | 42 (16.9%) | 2.29 |
| Total Families | 249 (100.0%) | 2.61 |
Median Household Size in Colebrook
The median household size in Colebrook is 1.92 persons per household, with single male/father households (14 | 2.5%) accounting for the largest median household size of 2.93 persons per household. non-family households (319 | 56.2%) represent the smallest median household size with 1.19 persons per household.
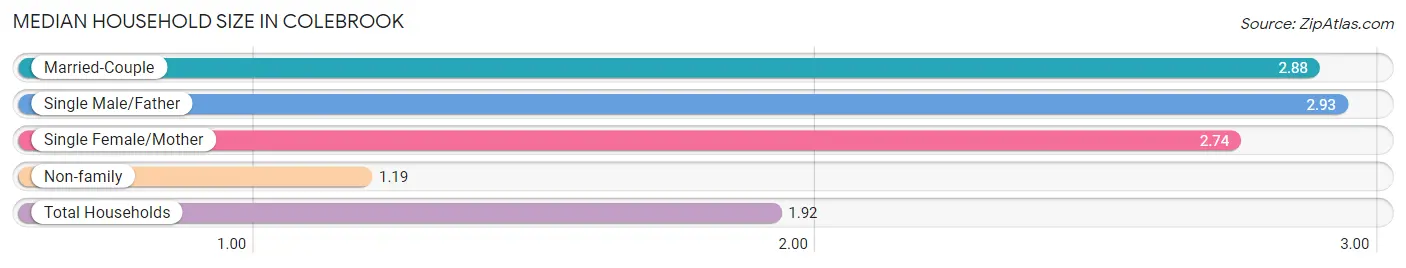
| Household Type | # Households | Household Size |
| Married-Couple | 193 (34.0%) | 2.88 |
| Single Male/Father | 14 (2.5%) | 2.93 |
| Single Female/Mother | 42 (7.4%) | 2.74 |
| Non-family | 319 (56.2%) | 1.19 |
| Total Households | 568 (100.0%) | 1.92 |
Household Size by Marriage Status in Colebrook
Out of a total of 568 households in Colebrook, 249 (43.8%) are family households, while 319 (56.2%) are nonfamily households. The most numerous type of family households are 2-person households, comprising 118, and the most common type of nonfamily households are 1-person households, comprising 238.
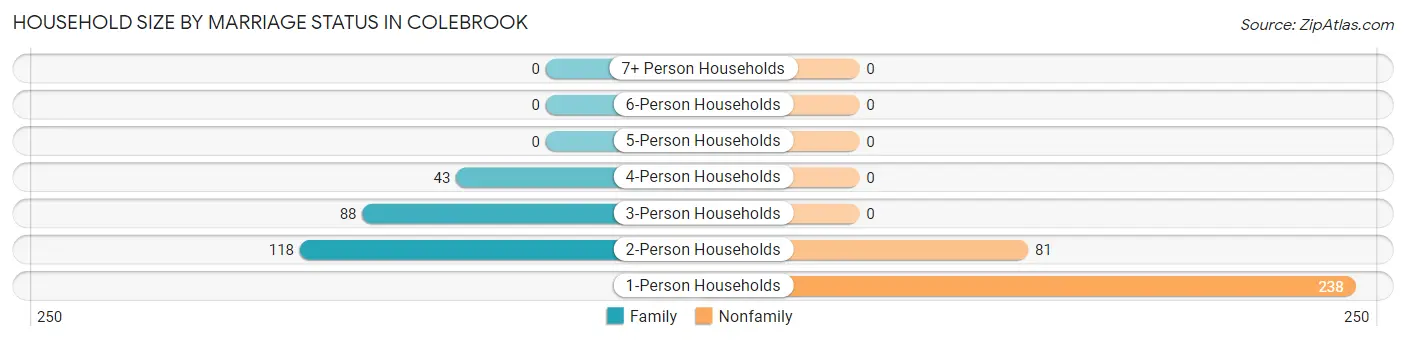
| Household Size | Family Households | Nonfamily Households |
| 1-Person Households | - | 238 (41.9%) |
| 2-Person Households | 118 (20.8%) | 81 (14.3%) |
| 3-Person Households | 88 (15.5%) | 0 (0.0%) |
| 4-Person Households | 43 (7.6%) | 0 (0.0%) |
| 5-Person Households | 0 (0.0%) | 0 (0.0%) |
| 6-Person Households | 0 (0.0%) | 0 (0.0%) |
| 7+ Person Households | 0 (0.0%) | 0 (0.0%) |
| Total | 249 (43.8%) | 319 (56.2%) |
Female Fertility in Colebrook
Fertility by Age in Colebrook
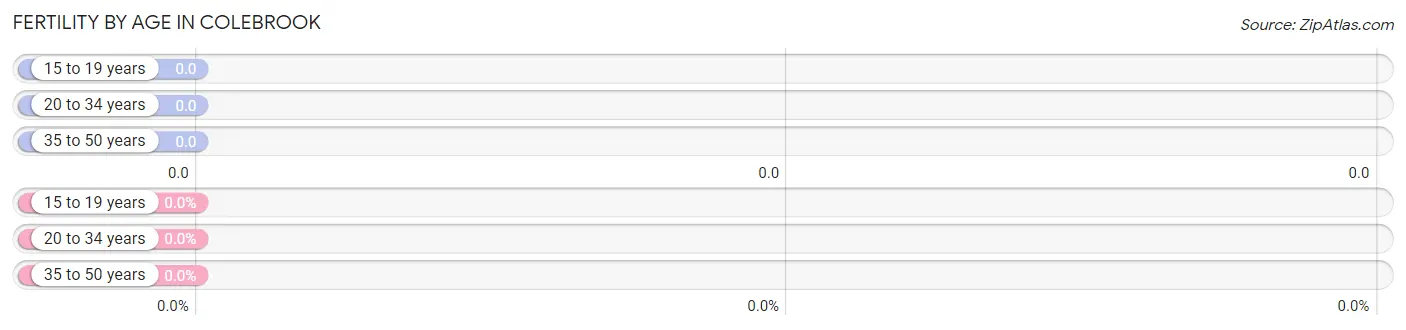
| Age Bracket | Women with Births | Births / 1,000 Women |
| 15 to 19 years | 0 (0.0%) | 0.0 |
| 20 to 34 years | 0 (0.0%) | 0.0 |
| 35 to 50 years | 0 (0.0%) | 0.0 |
| Total | 0 (0.0%) | 0.0 |
Fertility by Age by Marriage Status in Colebrook
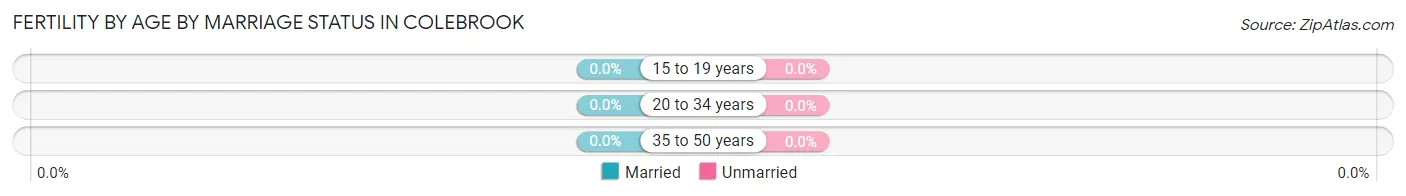
| Age Bracket | Married | Unmarried |
| 15 to 19 years | 0 (0.0%) | 0 (0.0%) |
| 20 to 34 years | 0 (0.0%) | 0 (0.0%) |
| 35 to 50 years | 0 (0.0%) | 0 (0.0%) |
| Total | 0 (0.0%) | 0 (0.0%) |
Fertility by Education in Colebrook
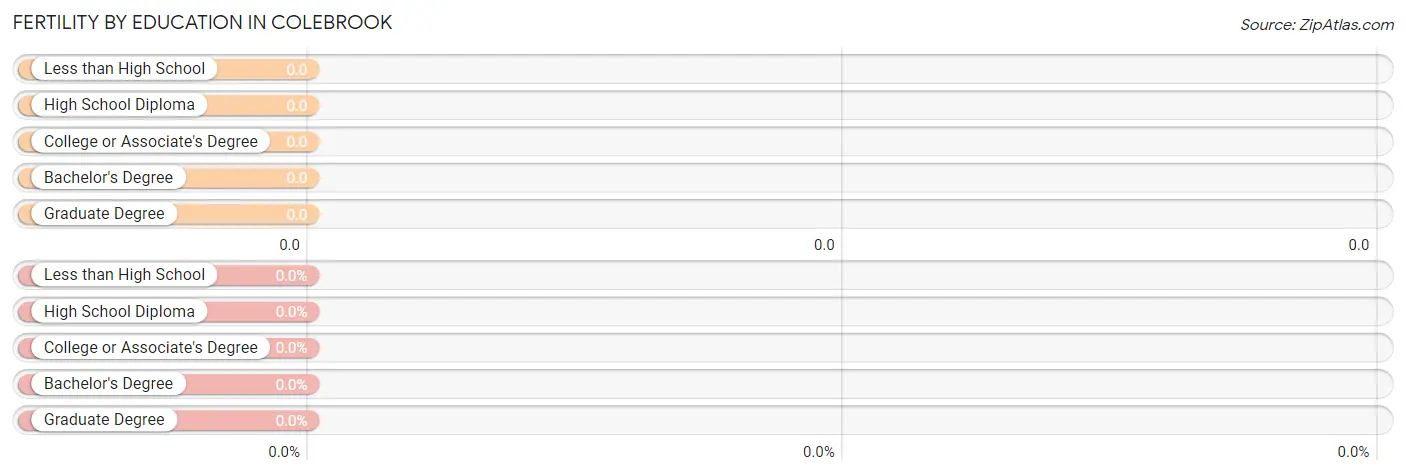
| Educational Attainment | Women with Births | Births / 1,000 Women |
| Less than High School | 0 (0.0%) | 0.0 |
| High School Diploma | 0 (0.0%) | 0.0 |
| College or Associate's Degree | 0 (0.0%) | 0.0 |
| Bachelor's Degree | 0 (0.0%) | 0.0 |
| Graduate Degree | 0 (0.0%) | 0.0 |
| Total | 0 (0.0%) | 0.0 |
Fertility by Education by Marriage Status in Colebrook
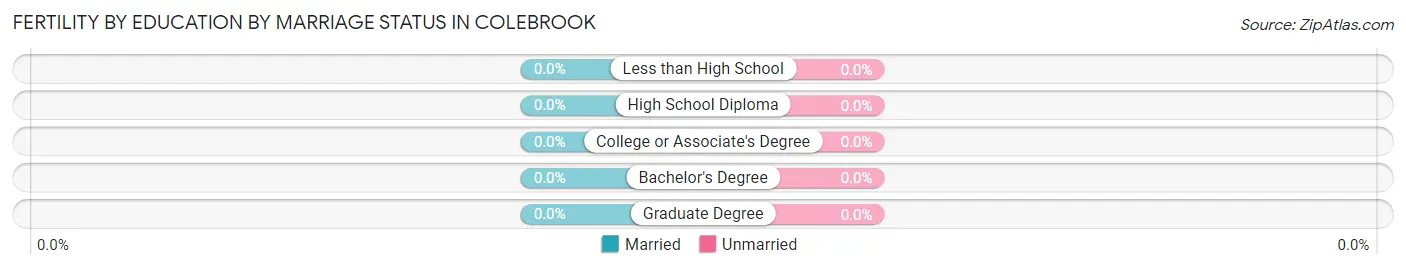
| Educational Attainment | Married | Unmarried |
| Less than High School | 0 (0.0%) | 0 (0.0%) |
| High School Diploma | 0 (0.0%) | 0 (0.0%) |
| College or Associate's Degree | 0 (0.0%) | 0 (0.0%) |
| Bachelor's Degree | 0 (0.0%) | 0 (0.0%) |
| Graduate Degree | 0 (0.0%) | 0 (0.0%) |
| Total | 0 (0.0%) | 0 (0.0%) |
Employment Characteristics in Colebrook
Employment by Class of Employer in Colebrook
Among the 490 employed individuals in Colebrook, private company employees (326 | 66.5%), not-for-profit organizations (56 | 11.4%), and self-employed (not incorporated) (51 | 10.4%) make up the most common classes of employment.
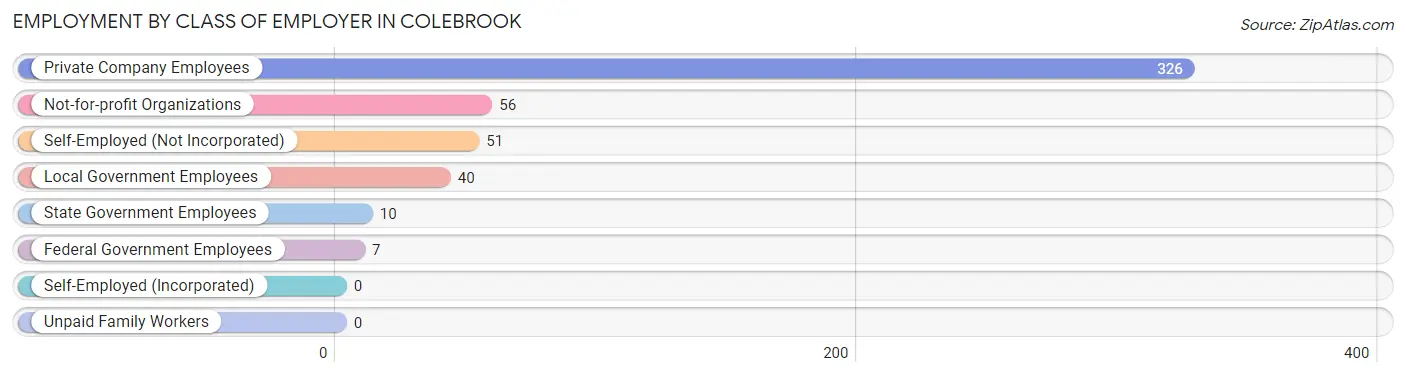
| Employer Class | # Employees | % Employees |
| Private Company Employees | 326 | 66.5% |
| Self-Employed (Incorporated) | 0 | 0.0% |
| Self-Employed (Not Incorporated) | 51 | 10.4% |
| Not-for-profit Organizations | 56 | 11.4% |
| Local Government Employees | 40 | 8.2% |
| State Government Employees | 10 | 2.0% |
| Federal Government Employees | 7 | 1.4% |
| Unpaid Family Workers | 0 | 0.0% |
| Total | 490 | 100.0% |
Employment Status by Age in Colebrook
According to the labor force statistics for Colebrook, out of the total population over 16 years of age (984), 49.9% or 491 individuals are in the labor force, with 0.2% or 1 of them unemployed. The age group with the highest labor force participation rate is 35 to 44 years, with 100.0% or 43 individuals in the labor force. Within the labor force, the 35 to 44 years age range has the highest percentage of unemployed individuals, with 2.3% or 1 of them being unemployed.
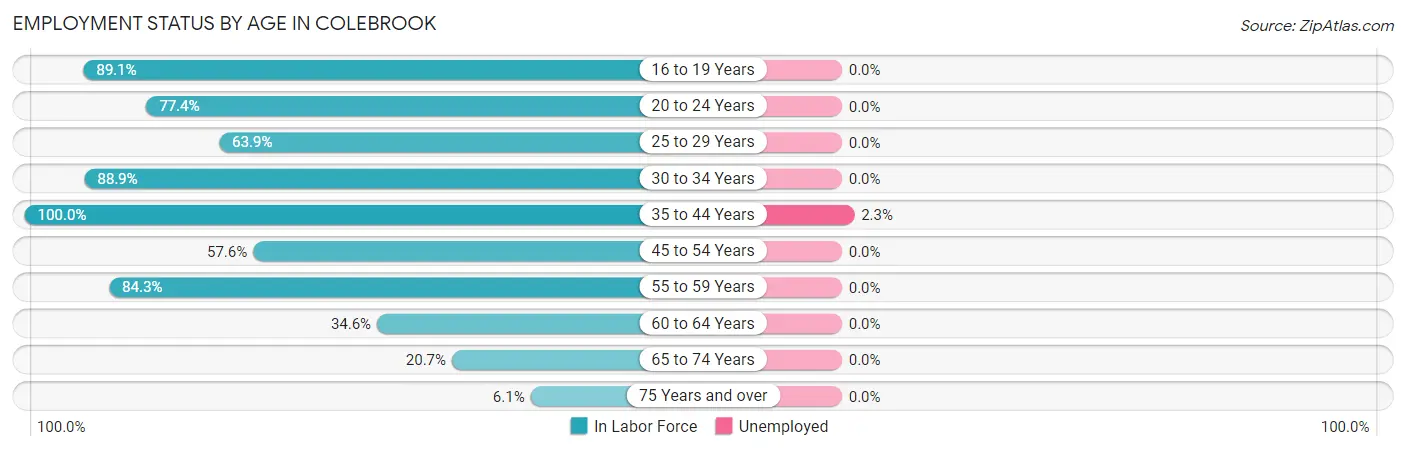
| Age Bracket | In Labor Force | Unemployed |
| 16 to 19 Years | 41 (89.1%) | 0 (0.0%) |
| 20 to 24 Years | 24 (77.4%) | 0 (0.0%) |
| 25 to 29 Years | 62 (63.9%) | 0 (0.0%) |
| 30 to 34 Years | 40 (88.9%) | 0 (0.0%) |
| 35 to 44 Years | 43 (100.0%) | 1 (2.3%) |
| 45 to 54 Years | 106 (57.6%) | 0 (0.0%) |
| 55 to 59 Years | 75 (84.3%) | 0 (0.0%) |
| 60 to 64 Years | 53 (34.6%) | 0 (0.0%) |
| 65 to 74 Years | 41 (20.7%) | 0 (0.0%) |
| 75 Years and over | 6 (6.1%) | 0 (0.0%) |
| Total | 491 (49.9%) | 1 (0.2%) |
Employment Status by Educational Attainment in Colebrook
According to labor force statistics for Colebrook, 62.0% of individuals (379) out of the total population between 25 and 64 years of age (611) are in the labor force, with 0.3% or 1 of them being unemployed. The group with the highest labor force participation rate are those with the educational attainment of bachelor's degree or higher, with 100.0% or 60 individuals in the labor force. Within the labor force, individuals with college / associate degree education have the highest percentage of unemployment, with 0.9% or 1 of them being unemployed.
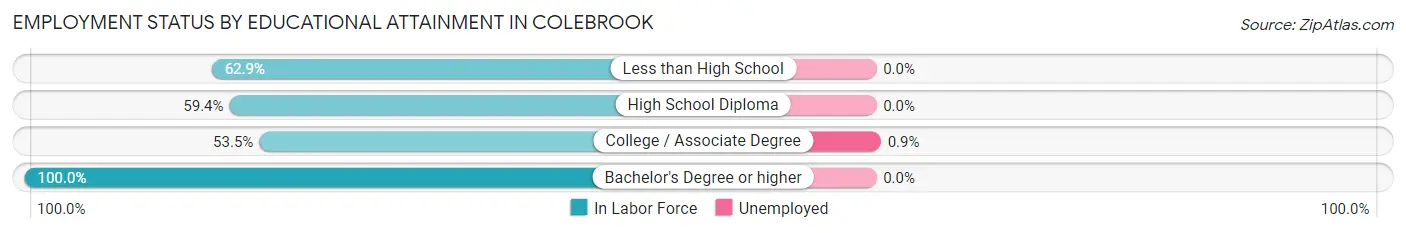
| Educational Attainment | In Labor Force | Unemployed |
| Less than High School | 61 (62.9%) | 0 (0.0%) |
| High School Diploma | 152 (59.4%) | 0 (0.0%) |
| College / Associate Degree | 106 (53.5%) | 2 (0.9%) |
| Bachelor's Degree or higher | 60 (100.0%) | 0 (0.0%) |
| Total | 379 (62.0%) | 2 (0.3%) |
Employment Occupations by Sex in Colebrook
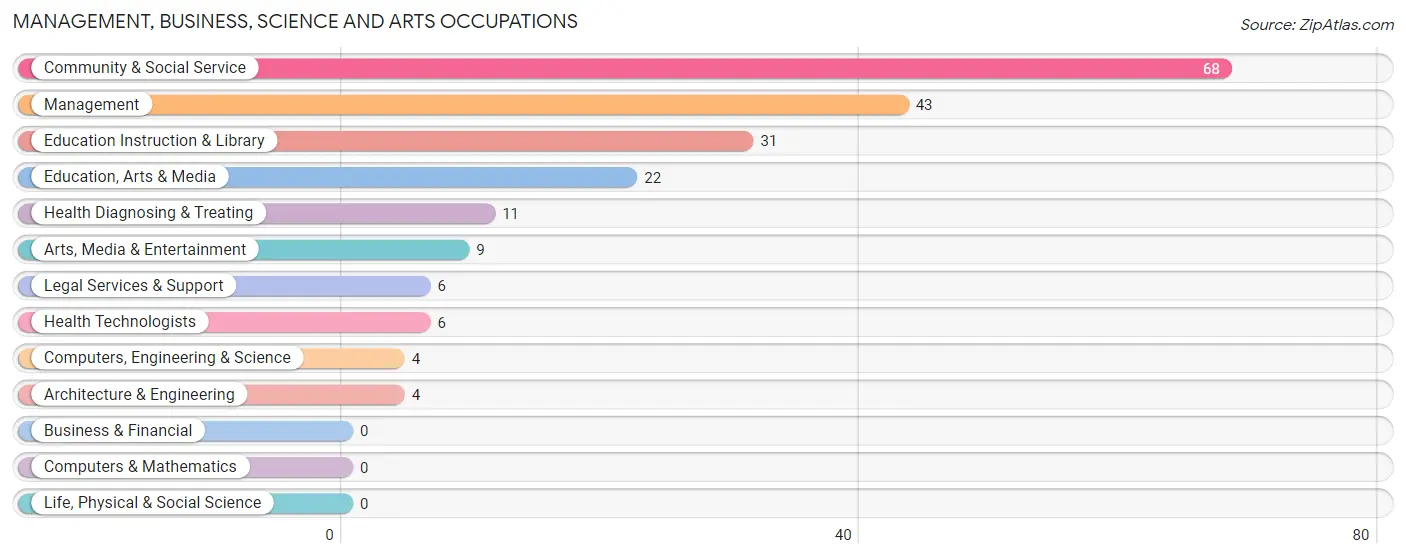
Management, Business, Science and Arts Occupations
The most common Management, Business, Science and Arts occupations in Colebrook are Community & Social Service (68 | 13.9%), Management (43 | 8.8%), Education Instruction & Library (31 | 6.3%), Education, Arts & Media (22 | 4.5%), and Health Diagnosing & Treating (11 | 2.2%).
Management, Business, Science and Arts Occupations by Sex
Within the Management, Business, Science and Arts occupations in Colebrook, the most male-oriented occupations are Computers, Engineering & Science (100.0%), Architecture & Engineering (100.0%), and Legal Services & Support (100.0%), while the most female-oriented occupations are Arts, Media & Entertainment (100.0%), Health Diagnosing & Treating (100.0%), and Health Technologists (100.0%).
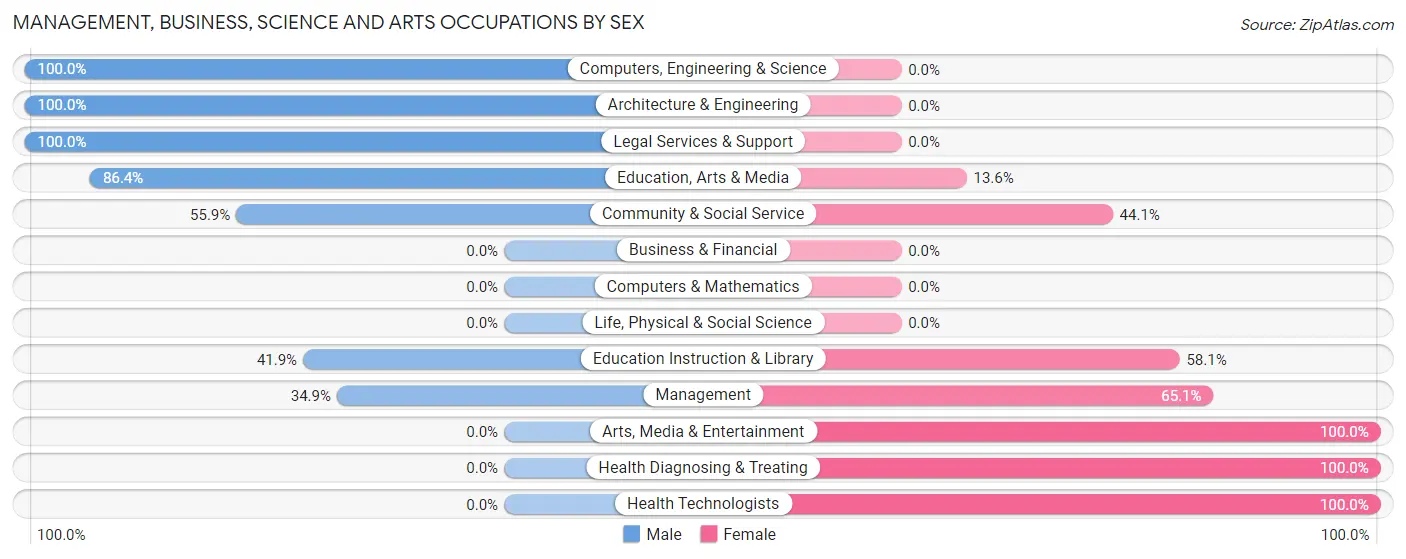
| Occupation | Male | Female |
| Management | 15 (34.9%) | 28 (65.1%) |
| Business & Financial | 0 (0.0%) | 0 (0.0%) |
| Computers, Engineering & Science | 4 (100.0%) | 0 (0.0%) |
| Computers & Mathematics | 0 (0.0%) | 0 (0.0%) |
| Architecture & Engineering | 4 (100.0%) | 0 (0.0%) |
| Life, Physical & Social Science | 0 (0.0%) | 0 (0.0%) |
| Community & Social Service | 38 (55.9%) | 30 (44.1%) |
| Education, Arts & Media | 19 (86.4%) | 3 (13.6%) |
| Legal Services & Support | 6 (100.0%) | 0 (0.0%) |
| Education Instruction & Library | 13 (41.9%) | 18 (58.1%) |
| Arts, Media & Entertainment | 0 (0.0%) | 9 (100.0%) |
| Health Diagnosing & Treating | 0 (0.0%) | 11 (100.0%) |
| Health Technologists | 0 (0.0%) | 6 (100.0%) |
| Total (Category) | 57 (45.2%) | 69 (54.8%) |
| Total (Overall) | 242 (49.4%) | 248 (50.6%) |
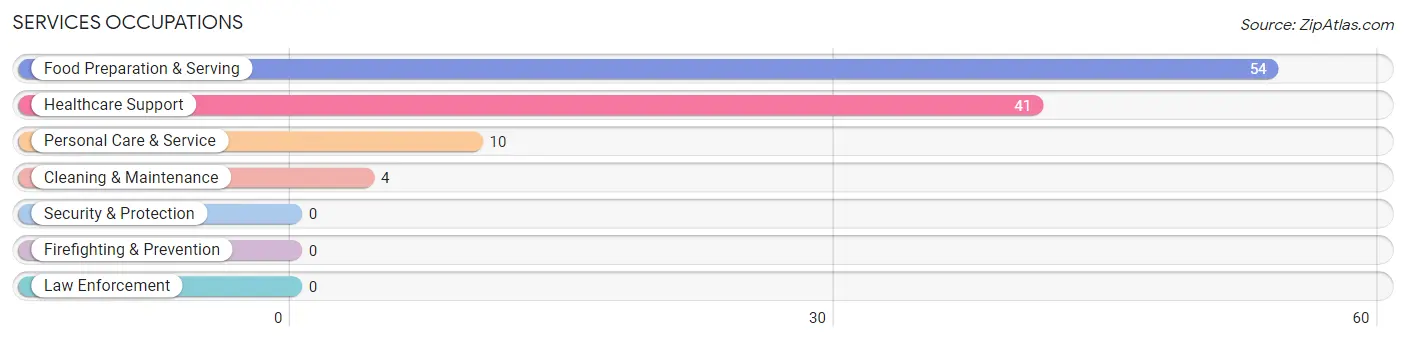
Services Occupations
The most common Services occupations in Colebrook are Food Preparation & Serving (54 | 11.0%), Healthcare Support (41 | 8.4%), Personal Care & Service (10 | 2.0%), and Cleaning & Maintenance (4 | 0.8%).
Services Occupations by Sex
Within the Services occupations in Colebrook, the most male-oriented occupations are Personal Care & Service (100.0%), Food Preparation & Serving (22.2%), and Healthcare Support (19.5%), while the most female-oriented occupations are Cleaning & Maintenance (100.0%), Healthcare Support (80.5%), and Food Preparation & Serving (77.8%).
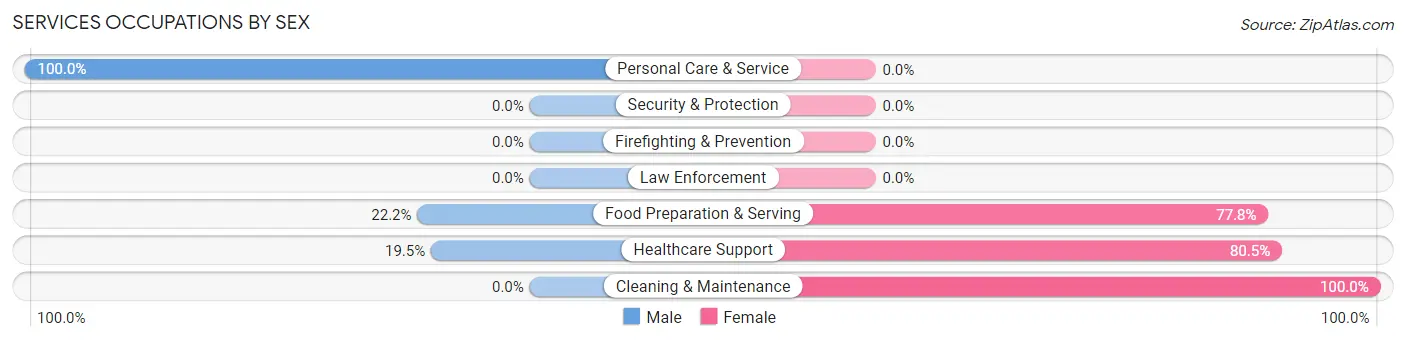
| Occupation | Male | Female |
| Healthcare Support | 8 (19.5%) | 33 (80.5%) |
| Security & Protection | 0 (0.0%) | 0 (0.0%) |
| Firefighting & Prevention | 0 (0.0%) | 0 (0.0%) |
| Law Enforcement | 0 (0.0%) | 0 (0.0%) |
| Food Preparation & Serving | 12 (22.2%) | 42 (77.8%) |
| Cleaning & Maintenance | 0 (0.0%) | 4 (100.0%) |
| Personal Care & Service | 10 (100.0%) | 0 (0.0%) |
| Total (Category) | 30 (27.5%) | 79 (72.5%) |
| Total (Overall) | 242 (49.4%) | 248 (50.6%) |
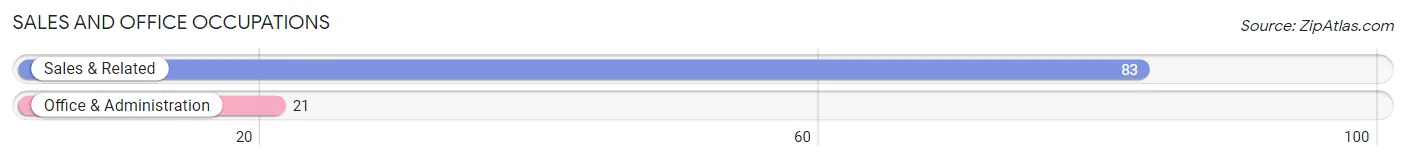
Sales and Office Occupations
The most common Sales and Office occupations in Colebrook are Sales & Related (83 | 16.9%), and Office & Administration (21 | 4.3%).
Sales and Office Occupations by Sex
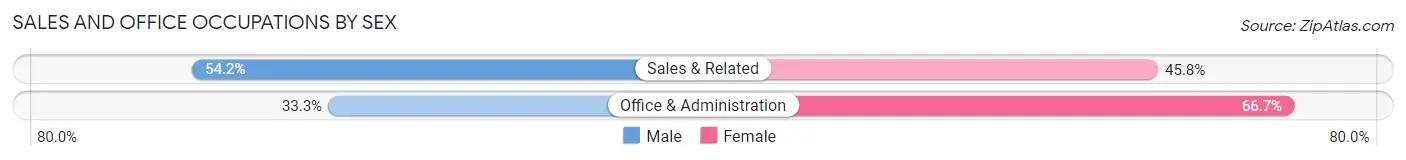
| Occupation | Male | Female |
| Sales & Related | 45 (54.2%) | 38 (45.8%) |
| Office & Administration | 7 (33.3%) | 14 (66.7%) |
| Total (Category) | 52 (50.0%) | 52 (50.0%) |
| Total (Overall) | 242 (49.4%) | 248 (50.6%) |
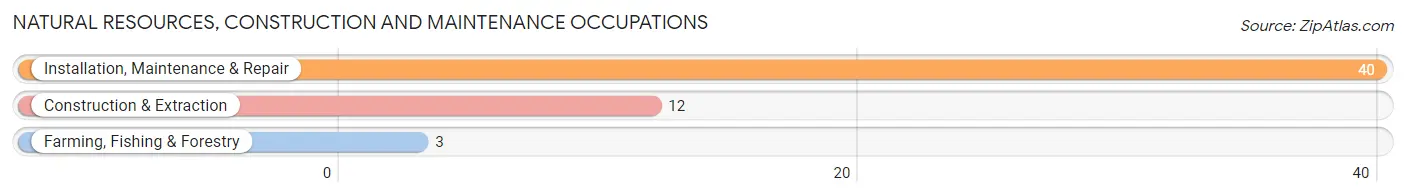
Natural Resources, Construction and Maintenance Occupations
The most common Natural Resources, Construction and Maintenance occupations in Colebrook are Installation, Maintenance & Repair (40 | 8.2%), Construction & Extraction (12 | 2.5%), and Farming, Fishing & Forestry (3 | 0.6%).
Natural Resources, Construction and Maintenance Occupations by Sex
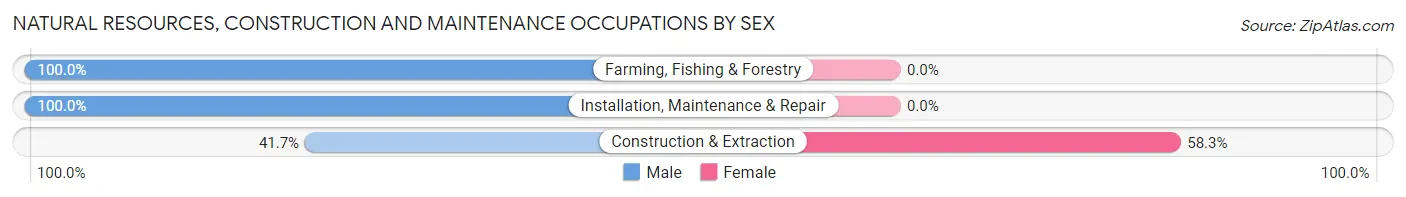
| Occupation | Male | Female |
| Farming, Fishing & Forestry | 3 (100.0%) | 0 (0.0%) |
| Construction & Extraction | 5 (41.7%) | 7 (58.3%) |
| Installation, Maintenance & Repair | 40 (100.0%) | 0 (0.0%) |
| Total (Category) | 48 (87.3%) | 7 (12.7%) |
| Total (Overall) | 242 (49.4%) | 248 (50.6%) |
Production, Transportation and Moving Occupations
The most common Production, Transportation and Moving occupations in Colebrook are Production (52 | 10.6%), Material Moving (26 | 5.3%), and Transportation (18 | 3.7%).
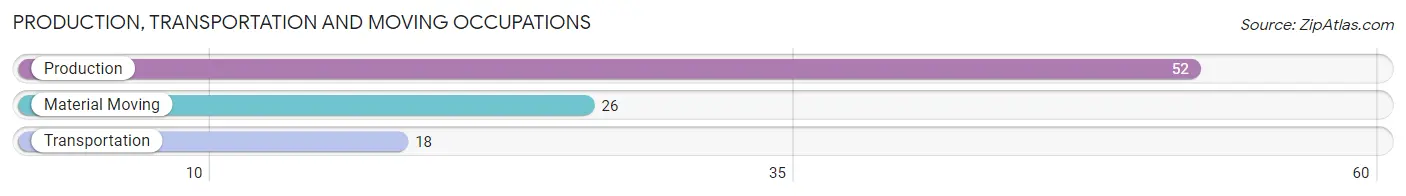
Production, Transportation and Moving Occupations by Sex
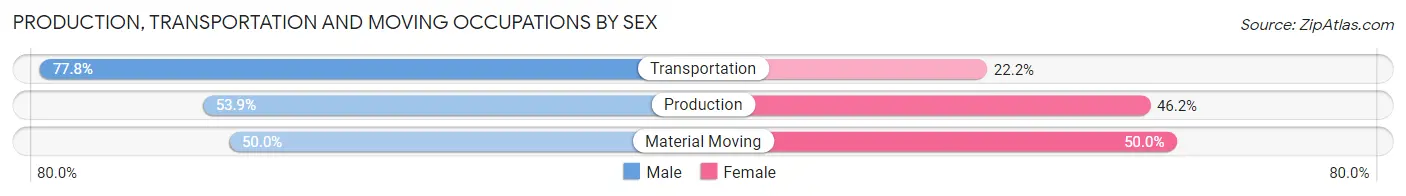
| Occupation | Male | Female |
| Production | 28 (53.8%) | 24 (46.2%) |
| Transportation | 14 (77.8%) | 4 (22.2%) |
| Material Moving | 13 (50.0%) | 13 (50.0%) |
| Total (Category) | 55 (57.3%) | 41 (42.7%) |
| Total (Overall) | 242 (49.4%) | 248 (50.6%) |
Employment Industries by Sex in Colebrook
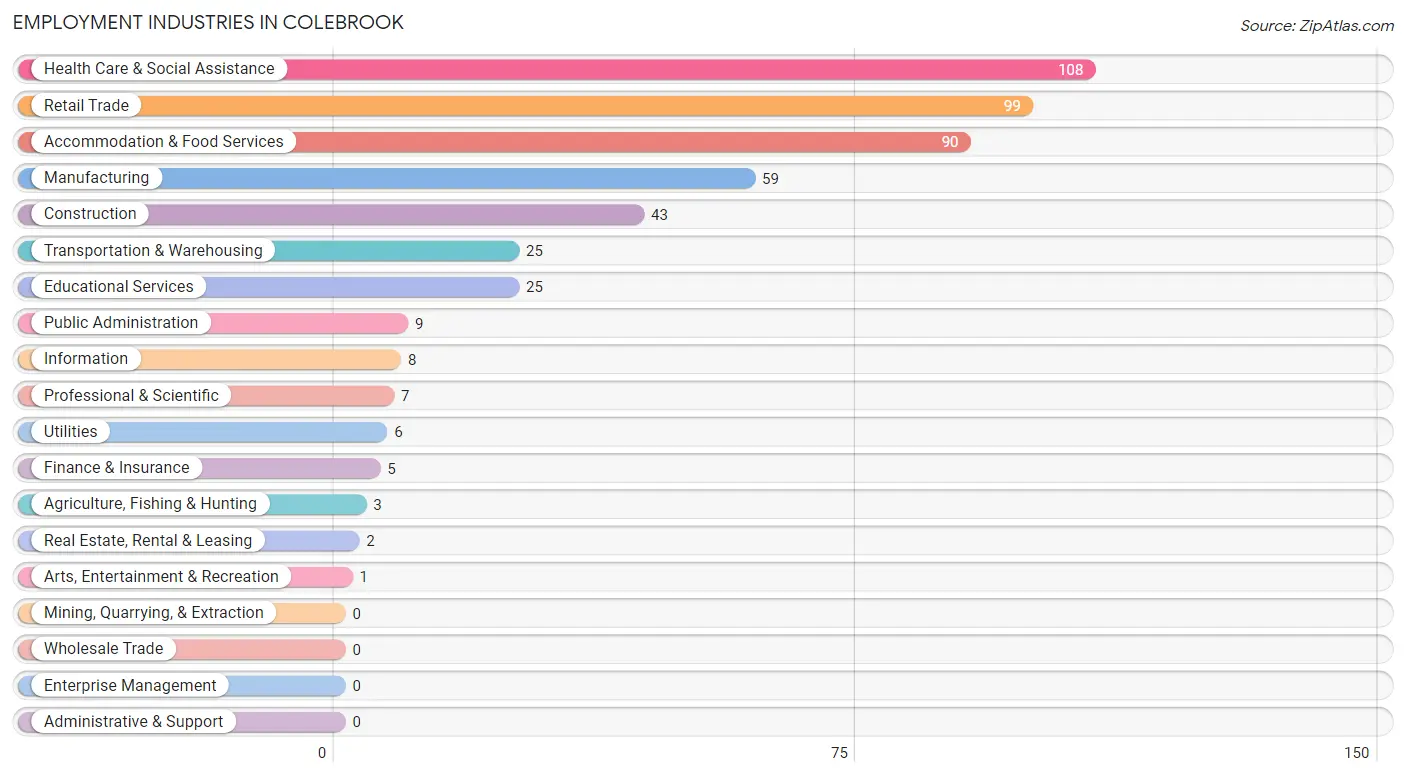
Employment Industries in Colebrook
The major employment industries in Colebrook include Health Care & Social Assistance (108 | 22.0%), Retail Trade (99 | 20.2%), Accommodation & Food Services (90 | 18.4%), Manufacturing (59 | 12.0%), and Construction (43 | 8.8%).
Employment Industries by Sex in Colebrook
The Colebrook industries that see more men than women are Agriculture, Fishing & Hunting (100.0%), Utilities (100.0%), and Real Estate, Rental & Leasing (100.0%), whereas the industries that tend to have a higher number of women are Information (100.0%), Finance & Insurance (100.0%), and Arts, Entertainment & Recreation (100.0%).
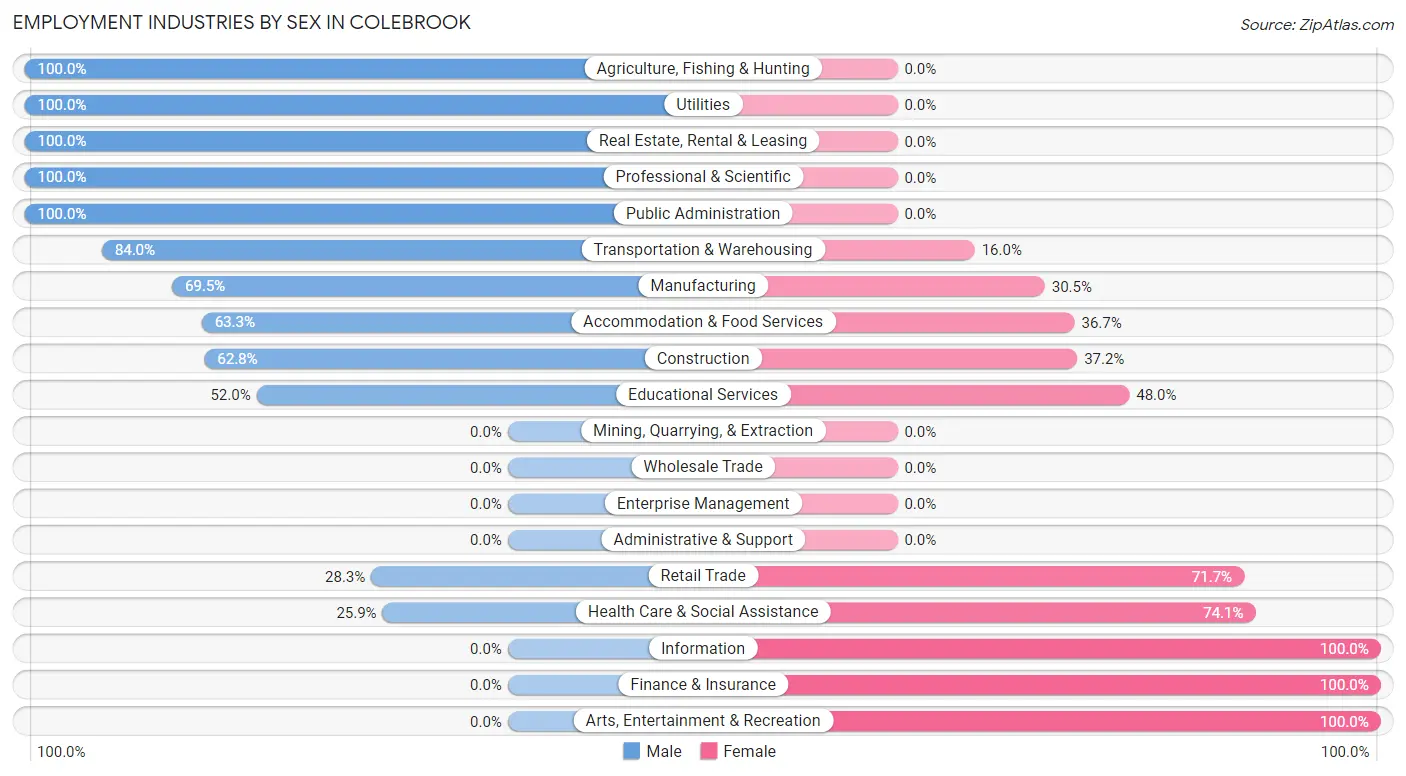
| Industry | Male | Female |
| Agriculture, Fishing & Hunting | 3 (100.0%) | 0 (0.0%) |
| Mining, Quarrying, & Extraction | 0 (0.0%) | 0 (0.0%) |
| Construction | 27 (62.8%) | 16 (37.2%) |
| Manufacturing | 41 (69.5%) | 18 (30.5%) |
| Wholesale Trade | 0 (0.0%) | 0 (0.0%) |
| Retail Trade | 28 (28.3%) | 71 (71.7%) |
| Transportation & Warehousing | 21 (84.0%) | 4 (16.0%) |
| Utilities | 6 (100.0%) | 0 (0.0%) |
| Information | 0 (0.0%) | 8 (100.0%) |
| Finance & Insurance | 0 (0.0%) | 5 (100.0%) |
| Real Estate, Rental & Leasing | 2 (100.0%) | 0 (0.0%) |
| Professional & Scientific | 7 (100.0%) | 0 (0.0%) |
| Enterprise Management | 0 (0.0%) | 0 (0.0%) |
| Administrative & Support | 0 (0.0%) | 0 (0.0%) |
| Educational Services | 13 (52.0%) | 12 (48.0%) |
| Health Care & Social Assistance | 28 (25.9%) | 80 (74.1%) |
| Arts, Entertainment & Recreation | 0 (0.0%) | 1 (100.0%) |
| Accommodation & Food Services | 57 (63.3%) | 33 (36.7%) |
| Public Administration | 9 (100.0%) | 0 (0.0%) |
| Total | 242 (49.4%) | 248 (50.6%) |
Education in Colebrook
School Enrollment in Colebrook
The most common levels of schooling among the 113 students in Colebrook are middle school (29 | 25.7%), college / undergraduate (25 | 22.1%), and high school (18 | 15.9%).
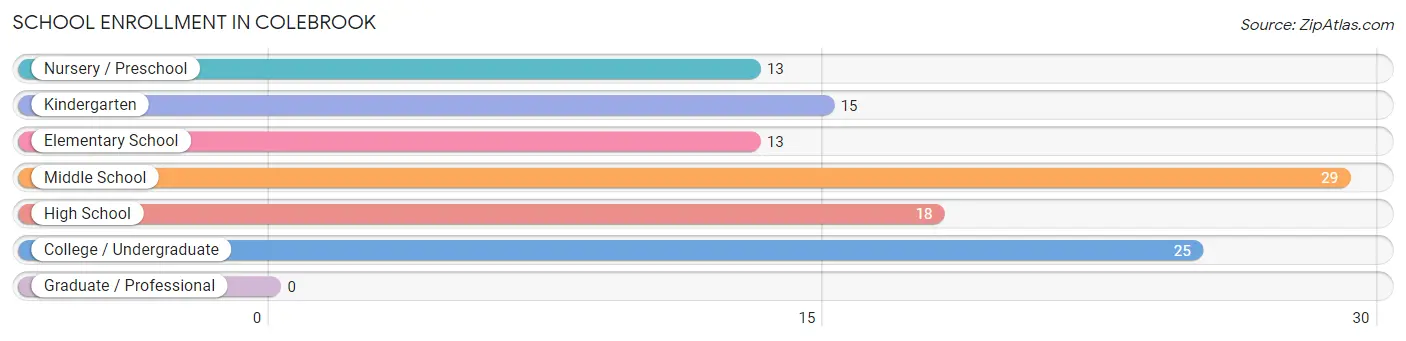
| School Level | # Students | % Students |
| Nursery / Preschool | 13 | 11.5% |
| Kindergarten | 15 | 13.3% |
| Elementary School | 13 | 11.5% |
| Middle School | 29 | 25.7% |
| High School | 18 | 15.9% |
| College / Undergraduate | 25 | 22.1% |
| Graduate / Professional | 0 | 0.0% |
| Total | 113 | 100.0% |
School Enrollment by Age by Funding Source in Colebrook
Out of a total of 113 students who are enrolled in schools in Colebrook, 15 (13.3%) attend a private institution, while the remaining 98 (86.7%) are enrolled in public schools. The age group of 10 to 14 year olds has the highest likelihood of being enrolled in private schools, with 10 (100.0% in the age bracket) enrolled. Conversely, the age group of 5 to 9 year old has the lowest likelihood of being enrolled in a private school, with 28 (100.0% in the age bracket) attending a public institution.
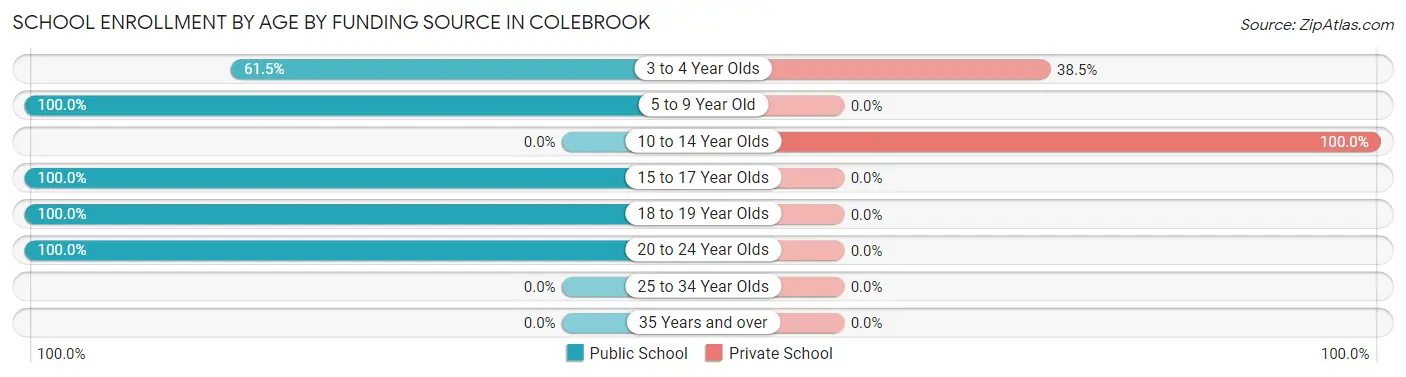
| Age Bracket | Public School | Private School |
| 3 to 4 Year Olds | 8 (61.5%) | 5 (38.5%) |
| 5 to 9 Year Old | 28 (100.0%) | 0 (0.0%) |
| 10 to 14 Year Olds | 0 (0.0%) | 10 (100.0%) |
| 15 to 17 Year Olds | 37 (100.0%) | 0 (0.0%) |
| 18 to 19 Year Olds | 1 (100.0%) | 0 (0.0%) |
| 20 to 24 Year Olds | 24 (100.0%) | 0 (0.0%) |
| 25 to 34 Year Olds | 0 (0.0%) | 0 (0.0%) |
| 35 Years and over | 0 (0.0%) | 0 (0.0%) |
| Total | 98 (86.7%) | 15 (13.3%) |
Educational Attainment by Field of Study in Colebrook
Social sciences (26 | 19.4%), arts & humanities (23 | 17.2%), bio, nature & agricultural (17 | 12.7%), education (16 | 11.9%), and science & technology (12 | 9.0%) are the most common fields of study among 134 individuals in Colebrook who have obtained a bachelor's degree or higher.
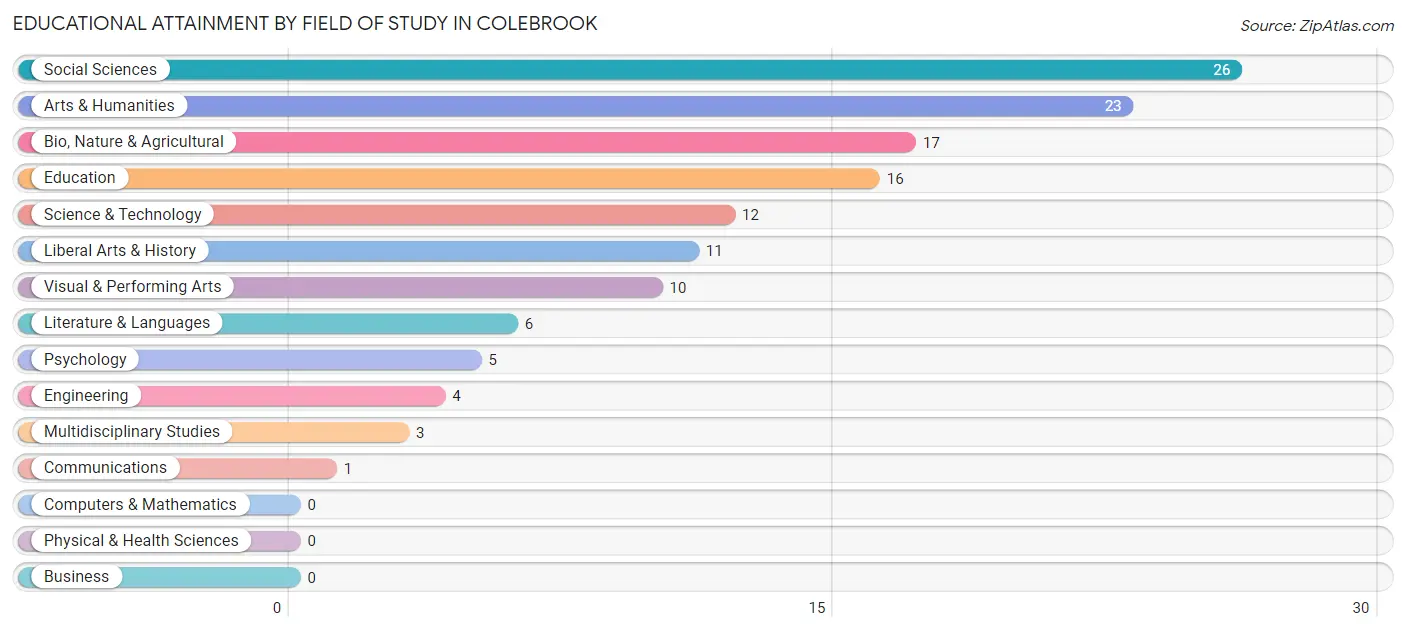
| Field of Study | # Graduates | % Graduates |
| Computers & Mathematics | 0 | 0.0% |
| Bio, Nature & Agricultural | 17 | 12.7% |
| Physical & Health Sciences | 0 | 0.0% |
| Psychology | 5 | 3.7% |
| Social Sciences | 26 | 19.4% |
| Engineering | 4 | 3.0% |
| Multidisciplinary Studies | 3 | 2.2% |
| Science & Technology | 12 | 9.0% |
| Business | 0 | 0.0% |
| Education | 16 | 11.9% |
| Literature & Languages | 6 | 4.5% |
| Liberal Arts & History | 11 | 8.2% |
| Visual & Performing Arts | 10 | 7.5% |
| Communications | 1 | 0.7% |
| Arts & Humanities | 23 | 17.2% |
| Total | 134 | 100.0% |
Transportation & Commute in Colebrook
Vehicle Availability by Sex in Colebrook
The most prevalent vehicle ownership categories in Colebrook are males with 2 vehicles (103, accounting for 42.6%) and females with 2 vehicles (106, making up 41.5%).
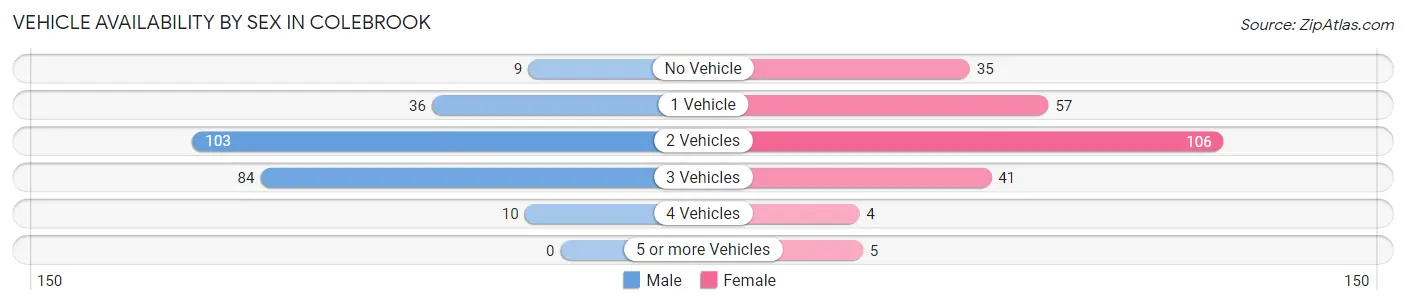
| Vehicles Available | Male | Female |
| No Vehicle | 9 (3.7%) | 35 (14.1%) |
| 1 Vehicle | 36 (14.9%) | 57 (23.0%) |
| 2 Vehicles | 103 (42.6%) | 106 (42.7%) |
| 3 Vehicles | 84 (34.7%) | 41 (16.5%) |
| 4 Vehicles | 10 (4.1%) | 4 (1.6%) |
| 5 or more Vehicles | 0 (0.0%) | 5 (2.0%) |
| Total | 242 (100.0%) | 248 (100.0%) |
Commute Time in Colebrook
The most frequently occuring commute durations in Colebrook are 5 to 9 minutes (212 commuters, 44.0%), less than 5 minutes (103 commuters, 21.4%), and 10 to 14 minutes (51 commuters, 10.6%).
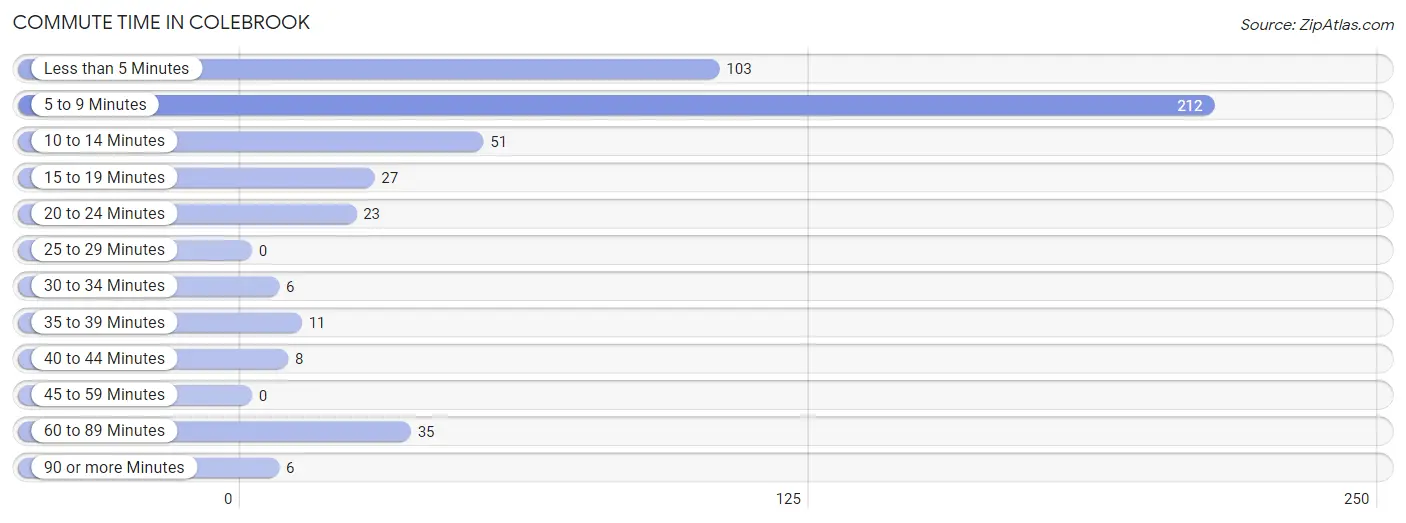
| Commute Time | # Commuters | % Commuters |
| Less than 5 Minutes | 103 | 21.4% |
| 5 to 9 Minutes | 212 | 44.0% |
| 10 to 14 Minutes | 51 | 10.6% |
| 15 to 19 Minutes | 27 | 5.6% |
| 20 to 24 Minutes | 23 | 4.8% |
| 25 to 29 Minutes | 0 | 0.0% |
| 30 to 34 Minutes | 6 | 1.2% |
| 35 to 39 Minutes | 11 | 2.3% |
| 40 to 44 Minutes | 8 | 1.7% |
| 45 to 59 Minutes | 0 | 0.0% |
| 60 to 89 Minutes | 35 | 7.3% |
| 90 or more Minutes | 6 | 1.2% |
Commute Time by Sex in Colebrook
The most common commute times in Colebrook are 5 to 9 minutes (87 commuters, 35.9%) for males and 5 to 9 minutes (125 commuters, 52.1%) for females.
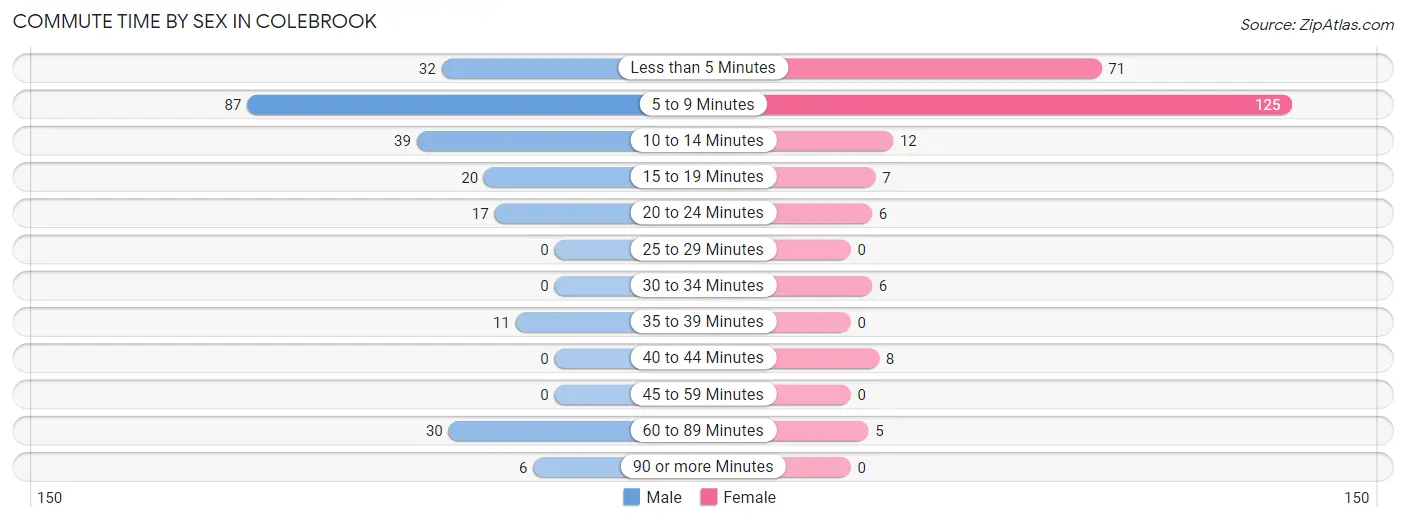
| Commute Time | Male | Female |
| Less than 5 Minutes | 32 (13.2%) | 71 (29.6%) |
| 5 to 9 Minutes | 87 (35.9%) | 125 (52.1%) |
| 10 to 14 Minutes | 39 (16.1%) | 12 (5.0%) |
| 15 to 19 Minutes | 20 (8.3%) | 7 (2.9%) |
| 20 to 24 Minutes | 17 (7.0%) | 6 (2.5%) |
| 25 to 29 Minutes | 0 (0.0%) | 0 (0.0%) |
| 30 to 34 Minutes | 0 (0.0%) | 6 (2.5%) |
| 35 to 39 Minutes | 11 (4.5%) | 0 (0.0%) |
| 40 to 44 Minutes | 0 (0.0%) | 8 (3.3%) |
| 45 to 59 Minutes | 0 (0.0%) | 0 (0.0%) |
| 60 to 89 Minutes | 30 (12.4%) | 5 (2.1%) |
| 90 or more Minutes | 6 (2.5%) | 0 (0.0%) |
Time of Departure to Work by Sex in Colebrook
The most frequent times of departure to work in Colebrook are 6:00 AM to 6:29 AM (53, 21.9%) for males and 12:00 PM to 3:59 PM (51, 21.2%) for females.
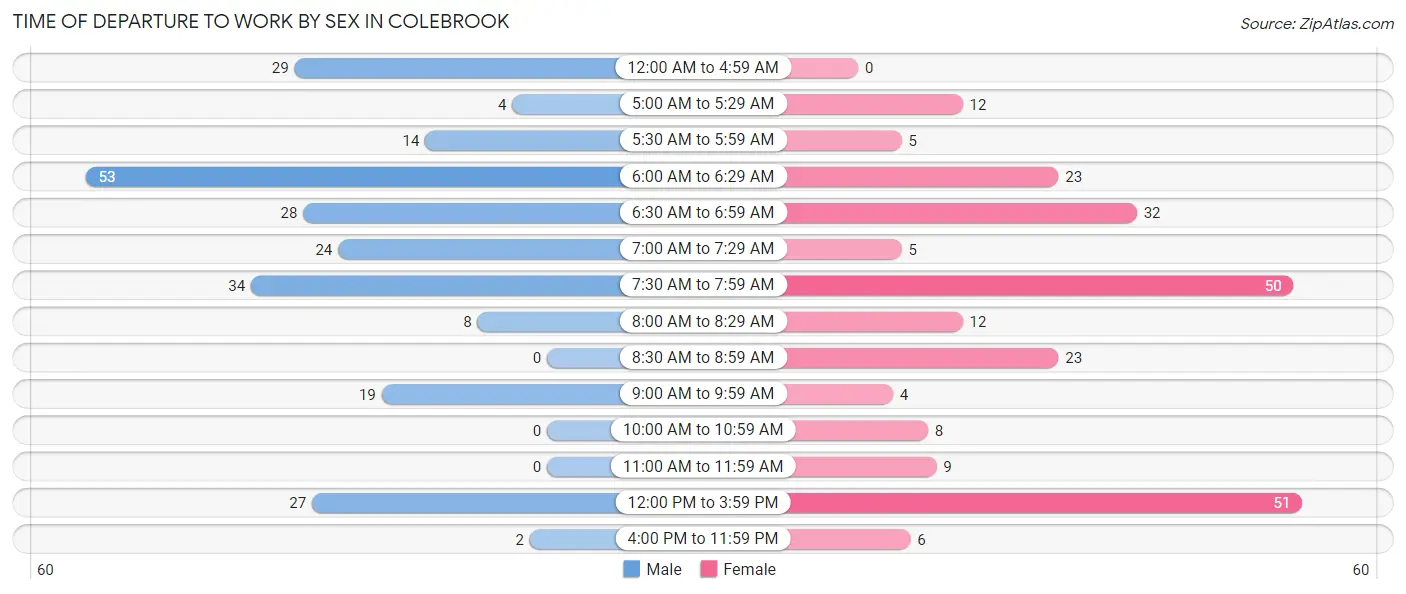
| Time of Departure | Male | Female |
| 12:00 AM to 4:59 AM | 29 (12.0%) | 0 (0.0%) |
| 5:00 AM to 5:29 AM | 4 (1.7%) | 12 (5.0%) |
| 5:30 AM to 5:59 AM | 14 (5.8%) | 5 (2.1%) |
| 6:00 AM to 6:29 AM | 53 (21.9%) | 23 (9.6%) |
| 6:30 AM to 6:59 AM | 28 (11.6%) | 32 (13.3%) |
| 7:00 AM to 7:29 AM | 24 (9.9%) | 5 (2.1%) |
| 7:30 AM to 7:59 AM | 34 (14.1%) | 50 (20.8%) |
| 8:00 AM to 8:29 AM | 8 (3.3%) | 12 (5.0%) |
| 8:30 AM to 8:59 AM | 0 (0.0%) | 23 (9.6%) |
| 9:00 AM to 9:59 AM | 19 (7.9%) | 4 (1.7%) |
| 10:00 AM to 10:59 AM | 0 (0.0%) | 8 (3.3%) |
| 11:00 AM to 11:59 AM | 0 (0.0%) | 9 (3.7%) |
| 12:00 PM to 3:59 PM | 27 (11.2%) | 51 (21.2%) |
| 4:00 PM to 11:59 PM | 2 (0.8%) | 6 (2.5%) |
| Total | 242 (100.0%) | 240 (100.0%) |
Housing Occupancy in Colebrook
Occupancy by Ownership in Colebrook
Of the total 568 dwellings in Colebrook, owner-occupied units account for 310 (54.6%), while renter-occupied units make up 258 (45.4%).
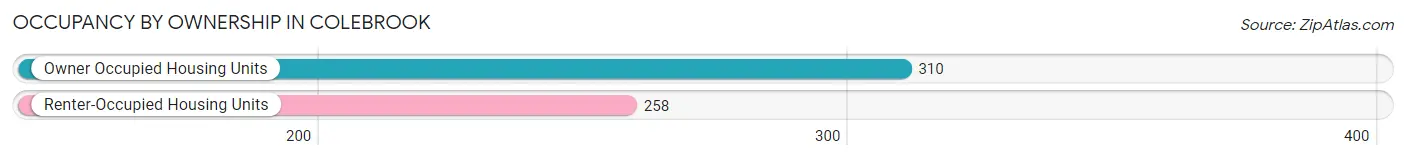
| Occupancy | # Housing Units | % Housing Units |
| Owner Occupied Housing Units | 310 | 54.6% |
| Renter-Occupied Housing Units | 258 | 45.4% |
| Total Occupied Housing Units | 568 | 100.0% |
Occupancy by Household Size in Colebrook
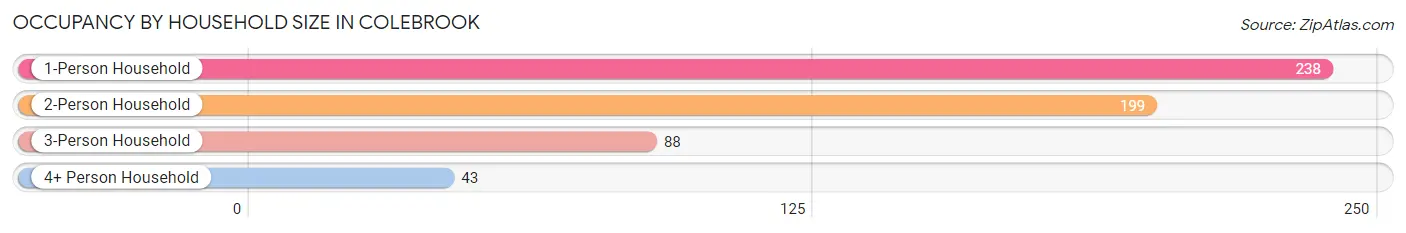
| Household Size | # Housing Units | % Housing Units |
| 1-Person Household | 238 | 41.9% |
| 2-Person Household | 199 | 35.0% |
| 3-Person Household | 88 | 15.5% |
| 4+ Person Household | 43 | 7.6% |
| Total Housing Units | 568 | 100.0% |
Occupancy by Ownership by Household Size in Colebrook
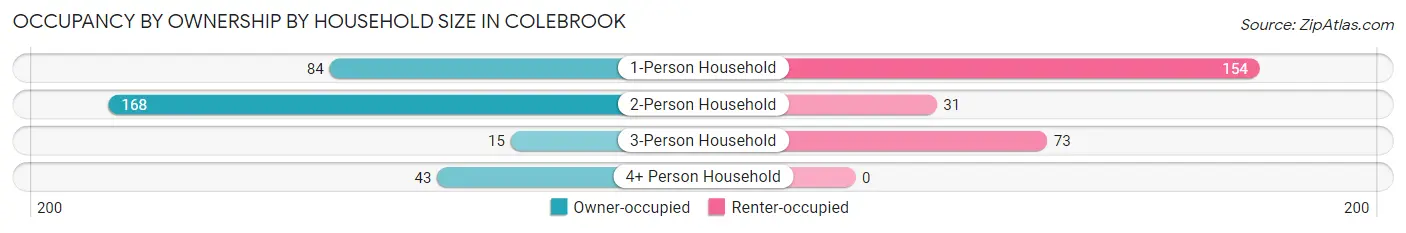
| Household Size | Owner-occupied | Renter-occupied |
| 1-Person Household | 84 (35.3%) | 154 (64.7%) |
| 2-Person Household | 168 (84.4%) | 31 (15.6%) |
| 3-Person Household | 15 (17.1%) | 73 (83.0%) |
| 4+ Person Household | 43 (100.0%) | 0 (0.0%) |
| Total Housing Units | 310 (54.6%) | 258 (45.4%) |
Occupancy by Educational Attainment in Colebrook
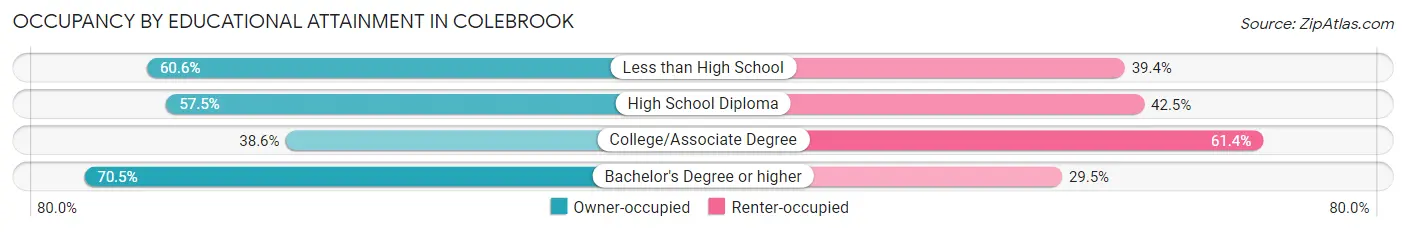
| Household Size | Owner-occupied | Renter-occupied |
| Less than High School | 83 (60.6%) | 54 (39.4%) |
| High School Diploma | 92 (57.5%) | 68 (42.5%) |
| College/Associate Degree | 68 (38.6%) | 108 (61.4%) |
| Bachelor's Degree or higher | 67 (70.5%) | 28 (29.5%) |
Occupancy by Age of Householder in Colebrook
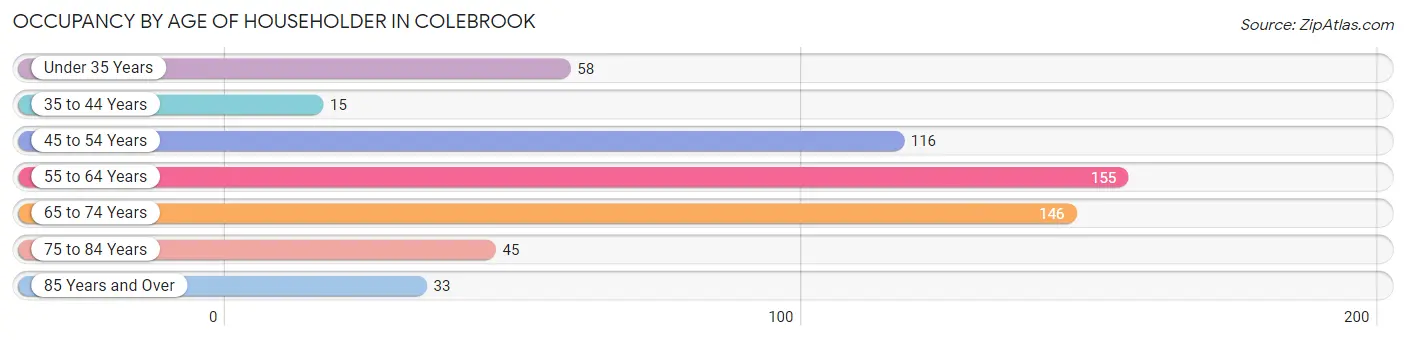
| Age Bracket | # Households | % Households |
| Under 35 Years | 58 | 10.2% |
| 35 to 44 Years | 15 | 2.6% |
| 45 to 54 Years | 116 | 20.4% |
| 55 to 64 Years | 155 | 27.3% |
| 65 to 74 Years | 146 | 25.7% |
| 75 to 84 Years | 45 | 7.9% |
| 85 Years and Over | 33 | 5.8% |
| Total | 568 | 100.0% |
Housing Finances in Colebrook
Median Income by Occupancy in Colebrook
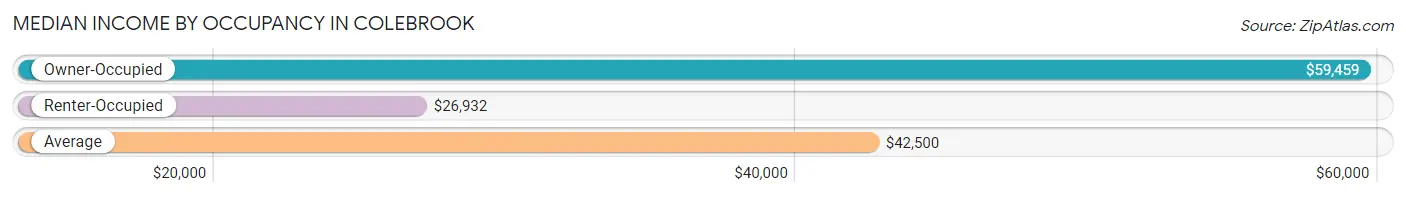
| Occupancy Type | # Households | Median Income |
| Owner-Occupied | 310 (54.6%) | $59,459 |
| Renter-Occupied | 258 (45.4%) | $26,932 |
| Average | 568 (100.0%) | $42,500 |
Occupancy by Householder Income Bracket in Colebrook
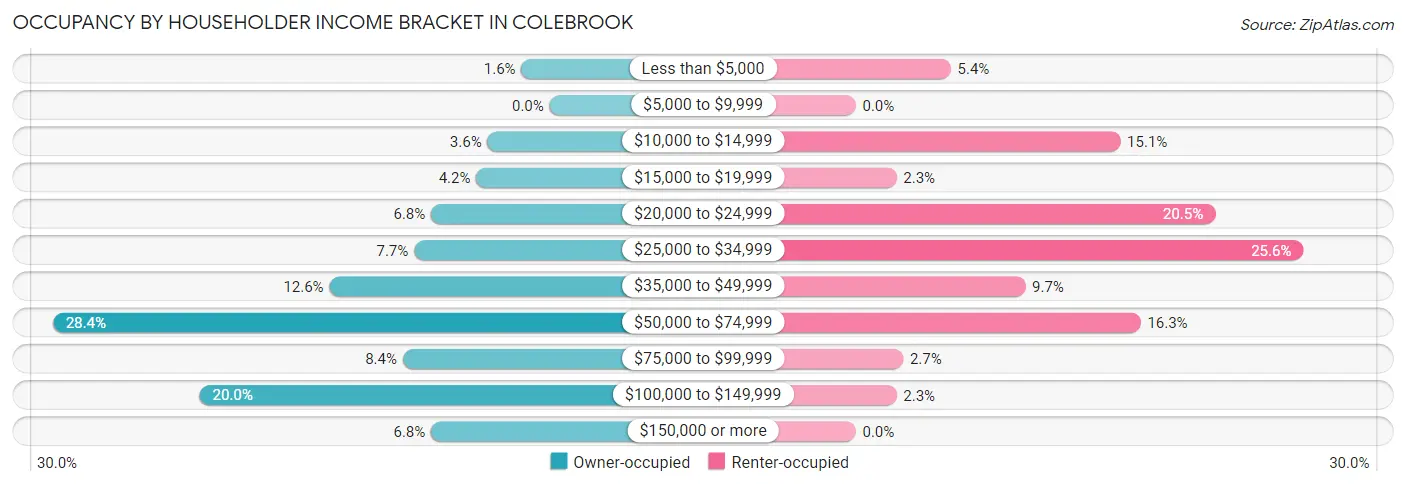
| Income Bracket | Owner-occupied | Renter-occupied |
| Less than $5,000 | 5 (1.6%) | 14 (5.4%) |
| $5,000 to $9,999 | 0 (0.0%) | 0 (0.0%) |
| $10,000 to $14,999 | 11 (3.5%) | 39 (15.1%) |
| $15,000 to $19,999 | 13 (4.2%) | 6 (2.3%) |
| $20,000 to $24,999 | 21 (6.8%) | 53 (20.5%) |
| $25,000 to $34,999 | 24 (7.7%) | 66 (25.6%) |
| $35,000 to $49,999 | 39 (12.6%) | 25 (9.7%) |
| $50,000 to $74,999 | 88 (28.4%) | 42 (16.3%) |
| $75,000 to $99,999 | 26 (8.4%) | 7 (2.7%) |
| $100,000 to $149,999 | 62 (20.0%) | 6 (2.3%) |
| $150,000 or more | 21 (6.8%) | 0 (0.0%) |
| Total | 310 (100.0%) | 258 (100.0%) |
Monthly Housing Cost Tiers in Colebrook
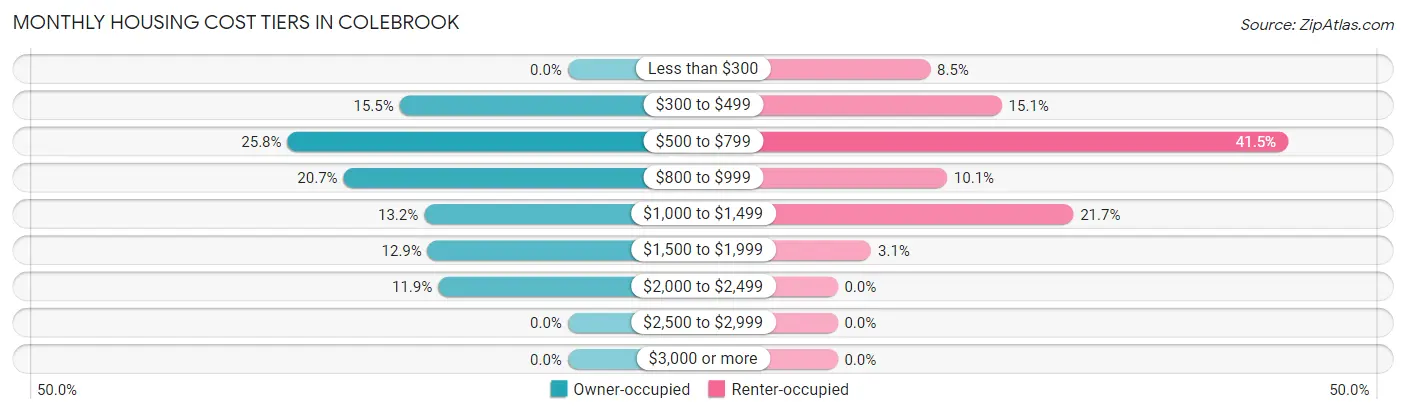
| Monthly Cost | Owner-occupied | Renter-occupied |
| Less than $300 | 0 (0.0%) | 22 (8.5%) |
| $300 to $499 | 48 (15.5%) | 39 (15.1%) |
| $500 to $799 | 80 (25.8%) | 107 (41.5%) |
| $800 to $999 | 64 (20.6%) | 26 (10.1%) |
| $1,000 to $1,499 | 41 (13.2%) | 56 (21.7%) |
| $1,500 to $1,999 | 40 (12.9%) | 8 (3.1%) |
| $2,000 to $2,499 | 37 (11.9%) | 0 (0.0%) |
| $2,500 to $2,999 | 0 (0.0%) | 0 (0.0%) |
| $3,000 or more | 0 (0.0%) | 0 (0.0%) |
| Total | 310 (100.0%) | 258 (100.0%) |
Physical Housing Characteristics in Colebrook
Housing Structures in Colebrook
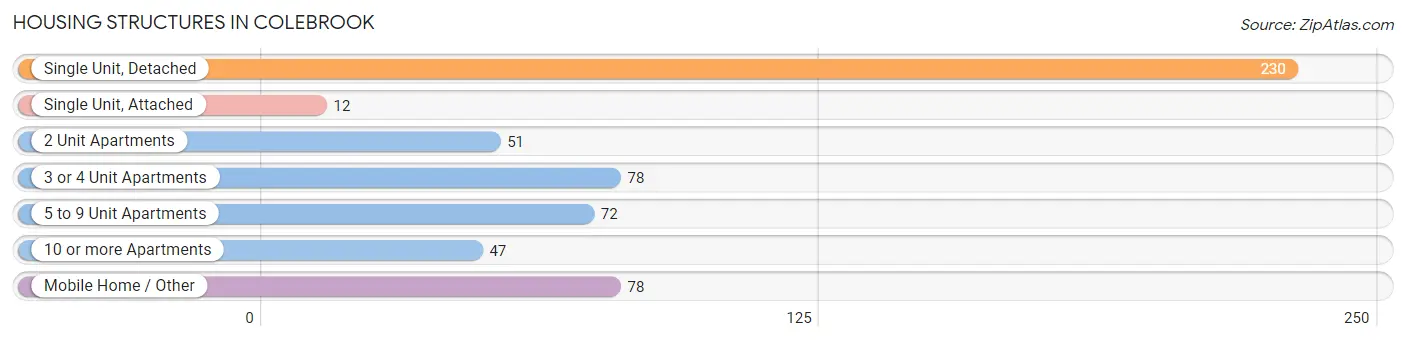
| Structure Type | # Housing Units | % Housing Units |
| Single Unit, Detached | 230 | 40.5% |
| Single Unit, Attached | 12 | 2.1% |
| 2 Unit Apartments | 51 | 9.0% |
| 3 or 4 Unit Apartments | 78 | 13.7% |
| 5 to 9 Unit Apartments | 72 | 12.7% |
| 10 or more Apartments | 47 | 8.3% |
| Mobile Home / Other | 78 | 13.7% |
| Total | 568 | 100.0% |
Housing Structures by Occupancy in Colebrook
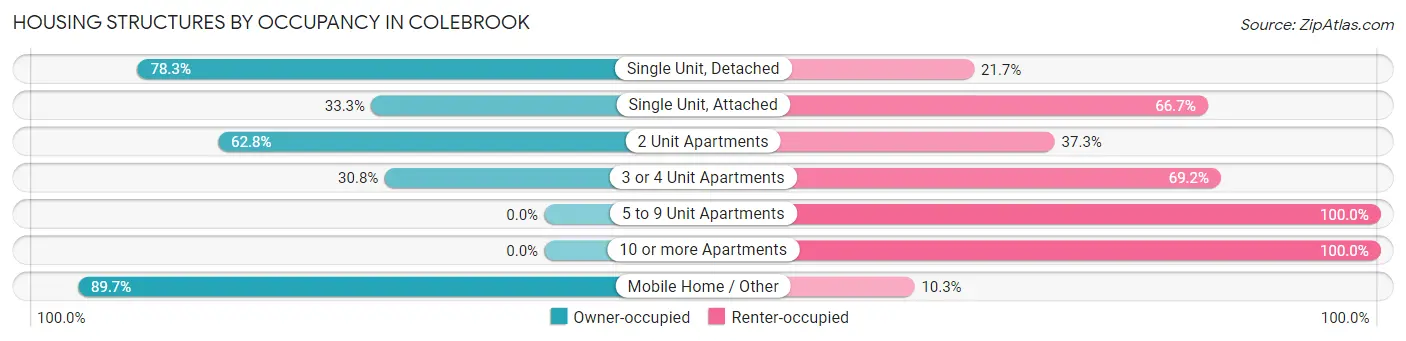
| Structure Type | Owner-occupied | Renter-occupied |
| Single Unit, Detached | 180 (78.3%) | 50 (21.7%) |
| Single Unit, Attached | 4 (33.3%) | 8 (66.7%) |
| 2 Unit Apartments | 32 (62.7%) | 19 (37.2%) |
| 3 or 4 Unit Apartments | 24 (30.8%) | 54 (69.2%) |
| 5 to 9 Unit Apartments | 0 (0.0%) | 72 (100.0%) |
| 10 or more Apartments | 0 (0.0%) | 47 (100.0%) |
| Mobile Home / Other | 70 (89.7%) | 8 (10.3%) |
| Total | 310 (54.6%) | 258 (45.4%) |
Housing Structures by Number of Rooms in Colebrook
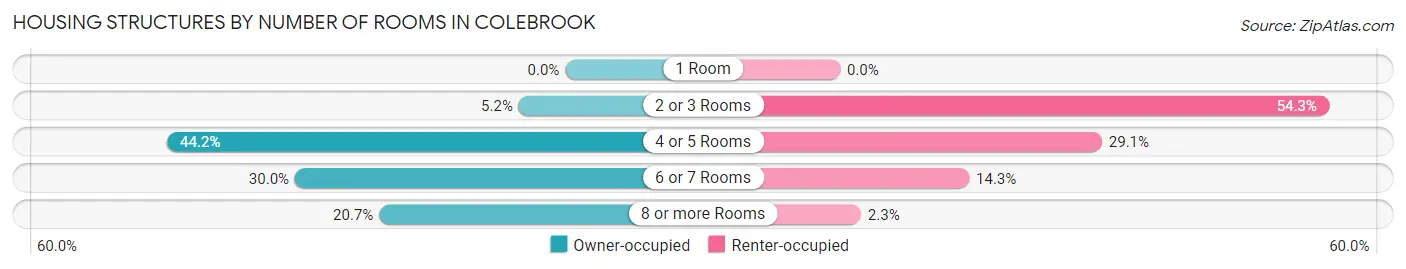
| Number of Rooms | Owner-occupied | Renter-occupied |
| 1 Room | 0 (0.0%) | 0 (0.0%) |
| 2 or 3 Rooms | 16 (5.2%) | 140 (54.3%) |
| 4 or 5 Rooms | 137 (44.2%) | 75 (29.1%) |
| 6 or 7 Rooms | 93 (30.0%) | 37 (14.3%) |
| 8 or more Rooms | 64 (20.6%) | 6 (2.3%) |
| Total | 310 (100.0%) | 258 (100.0%) |
Housing Structure by Heating Type in Colebrook
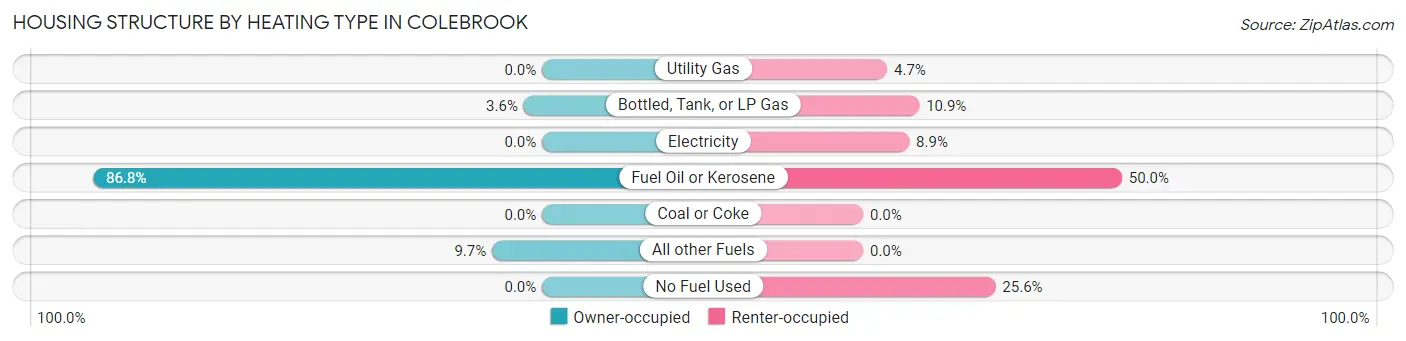
| Heating Type | Owner-occupied | Renter-occupied |
| Utility Gas | 0 (0.0%) | 12 (4.6%) |
| Bottled, Tank, or LP Gas | 11 (3.5%) | 28 (10.8%) |
| Electricity | 0 (0.0%) | 23 (8.9%) |
| Fuel Oil or Kerosene | 269 (86.8%) | 129 (50.0%) |
| Coal or Coke | 0 (0.0%) | 0 (0.0%) |
| All other Fuels | 30 (9.7%) | 0 (0.0%) |
| No Fuel Used | 0 (0.0%) | 66 (25.6%) |
| Total | 310 (100.0%) | 258 (100.0%) |
Household Vehicle Usage in Colebrook
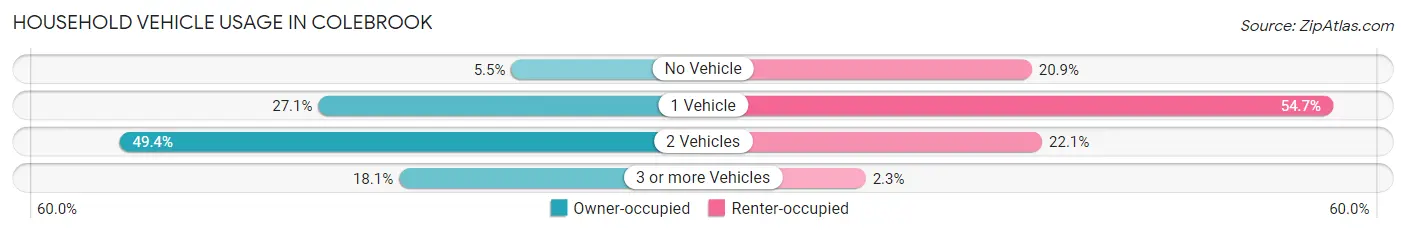
| Vehicles per Household | Owner-occupied | Renter-occupied |
| No Vehicle | 17 (5.5%) | 54 (20.9%) |
| 1 Vehicle | 84 (27.1%) | 141 (54.6%) |
| 2 Vehicles | 153 (49.3%) | 57 (22.1%) |
| 3 or more Vehicles | 56 (18.1%) | 6 (2.3%) |
| Total | 310 (100.0%) | 258 (100.0%) |
Real Estate & Mortgages in Colebrook
Real Estate and Mortgage Overview in Colebrook
| Characteristic | Without Mortgage | With Mortgage |
| Housing Units | 195 | 115 |
| Median Property Value | $155,900 | $106,400 |
| Median Household Income | $58,589 | $8 |
| Monthly Housing Costs | $695 | $0 |
| Real Estate Taxes | $2,602 | $22 |
Property Value by Mortgage Status in Colebrook
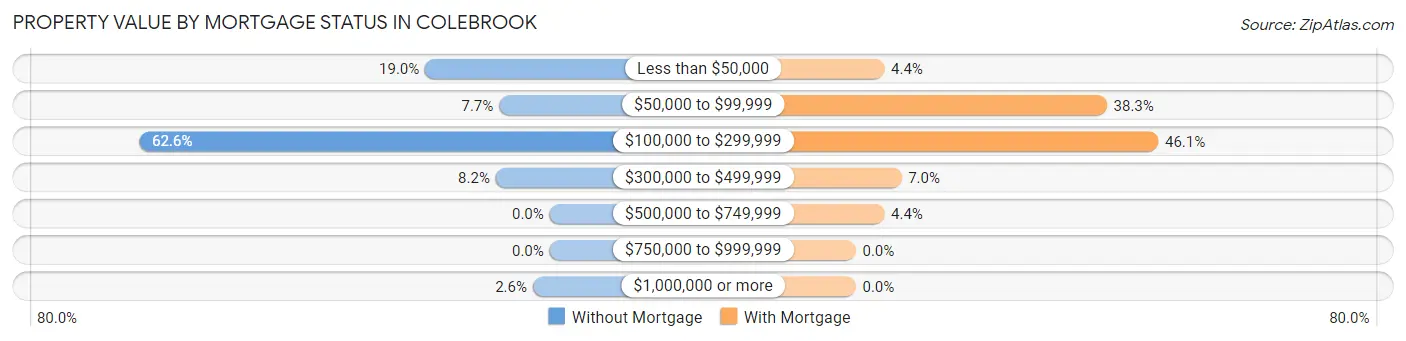
| Property Value | Without Mortgage | With Mortgage |
| Less than $50,000 | 37 (19.0%) | 5 (4.3%) |
| $50,000 to $99,999 | 15 (7.7%) | 44 (38.3%) |
| $100,000 to $299,999 | 122 (62.6%) | 53 (46.1%) |
| $300,000 to $499,999 | 16 (8.2%) | 8 (7.0%) |
| $500,000 to $749,999 | 0 (0.0%) | 5 (4.3%) |
| $750,000 to $999,999 | 0 (0.0%) | 0 (0.0%) |
| $1,000,000 or more | 5 (2.6%) | 0 (0.0%) |
| Total | 195 (100.0%) | 115 (100.0%) |
Household Income by Mortgage Status in Colebrook
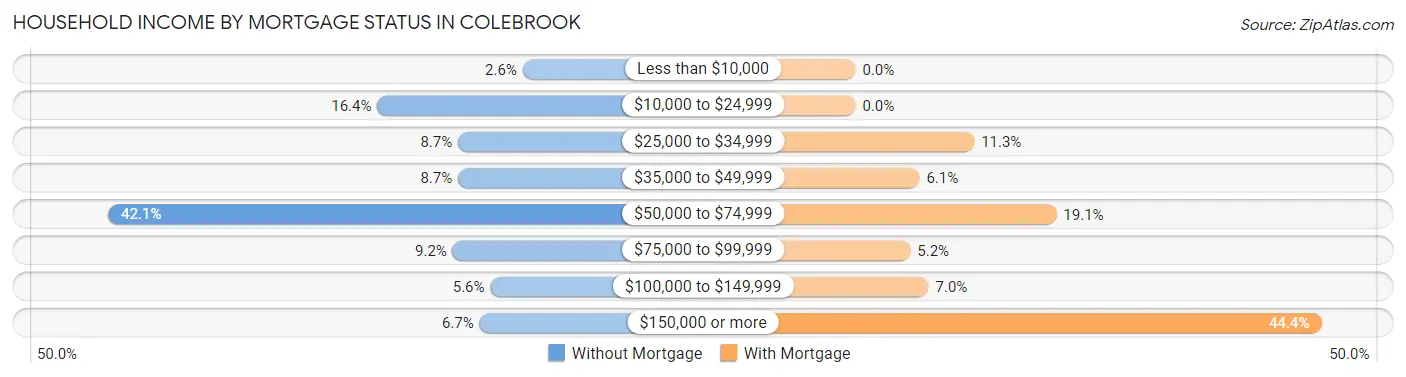
| Household Income | Without Mortgage | With Mortgage |
| Less than $10,000 | 5 (2.6%) | 0 (0.0%) |
| $10,000 to $24,999 | 32 (16.4%) | 0 (0.0%) |
| $25,000 to $34,999 | 17 (8.7%) | 13 (11.3%) |
| $35,000 to $49,999 | 17 (8.7%) | 7 (6.1%) |
| $50,000 to $74,999 | 82 (42.0%) | 22 (19.1%) |
| $75,000 to $99,999 | 18 (9.2%) | 6 (5.2%) |
| $100,000 to $149,999 | 11 (5.6%) | 8 (7.0%) |
| $150,000 or more | 13 (6.7%) | 51 (44.4%) |
| Total | 195 (100.0%) | 115 (100.0%) |
Property Value to Household Income Ratio in Colebrook
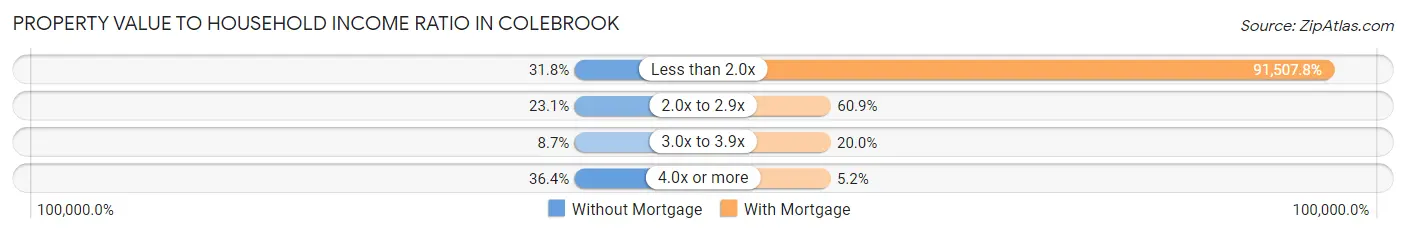
| Value-to-Income Ratio | Without Mortgage | With Mortgage |
| Less than 2.0x | 62 (31.8%) | 105,234 (91,507.8%) |
| 2.0x to 2.9x | 45 (23.1%) | 70 (60.9%) |
| 3.0x to 3.9x | 17 (8.7%) | 23 (20.0%) |
| 4.0x or more | 71 (36.4%) | 6 (5.2%) |
| Total | 195 (100.0%) | 115 (100.0%) |
Real Estate Taxes by Mortgage Status in Colebrook
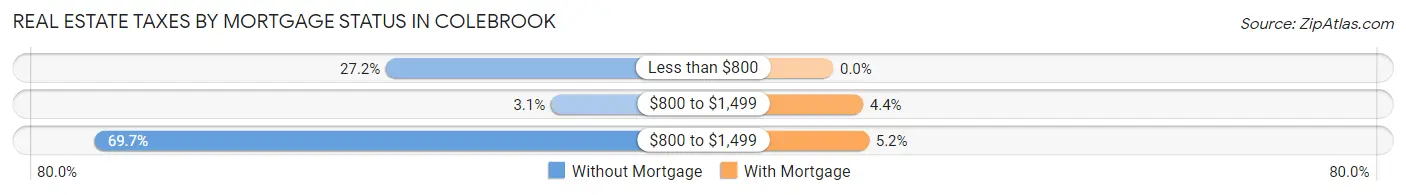
| Property Taxes | Without Mortgage | With Mortgage |
| Less than $800 | 53 (27.2%) | 0 (0.0%) |
| $800 to $1,499 | 6 (3.1%) | 5 (4.3%) |
| $800 to $1,499 | 136 (69.7%) | 6 (5.2%) |
| Total | 195 (100.0%) | 115 (100.0%) |
Health & Disability in Colebrook
Health Insurance Coverage by Age in Colebrook
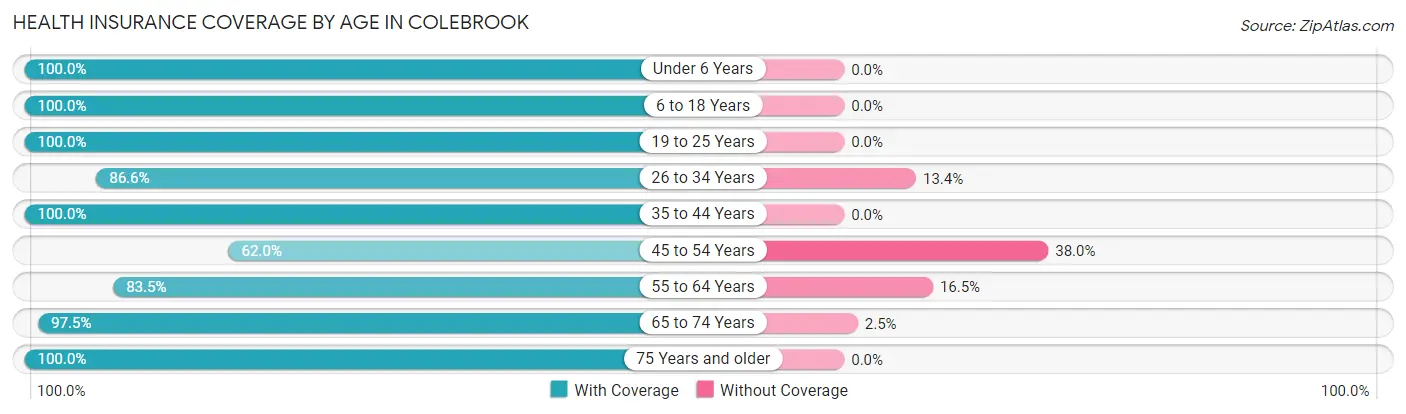
| Age Bracket | With Coverage | Without Coverage |
| Under 6 Years | 73 (100.0%) | 0 (0.0%) |
| 6 to 18 Years | 76 (100.0%) | 0 (0.0%) |
| 19 to 25 Years | 44 (100.0%) | 0 (0.0%) |
| 26 to 34 Years | 123 (86.6%) | 19 (13.4%) |
| 35 to 44 Years | 43 (100.0%) | 0 (0.0%) |
| 45 to 54 Years | 114 (62.0%) | 70 (38.0%) |
| 55 to 64 Years | 202 (83.5%) | 40 (16.5%) |
| 65 to 74 Years | 193 (97.5%) | 5 (2.5%) |
| 75 Years and older | 98 (100.0%) | 0 (0.0%) |
| Total | 966 (87.8%) | 134 (12.2%) |
Health Insurance Coverage by Citizenship Status in Colebrook
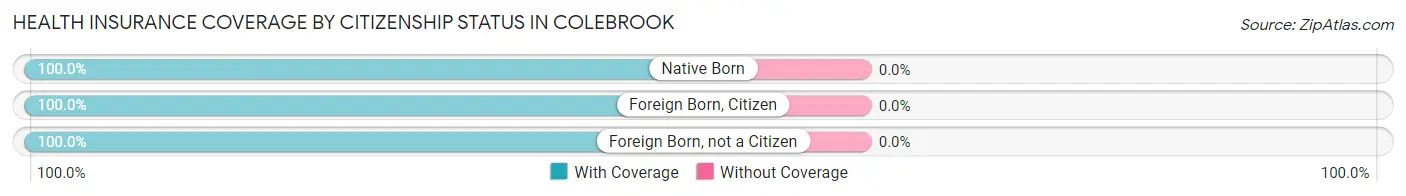
| Citizenship Status | With Coverage | Without Coverage |
| Native Born | 73 (100.0%) | 0 (0.0%) |
| Foreign Born, Citizen | 76 (100.0%) | 0 (0.0%) |
| Foreign Born, not a Citizen | 44 (100.0%) | 0 (0.0%) |
Health Insurance Coverage by Household Income in Colebrook
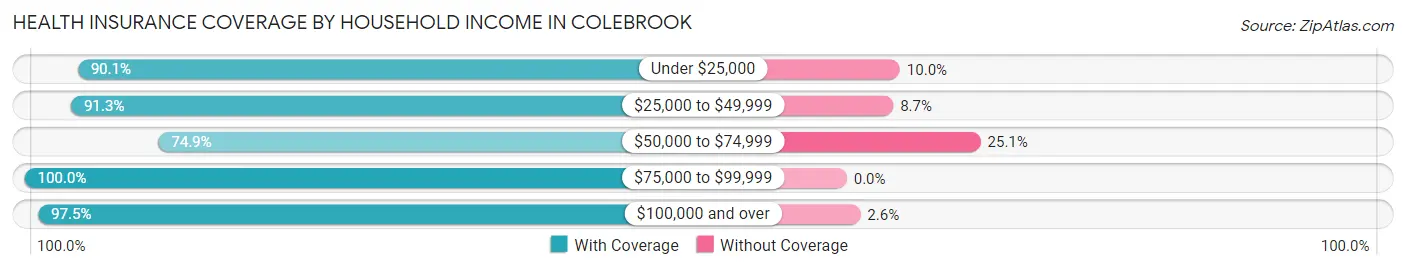
| Household Income | With Coverage | Without Coverage |
| Under $25,000 | 172 (90.0%) | 19 (10.0%) |
| $25,000 to $49,999 | 252 (91.3%) | 24 (8.7%) |
| $50,000 to $74,999 | 257 (74.9%) | 86 (25.1%) |
| $75,000 to $99,999 | 86 (100.0%) | 0 (0.0%) |
| $100,000 and over | 191 (97.5%) | 5 (2.5%) |
Public vs Private Health Insurance Coverage by Age in Colebrook
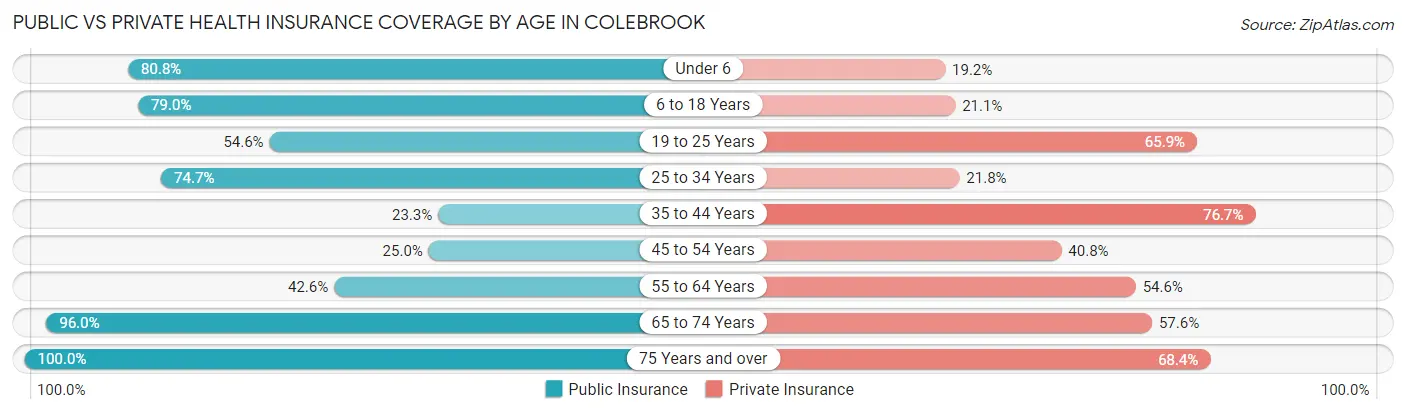
| Age Bracket | Public Insurance | Private Insurance |
| Under 6 | 59 (80.8%) | 14 (19.2%) |
| 6 to 18 Years | 60 (78.9%) | 16 (21.0%) |
| 19 to 25 Years | 24 (54.5%) | 29 (65.9%) |
| 25 to 34 Years | 106 (74.7%) | 31 (21.8%) |
| 35 to 44 Years | 10 (23.3%) | 33 (76.7%) |
| 45 to 54 Years | 46 (25.0%) | 75 (40.8%) |
| 55 to 64 Years | 103 (42.6%) | 132 (54.5%) |
| 65 to 74 Years | 190 (96.0%) | 114 (57.6%) |
| 75 Years and over | 98 (100.0%) | 67 (68.4%) |
| Total | 696 (63.3%) | 511 (46.5%) |
Disability Status by Sex by Age in Colebrook
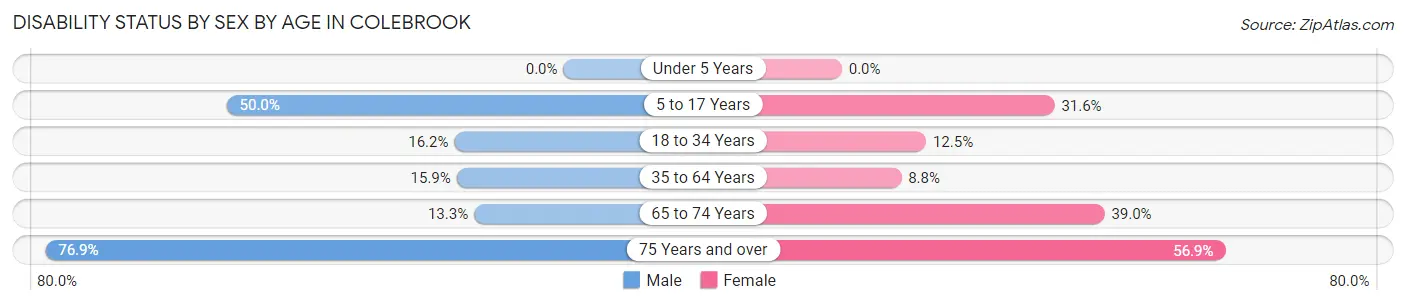
| Age Bracket | Male | Female |
| Under 5 Years | 0 (0.0%) | 0 (0.0%) |
| 5 to 17 Years | 19 (50.0%) | 12 (31.6%) |
| 18 to 34 Years | 17 (16.2%) | 12 (12.5%) |
| 35 to 64 Years | 42 (15.9%) | 18 (8.8%) |
| 65 to 74 Years | 13 (13.3%) | 39 (39.0%) |
| 75 Years and over | 20 (76.9%) | 41 (56.9%) |
Disability Class by Sex by Age in Colebrook
Disability Class: Hearing Difficulty
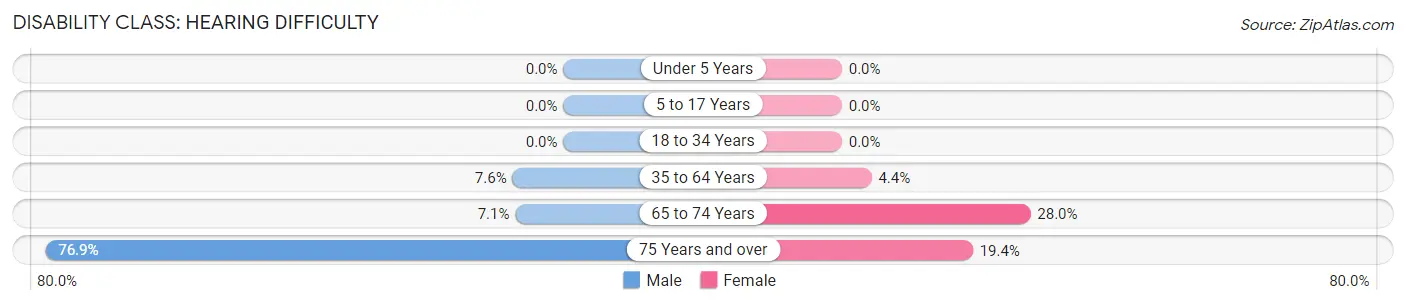
| Age Bracket | Male | Female |
| Under 5 Years | 0 (0.0%) | 0 (0.0%) |
| 5 to 17 Years | 0 (0.0%) | 0 (0.0%) |
| 18 to 34 Years | 0 (0.0%) | 0 (0.0%) |
| 35 to 64 Years | 20 (7.5%) | 9 (4.4%) |
| 65 to 74 Years | 7 (7.1%) | 28 (28.0%) |
| 75 Years and over | 20 (76.9%) | 14 (19.4%) |
Disability Class: Vision Difficulty
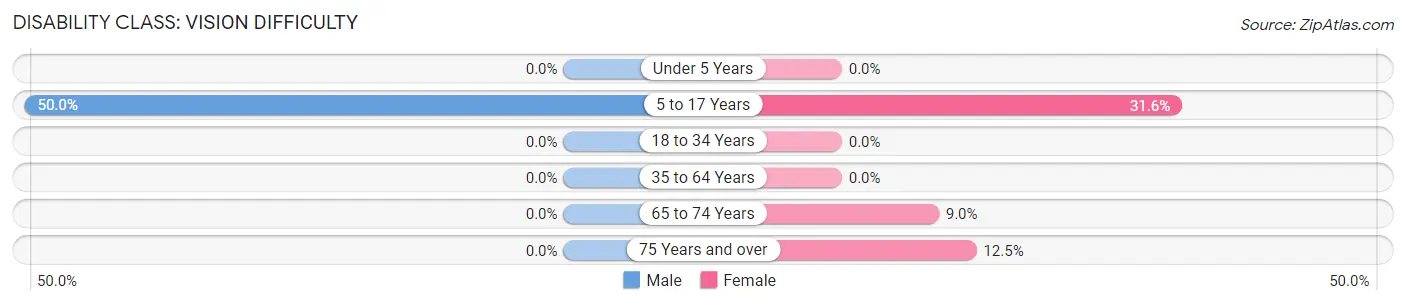
| Age Bracket | Male | Female |
| Under 5 Years | 0 (0.0%) | 0 (0.0%) |
| 5 to 17 Years | 19 (50.0%) | 12 (31.6%) |
| 18 to 34 Years | 0 (0.0%) | 0 (0.0%) |
| 35 to 64 Years | 0 (0.0%) | 0 (0.0%) |
| 65 to 74 Years | 0 (0.0%) | 9 (9.0%) |
| 75 Years and over | 0 (0.0%) | 9 (12.5%) |
Disability Class: Cognitive Difficulty
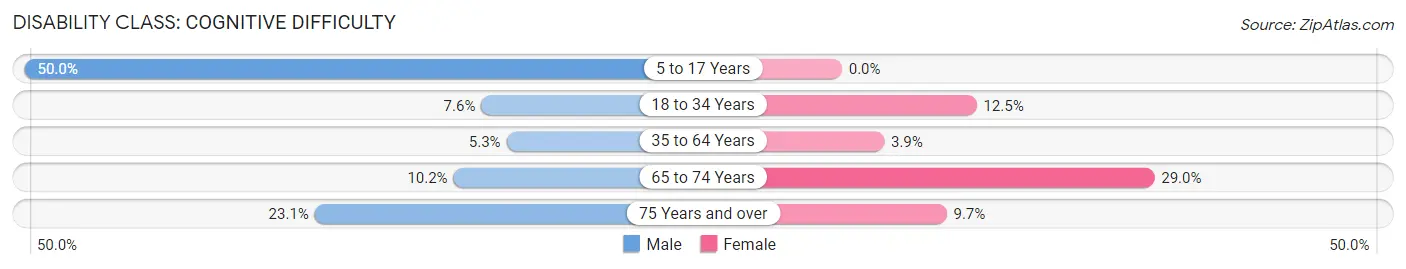
| Age Bracket | Male | Female |
| 5 to 17 Years | 19 (50.0%) | 0 (0.0%) |
| 18 to 34 Years | 8 (7.6%) | 12 (12.5%) |
| 35 to 64 Years | 14 (5.3%) | 8 (3.9%) |
| 65 to 74 Years | 10 (10.2%) | 29 (29.0%) |
| 75 Years and over | 6 (23.1%) | 7 (9.7%) |
Disability Class: Ambulatory Difficulty
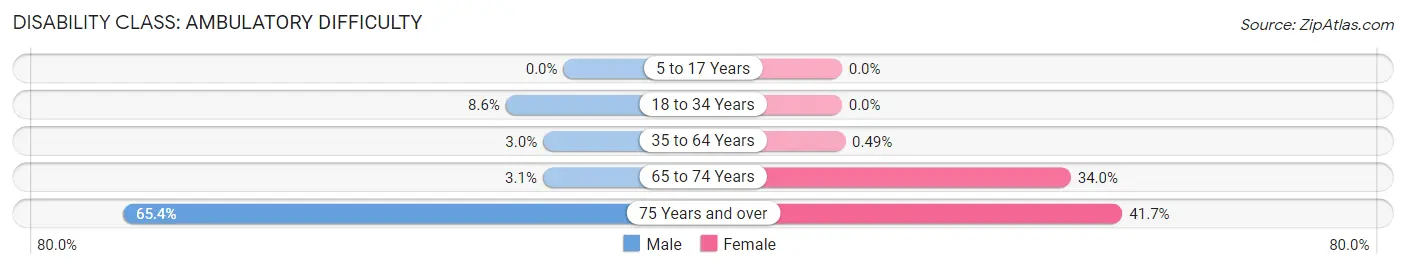
| Age Bracket | Male | Female |
| 5 to 17 Years | 0 (0.0%) | 0 (0.0%) |
| 18 to 34 Years | 9 (8.6%) | 0 (0.0%) |
| 35 to 64 Years | 8 (3.0%) | 1 (0.5%) |
| 65 to 74 Years | 3 (3.1%) | 34 (34.0%) |
| 75 Years and over | 17 (65.4%) | 30 (41.7%) |
Disability Class: Self-Care Difficulty
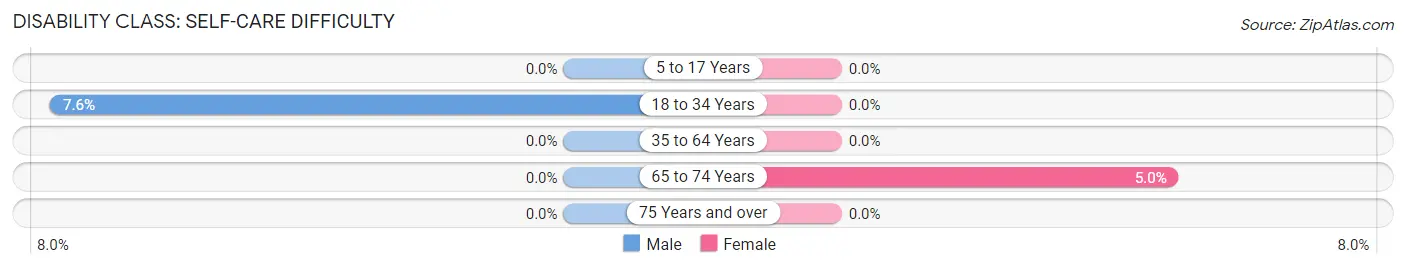
| Age Bracket | Male | Female |
| 5 to 17 Years | 0 (0.0%) | 0 (0.0%) |
| 18 to 34 Years | 8 (7.6%) | 0 (0.0%) |
| 35 to 64 Years | 0 (0.0%) | 0 (0.0%) |
| 65 to 74 Years | 0 (0.0%) | 5 (5.0%) |
| 75 Years and over | 0 (0.0%) | 0 (0.0%) |
Technology Access in Colebrook
Computing Device Access in Colebrook
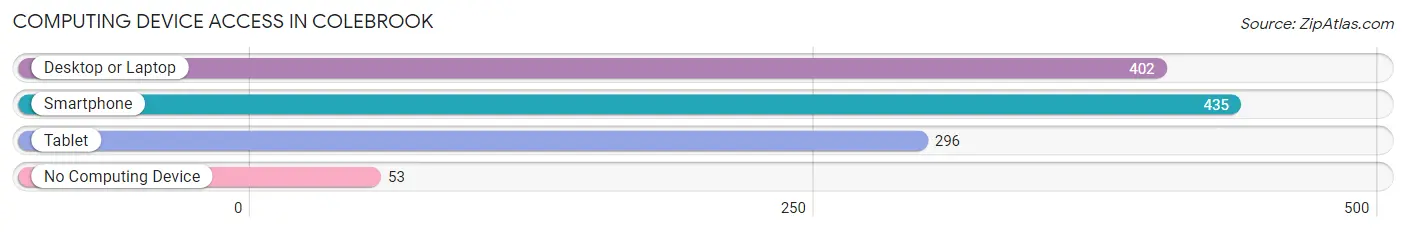
| Device Type | # Households | % Households |
| Desktop or Laptop | 402 | 70.8% |
| Smartphone | 435 | 76.6% |
| Tablet | 296 | 52.1% |
| No Computing Device | 53 | 9.3% |
| Total | 568 | 100.0% |
Internet Access in Colebrook
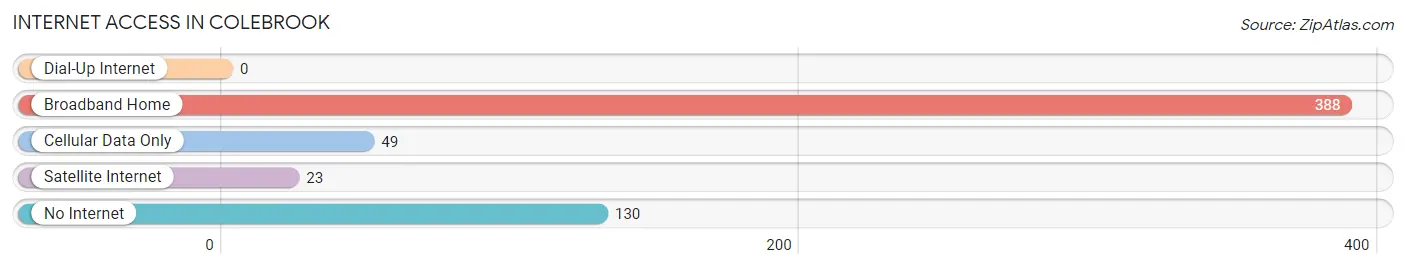
| Internet Type | # Households | % Households |
| Dial-Up Internet | 0 | 0.0% |
| Broadband Home | 388 | 68.3% |
| Cellular Data Only | 49 | 8.6% |
| Satellite Internet | 23 | 4.1% |
| No Internet | 130 | 22.9% |
| Total | 568 | 100.0% |
Colebrook Summary
Introduction
Colebrook is a town located in Coos County, New Hampshire, United States. It is situated in the northern part of the state, near the Canadian border. The town was incorporated in 1796 and has a population of approximately 1,500 people. The town is known for its rural beauty and its proximity to the White Mountains.
History
The area that is now Colebrook was first settled in 1771 by a group of settlers from Connecticut. The town was originally known as "Cole's Brook" after the first settler, John Cole. The town was officially incorporated in 1796 and was named after Cole.
In the early 19th century, the town was a major lumbering center. The lumber industry was the main source of income for the town until the mid-20th century. In the late 19th century, the town was also a major producer of granite.
Geography
Colebrook is located in the northern part of New Hampshire, near the Canadian border. The town is situated in the White Mountains region of the state. The town is bordered by the towns of Pittsburg to the north, Stewartstown to the east, and Columbia to the south. The Connecticut River forms the western border of the town.
The town has a total area of 44.2 square miles, of which 43.9 square miles is land and 0.3 square miles is water. The highest point in the town is the summit of Mount Magalloway, which has an elevation of 3,717 feet.
Economy
The economy of Colebrook is largely based on tourism. The town is a popular destination for outdoor recreation, such as hiking, fishing, and hunting. The town is also home to several ski resorts, including the popular Wildcat Mountain Ski Area.
The town is also home to several small businesses, including restaurants, retail stores, and lodging establishments. The town is also home to several manufacturing companies, including a paper mill and a furniture factory.
Demographics
As of the 2010 census, there were 1,500 people living in Colebrook. The population density was 34.1 people per square mile. The racial makeup of the town was 97.3% White, 0.7% Native American, 0.3% Asian, 0.2% from other races, and 1.5% from two or more races.
The median income for a household in the town was $37,500, and the median income for a family was $45,000. The per capita income for the town was $19,000. About 10.3% of families and 13.3% of the population were below the poverty line.
Conclusion
Colebrook is a small town located in Coos County, New Hampshire. The town has a population of approximately 1,500 people and is known for its rural beauty and its proximity to the White Mountains. The economy of the town is largely based on tourism, and the town is home to several small businesses and manufacturing companies. The population of the town is predominantly white, and the median income for a household is $37,500.
Common Questions
What is Per Capita Income in Colebrook?
Per Capita income in Colebrook is $30,353.
What is the Median Family Income in Colebrook?
Median Family Income in Colebrook is $54,567.
What is the Median Household income in Colebrook?
Median Household Income in Colebrook is $42,500.
What is Income or Wage Gap in Colebrook?
Income or Wage Gap in Colebrook is 15.8%.
Women in Colebrook earn 84.2 cents for every dollar earned by a man.
What is Inequality or Gini Index in Colebrook?
Inequality or Gini Index in Colebrook is 0.47.
What is the Total Population of Colebrook?
Total Population of Colebrook is 1,100.
What is the Total Male Population of Colebrook?
Total Male Population of Colebrook is 566.
What is the Total Female Population of Colebrook?
Total Female Population of Colebrook is 534.
What is the Ratio of Males per 100 Females in Colebrook?
There are 105.99 Males per 100 Females in Colebrook.
What is the Ratio of Females per 100 Males in Colebrook?
There are 94.35 Females per 100 Males in Colebrook.
What is the Median Population Age in Colebrook?
Median Population Age in Colebrook is 53.8 Years.
What is the Average Family Size in Colebrook
Average Family Size in Colebrook is 2.6 People.
What is the Average Household Size in Colebrook
Average Household Size in Colebrook is 1.9 People.
How Large is the Labor Force in Colebrook?
There are 491 People in the Labor Forcein in Colebrook.
What is the Percentage of People in the Labor Force in Colebrook?
49.9% of People are in the Labor Force in Colebrook.
What is the Unemployment Rate in Colebrook?
Unemployment Rate in Colebrook is 0.2%.