Cities with the Most Immigrants from Honduras in Illinois
RELATED REPORTS & OPTIONS
Honduras
Illinois
Compare Cities
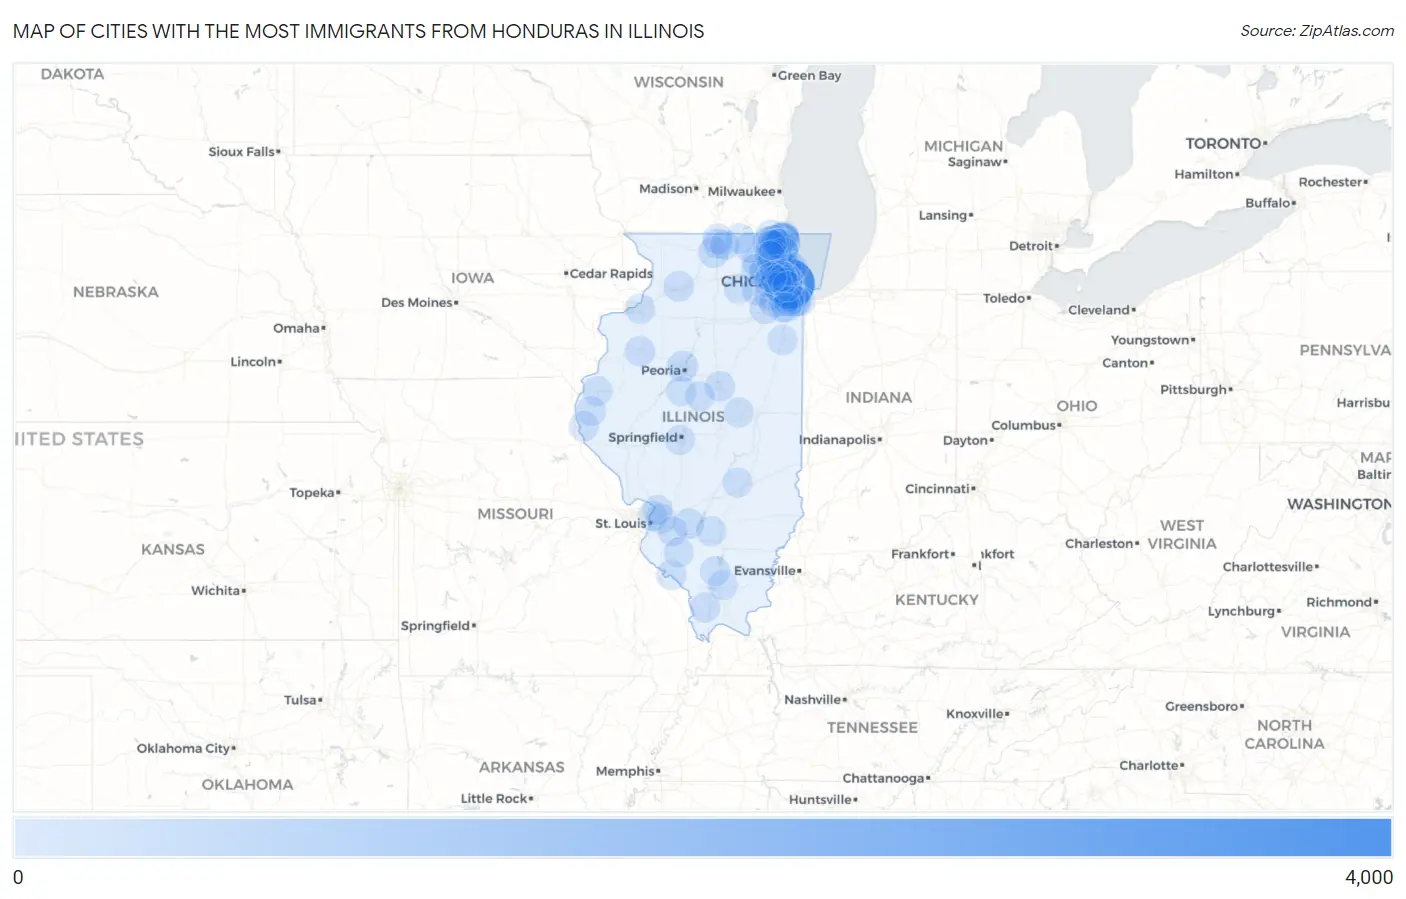
Map of Cities with the Most Immigrants from Honduras in Illinois
0
4,000
Cities with the Most Immigrants from Honduras in Illinois
| City | Honduras | vs State | vs National | |
| 1. | Chicago | 3,798 | 10,762(35.29%)#1 | 727,303(0.52%)#13 |
| 2. | Waukegan | 1,608 | 10,762(14.94%)#2 | 727,303(0.22%)#52 |
| 3. | Hanover Park | 792 | 10,762(7.36%)#3 | 727,303(0.11%)#122 |
| 4. | Cicero | 332 | 10,762(3.08%)#4 | 727,303(0.05%)#314 |
| 5. | Beach Park | 235 | 10,762(2.18%)#5 | 727,303(0.03%)#440 |
| 6. | Round Lake Beach | 212 | 10,762(1.97%)#6 | 727,303(0.03%)#481 |
| 7. | Peoria | 174 | 10,762(1.62%)#7 | 727,303(0.02%)#575 |
| 8. | North Chicago | 167 | 10,762(1.55%)#8 | 727,303(0.02%)#595 |
| 9. | Hawthorn Woods | 165 | 10,762(1.53%)#9 | 727,303(0.02%)#601 |
| 10. | Wheeling | 138 | 10,762(1.28%)#10 | 727,303(0.02%)#684 |
| 11. | Aurora | 124 | 10,762(1.15%)#11 | 727,303(0.02%)#751 |
| 12. | Breese | 119 | 10,762(1.11%)#12 | 727,303(0.02%)#787 |
| 13. | Schaumburg | 110 | 10,762(1.02%)#13 | 727,303(0.02%)#823 |
| 14. | Rockford | 107 | 10,762(0.99%)#14 | 727,303(0.01%)#833 |
| 15. | Ridgewood | 89 | 10,762(0.83%)#15 | 727,303(0.01%)#962 |
| 16. | Lombard | 86 | 10,762(0.80%)#16 | 727,303(0.01%)#979 |
| 17. | Addison | 86 | 10,762(0.80%)#17 | 727,303(0.01%)#981 |
| 18. | Anna | 85 | 10,762(0.79%)#18 | 727,303(0.01%)#991 |
| 19. | Carpentersville | 77 | 10,762(0.72%)#19 | 727,303(0.01%)#1,050 |
| 20. | Sterling | 77 | 10,762(0.72%)#20 | 727,303(0.01%)#1,053 |
| 21. | Harvey | 75 | 10,762(0.70%)#21 | 727,303(0.01%)#1,066 |
| 22. | Blue Island | 74 | 10,762(0.69%)#22 | 727,303(0.01%)#1,077 |
| 23. | Park City | 69 | 10,762(0.64%)#23 | 727,303(0.01%)#1,127 |
| 24. | Berwyn | 68 | 10,762(0.63%)#24 | 727,303(0.01%)#1,134 |
| 25. | Bloomington | 58 | 10,762(0.54%)#25 | 727,303(0.01%)#1,236 |
| 26. | Zion | 58 | 10,762(0.54%)#26 | 727,303(0.01%)#1,243 |
| 27. | Oak Lawn | 55 | 10,762(0.51%)#27 | 727,303(0.01%)#1,289 |
| 28. | Woodstock | 51 | 10,762(0.47%)#28 | 727,303(0.01%)#1,348 |
| 29. | Bridgeview | 50 | 10,762(0.46%)#29 | 727,303(0.01%)#1,367 |
| 30. | Des Plaines | 49 | 10,762(0.46%)#30 | 727,303(0.01%)#1,375 |
| 31. | Galesburg | 48 | 10,762(0.45%)#31 | 727,303(0.01%)#1,393 |
| 32. | Palatine | 46 | 10,762(0.43%)#32 | 727,303(0.01%)#1,421 |
| 33. | Joliet | 43 | 10,762(0.40%)#33 | 727,303(0.01%)#1,466 |
| 34. | Niles | 43 | 10,762(0.40%)#34 | 727,303(0.01%)#1,474 |
| 35. | Vernon Hills | 42 | 10,762(0.39%)#35 | 727,303(0.01%)#1,495 |
| 36. | Elgin | 39 | 10,762(0.36%)#36 | 727,303(0.01%)#1,544 |
| 37. | Bolingbrook | 33 | 10,762(0.31%)#37 | 727,303(0.00%)#1,680 |
| 38. | Long Lake | 32 | 10,762(0.30%)#38 | 727,303(0.00%)#1,723 |
| 39. | Hillside | 31 | 10,762(0.29%)#39 | 727,303(0.00%)#1,736 |
| 40. | Kankakee | 30 | 10,762(0.28%)#40 | 727,303(0.00%)#1,750 |
| 41. | Collinsville | 30 | 10,762(0.28%)#41 | 727,303(0.00%)#1,751 |
| 42. | Antioch | 27 | 10,762(0.25%)#42 | 727,303(0.00%)#1,844 |
| 43. | Bensenville | 25 | 10,762(0.23%)#43 | 727,303(0.00%)#1,890 |
| 44. | Centralia | 25 | 10,762(0.23%)#44 | 727,303(0.00%)#1,894 |
| 45. | Skokie | 24 | 10,762(0.22%)#45 | 727,303(0.00%)#1,910 |
| 46. | East Moline | 22 | 10,762(0.20%)#46 | 727,303(0.00%)#1,989 |
| 47. | Lake Forest | 22 | 10,762(0.20%)#47 | 727,303(0.00%)#1,990 |
| 48. | Oak Park | 21 | 10,762(0.20%)#48 | 727,303(0.00%)#2,015 |
| 49. | Melrose Park | 21 | 10,762(0.20%)#49 | 727,303(0.00%)#2,025 |
| 50. | Evanston | 20 | 10,762(0.19%)#50 | 727,303(0.00%)#2,058 |
| 51. | Phoenix | 19 | 10,762(0.18%)#51 | 727,303(0.00%)#2,130 |
| 52. | Calumet City | 18 | 10,762(0.17%)#52 | 727,303(0.00%)#2,134 |
| 53. | Lockport | 18 | 10,762(0.17%)#53 | 727,303(0.00%)#2,137 |
| 54. | Alsip | 18 | 10,762(0.17%)#54 | 727,303(0.00%)#2,145 |
| 55. | Wheaton | 17 | 10,762(0.16%)#55 | 727,303(0.00%)#2,166 |
| 56. | Grayslake | 16 | 10,762(0.15%)#56 | 727,303(0.00%)#2,220 |
| 57. | Broadview | 16 | 10,762(0.15%)#57 | 727,303(0.00%)#2,235 |
| 58. | Bellwood | 15 | 10,762(0.14%)#58 | 727,303(0.00%)#2,268 |
| 59. | Roscoe | 15 | 10,762(0.14%)#59 | 727,303(0.00%)#2,275 |
| 60. | Lindenhurst | 14 | 10,762(0.13%)#60 | 727,303(0.00%)#2,313 |
| 61. | Chester | 14 | 10,762(0.13%)#61 | 727,303(0.00%)#2,328 |
| 62. | Elk Grove Village | 13 | 10,762(0.12%)#62 | 727,303(0.00%)#2,357 |
| 63. | Machesney Park | 13 | 10,762(0.12%)#63 | 727,303(0.00%)#2,361 |
| 64. | Mokena | 13 | 10,762(0.12%)#64 | 727,303(0.00%)#2,367 |
| 65. | Gages Lake | 12 | 10,762(0.11%)#65 | 727,303(0.00%)#2,416 |
| 66. | Madison | 12 | 10,762(0.11%)#66 | 727,303(0.00%)#2,436 |
| 67. | Springfield | 11 | 10,762(0.10%)#67 | 727,303(0.00%)#2,450 |
| 68. | Forest Lake | 11 | 10,762(0.10%)#68 | 727,303(0.00%)#2,497 |
| 69. | Gurnee | 10 | 10,762(0.09%)#69 | 727,303(0.00%)#2,519 |
| 70. | Carthage | 10 | 10,762(0.09%)#70 | 727,303(0.00%)#2,559 |
| 71. | Orland Park | 9 | 10,762(0.08%)#71 | 727,303(0.00%)#2,591 |
| 72. | Quincy | 9 | 10,762(0.08%)#72 | 727,303(0.00%)#2,594 |
| 73. | Lake Zurich | 9 | 10,762(0.08%)#73 | 727,303(0.00%)#2,607 |
| 74. | Spillertown | 9 | 10,762(0.08%)#74 | 727,303(0.00%)#2,650 |
| 75. | Elmwood Park | 8 | 10,762(0.07%)#75 | 727,303(0.00%)#2,666 |
| 76. | Hinsdale | 8 | 10,762(0.07%)#76 | 727,303(0.00%)#2,669 |
| 77. | Harvard | 8 | 10,762(0.07%)#77 | 727,303(0.00%)#2,679 |
| 78. | Franklin Park | 7 | 10,762(0.07%)#78 | 727,303(0.00%)#2,719 |
| 79. | South Roxana | 7 | 10,762(0.07%)#79 | 727,303(0.00%)#2,745 |
| 80. | Villa Park | 6 | 10,762(0.06%)#80 | 727,303(0.00%)#2,781 |
| 81. | Hinckley | 6 | 10,762(0.06%)#81 | 727,303(0.00%)#2,818 |
| 82. | Green Valley | 6 | 10,762(0.06%)#82 | 727,303(0.00%)#2,833 |
| 83. | Shumway | 6 | 10,762(0.06%)#83 | 727,303(0.00%)#2,842 |
| 84. | Oak Forest | 5 | 10,762(0.05%)#84 | 727,303(0.00%)#2,848 |
| 85. | Frankfort Square | 5 | 10,762(0.05%)#85 | 727,303(0.00%)#2,857 |
| 86. | Mascoutah | 5 | 10,762(0.05%)#86 | 727,303(0.00%)#2,858 |
| 87. | Hainesville | 5 | 10,762(0.05%)#87 | 727,303(0.00%)#2,871 |
| 88. | Christopher | 5 | 10,762(0.05%)#88 | 727,303(0.00%)#2,876 |
| 89. | Tilden | 3 | 10,762(0.03%)#89 | 727,303(0.00%)#3,033 |
| 90. | Forest View | 2 | 10,762(0.02%)#90 | 727,303(0.00%)#3,084 |
| 91. | Armington | 2 | 10,762(0.02%)#91 | 727,303(0.00%)#3,102 |
| 92. | Glendale Heights | 1 | 10,762(0.01%)#92 | 727,303(0.00%)#3,116 |
| 93. | Timberlane | 1 | 10,762(0.01%)#93 | 727,303(0.00%)#3,150 |
| 94. | De Land | 1 | 10,762(0.01%)#94 | 727,303(0.00%)#3,171 |
| 95. | Loraine | 1 | 10,762(0.01%)#95 | 727,303(0.00%)#3,175 |
Common Questions
What are the Top 10 Cities with the Most Immigrants from Honduras in Illinois?
Top 10 Cities with the Most Immigrants from Honduras in Illinois are:
#1
3,798
#2
1,608
#3
792
#4
332
#5
235
#6
212
#7
174
#8
167
#9
165
#10
138
What city has the Most Immigrants from Honduras in Illinois?
Chicago has the Most Immigrants from Honduras in Illinois with 3,798.
What is the Total Immigrants from Honduras in the State of Illinois?
Total Immigrants from Honduras in Illinois is 10,762.
What is the Total Immigrants from Honduras in the United States?
Total Immigrants from Honduras in the United States is 727,303.