Cities with the Most Immigrants from Honduras in Minnesota
RELATED REPORTS & OPTIONS
Honduras
Minnesota
Compare Cities
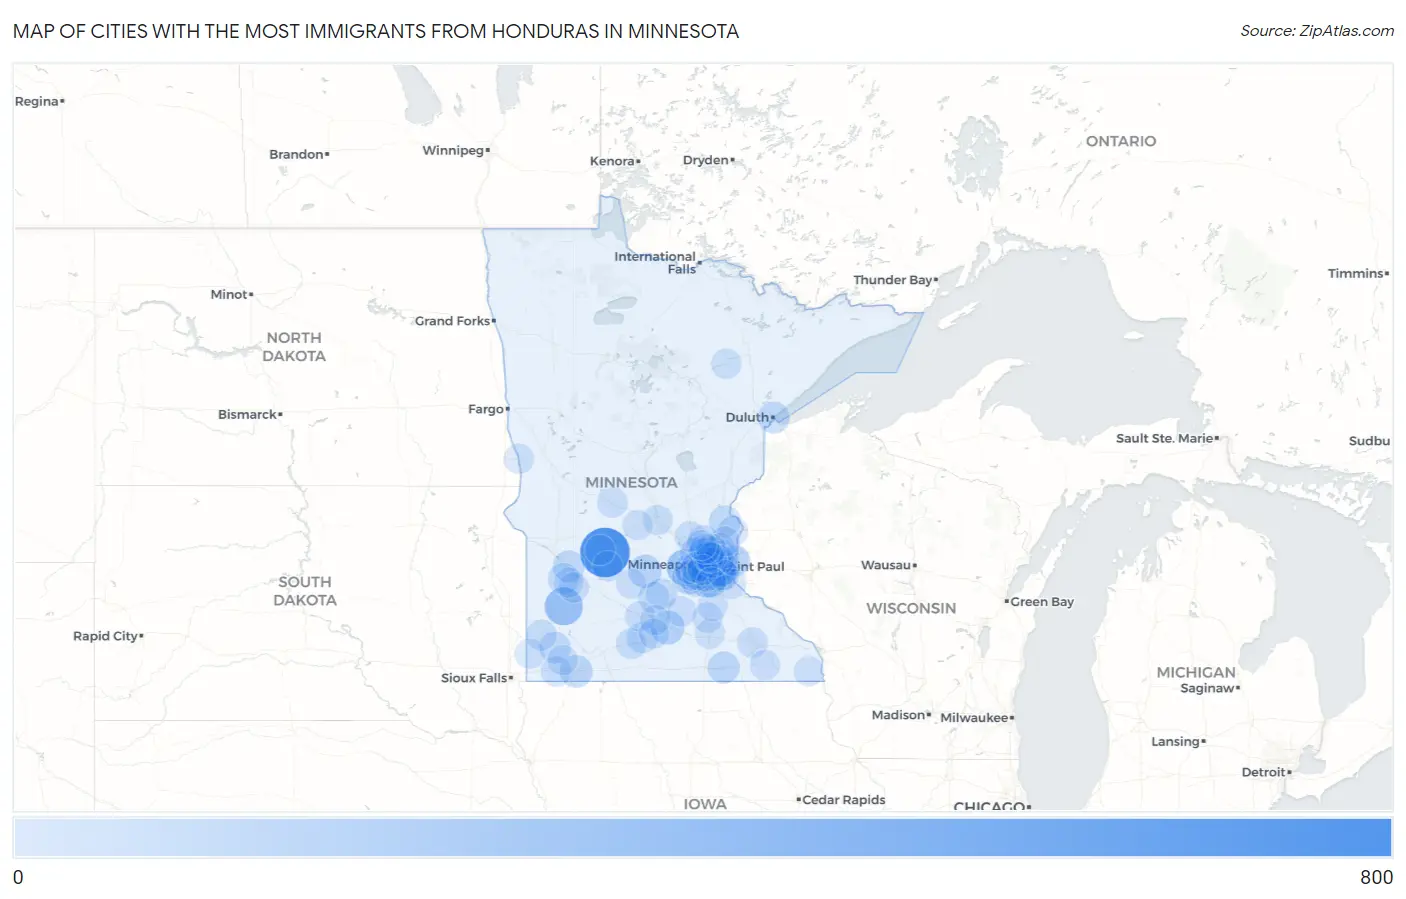
Map of Cities with the Most Immigrants from Honduras in Minnesota
0
800
Cities with the Most Immigrants from Honduras in Minnesota
| City | Honduras | vs State | vs National | |
| 1. | Willmar | 687 | 4,085(16.82%)#1 | 727,303(0.09%)#151 |
| 2. | Marshall | 272 | 4,085(6.66%)#2 | 727,303(0.04%)#394 |
| 3. | Mound | 223 | 4,085(5.46%)#3 | 727,303(0.03%)#456 |
| 4. | St Paul | 191 | 4,085(4.68%)#4 | 727,303(0.03%)#528 |
| 5. | Burnsville | 162 | 4,085(3.97%)#5 | 727,303(0.02%)#614 |
| 6. | West St Paul | 135 | 4,085(3.30%)#6 | 727,303(0.02%)#699 |
| 7. | Mankato | 130 | 4,085(3.18%)#7 | 727,303(0.02%)#716 |
| 8. | Columbia Heights | 128 | 4,085(3.13%)#8 | 727,303(0.02%)#727 |
| 9. | Minneapolis | 125 | 4,085(3.06%)#9 | 727,303(0.02%)#746 |
| 10. | Chaska | 117 | 4,085(2.86%)#10 | 727,303(0.02%)#794 |
| 11. | Mounds View | 112 | 4,085(2.74%)#11 | 727,303(0.02%)#820 |
| 12. | Hutchinson | 99 | 4,085(2.42%)#12 | 727,303(0.01%)#887 |
| 13. | Maplewood | 96 | 4,085(2.35%)#13 | 727,303(0.01%)#908 |
| 14. | Worthington | 84 | 4,085(2.06%)#14 | 727,303(0.01%)#999 |
| 15. | Maple Grove | 83 | 4,085(2.03%)#15 | 727,303(0.01%)#1,004 |
| 16. | Austin | 67 | 4,085(1.64%)#16 | 727,303(0.01%)#1,144 |
| 17. | Montevideo | 57 | 4,085(1.40%)#17 | 727,303(0.01%)#1,270 |
| 18. | Duluth | 56 | 4,085(1.37%)#18 | 727,303(0.01%)#1,276 |
| 19. | Andover | 56 | 4,085(1.37%)#19 | 727,303(0.01%)#1,279 |
| 20. | Chandler | 52 | 4,085(1.27%)#20 | 727,303(0.01%)#1,345 |
| 21. | North Branch | 49 | 4,085(1.20%)#21 | 727,303(0.01%)#1,381 |
| 22. | White Bear Lake | 47 | 4,085(1.15%)#22 | 727,303(0.01%)#1,409 |
| 23. | Clarkfield | 46 | 4,085(1.13%)#23 | 727,303(0.01%)#1,436 |
| 24. | Inver Grove Heights | 43 | 4,085(1.05%)#24 | 727,303(0.01%)#1,472 |
| 25. | Madelia | 40 | 4,085(0.98%)#25 | 727,303(0.01%)#1,541 |
| 26. | Gaylord | 39 | 4,085(0.95%)#26 | 727,303(0.01%)#1,560 |
| 27. | Arlington | 38 | 4,085(0.93%)#27 | 727,303(0.01%)#1,582 |
| 28. | Eagan | 34 | 4,085(0.83%)#28 | 727,303(0.00%)#1,654 |
| 29. | Shakopee | 31 | 4,085(0.76%)#29 | 727,303(0.00%)#1,729 |
| 30. | South St Paul | 29 | 4,085(0.71%)#30 | 727,303(0.00%)#1,782 |
| 31. | New Hope | 28 | 4,085(0.69%)#31 | 727,303(0.00%)#1,809 |
| 32. | Brooklyn Park | 26 | 4,085(0.64%)#32 | 727,303(0.00%)#1,861 |
| 33. | Holland | 26 | 4,085(0.64%)#33 | 727,303(0.00%)#1,880 |
| 34. | Bloomington | 23 | 4,085(0.56%)#34 | 727,303(0.00%)#1,942 |
| 35. | St James | 22 | 4,085(0.54%)#35 | 727,303(0.00%)#2,001 |
| 36. | Centerville | 22 | 4,085(0.54%)#36 | 727,303(0.00%)#2,003 |
| 37. | Chanhassen | 21 | 4,085(0.51%)#37 | 727,303(0.00%)#2,024 |
| 38. | Adrian | 14 | 4,085(0.34%)#38 | 727,303(0.00%)#2,347 |
| 39. | Tonka Bay | 13 | 4,085(0.32%)#39 | 727,303(0.00%)#2,390 |
| 40. | St Louis Park | 12 | 4,085(0.29%)#40 | 727,303(0.00%)#2,403 |
| 41. | Lindstrom | 12 | 4,085(0.29%)#41 | 727,303(0.00%)#2,425 |
| 42. | Oak Park Heights | 12 | 4,085(0.29%)#42 | 727,303(0.00%)#2,427 |
| 43. | Sauk Centre | 12 | 4,085(0.29%)#43 | 727,303(0.00%)#2,428 |
| 44. | Bayport | 12 | 4,085(0.29%)#44 | 727,303(0.00%)#2,430 |
| 45. | Eden Prairie | 11 | 4,085(0.27%)#45 | 727,303(0.00%)#2,453 |
| 46. | Minnetonka | 11 | 4,085(0.27%)#46 | 727,303(0.00%)#2,455 |
| 47. | Hastings | 11 | 4,085(0.27%)#47 | 727,303(0.00%)#2,465 |
| 48. | New Ulm | 11 | 4,085(0.27%)#48 | 727,303(0.00%)#2,472 |
| 49. | Little Canada | 11 | 4,085(0.27%)#49 | 727,303(0.00%)#2,476 |
| 50. | Hilltop | 11 | 4,085(0.27%)#50 | 727,303(0.00%)#2,499 |
| 51. | St Paul Park | 10 | 4,085(0.24%)#51 | 727,303(0.00%)#2,546 |
| 52. | Falcon Heights | 10 | 4,085(0.24%)#52 | 727,303(0.00%)#2,547 |
| 53. | Le Center | 10 | 4,085(0.24%)#53 | 727,303(0.00%)#2,560 |
| 54. | Rochester | 9 | 4,085(0.22%)#54 | 727,303(0.00%)#2,583 |
| 55. | Forest Lake | 8 | 4,085(0.20%)#55 | 727,303(0.00%)#2,667 |
| 56. | Hibbing | 8 | 4,085(0.20%)#56 | 727,303(0.00%)#2,670 |
| 57. | Wykoff | 8 | 4,085(0.20%)#57 | 727,303(0.00%)#2,705 |
| 58. | Blomkest | 8 | 4,085(0.20%)#58 | 727,303(0.00%)#2,706 |
| 59. | St Cloud | 7 | 4,085(0.17%)#59 | 727,303(0.00%)#2,708 |
| 60. | Fridley | 7 | 4,085(0.17%)#60 | 727,303(0.00%)#2,711 |
| 61. | New Brighton | 7 | 4,085(0.17%)#61 | 727,303(0.00%)#2,715 |
| 62. | Elk River | 6 | 4,085(0.15%)#62 | 727,303(0.00%)#2,775 |
| 63. | Faribault | 6 | 4,085(0.15%)#63 | 727,303(0.00%)#2,777 |
| 64. | Hanley Falls | 6 | 4,085(0.15%)#64 | 727,303(0.00%)#2,839 |
| 65. | Blaine | 5 | 4,085(0.12%)#65 | 727,303(0.00%)#2,843 |
| 66. | Edina | 5 | 4,085(0.12%)#66 | 727,303(0.00%)#2,845 |
| 67. | Richmond | 5 | 4,085(0.12%)#67 | 727,303(0.00%)#2,885 |
| 68. | Nicollet | 5 | 4,085(0.12%)#68 | 727,303(0.00%)#2,892 |
| 69. | Buffalo Lake | 5 | 4,085(0.12%)#69 | 727,303(0.00%)#2,899 |
| 70. | Coon Rapids | 4 | 4,085(0.10%)#70 | 727,303(0.00%)#2,907 |
| 71. | Lake Crystal | 4 | 4,085(0.10%)#71 | 727,303(0.00%)#2,939 |
| 72. | Apple Valley | 3 | 4,085(0.07%)#72 | 727,303(0.00%)#2,972 |
| 73. | Breckenridge | 3 | 4,085(0.07%)#73 | 727,303(0.00%)#3,001 |
| 74. | Caledonia | 3 | 4,085(0.07%)#74 | 727,303(0.00%)#3,003 |
| 75. | Owatonna | 2 | 4,085(0.05%)#75 | 727,303(0.00%)#3,052 |
| 76. | Hazel Run | 2 | 4,085(0.05%)#76 | 727,303(0.00%)#3,108 |
| 77. | Northfield | 1 | 4,085(0.02%)#77 | 727,303(0.00%)#3,119 |
| 78. | Anoka | 1 | 4,085(0.02%)#78 | 727,303(0.00%)#3,121 |
| 79. | Jasper | 1 | 4,085(0.02%)#79 | 727,303(0.00%)#3,166 |
| 80. | Pennock | 1 | 4,085(0.02%)#80 | 727,303(0.00%)#3,170 |
| 81. | Wilmont | 1 | 4,085(0.02%)#81 | 727,303(0.00%)#3,179 |
Common Questions
What are the Top 10 Cities with the Most Immigrants from Honduras in Minnesota?
Top 10 Cities with the Most Immigrants from Honduras in Minnesota are:
#1
687
#2
272
#3
223
#4
191
#5
162
#6
135
#7
130
#8
128
#9
125
#10
117
What city has the Most Immigrants from Honduras in Minnesota?
Willmar has the Most Immigrants from Honduras in Minnesota with 687.
What is the Total Immigrants from Honduras in the State of Minnesota?
Total Immigrants from Honduras in Minnesota is 4,085.
What is the Total Immigrants from Honduras in the United States?
Total Immigrants from Honduras in the United States is 727,303.