Carthage, IL Map & Demographics
Carthage Map
Carthage Overview
$41,156
PER CAPITA INCOME
$102,938
AVG FAMILY INCOME
$75,962
AVG HOUSEHOLD INCOME
35.4%
WAGE / INCOME GAP [ % ]
64.6¢/ $1
WAGE / INCOME GAP [ $ ]
0.36
INEQUALITY / GINI INDEX
2,560
TOTAL POPULATION
1,419
MALE POPULATION
1,141
FEMALE POPULATION
124.36
MALES / 100 FEMALES
80.41
FEMALES / 100 MALES
44.9
MEDIAN AGE
2.5
AVG FAMILY SIZE
2.0
AVG HOUSEHOLD SIZE
1,513
LABOR FORCE [ PEOPLE ]
68.2%
PERCENT IN LABOR FORCE
1.3%
UNEMPLOYMENT RATE
Carthage Zip Codes
Carthage Area Codes
Income in Carthage
Income Overview in Carthage
Per Capita Income in Carthage is $41,156, while median incomes of families and households are $102,938 and $75,962 respectively.
| Characteristic | Number | Measure |
| Per Capita Income | 2,560 | $41,156 |
| Median Family Income | 724 | $102,938 |
| Mean Family Income | 724 | $103,544 |
| Median Household Income | 1,252 | $75,962 |
| Mean Household Income | 1,252 | $83,680 |
| Income Deficit | 724 | $0 |
| Wage / Income Gap (%) | 2,560 | 35.44% |
| Wage / Income Gap ($) | 2,560 | 64.56¢ per $1 |
| Gini / Inequality Index | 2,560 | 0.36 |
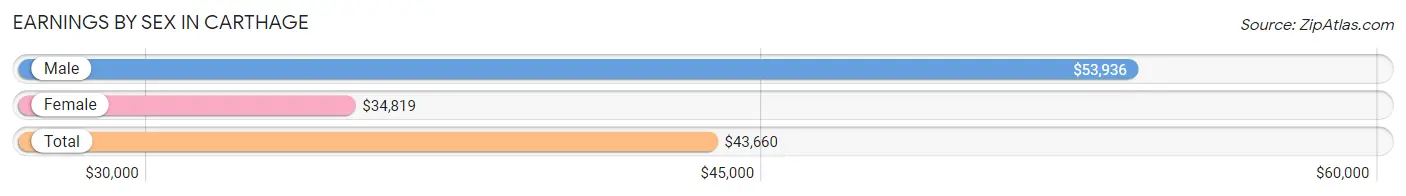
Earnings by Sex in Carthage
Average Earnings in Carthage are $43,660, $53,936 for men and $34,819 for women, a difference of 35.4%.
| Sex | Number | Average Earnings |
| Male | 928 (58.5%) | $53,936 |
| Female | 659 (41.5%) | $34,819 |
| Total | 1,587 (100.0%) | $43,660 |
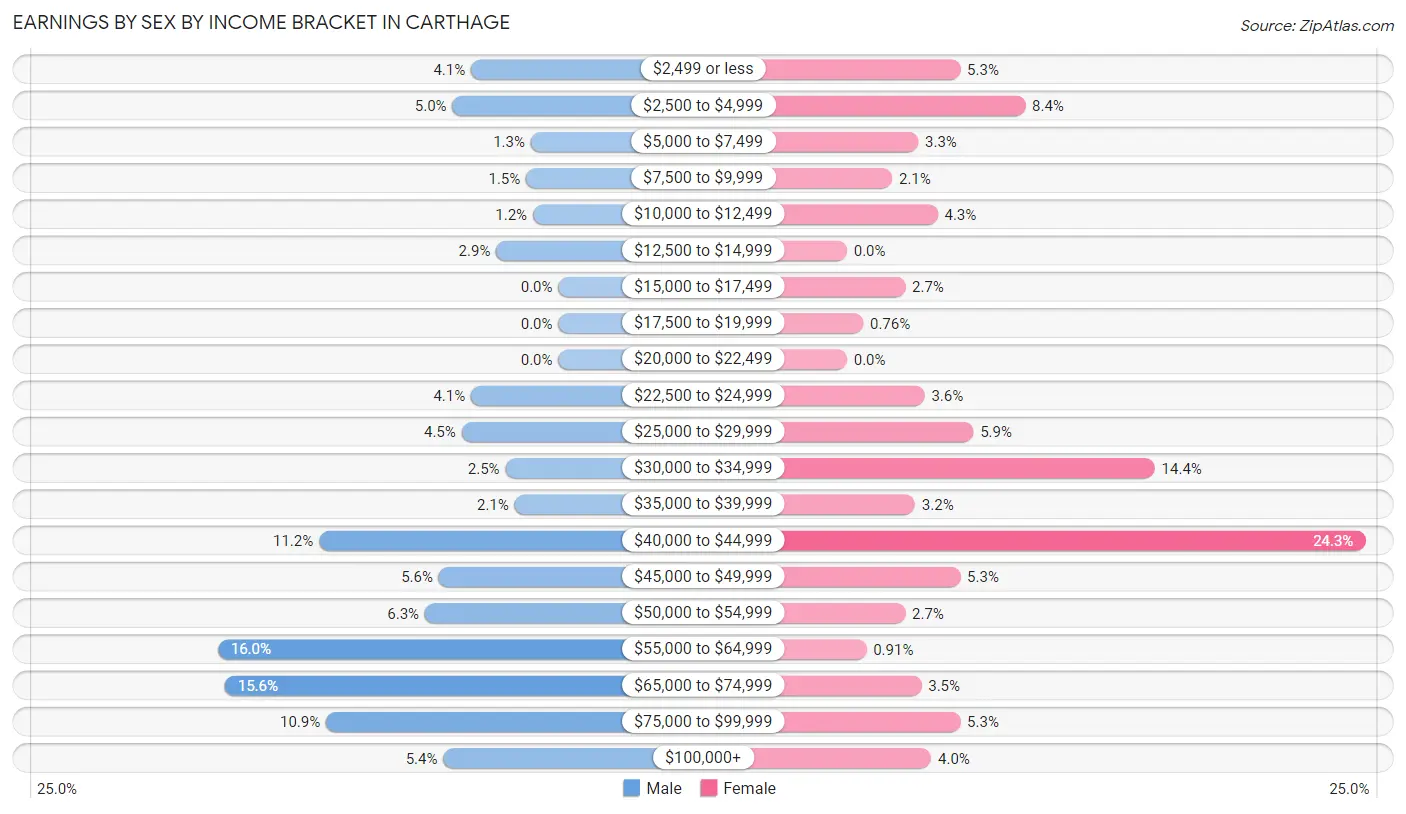
Earnings by Sex by Income Bracket in Carthage
The most common earnings brackets in Carthage are $55,000 to $64,999 for men (148 | 16.0%) and $40,000 to $44,999 for women (160 | 24.3%).
| Income | Male | Female |
| $2,499 or less | 38 (4.1%) | 35 (5.3%) |
| $2,500 to $4,999 | 46 (5.0%) | 55 (8.4%) |
| $5,000 to $7,499 | 12 (1.3%) | 22 (3.3%) |
| $7,500 to $9,999 | 14 (1.5%) | 14 (2.1%) |
| $10,000 to $12,499 | 11 (1.2%) | 28 (4.3%) |
| $12,500 to $14,999 | 27 (2.9%) | 0 (0.0%) |
| $15,000 to $17,499 | 0 (0.0%) | 18 (2.7%) |
| $17,500 to $19,999 | 0 (0.0%) | 5 (0.8%) |
| $20,000 to $22,499 | 0 (0.0%) | 0 (0.0%) |
| $22,500 to $24,999 | 38 (4.1%) | 24 (3.6%) |
| $25,000 to $29,999 | 42 (4.5%) | 39 (5.9%) |
| $30,000 to $34,999 | 23 (2.5%) | 95 (14.4%) |
| $35,000 to $39,999 | 19 (2.1%) | 21 (3.2%) |
| $40,000 to $44,999 | 104 (11.2%) | 160 (24.3%) |
| $45,000 to $49,999 | 52 (5.6%) | 35 (5.3%) |
| $50,000 to $54,999 | 58 (6.2%) | 18 (2.7%) |
| $55,000 to $64,999 | 148 (16.0%) | 6 (0.9%) |
| $65,000 to $74,999 | 145 (15.6%) | 23 (3.5%) |
| $75,000 to $99,999 | 101 (10.9%) | 35 (5.3%) |
| $100,000+ | 50 (5.4%) | 26 (4.0%) |
| Total | 928 (100.0%) | 659 (100.0%) |
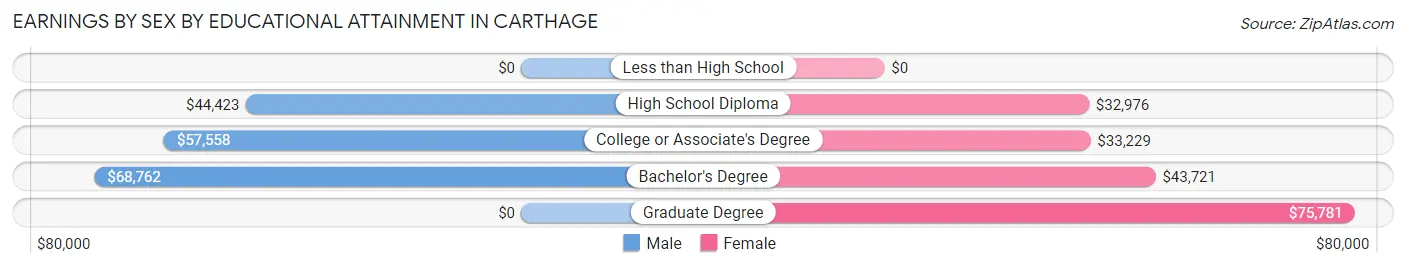
Earnings by Sex by Educational Attainment in Carthage
Average earnings in Carthage are $58,180 for men and $40,091 for women, a difference of 31.1%. Men with an educational attainment of bachelor's degree enjoy the highest average annual earnings of $68,762, while those with high school diploma education earn the least with $44,423. Women with an educational attainment of graduate degree earn the most with the average annual earnings of $75,781, while those with high school diploma education have the smallest earnings of $32,976.
| Educational Attainment | Male Income | Female Income |
| Less than High School | - | - |
| High School Diploma | $44,423 | $32,976 |
| College or Associate's Degree | $57,558 | $33,229 |
| Bachelor's Degree | $68,762 | $43,721 |
| Graduate Degree | - | - |
| Total | $58,180 | $40,091 |
Family Income in Carthage
Family Income Brackets in Carthage
According to the Carthage family income data, there are 256 families falling into the $100,000 to $149,999 income range, which is the most common income bracket and makes up 35.4% of all families.

| Income Bracket | # Families | % Families |
| Less than $10,000 | 31 | 4.3% |
| $10,000 to $14,999 | 10 | 1.4% |
| $15,000 to $24,999 | 31 | 4.3% |
| $25,000 to $34,999 | 25 | 3.5% |
| $35,000 to $49,999 | 0 | 0.0% |
| $50,000 to $74,999 | 82 | 11.3% |
| $75,000 to $99,999 | 160 | 22.1% |
| $100,000 to $149,999 | 256 | 35.4% |
| $150,000 to $199,999 | 83 | 11.5% |
| $200,000+ | 46 | 6.4% |
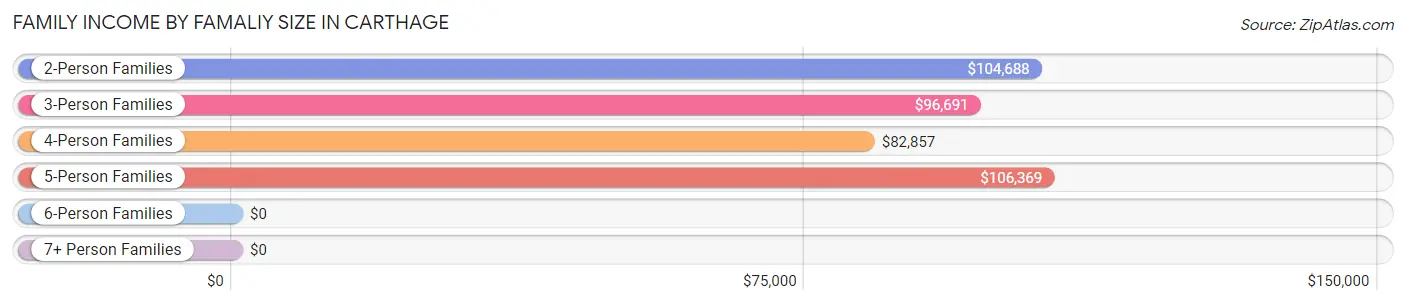
Family Income by Famaliy Size in Carthage
5-person families (33 | 4.6%) account for the highest median family income in Carthage with $106,369 per family, while 2-person families (484 | 66.8%) have the highest median income of $52,344 per family member.
| Income Bracket | # Families | Median Income |
| 2-Person Families | 484 (66.8%) | $104,688 |
| 3-Person Families | 81 (11.2%) | $96,691 |
| 4-Person Families | 126 (17.4%) | $82,857 |
| 5-Person Families | 33 (4.6%) | $106,369 |
| 6-Person Families | 0 (0.0%) | $0 |
| 7+ Person Families | 0 (0.0%) | $0 |
| Total | 724 (100.0%) | $102,938 |
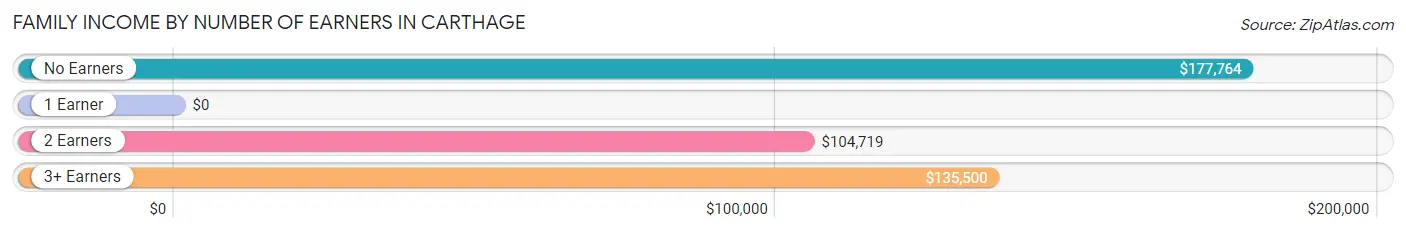
Family Income by Number of Earners in Carthage
| Number of Earners | # Families | Median Income |
| No Earners | 93 (12.9%) | $177,764 |
| 1 Earner | 142 (19.6%) | $0 |
| 2 Earners | 433 (59.8%) | $104,719 |
| 3+ Earners | 56 (7.7%) | $135,500 |
| Total | 724 (100.0%) | $102,938 |
Household Income in Carthage
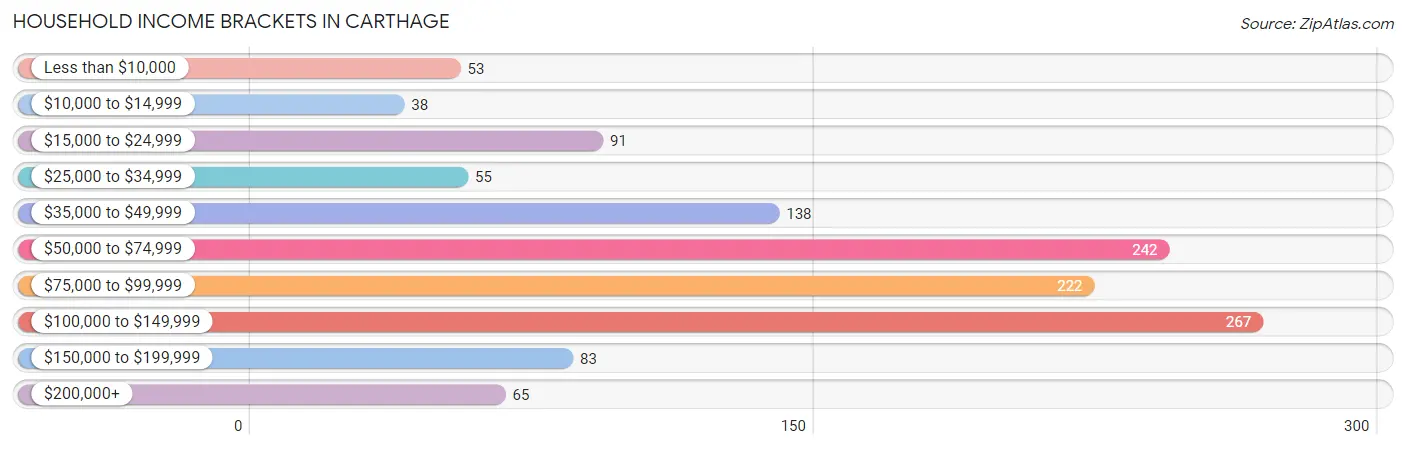
Household Income Brackets in Carthage
With 267 households falling in the category, the $100,000 to $149,999 income range is the most frequent in Carthage, accounting for 21.3% of all households. In contrast, only 38 households (3.0%) fall into the $10,000 to $14,999 income bracket, making it the least populous group.
| Income Bracket | # Households | % Households |
| Less than $10,000 | 53 | 4.2% |
| $10,000 to $14,999 | 38 | 3.0% |
| $15,000 to $24,999 | 91 | 7.3% |
| $25,000 to $34,999 | 55 | 4.4% |
| $35,000 to $49,999 | 138 | 11.0% |
| $50,000 to $74,999 | 242 | 19.3% |
| $75,000 to $99,999 | 222 | 17.7% |
| $100,000 to $149,999 | 267 | 21.3% |
| $150,000 to $199,999 | 83 | 6.6% |
| $200,000+ | 65 | 5.2% |
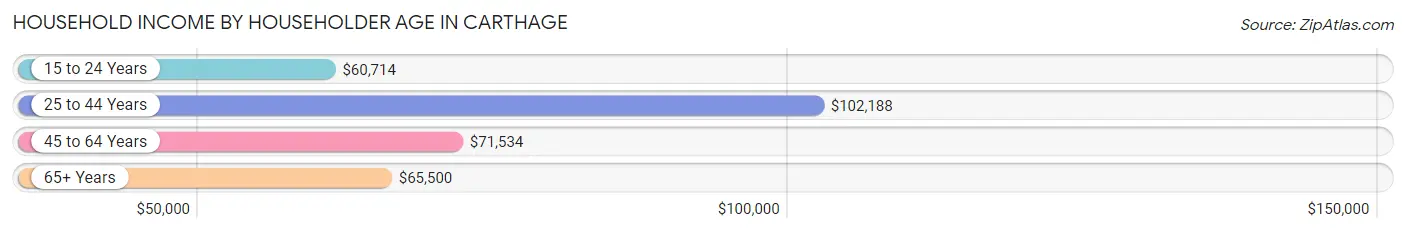
Household Income by Householder Age in Carthage
The median household income in Carthage is $75,962, with the highest median household income of $102,188 found in the 25 to 44 years age bracket for the primary householder. A total of 390 households (31.1%) fall into this category. Meanwhile, the 15 to 24 years age bracket for the primary householder has the lowest median household income of $60,714, with 36 households (2.9%) in this group.
| Income Bracket | # Households | Median Income |
| 15 to 24 Years | 36 (2.9%) | $60,714 |
| 25 to 44 Years | 390 (31.1%) | $102,188 |
| 45 to 64 Years | 472 (37.7%) | $71,534 |
| 65+ Years | 354 (28.3%) | $65,500 |
| Total | 1,252 (100.0%) | $75,962 |
Poverty in Carthage
Income Below Poverty by Sex and Age in Carthage
With 8.4% poverty level for males and 15.1% for females among the residents of Carthage, 6 to 11 year old males and under 5 year old females are the most vulnerable to poverty, with 33 males (32.4%) and 29 females (56.9%) in their respective age groups living below the poverty level.
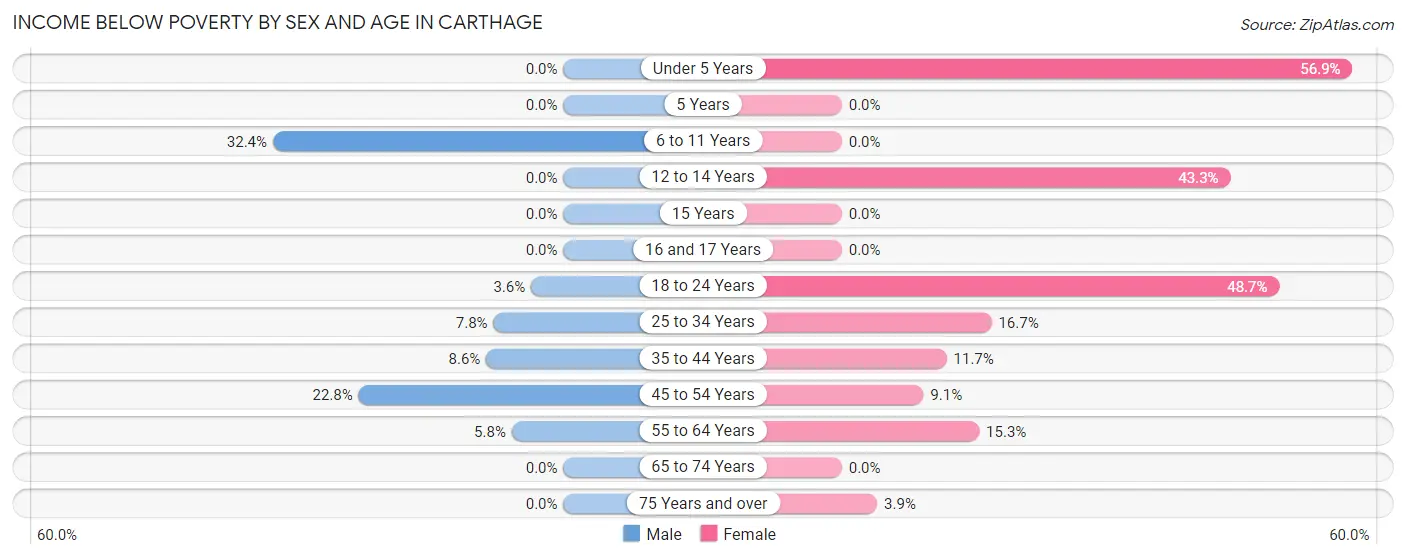
| Age Bracket | Male | Female |
| Under 5 Years | 0 (0.0%) | 29 (56.9%) |
| 5 Years | 0 (0.0%) | 0 (0.0%) |
| 6 to 11 Years | 33 (32.4%) | 0 (0.0%) |
| 12 to 14 Years | 0 (0.0%) | 29 (43.3%) |
| 15 Years | 0 (0.0%) | 0 (0.0%) |
| 16 and 17 Years | 0 (0.0%) | 0 (0.0%) |
| 18 to 24 Years | 4 (3.6%) | 19 (48.7%) |
| 25 to 34 Years | 18 (7.8%) | 32 (16.7%) |
| 35 to 44 Years | 14 (8.6%) | 14 (11.7%) |
| 45 to 54 Years | 26 (22.8%) | 11 (9.1%) |
| 55 to 64 Years | 18 (5.8%) | 28 (15.3%) |
| 65 to 74 Years | 0 (0.0%) | 0 (0.0%) |
| 75 Years and over | 0 (0.0%) | 8 (3.9%) |
| Total | 113 (8.4%) | 170 (15.1%) |
Income Above Poverty by Sex and Age in Carthage
According to the poverty statistics in Carthage, males aged under 5 years and females aged 6 to 11 years are the age groups that are most secure financially, with 100.0% of males and 100.0% of females in these age groups living above the poverty line.
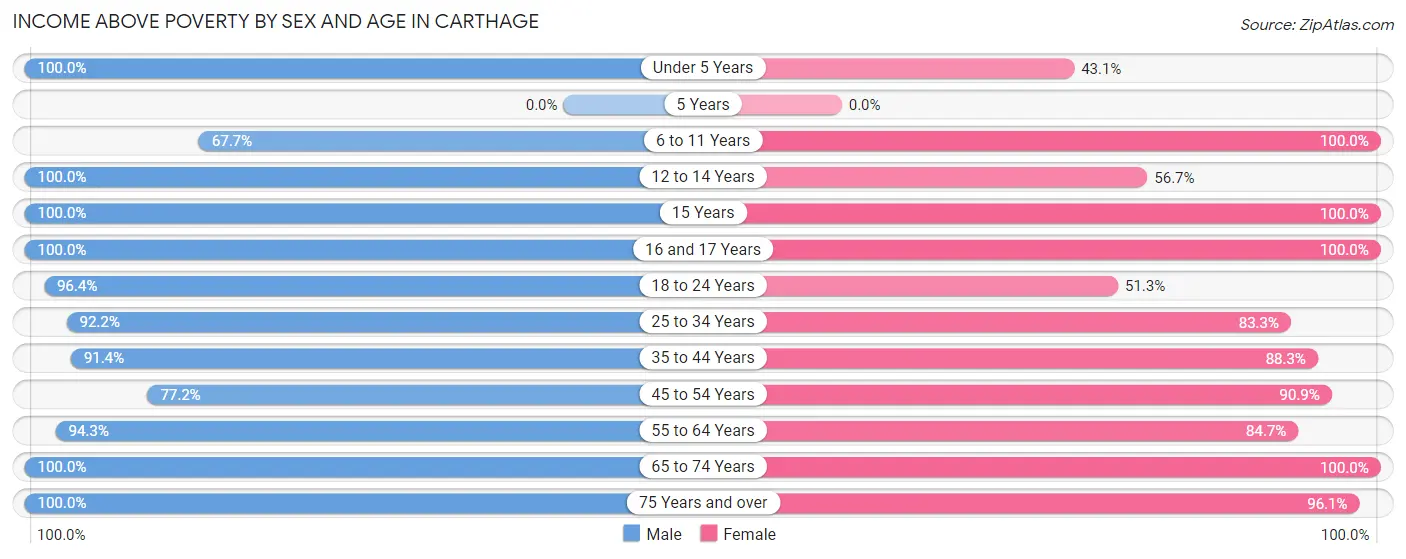
| Age Bracket | Male | Female |
| Under 5 Years | 33 (100.0%) | 22 (43.1%) |
| 5 Years | 0 (0.0%) | 0 (0.0%) |
| 6 to 11 Years | 69 (67.6%) | 5 (100.0%) |
| 12 to 14 Years | 66 (100.0%) | 38 (56.7%) |
| 15 Years | 7 (100.0%) | 11 (100.0%) |
| 16 and 17 Years | 17 (100.0%) | 38 (100.0%) |
| 18 to 24 Years | 107 (96.4%) | 20 (51.3%) |
| 25 to 34 Years | 213 (92.2%) | 160 (83.3%) |
| 35 to 44 Years | 149 (91.4%) | 106 (88.3%) |
| 45 to 54 Years | 88 (77.2%) | 110 (90.9%) |
| 55 to 64 Years | 295 (94.3%) | 155 (84.7%) |
| 65 to 74 Years | 69 (100.0%) | 92 (100.0%) |
| 75 Years and over | 120 (100.0%) | 195 (96.1%) |
| Total | 1,233 (91.6%) | 952 (84.9%) |
Income Below Poverty Among Married-Couple Families in Carthage
| Children | Above Poverty | Below Poverty |
| No Children | 439 (100.0%) | 0 (0.0%) |
| 1 or 2 Children | 151 (100.0%) | 0 (0.0%) |
| 3 or 4 Children | 26 (100.0%) | 0 (0.0%) |
| 5 or more Children | 0 (0.0%) | 0 (0.0%) |
| Total | 616 (100.0%) | 0 (0.0%) |
Income Below Poverty Among Single-Parent Households in Carthage
According to the poverty data in Carthage, 20.4% or 10 single-father households and 71.2% or 42 single-mother households are living below the poverty line. Among single-father households, those with no children have the highest poverty rate, with 10 households (20.4%) experiencing poverty. Likewise, among single-mother households, those with 3 or 4 children have the highest poverty rate, with 31 households (100.0%) falling below the poverty line.
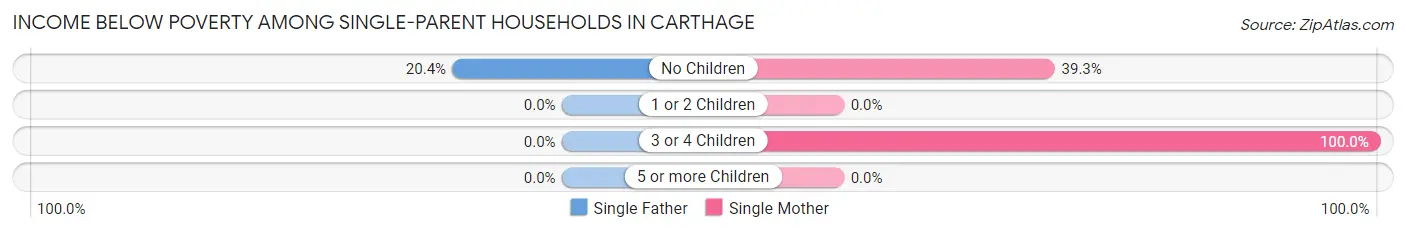
| Children | Single Father | Single Mother |
| No Children | 10 (20.4%) | 11 (39.3%) |
| 1 or 2 Children | 0 (0.0%) | 0 (0.0%) |
| 3 or 4 Children | 0 (0.0%) | 31 (100.0%) |
| 5 or more Children | 0 (0.0%) | 0 (0.0%) |
| Total | 10 (20.4%) | 42 (71.2%) |
Income Below Poverty Among Married-Couple vs Single-Parent Households in Carthage
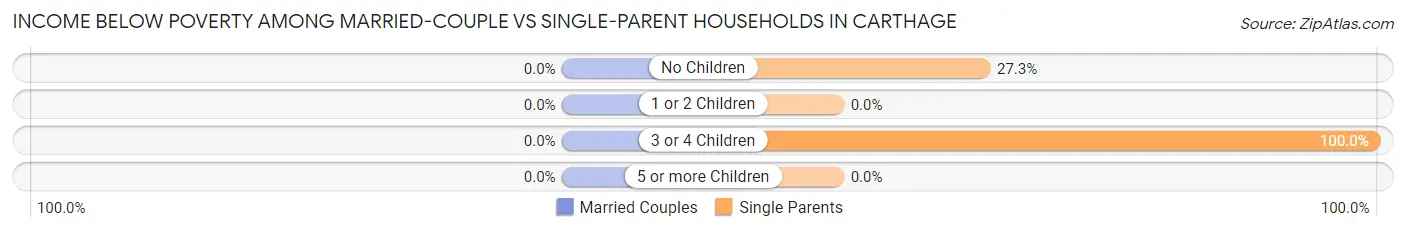
| Children | Married-Couple Families | Single-Parent Households |
| No Children | 0 (0.0%) | 21 (27.3%) |
| 1 or 2 Children | 0 (0.0%) | 0 (0.0%) |
| 3 or 4 Children | 0 (0.0%) | 31 (100.0%) |
| 5 or more Children | 0 (0.0%) | 0 (0.0%) |
| Total | 0 (0.0%) | 52 (48.1%) |
Race in Carthage
The most populous races in Carthage are White / Caucasian (2,307 | 90.1%), Two or more Races (136 | 5.3%), and Hispanic or Latino (105 | 4.1%).
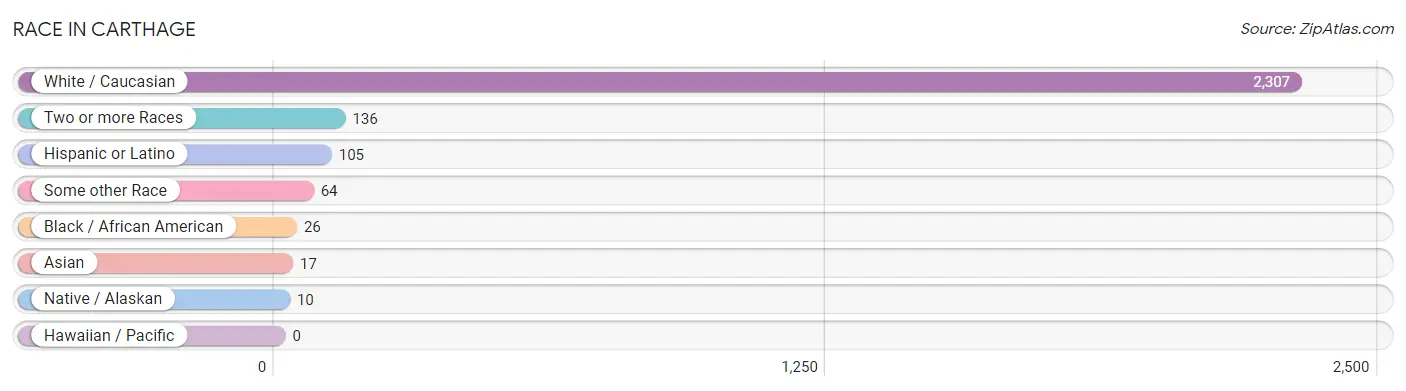
| Race | # Population | % Population |
| Asian | 17 | 0.7% |
| Black / African American | 26 | 1.0% |
| Hawaiian / Pacific | 0 | 0.0% |
| Hispanic or Latino | 105 | 4.1% |
| Native / Alaskan | 10 | 0.4% |
| White / Caucasian | 2,307 | 90.1% |
| Two or more Races | 136 | 5.3% |
| Some other Race | 64 | 2.5% |
| Total | 2,560 | 100.0% |
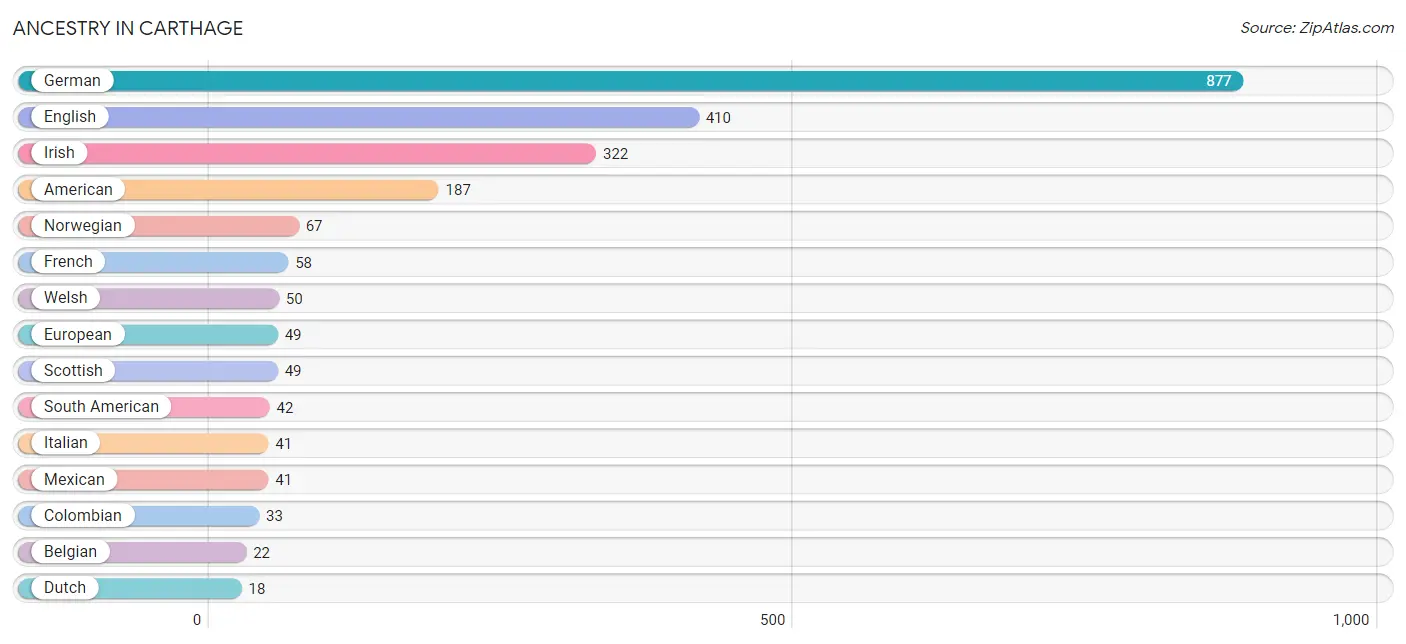
Ancestry in Carthage
The most populous ancestries reported in Carthage are German (877 | 34.3%), English (410 | 16.0%), Irish (322 | 12.6%), American (187 | 7.3%), and Norwegian (67 | 2.6%), together accounting for 72.8% of all Carthage residents.
| Ancestry | # Population | % Population |
| American | 187 | 7.3% |
| Arab | 12 | 0.5% |
| Belgian | 22 | 0.9% |
| Bhutanese | 5 | 0.2% |
| British | 11 | 0.4% |
| Central American | 14 | 0.5% |
| Colombian | 33 | 1.3% |
| Danish | 11 | 0.4% |
| Dutch | 18 | 0.7% |
| Ecuadorian | 9 | 0.4% |
| English | 410 | 16.0% |
| European | 49 | 1.9% |
| French | 58 | 2.3% |
| French Canadian | 5 | 0.2% |
| German | 877 | 34.3% |
| Greek | 16 | 0.6% |
| Guatemalan | 4 | 0.2% |
| Honduran | 10 | 0.4% |
| Irish | 322 | 12.6% |
| Italian | 41 | 1.6% |
| Korean | 16 | 0.6% |
| Mexican | 41 | 1.6% |
| Norwegian | 67 | 2.6% |
| Osage | 10 | 0.4% |
| Scandinavian | 6 | 0.2% |
| Scotch-Irish | 16 | 0.6% |
| Scottish | 49 | 1.9% |
| South American | 42 | 1.6% |
| Swedish | 13 | 0.5% |
| Thai | 12 | 0.5% |
| Welsh | 50 | 1.9% |
| Yugoslavian | 1 | 0.0% | View All 32 Rows |
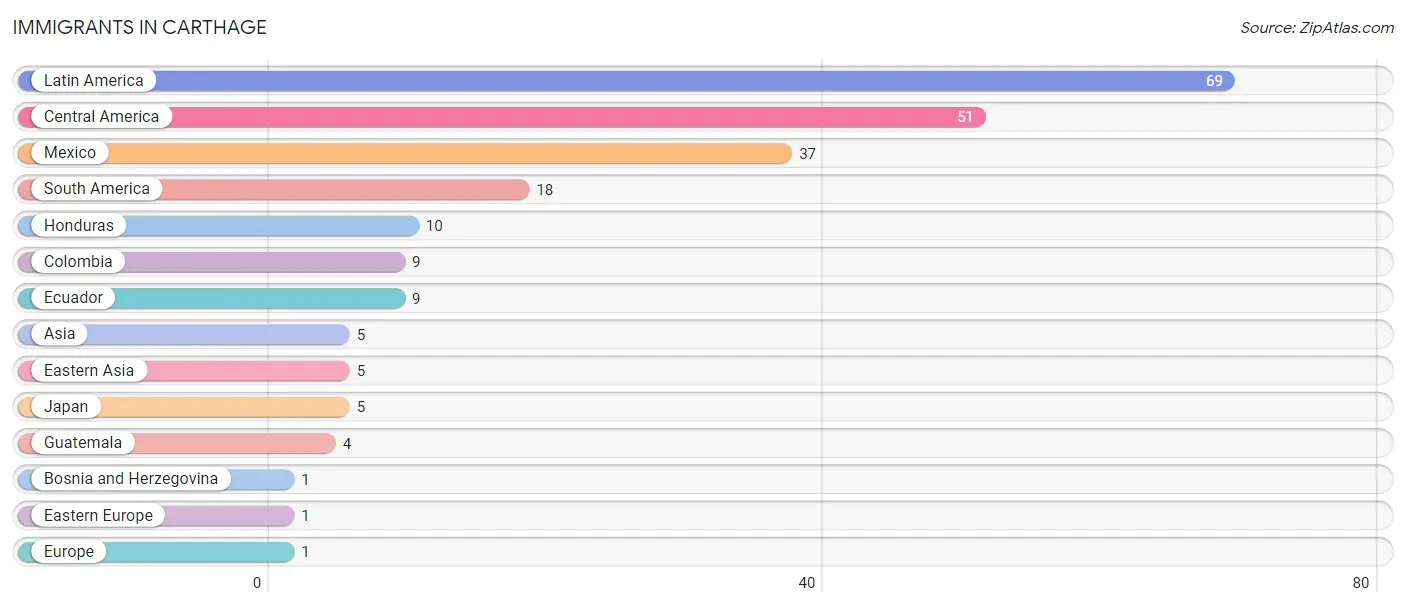
Immigrants in Carthage
The most numerous immigrant groups reported in Carthage came from Latin America (69 | 2.7%), Central America (51 | 2.0%), Mexico (37 | 1.5%), South America (18 | 0.7%), and Honduras (10 | 0.4%), together accounting for 7.2% of all Carthage residents.
| Immigration Origin | # Population | % Population |
| Asia | 5 | 0.2% |
| Bosnia and Herzegovina | 1 | 0.0% |
| Central America | 51 | 2.0% |
| Colombia | 9 | 0.4% |
| Eastern Asia | 5 | 0.2% |
| Eastern Europe | 1 | 0.0% |
| Ecuador | 9 | 0.4% |
| Europe | 1 | 0.0% |
| Guatemala | 4 | 0.2% |
| Honduras | 10 | 0.4% |
| Japan | 5 | 0.2% |
| Latin America | 69 | 2.7% |
| Mexico | 37 | 1.5% |
| South America | 18 | 0.7% | View All 14 Rows |
Sex and Age in Carthage
Sex and Age in Carthage
The most populous age groups in Carthage are 30 to 34 Years (189 | 13.3%) for men and 55 to 59 Years (133 | 11.7%) for women.
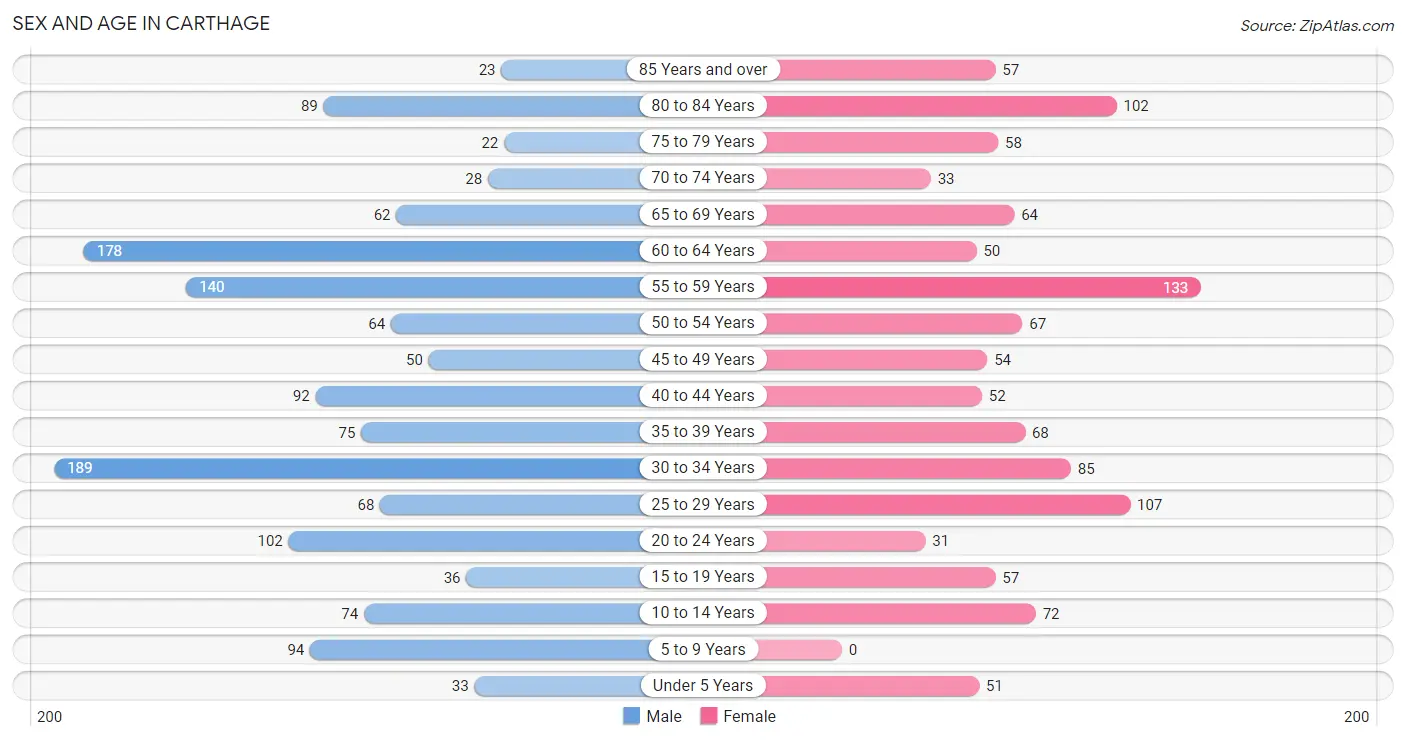
| Age Bracket | Male | Female |
| Under 5 Years | 33 (2.3%) | 51 (4.5%) |
| 5 to 9 Years | 94 (6.6%) | 0 (0.0%) |
| 10 to 14 Years | 74 (5.2%) | 72 (6.3%) |
| 15 to 19 Years | 36 (2.5%) | 57 (5.0%) |
| 20 to 24 Years | 102 (7.2%) | 31 (2.7%) |
| 25 to 29 Years | 68 (4.8%) | 107 (9.4%) |
| 30 to 34 Years | 189 (13.3%) | 85 (7.4%) |
| 35 to 39 Years | 75 (5.3%) | 68 (6.0%) |
| 40 to 44 Years | 92 (6.5%) | 52 (4.6%) |
| 45 to 49 Years | 50 (3.5%) | 54 (4.7%) |
| 50 to 54 Years | 64 (4.5%) | 67 (5.9%) |
| 55 to 59 Years | 140 (9.9%) | 133 (11.7%) |
| 60 to 64 Years | 178 (12.5%) | 50 (4.4%) |
| 65 to 69 Years | 62 (4.4%) | 64 (5.6%) |
| 70 to 74 Years | 28 (2.0%) | 33 (2.9%) |
| 75 to 79 Years | 22 (1.5%) | 58 (5.1%) |
| 80 to 84 Years | 89 (6.3%) | 102 (8.9%) |
| 85 Years and over | 23 (1.6%) | 57 (5.0%) |
| Total | 1,419 (100.0%) | 1,141 (100.0%) |
Families and Households in Carthage
Median Family Size in Carthage
The median family size in Carthage is 2.54 persons per family, with single female/mother families (59 | 8.2%) accounting for the largest median family size of 3.19 persons per family. On the other hand, single male/father families (49 | 6.8%) represent the smallest median family size with 2.14 persons per family.
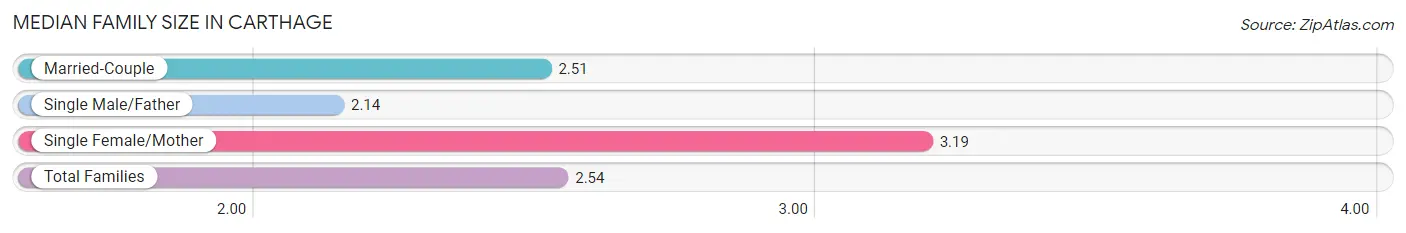
| Family Type | # Families | Family Size |
| Married-Couple | 616 (85.1%) | 2.51 |
| Single Male/Father | 49 (6.8%) | 2.14 |
| Single Female/Mother | 59 (8.2%) | 3.19 |
| Total Families | 724 (100.0%) | 2.54 |
Median Household Size in Carthage
The median household size in Carthage is 1.96 persons per household, with single female/mother households (59 | 4.7%) accounting for the largest median household size of 3.37 persons per household. non-family households (528 | 42.2%) represent the smallest median household size with 1.12 persons per household.
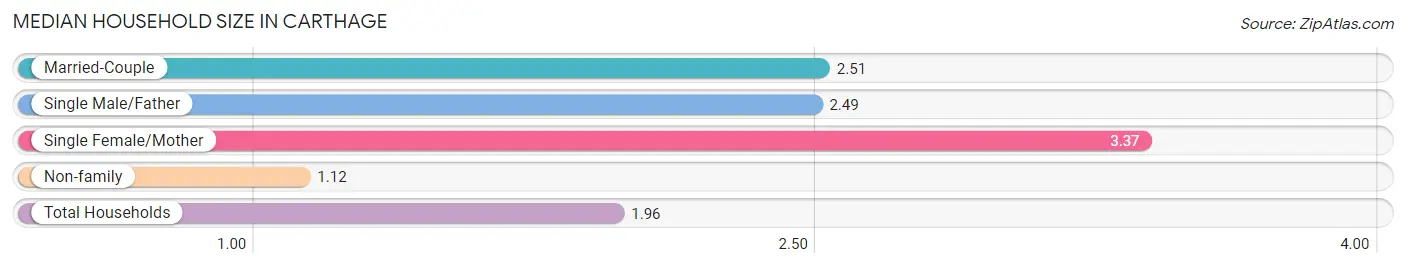
| Household Type | # Households | Household Size |
| Married-Couple | 616 (49.2%) | 2.51 |
| Single Male/Father | 49 (3.9%) | 2.49 |
| Single Female/Mother | 59 (4.7%) | 3.37 |
| Non-family | 528 (42.2%) | 1.12 |
| Total Households | 1,252 (100.0%) | 1.96 |
Household Size by Marriage Status in Carthage
Out of a total of 1,252 households in Carthage, 724 (57.8%) are family households, while 528 (42.2%) are nonfamily households. The most numerous type of family households are 2-person households, comprising 463, and the most common type of nonfamily households are 1-person households, comprising 482.
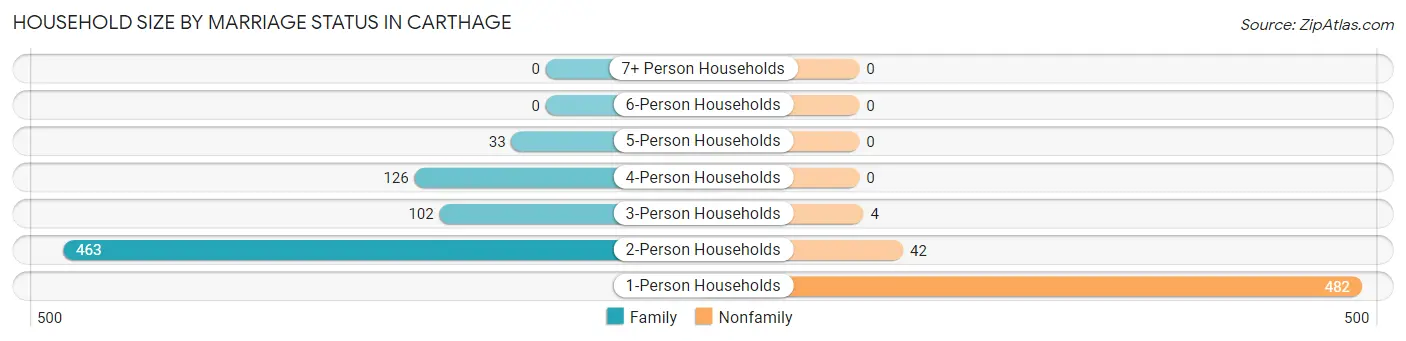
| Household Size | Family Households | Nonfamily Households |
| 1-Person Households | - | 482 (38.5%) |
| 2-Person Households | 463 (37.0%) | 42 (3.4%) |
| 3-Person Households | 102 (8.2%) | 4 (0.3%) |
| 4-Person Households | 126 (10.1%) | 0 (0.0%) |
| 5-Person Households | 33 (2.6%) | 0 (0.0%) |
| 6-Person Households | 0 (0.0%) | 0 (0.0%) |
| 7+ Person Households | 0 (0.0%) | 0 (0.0%) |
| Total | 724 (57.8%) | 528 (42.2%) |
Female Fertility in Carthage
Fertility by Age in Carthage
Average fertility rate in Carthage is 71.0 births per 1,000 women. Women in the age bracket of 20 to 34 years have the highest fertility rate with 103.0 births per 1,000 women. Women in the age bracket of 20 to 34 years acount for 69.7% of all women with births.
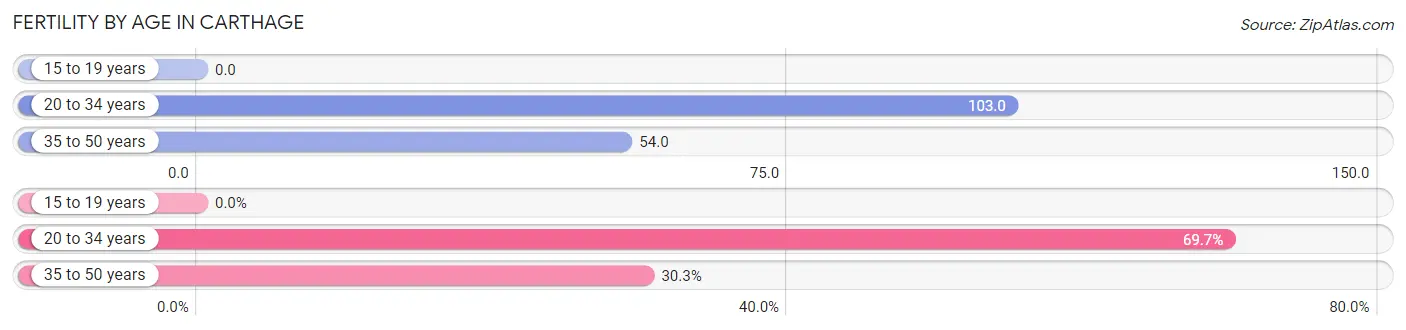
| Age Bracket | Women with Births | Births / 1,000 Women |
| 15 to 19 years | 0 (0.0%) | 0.0 |
| 20 to 34 years | 23 (69.7%) | 103.0 |
| 35 to 50 years | 10 (30.3%) | 54.0 |
| Total | 33 (100.0%) | 71.0 |
Fertility by Age by Marriage Status in Carthage
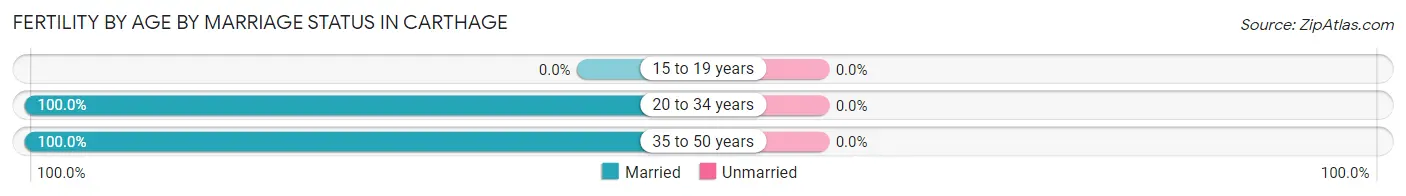
| Age Bracket | Married | Unmarried |
| 15 to 19 years | 0 (0.0%) | 0 (0.0%) |
| 20 to 34 years | 23 (100.0%) | 0 (0.0%) |
| 35 to 50 years | 10 (100.0%) | 0 (0.0%) |
| Total | 33 (100.0%) | 0 (0.0%) |
Fertility by Education in Carthage
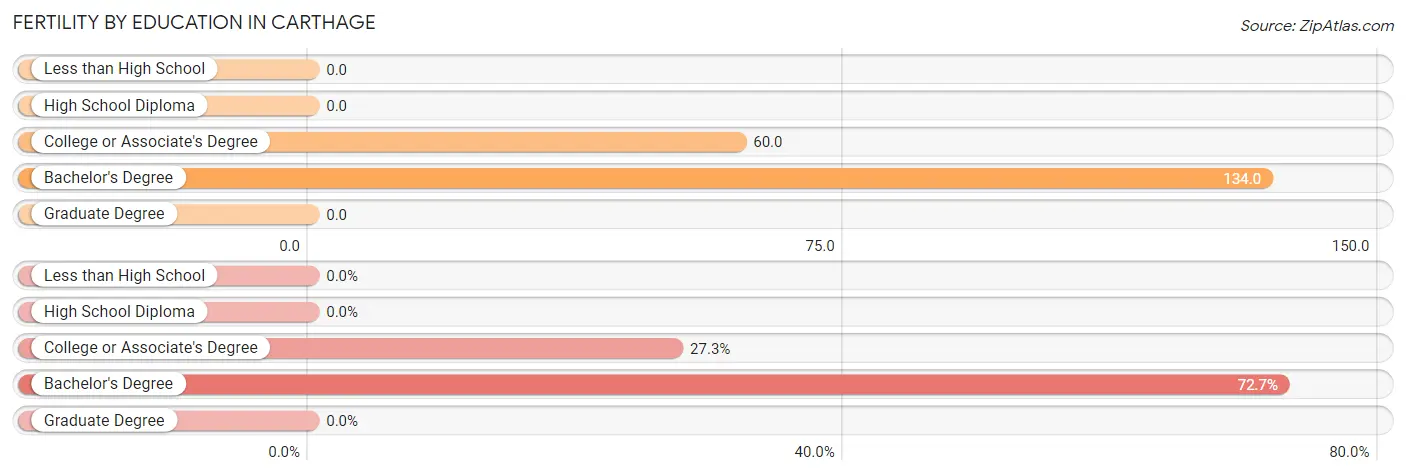
| Educational Attainment | Women with Births | Births / 1,000 Women |
| Less than High School | 0 (0.0%) | 0.0 |
| High School Diploma | 0 (0.0%) | 0.0 |
| College or Associate's Degree | 9 (27.3%) | 60.0 |
| Bachelor's Degree | 24 (72.7%) | 134.0 |
| Graduate Degree | 0 (0.0%) | 0.0 |
| Total | 33 (100.0%) | 71.0 |
Fertility by Education by Marriage Status in Carthage
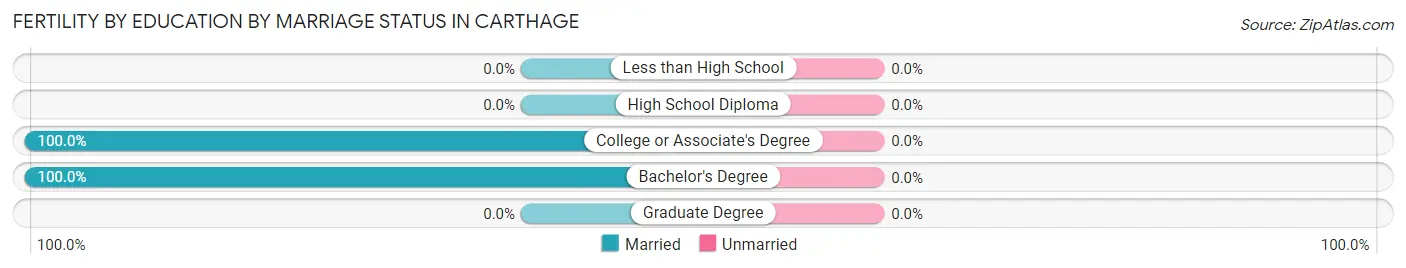
| Educational Attainment | Married | Unmarried |
| Less than High School | 0 (0.0%) | 0 (0.0%) |
| High School Diploma | 0 (0.0%) | 0 (0.0%) |
| College or Associate's Degree | 9 (100.0%) | 0 (0.0%) |
| Bachelor's Degree | 24 (100.0%) | 0 (0.0%) |
| Graduate Degree | 0 (0.0%) | 0 (0.0%) |
| Total | 33 (100.0%) | 0 (0.0%) |
Employment Characteristics in Carthage
Employment by Class of Employer in Carthage
Among the 1,466 employed individuals in Carthage, private company employees (922 | 62.9%), local government employees (195 | 13.3%), and self-employed (not incorporated) (151 | 10.3%) make up the most common classes of employment.
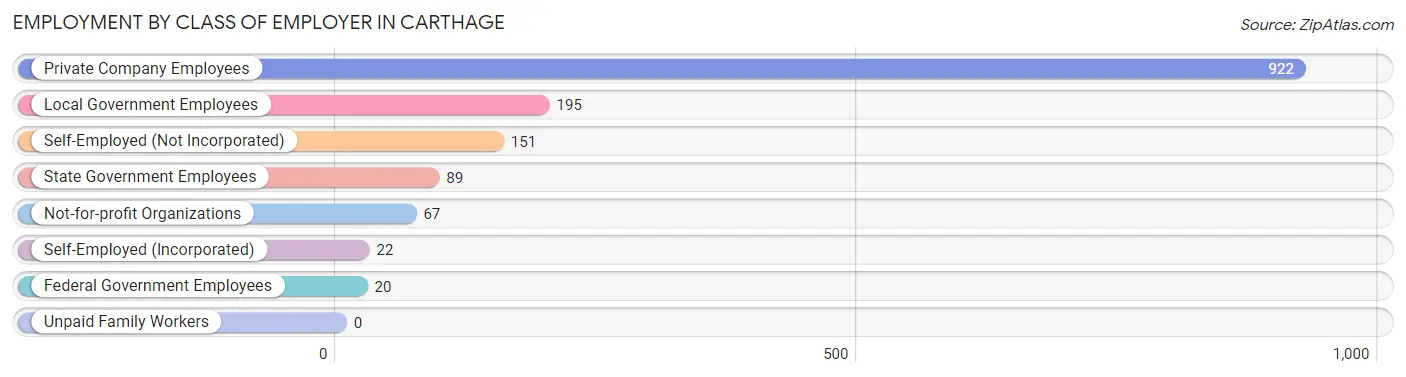
| Employer Class | # Employees | % Employees |
| Private Company Employees | 922 | 62.9% |
| Self-Employed (Incorporated) | 22 | 1.5% |
| Self-Employed (Not Incorporated) | 151 | 10.3% |
| Not-for-profit Organizations | 67 | 4.6% |
| Local Government Employees | 195 | 13.3% |
| State Government Employees | 89 | 6.1% |
| Federal Government Employees | 20 | 1.4% |
| Unpaid Family Workers | 0 | 0.0% |
| Total | 1,466 | 100.0% |
Employment Status by Age in Carthage
According to the labor force statistics for Carthage, out of the total population over 16 years of age (2,218), 68.2% or 1,513 individuals are in the labor force, with 1.3% or 20 of them unemployed. The age group with the highest labor force participation rate is 35 to 44 years, with 93.7% or 269 individuals in the labor force. Within the labor force, the 16 to 19 years age range has the highest percentage of unemployed individuals, with 8.3% or 4 of them being unemployed.
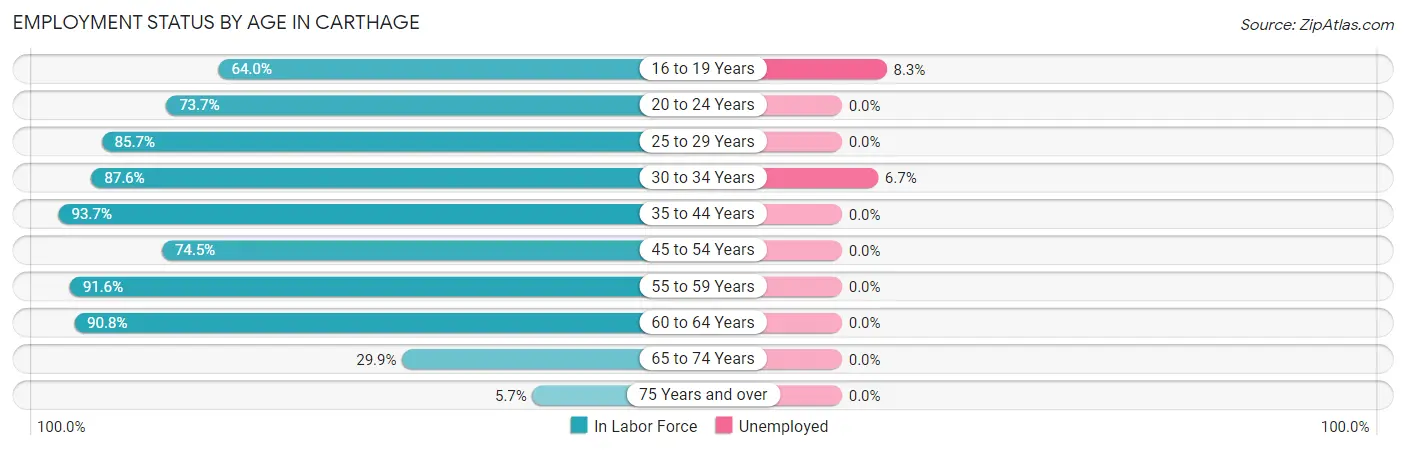
| Age Bracket | In Labor Force | Unemployed |
| 16 to 19 Years | 48 (64.0%) | 4 (8.3%) |
| 20 to 24 Years | 98 (73.7%) | 0 (0.0%) |
| 25 to 29 Years | 150 (85.7%) | 0 (0.0%) |
| 30 to 34 Years | 240 (87.6%) | 16 (6.7%) |
| 35 to 44 Years | 269 (93.7%) | 0 (0.0%) |
| 45 to 54 Years | 175 (74.5%) | 0 (0.0%) |
| 55 to 59 Years | 250 (91.6%) | 0 (0.0%) |
| 60 to 64 Years | 207 (90.8%) | 0 (0.0%) |
| 65 to 74 Years | 56 (29.9%) | 0 (0.0%) |
| 75 Years and over | 20 (5.7%) | 0 (0.0%) |
| Total | 1,513 (68.2%) | 20 (1.3%) |
Employment Status by Educational Attainment in Carthage
According to labor force statistics for Carthage, 87.7% of individuals (1,291) out of the total population between 25 and 64 years of age (1,472) are in the labor force, with 1.2% or 15 of them being unemployed. The group with the highest labor force participation rate are those with the educational attainment of bachelor's degree or higher, with 97.3% or 545 individuals in the labor force. Within the labor force, individuals with high school diploma education have the highest percentage of unemployment, with 5.6% or 16 of them being unemployed.
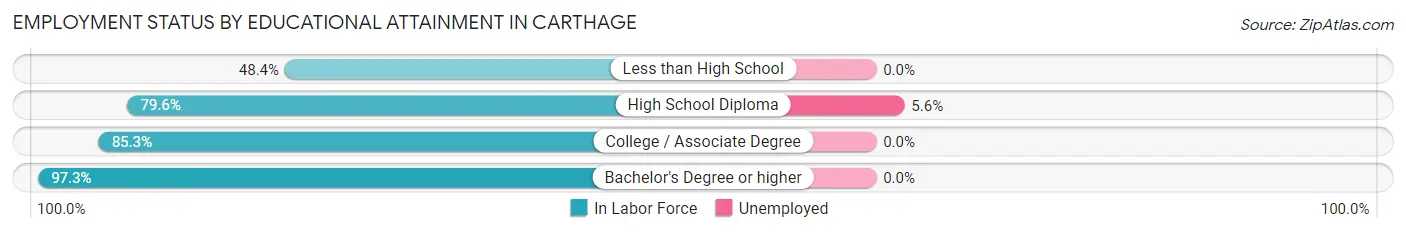
| Educational Attainment | In Labor Force | Unemployed |
| Less than High School | 15 (48.4%) | 0 (0.0%) |
| High School Diploma | 284 (79.6%) | 20 (5.6%) |
| College / Associate Degree | 447 (85.3%) | 0 (0.0%) |
| Bachelor's Degree or higher | 545 (97.3%) | 0 (0.0%) |
| Total | 1,291 (87.7%) | 18 (1.2%) |
Employment Occupations by Sex in Carthage
Management, Business, Science and Arts Occupations
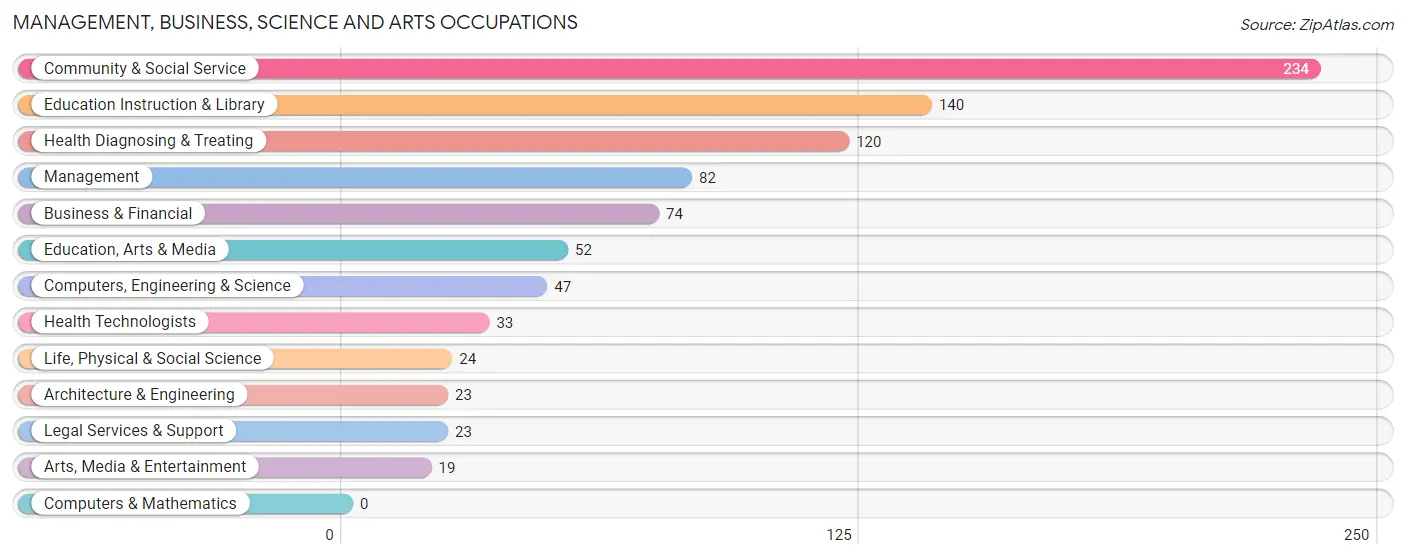
The most common Management, Business, Science and Arts occupations in Carthage are Community & Social Service (234 | 15.7%), Education Instruction & Library (140 | 9.4%), Health Diagnosing & Treating (120 | 8.0%), Management (82 | 5.5%), and Business & Financial (74 | 5.0%).
Management, Business, Science and Arts Occupations by Sex
Within the Management, Business, Science and Arts occupations in Carthage, the most male-oriented occupations are Architecture & Engineering (100.0%), Arts, Media & Entertainment (100.0%), and Education, Arts & Media (76.9%), while the most female-oriented occupations are Life, Physical & Social Science (100.0%), Education Instruction & Library (100.0%), and Health Technologists (100.0%).
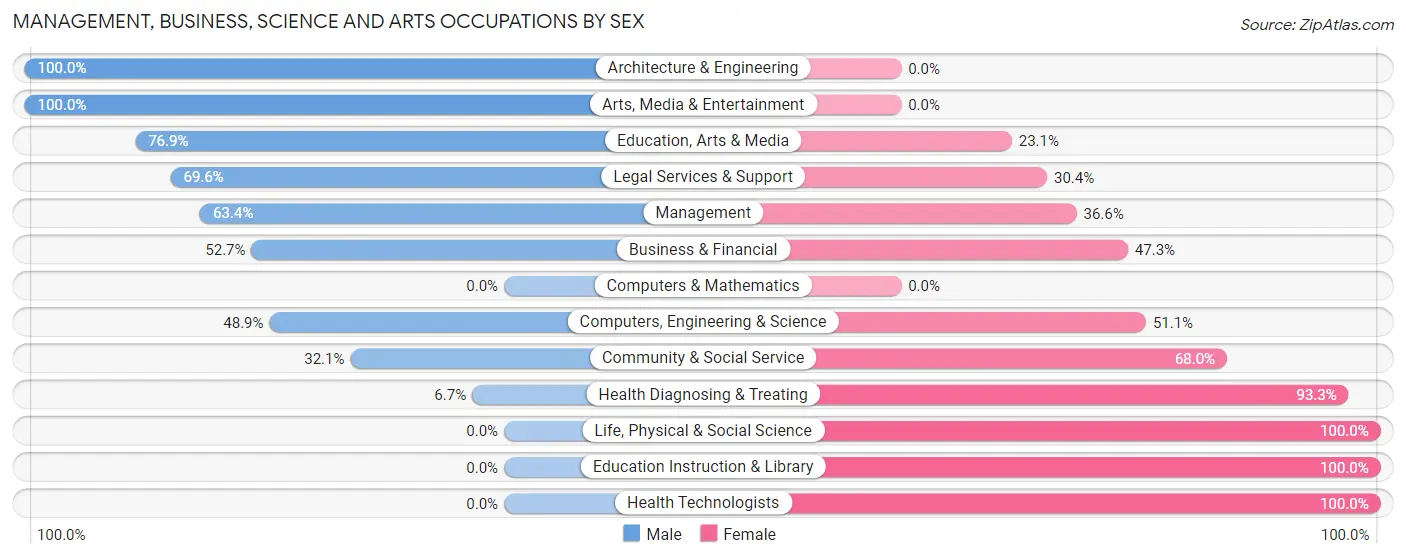
| Occupation | Male | Female |
| Management | 52 (63.4%) | 30 (36.6%) |
| Business & Financial | 39 (52.7%) | 35 (47.3%) |
| Computers, Engineering & Science | 23 (48.9%) | 24 (51.1%) |
| Computers & Mathematics | 0 (0.0%) | 0 (0.0%) |
| Architecture & Engineering | 23 (100.0%) | 0 (0.0%) |
| Life, Physical & Social Science | 0 (0.0%) | 24 (100.0%) |
| Community & Social Service | 75 (32.1%) | 159 (67.9%) |
| Education, Arts & Media | 40 (76.9%) | 12 (23.1%) |
| Legal Services & Support | 16 (69.6%) | 7 (30.4%) |
| Education Instruction & Library | 0 (0.0%) | 140 (100.0%) |
| Arts, Media & Entertainment | 19 (100.0%) | 0 (0.0%) |
| Health Diagnosing & Treating | 8 (6.7%) | 112 (93.3%) |
| Health Technologists | 0 (0.0%) | 33 (100.0%) |
| Total (Category) | 197 (35.4%) | 360 (64.6%) |
| Total (Overall) | 877 (58.7%) | 616 (41.3%) |
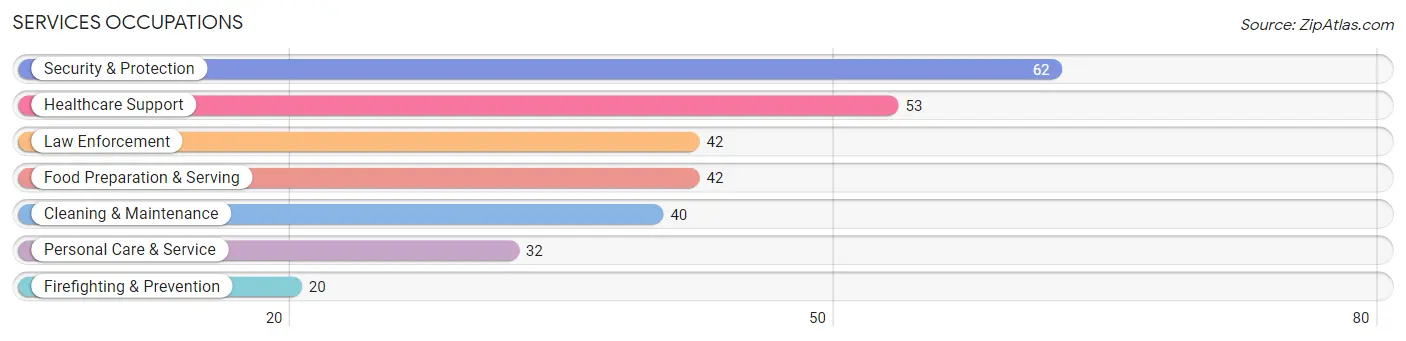
Services Occupations
The most common Services occupations in Carthage are Security & Protection (62 | 4.2%), Healthcare Support (53 | 3.5%), Law Enforcement (42 | 2.8%), Food Preparation & Serving (42 | 2.8%), and Cleaning & Maintenance (40 | 2.7%).
Services Occupations by Sex
Within the Services occupations in Carthage, the most male-oriented occupations are Firefighting & Prevention (100.0%), Security & Protection (88.7%), and Law Enforcement (83.3%), while the most female-oriented occupations are Food Preparation & Serving (83.3%), Healthcare Support (75.5%), and Personal Care & Service (50.0%).
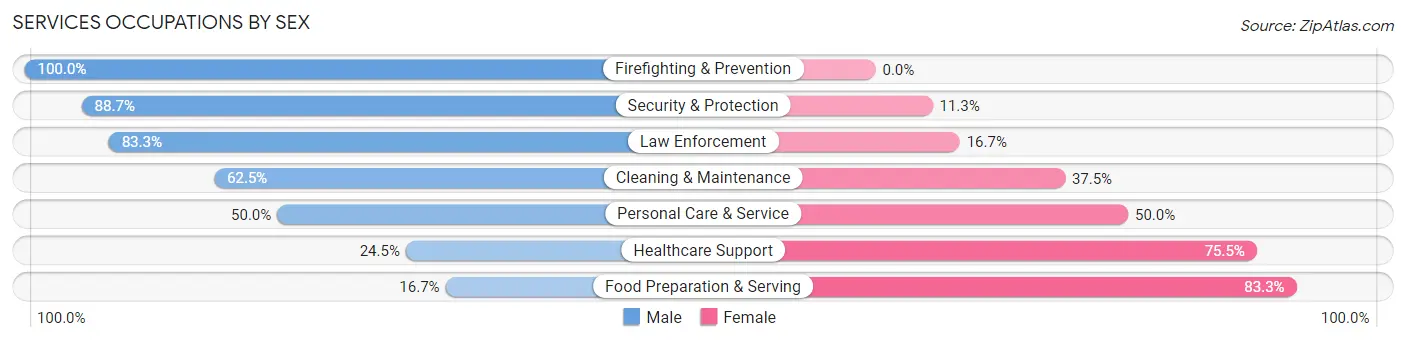
| Occupation | Male | Female |
| Healthcare Support | 13 (24.5%) | 40 (75.5%) |
| Security & Protection | 55 (88.7%) | 7 (11.3%) |
| Firefighting & Prevention | 20 (100.0%) | 0 (0.0%) |
| Law Enforcement | 35 (83.3%) | 7 (16.7%) |
| Food Preparation & Serving | 7 (16.7%) | 35 (83.3%) |
| Cleaning & Maintenance | 25 (62.5%) | 15 (37.5%) |
| Personal Care & Service | 16 (50.0%) | 16 (50.0%) |
| Total (Category) | 116 (50.7%) | 113 (49.3%) |
| Total (Overall) | 877 (58.7%) | 616 (41.3%) |
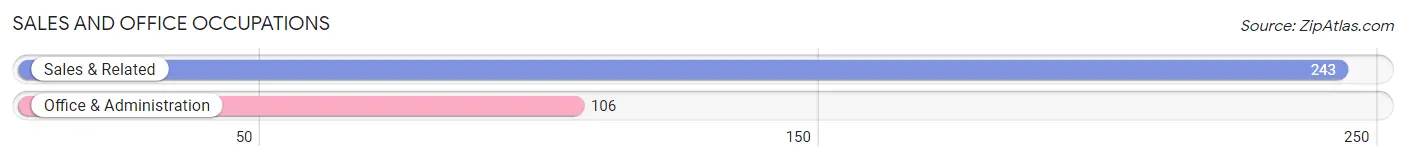
Sales and Office Occupations
The most common Sales and Office occupations in Carthage are Sales & Related (243 | 16.3%), and Office & Administration (106 | 7.1%).
Sales and Office Occupations by Sex
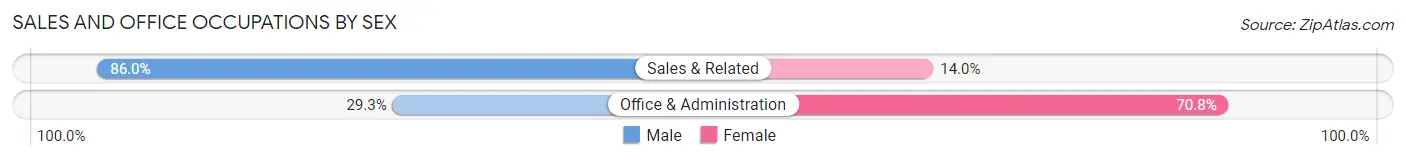
| Occupation | Male | Female |
| Sales & Related | 209 (86.0%) | 34 (14.0%) |
| Office & Administration | 31 (29.2%) | 75 (70.8%) |
| Total (Category) | 240 (68.8%) | 109 (31.2%) |
| Total (Overall) | 877 (58.7%) | 616 (41.3%) |
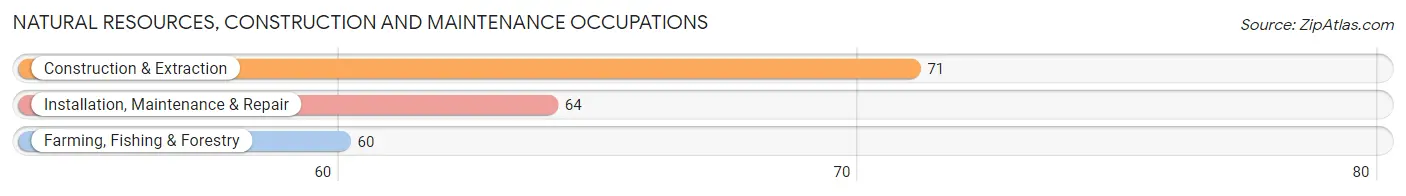
Natural Resources, Construction and Maintenance Occupations
The most common Natural Resources, Construction and Maintenance occupations in Carthage are Construction & Extraction (71 | 4.8%), Installation, Maintenance & Repair (64 | 4.3%), and Farming, Fishing & Forestry (60 | 4.0%).
Natural Resources, Construction and Maintenance Occupations by Sex
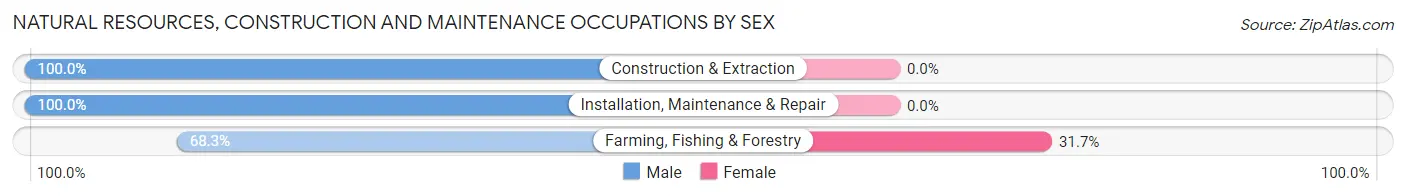
| Occupation | Male | Female |
| Farming, Fishing & Forestry | 41 (68.3%) | 19 (31.7%) |
| Construction & Extraction | 71 (100.0%) | 0 (0.0%) |
| Installation, Maintenance & Repair | 64 (100.0%) | 0 (0.0%) |
| Total (Category) | 176 (90.3%) | 19 (9.7%) |
| Total (Overall) | 877 (58.7%) | 616 (41.3%) |
Production, Transportation and Moving Occupations
The most common Production, Transportation and Moving occupations in Carthage are Production (69 | 4.6%), Material Moving (69 | 4.6%), and Transportation (25 | 1.7%).
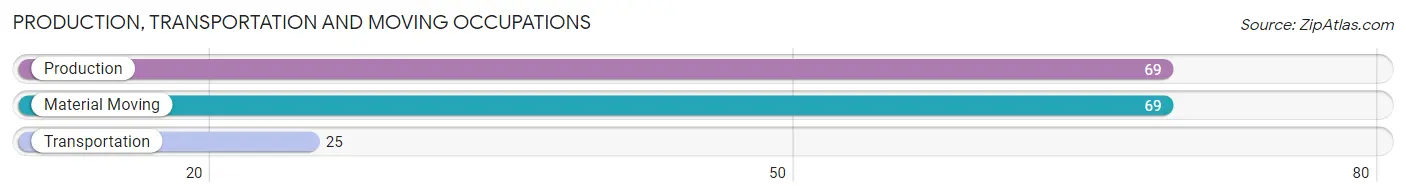
Production, Transportation and Moving Occupations by Sex
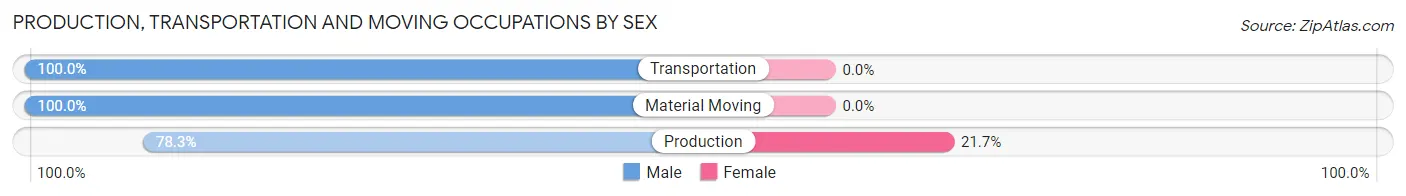
| Occupation | Male | Female |
| Production | 54 (78.3%) | 15 (21.7%) |
| Transportation | 25 (100.0%) | 0 (0.0%) |
| Material Moving | 69 (100.0%) | 0 (0.0%) |
| Total (Category) | 148 (90.8%) | 15 (9.2%) |
| Total (Overall) | 877 (58.7%) | 616 (41.3%) |
Employment Industries by Sex in Carthage
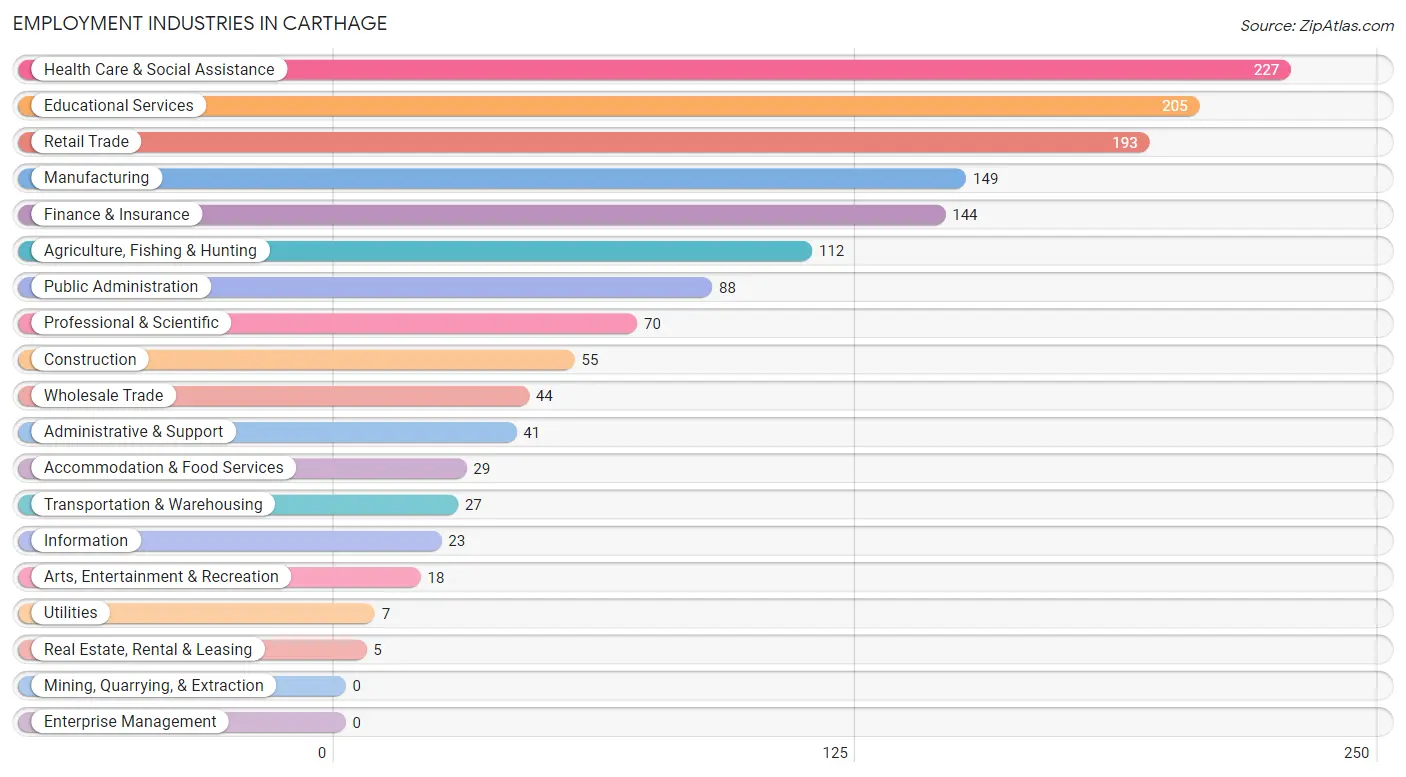
Employment Industries in Carthage
The major employment industries in Carthage include Health Care & Social Assistance (227 | 15.2%), Educational Services (205 | 13.7%), Retail Trade (193 | 12.9%), Manufacturing (149 | 10.0%), and Finance & Insurance (144 | 9.7%).
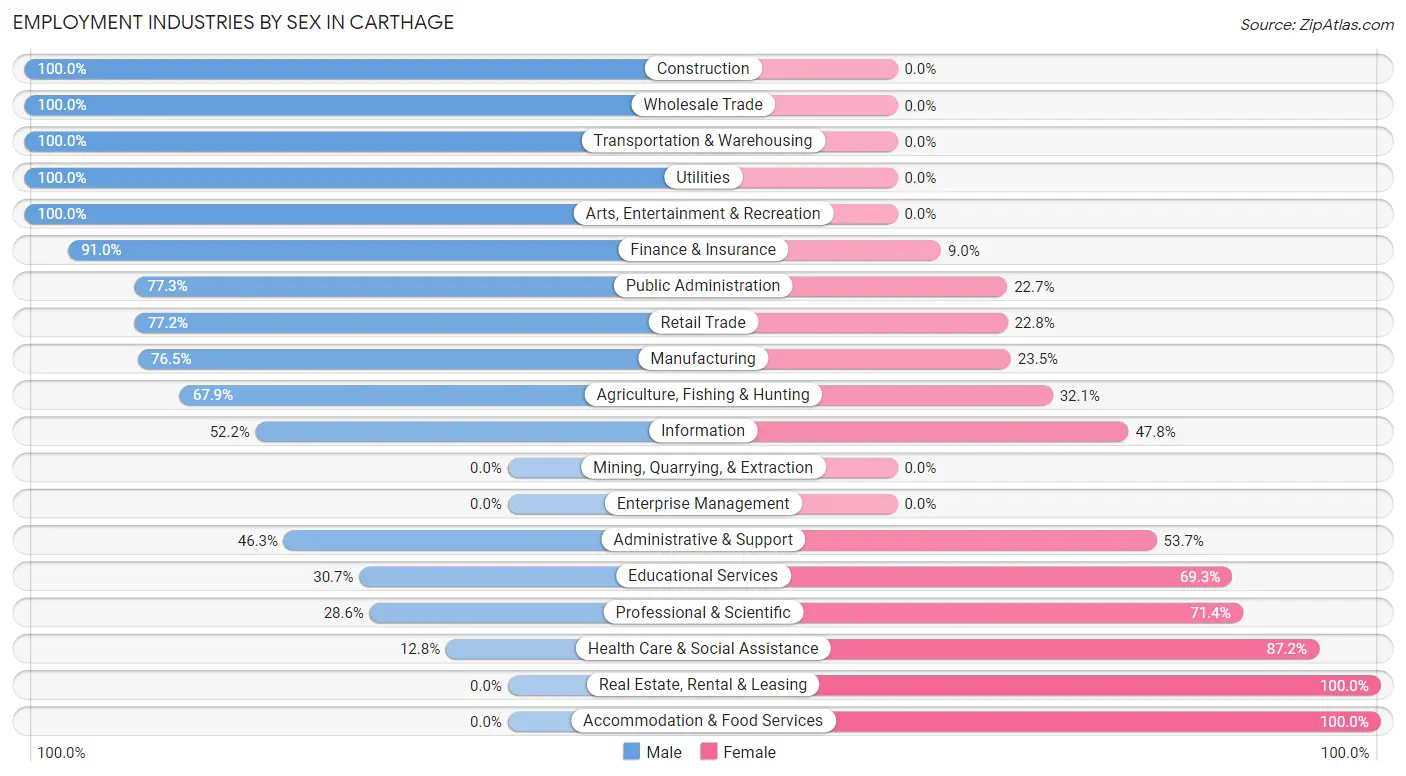
Employment Industries by Sex in Carthage
The Carthage industries that see more men than women are Construction (100.0%), Wholesale Trade (100.0%), and Transportation & Warehousing (100.0%), whereas the industries that tend to have a higher number of women are Real Estate, Rental & Leasing (100.0%), Accommodation & Food Services (100.0%), and Health Care & Social Assistance (87.2%).
| Industry | Male | Female |
| Agriculture, Fishing & Hunting | 76 (67.9%) | 36 (32.1%) |
| Mining, Quarrying, & Extraction | 0 (0.0%) | 0 (0.0%) |
| Construction | 55 (100.0%) | 0 (0.0%) |
| Manufacturing | 114 (76.5%) | 35 (23.5%) |
| Wholesale Trade | 44 (100.0%) | 0 (0.0%) |
| Retail Trade | 149 (77.2%) | 44 (22.8%) |
| Transportation & Warehousing | 27 (100.0%) | 0 (0.0%) |
| Utilities | 7 (100.0%) | 0 (0.0%) |
| Information | 12 (52.2%) | 11 (47.8%) |
| Finance & Insurance | 131 (91.0%) | 13 (9.0%) |
| Real Estate, Rental & Leasing | 0 (0.0%) | 5 (100.0%) |
| Professional & Scientific | 20 (28.6%) | 50 (71.4%) |
| Enterprise Management | 0 (0.0%) | 0 (0.0%) |
| Administrative & Support | 19 (46.3%) | 22 (53.7%) |
| Educational Services | 63 (30.7%) | 142 (69.3%) |
| Health Care & Social Assistance | 29 (12.8%) | 198 (87.2%) |
| Arts, Entertainment & Recreation | 18 (100.0%) | 0 (0.0%) |
| Accommodation & Food Services | 0 (0.0%) | 29 (100.0%) |
| Public Administration | 68 (77.3%) | 20 (22.7%) |
| Total | 877 (58.7%) | 616 (41.3%) |
Education in Carthage
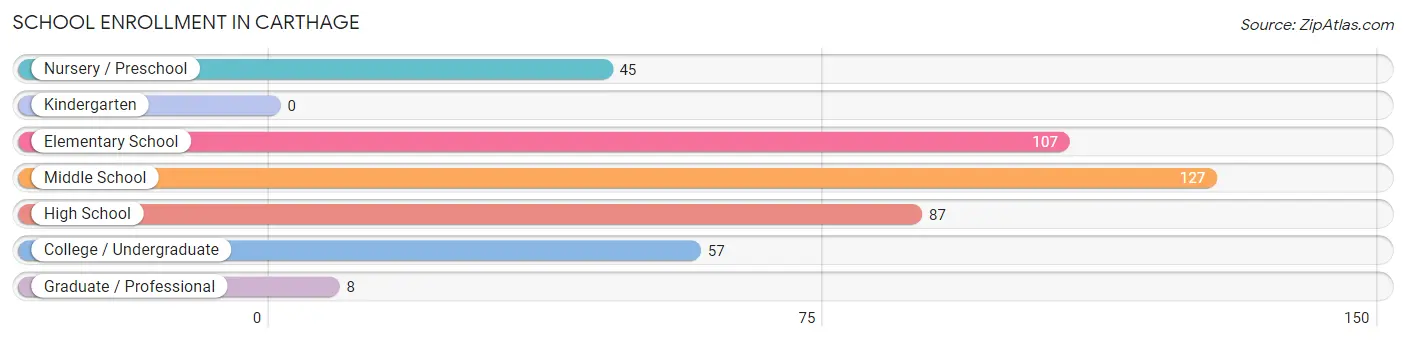
School Enrollment in Carthage
The most common levels of schooling among the 431 students in Carthage are middle school (127 | 29.5%), elementary school (107 | 24.8%), and high school (87 | 20.2%).
| School Level | # Students | % Students |
| Nursery / Preschool | 45 | 10.4% |
| Kindergarten | 0 | 0.0% |
| Elementary School | 107 | 24.8% |
| Middle School | 127 | 29.5% |
| High School | 87 | 20.2% |
| College / Undergraduate | 57 | 13.2% |
| Graduate / Professional | 8 | 1.9% |
| Total | 431 | 100.0% |
School Enrollment by Age by Funding Source in Carthage
Out of a total of 431 students who are enrolled in schools in Carthage, 51 (11.8%) attend a private institution, while the remaining 380 (88.2%) are enrolled in public schools. The age group of 18 to 19 year olds has the highest likelihood of being enrolled in private schools, with 11 (57.9% in the age bracket) enrolled. Conversely, the age group of 25 to 34 year olds has the lowest likelihood of being enrolled in a private school, with 17 (100.0% in the age bracket) attending a public institution.
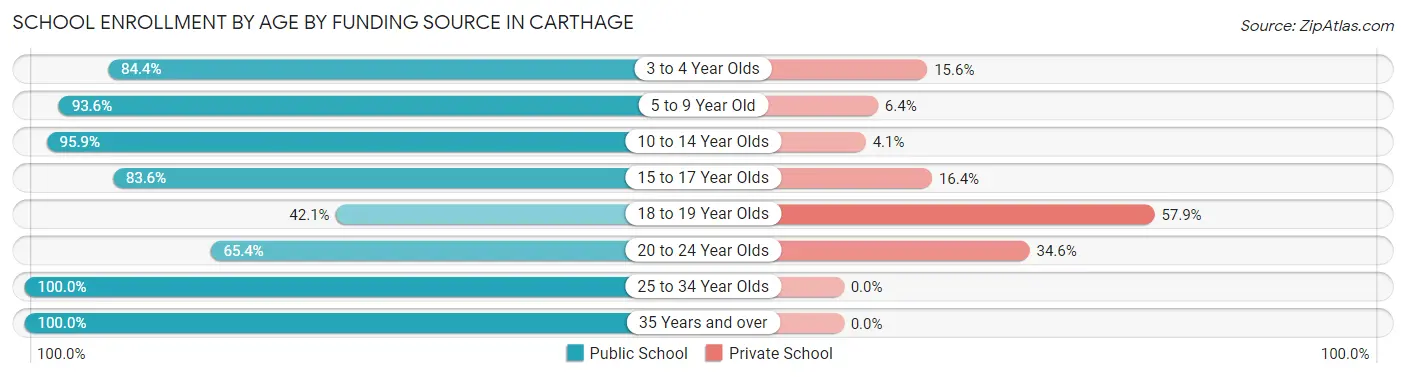
| Age Bracket | Public School | Private School |
| 3 to 4 Year Olds | 38 (84.4%) | 7 (15.6%) |
| 5 to 9 Year Old | 88 (93.6%) | 6 (6.4%) |
| 10 to 14 Year Olds | 140 (95.9%) | 6 (4.1%) |
| 15 to 17 Year Olds | 61 (83.6%) | 12 (16.4%) |
| 18 to 19 Year Olds | 8 (42.1%) | 11 (57.9%) |
| 20 to 24 Year Olds | 17 (65.4%) | 9 (34.6%) |
| 25 to 34 Year Olds | 17 (100.0%) | 0 (0.0%) |
| 35 Years and over | 11 (100.0%) | 0 (0.0%) |
| Total | 380 (88.2%) | 51 (11.8%) |
Educational Attainment by Field of Study in Carthage
Education (237 | 28.9%), business (121 | 14.8%), science & technology (109 | 13.3%), liberal arts & history (108 | 13.2%), and bio, nature & agricultural (80 | 9.8%) are the most common fields of study among 819 individuals in Carthage who have obtained a bachelor's degree or higher.
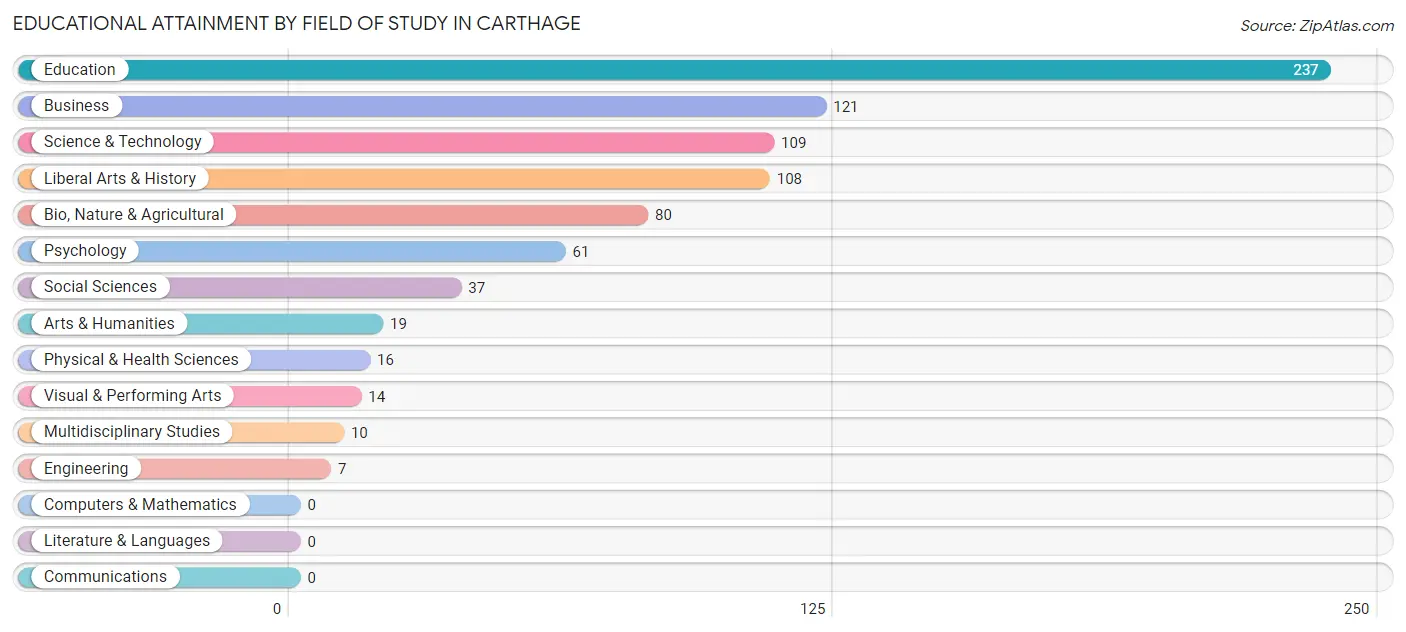
| Field of Study | # Graduates | % Graduates |
| Computers & Mathematics | 0 | 0.0% |
| Bio, Nature & Agricultural | 80 | 9.8% |
| Physical & Health Sciences | 16 | 1.9% |
| Psychology | 61 | 7.4% |
| Social Sciences | 37 | 4.5% |
| Engineering | 7 | 0.9% |
| Multidisciplinary Studies | 10 | 1.2% |
| Science & Technology | 109 | 13.3% |
| Business | 121 | 14.8% |
| Education | 237 | 28.9% |
| Literature & Languages | 0 | 0.0% |
| Liberal Arts & History | 108 | 13.2% |
| Visual & Performing Arts | 14 | 1.7% |
| Communications | 0 | 0.0% |
| Arts & Humanities | 19 | 2.3% |
| Total | 819 | 100.0% |
Transportation & Commute in Carthage
Vehicle Availability by Sex in Carthage
The most prevalent vehicle ownership categories in Carthage are males with 2 vehicles (302, accounting for 35.5%) and females with 2 vehicles (160, making up 49.1%).
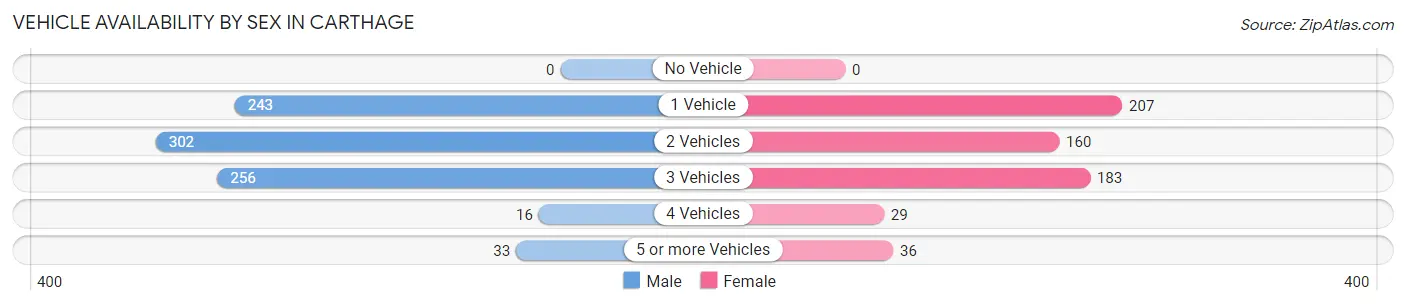
| Vehicles Available | Male | Female |
| No Vehicle | 0 (0.0%) | 0 (0.0%) |
| 1 Vehicle | 243 (28.6%) | 207 (33.7%) |
| 2 Vehicles | 302 (35.5%) | 160 (26.0%) |
| 3 Vehicles | 256 (30.1%) | 183 (29.8%) |
| 4 Vehicles | 16 (1.9%) | 29 (4.7%) |
| 5 or more Vehicles | 33 (3.9%) | 36 (5.9%) |
| Total | 850 (100.0%) | 615 (100.0%) |
Commute Time in Carthage
The most frequently occuring commute durations in Carthage are 5 to 9 minutes (287 commuters, 20.0%), 40 to 44 minutes (186 commuters, 13.0%), and 30 to 34 minutes (185 commuters, 12.9%).
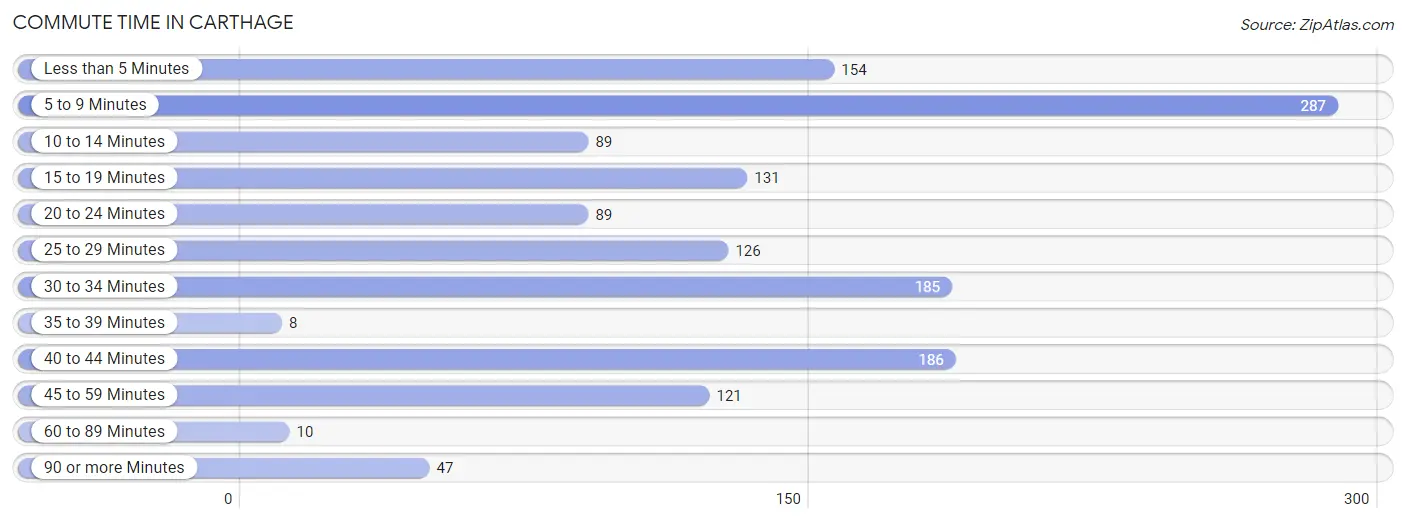
| Commute Time | # Commuters | % Commuters |
| Less than 5 Minutes | 154 | 10.7% |
| 5 to 9 Minutes | 287 | 20.0% |
| 10 to 14 Minutes | 89 | 6.2% |
| 15 to 19 Minutes | 131 | 9.1% |
| 20 to 24 Minutes | 89 | 6.2% |
| 25 to 29 Minutes | 126 | 8.8% |
| 30 to 34 Minutes | 185 | 12.9% |
| 35 to 39 Minutes | 8 | 0.6% |
| 40 to 44 Minutes | 186 | 13.0% |
| 45 to 59 Minutes | 121 | 8.4% |
| 60 to 89 Minutes | 10 | 0.7% |
| 90 or more Minutes | 47 | 3.3% |
Commute Time by Sex in Carthage
The most common commute times in Carthage are 5 to 9 minutes (162 commuters, 19.4%) for males and 5 to 9 minutes (125 commuters, 21.0%) for females.
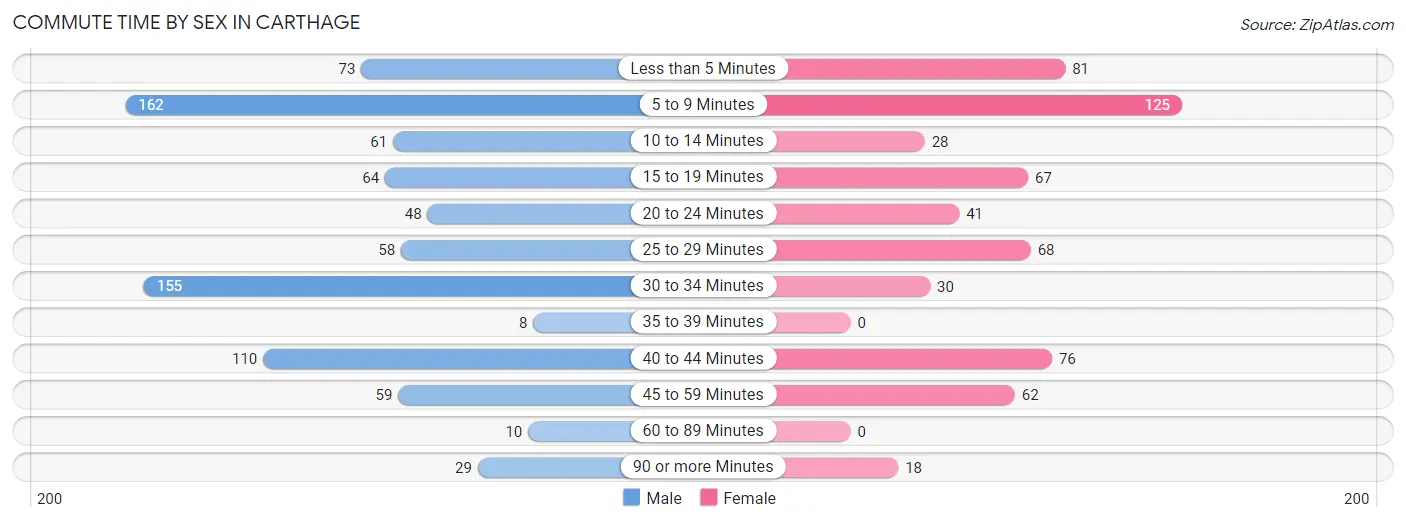
| Commute Time | Male | Female |
| Less than 5 Minutes | 73 (8.7%) | 81 (13.6%) |
| 5 to 9 Minutes | 162 (19.4%) | 125 (21.0%) |
| 10 to 14 Minutes | 61 (7.3%) | 28 (4.7%) |
| 15 to 19 Minutes | 64 (7.6%) | 67 (11.2%) |
| 20 to 24 Minutes | 48 (5.7%) | 41 (6.9%) |
| 25 to 29 Minutes | 58 (6.9%) | 68 (11.4%) |
| 30 to 34 Minutes | 155 (18.5%) | 30 (5.0%) |
| 35 to 39 Minutes | 8 (1.0%) | 0 (0.0%) |
| 40 to 44 Minutes | 110 (13.1%) | 76 (12.8%) |
| 45 to 59 Minutes | 59 (7.0%) | 62 (10.4%) |
| 60 to 89 Minutes | 10 (1.2%) | 0 (0.0%) |
| 90 or more Minutes | 29 (3.5%) | 18 (3.0%) |
Time of Departure to Work by Sex in Carthage
The most frequent times of departure to work in Carthage are 7:00 AM to 7:29 AM (206, 24.6%) for males and 7:30 AM to 7:59 AM (133, 22.3%) for females.
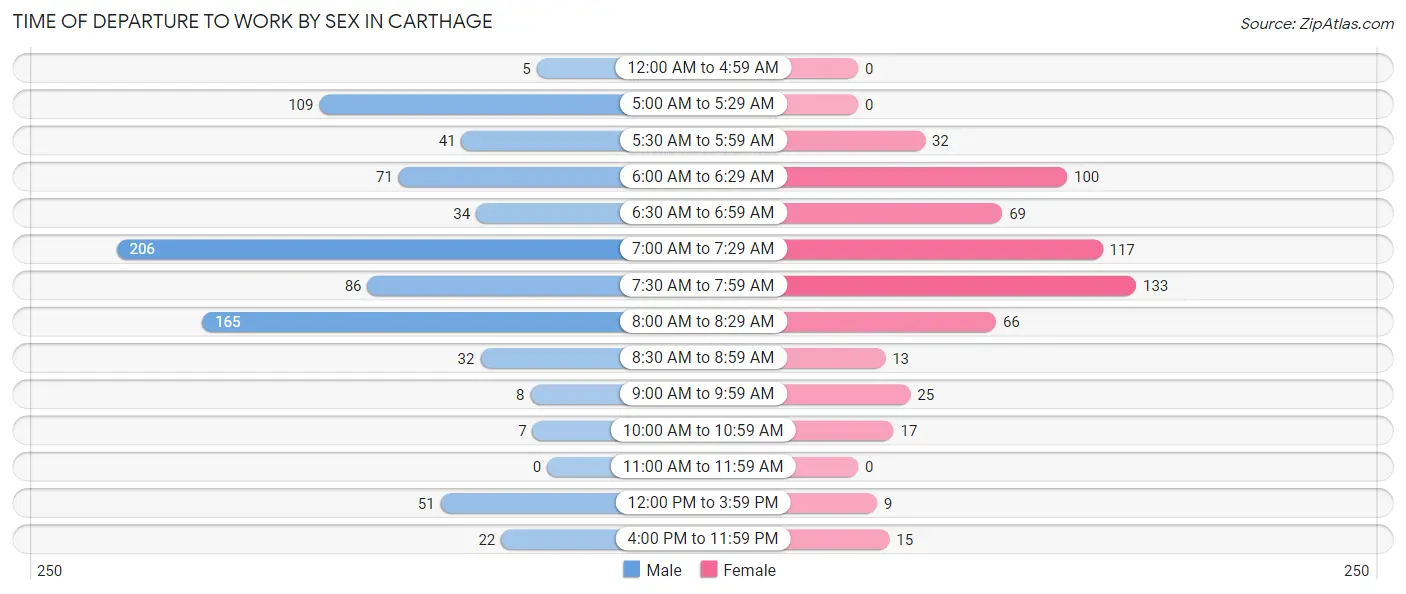
| Time of Departure | Male | Female |
| 12:00 AM to 4:59 AM | 5 (0.6%) | 0 (0.0%) |
| 5:00 AM to 5:29 AM | 109 (13.0%) | 0 (0.0%) |
| 5:30 AM to 5:59 AM | 41 (4.9%) | 32 (5.4%) |
| 6:00 AM to 6:29 AM | 71 (8.5%) | 100 (16.8%) |
| 6:30 AM to 6:59 AM | 34 (4.1%) | 69 (11.6%) |
| 7:00 AM to 7:29 AM | 206 (24.6%) | 117 (19.6%) |
| 7:30 AM to 7:59 AM | 86 (10.3%) | 133 (22.3%) |
| 8:00 AM to 8:29 AM | 165 (19.7%) | 66 (11.1%) |
| 8:30 AM to 8:59 AM | 32 (3.8%) | 13 (2.2%) |
| 9:00 AM to 9:59 AM | 8 (1.0%) | 25 (4.2%) |
| 10:00 AM to 10:59 AM | 7 (0.8%) | 17 (2.9%) |
| 11:00 AM to 11:59 AM | 0 (0.0%) | 0 (0.0%) |
| 12:00 PM to 3:59 PM | 51 (6.1%) | 9 (1.5%) |
| 4:00 PM to 11:59 PM | 22 (2.6%) | 15 (2.5%) |
| Total | 837 (100.0%) | 596 (100.0%) |
Housing Occupancy in Carthage
Occupancy by Ownership in Carthage
Of the total 1,252 dwellings in Carthage, owner-occupied units account for 939 (75.0%), while renter-occupied units make up 313 (25.0%).
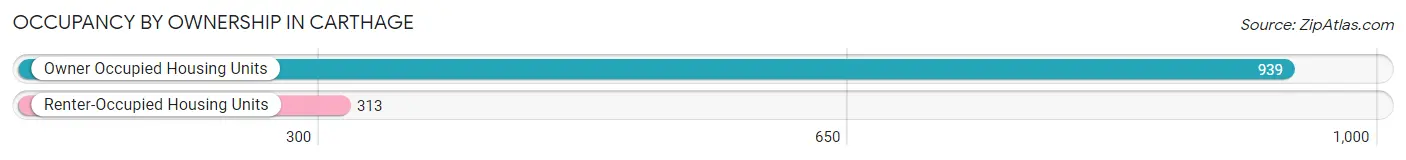
| Occupancy | # Housing Units | % Housing Units |
| Owner Occupied Housing Units | 939 | 75.0% |
| Renter-Occupied Housing Units | 313 | 25.0% |
| Total Occupied Housing Units | 1,252 | 100.0% |
Occupancy by Household Size in Carthage
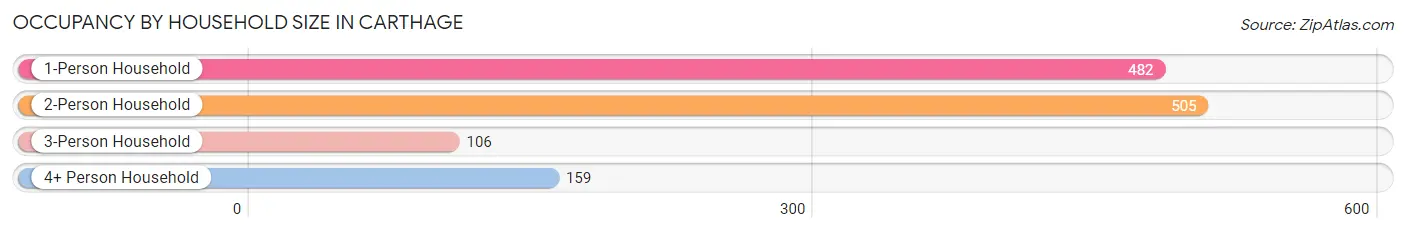
| Household Size | # Housing Units | % Housing Units |
| 1-Person Household | 482 | 38.5% |
| 2-Person Household | 505 | 40.3% |
| 3-Person Household | 106 | 8.5% |
| 4+ Person Household | 159 | 12.7% |
| Total Housing Units | 1,252 | 100.0% |
Occupancy by Ownership by Household Size in Carthage
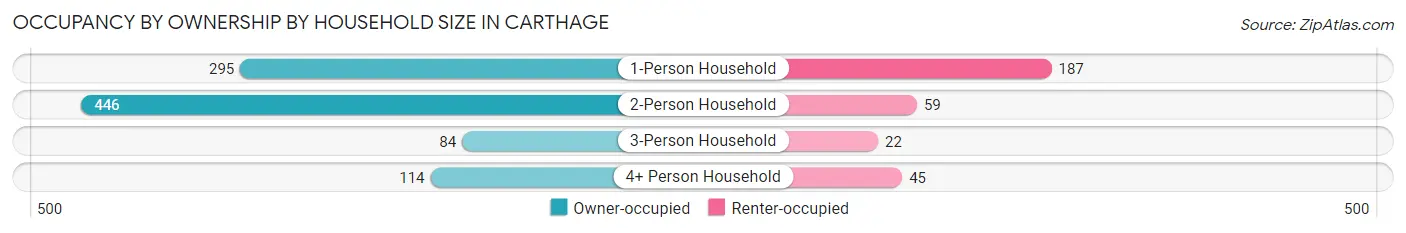
| Household Size | Owner-occupied | Renter-occupied |
| 1-Person Household | 295 (61.2%) | 187 (38.8%) |
| 2-Person Household | 446 (88.3%) | 59 (11.7%) |
| 3-Person Household | 84 (79.2%) | 22 (20.7%) |
| 4+ Person Household | 114 (71.7%) | 45 (28.3%) |
| Total Housing Units | 939 (75.0%) | 313 (25.0%) |
Occupancy by Educational Attainment in Carthage
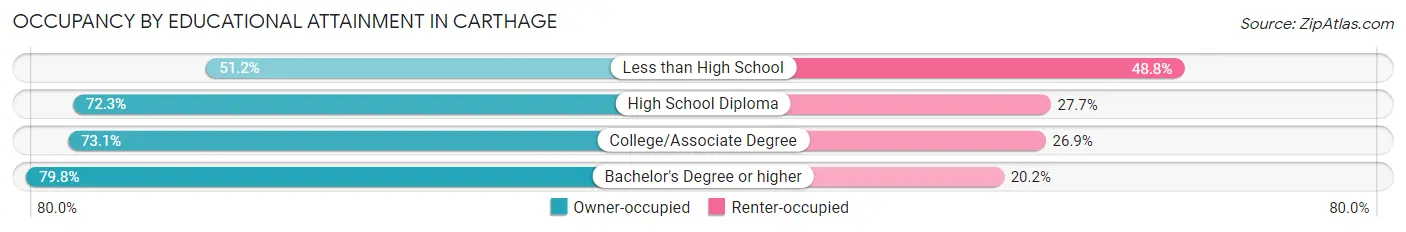
| Household Size | Owner-occupied | Renter-occupied |
| Less than High School | 22 (51.2%) | 21 (48.8%) |
| High School Diploma | 204 (72.3%) | 78 (27.7%) |
| College/Associate Degree | 291 (73.1%) | 107 (26.9%) |
| Bachelor's Degree or higher | 422 (79.8%) | 107 (20.2%) |
Occupancy by Age of Householder in Carthage
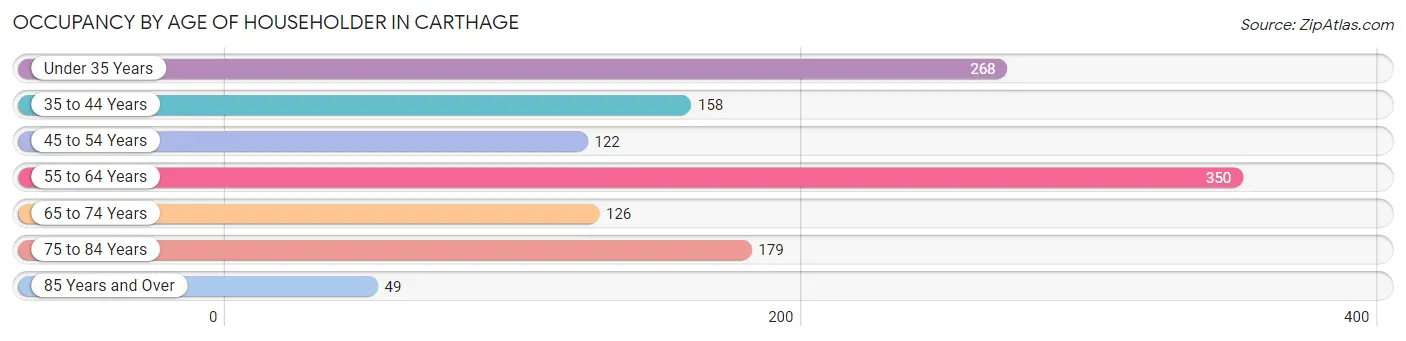
| Age Bracket | # Households | % Households |
| Under 35 Years | 268 | 21.4% |
| 35 to 44 Years | 158 | 12.6% |
| 45 to 54 Years | 122 | 9.7% |
| 55 to 64 Years | 350 | 28.0% |
| 65 to 74 Years | 126 | 10.1% |
| 75 to 84 Years | 179 | 14.3% |
| 85 Years and Over | 49 | 3.9% |
| Total | 1,252 | 100.0% |
Housing Finances in Carthage
Median Income by Occupancy in Carthage
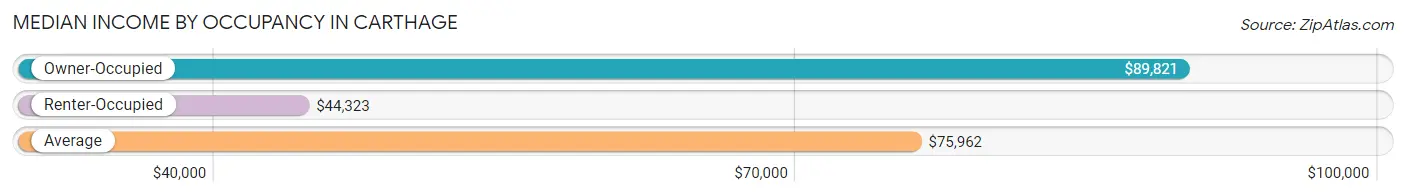
| Occupancy Type | # Households | Median Income |
| Owner-Occupied | 939 (75.0%) | $89,821 |
| Renter-Occupied | 313 (25.0%) | $44,323 |
| Average | 1,252 (100.0%) | $75,962 |
Occupancy by Householder Income Bracket in Carthage
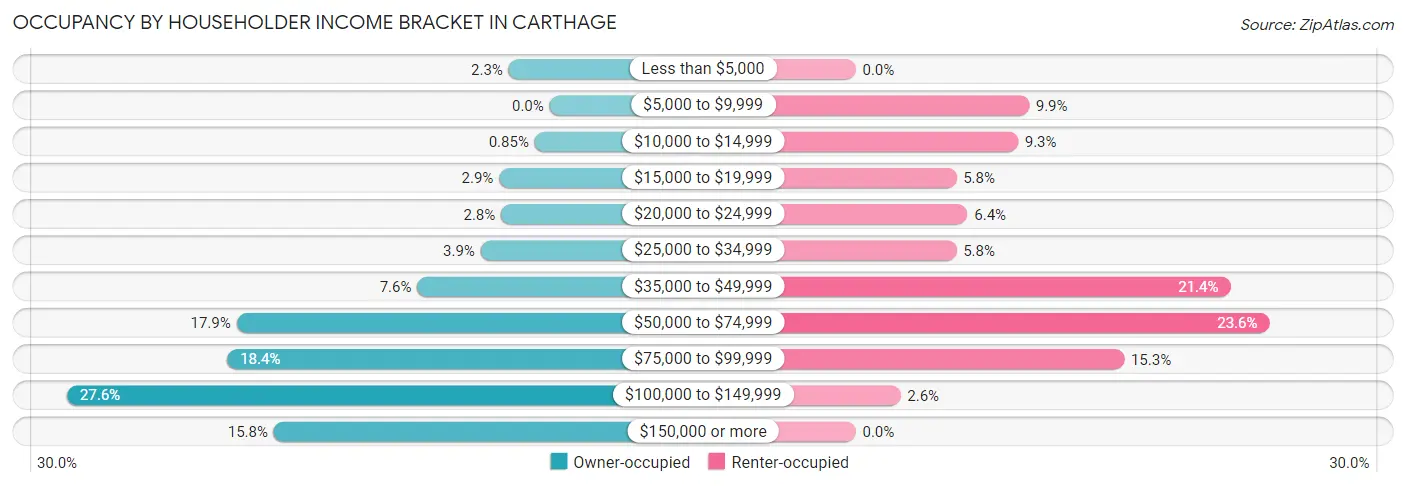
| Income Bracket | Owner-occupied | Renter-occupied |
| Less than $5,000 | 22 (2.3%) | 0 (0.0%) |
| $5,000 to $9,999 | 0 (0.0%) | 31 (9.9%) |
| $10,000 to $14,999 | 8 (0.9%) | 29 (9.3%) |
| $15,000 to $19,999 | 27 (2.9%) | 18 (5.8%) |
| $20,000 to $24,999 | 26 (2.8%) | 20 (6.4%) |
| $25,000 to $34,999 | 37 (3.9%) | 18 (5.8%) |
| $35,000 to $49,999 | 71 (7.6%) | 67 (21.4%) |
| $50,000 to $74,999 | 168 (17.9%) | 74 (23.6%) |
| $75,000 to $99,999 | 173 (18.4%) | 48 (15.3%) |
| $100,000 to $149,999 | 259 (27.6%) | 8 (2.6%) |
| $150,000 or more | 148 (15.8%) | 0 (0.0%) |
| Total | 939 (100.0%) | 313 (100.0%) |
Monthly Housing Cost Tiers in Carthage
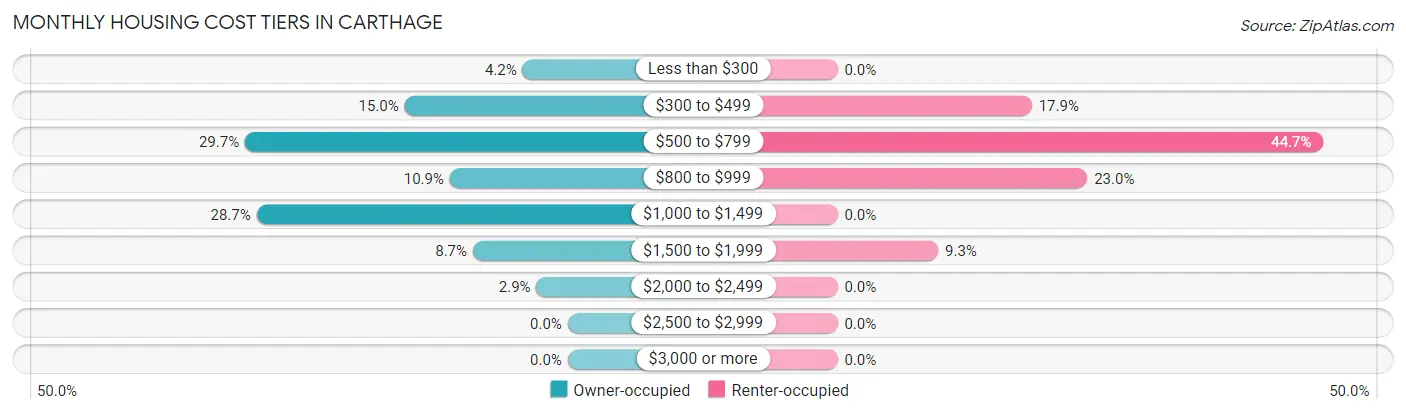
| Monthly Cost | Owner-occupied | Renter-occupied |
| Less than $300 | 39 (4.2%) | 0 (0.0%) |
| $300 to $499 | 141 (15.0%) | 56 (17.9%) |
| $500 to $799 | 279 (29.7%) | 140 (44.7%) |
| $800 to $999 | 102 (10.9%) | 72 (23.0%) |
| $1,000 to $1,499 | 269 (28.6%) | 0 (0.0%) |
| $1,500 to $1,999 | 82 (8.7%) | 29 (9.3%) |
| $2,000 to $2,499 | 27 (2.9%) | 0 (0.0%) |
| $2,500 to $2,999 | 0 (0.0%) | 0 (0.0%) |
| $3,000 or more | 0 (0.0%) | 0 (0.0%) |
| Total | 939 (100.0%) | 313 (100.0%) |
Physical Housing Characteristics in Carthage
Housing Structures in Carthage
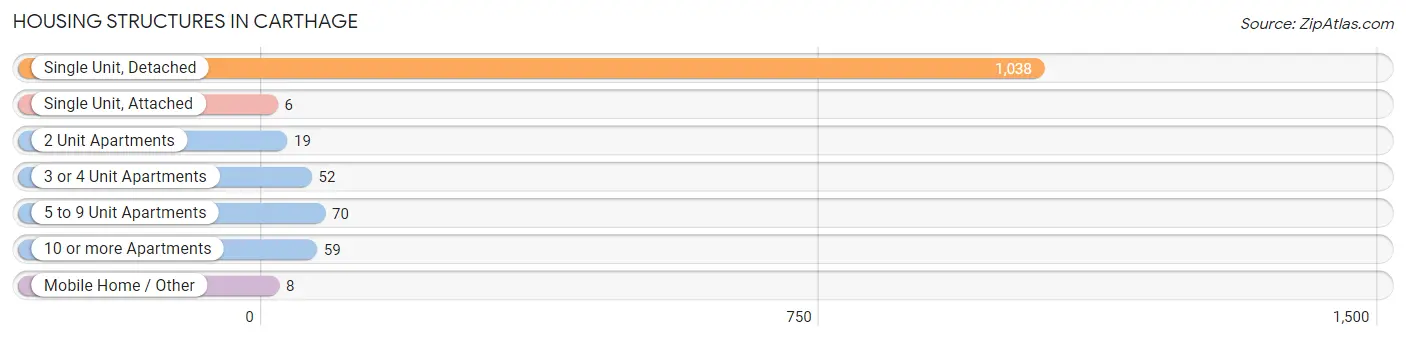
| Structure Type | # Housing Units | % Housing Units |
| Single Unit, Detached | 1,038 | 82.9% |
| Single Unit, Attached | 6 | 0.5% |
| 2 Unit Apartments | 19 | 1.5% |
| 3 or 4 Unit Apartments | 52 | 4.2% |
| 5 to 9 Unit Apartments | 70 | 5.6% |
| 10 or more Apartments | 59 | 4.7% |
| Mobile Home / Other | 8 | 0.6% |
| Total | 1,252 | 100.0% |
Housing Structures by Occupancy in Carthage
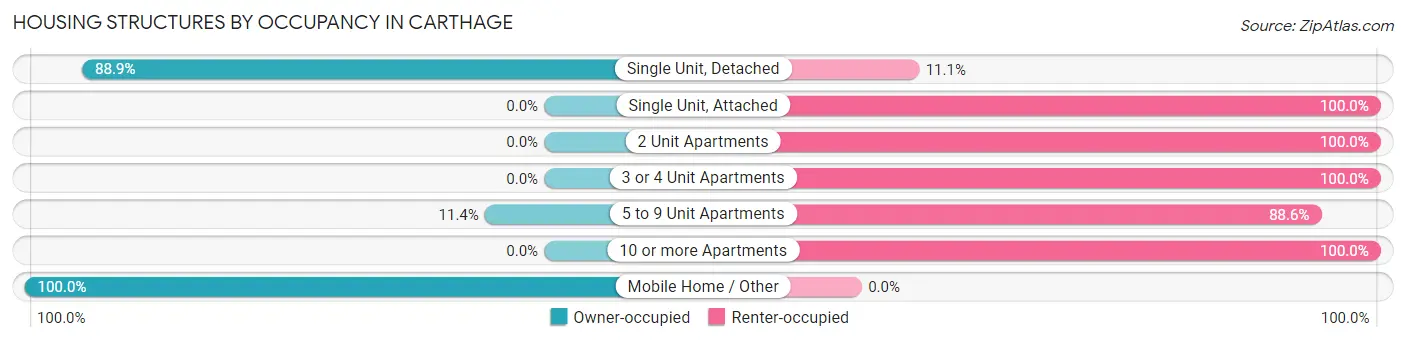
| Structure Type | Owner-occupied | Renter-occupied |
| Single Unit, Detached | 923 (88.9%) | 115 (11.1%) |
| Single Unit, Attached | 0 (0.0%) | 6 (100.0%) |
| 2 Unit Apartments | 0 (0.0%) | 19 (100.0%) |
| 3 or 4 Unit Apartments | 0 (0.0%) | 52 (100.0%) |
| 5 to 9 Unit Apartments | 8 (11.4%) | 62 (88.6%) |
| 10 or more Apartments | 0 (0.0%) | 59 (100.0%) |
| Mobile Home / Other | 8 (100.0%) | 0 (0.0%) |
| Total | 939 (75.0%) | 313 (25.0%) |
Housing Structures by Number of Rooms in Carthage
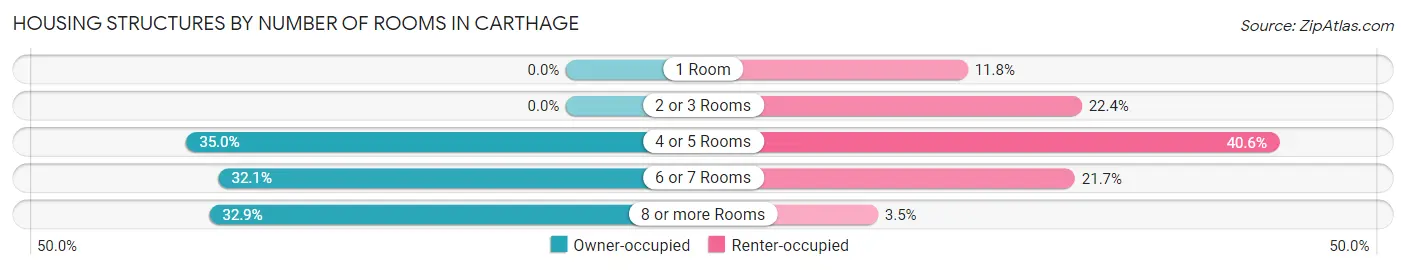
| Number of Rooms | Owner-occupied | Renter-occupied |
| 1 Room | 0 (0.0%) | 37 (11.8%) |
| 2 or 3 Rooms | 0 (0.0%) | 70 (22.4%) |
| 4 or 5 Rooms | 329 (35.0%) | 127 (40.6%) |
| 6 or 7 Rooms | 301 (32.1%) | 68 (21.7%) |
| 8 or more Rooms | 309 (32.9%) | 11 (3.5%) |
| Total | 939 (100.0%) | 313 (100.0%) |
Housing Structure by Heating Type in Carthage
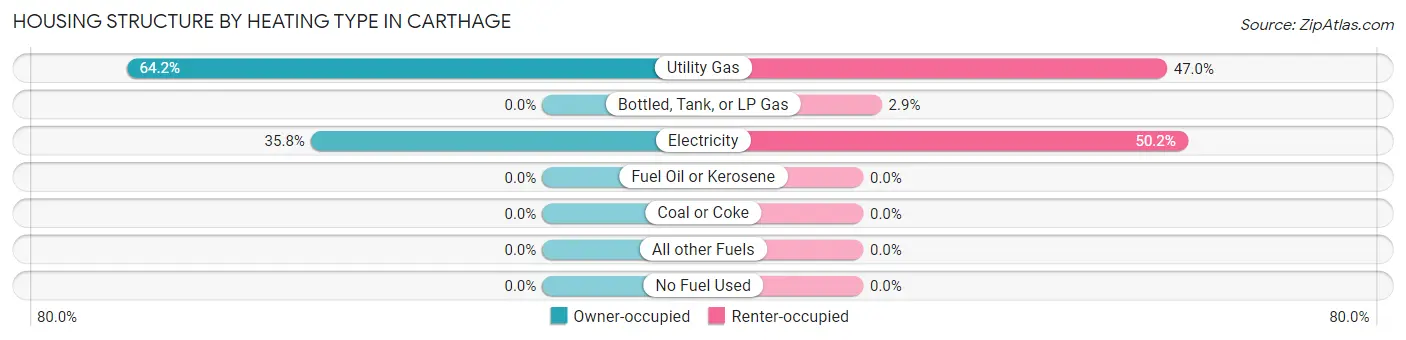
| Heating Type | Owner-occupied | Renter-occupied |
| Utility Gas | 603 (64.2%) | 147 (47.0%) |
| Bottled, Tank, or LP Gas | 0 (0.0%) | 9 (2.9%) |
| Electricity | 336 (35.8%) | 157 (50.2%) |
| Fuel Oil or Kerosene | 0 (0.0%) | 0 (0.0%) |
| Coal or Coke | 0 (0.0%) | 0 (0.0%) |
| All other Fuels | 0 (0.0%) | 0 (0.0%) |
| No Fuel Used | 0 (0.0%) | 0 (0.0%) |
| Total | 939 (100.0%) | 313 (100.0%) |
Household Vehicle Usage in Carthage
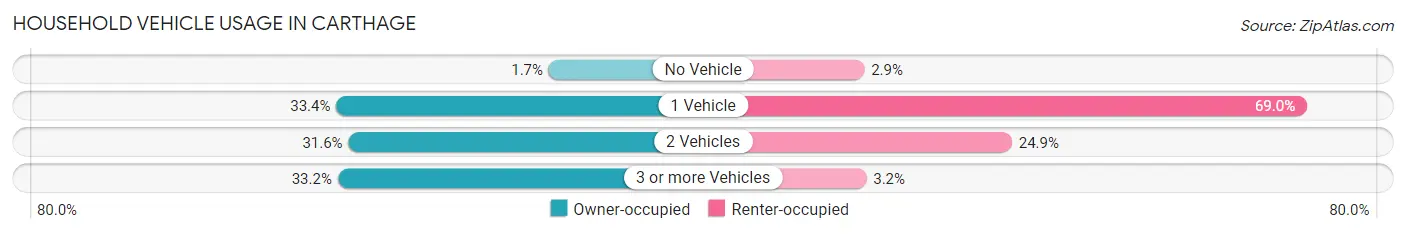
| Vehicles per Household | Owner-occupied | Renter-occupied |
| No Vehicle | 16 (1.7%) | 9 (2.9%) |
| 1 Vehicle | 314 (33.4%) | 216 (69.0%) |
| 2 Vehicles | 297 (31.6%) | 78 (24.9%) |
| 3 or more Vehicles | 312 (33.2%) | 10 (3.2%) |
| Total | 939 (100.0%) | 313 (100.0%) |
Real Estate & Mortgages in Carthage
Real Estate and Mortgage Overview in Carthage
| Characteristic | Without Mortgage | With Mortgage |
| Housing Units | 403 | 536 |
| Median Property Value | $129,100 | $103,100 |
| Median Household Income | $84,258 | $45 |
| Monthly Housing Costs | $551 | $0 |
| Real Estate Taxes | $2,542 | $0 |
Property Value by Mortgage Status in Carthage
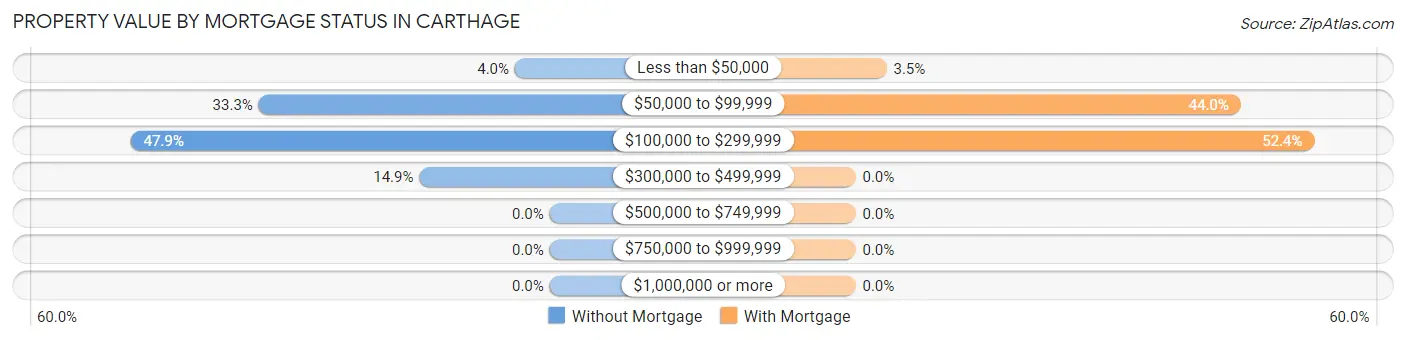
| Property Value | Without Mortgage | With Mortgage |
| Less than $50,000 | 16 (4.0%) | 19 (3.5%) |
| $50,000 to $99,999 | 134 (33.3%) | 236 (44.0%) |
| $100,000 to $299,999 | 193 (47.9%) | 281 (52.4%) |
| $300,000 to $499,999 | 60 (14.9%) | 0 (0.0%) |
| $500,000 to $749,999 | 0 (0.0%) | 0 (0.0%) |
| $750,000 to $999,999 | 0 (0.0%) | 0 (0.0%) |
| $1,000,000 or more | 0 (0.0%) | 0 (0.0%) |
| Total | 403 (100.0%) | 536 (100.0%) |
Household Income by Mortgage Status in Carthage
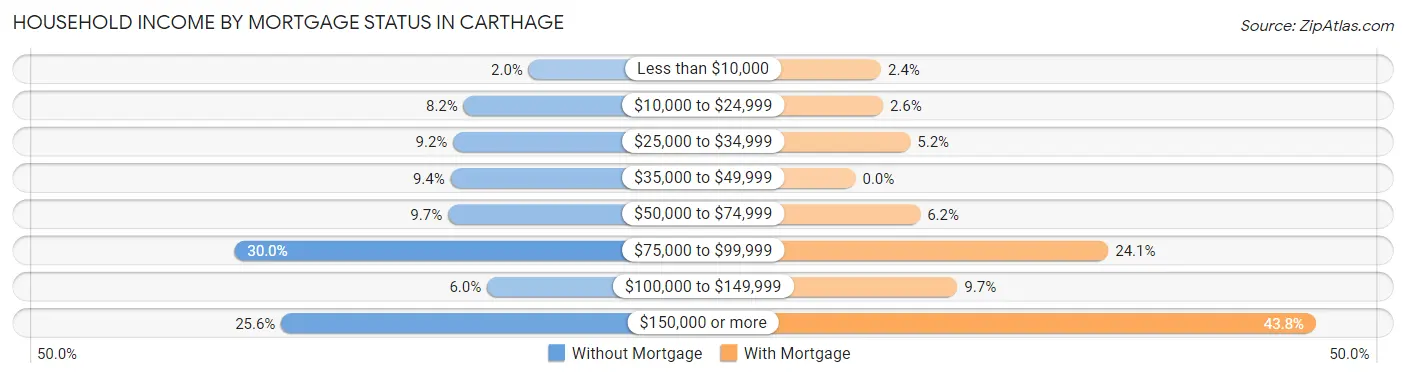
| Household Income | Without Mortgage | With Mortgage |
| Less than $10,000 | 8 (2.0%) | 13 (2.4%) |
| $10,000 to $24,999 | 33 (8.2%) | 14 (2.6%) |
| $25,000 to $34,999 | 37 (9.2%) | 28 (5.2%) |
| $35,000 to $49,999 | 38 (9.4%) | 0 (0.0%) |
| $50,000 to $74,999 | 39 (9.7%) | 33 (6.2%) |
| $75,000 to $99,999 | 121 (30.0%) | 129 (24.1%) |
| $100,000 to $149,999 | 24 (6.0%) | 52 (9.7%) |
| $150,000 or more | 103 (25.6%) | 235 (43.8%) |
| Total | 403 (100.0%) | 536 (100.0%) |
Property Value to Household Income Ratio in Carthage
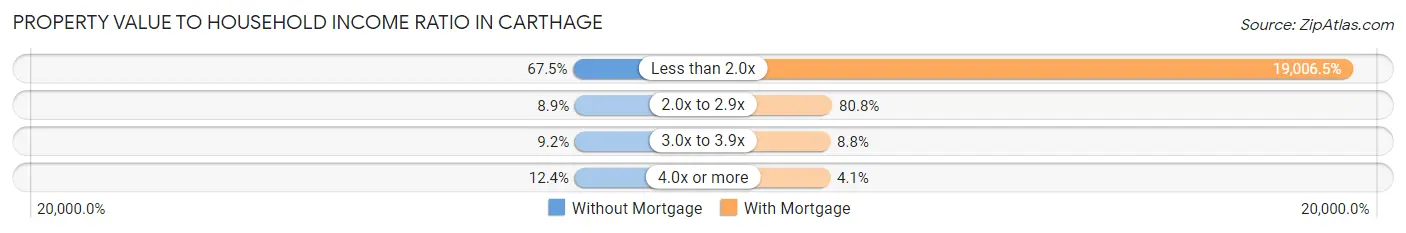
| Value-to-Income Ratio | Without Mortgage | With Mortgage |
| Less than 2.0x | 272 (67.5%) | 101,875 (19,006.5%) |
| 2.0x to 2.9x | 36 (8.9%) | 433 (80.8%) |
| 3.0x to 3.9x | 37 (9.2%) | 47 (8.8%) |
| 4.0x or more | 50 (12.4%) | 22 (4.1%) |
| Total | 403 (100.0%) | 536 (100.0%) |
Real Estate Taxes by Mortgage Status in Carthage
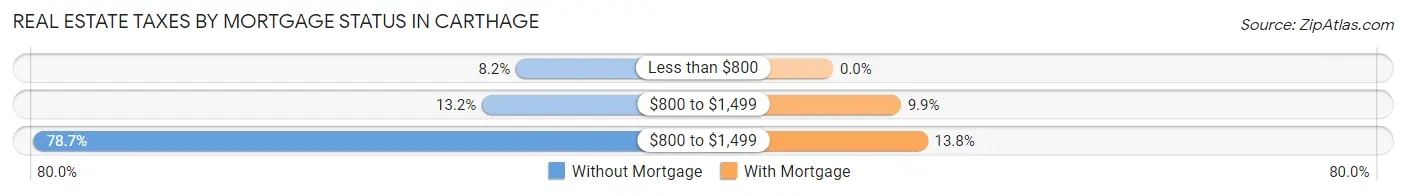
| Property Taxes | Without Mortgage | With Mortgage |
| Less than $800 | 33 (8.2%) | 0 (0.0%) |
| $800 to $1,499 | 53 (13.2%) | 53 (9.9%) |
| $800 to $1,499 | 317 (78.7%) | 74 (13.8%) |
| Total | 403 (100.0%) | 536 (100.0%) |
Health & Disability in Carthage
Health Insurance Coverage by Age in Carthage
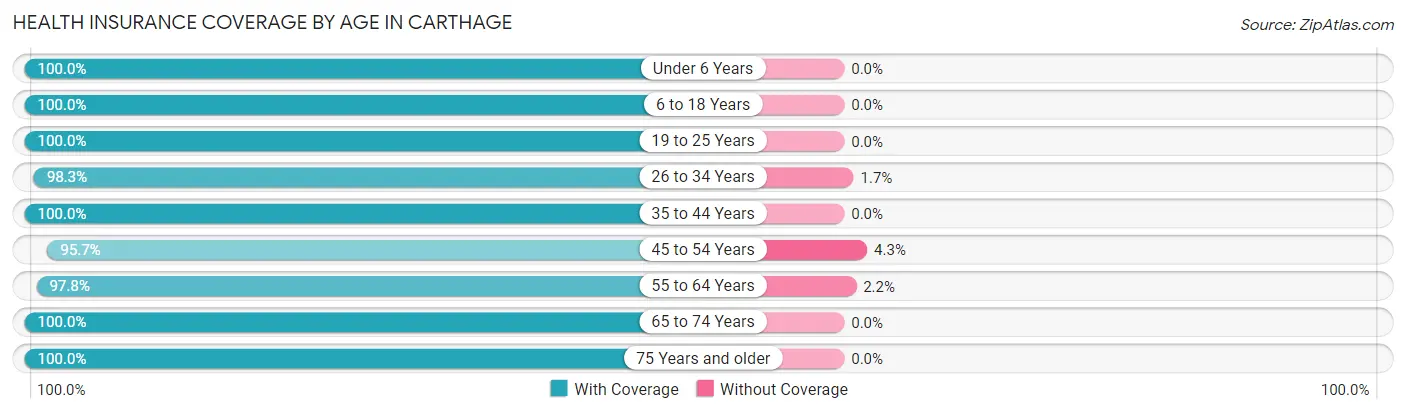
| Age Bracket | With Coverage | Without Coverage |
| Under 6 Years | 84 (100.0%) | 0 (0.0%) |
| 6 to 18 Years | 321 (100.0%) | 0 (0.0%) |
| 19 to 25 Years | 161 (100.0%) | 0 (0.0%) |
| 26 to 34 Years | 397 (98.3%) | 7 (1.7%) |
| 35 to 44 Years | 283 (100.0%) | 0 (0.0%) |
| 45 to 54 Years | 225 (95.7%) | 10 (4.3%) |
| 55 to 64 Years | 485 (97.8%) | 11 (2.2%) |
| 65 to 74 Years | 161 (100.0%) | 0 (0.0%) |
| 75 Years and older | 323 (100.0%) | 0 (0.0%) |
| Total | 2,440 (98.9%) | 28 (1.1%) |
Health Insurance Coverage by Citizenship Status in Carthage
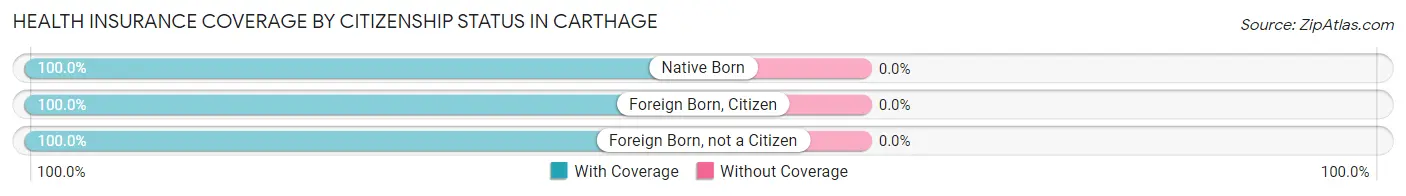
| Citizenship Status | With Coverage | Without Coverage |
| Native Born | 84 (100.0%) | 0 (0.0%) |
| Foreign Born, Citizen | 321 (100.0%) | 0 (0.0%) |
| Foreign Born, not a Citizen | 161 (100.0%) | 0 (0.0%) |
Health Insurance Coverage by Household Income in Carthage
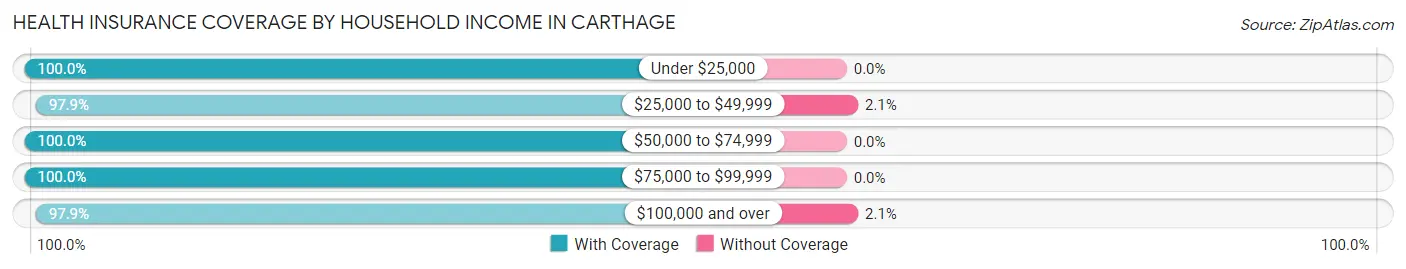
| Household Income | With Coverage | Without Coverage |
| Under $25,000 | 299 (100.0%) | 0 (0.0%) |
| $25,000 to $49,999 | 279 (97.9%) | 6 (2.1%) |
| $50,000 to $74,999 | 416 (100.0%) | 0 (0.0%) |
| $75,000 to $99,999 | 469 (100.0%) | 0 (0.0%) |
| $100,000 and over | 968 (97.9%) | 21 (2.1%) |
Public vs Private Health Insurance Coverage by Age in Carthage
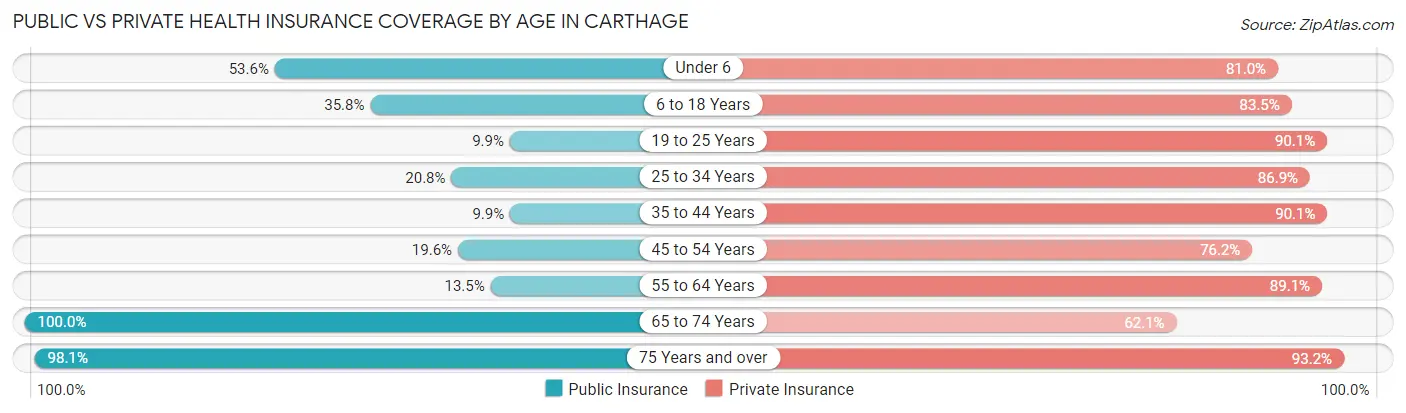
| Age Bracket | Public Insurance | Private Insurance |
| Under 6 | 45 (53.6%) | 68 (80.9%) |
| 6 to 18 Years | 115 (35.8%) | 268 (83.5%) |
| 19 to 25 Years | 16 (9.9%) | 145 (90.1%) |
| 25 to 34 Years | 84 (20.8%) | 351 (86.9%) |
| 35 to 44 Years | 28 (9.9%) | 255 (90.1%) |
| 45 to 54 Years | 46 (19.6%) | 179 (76.2%) |
| 55 to 64 Years | 67 (13.5%) | 442 (89.1%) |
| 65 to 74 Years | 161 (100.0%) | 100 (62.1%) |
| 75 Years and over | 317 (98.1%) | 301 (93.2%) |
| Total | 879 (35.6%) | 2,109 (85.5%) |
Disability Status by Sex by Age in Carthage
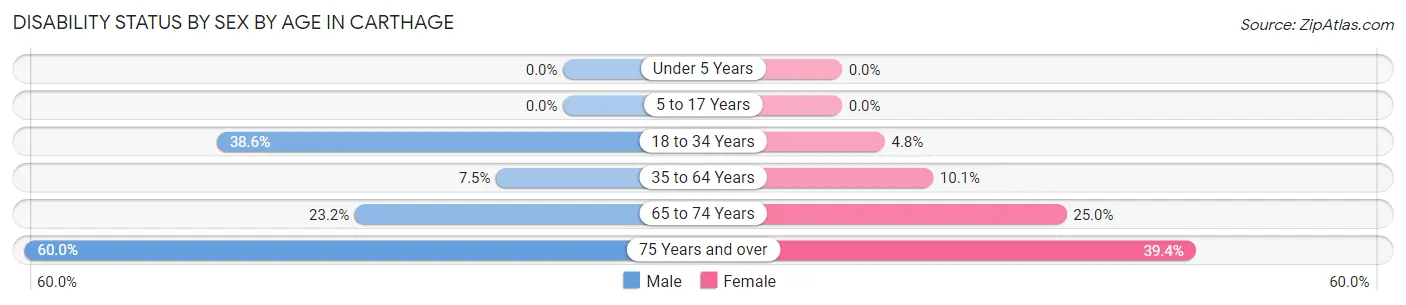
| Age Bracket | Male | Female |
| Under 5 Years | 0 (0.0%) | 0 (0.0%) |
| 5 to 17 Years | 0 (0.0%) | 0 (0.0%) |
| 18 to 34 Years | 132 (38.6%) | 11 (4.8%) |
| 35 to 64 Years | 44 (7.5%) | 43 (10.1%) |
| 65 to 74 Years | 16 (23.2%) | 23 (25.0%) |
| 75 Years and over | 72 (60.0%) | 80 (39.4%) |
Disability Class by Sex by Age in Carthage
Disability Class: Hearing Difficulty
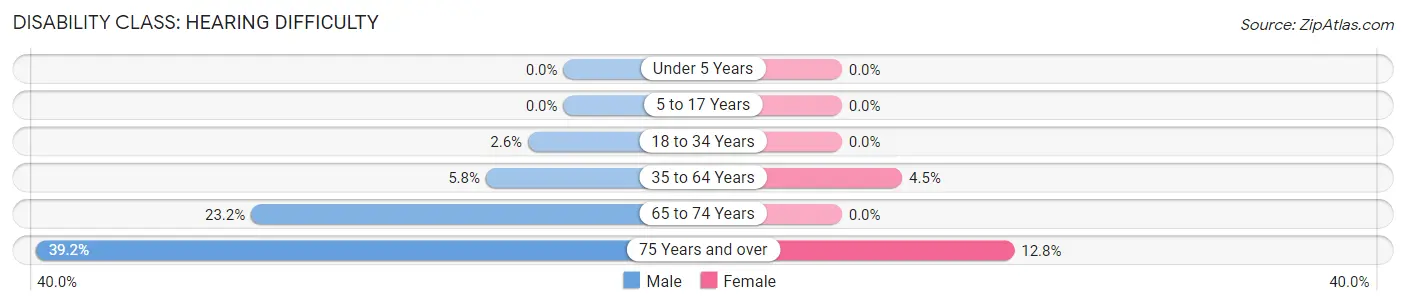
| Age Bracket | Male | Female |
| Under 5 Years | 0 (0.0%) | 0 (0.0%) |
| 5 to 17 Years | 0 (0.0%) | 0 (0.0%) |
| 18 to 34 Years | 9 (2.6%) | 0 (0.0%) |
| 35 to 64 Years | 34 (5.8%) | 19 (4.5%) |
| 65 to 74 Years | 16 (23.2%) | 0 (0.0%) |
| 75 Years and over | 47 (39.2%) | 26 (12.8%) |
Disability Class: Vision Difficulty
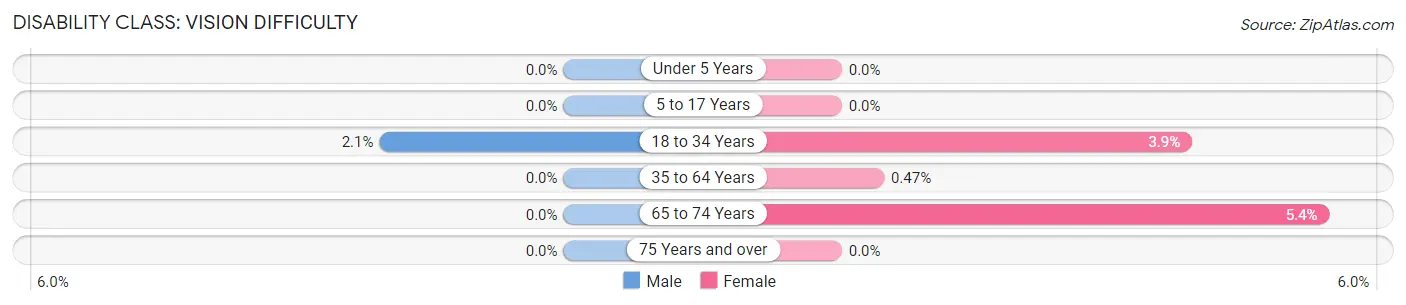
| Age Bracket | Male | Female |
| Under 5 Years | 0 (0.0%) | 0 (0.0%) |
| 5 to 17 Years | 0 (0.0%) | 0 (0.0%) |
| 18 to 34 Years | 7 (2.1%) | 9 (3.9%) |
| 35 to 64 Years | 0 (0.0%) | 2 (0.5%) |
| 65 to 74 Years | 0 (0.0%) | 5 (5.4%) |
| 75 Years and over | 0 (0.0%) | 0 (0.0%) |
Disability Class: Cognitive Difficulty
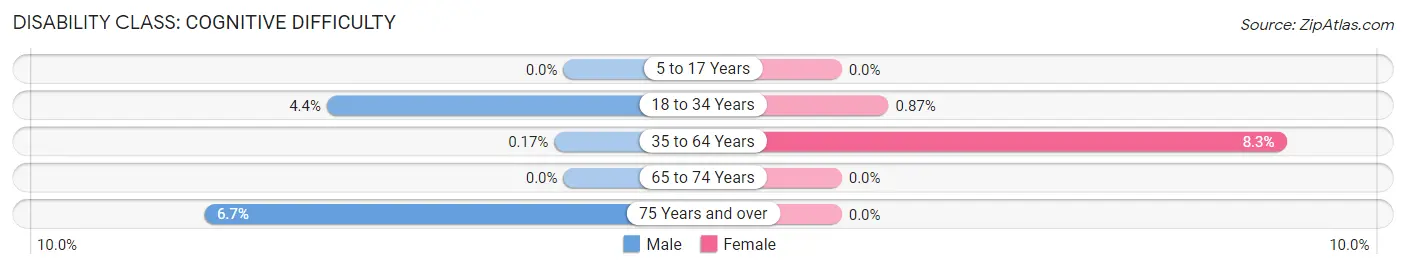
| Age Bracket | Male | Female |
| 5 to 17 Years | 0 (0.0%) | 0 (0.0%) |
| 18 to 34 Years | 15 (4.4%) | 2 (0.9%) |
| 35 to 64 Years | 1 (0.2%) | 35 (8.3%) |
| 65 to 74 Years | 0 (0.0%) | 0 (0.0%) |
| 75 Years and over | 8 (6.7%) | 0 (0.0%) |
Disability Class: Ambulatory Difficulty
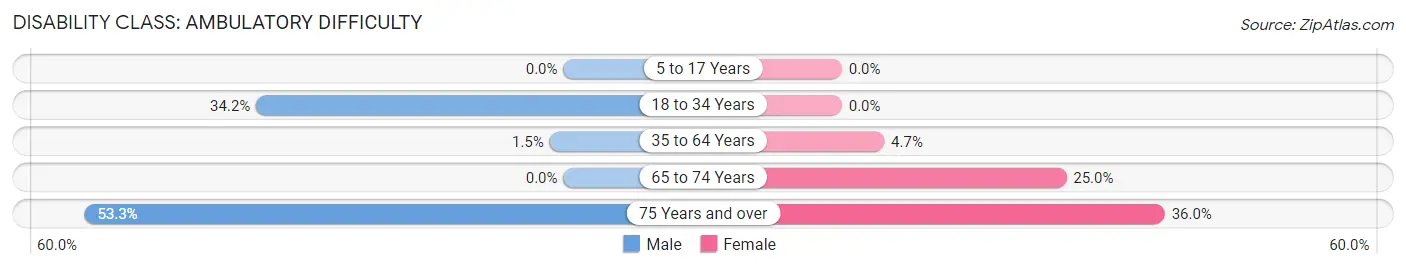
| Age Bracket | Male | Female |
| 5 to 17 Years | 0 (0.0%) | 0 (0.0%) |
| 18 to 34 Years | 117 (34.2%) | 0 (0.0%) |
| 35 to 64 Years | 9 (1.5%) | 20 (4.7%) |
| 65 to 74 Years | 0 (0.0%) | 23 (25.0%) |
| 75 Years and over | 64 (53.3%) | 73 (36.0%) |
Disability Class: Self-Care Difficulty
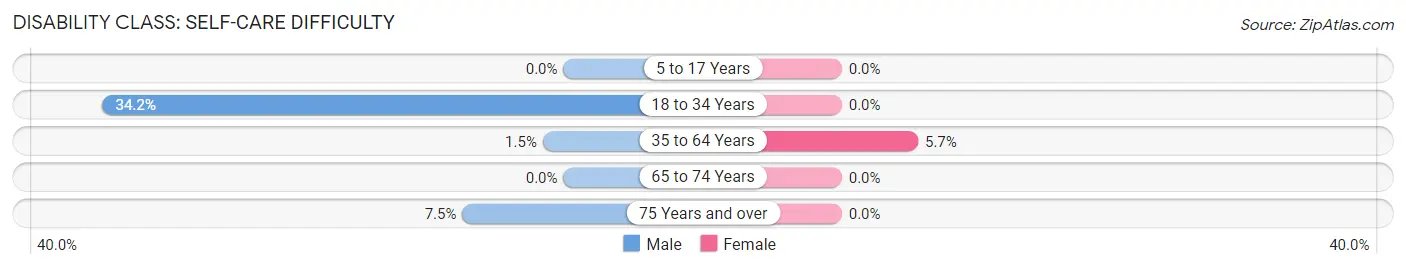
| Age Bracket | Male | Female |
| 5 to 17 Years | 0 (0.0%) | 0 (0.0%) |
| 18 to 34 Years | 117 (34.2%) | 0 (0.0%) |
| 35 to 64 Years | 9 (1.5%) | 24 (5.7%) |
| 65 to 74 Years | 0 (0.0%) | 0 (0.0%) |
| 75 Years and over | 9 (7.5%) | 0 (0.0%) |
Technology Access in Carthage
Computing Device Access in Carthage
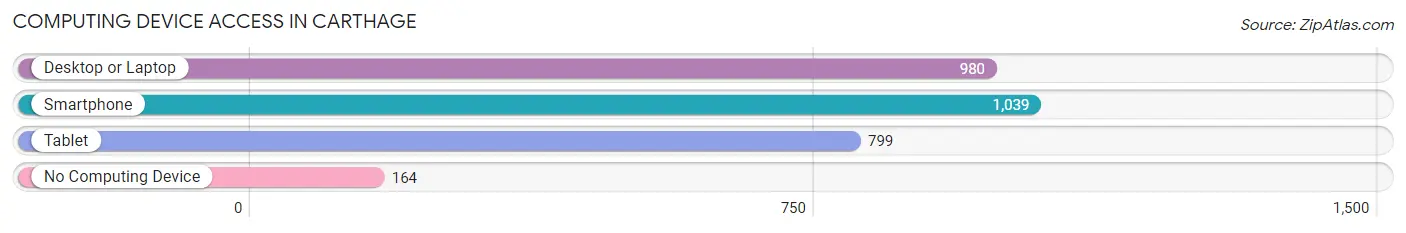
| Device Type | # Households | % Households |
| Desktop or Laptop | 980 | 78.3% |
| Smartphone | 1,039 | 83.0% |
| Tablet | 799 | 63.8% |
| No Computing Device | 164 | 13.1% |
| Total | 1,252 | 100.0% |
Internet Access in Carthage
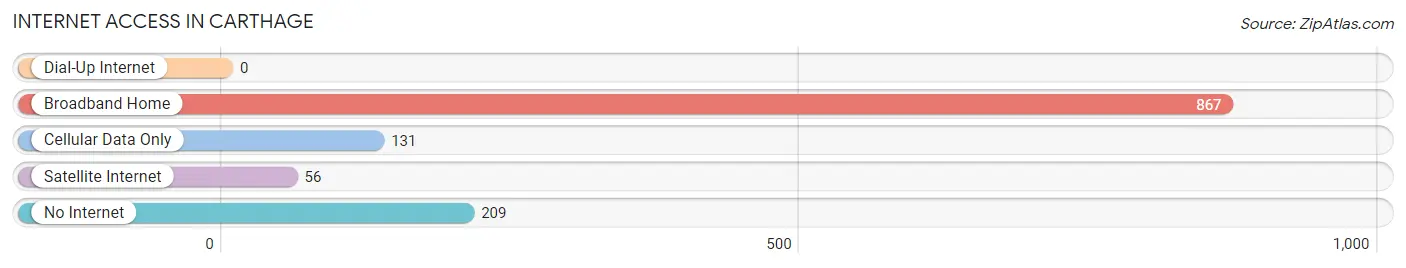
| Internet Type | # Households | % Households |
| Dial-Up Internet | 0 | 0.0% |
| Broadband Home | 867 | 69.3% |
| Cellular Data Only | 131 | 10.5% |
| Satellite Internet | 56 | 4.5% |
| No Internet | 209 | 16.7% |
| Total | 1,252 | 100.0% |
Carthage Summary
Carthage, Illinois is a small city located in Hancock County, Illinois. It is situated on the banks of the Mississippi River, approximately 30 miles south of the Quad Cities. The city has a population of approximately 2,500 people and is the county seat of Hancock County.
History
Carthage was founded in 1836 by a group of settlers from New England. The city was named after the ancient city of Carthage in Tunisia. The settlers were attracted to the area due to its fertile soil and abundant natural resources. The city was incorporated in 1837 and quickly became a thriving agricultural center.
In the late 19th century, Carthage became a major hub for the railroad industry. The city was home to several major railroads, including the Chicago, Burlington & Quincy Railroad, the Chicago & North Western Railway, and the Illinois Central Railroad. The railroads brought a great deal of economic prosperity to the city and helped to spur its growth.
Geography
Carthage is located in the western part of Hancock County, Illinois. It is situated on the banks of the Mississippi River, approximately 30 miles south of the Quad Cities. The city has a total area of 2.2 square miles, all of which is land. The terrain is mostly flat, with some rolling hills in the surrounding area.
The climate in Carthage is classified as humid continental, with hot, humid summers and cold, snowy winters. The average annual temperature is around 50 degrees Fahrenheit, with an average high of around 75 degrees in the summer and an average low of around 25 degrees in the winter.
Economy
The economy of Carthage is largely based on agriculture and manufacturing. The city is home to several large agricultural companies, including Cargill, ADM, and Monsanto. These companies employ a large number of people in the area and provide a significant portion of the city’s economic output.
In addition to agriculture, Carthage is also home to several manufacturing companies. The city is home to several large automotive parts manufacturers, including BorgWarner and Tenneco. These companies employ a large number of people in the area and provide a significant portion of the city’s economic output.
Demographics
As of the 2010 census, the population of Carthage was 2,500. The racial makeup of the city was 97.2% White, 0.8% African American, 0.4% Native American, 0.4% Asian, and 1.2% from other races. The median household income was $41,250, and the median family income was $50,000.
The city is home to a large number of churches, including the First Presbyterian Church, the First Baptist Church, and the Church of the Nazarene. The city also has a public library, a museum, and several parks.
Conclusion
Carthage, Illinois is a small city located in Hancock County, Illinois. It is situated on the banks of the Mississippi River, approximately 30 miles south of the Quad Cities. The city has a population of approximately 2,500 people and is the county seat of Hancock County. The economy of Carthage is largely based on agriculture and manufacturing, and the city is home to several large agricultural and automotive parts companies. The racial makeup of the city is 97.2% White, 0.8% African American, 0.4% Native American, 0.4% Asian, and 1.2% from other races. The median household income was $41,250, and the median family income was $50,000. The city is home to a large number of churches, a public library, a museum, and several parks.
Common Questions
What is Per Capita Income in Carthage?
Per Capita income in Carthage is $41,156.
What is the Median Family Income in Carthage?
Median Family Income in Carthage is $102,938.
What is the Median Household income in Carthage?
Median Household Income in Carthage is $75,962.
What is Income or Wage Gap in Carthage?
Income or Wage Gap in Carthage is 35.4%.
Women in Carthage earn 64.6 cents for every dollar earned by a man.
What is Inequality or Gini Index in Carthage?
Inequality or Gini Index in Carthage is 0.36.
What is the Total Population of Carthage?
Total Population of Carthage is 2,560.
What is the Total Male Population of Carthage?
Total Male Population of Carthage is 1,419.
What is the Total Female Population of Carthage?
Total Female Population of Carthage is 1,141.
What is the Ratio of Males per 100 Females in Carthage?
There are 124.36 Males per 100 Females in Carthage.
What is the Ratio of Females per 100 Males in Carthage?
There are 80.41 Females per 100 Males in Carthage.
What is the Median Population Age in Carthage?
Median Population Age in Carthage is 44.9 Years.
What is the Average Family Size in Carthage
Average Family Size in Carthage is 2.5 People.
What is the Average Household Size in Carthage
Average Household Size in Carthage is 2.0 People.
How Large is the Labor Force in Carthage?
There are 1,513 People in the Labor Forcein in Carthage.
What is the Percentage of People in the Labor Force in Carthage?
68.2% of People are in the Labor Force in Carthage.
What is the Unemployment Rate in Carthage?
Unemployment Rate in Carthage is 1.3%.