Galesburg, IL Map & Demographics
Galesburg Map
Galesburg Overview
$25,731
PER CAPITA INCOME
$68,215
AVG FAMILY INCOME
$42,346
AVG HOUSEHOLD INCOME
18.3%
WAGE / INCOME GAP [ % ]
81.7¢/ $1
WAGE / INCOME GAP [ $ ]
$8,740
FAMILY INCOME DEFICIT
0.47
INEQUALITY / GINI INDEX
29,923
TOTAL POPULATION
15,551
MALE POPULATION
14,372
FEMALE POPULATION
108.20
MALES / 100 FEMALES
92.42
FEMALES / 100 MALES
41.6
MEDIAN AGE
2.9
AVG FAMILY SIZE
2.1
AVG HOUSEHOLD SIZE
12,294
LABOR FORCE [ PEOPLE ]
48.6%
PERCENT IN LABOR FORCE
5.2%
UNEMPLOYMENT RATE
Galesburg Area Codes
Income in Galesburg
Income Overview in Galesburg
Per Capita Income in Galesburg is $25,731, while median incomes of families and households are $68,215 and $42,346 respectively.
| Characteristic | Number | Measure |
| Per Capita Income | 29,923 | $25,731 |
| Median Family Income | 6,171 | $68,215 |
| Mean Family Income | 6,171 | $82,090 |
| Median Household Income | 12,610 | $42,346 |
| Mean Household Income | 12,610 | $59,223 |
| Income Deficit | 6,171 | $8,740 |
| Wage / Income Gap (%) | 29,923 | 18.29% |
| Wage / Income Gap ($) | 29,923 | 81.71¢ per $1 |
| Gini / Inequality Index | 29,923 | 0.47 |
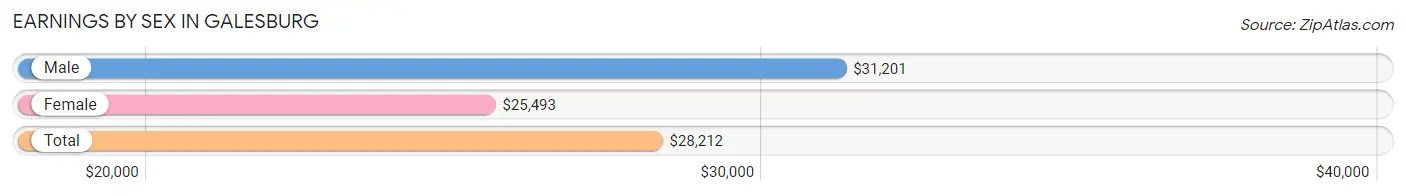
Earnings by Sex in Galesburg
Average Earnings in Galesburg are $28,212, $31,201 for men and $25,493 for women, a difference of 18.3%.
| Sex | Number | Average Earnings |
| Male | 6,759 (51.3%) | $31,201 |
| Female | 6,413 (48.7%) | $25,493 |
| Total | 13,172 (100.0%) | $28,212 |
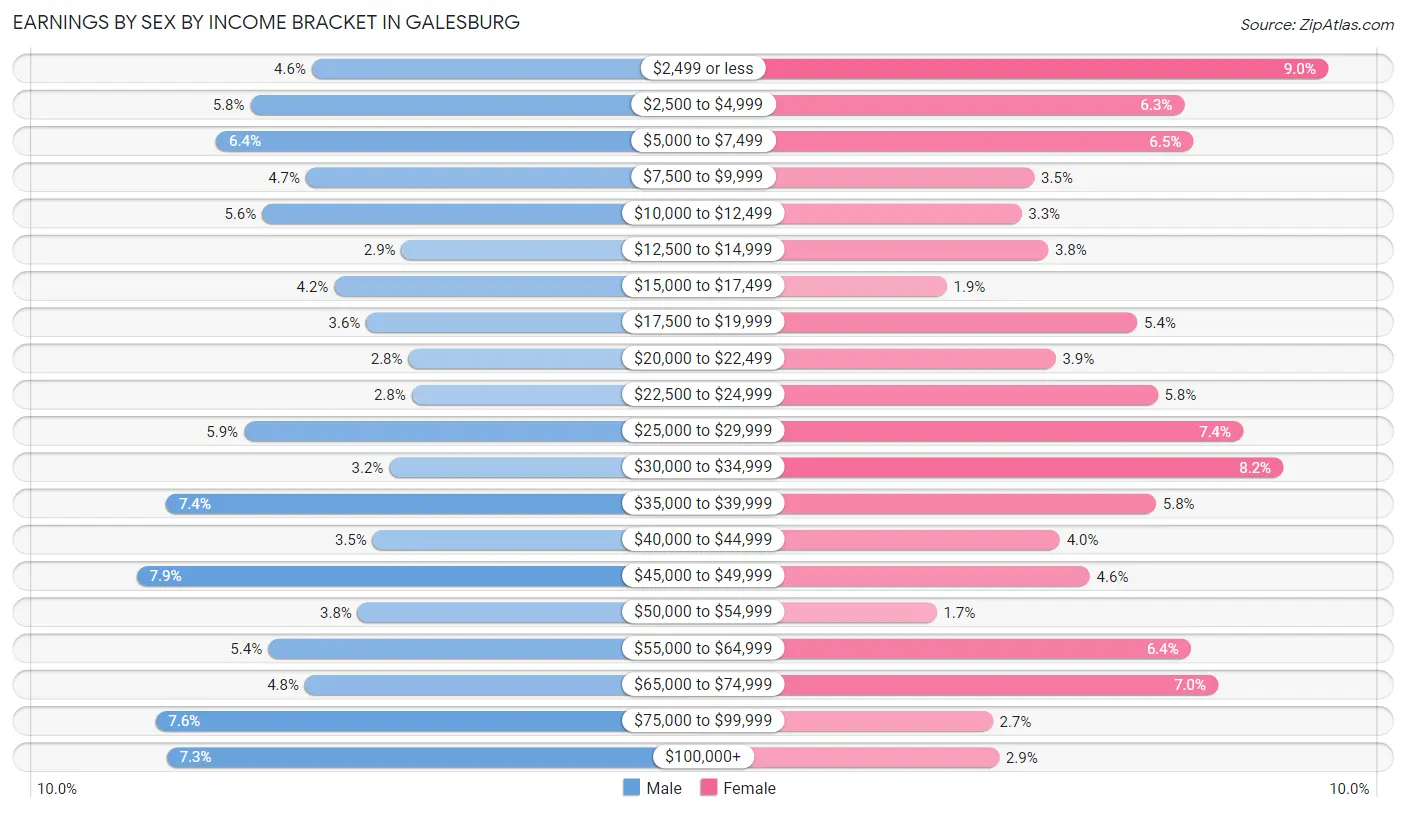
Earnings by Sex by Income Bracket in Galesburg
The most common earnings brackets in Galesburg are $45,000 to $49,999 for men (534 | 7.9%) and $2,499 or less for women (578 | 9.0%).
| Income | Male | Female |
| $2,499 or less | 312 (4.6%) | 578 (9.0%) |
| $2,500 to $4,999 | 390 (5.8%) | 405 (6.3%) |
| $5,000 to $7,499 | 433 (6.4%) | 416 (6.5%) |
| $7,500 to $9,999 | 320 (4.7%) | 225 (3.5%) |
| $10,000 to $12,499 | 375 (5.6%) | 210 (3.3%) |
| $12,500 to $14,999 | 199 (2.9%) | 242 (3.8%) |
| $15,000 to $17,499 | 284 (4.2%) | 120 (1.9%) |
| $17,500 to $19,999 | 243 (3.6%) | 349 (5.4%) |
| $20,000 to $22,499 | 190 (2.8%) | 251 (3.9%) |
| $22,500 to $24,999 | 186 (2.8%) | 373 (5.8%) |
| $25,000 to $29,999 | 398 (5.9%) | 476 (7.4%) |
| $30,000 to $34,999 | 214 (3.2%) | 524 (8.2%) |
| $35,000 to $39,999 | 497 (7.3%) | 371 (5.8%) |
| $40,000 to $44,999 | 235 (3.5%) | 256 (4.0%) |
| $45,000 to $49,999 | 534 (7.9%) | 292 (4.5%) |
| $50,000 to $54,999 | 254 (3.8%) | 108 (1.7%) |
| $55,000 to $64,999 | 368 (5.4%) | 413 (6.4%) |
| $65,000 to $74,999 | 321 (4.8%) | 446 (7.0%) |
| $75,000 to $99,999 | 510 (7.5%) | 175 (2.7%) |
| $100,000+ | 496 (7.3%) | 183 (2.9%) |
| Total | 6,759 (100.0%) | 6,413 (100.0%) |
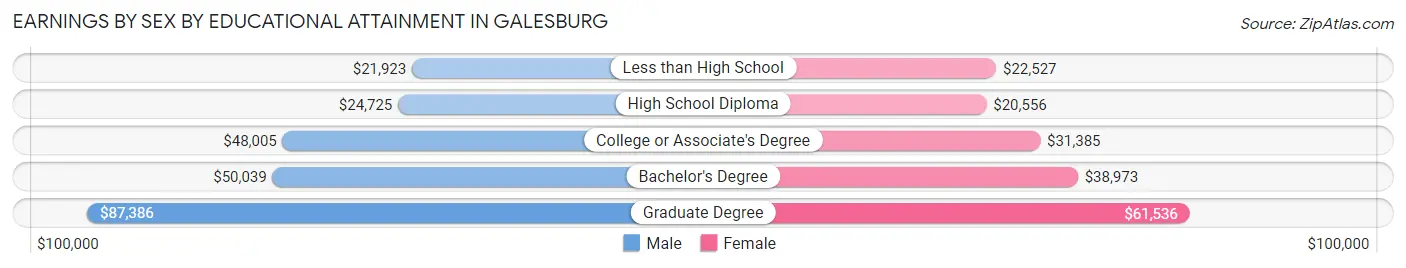
Earnings by Sex by Educational Attainment in Galesburg
Average earnings in Galesburg are $40,025 for men and $31,396 for women, a difference of 21.6%. Men with an educational attainment of graduate degree enjoy the highest average annual earnings of $87,386, while those with less than high school education earn the least with $21,923. Women with an educational attainment of graduate degree earn the most with the average annual earnings of $61,536, while those with high school diploma education have the smallest earnings of $20,556.
| Educational Attainment | Male Income | Female Income |
| Less than High School | $21,923 | $22,527 |
| High School Diploma | $24,725 | $20,556 |
| College or Associate's Degree | $48,005 | $31,385 |
| Bachelor's Degree | $50,039 | $38,973 |
| Graduate Degree | $87,386 | $61,536 |
| Total | $40,025 | $31,396 |
Family Income in Galesburg
Family Income Brackets in Galesburg
According to the Galesburg family income data, there are 1,185 families falling into the $100,000 to $149,999 income range, which is the most common income bracket and makes up 19.2% of all families. Conversely, the $200,000+ income bracket is the least frequent group with only 179 families (2.9%) belonging to this category.
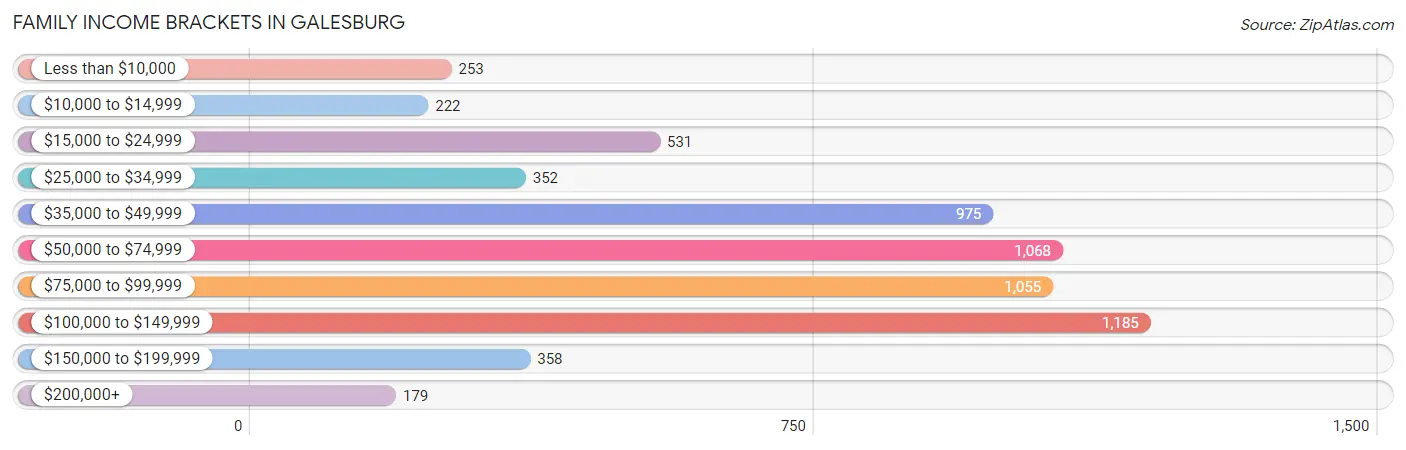
| Income Bracket | # Families | % Families |
| Less than $10,000 | 253 | 4.1% |
| $10,000 to $14,999 | 222 | 3.6% |
| $15,000 to $24,999 | 531 | 8.6% |
| $25,000 to $34,999 | 352 | 5.7% |
| $35,000 to $49,999 | 975 | 15.8% |
| $50,000 to $74,999 | 1,068 | 17.3% |
| $75,000 to $99,999 | 1,055 | 17.1% |
| $100,000 to $149,999 | 1,185 | 19.2% |
| $150,000 to $199,999 | 358 | 5.8% |
| $200,000+ | 179 | 2.9% |
Family Income by Famaliy Size in Galesburg
6-person families (71 | 1.1%) account for the highest median family income in Galesburg with $108,750 per family, while 2-person families (3,407 | 55.2%) have the highest median income of $30,681 per family member.
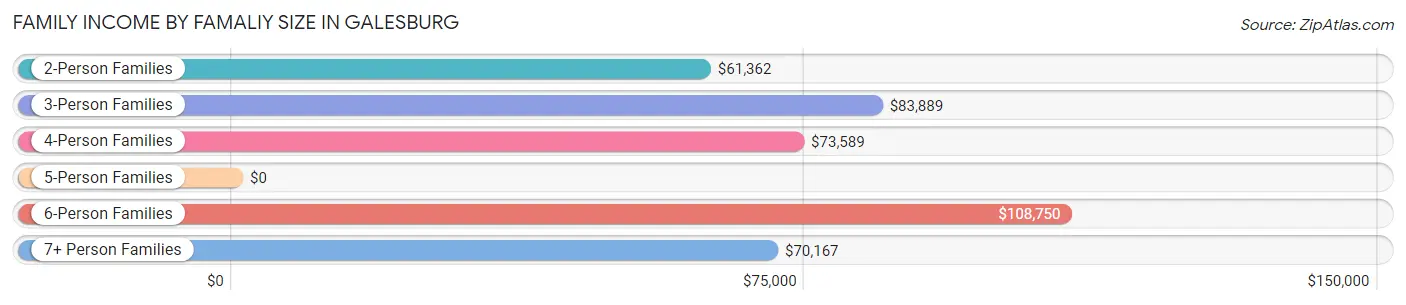
| Income Bracket | # Families | Median Income |
| 2-Person Families | 3,407 (55.2%) | $61,362 |
| 3-Person Families | 1,292 (20.9%) | $83,889 |
| 4-Person Families | 887 (14.4%) | $73,589 |
| 5-Person Families | 404 (6.6%) | $0 |
| 6-Person Families | 71 (1.1%) | $108,750 |
| 7+ Person Families | 110 (1.8%) | $70,167 |
| Total | 6,171 (100.0%) | $68,215 |
Family Income by Number of Earners in Galesburg
The median family income in Galesburg is $68,215, with families comprising 3+ earners (596) having the highest median family income of $104,357, while families with 1 earner (2,221) have the lowest median family income of $47,234, accounting for 9.7% and 36.0% of families, respectively.
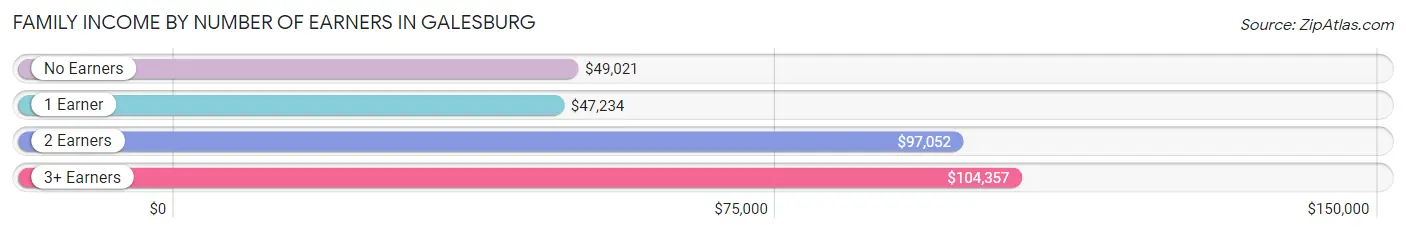
| Number of Earners | # Families | Median Income |
| No Earners | 1,369 (22.2%) | $49,021 |
| 1 Earner | 2,221 (36.0%) | $47,234 |
| 2 Earners | 1,985 (32.2%) | $97,052 |
| 3+ Earners | 596 (9.7%) | $104,357 |
| Total | 6,171 (100.0%) | $68,215 |
Household Income in Galesburg
Household Income Brackets in Galesburg
With 2,106 households falling in the category, the $35,000 to $49,999 income range is the most frequent in Galesburg, accounting for 16.7% of all households. In contrast, only 202 households (1.6%) fall into the $200,000+ income bracket, making it the least populous group.
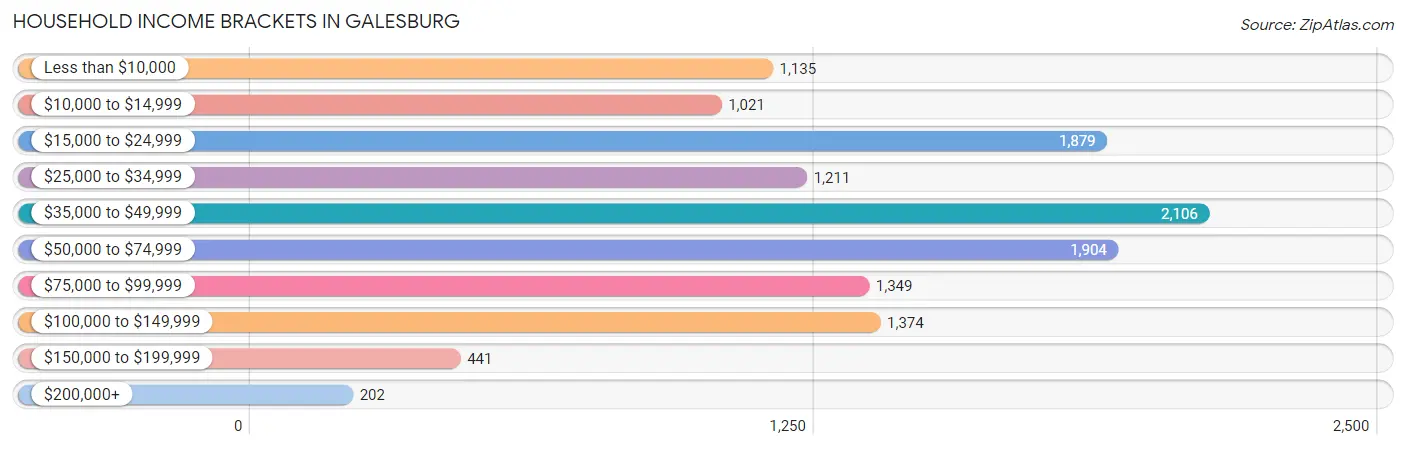
| Income Bracket | # Households | % Households |
| Less than $10,000 | 1,135 | 9.0% |
| $10,000 to $14,999 | 1,021 | 8.1% |
| $15,000 to $24,999 | 1,879 | 14.9% |
| $25,000 to $34,999 | 1,211 | 9.6% |
| $35,000 to $49,999 | 2,106 | 16.7% |
| $50,000 to $74,999 | 1,904 | 15.1% |
| $75,000 to $99,999 | 1,349 | 10.7% |
| $100,000 to $149,999 | 1,374 | 10.9% |
| $150,000 to $199,999 | 441 | 3.5% |
| $200,000+ | 202 | 1.6% |
Household Income by Householder Age in Galesburg
The median household income in Galesburg is $42,346, with the highest median household income of $55,550 found in the 45 to 64 years age bracket for the primary householder. A total of 4,045 households (32.1%) fall into this category. Meanwhile, the 15 to 24 years age bracket for the primary householder has the lowest median household income of $18,651, with 736 households (5.8%) in this group.
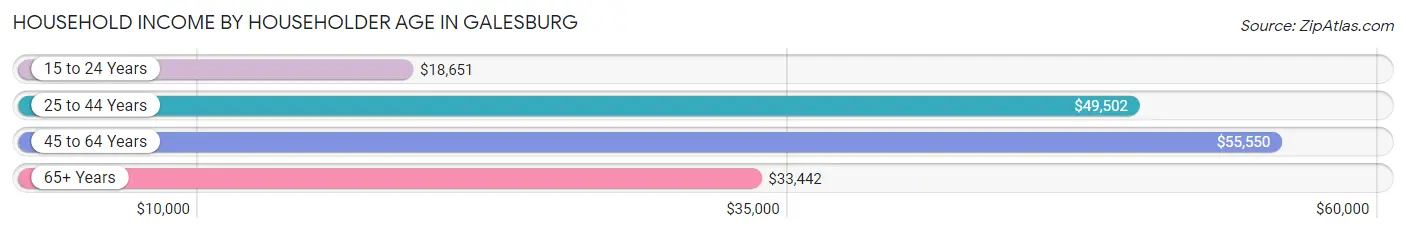
| Income Bracket | # Households | Median Income |
| 15 to 24 Years | 736 (5.8%) | $18,651 |
| 25 to 44 Years | 3,227 (25.6%) | $49,502 |
| 45 to 64 Years | 4,045 (32.1%) | $55,550 |
| 65+ Years | 4,602 (36.5%) | $33,442 |
| Total | 12,610 (100.0%) | $42,346 |
Poverty in Galesburg
Income Below Poverty by Sex and Age in Galesburg
With 20.6% poverty level for males and 20.5% for females among the residents of Galesburg, 5 year old males and 5 year old females are the most vulnerable to poverty, with 138 males (71.5%) and 70 females (37.4%) in their respective age groups living below the poverty level.
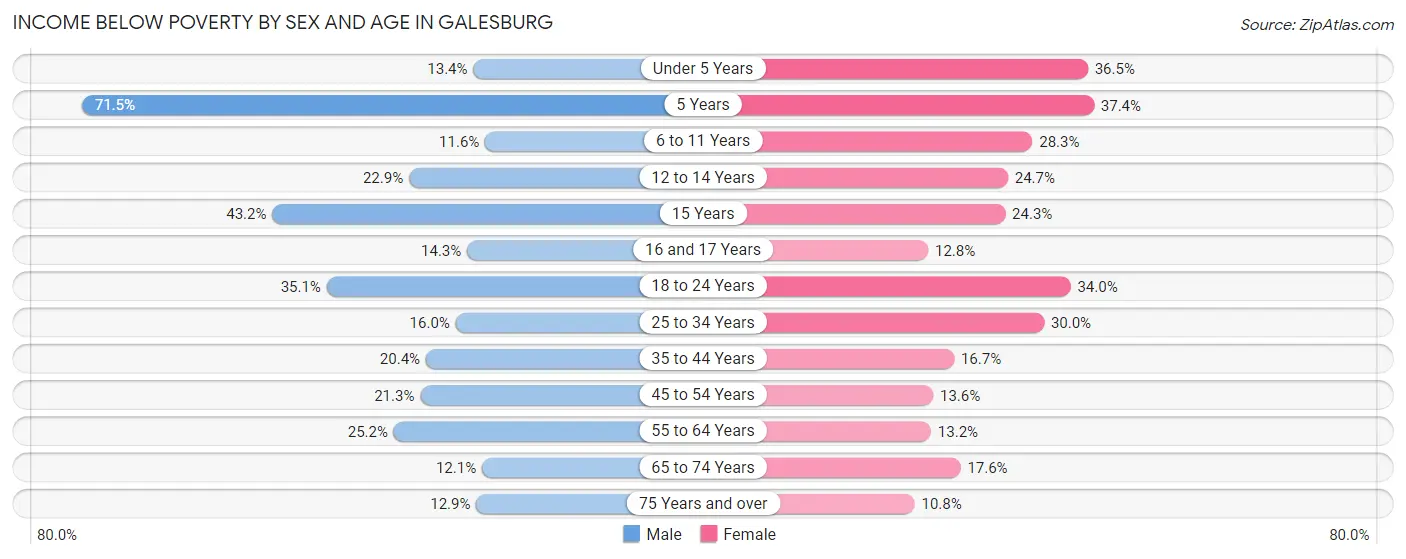
| Age Bracket | Male | Female |
| Under 5 Years | 99 (13.4%) | 256 (36.5%) |
| 5 Years | 138 (71.5%) | 70 (37.4%) |
| 6 to 11 Years | 78 (11.6%) | 243 (28.3%) |
| 12 to 14 Years | 121 (22.9%) | 88 (24.6%) |
| 15 Years | 86 (43.2%) | 33 (24.3%) |
| 16 and 17 Years | 36 (14.3%) | 31 (12.8%) |
| 18 to 24 Years | 442 (35.1%) | 364 (34.0%) |
| 25 to 34 Years | 235 (16.0%) | 474 (30.0%) |
| 35 to 44 Years | 302 (20.4%) | 253 (16.7%) |
| 45 to 54 Years | 319 (21.2%) | 189 (13.6%) |
| 55 to 64 Years | 455 (25.2%) | 253 (13.2%) |
| 65 to 74 Years | 192 (12.1%) | 312 (17.6%) |
| 75 Years and over | 151 (12.9%) | 180 (10.8%) |
| Total | 2,654 (20.6%) | 2,746 (20.5%) |
Income Above Poverty by Sex and Age in Galesburg
According to the poverty statistics in Galesburg, males aged 6 to 11 years and females aged 75 years and over are the age groups that are most secure financially, with 88.4% of males and 89.2% of females in these age groups living above the poverty line.
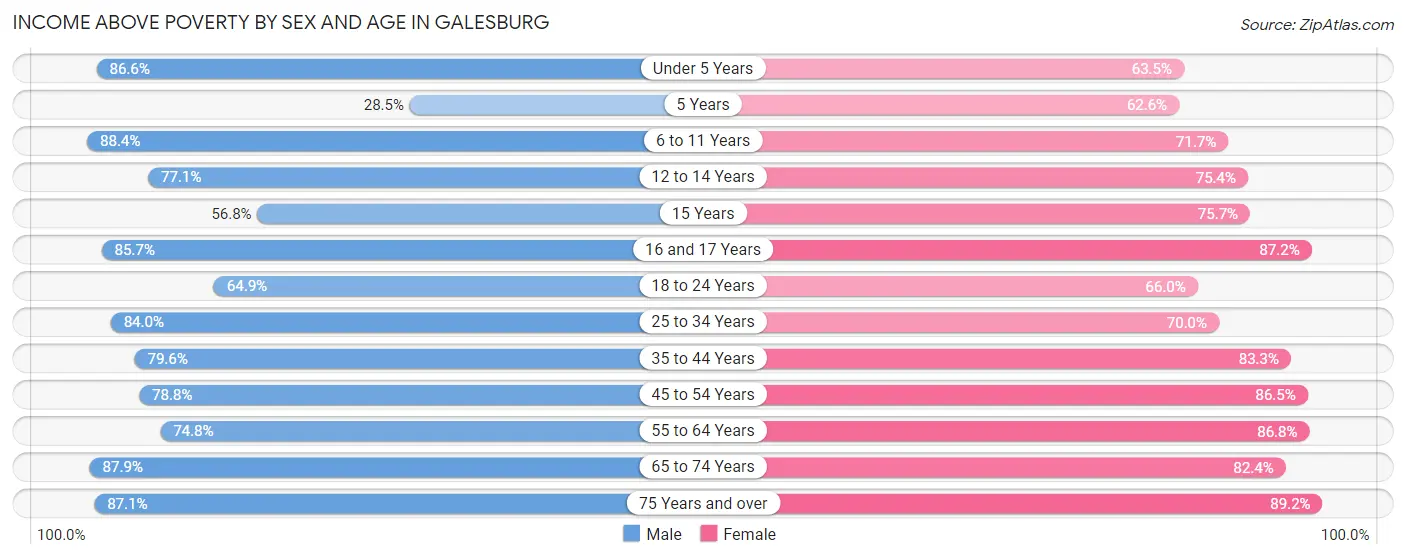
| Age Bracket | Male | Female |
| Under 5 Years | 642 (86.6%) | 445 (63.5%) |
| 5 Years | 55 (28.5%) | 117 (62.6%) |
| 6 to 11 Years | 594 (88.4%) | 616 (71.7%) |
| 12 to 14 Years | 407 (77.1%) | 269 (75.3%) |
| 15 Years | 113 (56.8%) | 103 (75.7%) |
| 16 and 17 Years | 216 (85.7%) | 211 (87.2%) |
| 18 to 24 Years | 816 (64.9%) | 708 (66.0%) |
| 25 to 34 Years | 1,235 (84.0%) | 1,105 (70.0%) |
| 35 to 44 Years | 1,178 (79.6%) | 1,266 (83.3%) |
| 45 to 54 Years | 1,182 (78.7%) | 1,206 (86.5%) |
| 55 to 64 Years | 1,352 (74.8%) | 1,659 (86.8%) |
| 65 to 74 Years | 1,397 (87.9%) | 1,459 (82.4%) |
| 75 Years and over | 1,017 (87.1%) | 1,487 (89.2%) |
| Total | 10,204 (79.4%) | 10,651 (79.5%) |
Income Below Poverty Among Married-Couple Families in Galesburg
The poverty statistics for married-couple families in Galesburg show that 4.0% or 170 of the total 4,298 families live below the poverty line. Families with 3 or 4 children have the highest poverty rate of 15.0%, comprising of 56 families. On the other hand, families with 1 or 2 children have the lowest poverty rate of 0.0%, which includes 0 families.
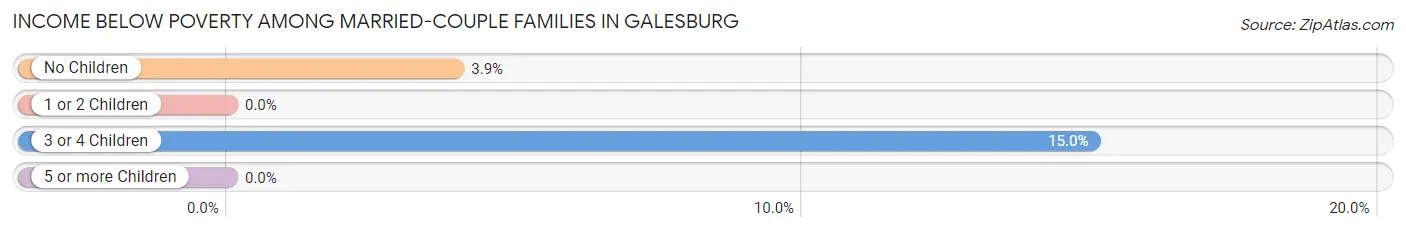
| Children | Above Poverty | Below Poverty |
| No Children | 2,777 (96.1%) | 114 (3.9%) |
| 1 or 2 Children | 998 (100.0%) | 0 (0.0%) |
| 3 or 4 Children | 317 (85.0%) | 56 (15.0%) |
| 5 or more Children | 36 (100.0%) | 0 (0.0%) |
| Total | 4,128 (96.0%) | 170 (4.0%) |
Income Below Poverty Among Single-Parent Households in Galesburg
According to the poverty data in Galesburg, 36.4% or 238 single-father households and 38.4% or 468 single-mother households are living below the poverty line. Among single-father households, those with 5 or more children have the highest poverty rate, with 6 households (100.0%) experiencing poverty. Likewise, among single-mother households, those with 3 or 4 children have the highest poverty rate, with 112 households (63.6%) falling below the poverty line.
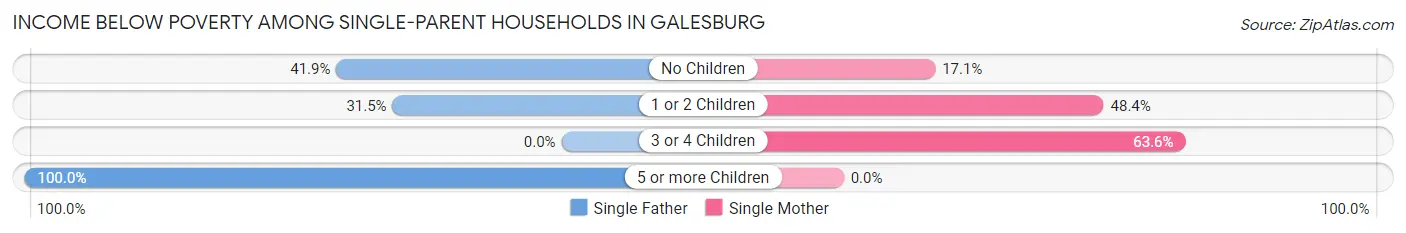
| Children | Single Father | Single Mother |
| No Children | 130 (41.9%) | 81 (17.1%) |
| 1 or 2 Children | 102 (31.5%) | 275 (48.4%) |
| 3 or 4 Children | 0 (0.0%) | 112 (63.6%) |
| 5 or more Children | 6 (100.0%) | 0 (0.0%) |
| Total | 238 (36.4%) | 468 (38.4%) |
Income Below Poverty Among Married-Couple vs Single-Parent Households in Galesburg
The poverty data for Galesburg shows that 170 of the married-couple family households (4.0%) and 706 of the single-parent households (37.7%) are living below the poverty level. Within the married-couple family households, those with 3 or 4 children have the highest poverty rate, with 56 households (15.0%) falling below the poverty line. Among the single-parent households, those with 5 or more children have the highest poverty rate, with 6 household (100.0%) living below poverty.
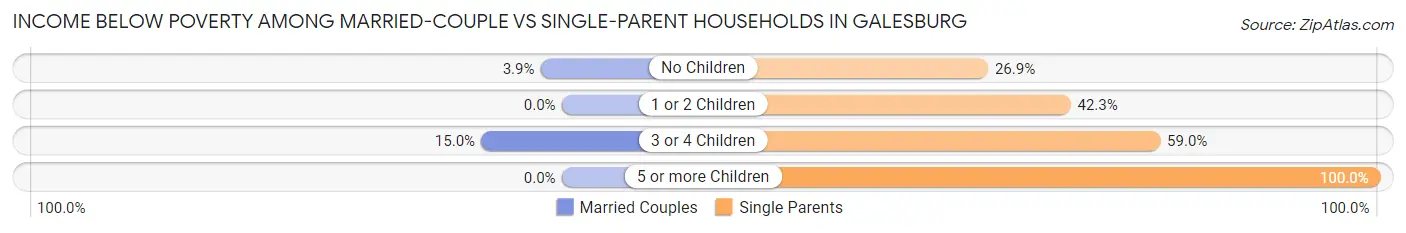
| Children | Married-Couple Families | Single-Parent Households |
| No Children | 114 (3.9%) | 211 (26.9%) |
| 1 or 2 Children | 0 (0.0%) | 377 (42.3%) |
| 3 or 4 Children | 56 (15.0%) | 112 (59.0%) |
| 5 or more Children | 0 (0.0%) | 6 (100.0%) |
| Total | 170 (4.0%) | 706 (37.7%) |
Race in Galesburg
The most populous races in Galesburg are White / Caucasian (22,634 | 75.6%), Black / African American (3,822 | 12.8%), and Hispanic or Latino (2,504 | 8.4%).
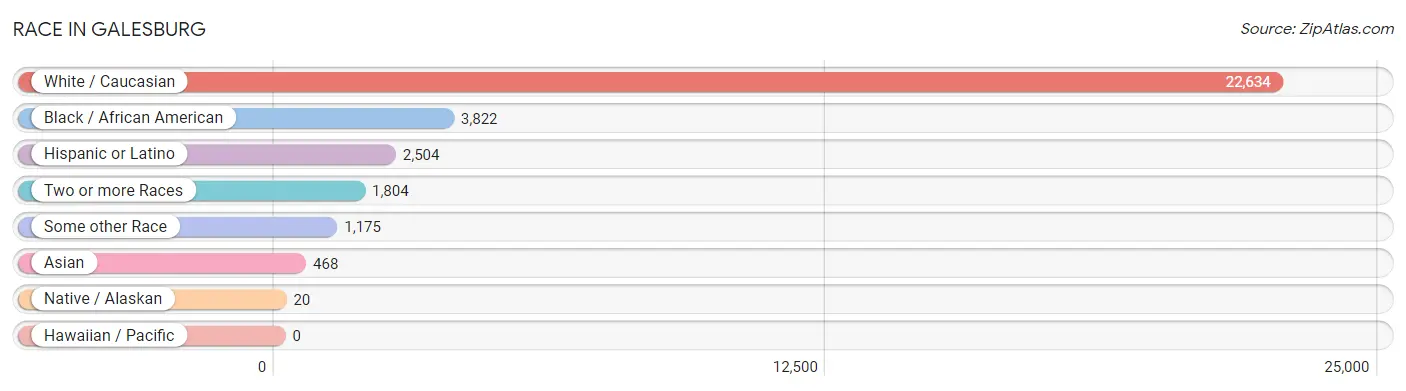
| Race | # Population | % Population |
| Asian | 468 | 1.6% |
| Black / African American | 3,822 | 12.8% |
| Hawaiian / Pacific | 0 | 0.0% |
| Hispanic or Latino | 2,504 | 8.4% |
| Native / Alaskan | 20 | 0.1% |
| White / Caucasian | 22,634 | 75.6% |
| Two or more Races | 1,804 | 6.0% |
| Some other Race | 1,175 | 3.9% |
| Total | 29,923 | 100.0% |
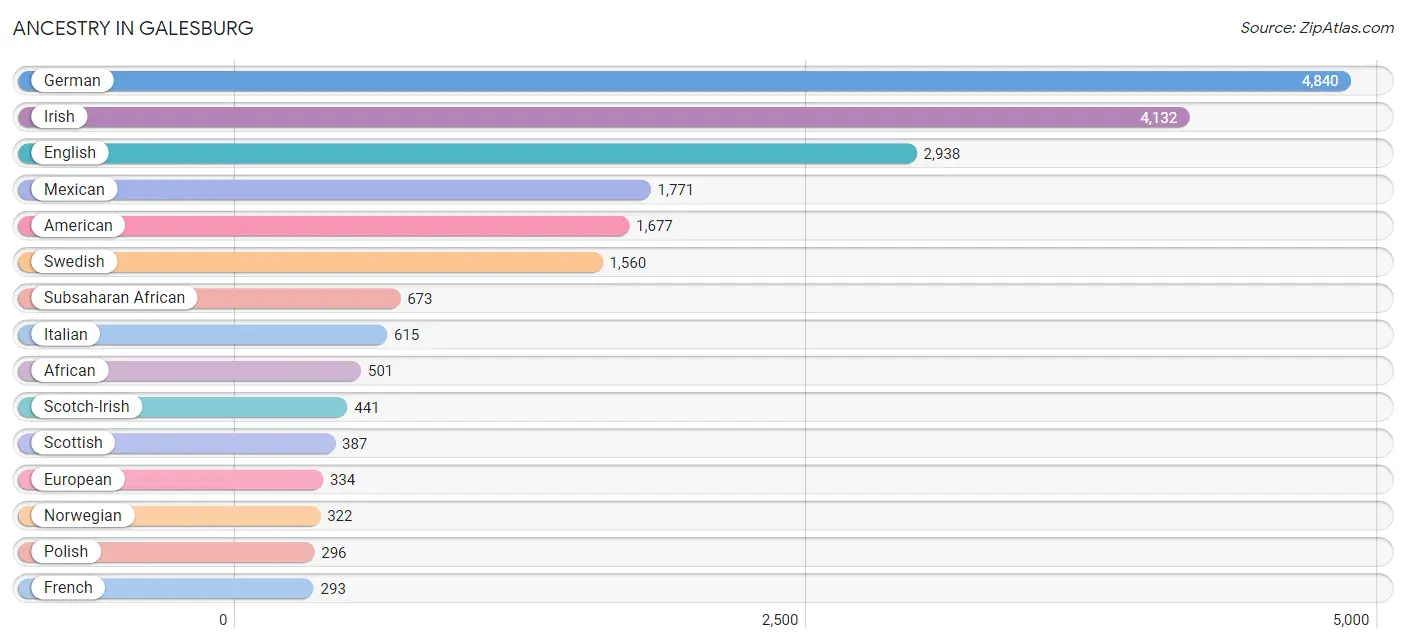
Ancestry in Galesburg
The most populous ancestries reported in Galesburg are German (4,840 | 16.2%), Irish (4,132 | 13.8%), English (2,938 | 9.8%), Mexican (1,771 | 5.9%), and American (1,677 | 5.6%), together accounting for 51.3% of all Galesburg residents.
| Ancestry | # Population | % Population |
| African | 501 | 1.7% |
| American | 1,677 | 5.6% |
| Apache | 5 | 0.0% |
| Arab | 2 | 0.0% |
| Armenian | 37 | 0.1% |
| Austrian | 51 | 0.2% |
| Belgian | 58 | 0.2% |
| Bhutanese | 33 | 0.1% |
| British | 149 | 0.5% |
| Celtic | 28 | 0.1% |
| Central American | 239 | 0.8% |
| Central American Indian | 37 | 0.1% |
| Cherokee | 16 | 0.1% |
| Colombian | 34 | 0.1% |
| Comanche | 9 | 0.0% |
| Croatian | 7 | 0.0% |
| Cuban | 16 | 0.1% |
| Czech | 61 | 0.2% |
| Czechoslovakian | 10 | 0.0% |
| Danish | 36 | 0.1% |
| Dominican | 21 | 0.1% |
| Dutch | 275 | 0.9% |
| Eastern European | 49 | 0.2% |
| English | 2,938 | 9.8% |
| Ethiopian | 11 | 0.0% |
| European | 334 | 1.1% |
| French | 293 | 1.0% |
| French Canadian | 35 | 0.1% |
| German | 4,840 | 16.2% |
| Ghanaian | 11 | 0.0% |
| Greek | 90 | 0.3% |
| Honduran | 161 | 0.5% |
| Hungarian | 56 | 0.2% |
| Indian (Asian) | 127 | 0.4% |
| Iranian | 18 | 0.1% |
| Irish | 4,132 | 13.8% |
| Israeli | 11 | 0.0% |
| Italian | 615 | 2.1% |
| Korean | 99 | 0.3% |
| Lithuanian | 16 | 0.1% |
| Luxembourger | 37 | 0.1% |
| Malaysian | 18 | 0.1% |
| Mexican | 1,771 | 5.9% |
| Navajo | 6 | 0.0% |
| Nicaraguan | 78 | 0.3% |
| Nigerian | 20 | 0.1% |
| Northern European | 52 | 0.2% |
| Norwegian | 322 | 1.1% |
| Pakistani | 16 | 0.1% |
| Pennsylvania German | 14 | 0.1% |
| Peruvian | 12 | 0.0% |
| Polish | 296 | 1.0% |
| Portuguese | 28 | 0.1% |
| Puerto Rican | 270 | 0.9% |
| Russian | 60 | 0.2% |
| Scandinavian | 104 | 0.4% |
| Scotch-Irish | 441 | 1.5% |
| Scottish | 387 | 1.3% |
| Sioux | 4 | 0.0% |
| South American | 46 | 0.2% |
| Spaniard | 28 | 0.1% |
| Sri Lankan | 98 | 0.3% |
| Subsaharan African | 673 | 2.2% |
| Swedish | 1,560 | 5.2% |
| Swiss | 70 | 0.2% |
| Thai | 166 | 0.5% |
| Ukrainian | 6 | 0.0% |
| Welsh | 116 | 0.4% |
| Yugoslavian | 19 | 0.1% |
| Yuman | 4 | 0.0% | View All 70 Rows |
Immigrants in Galesburg
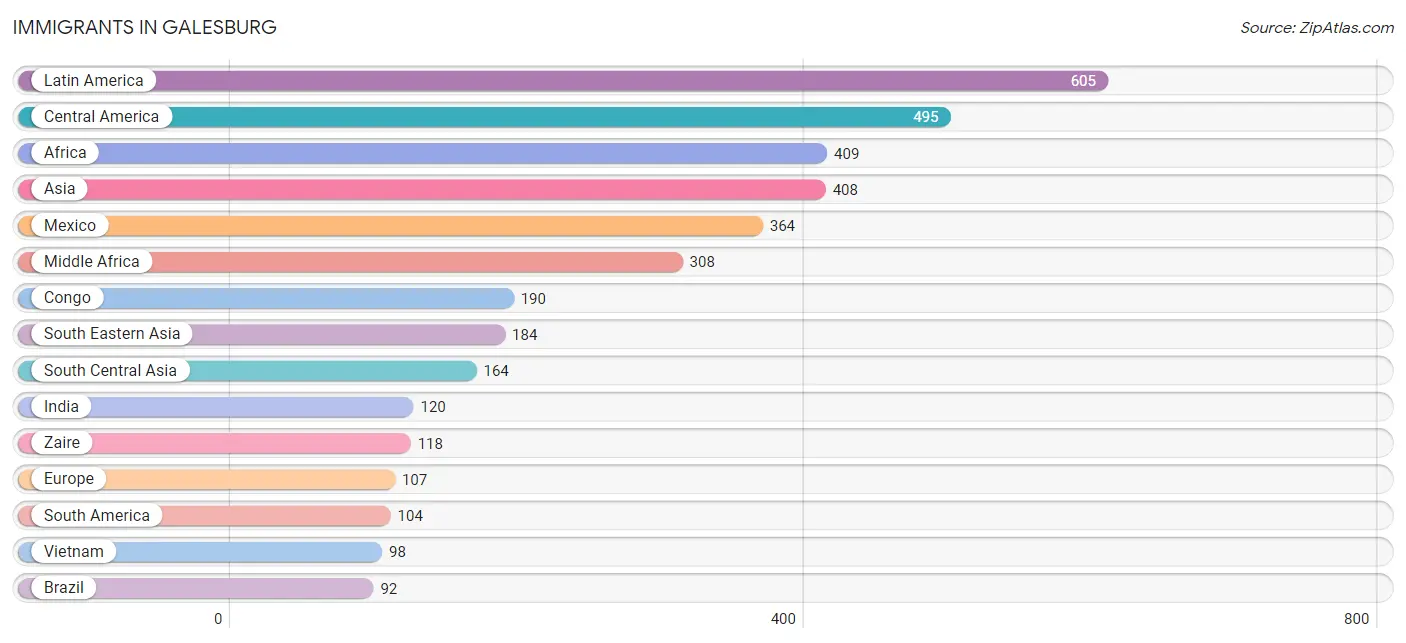
The most numerous immigrant groups reported in Galesburg came from Latin America (605 | 2.0%), Central America (495 | 1.7%), Africa (409 | 1.4%), Asia (408 | 1.4%), and Mexico (364 | 1.2%), together accounting for 7.6% of all Galesburg residents.
| Immigration Origin | # Population | % Population |
| Africa | 409 | 1.4% |
| Asia | 408 | 1.4% |
| Australia | 22 | 0.1% |
| Austria | 21 | 0.1% |
| Brazil | 92 | 0.3% |
| Caribbean | 6 | 0.0% |
| Central America | 495 | 1.7% |
| China | 56 | 0.2% |
| Congo | 190 | 0.6% |
| Cuba | 6 | 0.0% |
| Eastern Africa | 26 | 0.1% |
| Eastern Asia | 60 | 0.2% |
| Ethiopia | 26 | 0.1% |
| Europe | 107 | 0.4% |
| Germany | 21 | 0.1% |
| Ghana | 11 | 0.0% |
| Guatemala | 5 | 0.0% |
| Honduras | 48 | 0.2% |
| India | 120 | 0.4% |
| Japan | 4 | 0.0% |
| Laos | 6 | 0.0% |
| Latin America | 605 | 2.0% |
| Mexico | 364 | 1.2% |
| Middle Africa | 308 | 1.0% |
| Nepal | 10 | 0.0% |
| Netherlands | 7 | 0.0% |
| Nicaragua | 78 | 0.3% |
| Northern Europe | 6 | 0.0% |
| Oceania | 22 | 0.1% |
| Peru | 12 | 0.0% |
| Philippines | 76 | 0.3% |
| Portugal | 15 | 0.1% |
| South America | 104 | 0.4% |
| South Central Asia | 164 | 0.5% |
| South Eastern Asia | 184 | 0.6% |
| Southern Europe | 52 | 0.2% |
| Spain | 37 | 0.1% |
| Sri Lanka | 34 | 0.1% |
| Sweden | 6 | 0.0% |
| Thailand | 4 | 0.0% |
| Vietnam | 98 | 0.3% |
| Western Africa | 11 | 0.0% |
| Western Europe | 49 | 0.2% |
| Zaire | 118 | 0.4% | View All 44 Rows |
Sex and Age in Galesburg
Sex and Age in Galesburg
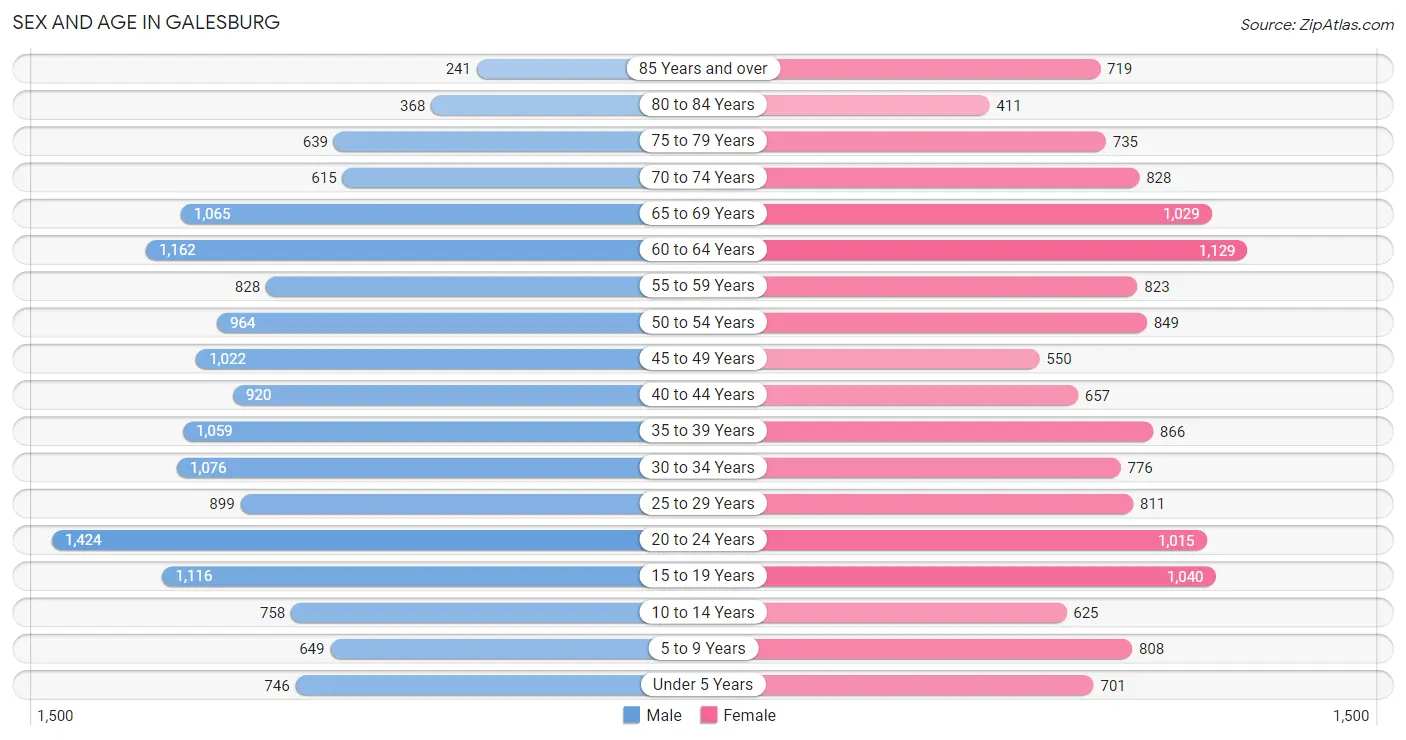
The most populous age groups in Galesburg are 20 to 24 Years (1,424 | 9.2%) for men and 60 to 64 Years (1,129 | 7.9%) for women.
| Age Bracket | Male | Female |
| Under 5 Years | 746 (4.8%) | 701 (4.9%) |
| 5 to 9 Years | 649 (4.2%) | 808 (5.6%) |
| 10 to 14 Years | 758 (4.9%) | 625 (4.3%) |
| 15 to 19 Years | 1,116 (7.2%) | 1,040 (7.2%) |
| 20 to 24 Years | 1,424 (9.2%) | 1,015 (7.1%) |
| 25 to 29 Years | 899 (5.8%) | 811 (5.6%) |
| 30 to 34 Years | 1,076 (6.9%) | 776 (5.4%) |
| 35 to 39 Years | 1,059 (6.8%) | 866 (6.0%) |
| 40 to 44 Years | 920 (5.9%) | 657 (4.6%) |
| 45 to 49 Years | 1,022 (6.6%) | 550 (3.8%) |
| 50 to 54 Years | 964 (6.2%) | 849 (5.9%) |
| 55 to 59 Years | 828 (5.3%) | 823 (5.7%) |
| 60 to 64 Years | 1,162 (7.5%) | 1,129 (7.9%) |
| 65 to 69 Years | 1,065 (6.9%) | 1,029 (7.2%) |
| 70 to 74 Years | 615 (4.0%) | 828 (5.8%) |
| 75 to 79 Years | 639 (4.1%) | 735 (5.1%) |
| 80 to 84 Years | 368 (2.4%) | 411 (2.9%) |
| 85 Years and over | 241 (1.5%) | 719 (5.0%) |
| Total | 15,551 (100.0%) | 14,372 (100.0%) |
Families and Households in Galesburg
Median Family Size in Galesburg
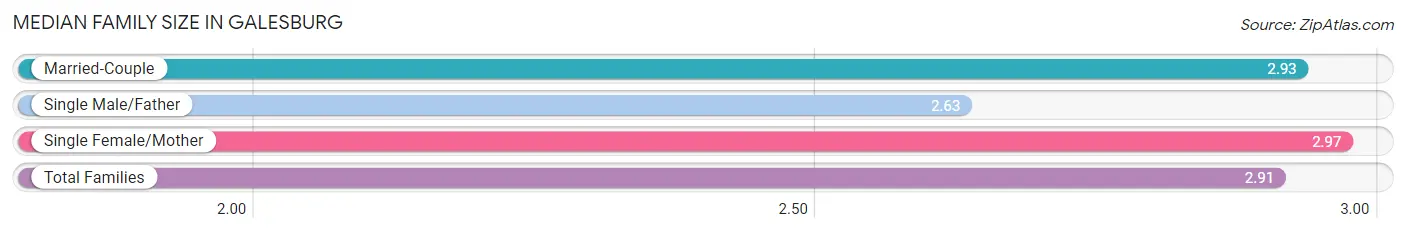
The median family size in Galesburg is 2.91 persons per family, with single female/mother families (1,219 | 19.8%) accounting for the largest median family size of 2.97 persons per family. On the other hand, single male/father families (654 | 10.6%) represent the smallest median family size with 2.63 persons per family.
| Family Type | # Families | Family Size |
| Married-Couple | 4,298 (69.7%) | 2.93 |
| Single Male/Father | 654 (10.6%) | 2.63 |
| Single Female/Mother | 1,219 (19.8%) | 2.97 |
| Total Families | 6,171 (100.0%) | 2.91 |
Median Household Size in Galesburg
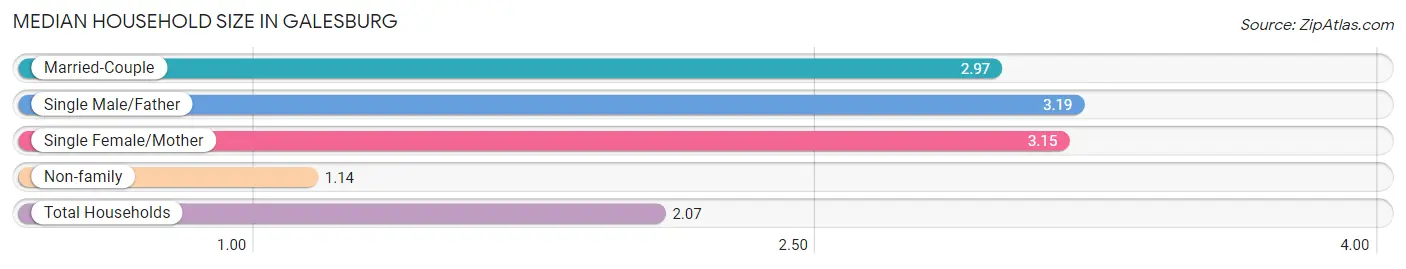
The median household size in Galesburg is 2.07 persons per household, with single male/father households (654 | 5.2%) accounting for the largest median household size of 3.19 persons per household. non-family households (6,439 | 51.1%) represent the smallest median household size with 1.14 persons per household.
| Household Type | # Households | Household Size |
| Married-Couple | 4,298 (34.1%) | 2.97 |
| Single Male/Father | 654 (5.2%) | 3.19 |
| Single Female/Mother | 1,219 (9.7%) | 3.15 |
| Non-family | 6,439 (51.1%) | 1.14 |
| Total Households | 12,610 (100.0%) | 2.07 |
Household Size by Marriage Status in Galesburg
Out of a total of 12,610 households in Galesburg, 6,171 (48.9%) are family households, while 6,439 (51.1%) are nonfamily households. The most numerous type of family households are 2-person households, comprising 3,087, and the most common type of nonfamily households are 1-person households, comprising 5,708.
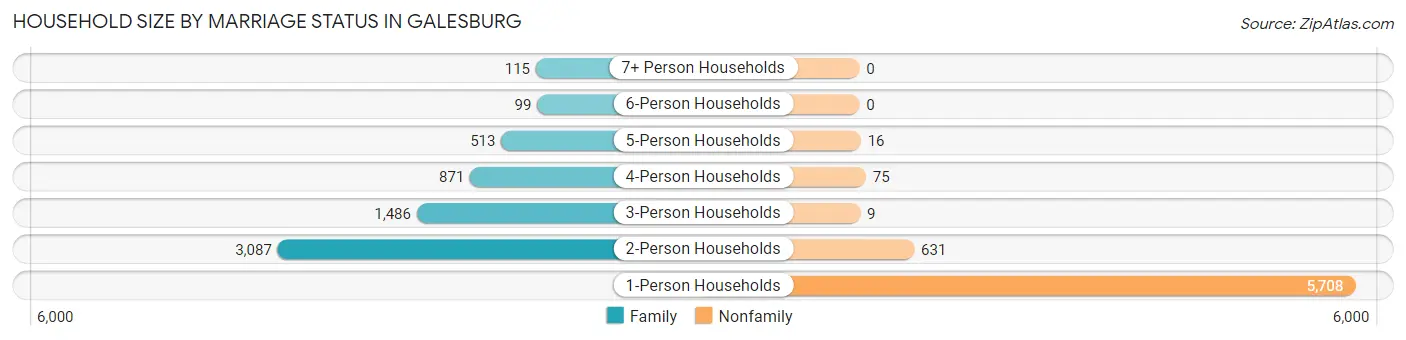
| Household Size | Family Households | Nonfamily Households |
| 1-Person Households | - | 5,708 (45.3%) |
| 2-Person Households | 3,087 (24.5%) | 631 (5.0%) |
| 3-Person Households | 1,486 (11.8%) | 9 (0.1%) |
| 4-Person Households | 871 (6.9%) | 75 (0.6%) |
| 5-Person Households | 513 (4.1%) | 16 (0.1%) |
| 6-Person Households | 99 (0.8%) | 0 (0.0%) |
| 7+ Person Households | 115 (0.9%) | 0 (0.0%) |
| Total | 6,171 (48.9%) | 6,439 (51.1%) |
Female Fertility in Galesburg
Fertility by Age in Galesburg
Average fertility rate in Galesburg is 61.0 births per 1,000 women. Women in the age bracket of 20 to 34 years have the highest fertility rate with 86.0 births per 1,000 women. Women in the age bracket of 20 to 34 years acount for 63.7% of all women with births.
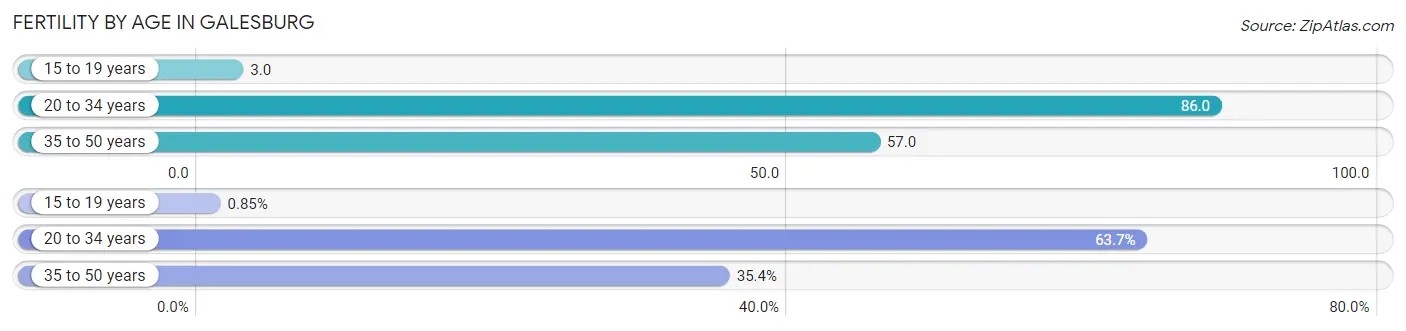
| Age Bracket | Women with Births | Births / 1,000 Women |
| 15 to 19 years | 3 (0.9%) | 3.0 |
| 20 to 34 years | 225 (63.7%) | 86.0 |
| 35 to 50 years | 125 (35.4%) | 57.0 |
| Total | 353 (100.0%) | 61.0 |
Fertility by Age by Marriage Status in Galesburg
64.0% of women with births (353) in Galesburg are married. The highest percentage of unmarried women with births falls into 15 to 19 years age bracket with 100.0% of them unmarried at the time of birth, while the lowest percentage of unmarried women with births belong to 35 to 50 years age bracket with 31.2% of them unmarried.
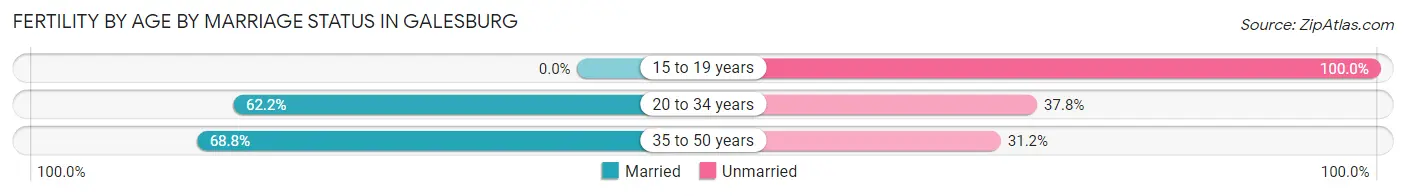
| Age Bracket | Married | Unmarried |
| 15 to 19 years | 0 (0.0%) | 3 (100.0%) |
| 20 to 34 years | 140 (62.2%) | 85 (37.8%) |
| 35 to 50 years | 86 (68.8%) | 39 (31.2%) |
| Total | 226 (64.0%) | 127 (36.0%) |
Fertility by Education in Galesburg
Average fertility rate in Galesburg is 61.0 births per 1,000 women. Women with the education attainment of high school diploma have the highest fertility rate of 112.0 births per 1,000 women, while women with the education attainment of less than high school have the lowest fertility at 23.0 births per 1,000 women. Women with the education attainment of high school diploma represent 41.9% of all women with births.
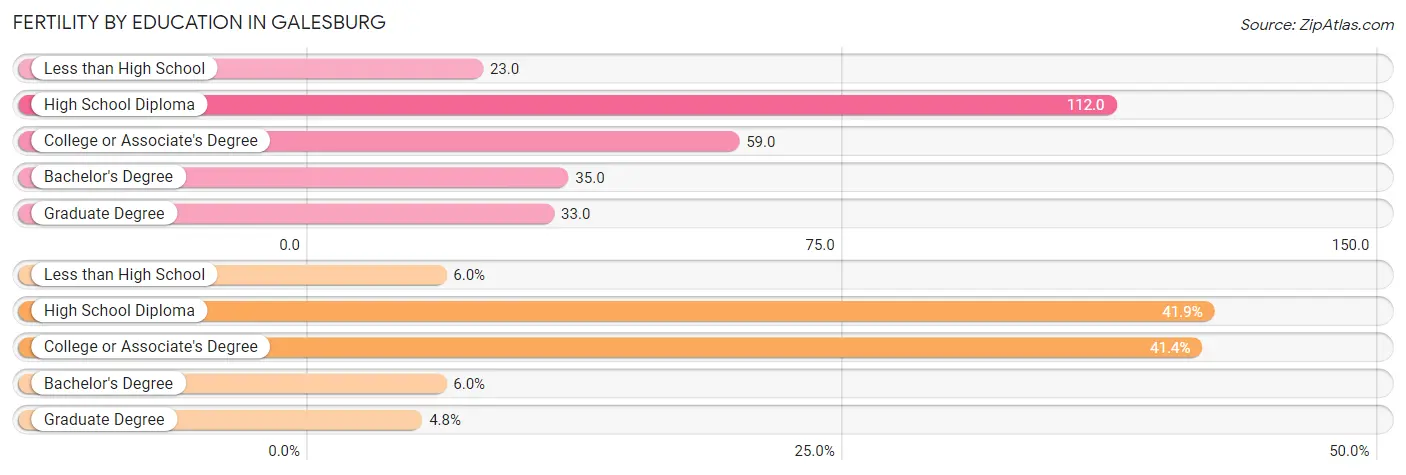
| Educational Attainment | Women with Births | Births / 1,000 Women |
| Less than High School | 21 (5.9%) | 23.0 |
| High School Diploma | 148 (41.9%) | 112.0 |
| College or Associate's Degree | 146 (41.4%) | 59.0 |
| Bachelor's Degree | 21 (5.9%) | 35.0 |
| Graduate Degree | 17 (4.8%) | 33.0 |
| Total | 353 (100.0%) | 61.0 |
Fertility by Education by Marriage Status in Galesburg
36.0% of women with births in Galesburg are unmarried. Women with the educational attainment of less than high school are most likely to be married with 100.0% of them married at childbirth, while women with the educational attainment of college or associate's degree are least likely to be married with 61.6% of them unmarried at childbirth.
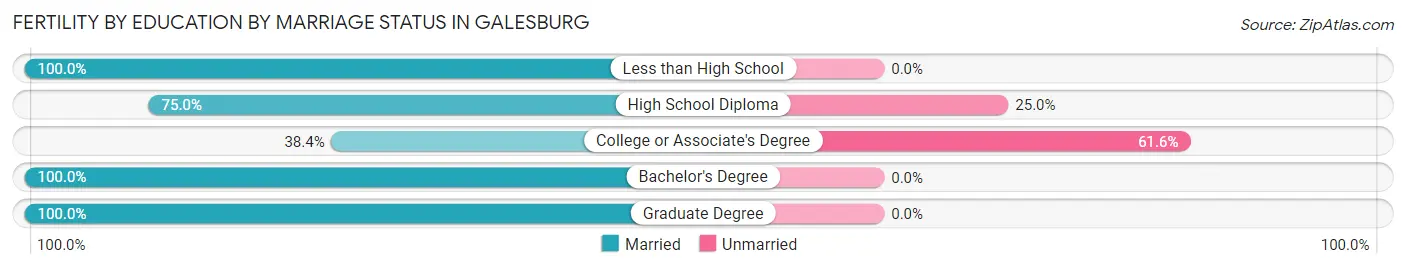
| Educational Attainment | Married | Unmarried |
| Less than High School | 21 (100.0%) | 0 (0.0%) |
| High School Diploma | 111 (75.0%) | 37 (25.0%) |
| College or Associate's Degree | 56 (38.4%) | 90 (61.6%) |
| Bachelor's Degree | 21 (100.0%) | 0 (0.0%) |
| Graduate Degree | 17 (100.0%) | 0 (0.0%) |
| Total | 226 (64.0%) | 127 (36.0%) |
Employment Characteristics in Galesburg
Employment by Class of Employer in Galesburg
Among the 11,431 employed individuals in Galesburg, private company employees (7,759 | 67.9%), not-for-profit organizations (1,555 | 13.6%), and local government employees (1,092 | 9.6%) make up the most common classes of employment.
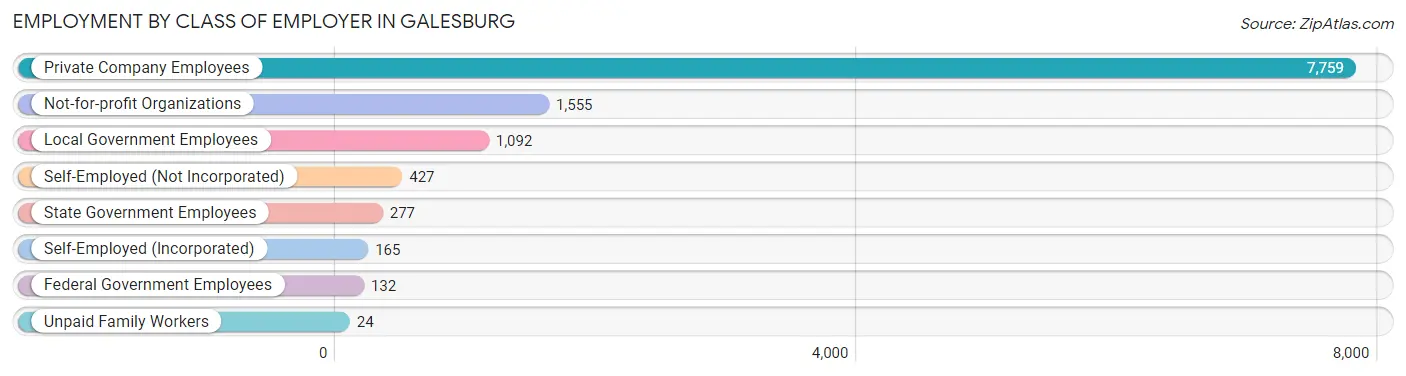
| Employer Class | # Employees | % Employees |
| Private Company Employees | 7,759 | 67.9% |
| Self-Employed (Incorporated) | 165 | 1.4% |
| Self-Employed (Not Incorporated) | 427 | 3.7% |
| Not-for-profit Organizations | 1,555 | 13.6% |
| Local Government Employees | 1,092 | 9.6% |
| State Government Employees | 277 | 2.4% |
| Federal Government Employees | 132 | 1.1% |
| Unpaid Family Workers | 24 | 0.2% |
| Total | 11,431 | 100.0% |
Employment Status by Age in Galesburg
According to the labor force statistics for Galesburg, out of the total population over 16 years of age (25,297), 48.6% or 12,294 individuals are in the labor force, with 5.2% or 639 of them unemployed. The age group with the highest labor force participation rate is 30 to 34 years, with 67.5% or 1,250 individuals in the labor force. Within the labor force, the 16 to 19 years age range has the highest percentage of unemployed individuals, with 19.7% or 202 of them being unemployed.
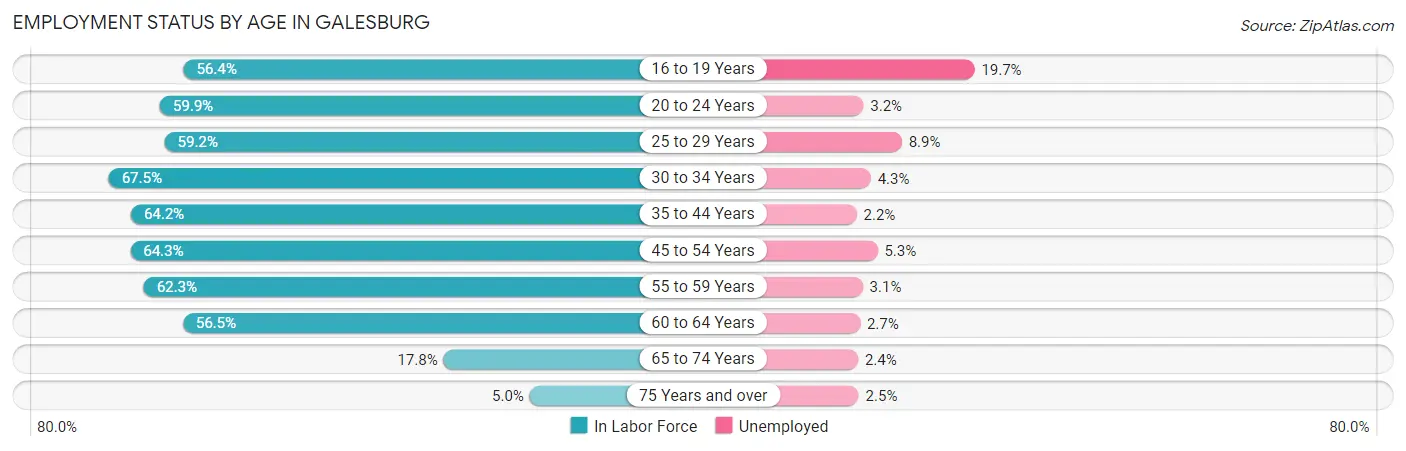
| Age Bracket | In Labor Force | Unemployed |
| 16 to 19 Years | 1,025 (56.4%) | 202 (19.7%) |
| 20 to 24 Years | 1,461 (59.9%) | 47 (3.2%) |
| 25 to 29 Years | 1,012 (59.2%) | 90 (8.9%) |
| 30 to 34 Years | 1,250 (67.5%) | 54 (4.3%) |
| 35 to 44 Years | 2,248 (64.2%) | 49 (2.2%) |
| 45 to 54 Years | 2,177 (64.3%) | 115 (5.3%) |
| 55 to 59 Years | 1,029 (62.3%) | 32 (3.1%) |
| 60 to 64 Years | 1,294 (56.5%) | 35 (2.7%) |
| 65 to 74 Years | 630 (17.8%) | 15 (2.4%) |
| 75 Years and over | 156 (5.0%) | 4 (2.5%) |
| Total | 12,294 (48.6%) | 639 (5.2%) |
Employment Status by Educational Attainment in Galesburg
According to labor force statistics for Galesburg, 62.6% of individuals (9,009) out of the total population between 25 and 64 years of age (14,391) are in the labor force, with 4.2% or 378 of them being unemployed. The group with the highest labor force participation rate are those with the educational attainment of bachelor's degree or higher, with 90.4% or 2,520 individuals in the labor force. Within the labor force, individuals with less than high school education have the highest percentage of unemployment, with 15.8% or 90 of them being unemployed.
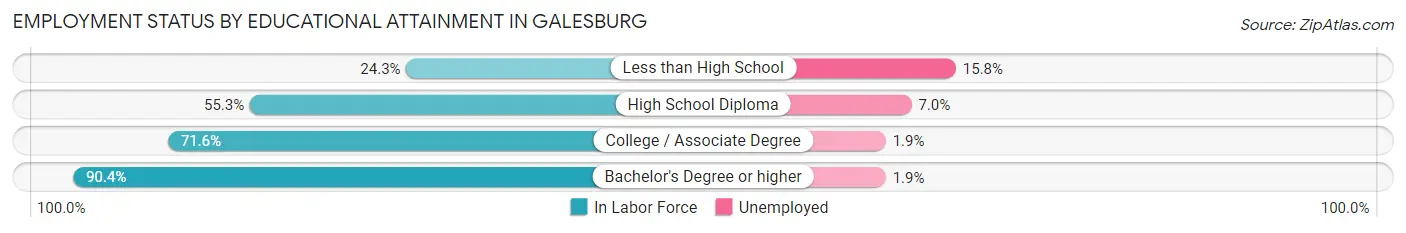
| Educational Attainment | In Labor Force | Unemployed |
| Less than High School | 569 (24.3%) | 370 (15.8%) |
| High School Diploma | 2,422 (55.3%) | 307 (7.0%) |
| College / Associate Degree | 3,496 (71.6%) | 93 (1.9%) |
| Bachelor's Degree or higher | 2,520 (90.4%) | 53 (1.9%) |
| Total | 9,009 (62.6%) | 604 (4.2%) |
Employment Occupations by Sex in Galesburg
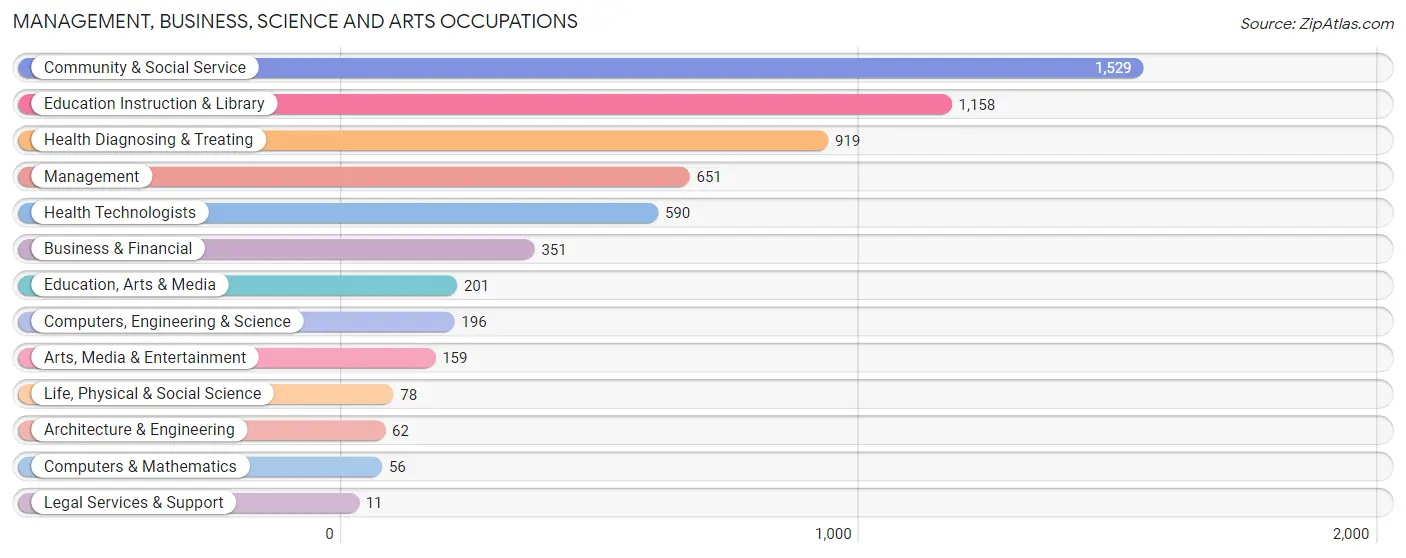
Management, Business, Science and Arts Occupations
The most common Management, Business, Science and Arts occupations in Galesburg are Community & Social Service (1,529 | 13.1%), Education Instruction & Library (1,158 | 10.0%), Health Diagnosing & Treating (919 | 7.9%), Management (651 | 5.6%), and Health Technologists (590 | 5.1%).
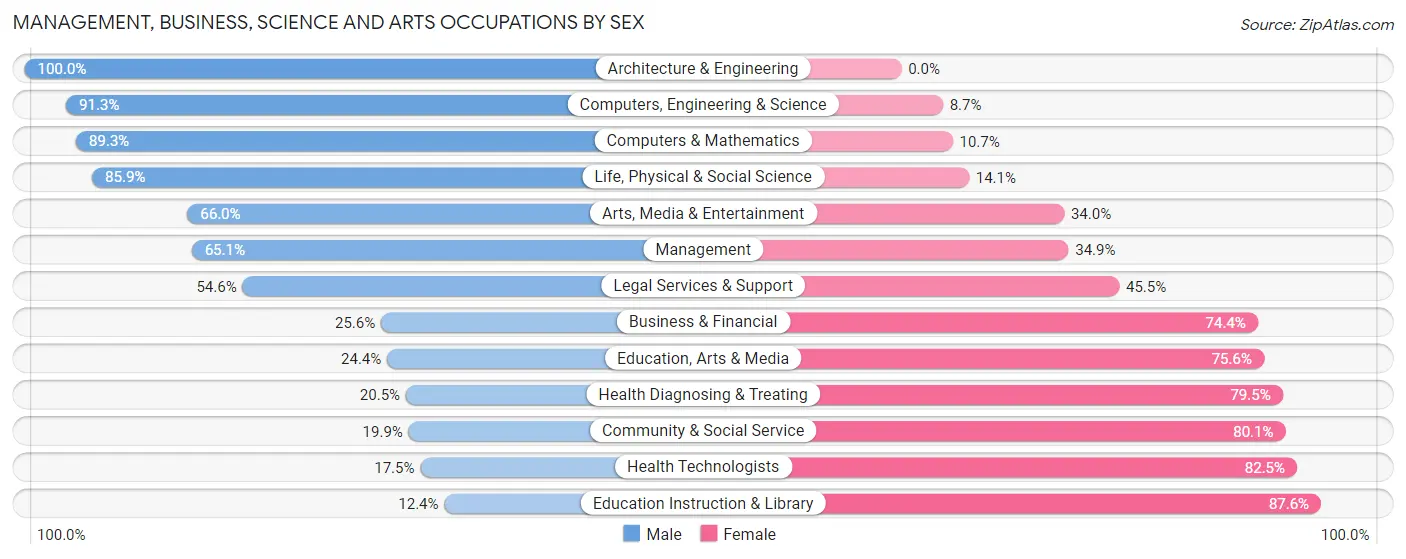
Management, Business, Science and Arts Occupations by Sex
Within the Management, Business, Science and Arts occupations in Galesburg, the most male-oriented occupations are Architecture & Engineering (100.0%), Computers, Engineering & Science (91.3%), and Computers & Mathematics (89.3%), while the most female-oriented occupations are Education Instruction & Library (87.6%), Health Technologists (82.5%), and Community & Social Service (80.1%).
| Occupation | Male | Female |
| Management | 424 (65.1%) | 227 (34.9%) |
| Business & Financial | 90 (25.6%) | 261 (74.4%) |
| Computers, Engineering & Science | 179 (91.3%) | 17 (8.7%) |
| Computers & Mathematics | 50 (89.3%) | 6 (10.7%) |
| Architecture & Engineering | 62 (100.0%) | 0 (0.0%) |
| Life, Physical & Social Science | 67 (85.9%) | 11 (14.1%) |
| Community & Social Service | 304 (19.9%) | 1,225 (80.1%) |
| Education, Arts & Media | 49 (24.4%) | 152 (75.6%) |
| Legal Services & Support | 6 (54.5%) | 5 (45.5%) |
| Education Instruction & Library | 144 (12.4%) | 1,014 (87.6%) |
| Arts, Media & Entertainment | 105 (66.0%) | 54 (34.0%) |
| Health Diagnosing & Treating | 188 (20.5%) | 731 (79.5%) |
| Health Technologists | 103 (17.5%) | 487 (82.5%) |
| Total (Category) | 1,185 (32.5%) | 2,461 (67.5%) |
| Total (Overall) | 5,806 (49.9%) | 5,830 (50.1%) |
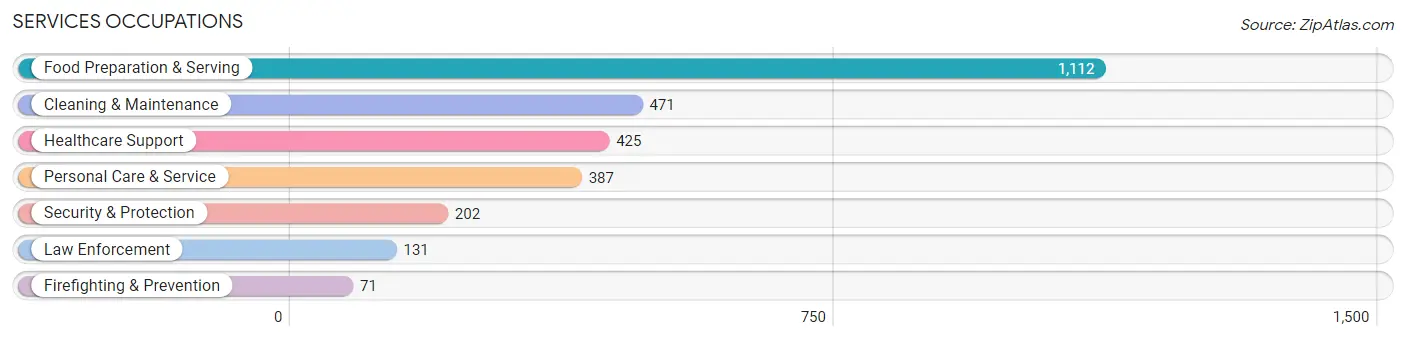
Services Occupations
The most common Services occupations in Galesburg are Food Preparation & Serving (1,112 | 9.6%), Cleaning & Maintenance (471 | 4.1%), Healthcare Support (425 | 3.6%), Personal Care & Service (387 | 3.3%), and Security & Protection (202 | 1.7%).
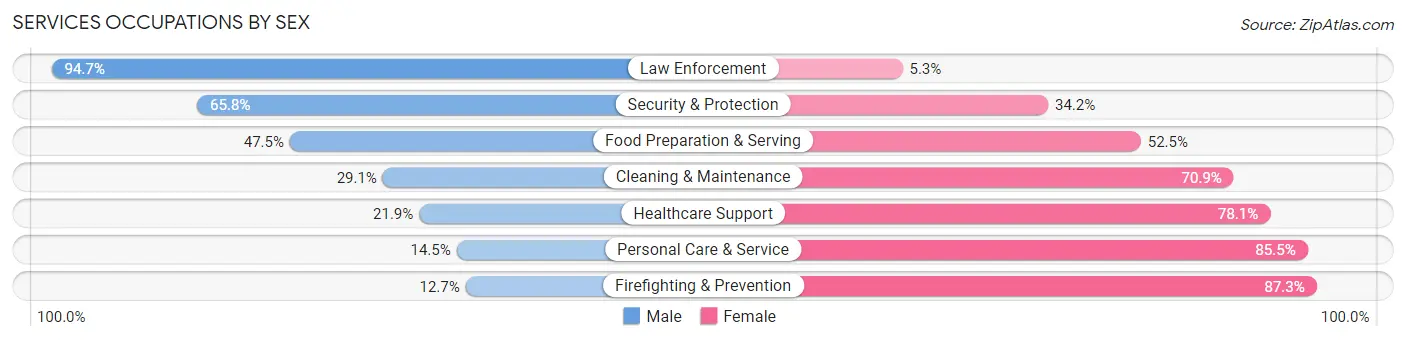
Services Occupations by Sex
Within the Services occupations in Galesburg, the most male-oriented occupations are Law Enforcement (94.7%), Security & Protection (65.8%), and Food Preparation & Serving (47.5%), while the most female-oriented occupations are Firefighting & Prevention (87.3%), Personal Care & Service (85.5%), and Healthcare Support (78.1%).
| Occupation | Male | Female |
| Healthcare Support | 93 (21.9%) | 332 (78.1%) |
| Security & Protection | 133 (65.8%) | 69 (34.2%) |
| Firefighting & Prevention | 9 (12.7%) | 62 (87.3%) |
| Law Enforcement | 124 (94.7%) | 7 (5.3%) |
| Food Preparation & Serving | 528 (47.5%) | 584 (52.5%) |
| Cleaning & Maintenance | 137 (29.1%) | 334 (70.9%) |
| Personal Care & Service | 56 (14.5%) | 331 (85.5%) |
| Total (Category) | 947 (36.5%) | 1,650 (63.5%) |
| Total (Overall) | 5,806 (49.9%) | 5,830 (50.1%) |
Sales and Office Occupations
The most common Sales and Office occupations in Galesburg are Sales & Related (1,348 | 11.6%), and Office & Administration (954 | 8.2%).

Sales and Office Occupations by Sex
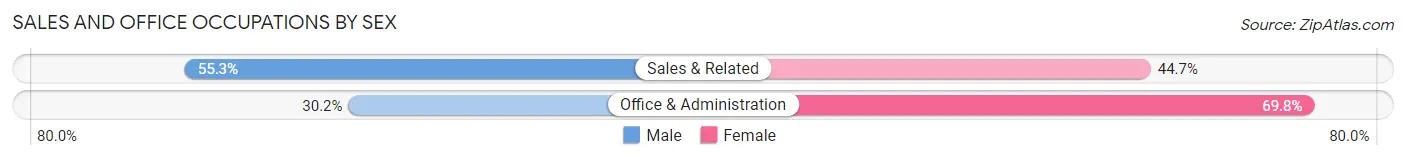
| Occupation | Male | Female |
| Sales & Related | 746 (55.3%) | 602 (44.7%) |
| Office & Administration | 288 (30.2%) | 666 (69.8%) |
| Total (Category) | 1,034 (44.9%) | 1,268 (55.1%) |
| Total (Overall) | 5,806 (49.9%) | 5,830 (50.1%) |
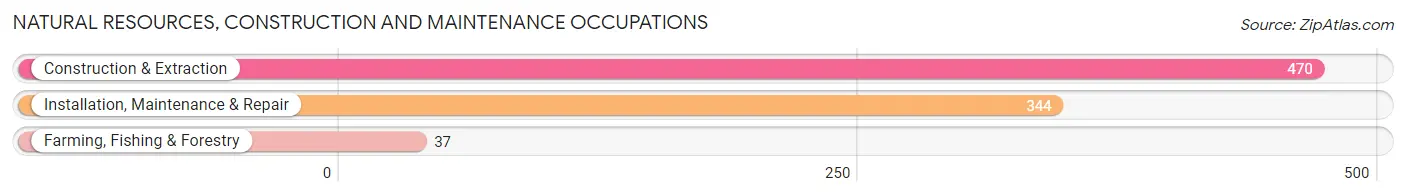
Natural Resources, Construction and Maintenance Occupations
The most common Natural Resources, Construction and Maintenance occupations in Galesburg are Construction & Extraction (470 | 4.0%), Installation, Maintenance & Repair (344 | 3.0%), and Farming, Fishing & Forestry (37 | 0.3%).
Natural Resources, Construction and Maintenance Occupations by Sex
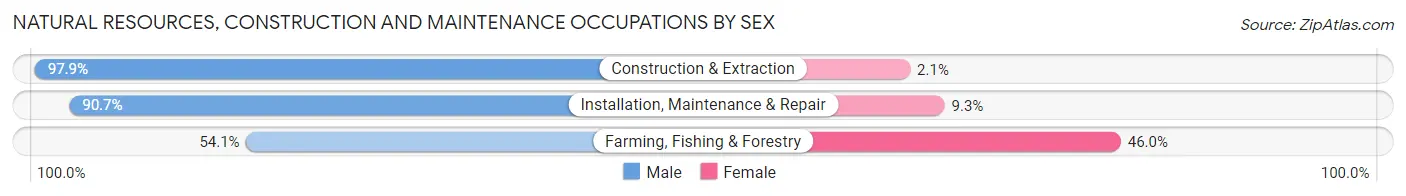
| Occupation | Male | Female |
| Farming, Fishing & Forestry | 20 (54.0%) | 17 (46.0%) |
| Construction & Extraction | 460 (97.9%) | 10 (2.1%) |
| Installation, Maintenance & Repair | 312 (90.7%) | 32 (9.3%) |
| Total (Category) | 792 (93.1%) | 59 (6.9%) |
| Total (Overall) | 5,806 (49.9%) | 5,830 (50.1%) |
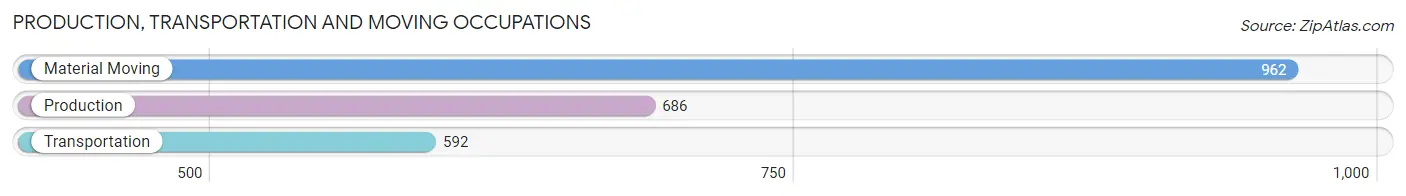
Production, Transportation and Moving Occupations
The most common Production, Transportation and Moving occupations in Galesburg are Material Moving (962 | 8.3%), Production (686 | 5.9%), and Transportation (592 | 5.1%).
Production, Transportation and Moving Occupations by Sex
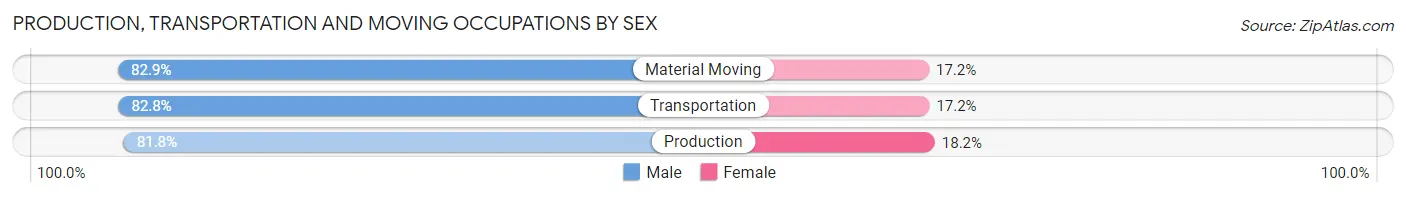
| Occupation | Male | Female |
| Production | 561 (81.8%) | 125 (18.2%) |
| Transportation | 490 (82.8%) | 102 (17.2%) |
| Material Moving | 797 (82.9%) | 165 (17.2%) |
| Total (Category) | 1,848 (82.5%) | 392 (17.5%) |
| Total (Overall) | 5,806 (49.9%) | 5,830 (50.1%) |
Employment Industries by Sex in Galesburg
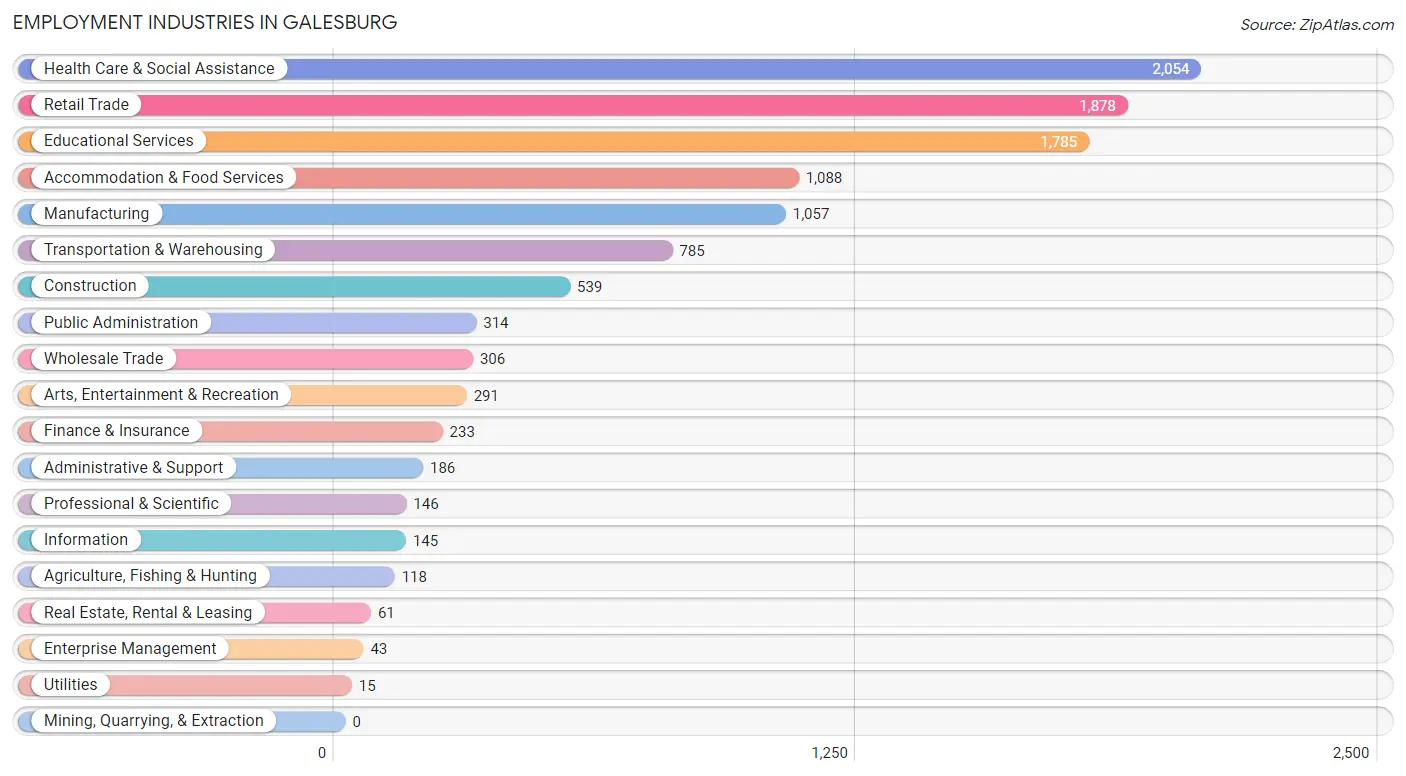
Employment Industries in Galesburg
The major employment industries in Galesburg include Health Care & Social Assistance (2,054 | 17.6%), Retail Trade (1,878 | 16.1%), Educational Services (1,785 | 15.3%), Accommodation & Food Services (1,088 | 9.3%), and Manufacturing (1,057 | 9.1%).
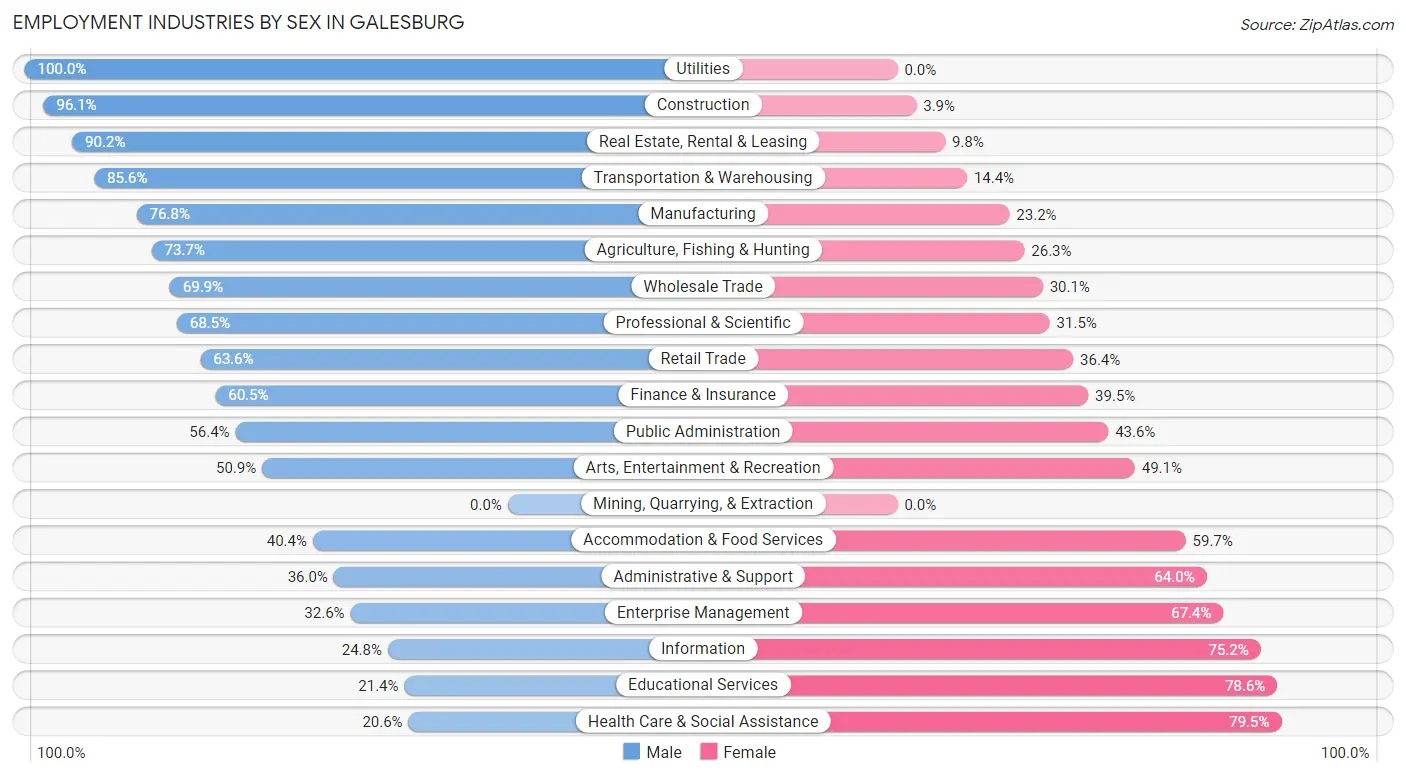
Employment Industries by Sex in Galesburg
The Galesburg industries that see more men than women are Utilities (100.0%), Construction (96.1%), and Real Estate, Rental & Leasing (90.2%), whereas the industries that tend to have a higher number of women are Health Care & Social Assistance (79.4%), Educational Services (78.6%), and Information (75.2%).
| Industry | Male | Female |
| Agriculture, Fishing & Hunting | 87 (73.7%) | 31 (26.3%) |
| Mining, Quarrying, & Extraction | 0 (0.0%) | 0 (0.0%) |
| Construction | 518 (96.1%) | 21 (3.9%) |
| Manufacturing | 812 (76.8%) | 245 (23.2%) |
| Wholesale Trade | 214 (69.9%) | 92 (30.1%) |
| Retail Trade | 1,195 (63.6%) | 683 (36.4%) |
| Transportation & Warehousing | 672 (85.6%) | 113 (14.4%) |
| Utilities | 15 (100.0%) | 0 (0.0%) |
| Information | 36 (24.8%) | 109 (75.2%) |
| Finance & Insurance | 141 (60.5%) | 92 (39.5%) |
| Real Estate, Rental & Leasing | 55 (90.2%) | 6 (9.8%) |
| Professional & Scientific | 100 (68.5%) | 46 (31.5%) |
| Enterprise Management | 14 (32.6%) | 29 (67.4%) |
| Administrative & Support | 67 (36.0%) | 119 (64.0%) |
| Educational Services | 382 (21.4%) | 1,403 (78.6%) |
| Health Care & Social Assistance | 422 (20.5%) | 1,632 (79.4%) |
| Arts, Entertainment & Recreation | 148 (50.9%) | 143 (49.1%) |
| Accommodation & Food Services | 439 (40.4%) | 649 (59.7%) |
| Public Administration | 177 (56.4%) | 137 (43.6%) |
| Total | 5,806 (49.9%) | 5,830 (50.1%) |
Education in Galesburg
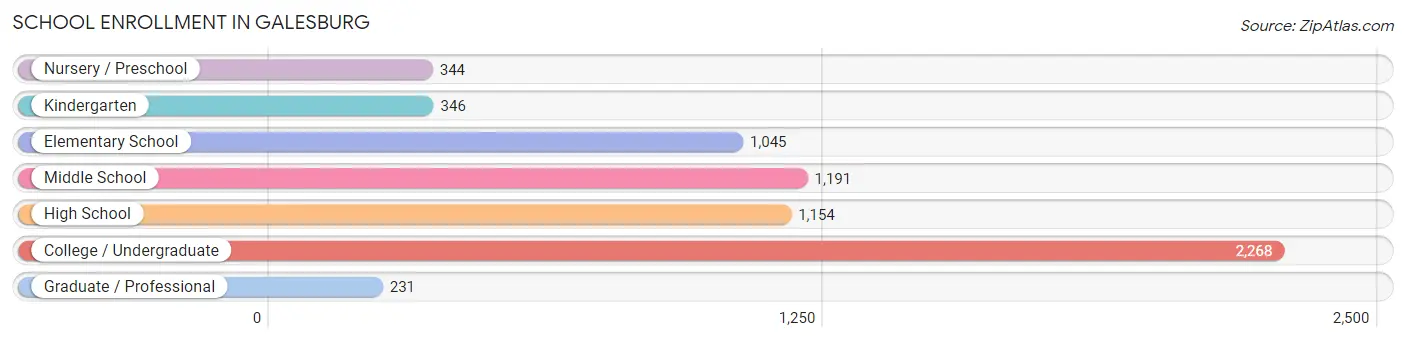
School Enrollment in Galesburg
The most common levels of schooling among the 6,579 students in Galesburg are college / undergraduate (2,268 | 34.5%), middle school (1,191 | 18.1%), and high school (1,154 | 17.5%).
| School Level | # Students | % Students |
| Nursery / Preschool | 344 | 5.2% |
| Kindergarten | 346 | 5.3% |
| Elementary School | 1,045 | 15.9% |
| Middle School | 1,191 | 18.1% |
| High School | 1,154 | 17.5% |
| College / Undergraduate | 2,268 | 34.5% |
| Graduate / Professional | 231 | 3.5% |
| Total | 6,579 | 100.0% |
School Enrollment by Age by Funding Source in Galesburg
Out of a total of 6,579 students who are enrolled in schools in Galesburg, 1,875 (28.5%) attend a private institution, while the remaining 4,704 (71.5%) are enrolled in public schools. The age group of 20 to 24 year olds has the highest likelihood of being enrolled in private schools, with 813 (64.4% in the age bracket) enrolled. Conversely, the age group of 3 to 4 year olds has the lowest likelihood of being enrolled in a private school, with 220 (93.6% in the age bracket) attending a public institution.
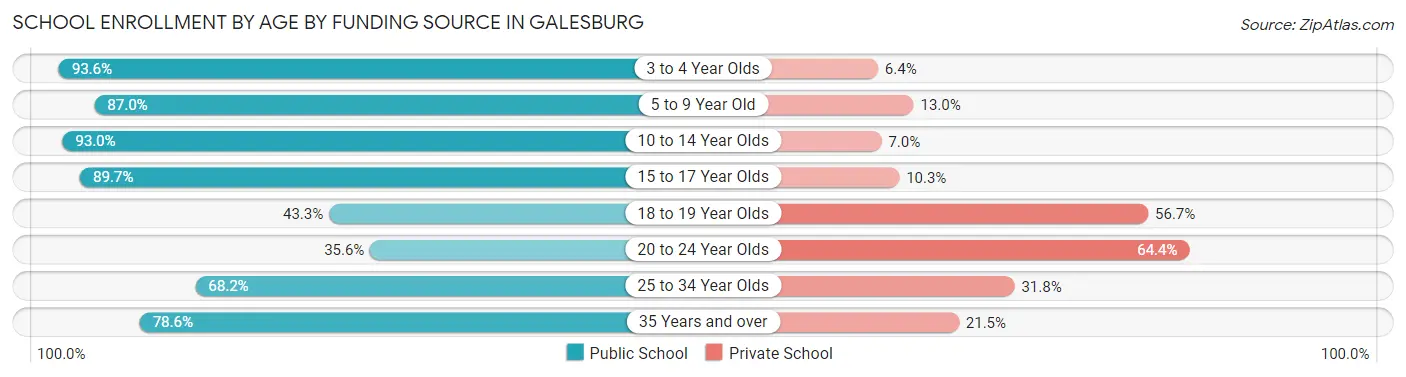
| Age Bracket | Public School | Private School |
| 3 to 4 Year Olds | 220 (93.6%) | 15 (6.4%) |
| 5 to 9 Year Old | 1,224 (87.0%) | 183 (13.0%) |
| 10 to 14 Year Olds | 1,281 (93.0%) | 97 (7.0%) |
| 15 to 17 Year Olds | 720 (89.7%) | 83 (10.3%) |
| 18 to 19 Year Olds | 413 (43.3%) | 541 (56.7%) |
| 20 to 24 Year Olds | 450 (35.6%) | 813 (64.4%) |
| 25 to 34 Year Olds | 180 (68.2%) | 84 (31.8%) |
| 35 Years and over | 216 (78.5%) | 59 (21.4%) |
| Total | 4,704 (71.5%) | 1,875 (28.5%) |
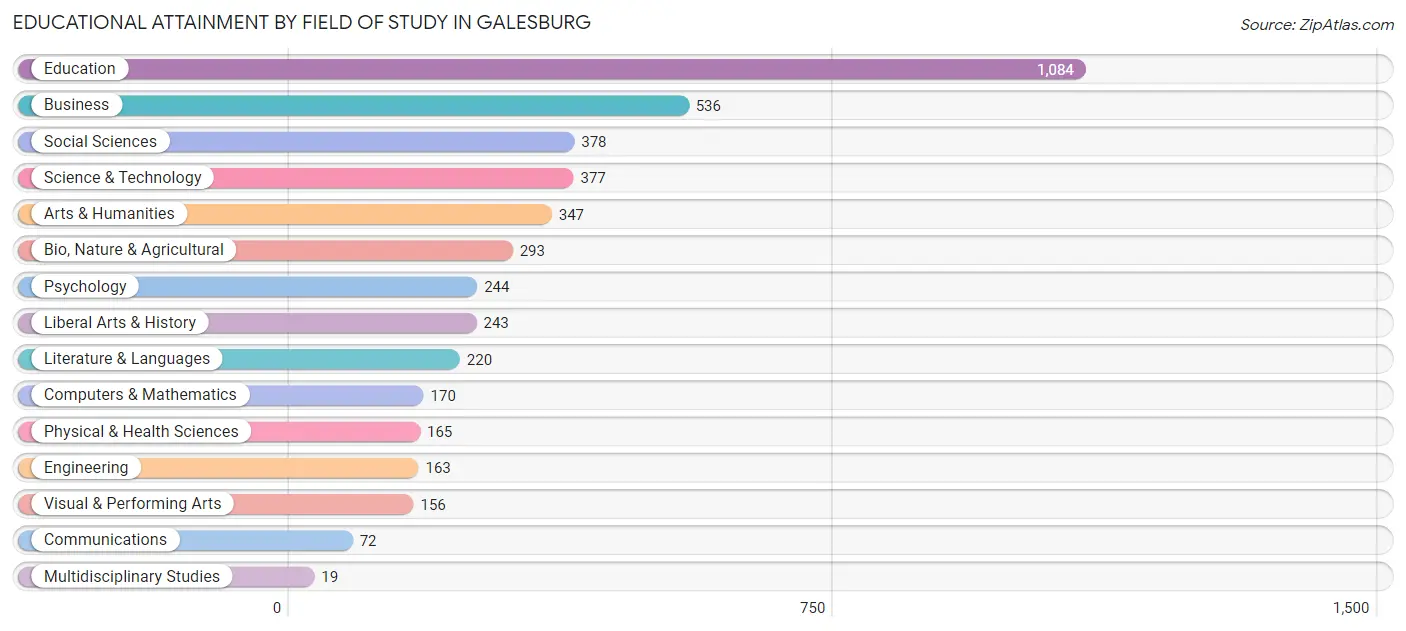
Educational Attainment by Field of Study in Galesburg
Education (1,084 | 24.3%), business (536 | 12.0%), social sciences (378 | 8.5%), science & technology (377 | 8.4%), and arts & humanities (347 | 7.8%) are the most common fields of study among 4,467 individuals in Galesburg who have obtained a bachelor's degree or higher.
| Field of Study | # Graduates | % Graduates |
| Computers & Mathematics | 170 | 3.8% |
| Bio, Nature & Agricultural | 293 | 6.6% |
| Physical & Health Sciences | 165 | 3.7% |
| Psychology | 244 | 5.5% |
| Social Sciences | 378 | 8.5% |
| Engineering | 163 | 3.6% |
| Multidisciplinary Studies | 19 | 0.4% |
| Science & Technology | 377 | 8.4% |
| Business | 536 | 12.0% |
| Education | 1,084 | 24.3% |
| Literature & Languages | 220 | 4.9% |
| Liberal Arts & History | 243 | 5.4% |
| Visual & Performing Arts | 156 | 3.5% |
| Communications | 72 | 1.6% |
| Arts & Humanities | 347 | 7.8% |
| Total | 4,467 | 100.0% |
Transportation & Commute in Galesburg
Vehicle Availability by Sex in Galesburg
The most prevalent vehicle ownership categories in Galesburg are males with 2 vehicles (2,104, accounting for 37.7%) and females with 2 vehicles (1,871, making up 39.3%).
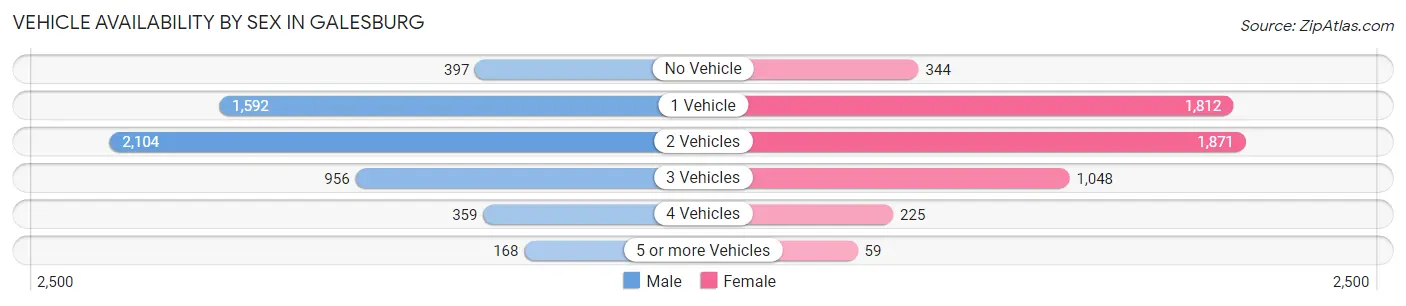
| Vehicles Available | Male | Female |
| No Vehicle | 397 (7.1%) | 344 (6.4%) |
| 1 Vehicle | 1,592 (28.5%) | 1,812 (33.8%) |
| 2 Vehicles | 2,104 (37.7%) | 1,871 (34.9%) |
| 3 Vehicles | 956 (17.1%) | 1,048 (19.6%) |
| 4 Vehicles | 359 (6.4%) | 225 (4.2%) |
| 5 or more Vehicles | 168 (3.0%) | 59 (1.1%) |
| Total | 5,576 (100.0%) | 5,359 (100.0%) |
Commute Time in Galesburg
The most frequently occuring commute durations in Galesburg are 5 to 9 minutes (3,014 commuters, 27.5%), 10 to 14 minutes (2,826 commuters, 25.8%), and 15 to 19 minutes (1,837 commuters, 16.7%).
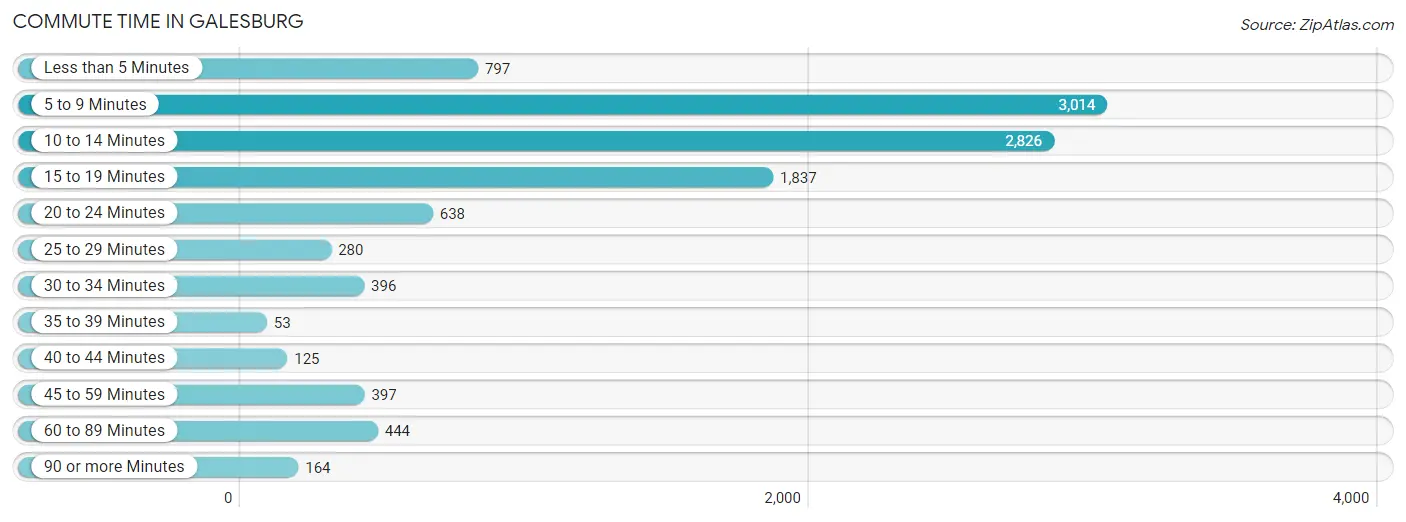
| Commute Time | # Commuters | % Commuters |
| Less than 5 Minutes | 797 | 7.3% |
| 5 to 9 Minutes | 3,014 | 27.5% |
| 10 to 14 Minutes | 2,826 | 25.8% |
| 15 to 19 Minutes | 1,837 | 16.7% |
| 20 to 24 Minutes | 638 | 5.8% |
| 25 to 29 Minutes | 280 | 2.5% |
| 30 to 34 Minutes | 396 | 3.6% |
| 35 to 39 Minutes | 53 | 0.5% |
| 40 to 44 Minutes | 125 | 1.1% |
| 45 to 59 Minutes | 397 | 3.6% |
| 60 to 89 Minutes | 444 | 4.1% |
| 90 or more Minutes | 164 | 1.5% |
Commute Time by Sex in Galesburg
The most common commute times in Galesburg are 5 to 9 minutes (1,382 commuters, 24.8%) for males and 10 to 14 minutes (1,654 commuters, 30.6%) for females.
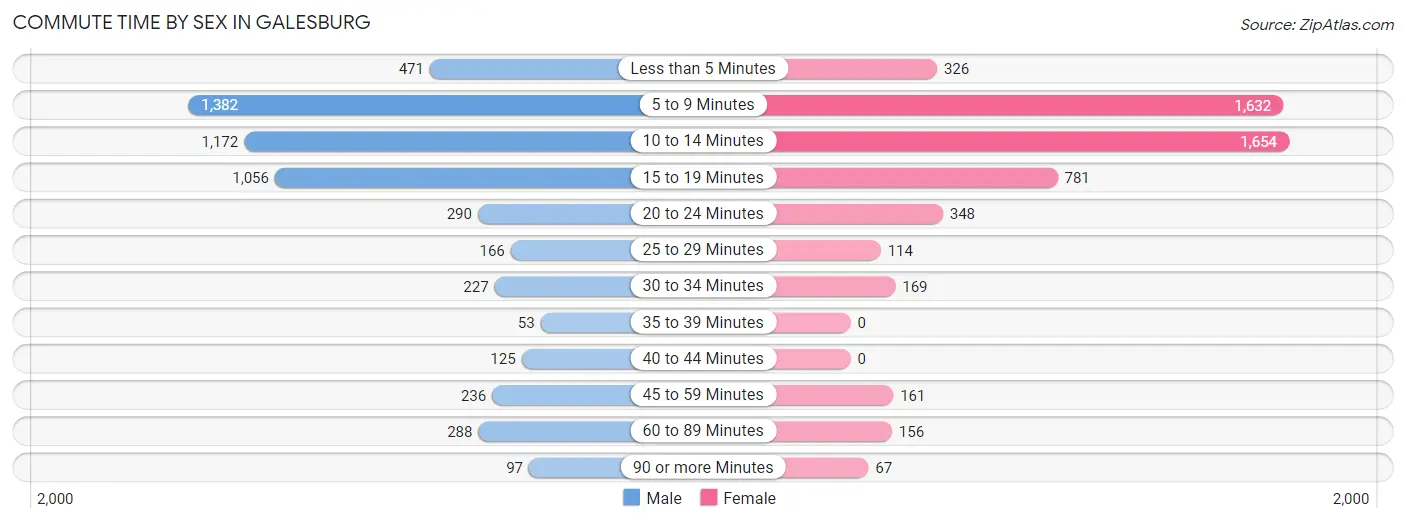
| Commute Time | Male | Female |
| Less than 5 Minutes | 471 (8.5%) | 326 (6.0%) |
| 5 to 9 Minutes | 1,382 (24.8%) | 1,632 (30.2%) |
| 10 to 14 Minutes | 1,172 (21.1%) | 1,654 (30.6%) |
| 15 to 19 Minutes | 1,056 (19.0%) | 781 (14.4%) |
| 20 to 24 Minutes | 290 (5.2%) | 348 (6.4%) |
| 25 to 29 Minutes | 166 (3.0%) | 114 (2.1%) |
| 30 to 34 Minutes | 227 (4.1%) | 169 (3.1%) |
| 35 to 39 Minutes | 53 (0.9%) | 0 (0.0%) |
| 40 to 44 Minutes | 125 (2.2%) | 0 (0.0%) |
| 45 to 59 Minutes | 236 (4.2%) | 161 (3.0%) |
| 60 to 89 Minutes | 288 (5.2%) | 156 (2.9%) |
| 90 or more Minutes | 97 (1.7%) | 67 (1.2%) |
Time of Departure to Work by Sex in Galesburg
The most frequent times of departure to work in Galesburg are 7:00 AM to 7:29 AM (922, 16.6%) for males and 12:00 PM to 3:59 PM (815, 15.1%) for females.
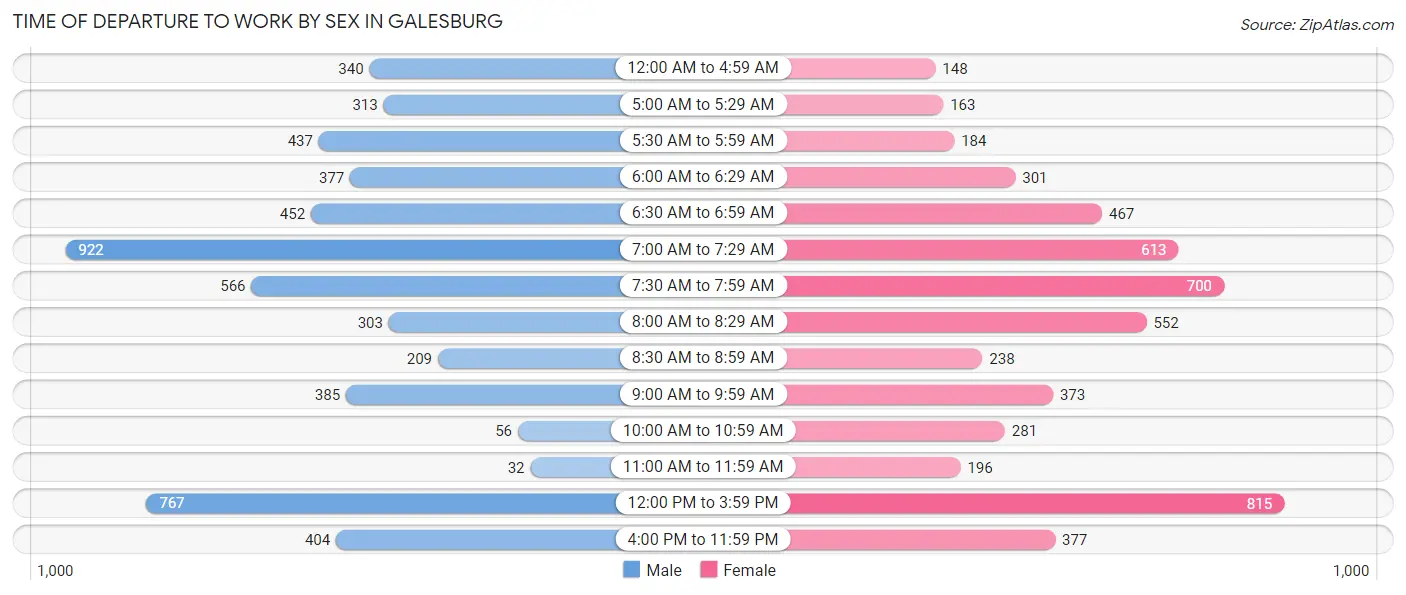
| Time of Departure | Male | Female |
| 12:00 AM to 4:59 AM | 340 (6.1%) | 148 (2.7%) |
| 5:00 AM to 5:29 AM | 313 (5.6%) | 163 (3.0%) |
| 5:30 AM to 5:59 AM | 437 (7.9%) | 184 (3.4%) |
| 6:00 AM to 6:29 AM | 377 (6.8%) | 301 (5.6%) |
| 6:30 AM to 6:59 AM | 452 (8.1%) | 467 (8.6%) |
| 7:00 AM to 7:29 AM | 922 (16.6%) | 613 (11.3%) |
| 7:30 AM to 7:59 AM | 566 (10.2%) | 700 (12.9%) |
| 8:00 AM to 8:29 AM | 303 (5.4%) | 552 (10.2%) |
| 8:30 AM to 8:59 AM | 209 (3.8%) | 238 (4.4%) |
| 9:00 AM to 9:59 AM | 385 (6.9%) | 373 (6.9%) |
| 10:00 AM to 10:59 AM | 56 (1.0%) | 281 (5.2%) |
| 11:00 AM to 11:59 AM | 32 (0.6%) | 196 (3.6%) |
| 12:00 PM to 3:59 PM | 767 (13.8%) | 815 (15.1%) |
| 4:00 PM to 11:59 PM | 404 (7.3%) | 377 (7.0%) |
| Total | 5,563 (100.0%) | 5,408 (100.0%) |
Housing Occupancy in Galesburg
Occupancy by Ownership in Galesburg
Of the total 12,610 dwellings in Galesburg, owner-occupied units account for 7,539 (59.8%), while renter-occupied units make up 5,071 (40.2%).
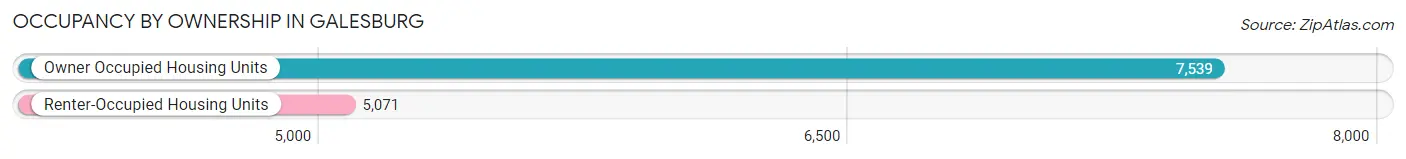
| Occupancy | # Housing Units | % Housing Units |
| Owner Occupied Housing Units | 7,539 | 59.8% |
| Renter-Occupied Housing Units | 5,071 | 40.2% |
| Total Occupied Housing Units | 12,610 | 100.0% |
Occupancy by Household Size in Galesburg
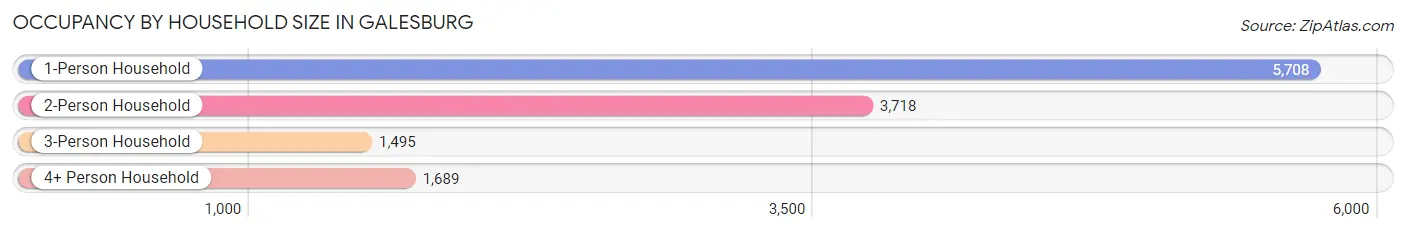
| Household Size | # Housing Units | % Housing Units |
| 1-Person Household | 5,708 | 45.3% |
| 2-Person Household | 3,718 | 29.5% |
| 3-Person Household | 1,495 | 11.9% |
| 4+ Person Household | 1,689 | 13.4% |
| Total Housing Units | 12,610 | 100.0% |
Occupancy by Ownership by Household Size in Galesburg
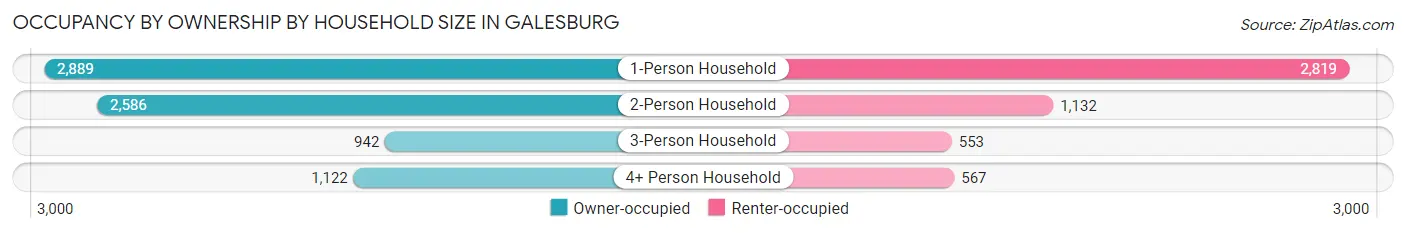
| Household Size | Owner-occupied | Renter-occupied |
| 1-Person Household | 2,889 (50.6%) | 2,819 (49.4%) |
| 2-Person Household | 2,586 (69.6%) | 1,132 (30.4%) |
| 3-Person Household | 942 (63.0%) | 553 (37.0%) |
| 4+ Person Household | 1,122 (66.4%) | 567 (33.6%) |
| Total Housing Units | 7,539 (59.8%) | 5,071 (40.2%) |
Occupancy by Educational Attainment in Galesburg
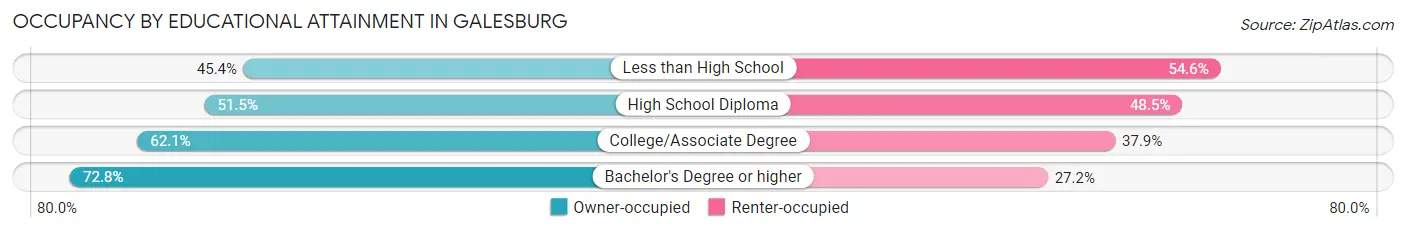
| Household Size | Owner-occupied | Renter-occupied |
| Less than High School | 570 (45.4%) | 686 (54.6%) |
| High School Diploma | 1,920 (51.5%) | 1,811 (48.5%) |
| College/Associate Degree | 2,904 (62.1%) | 1,772 (37.9%) |
| Bachelor's Degree or higher | 2,145 (72.8%) | 802 (27.2%) |
Occupancy by Age of Householder in Galesburg
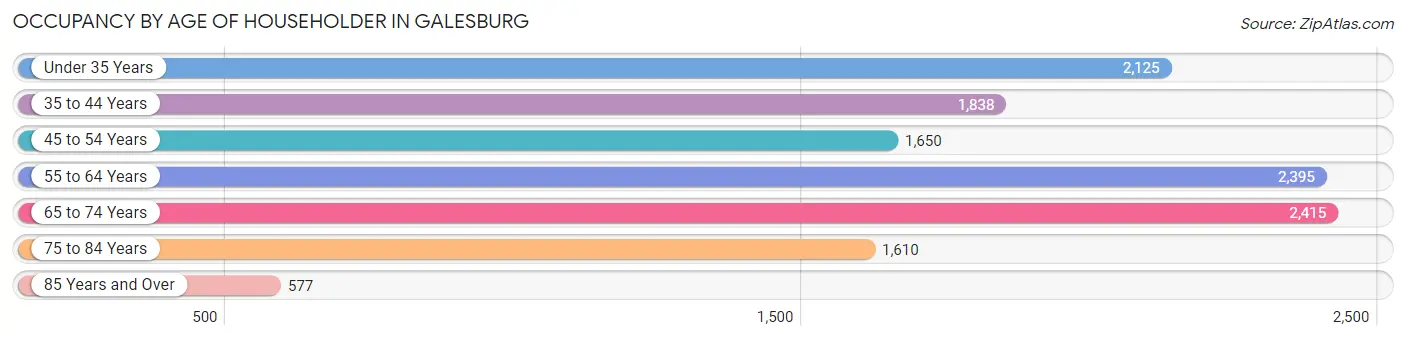
| Age Bracket | # Households | % Households |
| Under 35 Years | 2,125 | 16.9% |
| 35 to 44 Years | 1,838 | 14.6% |
| 45 to 54 Years | 1,650 | 13.1% |
| 55 to 64 Years | 2,395 | 19.0% |
| 65 to 74 Years | 2,415 | 19.2% |
| 75 to 84 Years | 1,610 | 12.8% |
| 85 Years and Over | 577 | 4.6% |
| Total | 12,610 | 100.0% |
Housing Finances in Galesburg
Median Income by Occupancy in Galesburg
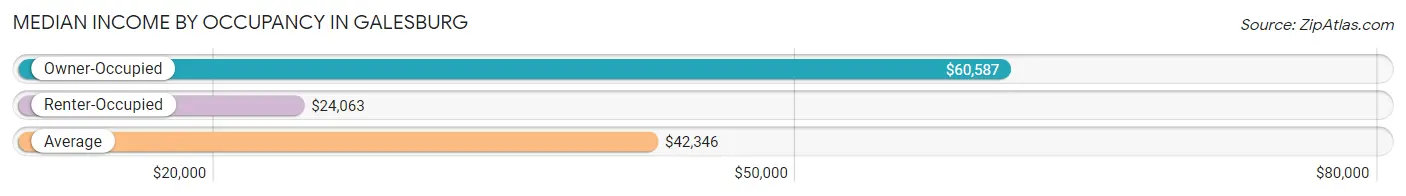
| Occupancy Type | # Households | Median Income |
| Owner-Occupied | 7,539 (59.8%) | $60,587 |
| Renter-Occupied | 5,071 (40.2%) | $24,063 |
| Average | 12,610 (100.0%) | $42,346 |
Occupancy by Householder Income Bracket in Galesburg
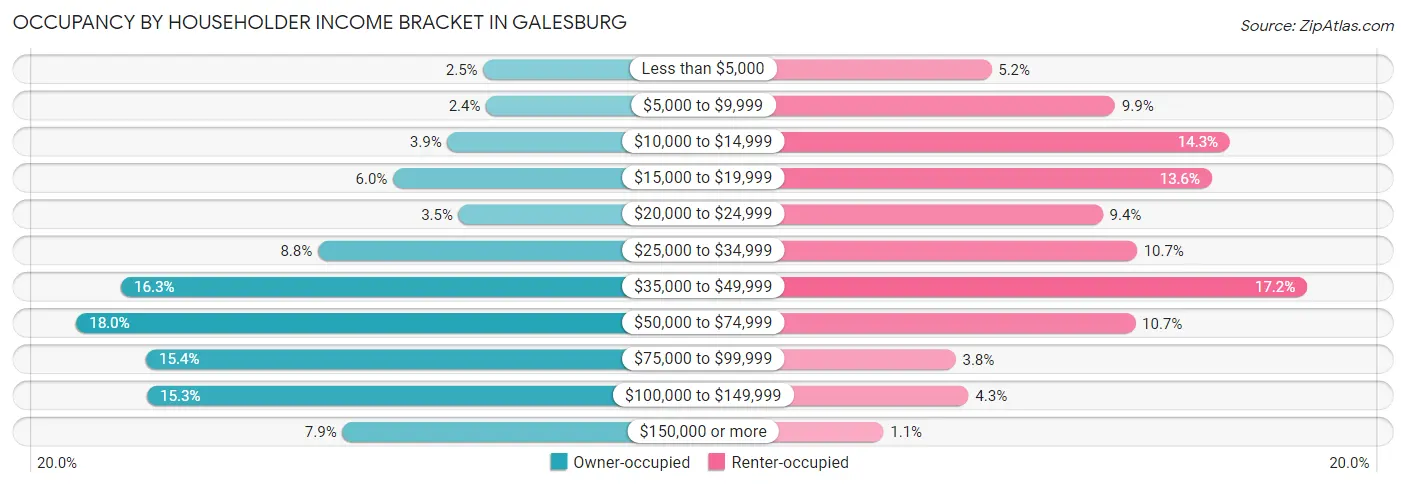
| Income Bracket | Owner-occupied | Renter-occupied |
| Less than $5,000 | 190 (2.5%) | 262 (5.2%) |
| $5,000 to $9,999 | 182 (2.4%) | 501 (9.9%) |
| $10,000 to $14,999 | 293 (3.9%) | 723 (14.3%) |
| $15,000 to $19,999 | 449 (6.0%) | 688 (13.6%) |
| $20,000 to $24,999 | 261 (3.5%) | 477 (9.4%) |
| $25,000 to $34,999 | 665 (8.8%) | 543 (10.7%) |
| $35,000 to $49,999 | 1,230 (16.3%) | 872 (17.2%) |
| $50,000 to $74,999 | 1,359 (18.0%) | 540 (10.6%) |
| $75,000 to $99,999 | 1,159 (15.4%) | 193 (3.8%) |
| $100,000 to $149,999 | 1,156 (15.3%) | 218 (4.3%) |
| $150,000 or more | 595 (7.9%) | 54 (1.1%) |
| Total | 7,539 (100.0%) | 5,071 (100.0%) |
Monthly Housing Cost Tiers in Galesburg
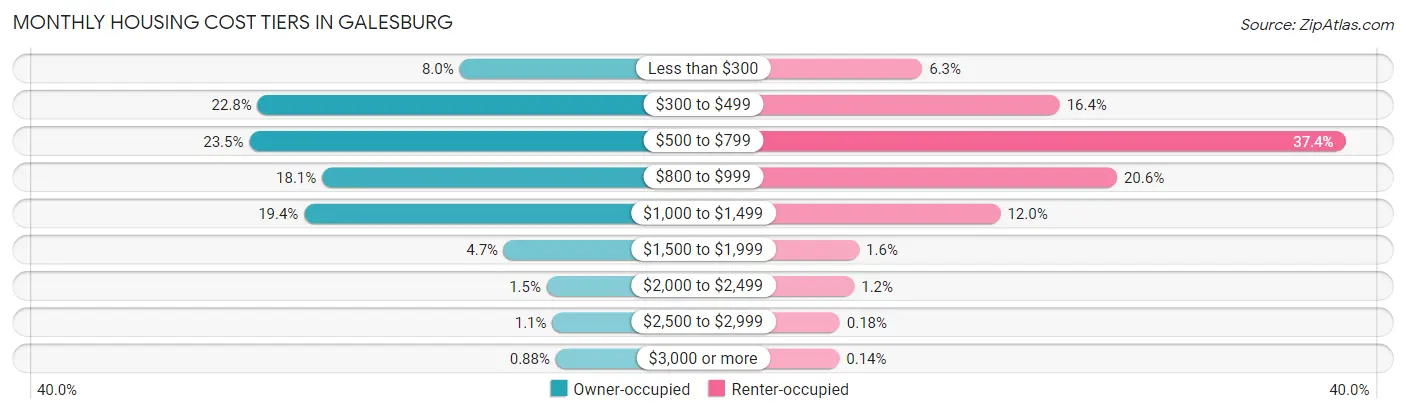
| Monthly Cost | Owner-occupied | Renter-occupied |
| Less than $300 | 601 (8.0%) | 317 (6.2%) |
| $300 to $499 | 1,722 (22.8%) | 830 (16.4%) |
| $500 to $799 | 1,768 (23.4%) | 1,897 (37.4%) |
| $800 to $999 | 1,364 (18.1%) | 1,044 (20.6%) |
| $1,000 to $1,499 | 1,463 (19.4%) | 609 (12.0%) |
| $1,500 to $1,999 | 354 (4.7%) | 81 (1.6%) |
| $2,000 to $2,499 | 116 (1.5%) | 63 (1.2%) |
| $2,500 to $2,999 | 85 (1.1%) | 9 (0.2%) |
| $3,000 or more | 66 (0.9%) | 7 (0.1%) |
| Total | 7,539 (100.0%) | 5,071 (100.0%) |
Physical Housing Characteristics in Galesburg
Housing Structures in Galesburg
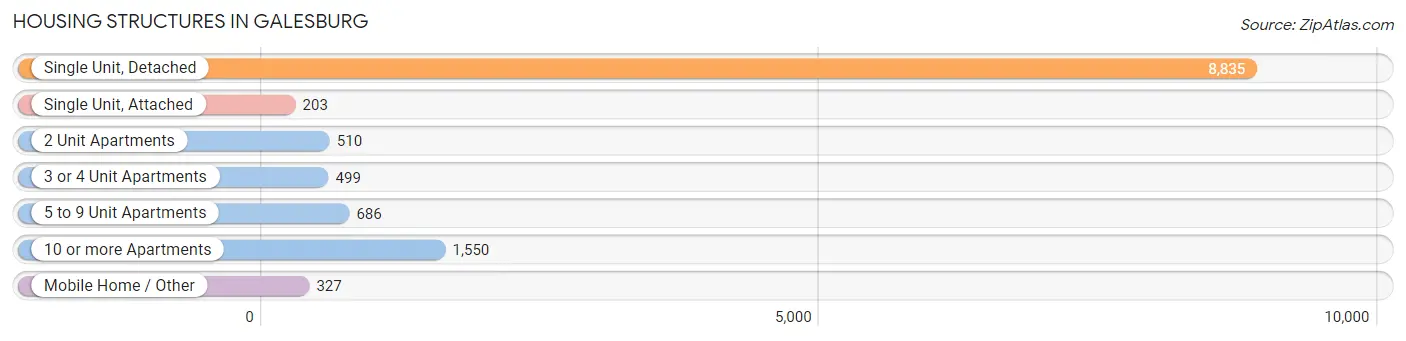
| Structure Type | # Housing Units | % Housing Units |
| Single Unit, Detached | 8,835 | 70.1% |
| Single Unit, Attached | 203 | 1.6% |
| 2 Unit Apartments | 510 | 4.0% |
| 3 or 4 Unit Apartments | 499 | 4.0% |
| 5 to 9 Unit Apartments | 686 | 5.4% |
| 10 or more Apartments | 1,550 | 12.3% |
| Mobile Home / Other | 327 | 2.6% |
| Total | 12,610 | 100.0% |
Housing Structures by Occupancy in Galesburg
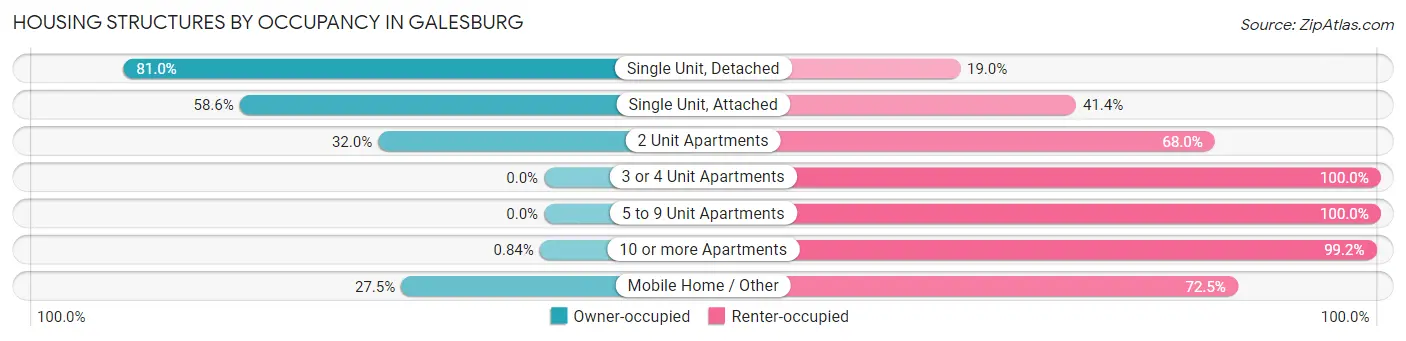
| Structure Type | Owner-occupied | Renter-occupied |
| Single Unit, Detached | 7,154 (81.0%) | 1,681 (19.0%) |
| Single Unit, Attached | 119 (58.6%) | 84 (41.4%) |
| 2 Unit Apartments | 163 (32.0%) | 347 (68.0%) |
| 3 or 4 Unit Apartments | 0 (0.0%) | 499 (100.0%) |
| 5 to 9 Unit Apartments | 0 (0.0%) | 686 (100.0%) |
| 10 or more Apartments | 13 (0.8%) | 1,537 (99.2%) |
| Mobile Home / Other | 90 (27.5%) | 237 (72.5%) |
| Total | 7,539 (59.8%) | 5,071 (40.2%) |
Housing Structures by Number of Rooms in Galesburg
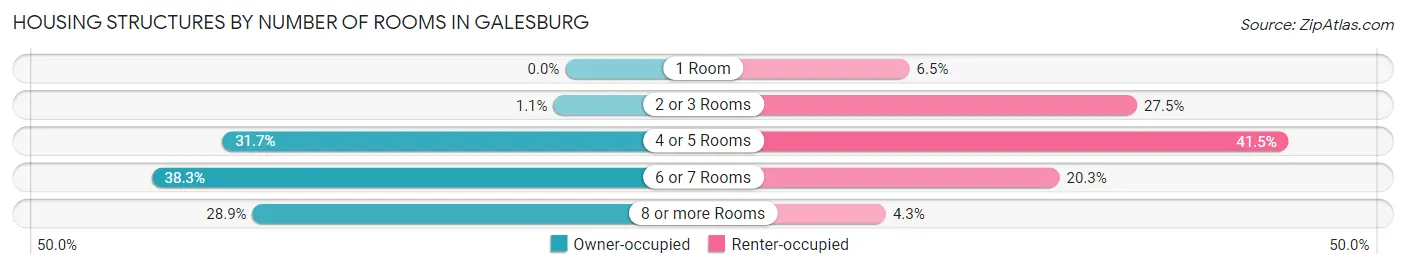
| Number of Rooms | Owner-occupied | Renter-occupied |
| 1 Room | 0 (0.0%) | 327 (6.5%) |
| 2 or 3 Rooms | 83 (1.1%) | 1,394 (27.5%) |
| 4 or 5 Rooms | 2,391 (31.7%) | 2,104 (41.5%) |
| 6 or 7 Rooms | 2,884 (38.3%) | 1,030 (20.3%) |
| 8 or more Rooms | 2,181 (28.9%) | 216 (4.3%) |
| Total | 7,539 (100.0%) | 5,071 (100.0%) |
Housing Structure by Heating Type in Galesburg
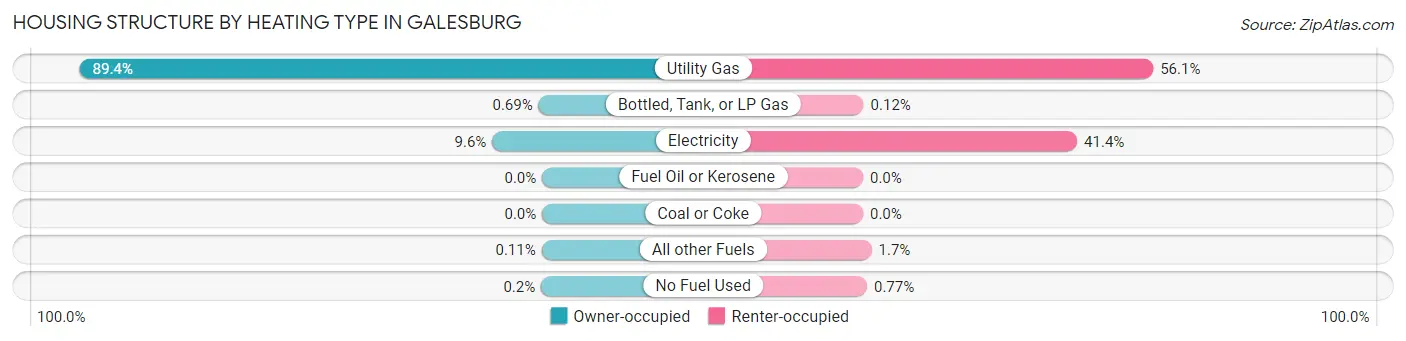
| Heating Type | Owner-occupied | Renter-occupied |
| Utility Gas | 6,737 (89.4%) | 2,844 (56.1%) |
| Bottled, Tank, or LP Gas | 52 (0.7%) | 6 (0.1%) |
| Electricity | 727 (9.6%) | 2,098 (41.4%) |
| Fuel Oil or Kerosene | 0 (0.0%) | 0 (0.0%) |
| Coal or Coke | 0 (0.0%) | 0 (0.0%) |
| All other Fuels | 8 (0.1%) | 84 (1.7%) |
| No Fuel Used | 15 (0.2%) | 39 (0.8%) |
| Total | 7,539 (100.0%) | 5,071 (100.0%) |
Household Vehicle Usage in Galesburg
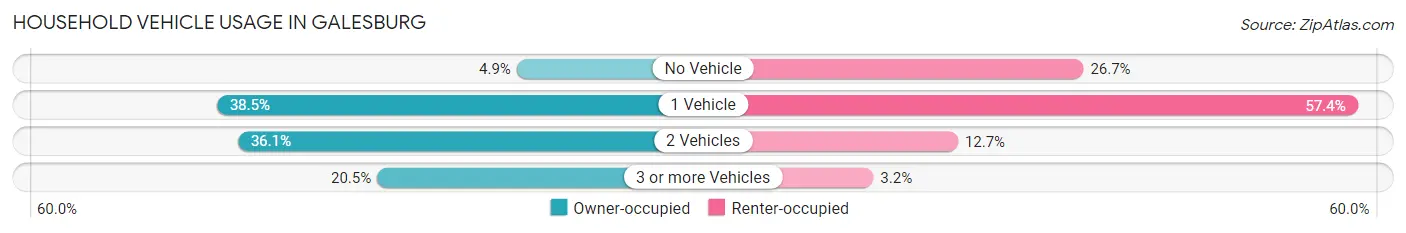
| Vehicles per Household | Owner-occupied | Renter-occupied |
| No Vehicle | 368 (4.9%) | 1,355 (26.7%) |
| 1 Vehicle | 2,901 (38.5%) | 2,912 (57.4%) |
| 2 Vehicles | 2,723 (36.1%) | 642 (12.7%) |
| 3 or more Vehicles | 1,547 (20.5%) | 162 (3.2%) |
| Total | 7,539 (100.0%) | 5,071 (100.0%) |
Real Estate & Mortgages in Galesburg
Real Estate and Mortgage Overview in Galesburg
| Characteristic | Without Mortgage | With Mortgage |
| Housing Units | 3,757 | 3,782 |
| Median Property Value | $80,500 | $91,100 |
| Median Household Income | $49,032 | $435 |
| Monthly Housing Costs | $445 | $66 |
| Real Estate Taxes | $1,572 | $113 |
Property Value by Mortgage Status in Galesburg
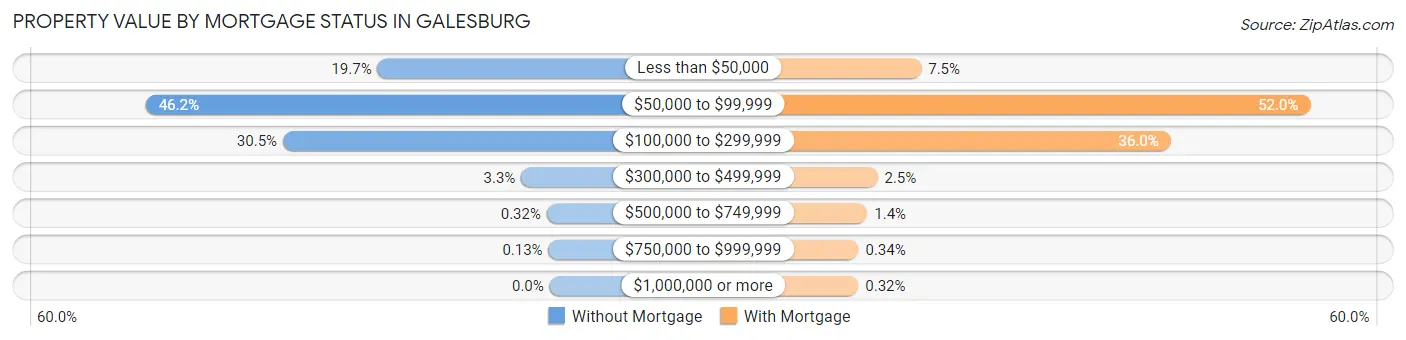
| Property Value | Without Mortgage | With Mortgage |
| Less than $50,000 | 739 (19.7%) | 284 (7.5%) |
| $50,000 to $99,999 | 1,734 (46.2%) | 1,965 (52.0%) |
| $100,000 to $299,999 | 1,145 (30.5%) | 1,362 (36.0%) |
| $300,000 to $499,999 | 122 (3.3%) | 95 (2.5%) |
| $500,000 to $749,999 | 12 (0.3%) | 51 (1.3%) |
| $750,000 to $999,999 | 5 (0.1%) | 13 (0.3%) |
| $1,000,000 or more | 0 (0.0%) | 12 (0.3%) |
| Total | 3,757 (100.0%) | 3,782 (100.0%) |
Household Income by Mortgage Status in Galesburg
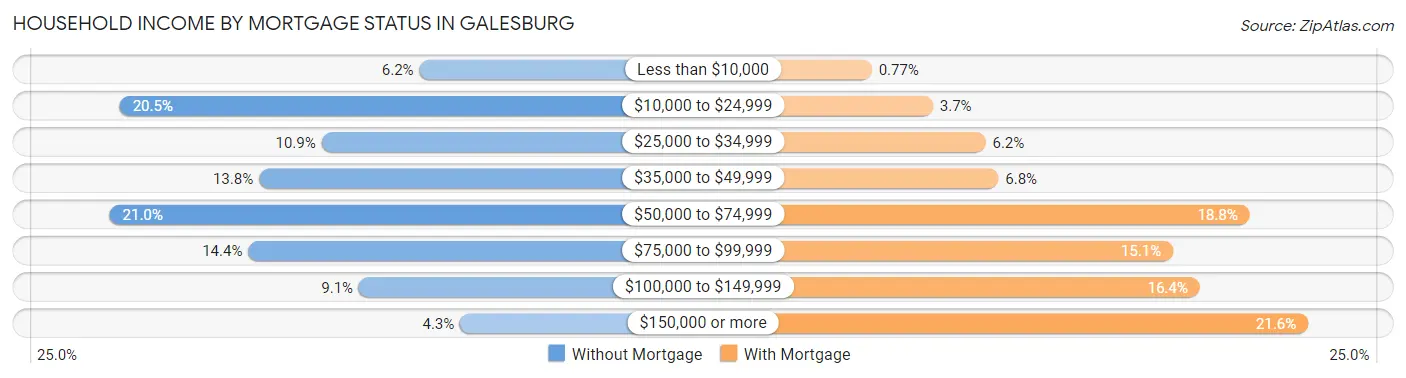
| Household Income | Without Mortgage | With Mortgage |
| Less than $10,000 | 233 (6.2%) | 29 (0.8%) |
| $10,000 to $24,999 | 769 (20.5%) | 139 (3.7%) |
| $25,000 to $34,999 | 408 (10.9%) | 234 (6.2%) |
| $35,000 to $49,999 | 520 (13.8%) | 257 (6.8%) |
| $50,000 to $74,999 | 787 (20.9%) | 710 (18.8%) |
| $75,000 to $99,999 | 539 (14.3%) | 572 (15.1%) |
| $100,000 to $149,999 | 341 (9.1%) | 620 (16.4%) |
| $150,000 or more | 160 (4.3%) | 815 (21.5%) |
| Total | 3,757 (100.0%) | 3,782 (100.0%) |
Property Value to Household Income Ratio in Galesburg
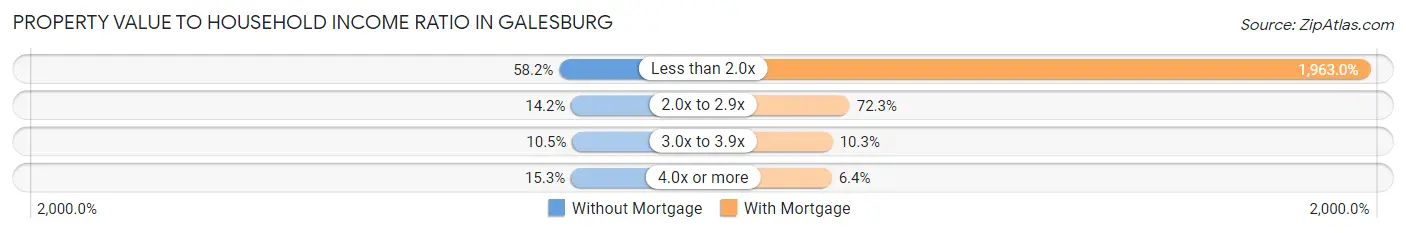
| Value-to-Income Ratio | Without Mortgage | With Mortgage |
| Less than 2.0x | 2,188 (58.2%) | 74,239 (1,963.0%) |
| 2.0x to 2.9x | 533 (14.2%) | 2,733 (72.3%) |
| 3.0x to 3.9x | 393 (10.5%) | 388 (10.3%) |
| 4.0x or more | 576 (15.3%) | 243 (6.4%) |
| Total | 3,757 (100.0%) | 3,782 (100.0%) |
Real Estate Taxes by Mortgage Status in Galesburg
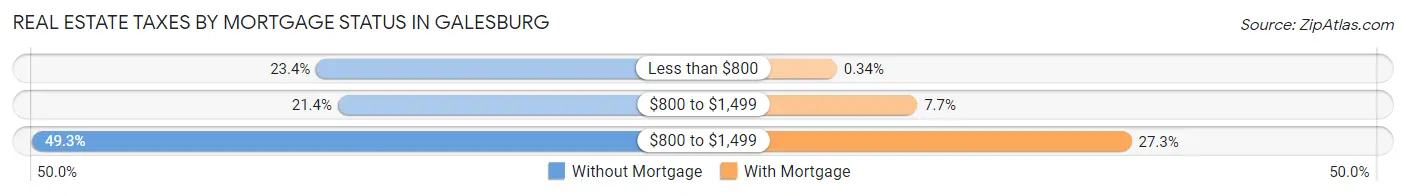
| Property Taxes | Without Mortgage | With Mortgage |
| Less than $800 | 878 (23.4%) | 13 (0.3%) |
| $800 to $1,499 | 804 (21.4%) | 291 (7.7%) |
| $800 to $1,499 | 1,853 (49.3%) | 1,031 (27.3%) |
| Total | 3,757 (100.0%) | 3,782 (100.0%) |
Health & Disability in Galesburg
Health Insurance Coverage by Age in Galesburg
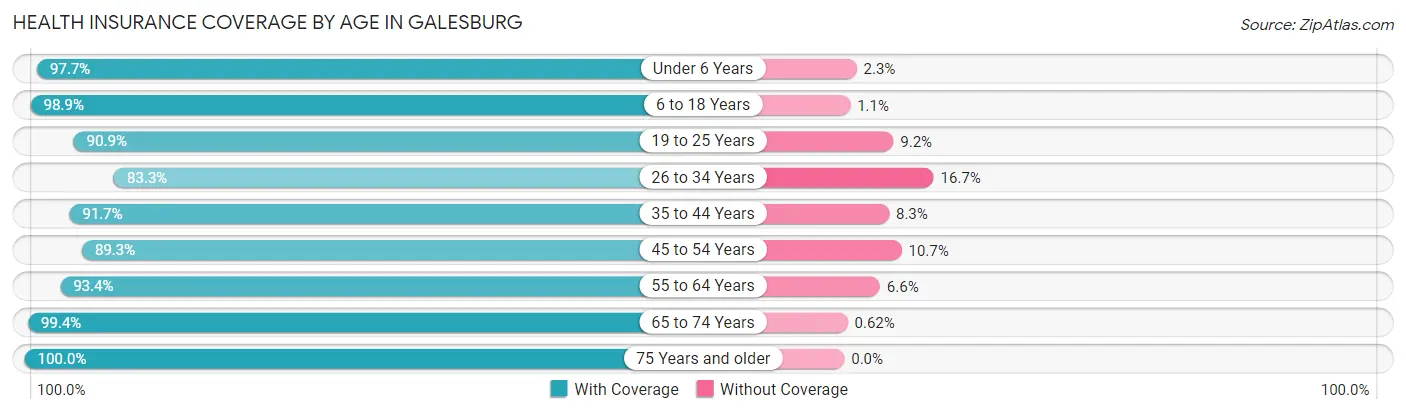
| Age Bracket | With Coverage | Without Coverage |
| Under 6 Years | 1,785 (97.7%) | 42 (2.3%) |
| 6 to 18 Years | 3,736 (98.9%) | 42 (1.1%) |
| 19 to 25 Years | 3,038 (90.8%) | 306 (9.1%) |
| 26 to 34 Years | 2,311 (83.3%) | 462 (16.7%) |
| 35 to 44 Years | 2,749 (91.7%) | 250 (8.3%) |
| 45 to 54 Years | 2,587 (89.3%) | 309 (10.7%) |
| 55 to 64 Years | 3,472 (93.4%) | 247 (6.6%) |
| 65 to 74 Years | 3,339 (99.4%) | 21 (0.6%) |
| 75 Years and older | 2,835 (100.0%) | 0 (0.0%) |
| Total | 25,852 (93.9%) | 1,679 (6.1%) |
Health Insurance Coverage by Citizenship Status in Galesburg
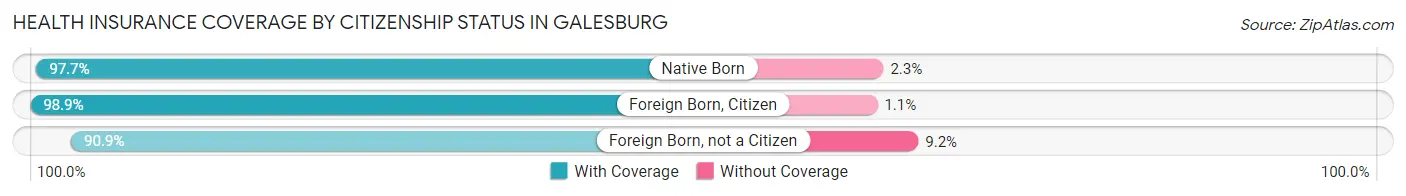
| Citizenship Status | With Coverage | Without Coverage |
| Native Born | 1,785 (97.7%) | 42 (2.3%) |
| Foreign Born, Citizen | 3,736 (98.9%) | 42 (1.1%) |
| Foreign Born, not a Citizen | 3,038 (90.8%) | 306 (9.1%) |
Health Insurance Coverage by Household Income in Galesburg
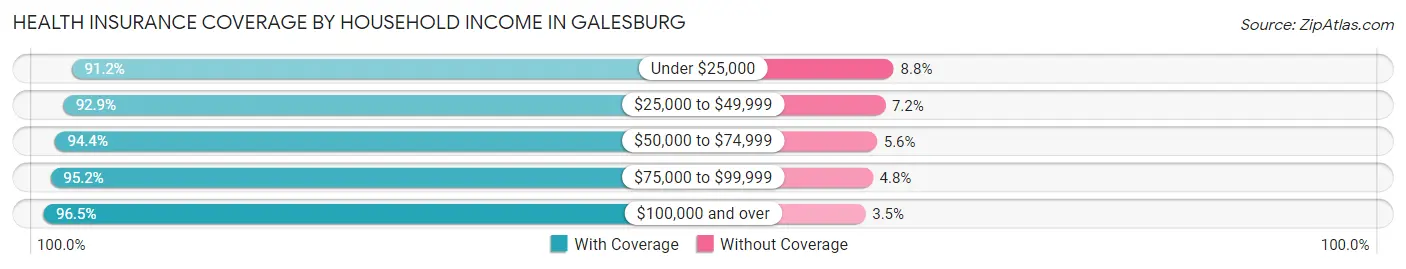
| Household Income | With Coverage | Without Coverage |
| Under $25,000 | 5,275 (91.2%) | 508 (8.8%) |
| $25,000 to $49,999 | 6,037 (92.8%) | 465 (7.1%) |
| $50,000 to $74,999 | 3,760 (94.4%) | 224 (5.6%) |
| $75,000 to $99,999 | 3,304 (95.2%) | 168 (4.8%) |
| $100,000 and over | 6,081 (96.5%) | 218 (3.5%) |
Public vs Private Health Insurance Coverage by Age in Galesburg
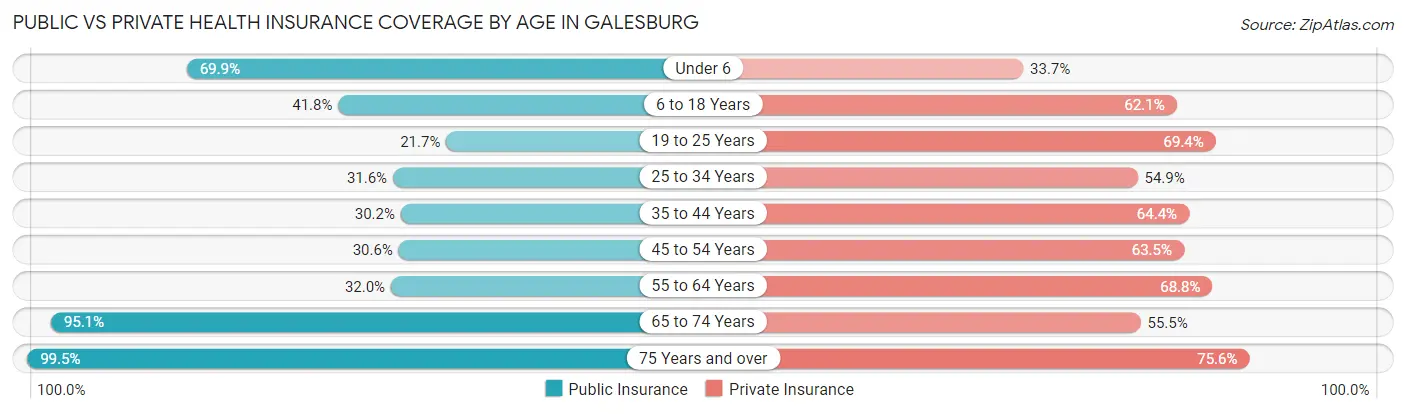
| Age Bracket | Public Insurance | Private Insurance |
| Under 6 | 1,277 (69.9%) | 615 (33.7%) |
| 6 to 18 Years | 1,578 (41.8%) | 2,347 (62.1%) |
| 19 to 25 Years | 727 (21.7%) | 2,320 (69.4%) |
| 25 to 34 Years | 877 (31.6%) | 1,522 (54.9%) |
| 35 to 44 Years | 905 (30.2%) | 1,932 (64.4%) |
| 45 to 54 Years | 885 (30.6%) | 1,838 (63.5%) |
| 55 to 64 Years | 1,190 (32.0%) | 2,557 (68.8%) |
| 65 to 74 Years | 3,196 (95.1%) | 1,863 (55.4%) |
| 75 Years and over | 2,821 (99.5%) | 2,144 (75.6%) |
| Total | 13,456 (48.9%) | 17,138 (62.3%) |
Disability Status by Sex by Age in Galesburg
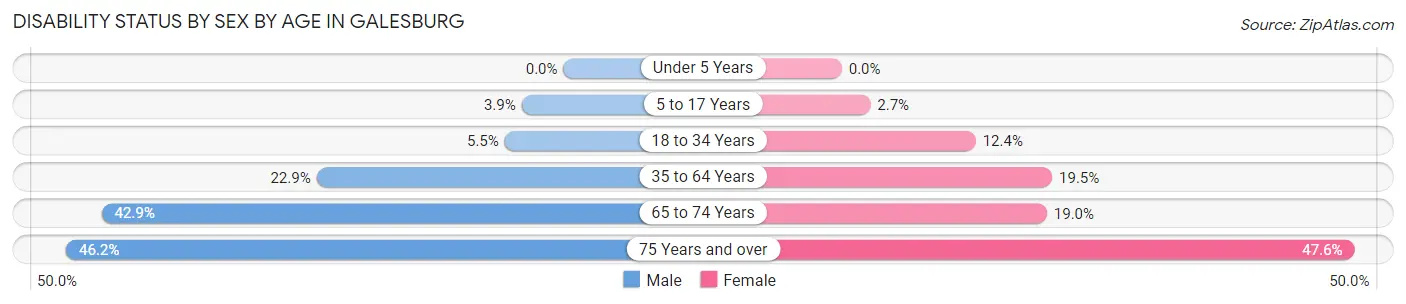
| Age Bracket | Male | Female |
| Under 5 Years | 0 (0.0%) | 0 (0.0%) |
| 5 to 17 Years | 72 (3.9%) | 48 (2.6%) |
| 18 to 34 Years | 183 (5.4%) | 404 (12.4%) |
| 35 to 64 Years | 1,097 (22.9%) | 942 (19.5%) |
| 65 to 74 Years | 681 (42.9%) | 337 (19.0%) |
| 75 Years and over | 539 (46.2%) | 793 (47.6%) |
Disability Class by Sex by Age in Galesburg
Disability Class: Hearing Difficulty
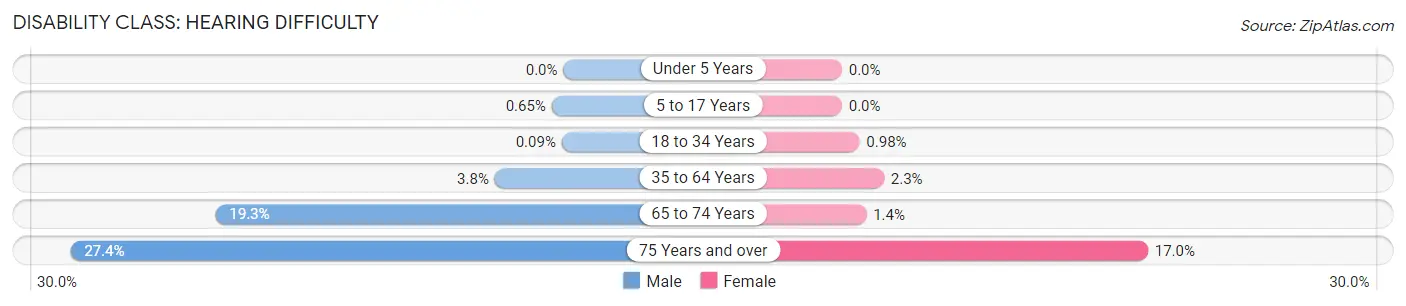
| Age Bracket | Male | Female |
| Under 5 Years | 0 (0.0%) | 0 (0.0%) |
| 5 to 17 Years | 12 (0.6%) | 0 (0.0%) |
| 18 to 34 Years | 3 (0.1%) | 32 (1.0%) |
| 35 to 64 Years | 183 (3.8%) | 113 (2.3%) |
| 65 to 74 Years | 307 (19.3%) | 24 (1.4%) |
| 75 Years and over | 320 (27.4%) | 284 (17.0%) |
Disability Class: Vision Difficulty
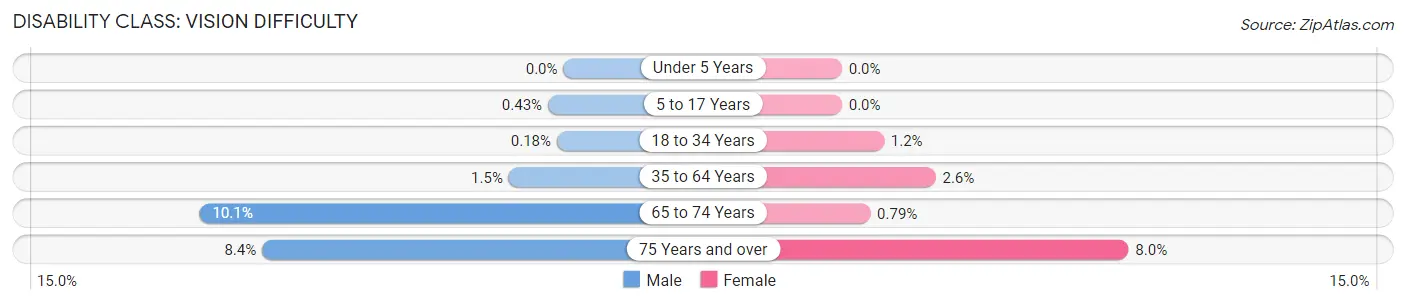
| Age Bracket | Male | Female |
| Under 5 Years | 0 (0.0%) | 0 (0.0%) |
| 5 to 17 Years | 8 (0.4%) | 0 (0.0%) |
| 18 to 34 Years | 6 (0.2%) | 38 (1.2%) |
| 35 to 64 Years | 73 (1.5%) | 126 (2.6%) |
| 65 to 74 Years | 161 (10.1%) | 14 (0.8%) |
| 75 Years and over | 98 (8.4%) | 133 (8.0%) |
Disability Class: Cognitive Difficulty
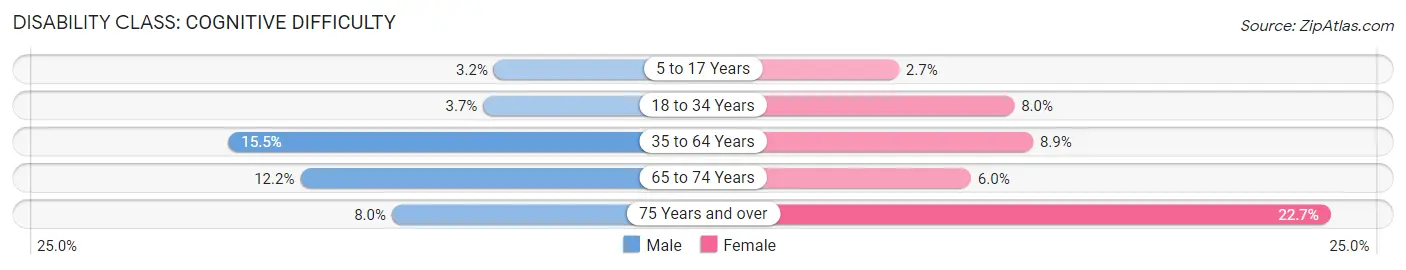
| Age Bracket | Male | Female |
| 5 to 17 Years | 60 (3.2%) | 48 (2.6%) |
| 18 to 34 Years | 125 (3.7%) | 260 (8.0%) |
| 35 to 64 Years | 744 (15.5%) | 428 (8.9%) |
| 65 to 74 Years | 194 (12.2%) | 106 (6.0%) |
| 75 Years and over | 93 (8.0%) | 378 (22.7%) |
Disability Class: Ambulatory Difficulty
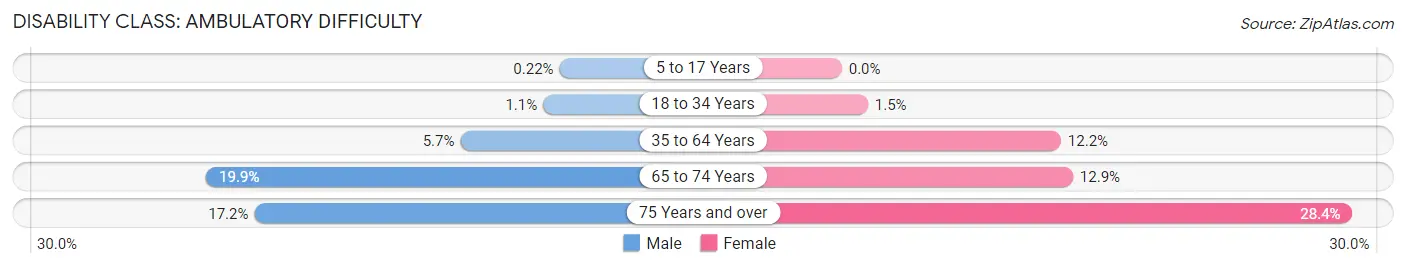
| Age Bracket | Male | Female |
| 5 to 17 Years | 4 (0.2%) | 0 (0.0%) |
| 18 to 34 Years | 38 (1.1%) | 47 (1.5%) |
| 35 to 64 Years | 275 (5.7%) | 589 (12.2%) |
| 65 to 74 Years | 316 (19.9%) | 228 (12.9%) |
| 75 Years and over | 201 (17.2%) | 474 (28.4%) |
Disability Class: Self-Care Difficulty
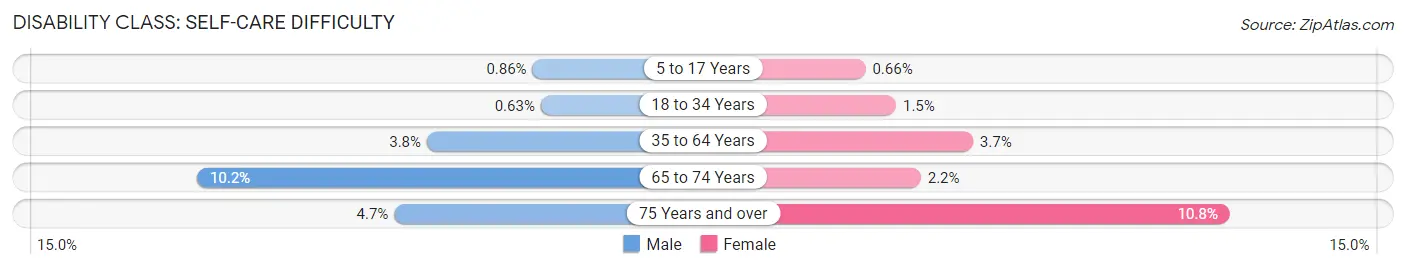
| Age Bracket | Male | Female |
| 5 to 17 Years | 16 (0.9%) | 12 (0.7%) |
| 18 to 34 Years | 21 (0.6%) | 49 (1.5%) |
| 35 to 64 Years | 182 (3.8%) | 176 (3.6%) |
| 65 to 74 Years | 162 (10.2%) | 39 (2.2%) |
| 75 Years and over | 55 (4.7%) | 180 (10.8%) |
Technology Access in Galesburg
Computing Device Access in Galesburg
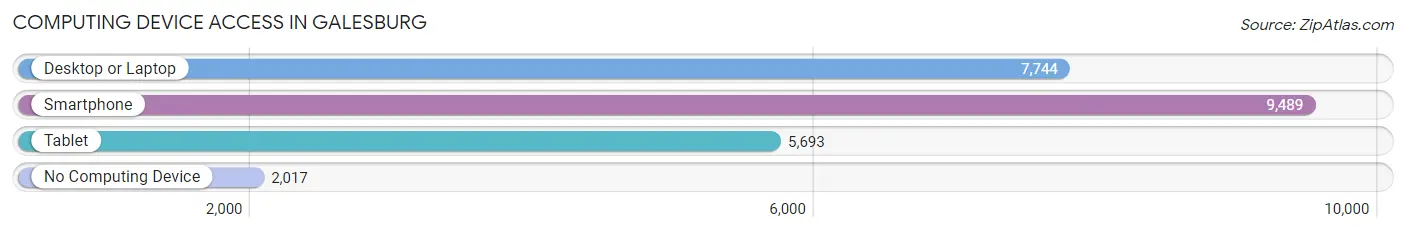
| Device Type | # Households | % Households |
| Desktop or Laptop | 7,744 | 61.4% |
| Smartphone | 9,489 | 75.2% |
| Tablet | 5,693 | 45.2% |
| No Computing Device | 2,017 | 16.0% |
| Total | 12,610 | 100.0% |
Internet Access in Galesburg
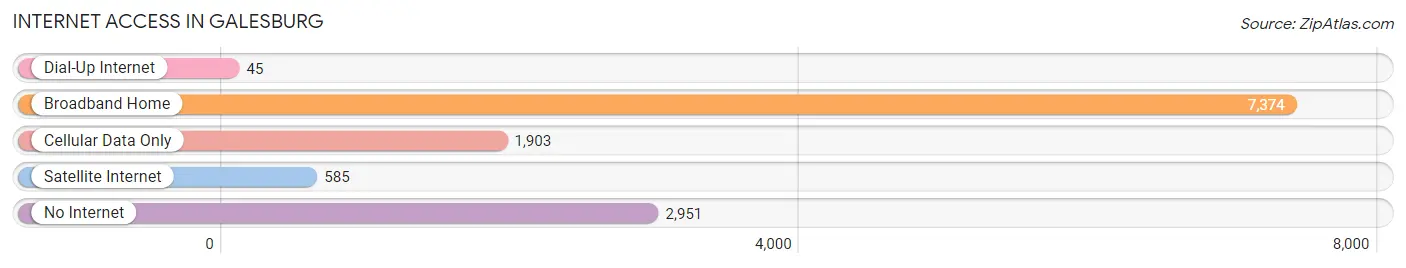
| Internet Type | # Households | % Households |
| Dial-Up Internet | 45 | 0.4% |
| Broadband Home | 7,374 | 58.5% |
| Cellular Data Only | 1,903 | 15.1% |
| Satellite Internet | 585 | 4.6% |
| No Internet | 2,951 | 23.4% |
| Total | 12,610 | 100.0% |
Galesburg Summary
Galesburg, Illinois is a city located in Knox County, Illinois, United States. It is the county seat of Knox County and is located along the banks of the Mississippi River. The city has a population of 32,195 as of the 2010 census, making it the largest city in Knox County.
History
Galesburg was founded in 1834 by George Washington Gale, a Presbyterian minister from New York. Gale had been sent to the area by the Home Missionary Society to establish a religious community. He named the city after himself and it quickly grew into a thriving community.
Galesburg was an important stop on the Underground Railroad, with many slaves escaping to freedom in Canada. The city was also a major stop on the Lincoln-Douglas debates of 1858.
Geography
Galesburg is located at 40°57'N 90°24'W (40.95, -90.40). It is situated along the banks of the Mississippi River in western Illinois. The city has a total area of 11.2 square miles, of which 11.1 square miles is land and 0.1 square miles is water.
Economy
Galesburg is a major industrial center in western Illinois. The city is home to several large manufacturing companies, including Maytag, Galesburg Steel, and Galesburg Foundry. The city also has a thriving agricultural sector, with many farms located in the surrounding area.
Demographics
As of the 2010 census, Galesburg had a population of 32,195. The racial makeup of the city was 79.2% White, 15.3% African American, 0.4% Native American, 1.2% Asian, 0.1% Pacific Islander, 1.7% from other races, and 2.1% from two or more races. Hispanic or Latino of any race were 4.2% of the population.
The median income for a household in Galesburg was $37,945, and the median income for a family was $45,945. The per capita income for the city was $19,845. About 14.2% of families and 17.7% of the population were below the poverty line, including 25.2% of those under age 18 and 8.7% of those age 65 or over.
Conclusion
Galesburg, Illinois is a city with a rich history and a vibrant economy. It is located along the banks of the Mississippi River and is home to many large manufacturing companies. The city has a population of 32,195 and a median income of $37,945. Galesburg is an important stop on the Underground Railroad and was the site of the famous Lincoln-Douglas debates.
Common Questions
What is Per Capita Income in Galesburg?
Per Capita income in Galesburg is $25,731.
What is the Median Family Income in Galesburg?
Median Family Income in Galesburg is $68,215.
What is the Median Household income in Galesburg?
Median Household Income in Galesburg is $42,346.
What is Income or Wage Gap in Galesburg?
Income or Wage Gap in Galesburg is 18.3%.
Women in Galesburg earn 81.7 cents for every dollar earned by a man.
What is Family Income Deficit in Galesburg?
Family Income Deficit in Galesburg is $8,740.
Families that are below poverty line in Galesburg earn $8,740 less on average than the poverty threshold level.
What is Inequality or Gini Index in Galesburg?
Inequality or Gini Index in Galesburg is 0.47.
What is the Total Population of Galesburg?
Total Population of Galesburg is 29,923.
What is the Total Male Population of Galesburg?
Total Male Population of Galesburg is 15,551.
What is the Total Female Population of Galesburg?
Total Female Population of Galesburg is 14,372.
What is the Ratio of Males per 100 Females in Galesburg?
There are 108.20 Males per 100 Females in Galesburg.
What is the Ratio of Females per 100 Males in Galesburg?
There are 92.42 Females per 100 Males in Galesburg.
What is the Median Population Age in Galesburg?
Median Population Age in Galesburg is 41.6 Years.
What is the Average Family Size in Galesburg
Average Family Size in Galesburg is 2.9 People.
What is the Average Household Size in Galesburg
Average Household Size in Galesburg is 2.1 People.
How Large is the Labor Force in Galesburg?
There are 12,294 People in the Labor Forcein in Galesburg.
What is the Percentage of People in the Labor Force in Galesburg?
48.6% of People are in the Labor Force in Galesburg.
What is the Unemployment Rate in Galesburg?
Unemployment Rate in Galesburg is 5.2%.