Lombard, IL Map & Demographics
Lombard Map
Lombard Overview
$47,178
PER CAPITA INCOME
$117,165
AVG FAMILY INCOME
$95,509
AVG HOUSEHOLD INCOME
24.6%
WAGE / INCOME GAP [ % ]
75.4¢/ $1
WAGE / INCOME GAP [ $ ]
$13,797
FAMILY INCOME DEFICIT
0.41
INEQUALITY / GINI INDEX
44,055
TOTAL POPULATION
21,440
MALE POPULATION
22,615
FEMALE POPULATION
94.80
MALES / 100 FEMALES
105.48
FEMALES / 100 MALES
37.7
MEDIAN AGE
3.2
AVG FAMILY SIZE
2.5
AVG HOUSEHOLD SIZE
25,438
LABOR FORCE [ PEOPLE ]
70.9%
PERCENT IN LABOR FORCE
4.4%
UNEMPLOYMENT RATE
Lombard Zip Codes
Income in Lombard
Income Overview in Lombard
Per Capita Income in Lombard is $47,178, while median incomes of families and households are $117,165 and $95,509 respectively.
| Characteristic | Number | Measure |
| Per Capita Income | 44,055 | $47,178 |
| Median Family Income | 11,237 | $117,165 |
| Mean Family Income | 11,237 | $138,846 |
| Median Household Income | 17,180 | $95,509 |
| Mean Household Income | 17,180 | $117,753 |
| Income Deficit | 11,237 | $13,797 |
| Wage / Income Gap (%) | 44,055 | 24.64% |
| Wage / Income Gap ($) | 44,055 | 75.36¢ per $1 |
| Gini / Inequality Index | 44,055 | 0.41 |
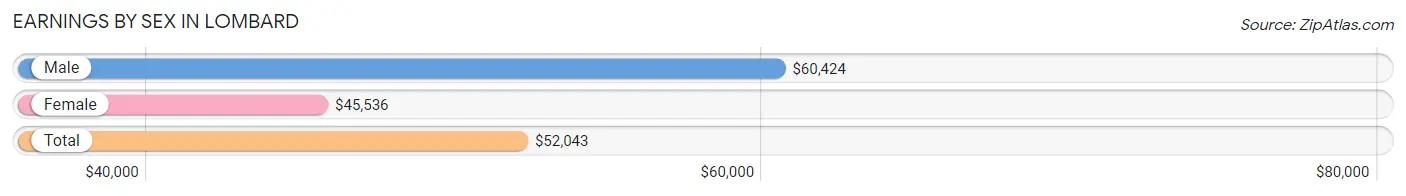
Earnings by Sex in Lombard
Average Earnings in Lombard are $52,043, $60,424 for men and $45,536 for women, a difference of 24.6%.
| Sex | Number | Average Earnings |
| Male | 13,393 (51.5%) | $60,424 |
| Female | 12,626 (48.5%) | $45,536 |
| Total | 26,019 (100.0%) | $52,043 |
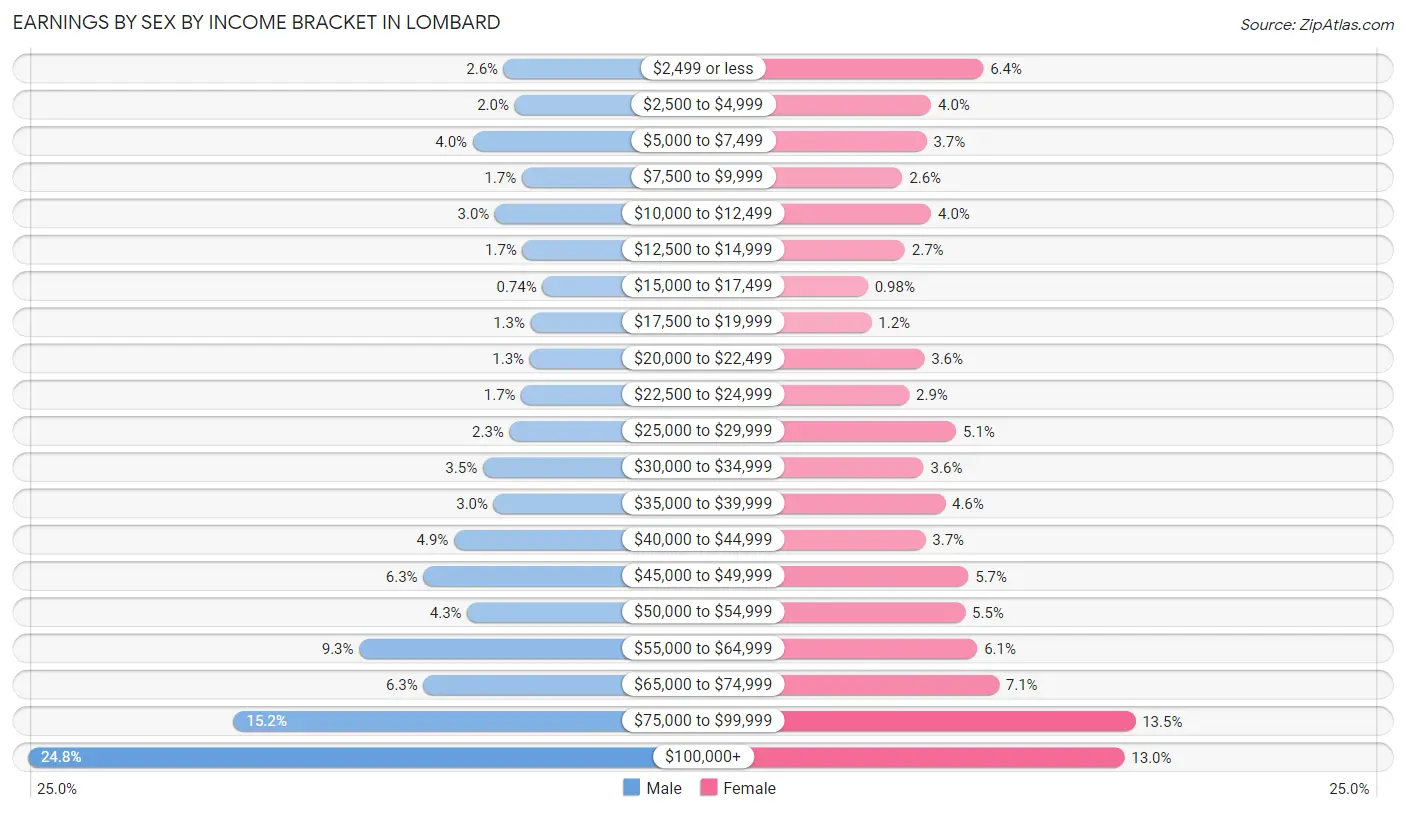
Earnings by Sex by Income Bracket in Lombard
The most common earnings brackets in Lombard are $100,000+ for men (3,327 | 24.8%) and $75,000 to $99,999 for women (1,706 | 13.5%).
| Income | Male | Female |
| $2,499 or less | 341 (2.5%) | 807 (6.4%) |
| $2,500 to $4,999 | 273 (2.0%) | 499 (4.0%) |
| $5,000 to $7,499 | 536 (4.0%) | 471 (3.7%) |
| $7,500 to $9,999 | 228 (1.7%) | 328 (2.6%) |
| $10,000 to $12,499 | 397 (3.0%) | 499 (4.0%) |
| $12,500 to $14,999 | 224 (1.7%) | 344 (2.7%) |
| $15,000 to $17,499 | 99 (0.7%) | 124 (1.0%) |
| $17,500 to $19,999 | 173 (1.3%) | 145 (1.1%) |
| $20,000 to $22,499 | 178 (1.3%) | 458 (3.6%) |
| $22,500 to $24,999 | 232 (1.7%) | 369 (2.9%) |
| $25,000 to $29,999 | 306 (2.3%) | 646 (5.1%) |
| $30,000 to $34,999 | 473 (3.5%) | 454 (3.6%) |
| $35,000 to $39,999 | 405 (3.0%) | 581 (4.6%) |
| $40,000 to $44,999 | 654 (4.9%) | 465 (3.7%) |
| $45,000 to $49,999 | 847 (6.3%) | 719 (5.7%) |
| $50,000 to $54,999 | 570 (4.3%) | 699 (5.5%) |
| $55,000 to $64,999 | 1,248 (9.3%) | 771 (6.1%) |
| $65,000 to $74,999 | 845 (6.3%) | 899 (7.1%) |
| $75,000 to $99,999 | 2,037 (15.2%) | 1,706 (13.5%) |
| $100,000+ | 3,327 (24.8%) | 1,642 (13.0%) |
| Total | 13,393 (100.0%) | 12,626 (100.0%) |
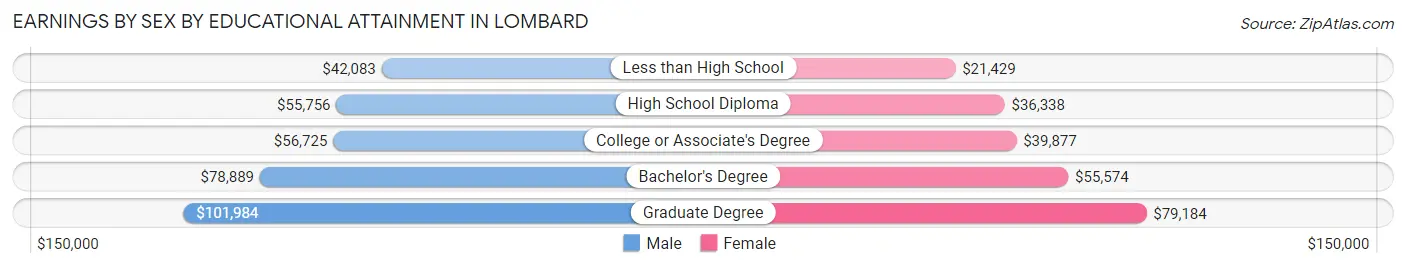
Earnings by Sex by Educational Attainment in Lombard
Average earnings in Lombard are $67,624 for men and $50,357 for women, a difference of 25.5%. Men with an educational attainment of graduate degree enjoy the highest average annual earnings of $101,984, while those with less than high school education earn the least with $42,083. Women with an educational attainment of graduate degree earn the most with the average annual earnings of $79,184, while those with less than high school education have the smallest earnings of $21,429.
| Educational Attainment | Male Income | Female Income |
| Less than High School | $42,083 | $21,429 |
| High School Diploma | $55,756 | $36,338 |
| College or Associate's Degree | $56,725 | $39,877 |
| Bachelor's Degree | $78,889 | $55,574 |
| Graduate Degree | $101,984 | $79,184 |
| Total | $67,624 | $50,357 |
Family Income in Lombard
Family Income Brackets in Lombard
According to the Lombard family income data, there are 2,967 families falling into the $100,000 to $149,999 income range, which is the most common income bracket and makes up 26.4% of all families. Conversely, the $10,000 to $14,999 income bracket is the least frequent group with only 56 families (0.5%) belonging to this category.
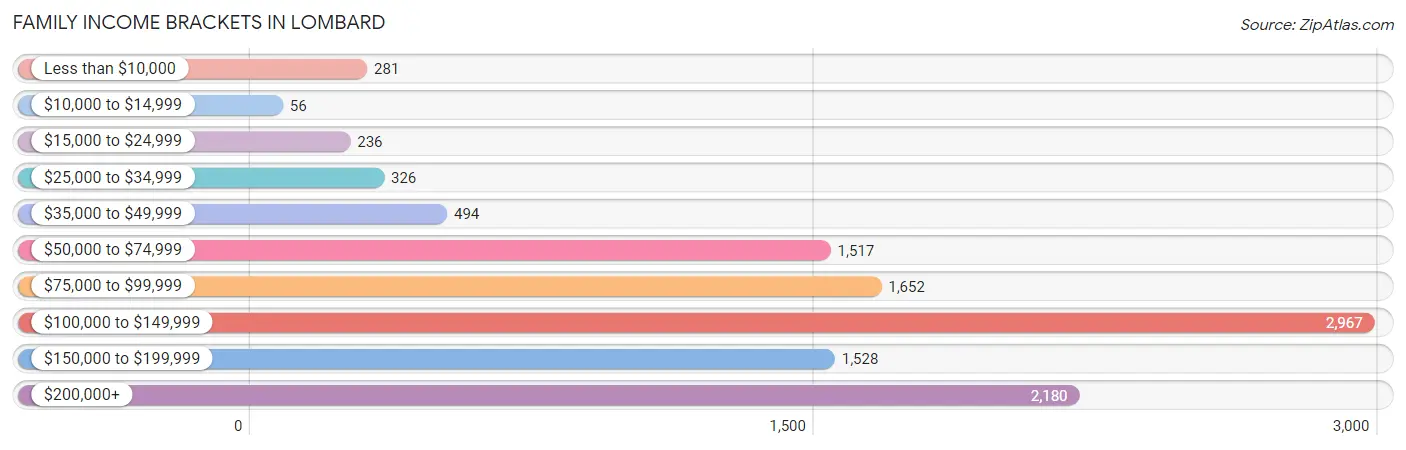
| Income Bracket | # Families | % Families |
| Less than $10,000 | 281 | 2.5% |
| $10,000 to $14,999 | 56 | 0.5% |
| $15,000 to $24,999 | 236 | 2.1% |
| $25,000 to $34,999 | 326 | 2.9% |
| $35,000 to $49,999 | 494 | 4.4% |
| $50,000 to $74,999 | 1,517 | 13.5% |
| $75,000 to $99,999 | 1,652 | 14.7% |
| $100,000 to $149,999 | 2,967 | 26.4% |
| $150,000 to $199,999 | 1,528 | 13.6% |
| $200,000+ | 2,180 | 19.4% |
Family Income by Famaliy Size in Lombard
5-person families (1,152 | 10.2%) account for the highest median family income in Lombard with $177,500 per family, while 2-person families (5,063 | 45.1%) have the highest median income of $46,804 per family member.
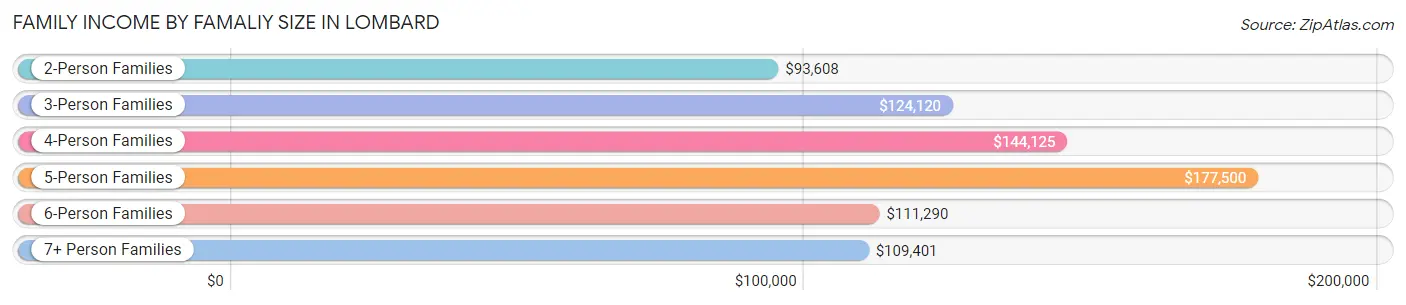
| Income Bracket | # Families | Median Income |
| 2-Person Families | 5,063 (45.1%) | $93,608 |
| 3-Person Families | 2,667 (23.7%) | $124,120 |
| 4-Person Families | 1,897 (16.9%) | $144,125 |
| 5-Person Families | 1,152 (10.2%) | $177,500 |
| 6-Person Families | 282 (2.5%) | $111,290 |
| 7+ Person Families | 176 (1.6%) | $109,401 |
| Total | 11,237 (100.0%) | $117,165 |
Family Income by Number of Earners in Lombard
The median family income in Lombard is $117,165, with families comprising 3+ earners (1,837) having the highest median family income of $160,720, while families with no earners (1,163) have the lowest median family income of $61,791, accounting for 16.4% and 10.3% of families, respectively.
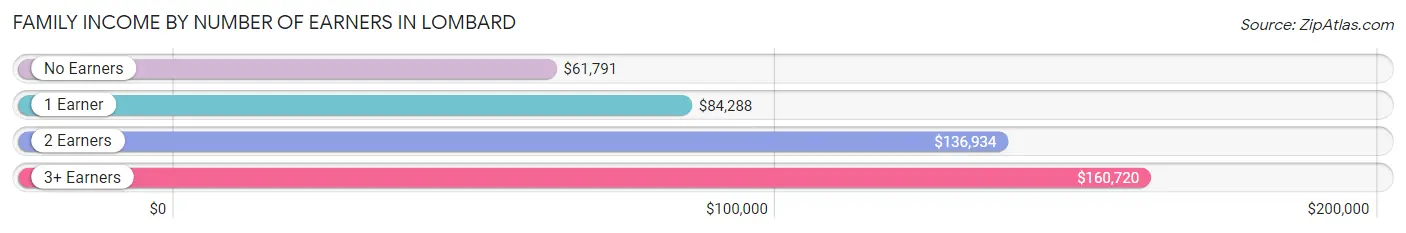
| Number of Earners | # Families | Median Income |
| No Earners | 1,163 (10.3%) | $61,791 |
| 1 Earner | 2,883 (25.7%) | $84,288 |
| 2 Earners | 5,354 (47.6%) | $136,934 |
| 3+ Earners | 1,837 (16.4%) | $160,720 |
| Total | 11,237 (100.0%) | $117,165 |
Household Income in Lombard
Household Income Brackets in Lombard
With 4,003 households falling in the category, the $100,000 to $149,999 income range is the most frequent in Lombard, accounting for 23.3% of all households. In contrast, only 223 households (1.3%) fall into the $10,000 to $14,999 income bracket, making it the least populous group.
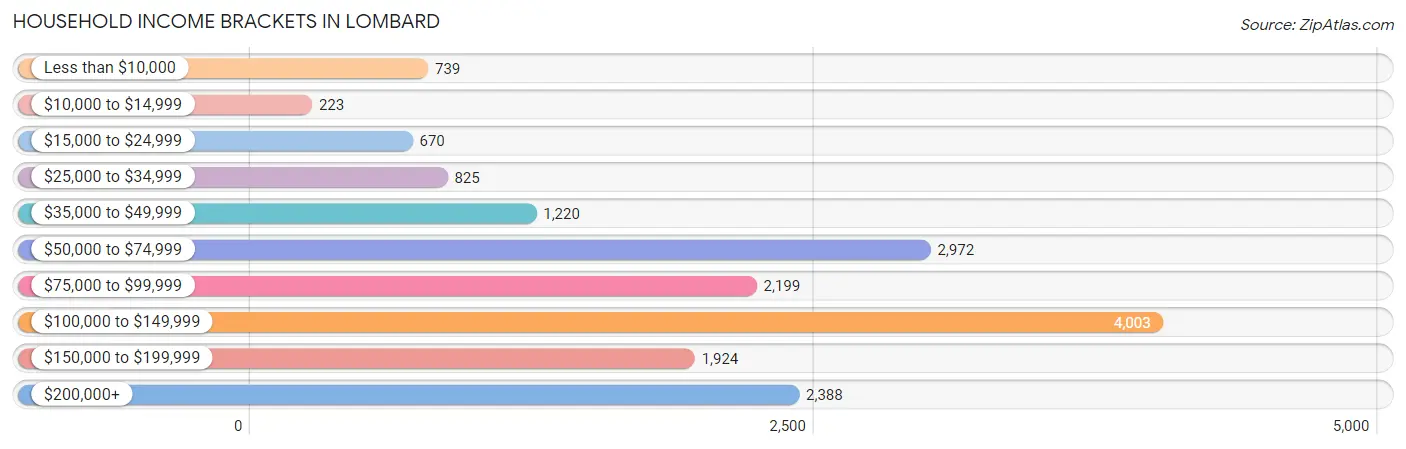
| Income Bracket | # Households | % Households |
| Less than $10,000 | 739 | 4.3% |
| $10,000 to $14,999 | 223 | 1.3% |
| $15,000 to $24,999 | 670 | 3.9% |
| $25,000 to $34,999 | 825 | 4.8% |
| $35,000 to $49,999 | 1,220 | 7.1% |
| $50,000 to $74,999 | 2,972 | 17.3% |
| $75,000 to $99,999 | 2,199 | 12.8% |
| $100,000 to $149,999 | 4,003 | 23.3% |
| $150,000 to $199,999 | 1,924 | 11.2% |
| $200,000+ | 2,388 | 13.9% |
Household Income by Householder Age in Lombard
The median household income in Lombard is $95,509, with the highest median household income of $112,829 found in the 45 to 64 years age bracket for the primary householder. A total of 6,227 households (36.2%) fall into this category. Meanwhile, the 15 to 24 years age bracket for the primary householder has the lowest median household income of $51,507, with 393 households (2.3%) in this group.
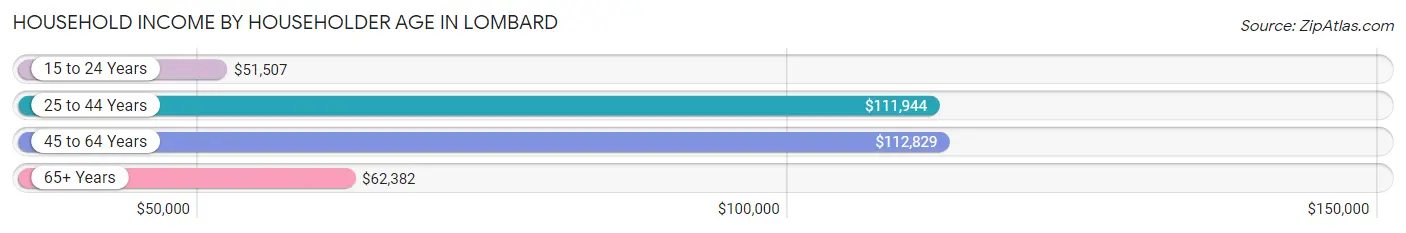
| Income Bracket | # Households | Median Income |
| 15 to 24 Years | 393 (2.3%) | $51,507 |
| 25 to 44 Years | 6,226 (36.2%) | $111,944 |
| 45 to 64 Years | 6,227 (36.2%) | $112,829 |
| 65+ Years | 4,334 (25.2%) | $62,382 |
| Total | 17,180 (100.0%) | $95,509 |
Poverty in Lombard
Income Below Poverty by Sex and Age in Lombard
With 5.8% poverty level for males and 8.3% for females among the residents of Lombard, 12 to 14 year old males and 18 to 24 year old females are the most vulnerable to poverty, with 74 males (10.4%) and 491 females (25.7%) in their respective age groups living below the poverty level.
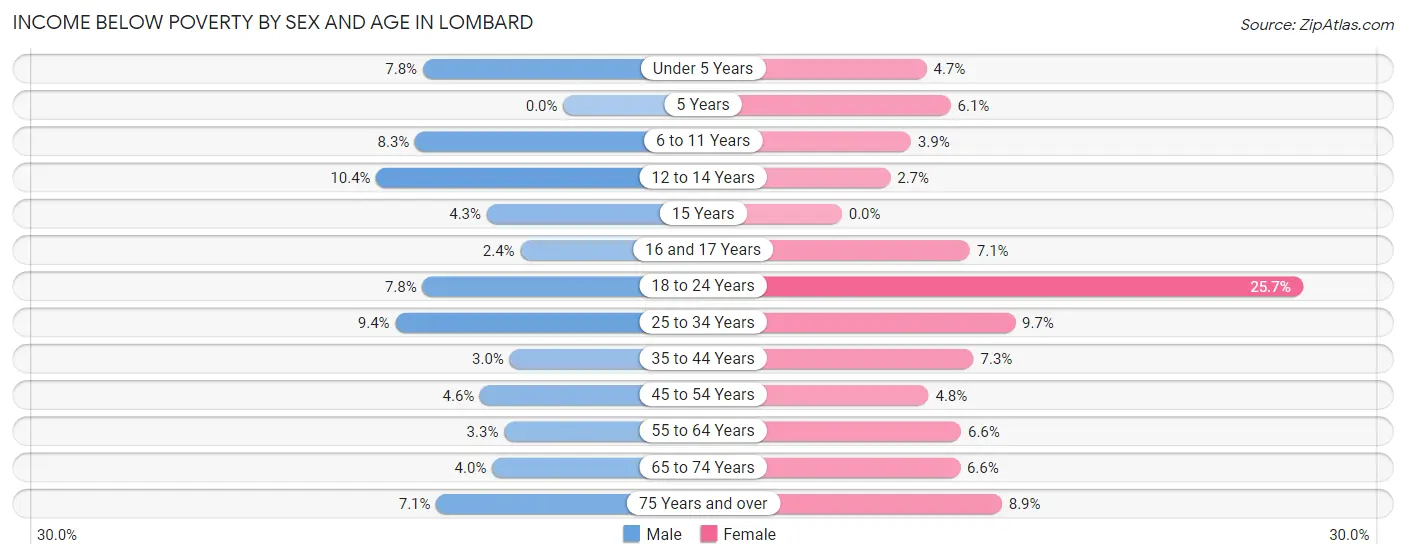
| Age Bracket | Male | Female |
| Under 5 Years | 96 (7.8%) | 68 (4.7%) |
| 5 Years | 0 (0.0%) | 18 (6.1%) |
| 6 to 11 Years | 129 (8.3%) | 48 (3.8%) |
| 12 to 14 Years | 74 (10.4%) | 21 (2.7%) |
| 15 Years | 10 (4.3%) | 0 (0.0%) |
| 16 and 17 Years | 11 (2.4%) | 34 (7.1%) |
| 18 to 24 Years | 135 (7.8%) | 491 (25.7%) |
| 25 to 34 Years | 328 (9.3%) | 364 (9.7%) |
| 35 to 44 Years | 99 (3.0%) | 196 (7.3%) |
| 45 to 54 Years | 110 (4.6%) | 120 (4.8%) |
| 55 to 64 Years | 93 (3.3%) | 201 (6.6%) |
| 65 to 74 Years | 73 (4.0%) | 140 (6.6%) |
| 75 Years and over | 74 (7.1%) | 153 (8.9%) |
| Total | 1,232 (5.8%) | 1,854 (8.3%) |
Income Above Poverty by Sex and Age in Lombard
According to the poverty statistics in Lombard, males aged 5 years and females aged 15 years are the age groups that are most secure financially, with 100.0% of males and 100.0% of females in these age groups living above the poverty line.
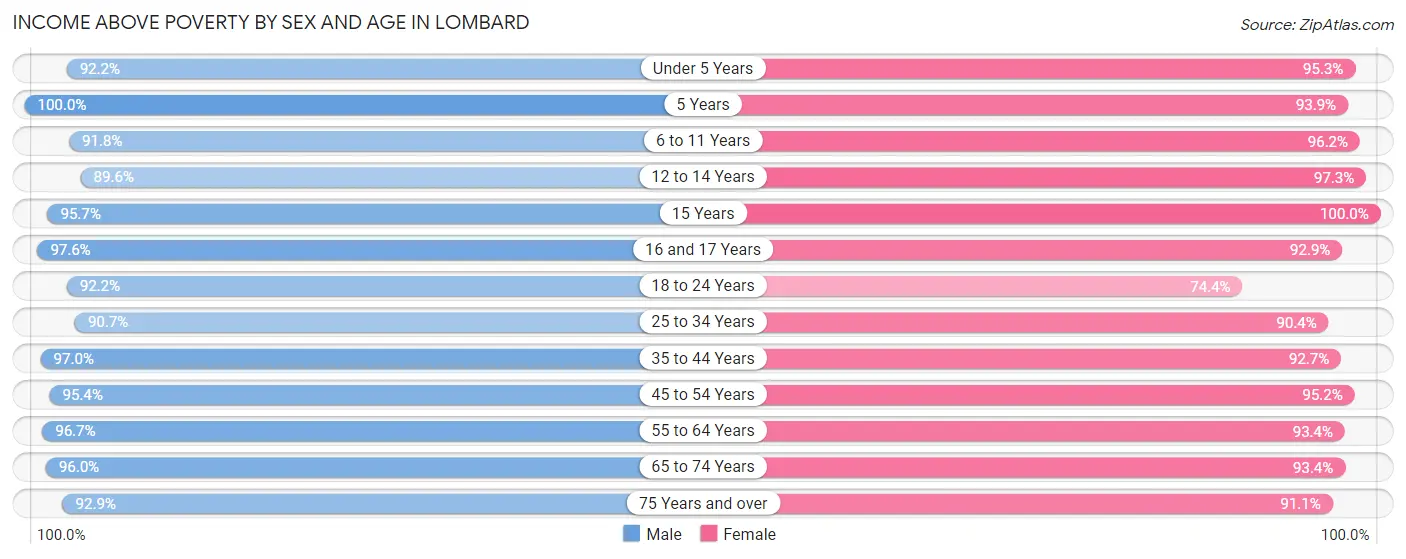
| Age Bracket | Male | Female |
| Under 5 Years | 1,132 (92.2%) | 1,372 (95.3%) |
| 5 Years | 337 (100.0%) | 279 (93.9%) |
| 6 to 11 Years | 1,435 (91.7%) | 1,198 (96.2%) |
| 12 to 14 Years | 637 (89.6%) | 758 (97.3%) |
| 15 Years | 225 (95.7%) | 279 (100.0%) |
| 16 and 17 Years | 450 (97.6%) | 443 (92.9%) |
| 18 to 24 Years | 1,586 (92.2%) | 1,423 (74.4%) |
| 25 to 34 Years | 3,180 (90.6%) | 3,408 (90.3%) |
| 35 to 44 Years | 3,210 (97.0%) | 2,476 (92.7%) |
| 45 to 54 Years | 2,267 (95.4%) | 2,364 (95.2%) |
| 55 to 64 Years | 2,735 (96.7%) | 2,827 (93.4%) |
| 65 to 74 Years | 1,771 (96.0%) | 1,987 (93.4%) |
| 75 Years and over | 973 (92.9%) | 1,565 (91.1%) |
| Total | 19,938 (94.2%) | 20,379 (91.7%) |
Income Below Poverty Among Married-Couple Families in Lombard
The poverty statistics for married-couple families in Lombard show that 2.9% or 257 of the total 8,879 families live below the poverty line. Families with no children have the highest poverty rate of 3.8%, comprising of 189 families. On the other hand, families with 5 or more children have the lowest poverty rate of 0.0%, which includes 0 families.
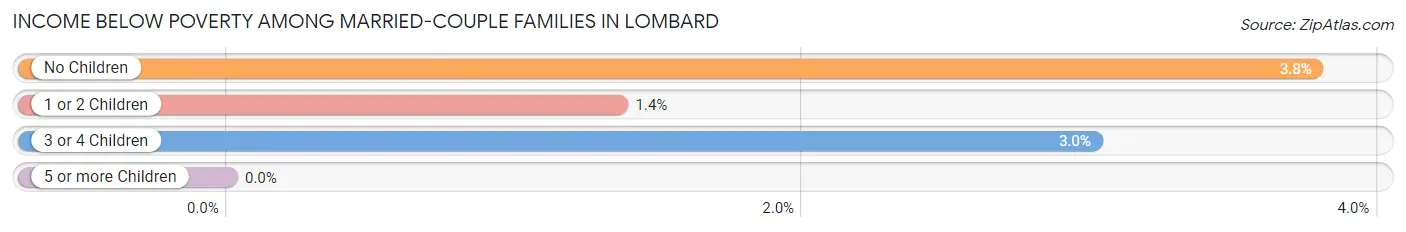
| Children | Above Poverty | Below Poverty |
| No Children | 4,814 (96.2%) | 189 (3.8%) |
| 1 or 2 Children | 2,902 (98.6%) | 40 (1.4%) |
| 3 or 4 Children | 902 (97.0%) | 28 (3.0%) |
| 5 or more Children | 4 (100.0%) | 0 (0.0%) |
| Total | 8,622 (97.1%) | 257 (2.9%) |
Income Below Poverty Among Single-Parent Households in Lombard
According to the poverty data in Lombard, 10.2% or 63 single-father households and 13.3% or 232 single-mother households are living below the poverty line. Among single-father households, those with no children have the highest poverty rate, with 54 households (13.4%) experiencing poverty. Likewise, among single-mother households, those with 3 or 4 children have the highest poverty rate, with 33 households (37.9%) falling below the poverty line.
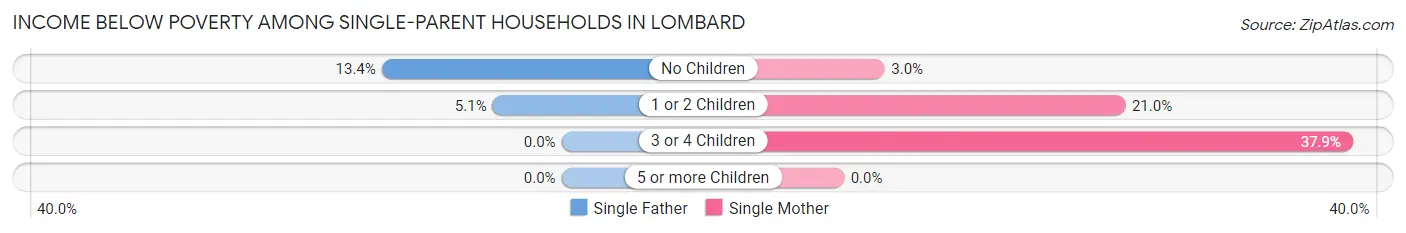
| Children | Single Father | Single Mother |
| No Children | 54 (13.4%) | 25 (3.0%) |
| 1 or 2 Children | 9 (5.1%) | 174 (21.0%) |
| 3 or 4 Children | 0 (0.0%) | 33 (37.9%) |
| 5 or more Children | 0 (0.0%) | 0 (0.0%) |
| Total | 63 (10.2%) | 232 (13.3%) |
Income Below Poverty Among Married-Couple vs Single-Parent Households in Lombard
The poverty data for Lombard shows that 257 of the married-couple family households (2.9%) and 295 of the single-parent households (12.5%) are living below the poverty level. Within the married-couple family households, those with no children have the highest poverty rate, with 189 households (3.8%) falling below the poverty line. Among the single-parent households, those with 3 or 4 children have the highest poverty rate, with 33 household (26.4%) living below poverty.
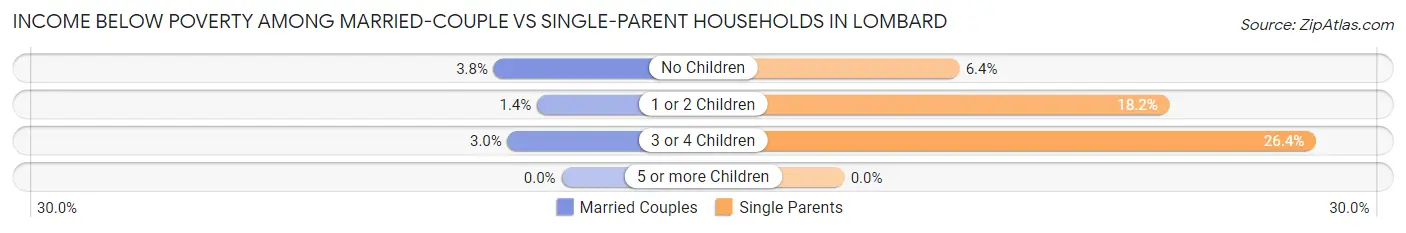
| Children | Married-Couple Families | Single-Parent Households |
| No Children | 189 (3.8%) | 79 (6.4%) |
| 1 or 2 Children | 40 (1.4%) | 183 (18.2%) |
| 3 or 4 Children | 28 (3.0%) | 33 (26.4%) |
| 5 or more Children | 0 (0.0%) | 0 (0.0%) |
| Total | 257 (2.9%) | 295 (12.5%) |
Race in Lombard
The most populous races in Lombard are White / Caucasian (32,476 | 73.7%), Asian (5,295 | 12.0%), and Hispanic or Latino (4,698 | 10.7%).
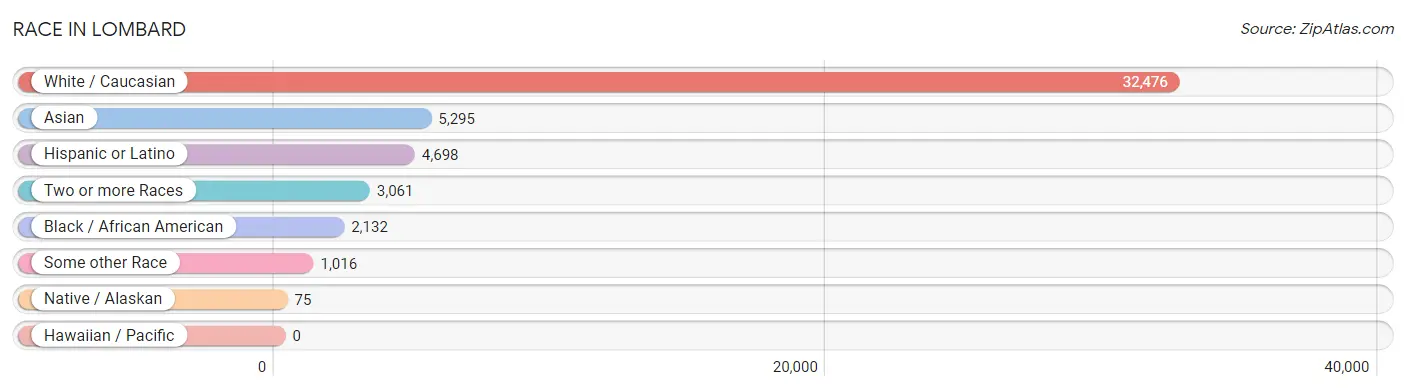
| Race | # Population | % Population |
| Asian | 5,295 | 12.0% |
| Black / African American | 2,132 | 4.8% |
| Hawaiian / Pacific | 0 | 0.0% |
| Hispanic or Latino | 4,698 | 10.7% |
| Native / Alaskan | 75 | 0.2% |
| White / Caucasian | 32,476 | 73.7% |
| Two or more Races | 3,061 | 7.0% |
| Some other Race | 1,016 | 2.3% |
| Total | 44,055 | 100.0% |
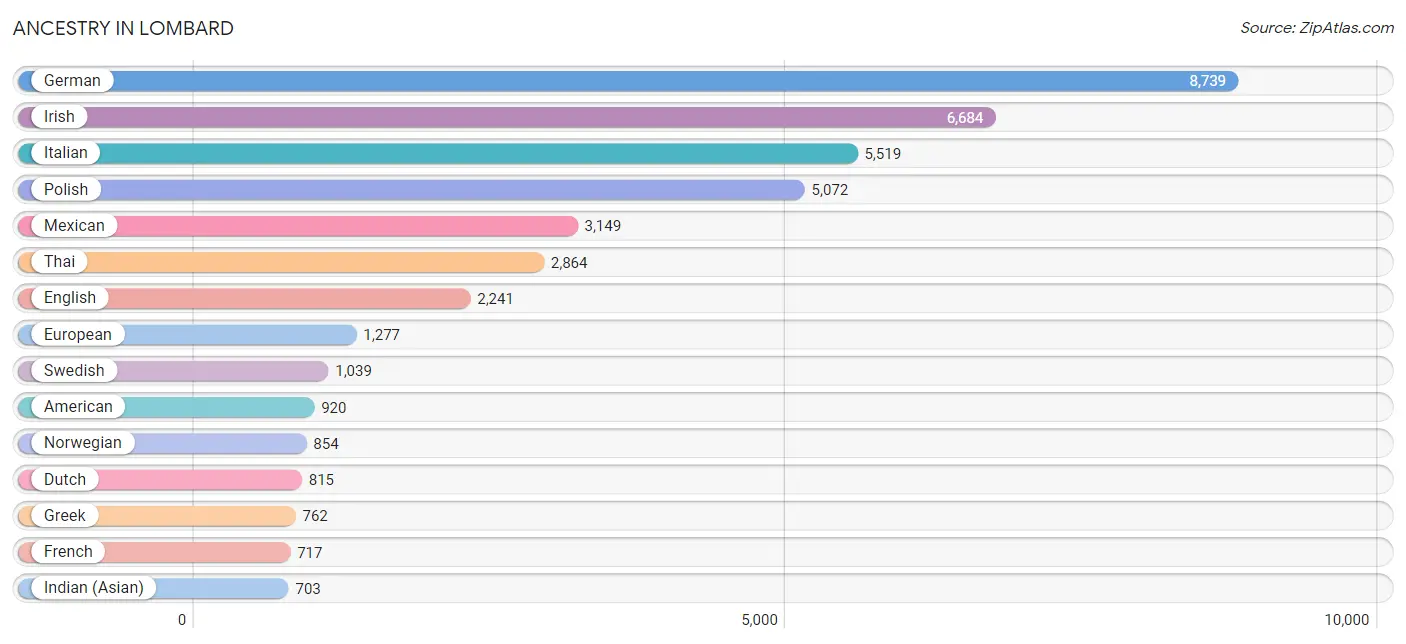
Ancestry in Lombard
The most populous ancestries reported in Lombard are German (8,739 | 19.8%), Irish (6,684 | 15.2%), Italian (5,519 | 12.5%), Polish (5,072 | 11.5%), and Mexican (3,149 | 7.1%), together accounting for 66.2% of all Lombard residents.
| Ancestry | # Population | % Population |
| African | 169 | 0.4% |
| Albanian | 643 | 1.5% |
| American | 920 | 2.1% |
| Arab | 535 | 1.2% |
| Argentinean | 59 | 0.1% |
| Armenian | 41 | 0.1% |
| Assyrian / Chaldean / Syriac | 37 | 0.1% |
| Australian | 18 | 0.0% |
| Austrian | 183 | 0.4% |
| Belgian | 84 | 0.2% |
| Bhutanese | 136 | 0.3% |
| Blackfeet | 8 | 0.0% |
| Bolivian | 22 | 0.1% |
| Brazilian | 47 | 0.1% |
| British | 97 | 0.2% |
| Bulgarian | 178 | 0.4% |
| Burmese | 150 | 0.3% |
| Cambodian | 17 | 0.0% |
| Canadian | 35 | 0.1% |
| Celtic | 6 | 0.0% |
| Central American | 157 | 0.4% |
| Central American Indian | 27 | 0.1% |
| Cherokee | 69 | 0.2% |
| Chilean | 7 | 0.0% |
| Colombian | 63 | 0.1% |
| Croatian | 213 | 0.5% |
| Cuban | 24 | 0.1% |
| Czech | 627 | 1.4% |
| Czechoslovakian | 72 | 0.2% |
| Danish | 291 | 0.7% |
| Dominican | 11 | 0.0% |
| Dutch | 815 | 1.8% |
| Eastern European | 151 | 0.3% |
| Ecuadorian | 130 | 0.3% |
| Egyptian | 156 | 0.4% |
| English | 2,241 | 5.1% |
| Ethiopian | 12 | 0.0% |
| European | 1,277 | 2.9% |
| Finnish | 100 | 0.2% |
| French | 717 | 1.6% |
| French Canadian | 85 | 0.2% |
| German | 8,739 | 19.8% |
| Ghanaian | 53 | 0.1% |
| Greek | 762 | 1.7% |
| Guatemalan | 14 | 0.0% |
| Haitian | 56 | 0.1% |
| Honduran | 86 | 0.2% |
| Hungarian | 132 | 0.3% |
| Indian (Asian) | 703 | 1.6% |
| Iranian | 65 | 0.2% |
| Iraqi | 17 | 0.0% |
| Irish | 6,684 | 15.2% |
| Italian | 5,519 | 12.5% |
| Jamaican | 192 | 0.4% |
| Japanese | 32 | 0.1% |
| Jordanian | 13 | 0.0% |
| Kenyan | 12 | 0.0% |
| Korean | 701 | 1.6% |
| Lebanese | 154 | 0.4% |
| Lithuanian | 426 | 1.0% |
| Luxembourger | 27 | 0.1% |
| Macedonian | 118 | 0.3% |
| Mexican | 3,149 | 7.1% |
| Mexican American Indian | 16 | 0.0% |
| Moroccan | 38 | 0.1% |
| Navajo | 9 | 0.0% |
| Nicaraguan | 14 | 0.0% |
| Nigerian | 64 | 0.2% |
| Northern European | 43 | 0.1% |
| Norwegian | 854 | 1.9% |
| Palestinian | 1 | 0.0% |
| Peruvian | 105 | 0.2% |
| Polish | 5,072 | 11.5% |
| Portuguese | 135 | 0.3% |
| Puerto Rican | 308 | 0.7% |
| Romanian | 117 | 0.3% |
| Russian | 272 | 0.6% |
| Salvadoran | 43 | 0.1% |
| Scandinavian | 46 | 0.1% |
| Scotch-Irish | 259 | 0.6% |
| Scottish | 318 | 0.7% |
| Serbian | 90 | 0.2% |
| Slovak | 145 | 0.3% |
| Slovene | 269 | 0.6% |
| Somali | 37 | 0.1% |
| South American | 582 | 1.3% |
| South American Indian | 28 | 0.1% |
| Spaniard | 261 | 0.6% |
| Spanish | 174 | 0.4% |
| Sri Lankan | 39 | 0.1% |
| Subsaharan African | 305 | 0.7% |
| Swedish | 1,039 | 2.4% |
| Swiss | 133 | 0.3% |
| Syrian | 1 | 0.0% |
| Thai | 2,864 | 6.5% |
| Trinidadian and Tobagonian | 32 | 0.1% |
| Turkish | 7 | 0.0% |
| Ukrainian | 417 | 0.9% |
| Uruguayan | 17 | 0.0% |
| Venezuelan | 179 | 0.4% |
| Vietnamese | 231 | 0.5% |
| Welsh | 131 | 0.3% |
| West Indian | 9 | 0.0% |
| Yugoslavian | 73 | 0.2% | View All 104 Rows |
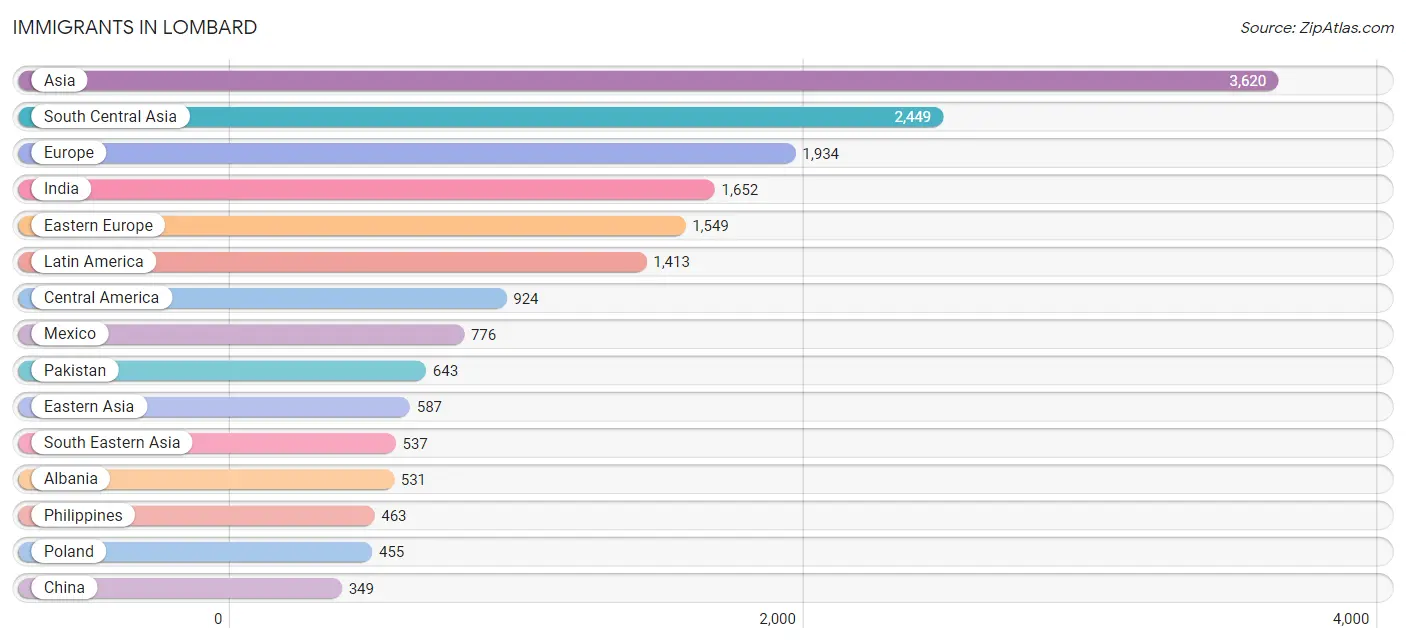
Immigrants in Lombard
The most numerous immigrant groups reported in Lombard came from Asia (3,620 | 8.2%), South Central Asia (2,449 | 5.6%), Europe (1,934 | 4.4%), India (1,652 | 3.7%), and Eastern Europe (1,549 | 3.5%), together accounting for 25.4% of all Lombard residents.
| Immigration Origin | # Population | % Population |
| Africa | 117 | 0.3% |
| Albania | 531 | 1.2% |
| Argentina | 30 | 0.1% |
| Asia | 3,620 | 8.2% |
| Australia | 18 | 0.0% |
| Austria | 15 | 0.0% |
| Bangladesh | 67 | 0.2% |
| Belgium | 7 | 0.0% |
| Bolivia | 22 | 0.1% |
| Brazil | 33 | 0.1% |
| Bulgaria | 116 | 0.3% |
| Cambodia | 16 | 0.0% |
| Canada | 56 | 0.1% |
| Caribbean | 155 | 0.4% |
| Central America | 924 | 2.1% |
| Chile | 7 | 0.0% |
| China | 349 | 0.8% |
| Colombia | 41 | 0.1% |
| Croatia | 23 | 0.1% |
| Cuba | 9 | 0.0% |
| Czechoslovakia | 37 | 0.1% |
| Denmark | 15 | 0.0% |
| Eastern Africa | 23 | 0.1% |
| Eastern Asia | 587 | 1.3% |
| Eastern Europe | 1,549 | 3.5% |
| Egypt | 8 | 0.0% |
| El Salvador | 15 | 0.0% |
| England | 75 | 0.2% |
| Ethiopia | 12 | 0.0% |
| Europe | 1,934 | 4.4% |
| France | 35 | 0.1% |
| Germany | 74 | 0.2% |
| Ghana | 32 | 0.1% |
| Greece | 33 | 0.1% |
| Guatemala | 33 | 0.1% |
| Honduras | 86 | 0.2% |
| Hong Kong | 20 | 0.1% |
| India | 1,652 | 3.7% |
| Indonesia | 10 | 0.0% |
| Iran | 52 | 0.1% |
| Iraq | 7 | 0.0% |
| Italy | 52 | 0.1% |
| Jamaica | 146 | 0.3% |
| Japan | 19 | 0.0% |
| Kenya | 11 | 0.0% |
| Korea | 202 | 0.5% |
| Latin America | 1,413 | 3.2% |
| Lebanon | 21 | 0.1% |
| Lithuania | 71 | 0.2% |
| Mexico | 776 | 1.8% |
| Moldova | 48 | 0.1% |
| Morocco | 20 | 0.1% |
| Nepal | 24 | 0.1% |
| Nicaragua | 14 | 0.0% |
| Nigeria | 11 | 0.0% |
| North Macedonia | 45 | 0.1% |
| Northern Africa | 51 | 0.1% |
| Northern Europe | 169 | 0.4% |
| Norway | 11 | 0.0% |
| Oceania | 18 | 0.0% |
| Pakistan | 643 | 1.5% |
| Peru | 73 | 0.2% |
| Philippines | 463 | 1.1% |
| Poland | 455 | 1.0% |
| Romania | 11 | 0.0% |
| Russia | 46 | 0.1% |
| Saudi Arabia | 18 | 0.0% |
| Scotland | 20 | 0.1% |
| Serbia | 16 | 0.0% |
| Singapore | 3 | 0.0% |
| South America | 334 | 0.8% |
| South Central Asia | 2,449 | 5.6% |
| South Eastern Asia | 537 | 1.2% |
| Southern Europe | 85 | 0.2% |
| Sweden | 12 | 0.0% |
| Taiwan | 59 | 0.1% |
| Ukraine | 101 | 0.2% |
| Uruguay | 8 | 0.0% |
| Venezuela | 120 | 0.3% |
| Vietnam | 45 | 0.1% |
| Western Africa | 43 | 0.1% |
| Western Asia | 46 | 0.1% |
| Western Europe | 131 | 0.3% | View All 83 Rows |
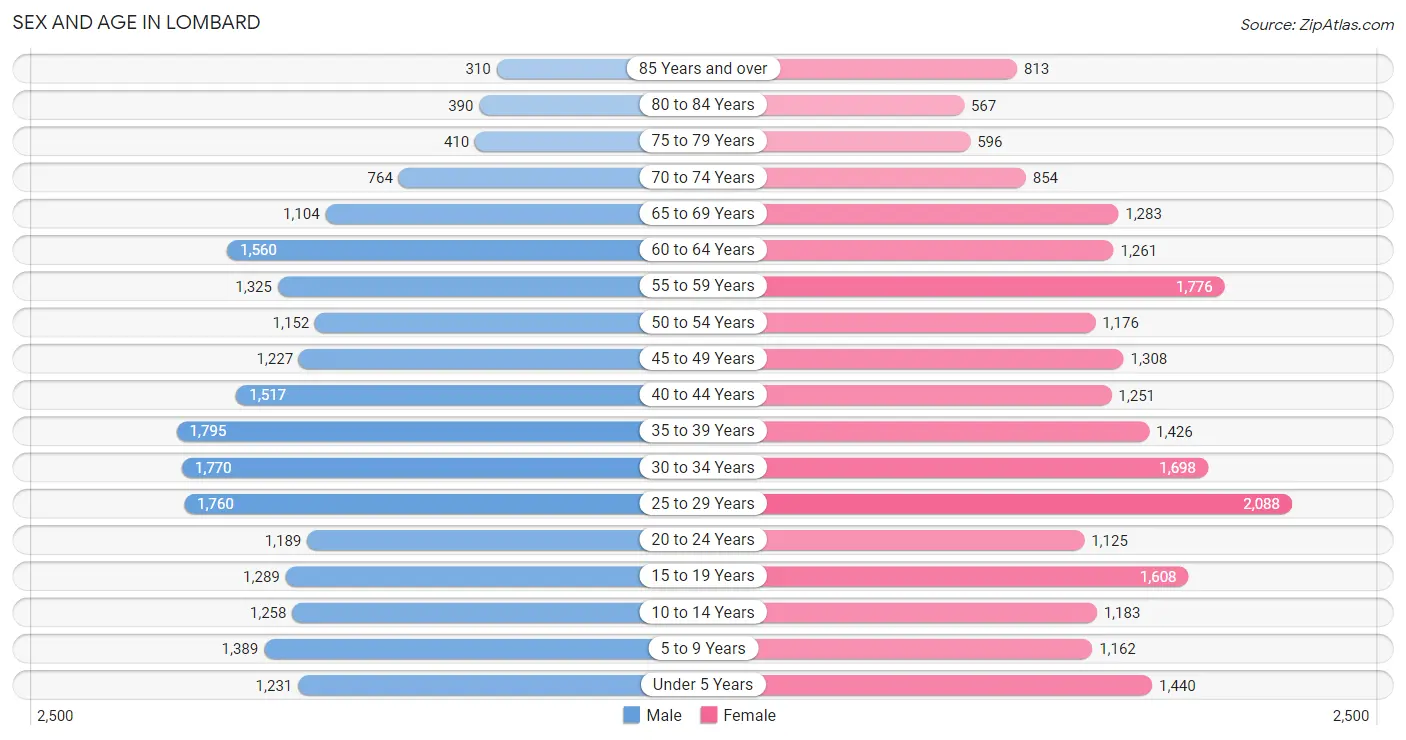
Sex and Age in Lombard
Sex and Age in Lombard
The most populous age groups in Lombard are 35 to 39 Years (1,795 | 8.4%) for men and 25 to 29 Years (2,088 | 9.2%) for women.
| Age Bracket | Male | Female |
| Under 5 Years | 1,231 (5.7%) | 1,440 (6.4%) |
| 5 to 9 Years | 1,389 (6.5%) | 1,162 (5.1%) |
| 10 to 14 Years | 1,258 (5.9%) | 1,183 (5.2%) |
| 15 to 19 Years | 1,289 (6.0%) | 1,608 (7.1%) |
| 20 to 24 Years | 1,189 (5.6%) | 1,125 (5.0%) |
| 25 to 29 Years | 1,760 (8.2%) | 2,088 (9.2%) |
| 30 to 34 Years | 1,770 (8.3%) | 1,698 (7.5%) |
| 35 to 39 Years | 1,795 (8.4%) | 1,426 (6.3%) |
| 40 to 44 Years | 1,517 (7.1%) | 1,251 (5.5%) |
| 45 to 49 Years | 1,227 (5.7%) | 1,308 (5.8%) |
| 50 to 54 Years | 1,152 (5.4%) | 1,176 (5.2%) |
| 55 to 59 Years | 1,325 (6.2%) | 1,776 (7.9%) |
| 60 to 64 Years | 1,560 (7.3%) | 1,261 (5.6%) |
| 65 to 69 Years | 1,104 (5.1%) | 1,283 (5.7%) |
| 70 to 74 Years | 764 (3.6%) | 854 (3.8%) |
| 75 to 79 Years | 410 (1.9%) | 596 (2.6%) |
| 80 to 84 Years | 390 (1.8%) | 567 (2.5%) |
| 85 Years and over | 310 (1.5%) | 813 (3.6%) |
| Total | 21,440 (100.0%) | 22,615 (100.0%) |
Families and Households in Lombard
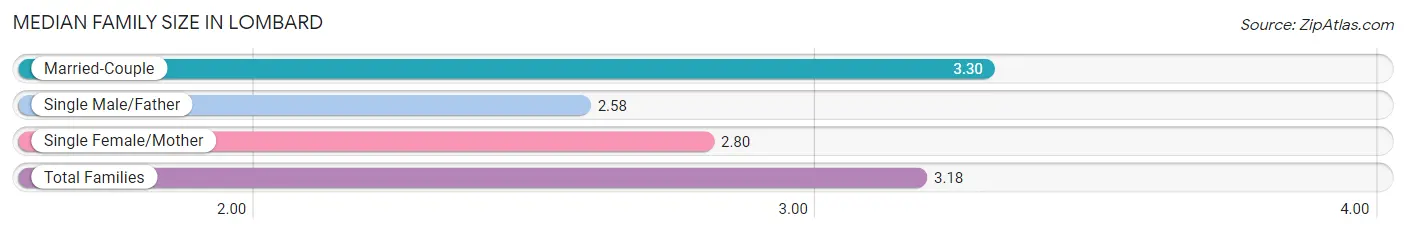
Median Family Size in Lombard
The median family size in Lombard is 3.18 persons per family, with married-couple families (8,879 | 79.0%) accounting for the largest median family size of 3.3 persons per family. On the other hand, single male/father families (616 | 5.5%) represent the smallest median family size with 2.58 persons per family.
| Family Type | # Families | Family Size |
| Married-Couple | 8,879 (79.0%) | 3.30 |
| Single Male/Father | 616 (5.5%) | 2.58 |
| Single Female/Mother | 1,742 (15.5%) | 2.80 |
| Total Families | 11,237 (100.0%) | 3.18 |
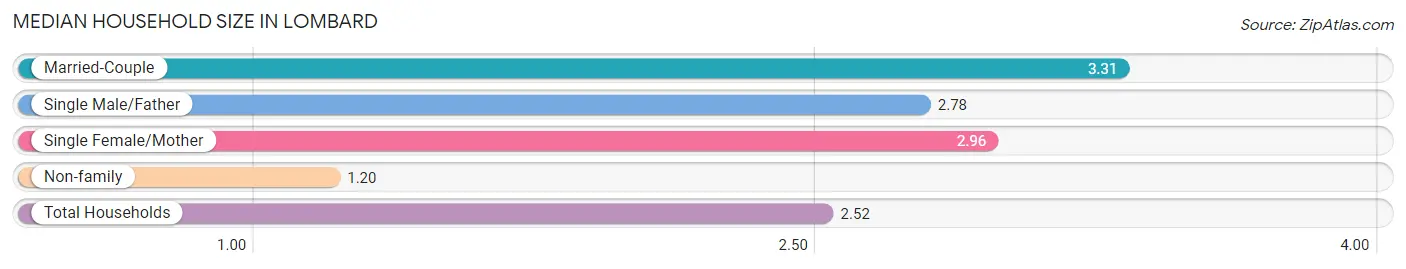
Median Household Size in Lombard
The median household size in Lombard is 2.52 persons per household, with married-couple households (8,879 | 51.7%) accounting for the largest median household size of 3.31 persons per household. non-family households (5,943 | 34.6%) represent the smallest median household size with 1.20 persons per household.
| Household Type | # Households | Household Size |
| Married-Couple | 8,879 (51.7%) | 3.31 |
| Single Male/Father | 616 (3.6%) | 2.78 |
| Single Female/Mother | 1,742 (10.1%) | 2.96 |
| Non-family | 5,943 (34.6%) | 1.20 |
| Total Households | 17,180 (100.0%) | 2.52 |
Household Size by Marriage Status in Lombard
Out of a total of 17,180 households in Lombard, 11,237 (65.4%) are family households, while 5,943 (34.6%) are nonfamily households. The most numerous type of family households are 2-person households, comprising 4,883, and the most common type of nonfamily households are 1-person households, comprising 4,896.
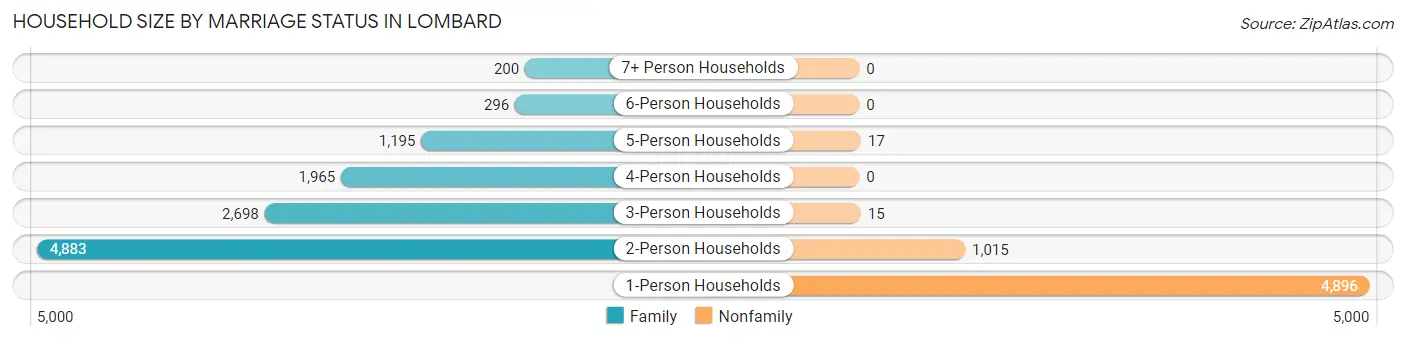
| Household Size | Family Households | Nonfamily Households |
| 1-Person Households | - | 4,896 (28.5%) |
| 2-Person Households | 4,883 (28.4%) | 1,015 (5.9%) |
| 3-Person Households | 2,698 (15.7%) | 15 (0.1%) |
| 4-Person Households | 1,965 (11.4%) | 0 (0.0%) |
| 5-Person Households | 1,195 (7.0%) | 17 (0.1%) |
| 6-Person Households | 296 (1.7%) | 0 (0.0%) |
| 7+ Person Households | 200 (1.2%) | 0 (0.0%) |
| Total | 11,237 (65.4%) | 5,943 (34.6%) |
Female Fertility in Lombard
Fertility by Age in Lombard
Average fertility rate in Lombard is 53.0 births per 1,000 women. Women in the age bracket of 20 to 34 years have the highest fertility rate with 80.0 births per 1,000 women. Women in the age bracket of 20 to 34 years acount for 69.0% of all women with births.
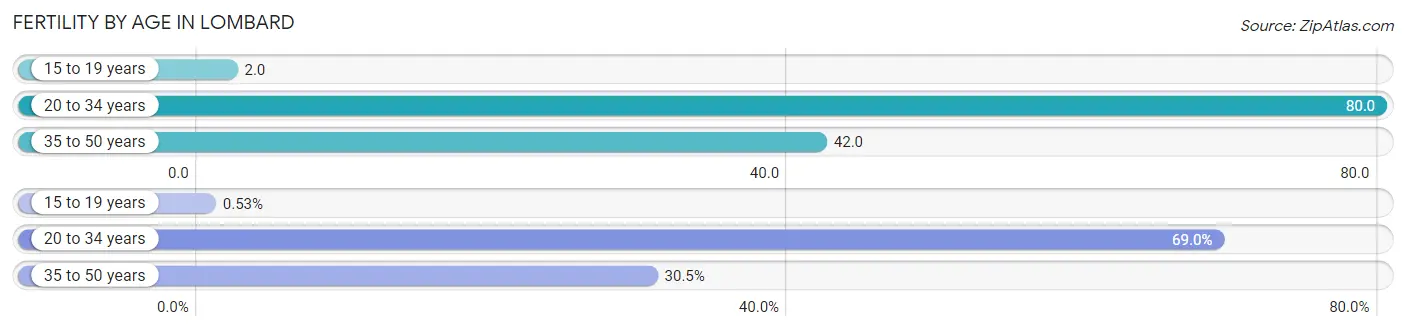
| Age Bracket | Women with Births | Births / 1,000 Women |
| 15 to 19 years | 3 (0.5%) | 2.0 |
| 20 to 34 years | 391 (69.0%) | 80.0 |
| 35 to 50 years | 173 (30.5%) | 42.0 |
| Total | 567 (100.0%) | 53.0 |
Fertility by Age by Marriage Status in Lombard
78.7% of women with births (567) in Lombard are married. The highest percentage of unmarried women with births falls into 15 to 19 years age bracket with 100.0% of them unmarried at the time of birth, while the lowest percentage of unmarried women with births belong to 35 to 50 years age bracket with 16.2% of them unmarried.
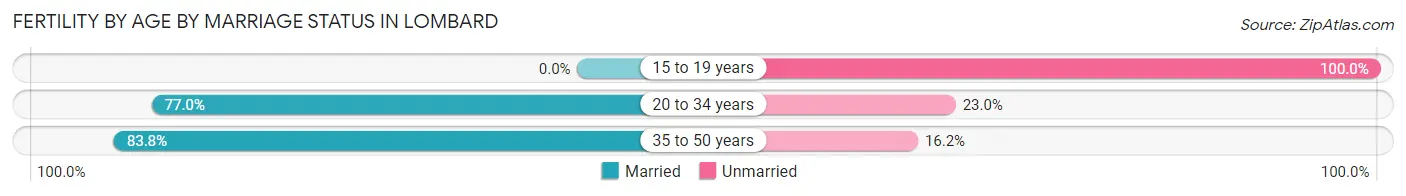
| Age Bracket | Married | Unmarried |
| 15 to 19 years | 0 (0.0%) | 3 (100.0%) |
| 20 to 34 years | 301 (77.0%) | 90 (23.0%) |
| 35 to 50 years | 145 (83.8%) | 28 (16.2%) |
| Total | 446 (78.7%) | 121 (21.3%) |
Fertility by Education in Lombard
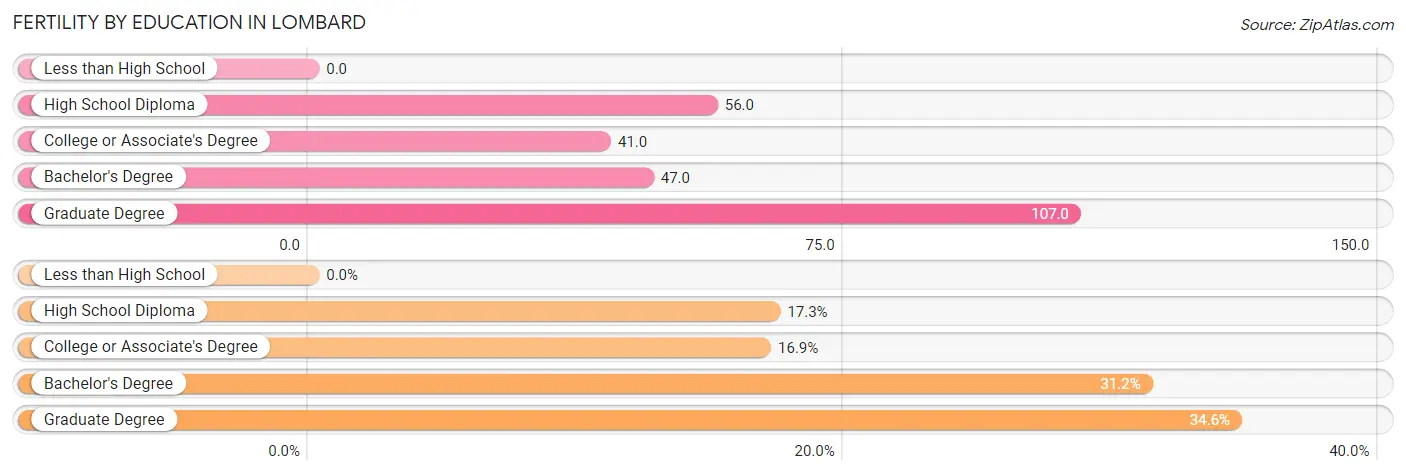
| Educational Attainment | Women with Births | Births / 1,000 Women |
| Less than High School | 0 (0.0%) | 0.0 |
| High School Diploma | 98 (17.3%) | 56.0 |
| College or Associate's Degree | 96 (16.9%) | 41.0 |
| Bachelor's Degree | 177 (31.2%) | 47.0 |
| Graduate Degree | 196 (34.6%) | 107.0 |
| Total | 567 (100.0%) | 53.0 |
Fertility by Education by Marriage Status in Lombard
21.3% of women with births in Lombard are unmarried. Women with the educational attainment of bachelor's degree are most likely to be married with 100.0% of them married at childbirth, while women with the educational attainment of high school diploma are least likely to be married with 66.3% of them unmarried at childbirth.
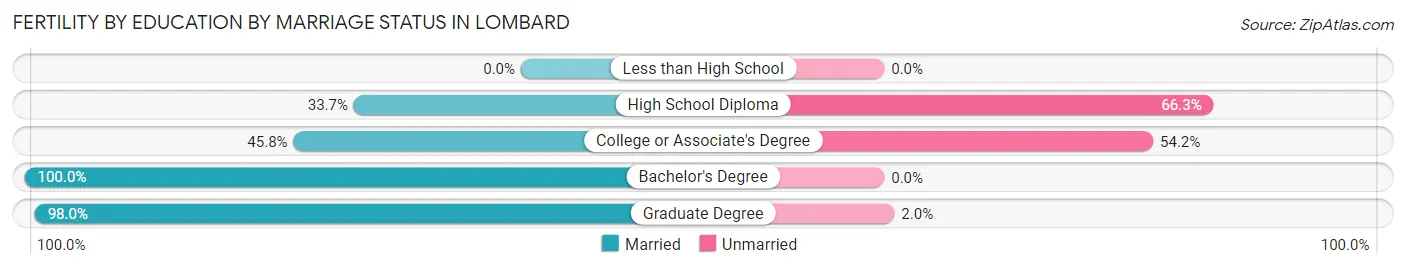
| Educational Attainment | Married | Unmarried |
| Less than High School | 0 (0.0%) | 0 (0.0%) |
| High School Diploma | 33 (33.7%) | 65 (66.3%) |
| College or Associate's Degree | 44 (45.8%) | 52 (54.2%) |
| Bachelor's Degree | 177 (100.0%) | 0 (0.0%) |
| Graduate Degree | 192 (98.0%) | 4 (2.0%) |
| Total | 446 (78.7%) | 121 (21.3%) |
Employment Characteristics in Lombard
Employment by Class of Employer in Lombard
Among the 23,881 employed individuals in Lombard, private company employees (17,454 | 73.1%), local government employees (2,070 | 8.7%), and not-for-profit organizations (2,060 | 8.6%) make up the most common classes of employment.
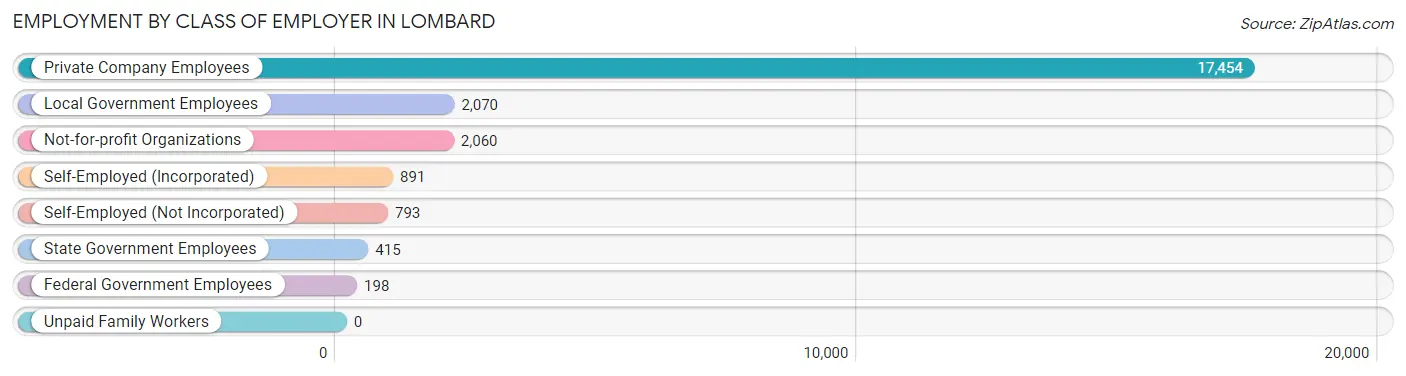
| Employer Class | # Employees | % Employees |
| Private Company Employees | 17,454 | 73.1% |
| Self-Employed (Incorporated) | 891 | 3.7% |
| Self-Employed (Not Incorporated) | 793 | 3.3% |
| Not-for-profit Organizations | 2,060 | 8.6% |
| Local Government Employees | 2,070 | 8.7% |
| State Government Employees | 415 | 1.7% |
| Federal Government Employees | 198 | 0.8% |
| Unpaid Family Workers | 0 | 0.0% |
| Total | 23,881 | 100.0% |
Employment Status by Age in Lombard
According to the labor force statistics for Lombard, out of the total population over 16 years of age (35,878), 70.9% or 25,438 individuals are in the labor force, with 4.4% or 1,119 of them unemployed. The age group with the highest labor force participation rate is 30 to 34 years, with 89.9% or 3,118 individuals in the labor force. Within the labor force, the 16 to 19 years age range has the highest percentage of unemployed individuals, with 14.4% or 202 of them being unemployed.
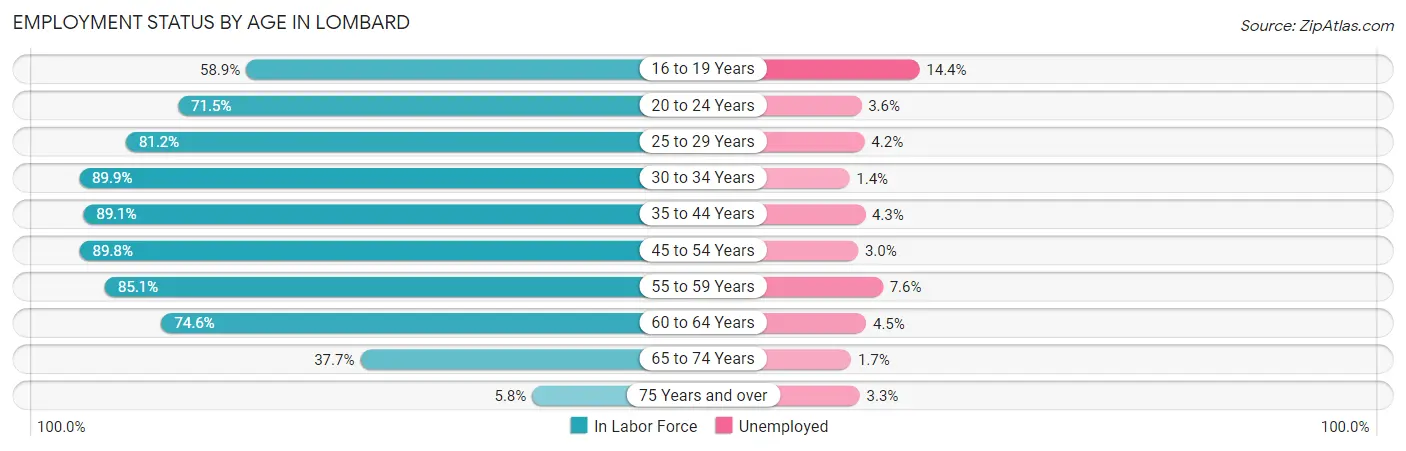
| Age Bracket | In Labor Force | Unemployed |
| 16 to 19 Years | 1,404 (58.9%) | 202 (14.4%) |
| 20 to 24 Years | 1,655 (71.5%) | 60 (3.6%) |
| 25 to 29 Years | 3,125 (81.2%) | 131 (4.2%) |
| 30 to 34 Years | 3,118 (89.9%) | 44 (1.4%) |
| 35 to 44 Years | 5,336 (89.1%) | 229 (4.3%) |
| 45 to 54 Years | 4,367 (89.8%) | 131 (3.0%) |
| 55 to 59 Years | 2,639 (85.1%) | 201 (7.6%) |
| 60 to 64 Years | 2,104 (74.6%) | 95 (4.5%) |
| 65 to 74 Years | 1,510 (37.7%) | 26 (1.7%) |
| 75 Years and over | 179 (5.8%) | 6 (3.3%) |
| Total | 25,438 (70.9%) | 1,119 (4.4%) |
Employment Status by Educational Attainment in Lombard
According to labor force statistics for Lombard, 85.9% of individuals (20,693) out of the total population between 25 and 64 years of age (24,090) are in the labor force, with 4.0% or 828 of them being unemployed. The group with the highest labor force participation rate are those with the educational attainment of college / associate degree, with 89.1% or 5,290 individuals in the labor force. Within the labor force, individuals with less than high school education have the highest percentage of unemployment, with 18.5% or 75 of them being unemployed.
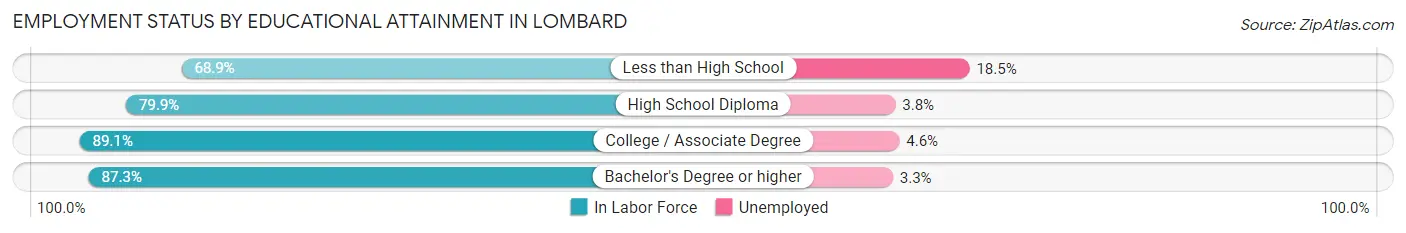
| Educational Attainment | In Labor Force | Unemployed |
| Less than High School | 405 (68.9%) | 109 (18.5%) |
| High School Diploma | 3,677 (79.9%) | 175 (3.8%) |
| College / Associate Degree | 5,290 (89.1%) | 273 (4.6%) |
| Bachelor's Degree or higher | 11,317 (87.3%) | 428 (3.3%) |
| Total | 20,693 (85.9%) | 964 (4.0%) |
Employment Occupations by Sex in Lombard
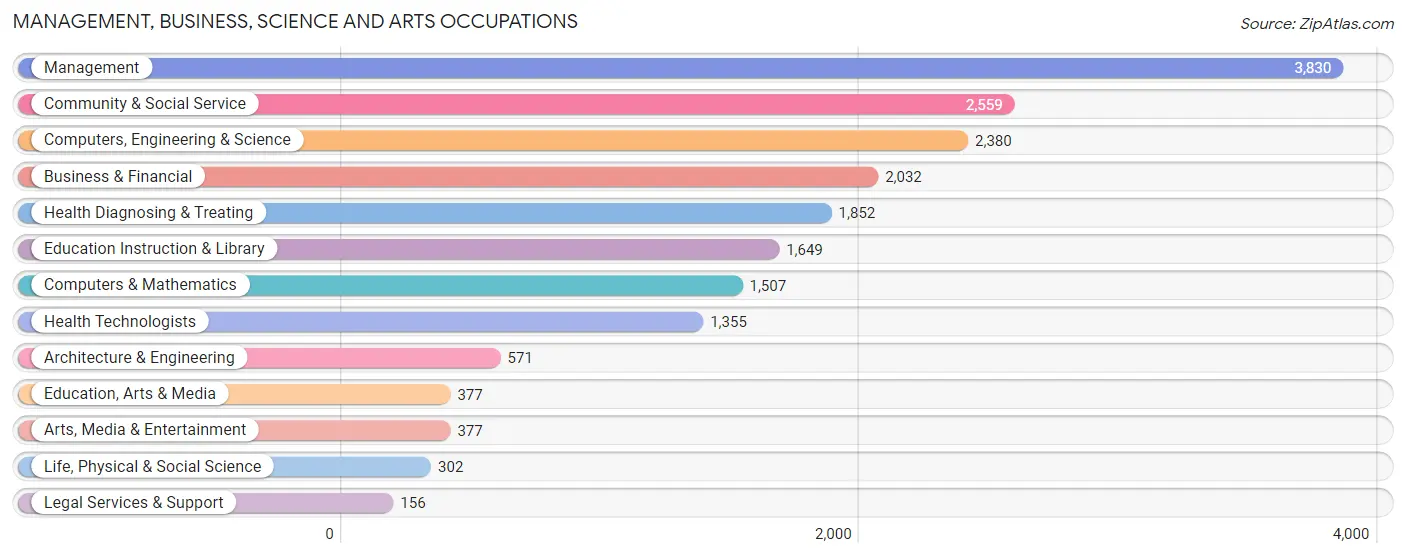
Management, Business, Science and Arts Occupations
The most common Management, Business, Science and Arts occupations in Lombard are Management (3,830 | 15.8%), Community & Social Service (2,559 | 10.5%), Computers, Engineering & Science (2,380 | 9.8%), Business & Financial (2,032 | 8.4%), and Health Diagnosing & Treating (1,852 | 7.6%).
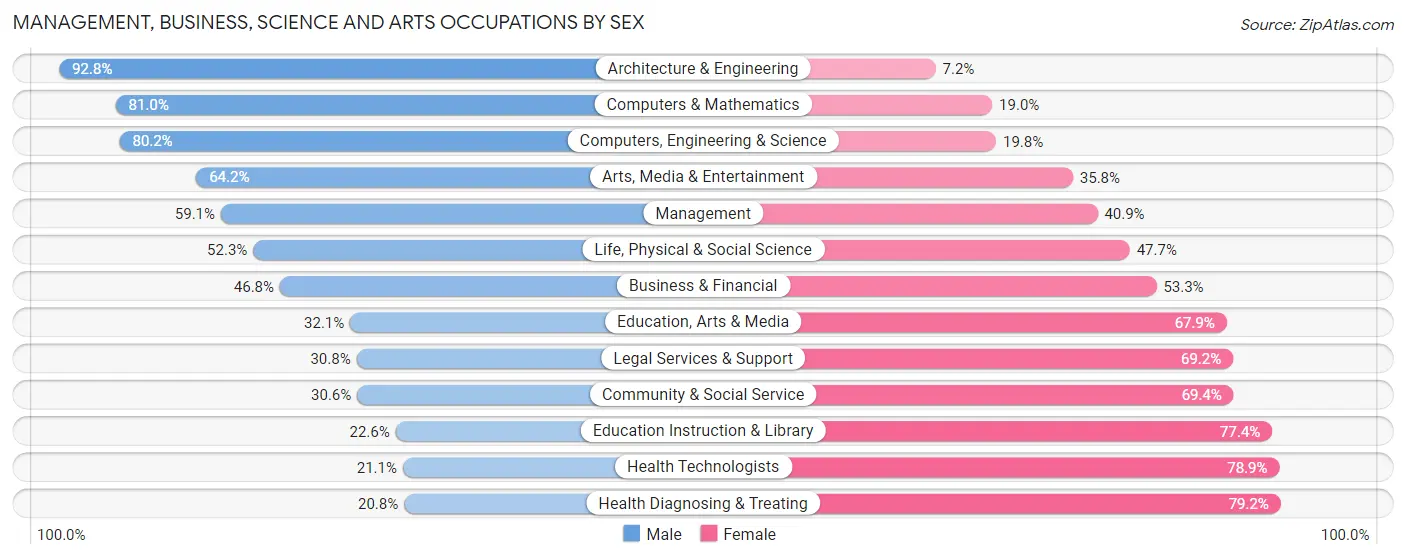
Management, Business, Science and Arts Occupations by Sex
Within the Management, Business, Science and Arts occupations in Lombard, the most male-oriented occupations are Architecture & Engineering (92.8%), Computers & Mathematics (81.0%), and Computers, Engineering & Science (80.2%), while the most female-oriented occupations are Health Diagnosing & Treating (79.2%), Health Technologists (78.9%), and Education Instruction & Library (77.4%).
| Occupation | Male | Female |
| Management | 2,262 (59.1%) | 1,568 (40.9%) |
| Business & Financial | 950 (46.8%) | 1,082 (53.2%) |
| Computers, Engineering & Science | 1,909 (80.2%) | 471 (19.8%) |
| Computers & Mathematics | 1,221 (81.0%) | 286 (19.0%) |
| Architecture & Engineering | 530 (92.8%) | 41 (7.2%) |
| Life, Physical & Social Science | 158 (52.3%) | 144 (47.7%) |
| Community & Social Service | 784 (30.6%) | 1,775 (69.4%) |
| Education, Arts & Media | 121 (32.1%) | 256 (67.9%) |
| Legal Services & Support | 48 (30.8%) | 108 (69.2%) |
| Education Instruction & Library | 373 (22.6%) | 1,276 (77.4%) |
| Arts, Media & Entertainment | 242 (64.2%) | 135 (35.8%) |
| Health Diagnosing & Treating | 386 (20.8%) | 1,466 (79.2%) |
| Health Technologists | 286 (21.1%) | 1,069 (78.9%) |
| Total (Category) | 6,291 (49.7%) | 6,362 (50.3%) |
| Total (Overall) | 12,710 (52.3%) | 11,608 (47.7%) |
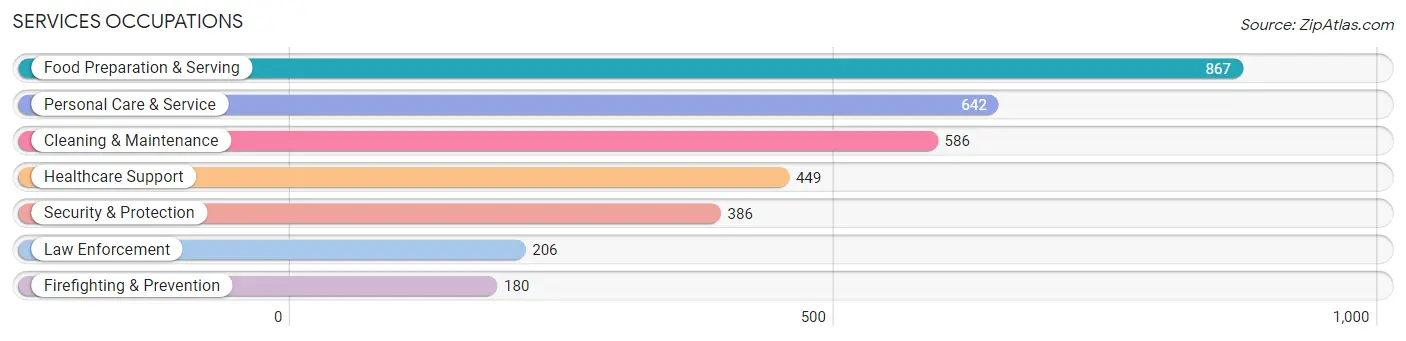
Services Occupations
The most common Services occupations in Lombard are Food Preparation & Serving (867 | 3.6%), Personal Care & Service (642 | 2.6%), Cleaning & Maintenance (586 | 2.4%), Healthcare Support (449 | 1.8%), and Security & Protection (386 | 1.6%).
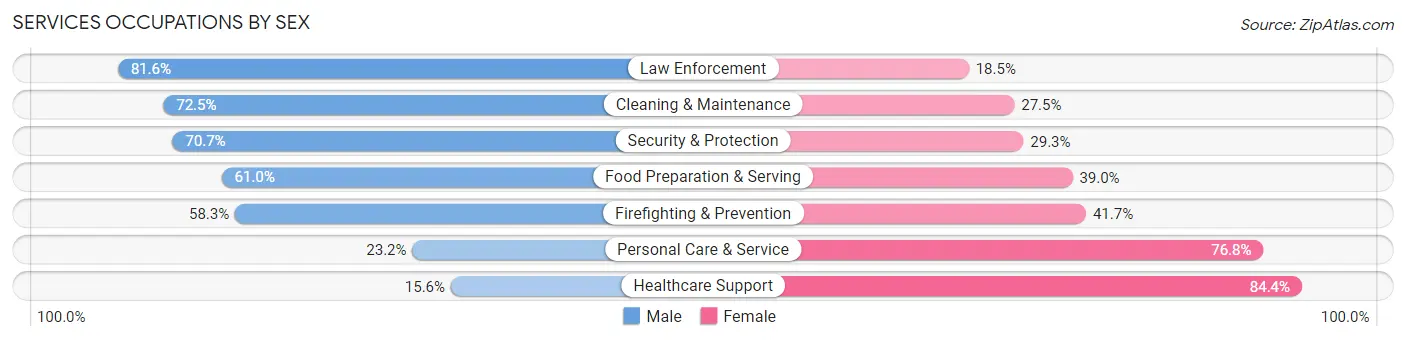
Services Occupations by Sex
Within the Services occupations in Lombard, the most male-oriented occupations are Law Enforcement (81.6%), Cleaning & Maintenance (72.5%), and Security & Protection (70.7%), while the most female-oriented occupations are Healthcare Support (84.4%), Personal Care & Service (76.8%), and Firefighting & Prevention (41.7%).
| Occupation | Male | Female |
| Healthcare Support | 70 (15.6%) | 379 (84.4%) |
| Security & Protection | 273 (70.7%) | 113 (29.3%) |
| Firefighting & Prevention | 105 (58.3%) | 75 (41.7%) |
| Law Enforcement | 168 (81.6%) | 38 (18.4%) |
| Food Preparation & Serving | 529 (61.0%) | 338 (39.0%) |
| Cleaning & Maintenance | 425 (72.5%) | 161 (27.5%) |
| Personal Care & Service | 149 (23.2%) | 493 (76.8%) |
| Total (Category) | 1,446 (49.3%) | 1,484 (50.6%) |
| Total (Overall) | 12,710 (52.3%) | 11,608 (47.7%) |
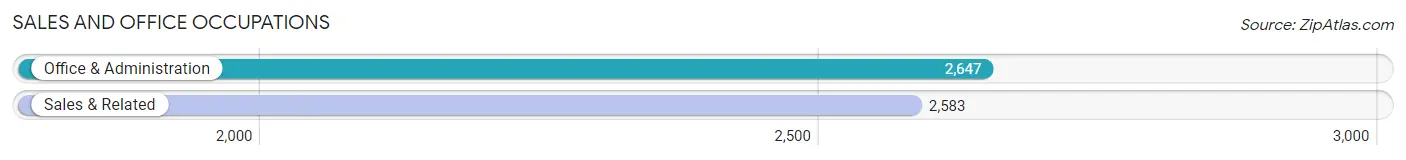
Sales and Office Occupations
The most common Sales and Office occupations in Lombard are Office & Administration (2,647 | 10.9%), and Sales & Related (2,583 | 10.6%).
Sales and Office Occupations by Sex
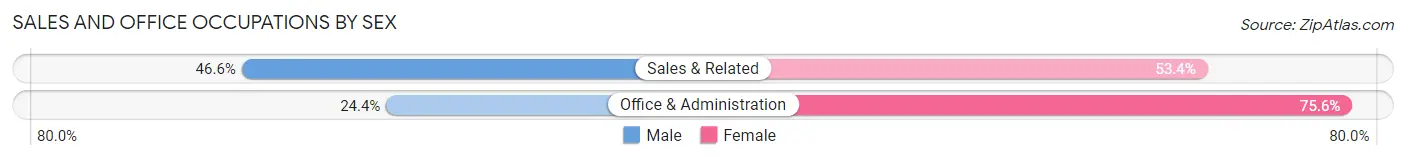
| Occupation | Male | Female |
| Sales & Related | 1,204 (46.6%) | 1,379 (53.4%) |
| Office & Administration | 645 (24.4%) | 2,002 (75.6%) |
| Total (Category) | 1,849 (35.3%) | 3,381 (64.6%) |
| Total (Overall) | 12,710 (52.3%) | 11,608 (47.7%) |
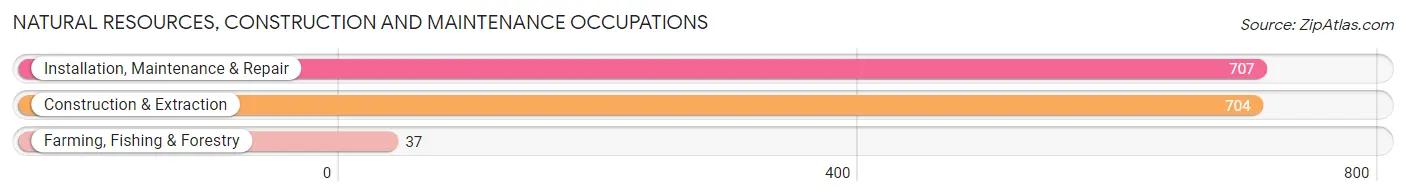
Natural Resources, Construction and Maintenance Occupations
The most common Natural Resources, Construction and Maintenance occupations in Lombard are Installation, Maintenance & Repair (707 | 2.9%), Construction & Extraction (704 | 2.9%), and Farming, Fishing & Forestry (37 | 0.2%).
Natural Resources, Construction and Maintenance Occupations by Sex
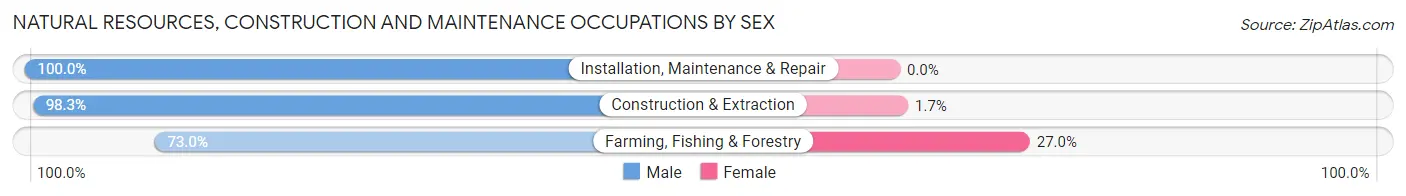
| Occupation | Male | Female |
| Farming, Fishing & Forestry | 27 (73.0%) | 10 (27.0%) |
| Construction & Extraction | 692 (98.3%) | 12 (1.7%) |
| Installation, Maintenance & Repair | 707 (100.0%) | 0 (0.0%) |
| Total (Category) | 1,426 (98.5%) | 22 (1.5%) |
| Total (Overall) | 12,710 (52.3%) | 11,608 (47.7%) |
Production, Transportation and Moving Occupations
The most common Production, Transportation and Moving occupations in Lombard are Material Moving (748 | 3.1%), Production (720 | 3.0%), and Transportation (589 | 2.4%).
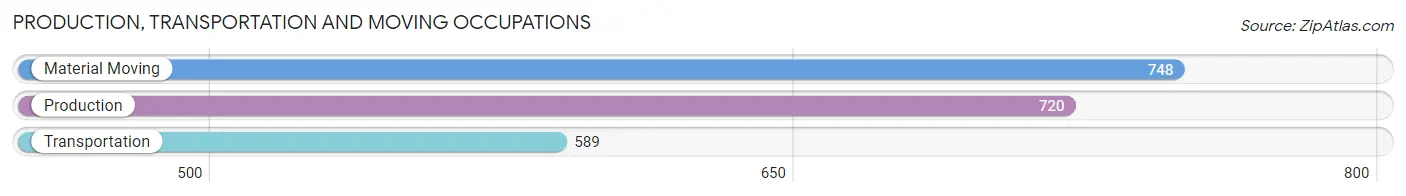
Production, Transportation and Moving Occupations by Sex
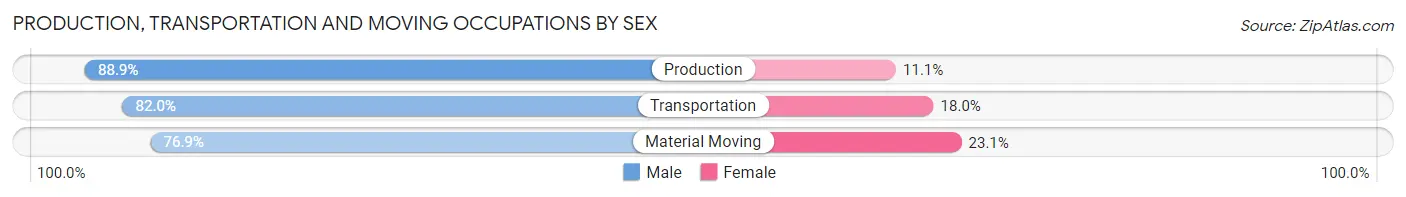
| Occupation | Male | Female |
| Production | 640 (88.9%) | 80 (11.1%) |
| Transportation | 483 (82.0%) | 106 (18.0%) |
| Material Moving | 575 (76.9%) | 173 (23.1%) |
| Total (Category) | 1,698 (82.6%) | 359 (17.4%) |
| Total (Overall) | 12,710 (52.3%) | 11,608 (47.7%) |
Employment Industries by Sex in Lombard
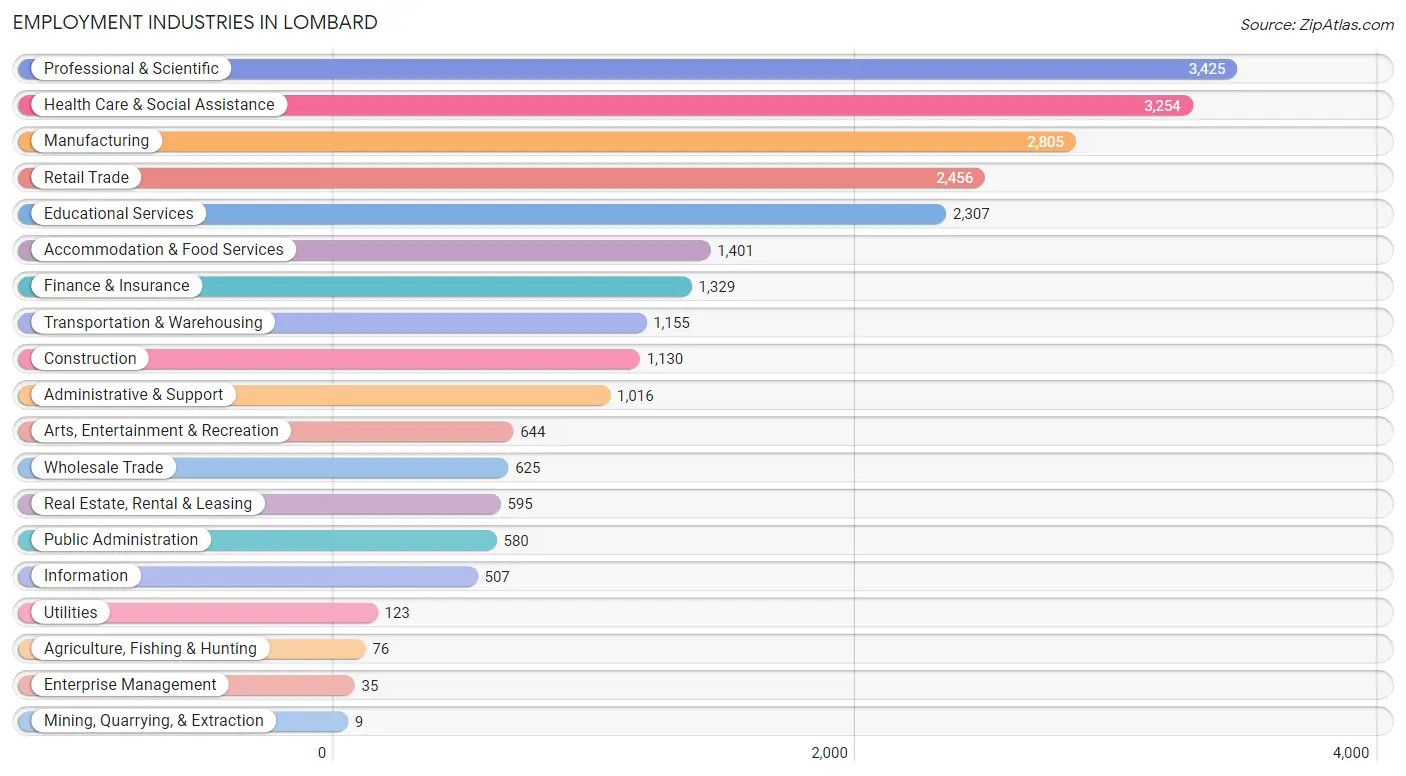
Employment Industries in Lombard
The major employment industries in Lombard include Professional & Scientific (3,425 | 14.1%), Health Care & Social Assistance (3,254 | 13.4%), Manufacturing (2,805 | 11.5%), Retail Trade (2,456 | 10.1%), and Educational Services (2,307 | 9.5%).
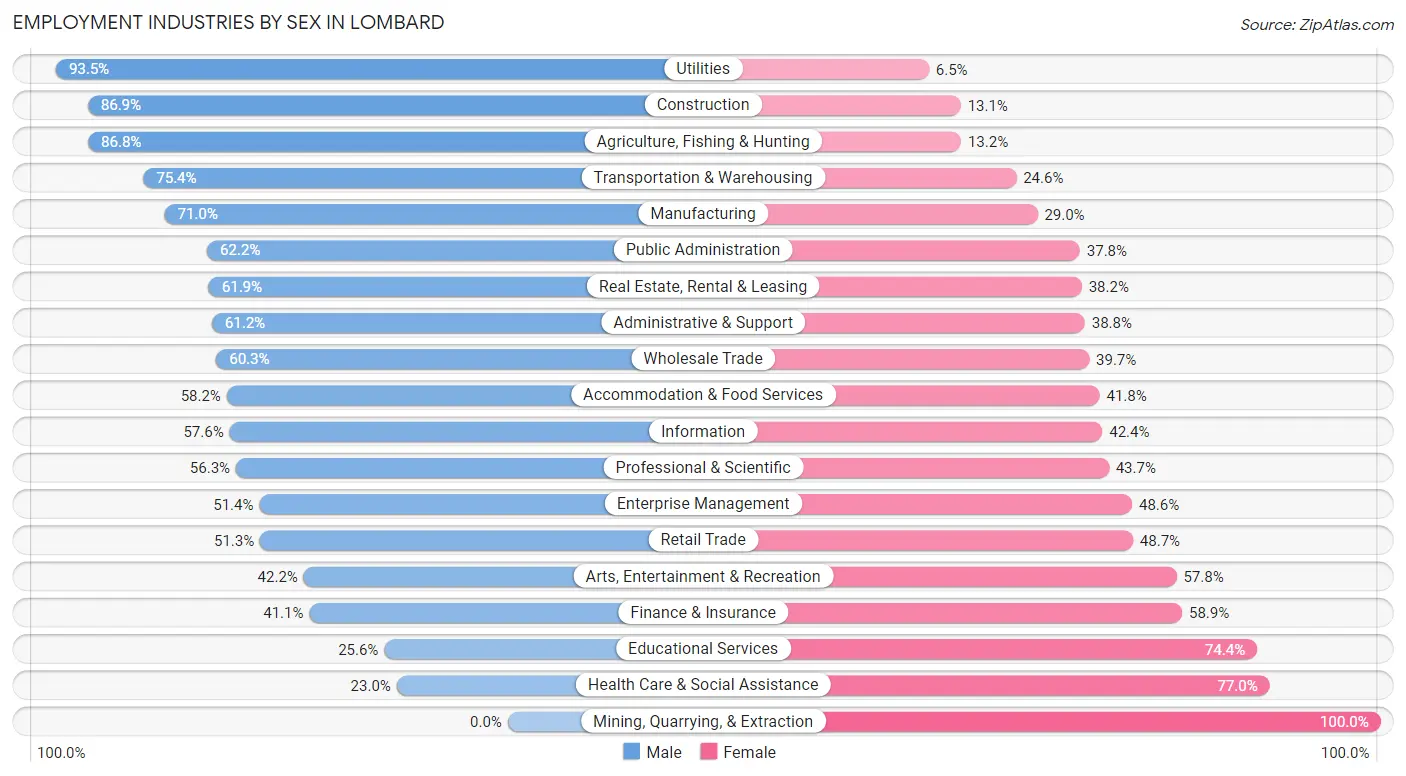
Employment Industries by Sex in Lombard
The Lombard industries that see more men than women are Utilities (93.5%), Construction (86.9%), and Agriculture, Fishing & Hunting (86.8%), whereas the industries that tend to have a higher number of women are Mining, Quarrying, & Extraction (100.0%), Health Care & Social Assistance (77.0%), and Educational Services (74.4%).
| Industry | Male | Female |
| Agriculture, Fishing & Hunting | 66 (86.8%) | 10 (13.2%) |
| Mining, Quarrying, & Extraction | 0 (0.0%) | 9 (100.0%) |
| Construction | 982 (86.9%) | 148 (13.1%) |
| Manufacturing | 1,992 (71.0%) | 813 (29.0%) |
| Wholesale Trade | 377 (60.3%) | 248 (39.7%) |
| Retail Trade | 1,259 (51.3%) | 1,197 (48.7%) |
| Transportation & Warehousing | 871 (75.4%) | 284 (24.6%) |
| Utilities | 115 (93.5%) | 8 (6.5%) |
| Information | 292 (57.6%) | 215 (42.4%) |
| Finance & Insurance | 546 (41.1%) | 783 (58.9%) |
| Real Estate, Rental & Leasing | 368 (61.9%) | 227 (38.2%) |
| Professional & Scientific | 1,927 (56.3%) | 1,498 (43.7%) |
| Enterprise Management | 18 (51.4%) | 17 (48.6%) |
| Administrative & Support | 622 (61.2%) | 394 (38.8%) |
| Educational Services | 590 (25.6%) | 1,717 (74.4%) |
| Health Care & Social Assistance | 748 (23.0%) | 2,506 (77.0%) |
| Arts, Entertainment & Recreation | 272 (42.2%) | 372 (57.8%) |
| Accommodation & Food Services | 815 (58.2%) | 586 (41.8%) |
| Public Administration | 361 (62.2%) | 219 (37.8%) |
| Total | 12,710 (52.3%) | 11,608 (47.7%) |
Education in Lombard
School Enrollment in Lombard
The most common levels of schooling among the 10,394 students in Lombard are college / undergraduate (2,171 | 20.9%), high school (1,961 | 18.9%), and middle school (1,867 | 18.0%).
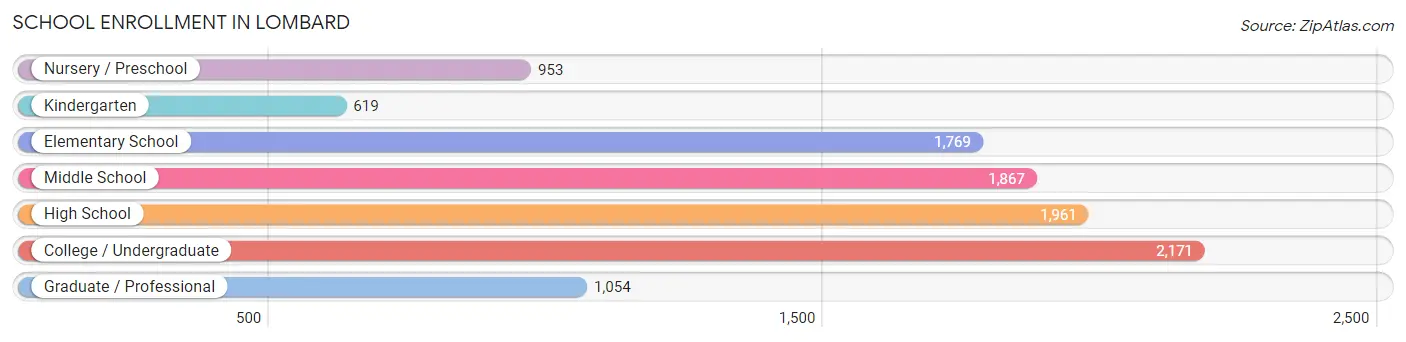
| School Level | # Students | % Students |
| Nursery / Preschool | 953 | 9.2% |
| Kindergarten | 619 | 6.0% |
| Elementary School | 1,769 | 17.0% |
| Middle School | 1,867 | 18.0% |
| High School | 1,961 | 18.9% |
| College / Undergraduate | 2,171 | 20.9% |
| Graduate / Professional | 1,054 | 10.1% |
| Total | 10,394 | 100.0% |
School Enrollment by Age by Funding Source in Lombard
Out of a total of 10,394 students who are enrolled in schools in Lombard, 2,848 (27.4%) attend a private institution, while the remaining 7,546 (72.6%) are enrolled in public schools. The age group of 25 to 34 year olds has the highest likelihood of being enrolled in private schools, with 476 (62.0% in the age bracket) enrolled. Conversely, the age group of 15 to 17 year olds has the lowest likelihood of being enrolled in a private school, with 1,366 (94.7% in the age bracket) attending a public institution.
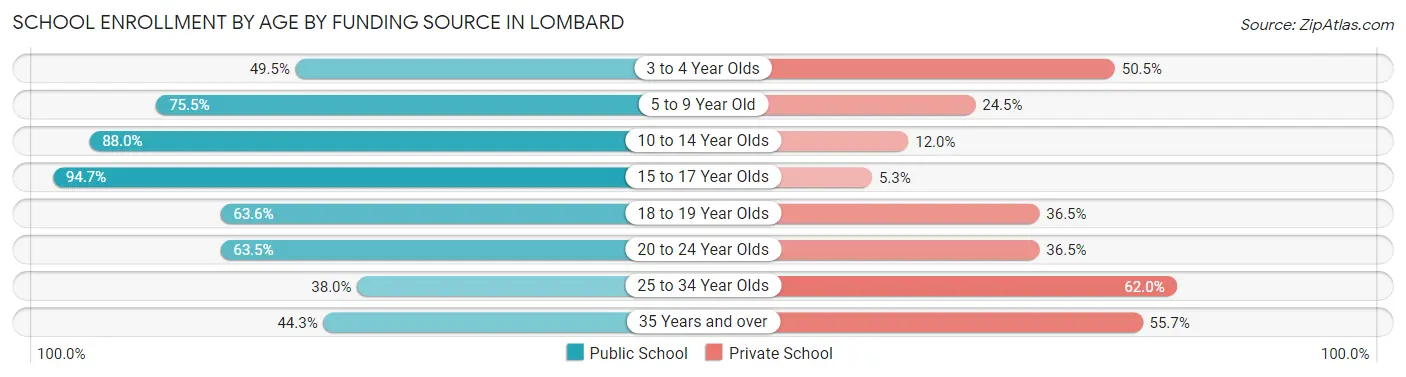
| Age Bracket | Public School | Private School |
| 3 to 4 Year Olds | 347 (49.5%) | 354 (50.5%) |
| 5 to 9 Year Old | 1,822 (75.5%) | 592 (24.5%) |
| 10 to 14 Year Olds | 2,082 (88.0%) | 285 (12.0%) |
| 15 to 17 Year Olds | 1,366 (94.7%) | 76 (5.3%) |
| 18 to 19 Year Olds | 727 (63.5%) | 417 (36.4%) |
| 20 to 24 Year Olds | 732 (63.5%) | 420 (36.5%) |
| 25 to 34 Year Olds | 292 (38.0%) | 476 (62.0%) |
| 35 Years and over | 180 (44.3%) | 226 (55.7%) |
| Total | 7,546 (72.6%) | 2,848 (27.4%) |
Educational Attainment by Field of Study in Lombard
Business (3,757 | 22.3%), science & technology (1,932 | 11.5%), education (1,862 | 11.1%), engineering (1,316 | 7.8%), and computers & mathematics (1,197 | 7.1%) are the most common fields of study among 16,852 individuals in Lombard who have obtained a bachelor's degree or higher.
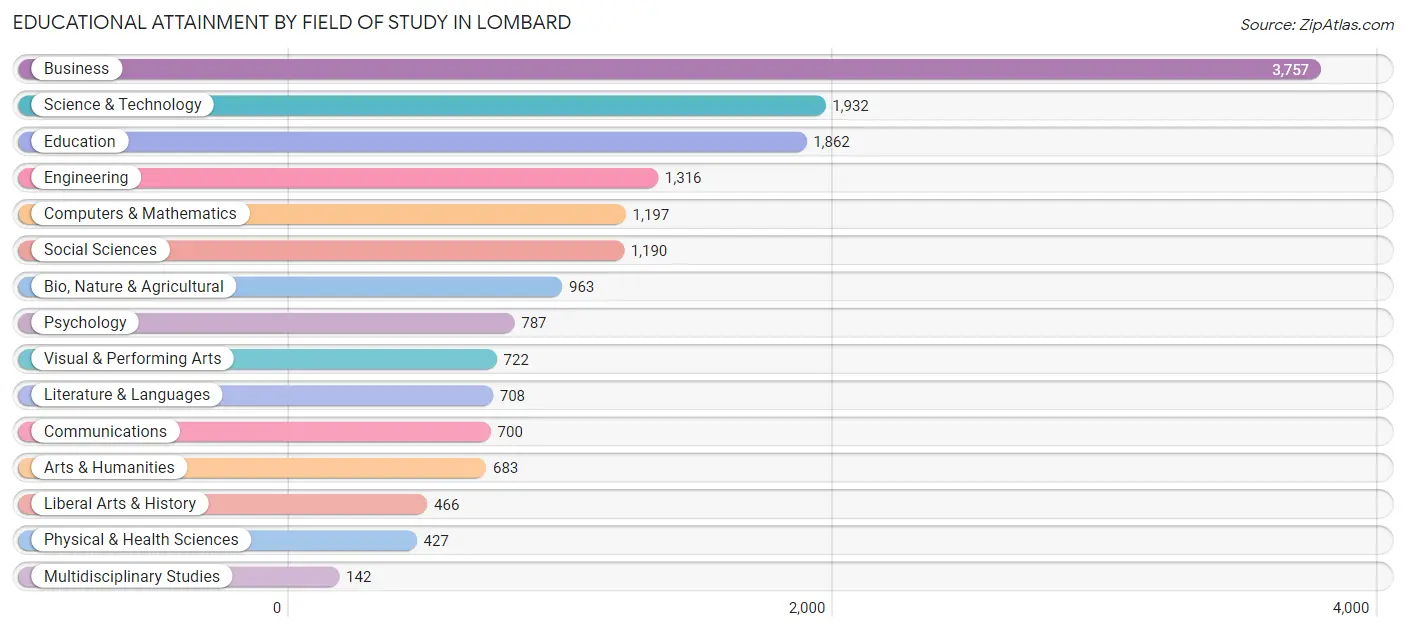
| Field of Study | # Graduates | % Graduates |
| Computers & Mathematics | 1,197 | 7.1% |
| Bio, Nature & Agricultural | 963 | 5.7% |
| Physical & Health Sciences | 427 | 2.5% |
| Psychology | 787 | 4.7% |
| Social Sciences | 1,190 | 7.1% |
| Engineering | 1,316 | 7.8% |
| Multidisciplinary Studies | 142 | 0.8% |
| Science & Technology | 1,932 | 11.5% |
| Business | 3,757 | 22.3% |
| Education | 1,862 | 11.1% |
| Literature & Languages | 708 | 4.2% |
| Liberal Arts & History | 466 | 2.8% |
| Visual & Performing Arts | 722 | 4.3% |
| Communications | 700 | 4.2% |
| Arts & Humanities | 683 | 4.1% |
| Total | 16,852 | 100.0% |
Transportation & Commute in Lombard
Vehicle Availability by Sex in Lombard
The most prevalent vehicle ownership categories in Lombard are males with 2 vehicles (5,623, accounting for 45.1%) and females with 2 vehicles (5,174, making up 49.6%).
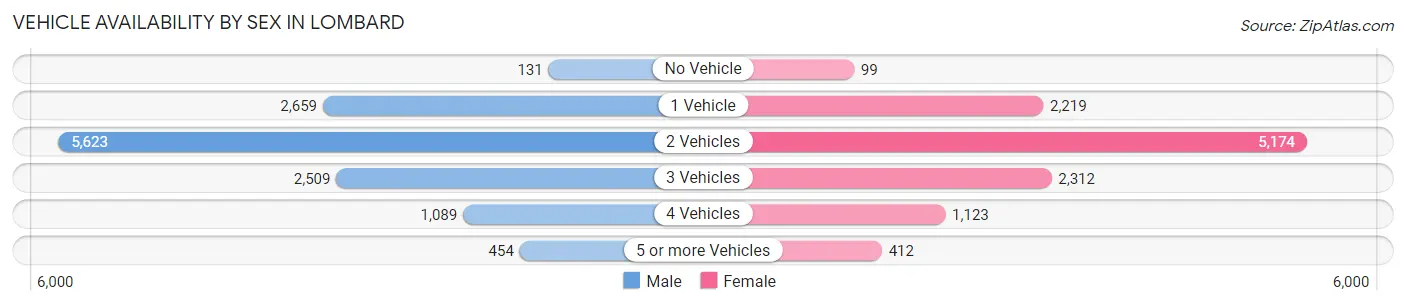
| Vehicles Available | Male | Female |
| No Vehicle | 131 (1.1%) | 99 (0.9%) |
| 1 Vehicle | 2,659 (21.3%) | 2,219 (19.6%) |
| 2 Vehicles | 5,623 (45.1%) | 5,174 (45.6%) |
| 3 Vehicles | 2,509 (20.1%) | 2,312 (20.4%) |
| 4 Vehicles | 1,089 (8.7%) | 1,123 (9.9%) |
| 5 or more Vehicles | 454 (3.6%) | 412 (3.6%) |
| Total | 12,465 (100.0%) | 11,339 (100.0%) |
Commute Time in Lombard
The most frequently occuring commute durations in Lombard are 20 to 24 minutes (3,404 commuters, 17.1%), 30 to 34 minutes (2,507 commuters, 12.6%), and 15 to 19 minutes (2,468 commuters, 12.4%).
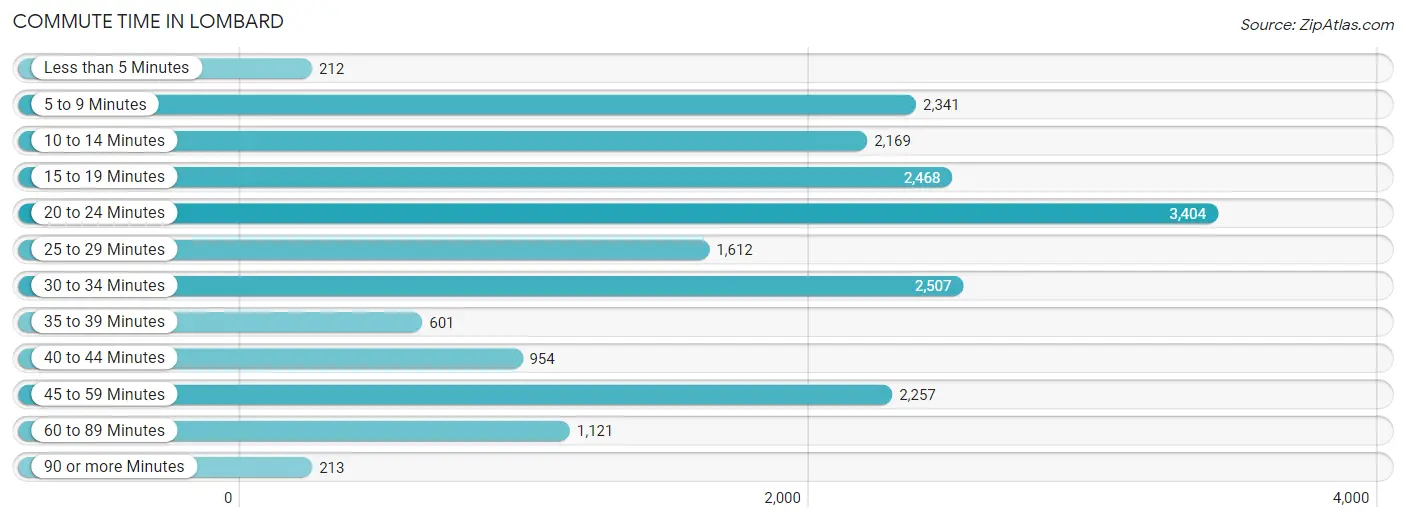
| Commute Time | # Commuters | % Commuters |
| Less than 5 Minutes | 212 | 1.1% |
| 5 to 9 Minutes | 2,341 | 11.8% |
| 10 to 14 Minutes | 2,169 | 10.9% |
| 15 to 19 Minutes | 2,468 | 12.4% |
| 20 to 24 Minutes | 3,404 | 17.1% |
| 25 to 29 Minutes | 1,612 | 8.1% |
| 30 to 34 Minutes | 2,507 | 12.6% |
| 35 to 39 Minutes | 601 | 3.0% |
| 40 to 44 Minutes | 954 | 4.8% |
| 45 to 59 Minutes | 2,257 | 11.4% |
| 60 to 89 Minutes | 1,121 | 5.6% |
| 90 or more Minutes | 213 | 1.1% |
Commute Time by Sex in Lombard
The most common commute times in Lombard are 45 to 59 minutes (1,572 commuters, 14.9%) for males and 20 to 24 minutes (2,009 commuters, 21.6%) for females.
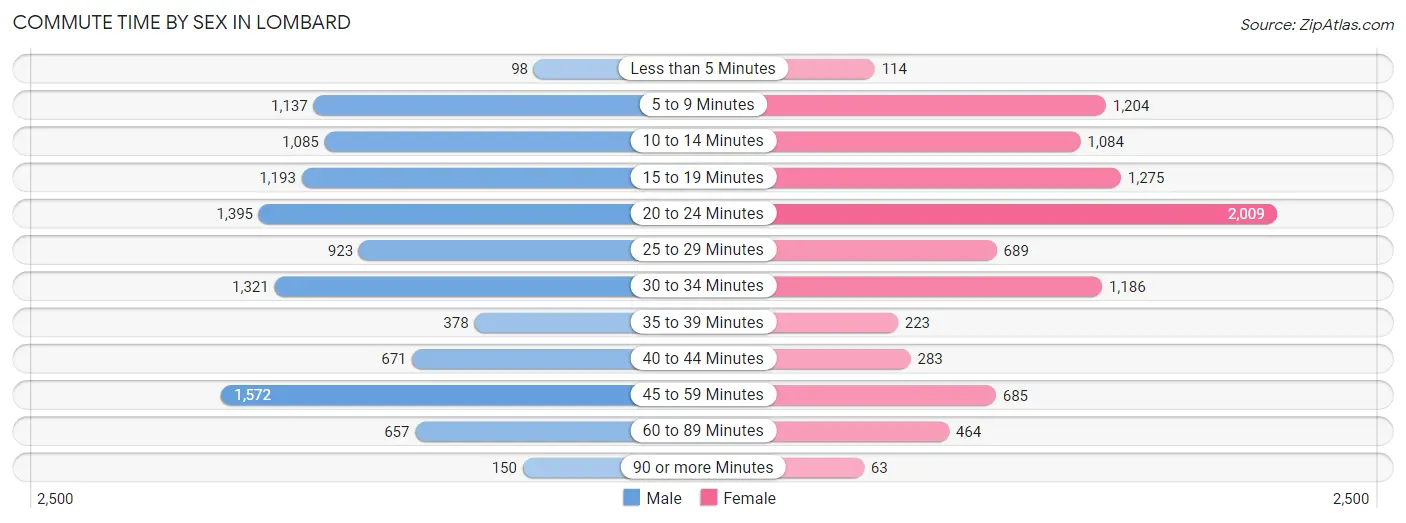
| Commute Time | Male | Female |
| Less than 5 Minutes | 98 (0.9%) | 114 (1.2%) |
| 5 to 9 Minutes | 1,137 (10.7%) | 1,204 (13.0%) |
| 10 to 14 Minutes | 1,085 (10.3%) | 1,084 (11.7%) |
| 15 to 19 Minutes | 1,193 (11.3%) | 1,275 (13.7%) |
| 20 to 24 Minutes | 1,395 (13.2%) | 2,009 (21.6%) |
| 25 to 29 Minutes | 923 (8.7%) | 689 (7.4%) |
| 30 to 34 Minutes | 1,321 (12.5%) | 1,186 (12.8%) |
| 35 to 39 Minutes | 378 (3.6%) | 223 (2.4%) |
| 40 to 44 Minutes | 671 (6.3%) | 283 (3.0%) |
| 45 to 59 Minutes | 1,572 (14.9%) | 685 (7.4%) |
| 60 to 89 Minutes | 657 (6.2%) | 464 (5.0%) |
| 90 or more Minutes | 150 (1.4%) | 63 (0.7%) |
Time of Departure to Work by Sex in Lombard
The most frequent times of departure to work in Lombard are 7:00 AM to 7:29 AM (1,732, 16.4%) for males and 7:30 AM to 7:59 AM (1,971, 21.2%) for females.
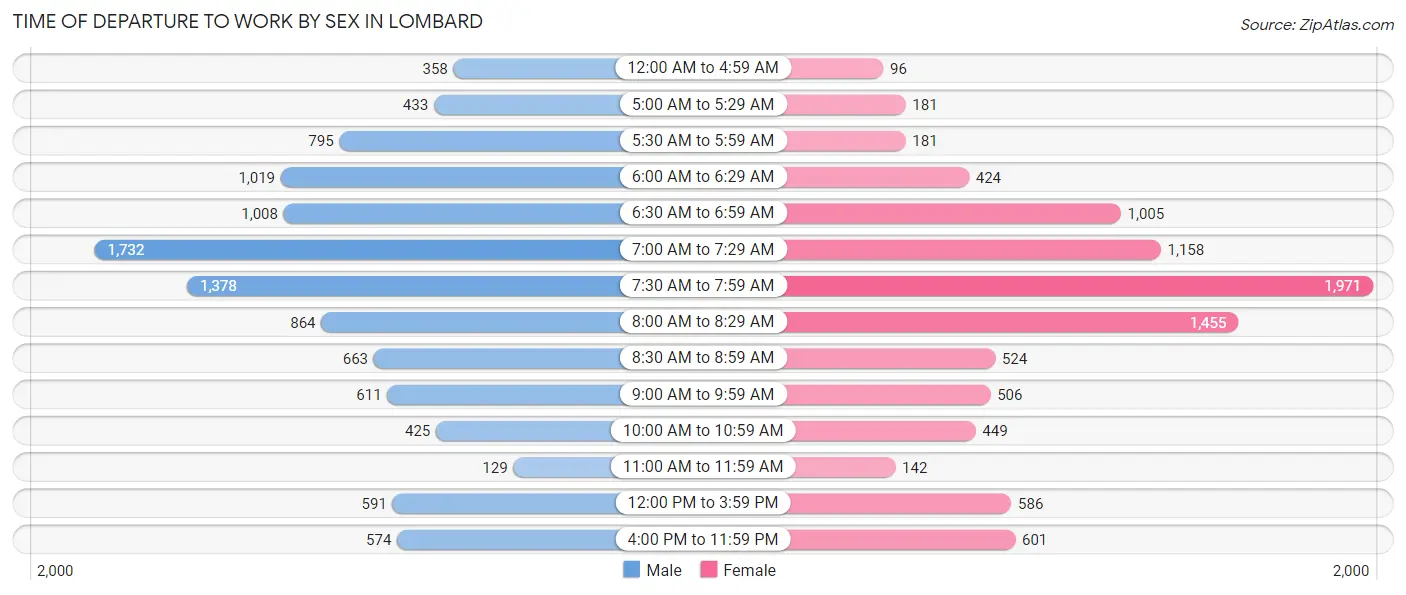
| Time of Departure | Male | Female |
| 12:00 AM to 4:59 AM | 358 (3.4%) | 96 (1.0%) |
| 5:00 AM to 5:29 AM | 433 (4.1%) | 181 (1.9%) |
| 5:30 AM to 5:59 AM | 795 (7.5%) | 181 (1.9%) |
| 6:00 AM to 6:29 AM | 1,019 (9.6%) | 424 (4.6%) |
| 6:30 AM to 6:59 AM | 1,008 (9.5%) | 1,005 (10.8%) |
| 7:00 AM to 7:29 AM | 1,732 (16.4%) | 1,158 (12.5%) |
| 7:30 AM to 7:59 AM | 1,378 (13.0%) | 1,971 (21.2%) |
| 8:00 AM to 8:29 AM | 864 (8.2%) | 1,455 (15.7%) |
| 8:30 AM to 8:59 AM | 663 (6.3%) | 524 (5.7%) |
| 9:00 AM to 9:59 AM | 611 (5.8%) | 506 (5.4%) |
| 10:00 AM to 10:59 AM | 425 (4.0%) | 449 (4.8%) |
| 11:00 AM to 11:59 AM | 129 (1.2%) | 142 (1.5%) |
| 12:00 PM to 3:59 PM | 591 (5.6%) | 586 (6.3%) |
| 4:00 PM to 11:59 PM | 574 (5.4%) | 601 (6.5%) |
| Total | 10,580 (100.0%) | 9,279 (100.0%) |
Housing Occupancy in Lombard
Occupancy by Ownership in Lombard
Of the total 17,180 dwellings in Lombard, owner-occupied units account for 12,009 (69.9%), while renter-occupied units make up 5,171 (30.1%).
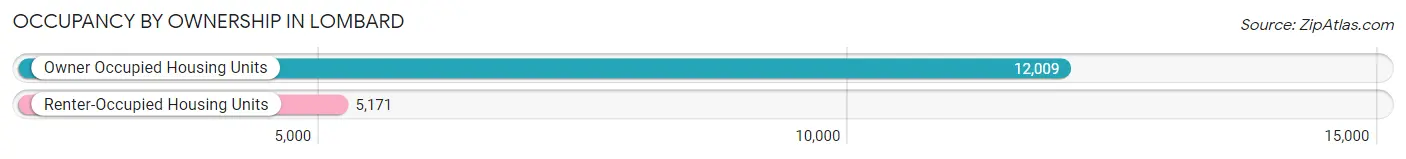
| Occupancy | # Housing Units | % Housing Units |
| Owner Occupied Housing Units | 12,009 | 69.9% |
| Renter-Occupied Housing Units | 5,171 | 30.1% |
| Total Occupied Housing Units | 17,180 | 100.0% |
Occupancy by Household Size in Lombard
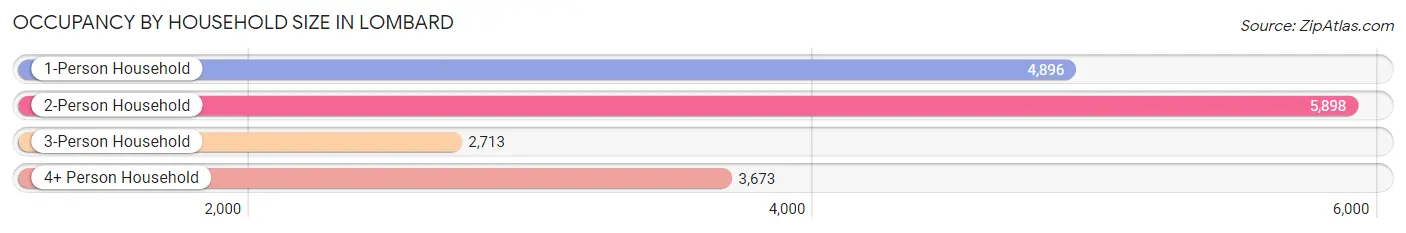
| Household Size | # Housing Units | % Housing Units |
| 1-Person Household | 4,896 | 28.5% |
| 2-Person Household | 5,898 | 34.3% |
| 3-Person Household | 2,713 | 15.8% |
| 4+ Person Household | 3,673 | 21.4% |
| Total Housing Units | 17,180 | 100.0% |
Occupancy by Ownership by Household Size in Lombard
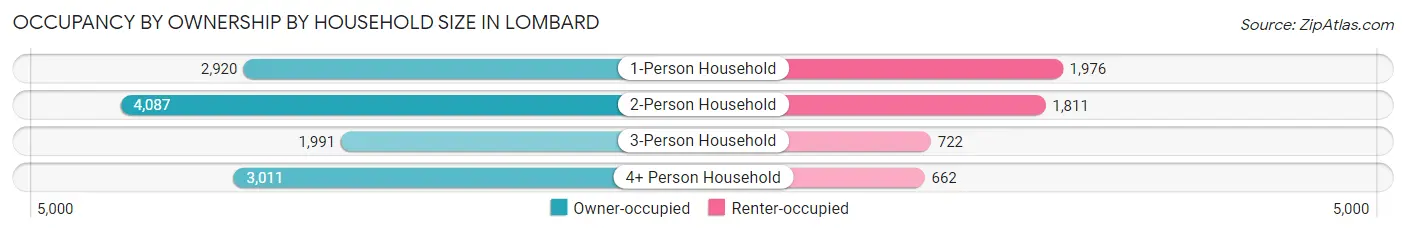
| Household Size | Owner-occupied | Renter-occupied |
| 1-Person Household | 2,920 (59.6%) | 1,976 (40.4%) |
| 2-Person Household | 4,087 (69.3%) | 1,811 (30.7%) |
| 3-Person Household | 1,991 (73.4%) | 722 (26.6%) |
| 4+ Person Household | 3,011 (82.0%) | 662 (18.0%) |
| Total Housing Units | 12,009 (69.9%) | 5,171 (30.1%) |
Occupancy by Educational Attainment in Lombard
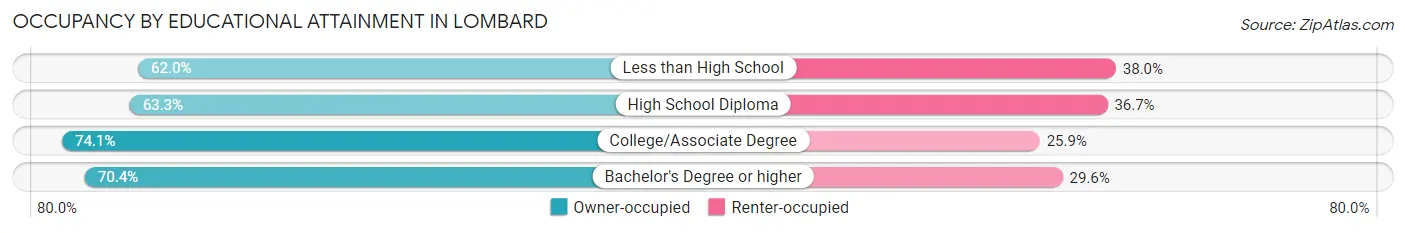
| Household Size | Owner-occupied | Renter-occupied |
| Less than High School | 282 (62.0%) | 173 (38.0%) |
| High School Diploma | 1,868 (63.3%) | 1,082 (36.7%) |
| College/Associate Degree | 3,204 (74.1%) | 1,122 (25.9%) |
| Bachelor's Degree or higher | 6,655 (70.4%) | 2,794 (29.6%) |
Occupancy by Age of Householder in Lombard
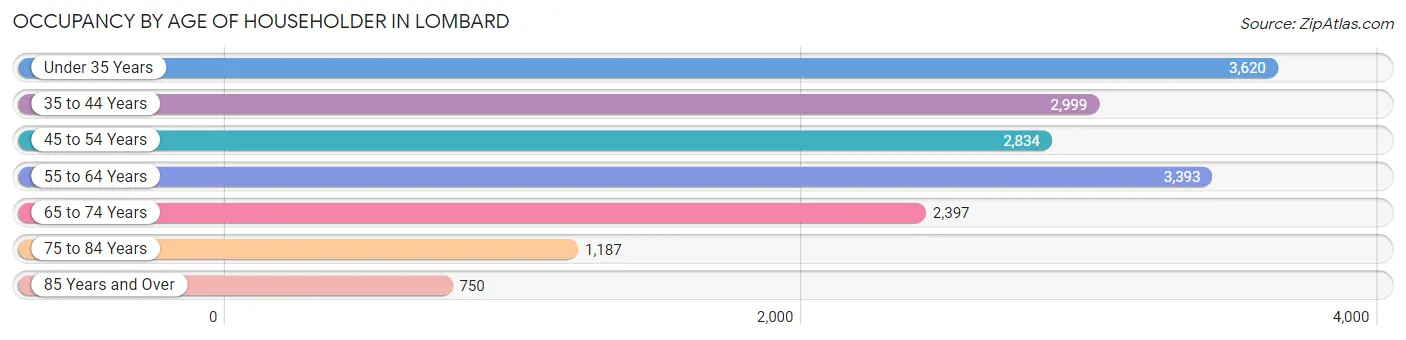
| Age Bracket | # Households | % Households |
| Under 35 Years | 3,620 | 21.1% |
| 35 to 44 Years | 2,999 | 17.5% |
| 45 to 54 Years | 2,834 | 16.5% |
| 55 to 64 Years | 3,393 | 19.8% |
| 65 to 74 Years | 2,397 | 14.0% |
| 75 to 84 Years | 1,187 | 6.9% |
| 85 Years and Over | 750 | 4.4% |
| Total | 17,180 | 100.0% |
Housing Finances in Lombard
Median Income by Occupancy in Lombard
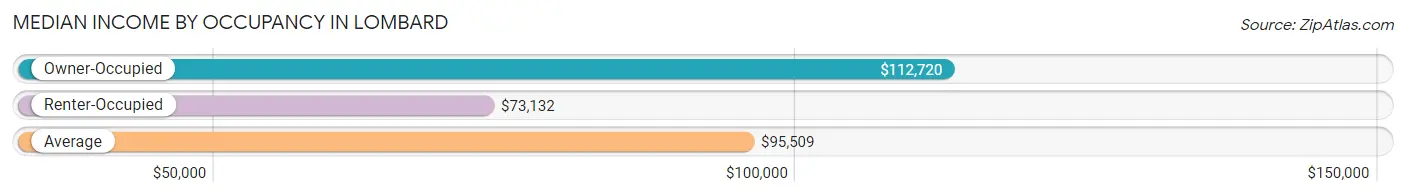
| Occupancy Type | # Households | Median Income |
| Owner-Occupied | 12,009 (69.9%) | $112,720 |
| Renter-Occupied | 5,171 (30.1%) | $73,132 |
| Average | 17,180 (100.0%) | $95,509 |
Occupancy by Householder Income Bracket in Lombard
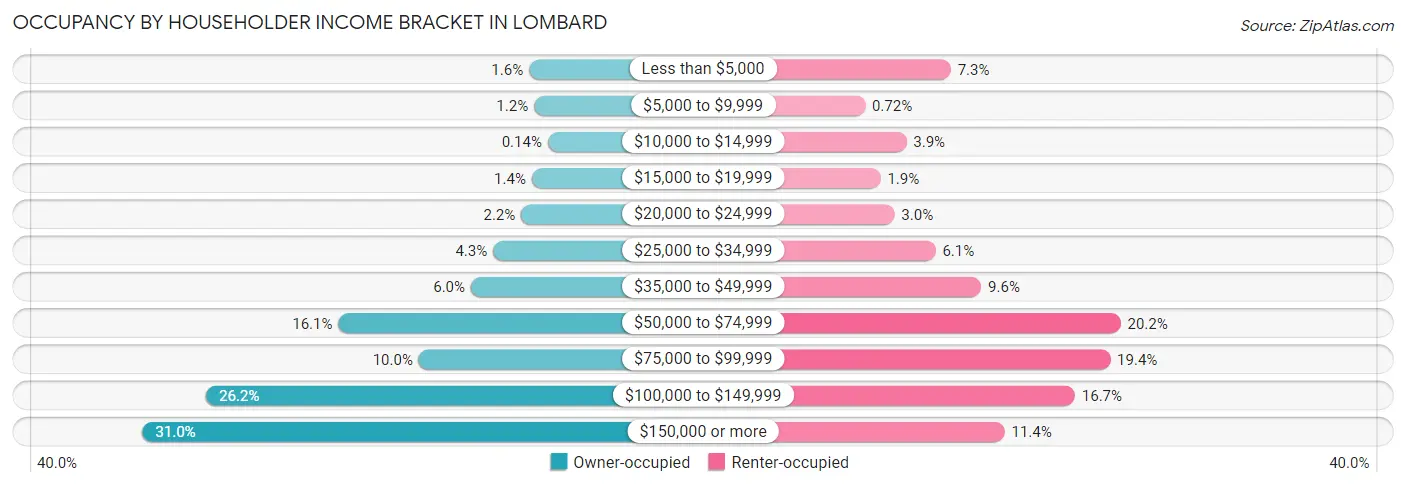
| Income Bracket | Owner-occupied | Renter-occupied |
| Less than $5,000 | 189 (1.6%) | 375 (7.2%) |
| $5,000 to $9,999 | 143 (1.2%) | 37 (0.7%) |
| $10,000 to $14,999 | 17 (0.1%) | 200 (3.9%) |
| $15,000 to $19,999 | 163 (1.4%) | 98 (1.9%) |
| $20,000 to $24,999 | 260 (2.2%) | 153 (3.0%) |
| $25,000 to $34,999 | 517 (4.3%) | 315 (6.1%) |
| $35,000 to $49,999 | 721 (6.0%) | 495 (9.6%) |
| $50,000 to $74,999 | 1,934 (16.1%) | 1,044 (20.2%) |
| $75,000 to $99,999 | 1,197 (10.0%) | 1,003 (19.4%) |
| $100,000 to $149,999 | 3,143 (26.2%) | 864 (16.7%) |
| $150,000 or more | 3,725 (31.0%) | 587 (11.4%) |
| Total | 12,009 (100.0%) | 5,171 (100.0%) |
Monthly Housing Cost Tiers in Lombard
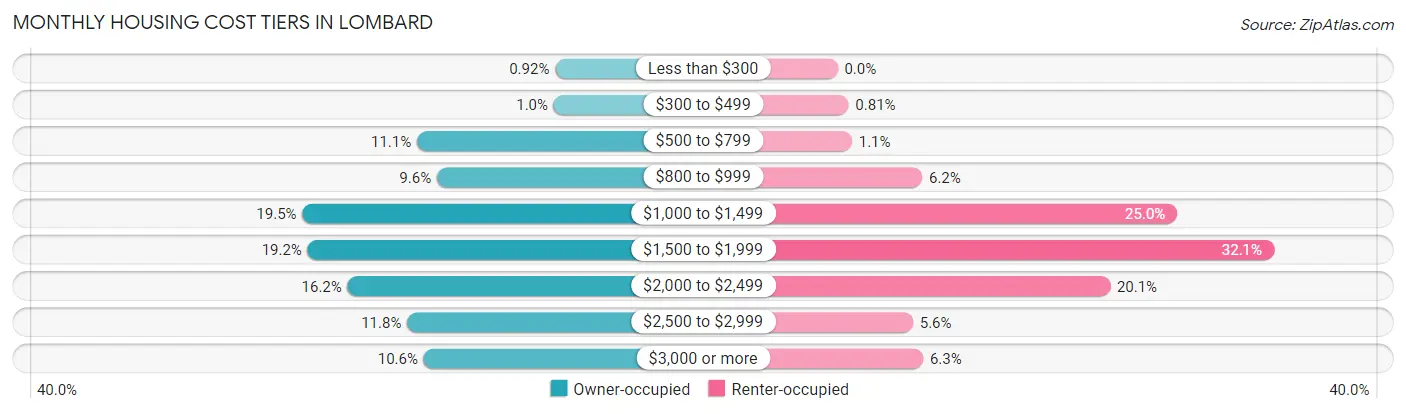
| Monthly Cost | Owner-occupied | Renter-occupied |
| Less than $300 | 110 (0.9%) | 0 (0.0%) |
| $300 to $499 | 123 (1.0%) | 42 (0.8%) |
| $500 to $799 | 1,333 (11.1%) | 55 (1.1%) |
| $800 to $999 | 1,157 (9.6%) | 322 (6.2%) |
| $1,000 to $1,499 | 2,346 (19.5%) | 1,294 (25.0%) |
| $1,500 to $1,999 | 2,300 (19.2%) | 1,662 (32.1%) |
| $2,000 to $2,499 | 1,947 (16.2%) | 1,038 (20.1%) |
| $2,500 to $2,999 | 1,420 (11.8%) | 287 (5.6%) |
| $3,000 or more | 1,273 (10.6%) | 326 (6.3%) |
| Total | 12,009 (100.0%) | 5,171 (100.0%) |
Physical Housing Characteristics in Lombard
Housing Structures in Lombard
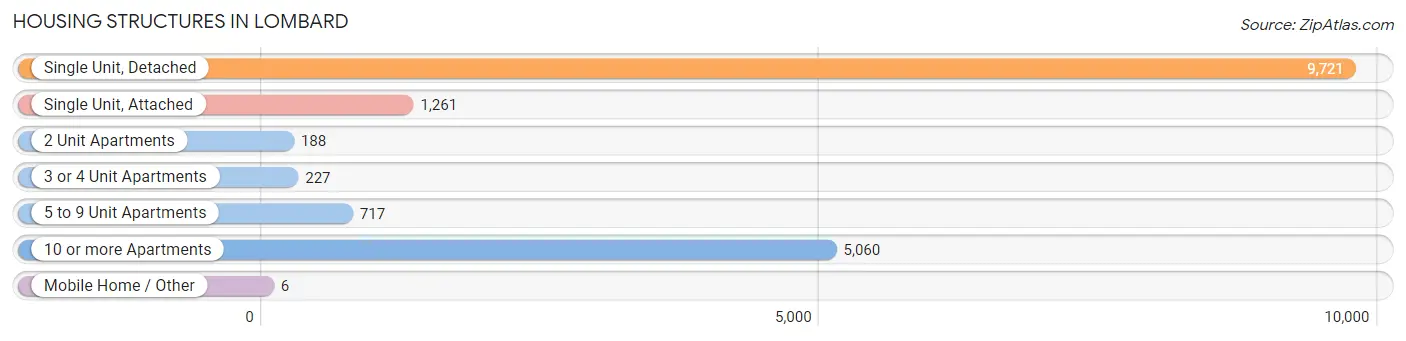
| Structure Type | # Housing Units | % Housing Units |
| Single Unit, Detached | 9,721 | 56.6% |
| Single Unit, Attached | 1,261 | 7.3% |
| 2 Unit Apartments | 188 | 1.1% |
| 3 or 4 Unit Apartments | 227 | 1.3% |
| 5 to 9 Unit Apartments | 717 | 4.2% |
| 10 or more Apartments | 5,060 | 29.4% |
| Mobile Home / Other | 6 | 0.0% |
| Total | 17,180 | 100.0% |
Housing Structures by Occupancy in Lombard
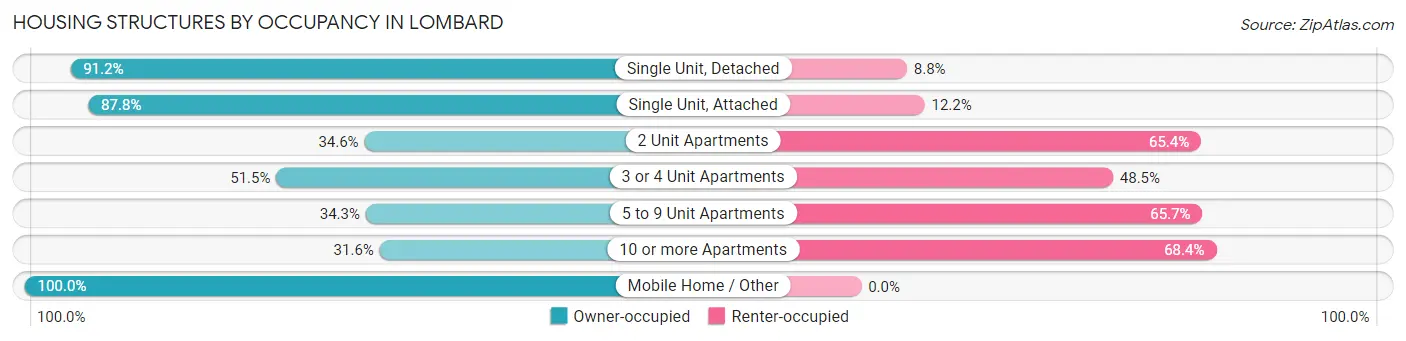
| Structure Type | Owner-occupied | Renter-occupied |
| Single Unit, Detached | 8,867 (91.2%) | 854 (8.8%) |
| Single Unit, Attached | 1,107 (87.8%) | 154 (12.2%) |
| 2 Unit Apartments | 65 (34.6%) | 123 (65.4%) |
| 3 or 4 Unit Apartments | 117 (51.5%) | 110 (48.5%) |
| 5 to 9 Unit Apartments | 246 (34.3%) | 471 (65.7%) |
| 10 or more Apartments | 1,601 (31.6%) | 3,459 (68.4%) |
| Mobile Home / Other | 6 (100.0%) | 0 (0.0%) |
| Total | 12,009 (69.9%) | 5,171 (30.1%) |
Housing Structures by Number of Rooms in Lombard
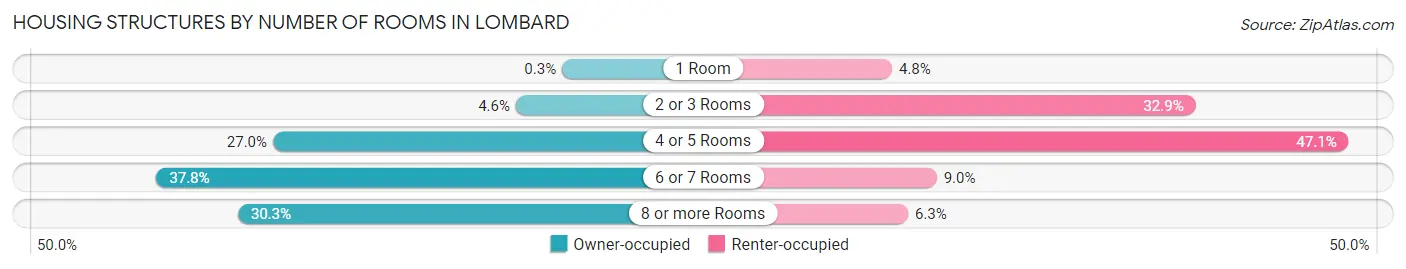
| Number of Rooms | Owner-occupied | Renter-occupied |
| 1 Room | 36 (0.3%) | 249 (4.8%) |
| 2 or 3 Rooms | 549 (4.6%) | 1,700 (32.9%) |
| 4 or 5 Rooms | 3,247 (27.0%) | 2,433 (47.0%) |
| 6 or 7 Rooms | 4,541 (37.8%) | 463 (8.9%) |
| 8 or more Rooms | 3,636 (30.3%) | 326 (6.3%) |
| Total | 12,009 (100.0%) | 5,171 (100.0%) |
Housing Structure by Heating Type in Lombard
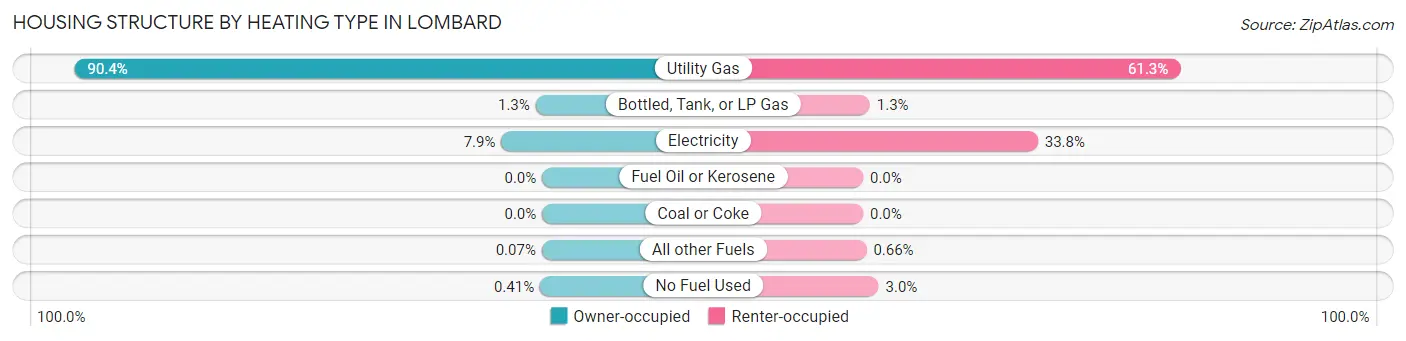
| Heating Type | Owner-occupied | Renter-occupied |
| Utility Gas | 10,853 (90.4%) | 3,168 (61.3%) |
| Bottled, Tank, or LP Gas | 150 (1.3%) | 68 (1.3%) |
| Electricity | 948 (7.9%) | 1,746 (33.8%) |
| Fuel Oil or Kerosene | 0 (0.0%) | 0 (0.0%) |
| Coal or Coke | 0 (0.0%) | 0 (0.0%) |
| All other Fuels | 9 (0.1%) | 34 (0.7%) |
| No Fuel Used | 49 (0.4%) | 155 (3.0%) |
| Total | 12,009 (100.0%) | 5,171 (100.0%) |
Household Vehicle Usage in Lombard
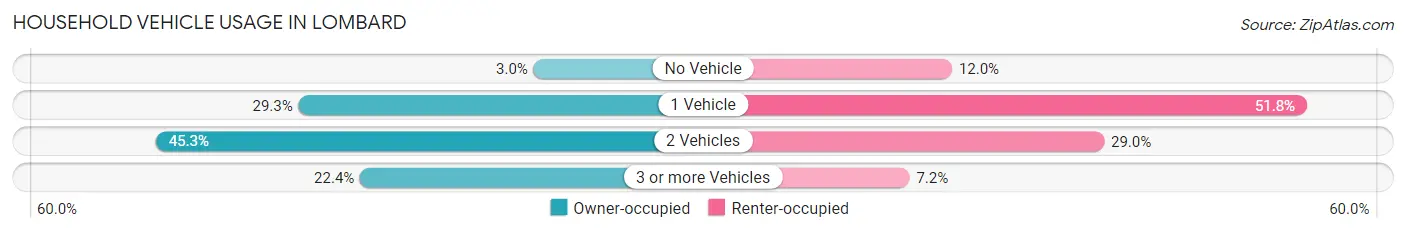
| Vehicles per Household | Owner-occupied | Renter-occupied |
| No Vehicle | 357 (3.0%) | 620 (12.0%) |
| 1 Vehicle | 3,520 (29.3%) | 2,676 (51.7%) |
| 2 Vehicles | 5,441 (45.3%) | 1,501 (29.0%) |
| 3 or more Vehicles | 2,691 (22.4%) | 374 (7.2%) |
| Total | 12,009 (100.0%) | 5,171 (100.0%) |
Real Estate & Mortgages in Lombard
Real Estate and Mortgage Overview in Lombard
| Characteristic | Without Mortgage | With Mortgage |
| Housing Units | 4,115 | 7,894 |
| Median Property Value | $290,200 | $319,900 |
| Median Household Income | $80,822 | $2,845 |
| Monthly Housing Costs | $919 | $1,264 |
| Real Estate Taxes | $6,413 | $62 |
Property Value by Mortgage Status in Lombard
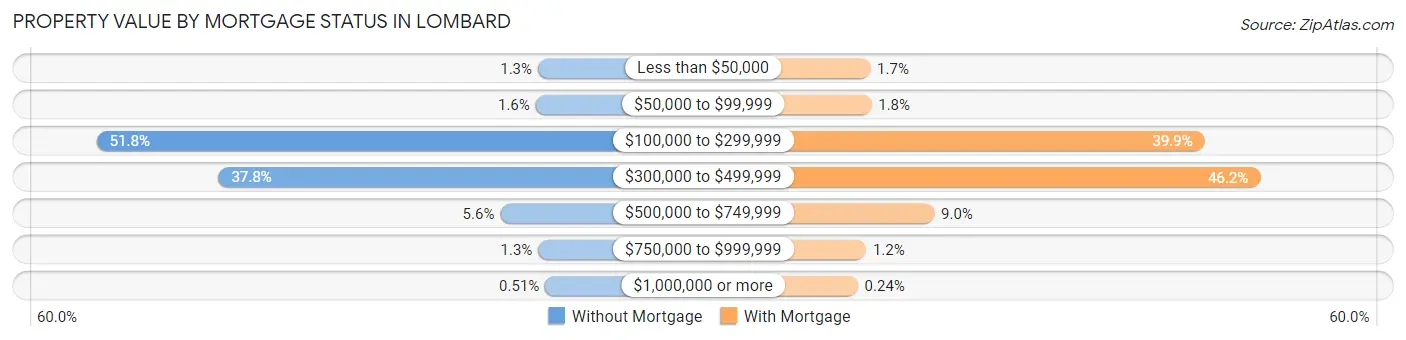
| Property Value | Without Mortgage | With Mortgage |
| Less than $50,000 | 55 (1.3%) | 132 (1.7%) |
| $50,000 to $99,999 | 66 (1.6%) | 142 (1.8%) |
| $100,000 to $299,999 | 2,130 (51.8%) | 3,148 (39.9%) |
| $300,000 to $499,999 | 1,557 (37.8%) | 3,650 (46.2%) |
| $500,000 to $749,999 | 232 (5.6%) | 709 (9.0%) |
| $750,000 to $999,999 | 54 (1.3%) | 94 (1.2%) |
| $1,000,000 or more | 21 (0.5%) | 19 (0.2%) |
| Total | 4,115 (100.0%) | 7,894 (100.0%) |
Household Income by Mortgage Status in Lombard
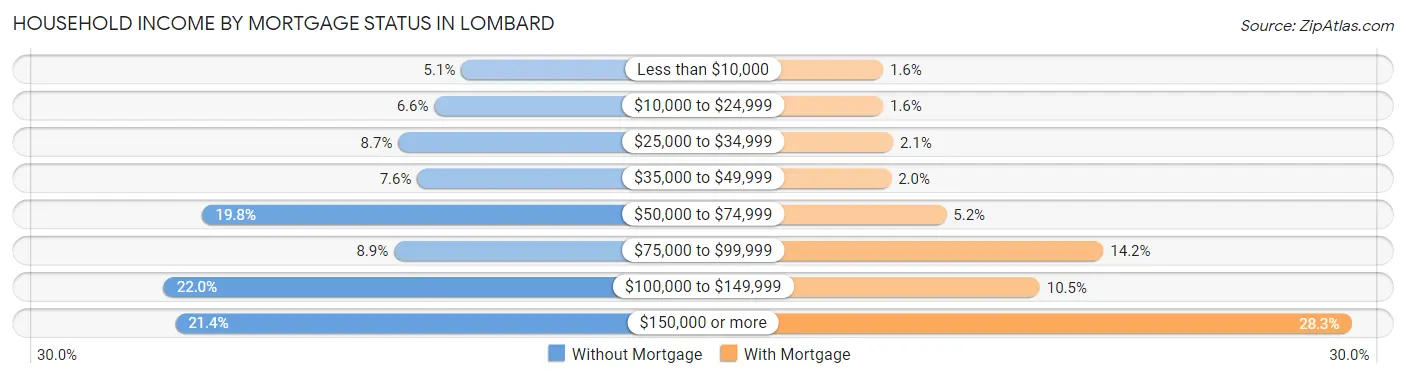
| Household Income | Without Mortgage | With Mortgage |
| Less than $10,000 | 208 (5.1%) | 124 (1.6%) |
| $10,000 to $24,999 | 271 (6.6%) | 124 (1.6%) |
| $25,000 to $34,999 | 356 (8.6%) | 169 (2.1%) |
| $35,000 to $49,999 | 311 (7.6%) | 161 (2.0%) |
| $50,000 to $74,999 | 816 (19.8%) | 410 (5.2%) |
| $75,000 to $99,999 | 366 (8.9%) | 1,118 (14.2%) |
| $100,000 to $149,999 | 907 (22.0%) | 831 (10.5%) |
| $150,000 or more | 880 (21.4%) | 2,236 (28.3%) |
| Total | 4,115 (100.0%) | 7,894 (100.0%) |
Property Value to Household Income Ratio in Lombard
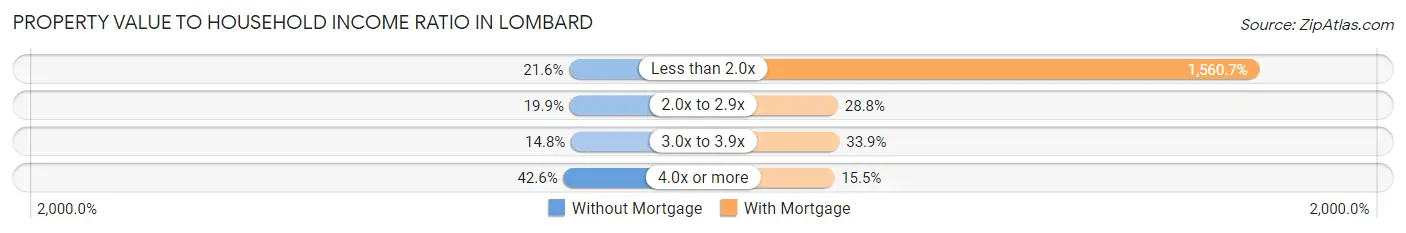
| Value-to-Income Ratio | Without Mortgage | With Mortgage |
| Less than 2.0x | 888 (21.6%) | 123,205 (1,560.7%) |
| 2.0x to 2.9x | 818 (19.9%) | 2,275 (28.8%) |
| 3.0x to 3.9x | 607 (14.7%) | 2,679 (33.9%) |
| 4.0x or more | 1,754 (42.6%) | 1,226 (15.5%) |
| Total | 4,115 (100.0%) | 7,894 (100.0%) |
Real Estate Taxes by Mortgage Status in Lombard
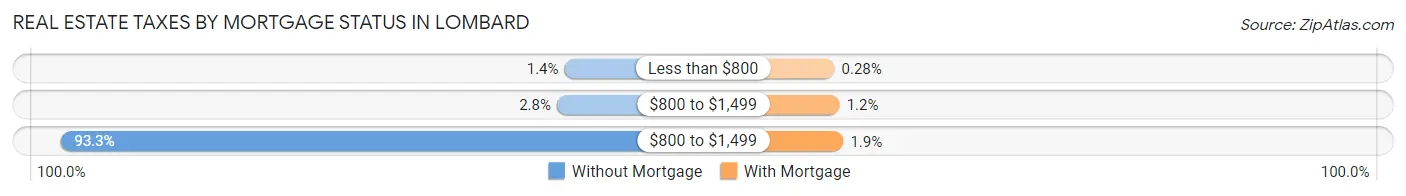
| Property Taxes | Without Mortgage | With Mortgage |
| Less than $800 | 58 (1.4%) | 22 (0.3%) |
| $800 to $1,499 | 115 (2.8%) | 96 (1.2%) |
| $800 to $1,499 | 3,839 (93.3%) | 150 (1.9%) |
| Total | 4,115 (100.0%) | 7,894 (100.0%) |
Health & Disability in Lombard
Health Insurance Coverage by Age in Lombard
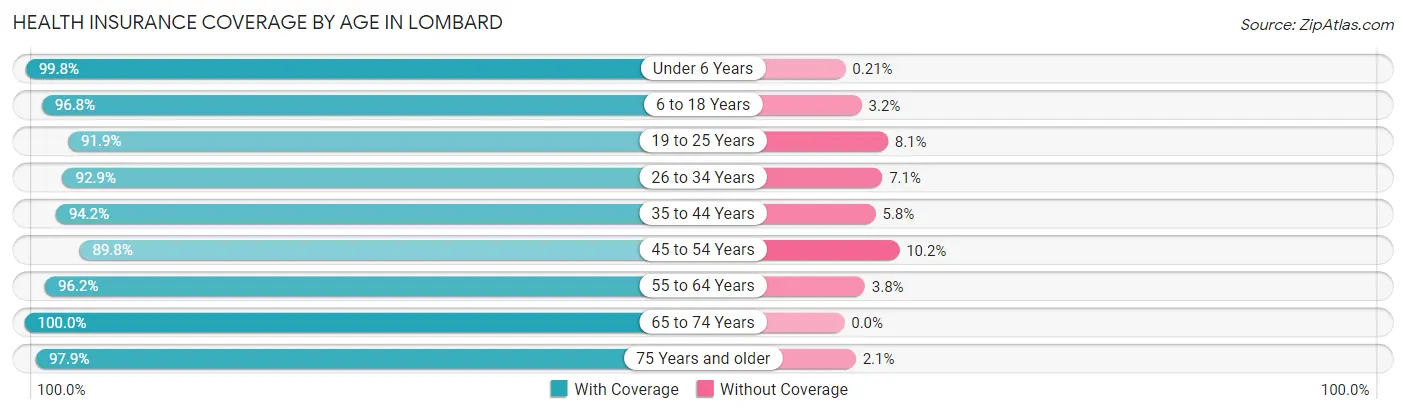
| Age Bracket | With Coverage | Without Coverage |
| Under 6 Years | 3,311 (99.8%) | 7 (0.2%) |
| 6 to 18 Years | 6,418 (96.8%) | 214 (3.2%) |
| 19 to 25 Years | 3,648 (91.9%) | 322 (8.1%) |
| 26 to 34 Years | 5,789 (92.9%) | 441 (7.1%) |
| 35 to 44 Years | 5,640 (94.2%) | 349 (5.8%) |
| 45 to 54 Years | 4,363 (89.8%) | 498 (10.2%) |
| 55 to 64 Years | 5,632 (96.2%) | 224 (3.8%) |
| 65 to 74 Years | 3,971 (100.0%) | 0 (0.0%) |
| 75 Years and older | 2,706 (97.9%) | 59 (2.1%) |
| Total | 41,478 (95.2%) | 2,114 (4.9%) |
Health Insurance Coverage by Citizenship Status in Lombard
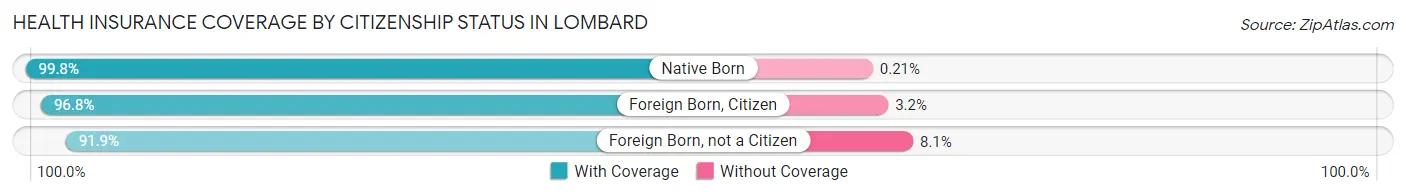
| Citizenship Status | With Coverage | Without Coverage |
| Native Born | 3,311 (99.8%) | 7 (0.2%) |
| Foreign Born, Citizen | 6,418 (96.8%) | 214 (3.2%) |
| Foreign Born, not a Citizen | 3,648 (91.9%) | 322 (8.1%) |
Health Insurance Coverage by Household Income in Lombard
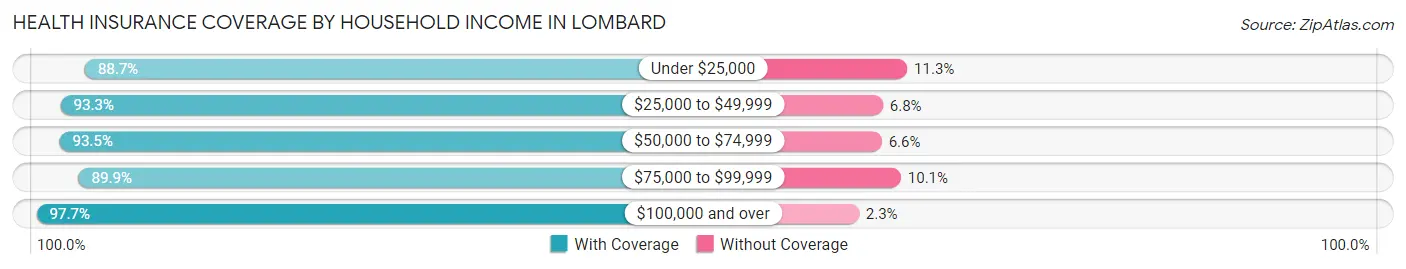
| Household Income | With Coverage | Without Coverage |
| Under $25,000 | 2,471 (88.7%) | 315 (11.3%) |
| $25,000 to $49,999 | 3,453 (93.2%) | 250 (6.8%) |
| $50,000 to $74,999 | 5,454 (93.4%) | 382 (6.6%) |
| $75,000 to $99,999 | 4,977 (89.9%) | 561 (10.1%) |
| $100,000 and over | 24,927 (97.7%) | 577 (2.3%) |
Public vs Private Health Insurance Coverage by Age in Lombard
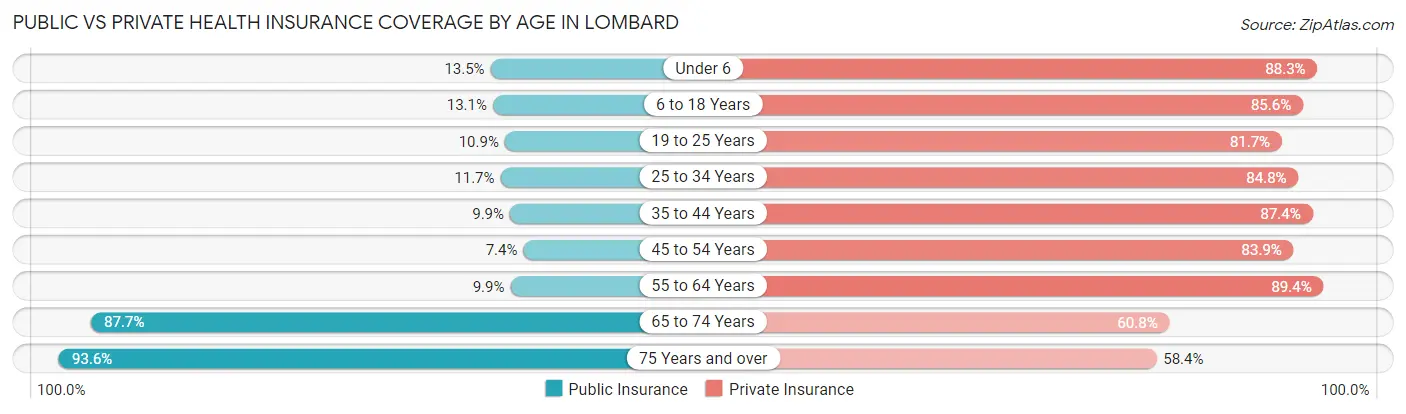
| Age Bracket | Public Insurance | Private Insurance |
| Under 6 | 449 (13.5%) | 2,929 (88.3%) |
| 6 to 18 Years | 869 (13.1%) | 5,677 (85.6%) |
| 19 to 25 Years | 432 (10.9%) | 3,243 (81.7%) |
| 25 to 34 Years | 728 (11.7%) | 5,280 (84.8%) |
| 35 to 44 Years | 595 (9.9%) | 5,233 (87.4%) |
| 45 to 54 Years | 361 (7.4%) | 4,077 (83.9%) |
| 55 to 64 Years | 577 (9.9%) | 5,235 (89.4%) |
| 65 to 74 Years | 3,481 (87.7%) | 2,415 (60.8%) |
| 75 Years and over | 2,589 (93.6%) | 1,614 (58.4%) |
| Total | 10,081 (23.1%) | 35,703 (81.9%) |
Disability Status by Sex by Age in Lombard
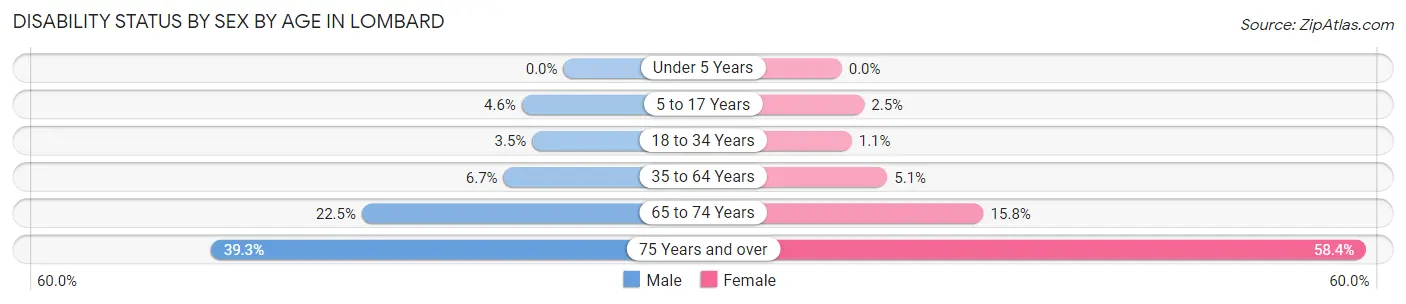
| Age Bracket | Male | Female |
| Under 5 Years | 0 (0.0%) | 0 (0.0%) |
| 5 to 17 Years | 155 (4.6%) | 78 (2.5%) |
| 18 to 34 Years | 183 (3.5%) | 64 (1.1%) |
| 35 to 64 Years | 568 (6.7%) | 415 (5.1%) |
| 65 to 74 Years | 414 (22.5%) | 336 (15.8%) |
| 75 Years and over | 411 (39.3%) | 1,003 (58.4%) |
Disability Class by Sex by Age in Lombard
Disability Class: Hearing Difficulty
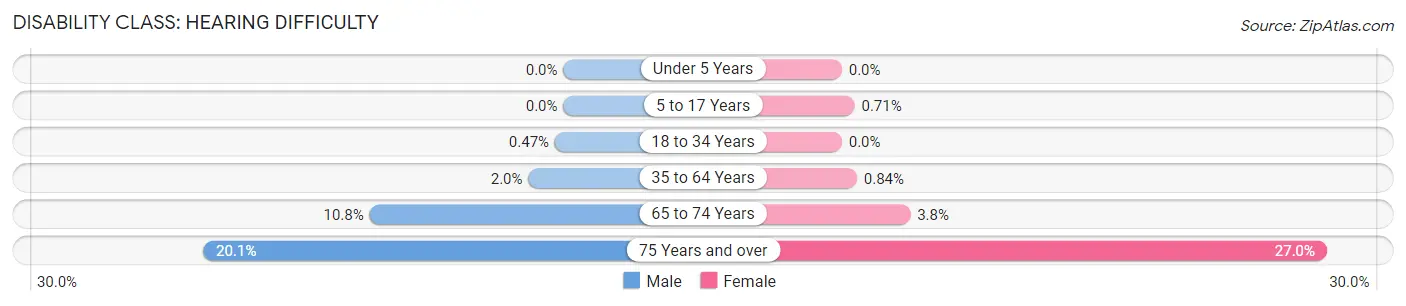
| Age Bracket | Male | Female |
| Under 5 Years | 0 (0.0%) | 0 (0.0%) |
| 5 to 17 Years | 0 (0.0%) | 22 (0.7%) |
| 18 to 34 Years | 25 (0.5%) | 0 (0.0%) |
| 35 to 64 Years | 166 (1.9%) | 69 (0.8%) |
| 65 to 74 Years | 199 (10.8%) | 81 (3.8%) |
| 75 Years and over | 210 (20.1%) | 464 (27.0%) |
Disability Class: Vision Difficulty
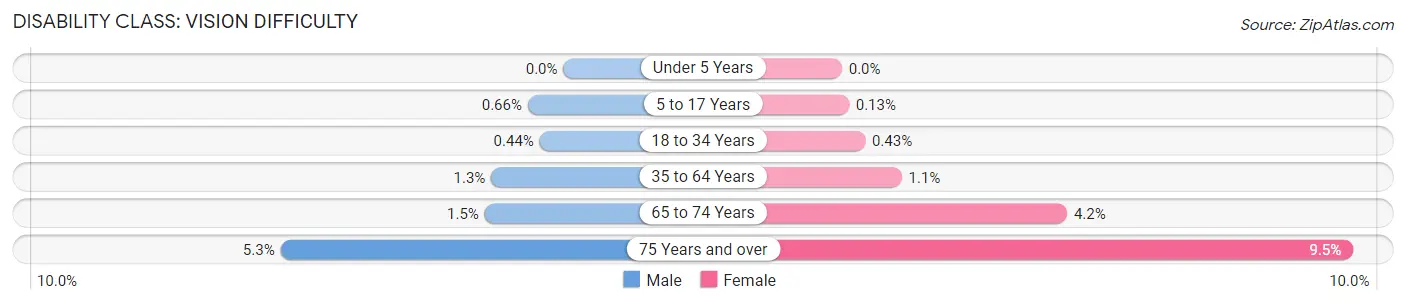
| Age Bracket | Male | Female |
| Under 5 Years | 0 (0.0%) | 0 (0.0%) |
| 5 to 17 Years | 22 (0.7%) | 4 (0.1%) |
| 18 to 34 Years | 23 (0.4%) | 25 (0.4%) |
| 35 to 64 Years | 114 (1.3%) | 91 (1.1%) |
| 65 to 74 Years | 27 (1.5%) | 89 (4.2%) |
| 75 Years and over | 55 (5.2%) | 163 (9.5%) |
Disability Class: Cognitive Difficulty
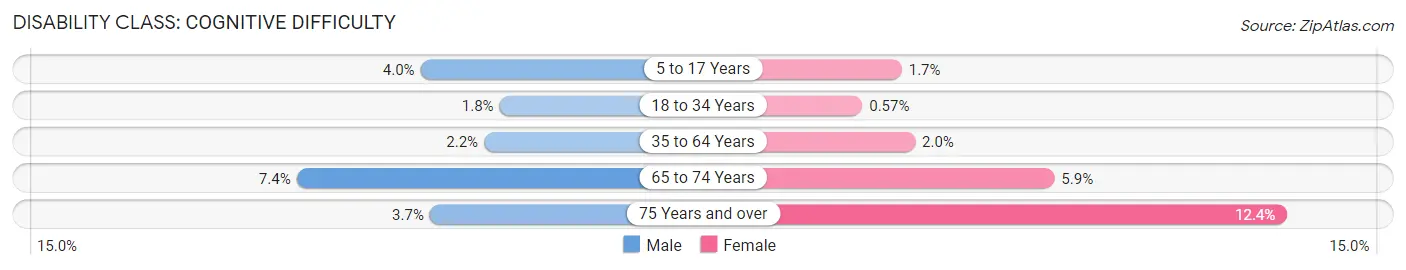
| Age Bracket | Male | Female |
| 5 to 17 Years | 133 (4.0%) | 52 (1.7%) |
| 18 to 34 Years | 94 (1.8%) | 33 (0.6%) |
| 35 to 64 Years | 188 (2.2%) | 167 (2.0%) |
| 65 to 74 Years | 137 (7.4%) | 126 (5.9%) |
| 75 Years and over | 39 (3.7%) | 213 (12.4%) |
Disability Class: Ambulatory Difficulty
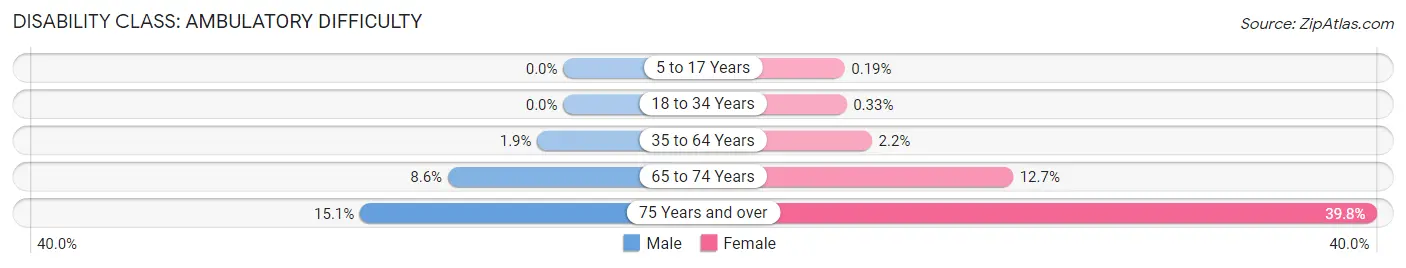
| Age Bracket | Male | Female |
| 5 to 17 Years | 0 (0.0%) | 6 (0.2%) |
| 18 to 34 Years | 0 (0.0%) | 19 (0.3%) |
| 35 to 64 Years | 164 (1.9%) | 181 (2.2%) |
| 65 to 74 Years | 158 (8.6%) | 270 (12.7%) |
| 75 Years and over | 158 (15.1%) | 683 (39.8%) |
Disability Class: Self-Care Difficulty
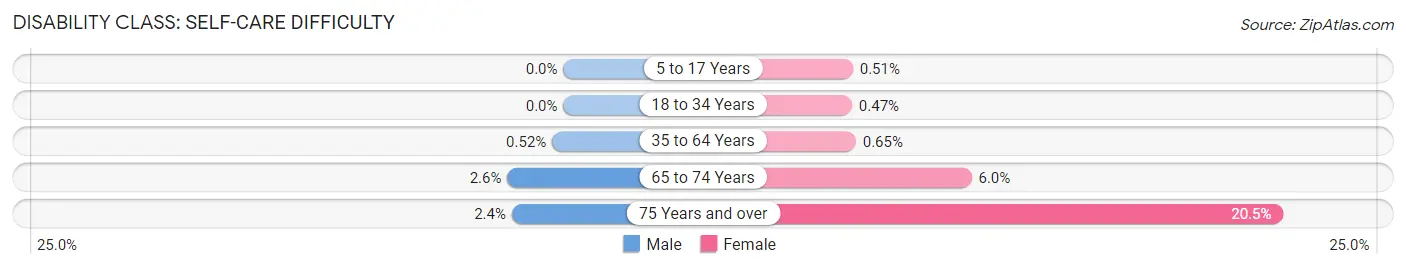
| Age Bracket | Male | Female |
| 5 to 17 Years | 0 (0.0%) | 16 (0.5%) |
| 18 to 34 Years | 0 (0.0%) | 27 (0.5%) |
| 35 to 64 Years | 44 (0.5%) | 53 (0.6%) |
| 65 to 74 Years | 48 (2.6%) | 128 (6.0%) |
| 75 Years and over | 25 (2.4%) | 352 (20.5%) |
Technology Access in Lombard
Computing Device Access in Lombard
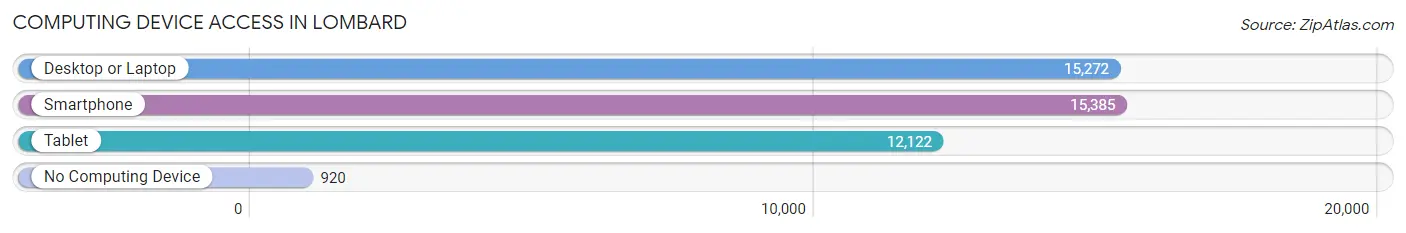
| Device Type | # Households | % Households |
| Desktop or Laptop | 15,272 | 88.9% |
| Smartphone | 15,385 | 89.5% |
| Tablet | 12,122 | 70.6% |
| No Computing Device | 920 | 5.4% |
| Total | 17,180 | 100.0% |
Internet Access in Lombard
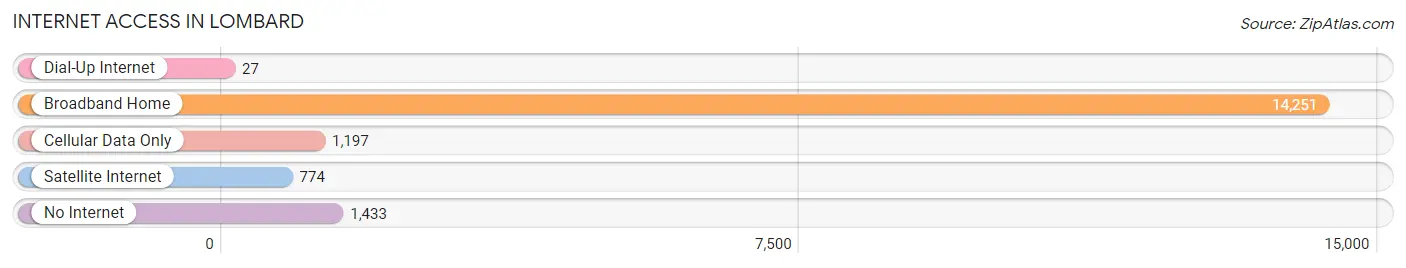
| Internet Type | # Households | % Households |
| Dial-Up Internet | 27 | 0.2% |
| Broadband Home | 14,251 | 83.0% |
| Cellular Data Only | 1,197 | 7.0% |
| Satellite Internet | 774 | 4.5% |
| No Internet | 1,433 | 8.3% |
| Total | 17,180 | 100.0% |
Lombard Summary
Lombard, Illinois is a village located in DuPage County, approximately 22 miles west of downtown Chicago. It is a suburb of Chicago and is part of the Chicago metropolitan area. The village has a population of 44,000 and is known for its vibrant downtown area, which is home to a variety of shops, restaurants, and entertainment venues.
History
Lombard was first settled in the 1830s by European immigrants, primarily from Germany. The village was originally known as Babcock’s Grove, after the first settler, John Babcock. In 1869, the village was renamed Lombard after the Italian city of the same name. The village was officially incorporated in 1869 and was the first village in DuPage County.
In the late 19th century, Lombard was a popular destination for wealthy Chicagoans looking to escape the city. The village was known for its large estates and beautiful gardens. In the early 20th century, the village began to grow rapidly as more people moved to the area. The village was also home to a number of factories, including the International Harvester plant, which was the largest employer in the village for many years.
Geography
Lombard is located in DuPage County, approximately 22 miles west of downtown Chicago. The village is bordered by Elmhurst to the north, Villa Park to the east, Oak Brook to the south, and Glen Ellyn to the west. The village is situated on the Des Plaines River and is part of the Chicago metropolitan area.
The village has a total area of 8.3 square miles, of which 8.2 square miles is land and 0.1 square miles is water. The village is located in a flat, low-lying area and is surrounded by several small lakes and ponds.
Economy
Lombard’s economy is largely based on retail and services. The village is home to a variety of shops, restaurants, and entertainment venues. The village is also home to a number of corporate headquarters, including the headquarters of the American National Bank and Trust Company.
The village is also home to a number of manufacturing companies, including the International Harvester plant, which was the largest employer in the village for many years. The village is also home to a number of technology companies, including the software company, Oracle.
Demographics
As of the 2010 census, the village had a population of 44,000. The racial makeup of the village was 79.2% White, 8.2% African American, 0.3% Native American, 6.2% Asian, and 4.3% from other races. Hispanic or Latino of any race were 11.3% of the population.
The median income for a household in the village was $63,945, and the median income for a family was $76,945. The per capita income for the village was $31,945. About 4.3% of families and 6.2% of the population were below the poverty line, including 8.2% of those under age 18 and 4.3% of those age 65 or over.
Lombard is a vibrant village with a rich history and a diverse population. The village is home to a variety of shops, restaurants, and entertainment venues, as well as a number of corporate headquarters and manufacturing companies. The village has a strong economy and is a popular destination for those looking to escape the hustle and bustle of the city.
Common Questions
What is Per Capita Income in Lombard?
Per Capita income in Lombard is $47,178.
What is the Median Family Income in Lombard?
Median Family Income in Lombard is $117,165.
What is the Median Household income in Lombard?
Median Household Income in Lombard is $95,509.
What is Income or Wage Gap in Lombard?
Income or Wage Gap in Lombard is 24.6%.
Women in Lombard earn 75.4 cents for every dollar earned by a man.
What is Family Income Deficit in Lombard?
Family Income Deficit in Lombard is $13,797.
Families that are below poverty line in Lombard earn $13,797 less on average than the poverty threshold level.
What is Inequality or Gini Index in Lombard?
Inequality or Gini Index in Lombard is 0.41.
What is the Total Population of Lombard?
Total Population of Lombard is 44,055.
What is the Total Male Population of Lombard?
Total Male Population of Lombard is 21,440.
What is the Total Female Population of Lombard?
Total Female Population of Lombard is 22,615.
What is the Ratio of Males per 100 Females in Lombard?
There are 94.80 Males per 100 Females in Lombard.
What is the Ratio of Females per 100 Males in Lombard?
There are 105.48 Females per 100 Males in Lombard.
What is the Median Population Age in Lombard?
Median Population Age in Lombard is 37.7 Years.
What is the Average Family Size in Lombard
Average Family Size in Lombard is 3.2 People.
What is the Average Household Size in Lombard
Average Household Size in Lombard is 2.5 People.
How Large is the Labor Force in Lombard?
There are 25,438 People in the Labor Forcein in Lombard.
What is the Percentage of People in the Labor Force in Lombard?
70.9% of People are in the Labor Force in Lombard.
What is the Unemployment Rate in Lombard?
Unemployment Rate in Lombard is 4.4%.