Cities with the Highest Percentage of Immigrants from Vietnam in Illinois
RELATED REPORTS & OPTIONS
Vietnam
Illinois
Compare Cities
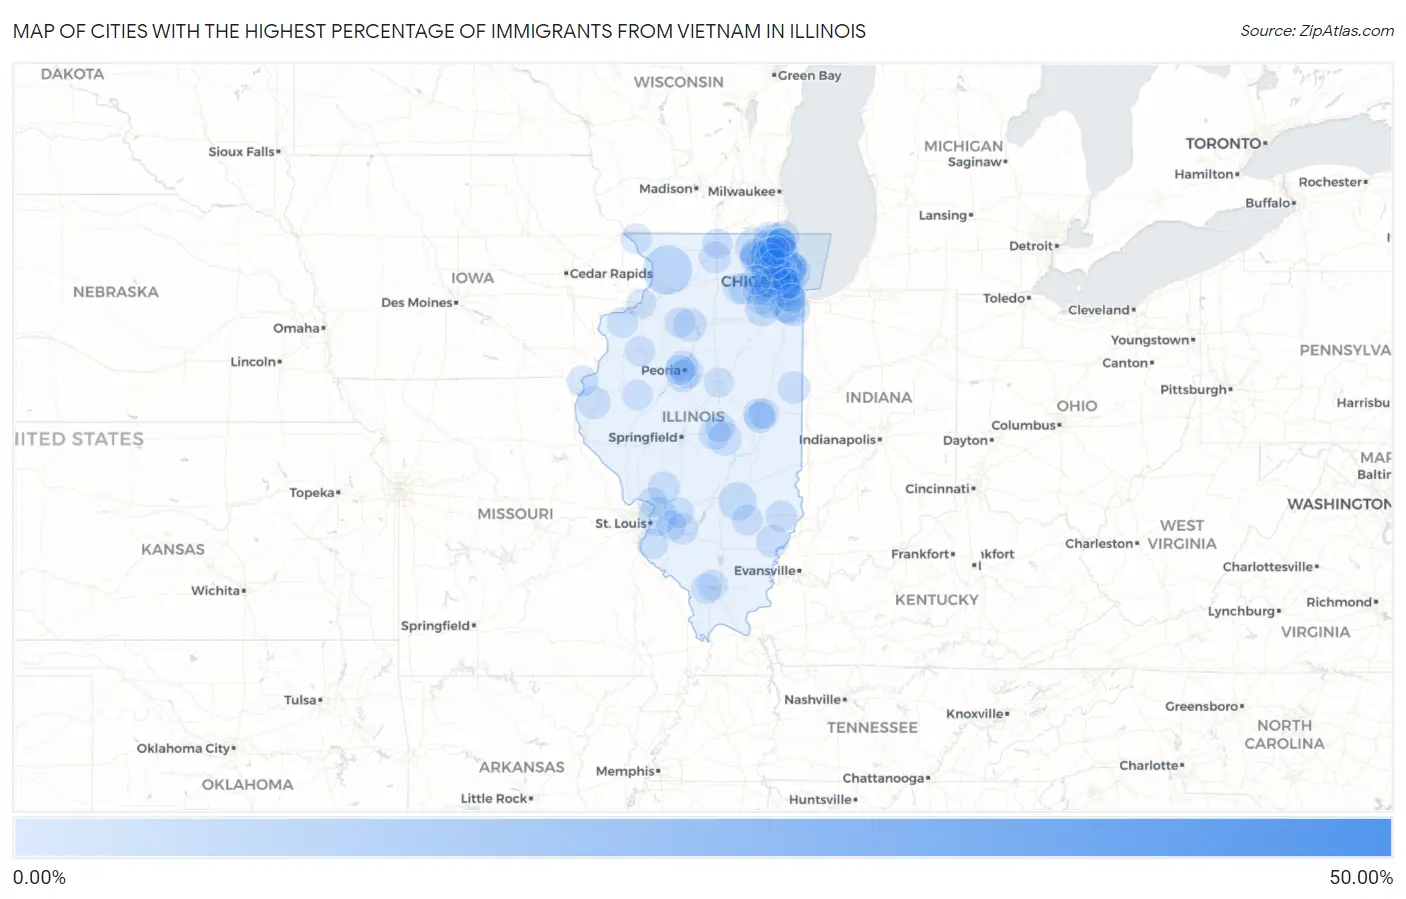
Map of Cities with the Highest Percentage of Immigrants from Vietnam in Illinois
0.00%
50.00%
Cities with the Highest Percentage of Immigrants from Vietnam in Illinois
| City | Vietnam | vs State | vs National | |
| 1. | Eagle Lake | 43.10% | 0.17%(+42.9)#-1 | 0.41%(+42.7)#0 |
| 2. | Arbury Hills | 6.76% | 0.17%(+6.59)#0 | 0.41%(+6.35)#1 |
| 3. | Chadwick | 4.17% | 0.17%(+3.99)#1 | 0.41%(+3.76)#2 |
| 4. | Lincolnwood | 2.53% | 0.17%(+2.36)#9 | 0.41%(+2.12)#436 |
| 5. | Harwood Heights | 2.21% | 0.17%(+2.04)#10 | 0.41%(+1.81)#437 |
| 6. | Morton Grove | 2.02% | 0.17%(+1.85)#11 | 0.41%(+1.62)#438 |
| 7. | Pontoon Beach | 2.00% | 0.17%(+1.83)#12 | 0.41%(+1.60)#439 |
| 8. | Carol Stream | 1.99% | 0.17%(+1.82)#65 | 0.41%(+1.58)#1,975 |
| 9. | Glendale Heights | 1.91% | 0.17%(+1.73)#66 | 0.41%(+1.50)#1,980 |
| 10. | Edgewood | 1.86% | 0.17%(+1.69)#67 | 0.41%(+1.46)#1,981 |
| 11. | Bull Valley | 1.60% | 0.17%(+1.43)#68 | 0.41%(+1.19)#1,982 |
| 12. | Olympia Fields | 1.36% | 0.17%(+1.19)#69 | 0.41%(+0.954)#1,983 |
| 13. | Grandwood Park | 1.35% | 0.17%(+1.18)#70 | 0.41%(+0.946)#1,984 |
| 14. | Mccook | 1.34% | 0.17%(+1.16)#71 | 0.41%(+0.930)#1,985 |
| 15. | Shorewood | 1.24% | 0.17%(+1.06)#72 | 0.41%(+0.829)#1,986 |
| 16. | Barrington Hills | 1.13% | 0.17%(+0.957)#73 | 0.41%(+0.723)#1,987 |
| 17. | Lake Villa | 1.00% | 0.17%(+0.825)#74 | 0.41%(+0.592)#1,988 |
| 18. | Tiskilwa | 0.94% | 0.17%(+0.764)#75 | 0.41%(+0.531)#1,989 |
| 19. | Mount Zion | 0.91% | 0.17%(+0.737)#76 | 0.41%(+0.504)#1,990 |
| 20. | Skokie | 0.84% | 0.17%(+0.669)#77 | 0.41%(+0.436)#1,991 |
| 21. | West Point | 0.84% | 0.17%(+0.662)#78 | 0.41%(+0.429)#1,992 |
| 22. | Niles | 0.82% | 0.17%(+0.641)#79 | 0.41%(+0.408)#1,993 |
| 23. | North Barrington | 0.80% | 0.17%(+0.627)#80 | 0.41%(+0.394)#1,994 |
| 24. | Round Lake | 0.75% | 0.17%(+0.575)#81 | 0.41%(+0.342)#1,995 |
| 25. | Albion | 0.75% | 0.17%(+0.575)#82 | 0.41%(+0.341)#1,996 |
| 26. | Northlake | 0.73% | 0.17%(+0.559)#83 | 0.41%(+0.326)#1,997 |
| 27. | Royal Lakes | 0.73% | 0.17%(+0.558)#84 | 0.41%(+0.325)#1,998 |
| 28. | Burbank | 0.72% | 0.17%(+0.547)#88 | 0.41%(+0.313)#2,384 |
| 29. | Hoopeston | 0.71% | 0.17%(+0.534)#89 | 0.41%(+0.301)#2,385 |
| 30. | Broadview | 0.68% | 0.17%(+0.504)#90 | 0.41%(+0.271)#2,386 |
| 31. | Harristown | 0.67% | 0.17%(+0.495)#91 | 0.41%(+0.262)#2,387 |
| 32. | North Pekin | 0.62% | 0.17%(+0.442)#92 | 0.41%(+0.209)#2,388 |
| 33. | Indian Creek | 0.60% | 0.17%(+0.428)#93 | 0.41%(+0.195)#2,389 |
| 34. | Algonquin | 0.57% | 0.17%(+0.398)#94 | 0.41%(+0.164)#2,390 |
| 35. | New Milford | 0.55% | 0.17%(+0.376)#95 | 0.41%(+0.143)#2,391 |
| 36. | East Peoria | 0.55% | 0.17%(+0.375)#97 | 0.41%(+0.142)#2,714 |
| 37. | Mount Prospect | 0.52% | 0.17%(+0.347)#98 | 0.41%(+0.114)#2,715 |
| 38. | South Barrington | 0.50% | 0.17%(+0.325)#99 | 0.41%(+0.092)#2,716 |
| 39. | Peoria | 0.50% | 0.17%(+0.323)#100 | 0.41%(+0.090)#2,717 |
| 40. | Big Rock | 0.49% | 0.17%(+0.317)#101 | 0.41%(+0.084)#2,718 |
| 41. | Matteson | 0.49% | 0.17%(+0.312)#102 | 0.41%(+0.079)#2,719 |
| 42. | Albers | 0.48% | 0.17%(+0.309)#103 | 0.41%(+0.076)#2,720 |
| 43. | Nauvoo | 0.46% | 0.17%(+0.290)#104 | 0.41%(+0.057)#2,721 |
| 44. | Sumner | 0.46% | 0.17%(+0.282)#105 | 0.41%(+0.049)#2,722 |
| 45. | Champaign | 0.45% | 0.17%(+0.278)#106 | 0.41%(+0.045)#2,723 |
| 46. | Zion | 0.45% | 0.17%(+0.277)#107 | 0.41%(+0.044)#2,724 |
| 47. | Lake Barrington | 0.45% | 0.17%(+0.272)#108 | 0.41%(+0.039)#2,725 |
| 48. | Des Plaines | 0.44% | 0.17%(+0.268)#109 | 0.41%(+0.035)#2,726 |
| 49. | Savoy | 0.44% | 0.17%(+0.263)#110 | 0.41%(+0.030)#2,727 |
| 50. | Warrenville | 0.41% | 0.17%(+0.234)#111 | 0.41%(+0.001)#2,728 |
| 51. | Flora | 0.40% | 0.17%(+0.230)#112 | 0.41%(-0.003)#2,729 |
| 52. | Gurnee | 0.39% | 0.17%(+0.217)#113 | 0.41%(-0.016)#2,730 |
| 53. | Lake In The Hills | 0.38% | 0.17%(+0.205)#114 | 0.41%(-0.028)#2,731 |
| 54. | Buda | 0.38% | 0.17%(+0.204)#115 | 0.41%(-0.030)#2,732 |
| 55. | Frankfort Square | 0.37% | 0.17%(+0.199)#116 | 0.41%(-0.034)#2,733 |
| 56. | Green Oaks | 0.37% | 0.17%(+0.192)#117 | 0.41%(-0.041)#2,734 |
| 57. | Grayslake | 0.36% | 0.17%(+0.186)#118 | 0.41%(-0.047)#2,735 |
| 58. | Carterville | 0.36% | 0.17%(+0.185)#119 | 0.41%(-0.048)#2,736 |
| 59. | Highland | 0.34% | 0.17%(+0.168)#120 | 0.41%(-0.065)#2,737 |
| 60. | Knollwood | 0.34% | 0.17%(+0.166)#121 | 0.41%(-0.067)#2,738 |
| 61. | Reynolds | 0.34% | 0.17%(+0.161)#122 | 0.41%(-0.072)#2,739 |
| 62. | Galena | 0.33% | 0.17%(+0.160)#123 | 0.41%(-0.073)#2,740 |
| 63. | Table Grove | 0.33% | 0.17%(+0.155)#124 | 0.41%(-0.078)#2,741 |
| 64. | Galesburg | 0.33% | 0.17%(+0.153)#125 | 0.41%(-0.080)#2,882 |
| 65. | Bensenville | 0.33% | 0.17%(+0.152)#126 | 0.41%(-0.081)#2,883 |
| 66. | Hinckley | 0.32% | 0.17%(+0.150)#127 | 0.41%(-0.083)#2,884 |
| 67. | Waterloo | 0.32% | 0.17%(+0.143)#128 | 0.41%(-0.090)#2,885 |
| 68. | Evanston | 0.32% | 0.17%(+0.143)#129 | 0.41%(-0.090)#2,886 |
| 69. | Alsip | 0.31% | 0.17%(+0.138)#130 | 0.41%(-0.095)#2,887 |
| 70. | Lake Forest | 0.31% | 0.17%(+0.134)#131 | 0.41%(-0.099)#2,888 |
| 71. | Carbondale | 0.31% | 0.17%(+0.134)#132 | 0.41%(-0.099)#2,889 |
| 72. | Chicago | 0.31% | 0.17%(+0.131)#133 | 0.41%(-0.102)#2,890 |
| 73. | Crystal Lake | 0.30% | 0.17%(+0.122)#134 | 0.41%(-0.111)#2,891 |
| 74. | Hanover Park | 0.29% | 0.17%(+0.118)#135 | 0.41%(-0.115)#2,892 |
| 75. | Lyons | 0.29% | 0.17%(+0.116)#136 | 0.41%(-0.118)#2,893 |
| 76. | Park City | 0.29% | 0.17%(+0.111)#137 | 0.41%(-0.122)#2,894 |
| 77. | Plainfield | 0.28% | 0.17%(+0.108)#138 | 0.41%(-0.125)#2,895 |
| 78. | Wheaton | 0.27% | 0.17%(+0.096)#139 | 0.41%(-0.137)#2,896 |
| 79. | Schiller Park | 0.27% | 0.17%(+0.093)#140 | 0.41%(-0.140)#2,897 |
| 80. | Rolling Meadows | 0.27% | 0.17%(+0.092)#141 | 0.41%(-0.142)#2,898 |
| 81. | Alton | 0.26% | 0.17%(+0.087)#142 | 0.41%(-0.146)#2,950 |
| 82. | Bellevue | 0.26% | 0.17%(+0.086)#143 | 0.41%(-0.147)#2,951 |
| 83. | Urbana | 0.25% | 0.17%(+0.076)#144 | 0.41%(-0.157)#2,952 |
| 84. | Berwyn | 0.25% | 0.17%(+0.075)#145 | 0.41%(-0.158)#2,953 |
| 85. | Deer Park | 0.24% | 0.17%(+0.069)#146 | 0.41%(-0.164)#2,954 |
| 86. | Naperville | 0.24% | 0.17%(+0.068)#147 | 0.41%(-0.165)#2,955 |
| 87. | Aurora | 0.24% | 0.17%(+0.067)#148 | 0.41%(-0.166)#2,956 |
| 88. | Villa Park | 0.24% | 0.17%(+0.063)#149 | 0.41%(-0.170)#2,957 |
| 89. | Arlington Heights | 0.23% | 0.17%(+0.059)#150 | 0.41%(-0.175)#2,958 |
| 90. | Crest Hill | 0.23% | 0.17%(+0.057)#151 | 0.41%(-0.176)#2,959 |
| 91. | Hawthorn Woods | 0.23% | 0.17%(+0.056)#152 | 0.41%(-0.177)#2,960 |
| 92. | Robbins | 0.23% | 0.17%(+0.054)#153 | 0.41%(-0.179)#2,961 |
| 93. | Machesney Park | 0.23% | 0.17%(+0.053)#154 | 0.41%(-0.180)#2,962 |
| 94. | Waukegan | 0.22% | 0.17%(+0.047)#155 | 0.41%(-0.186)#2,963 |
| 95. | Lebanon | 0.21% | 0.17%(+0.039)#156 | 0.41%(-0.194)#2,964 |
| 96. | Mundelein | 0.21% | 0.17%(+0.038)#157 | 0.41%(-0.196)#2,965 |
| 97. | Normal | 0.21% | 0.17%(+0.035)#158 | 0.41%(-0.198)#2,966 |
| 98. | Forsyth | 0.21% | 0.17%(+0.033)#159 | 0.41%(-0.200)#2,967 |
| 99. | Geneva | 0.21% | 0.17%(+0.031)#160 | 0.41%(-0.202)#2,968 |
| 100. | Rapids City | 0.20% | 0.17%(+0.029)#161 | 0.41%(-0.204)#2,969 |
Common Questions
What are the Top 10 Cities with the Highest Percentage of Immigrants from Vietnam in Illinois?
Top 10 Cities with the Highest Percentage of Immigrants from Vietnam in Illinois are:
#1
4.17%
#2
2.53%
#3
2.21%
#4
2.02%
#5
2.00%
#6
1.99%
#7
1.91%
#8
1.86%
#9
1.60%
#10
1.36%
What city has the Highest Percentage of Immigrants from Vietnam in Illinois?
Chadwick has the Highest Percentage of Immigrants from Vietnam in Illinois with 4.17%.
What is the Percentage of Immigrants from Vietnam in the State of Illinois?
Percentage of Immigrants from Vietnam in Illinois is 0.17%.
What is the Percentage of Immigrants from Vietnam in the United States?
Percentage of Immigrants from Vietnam in the United States is 0.41%.