Cities with the Highest Percentage of Population Employed in Legal Services & Support in Illinois
RELATED REPORTS & OPTIONS
Legal Services & Support
Illinois
Compare Cities
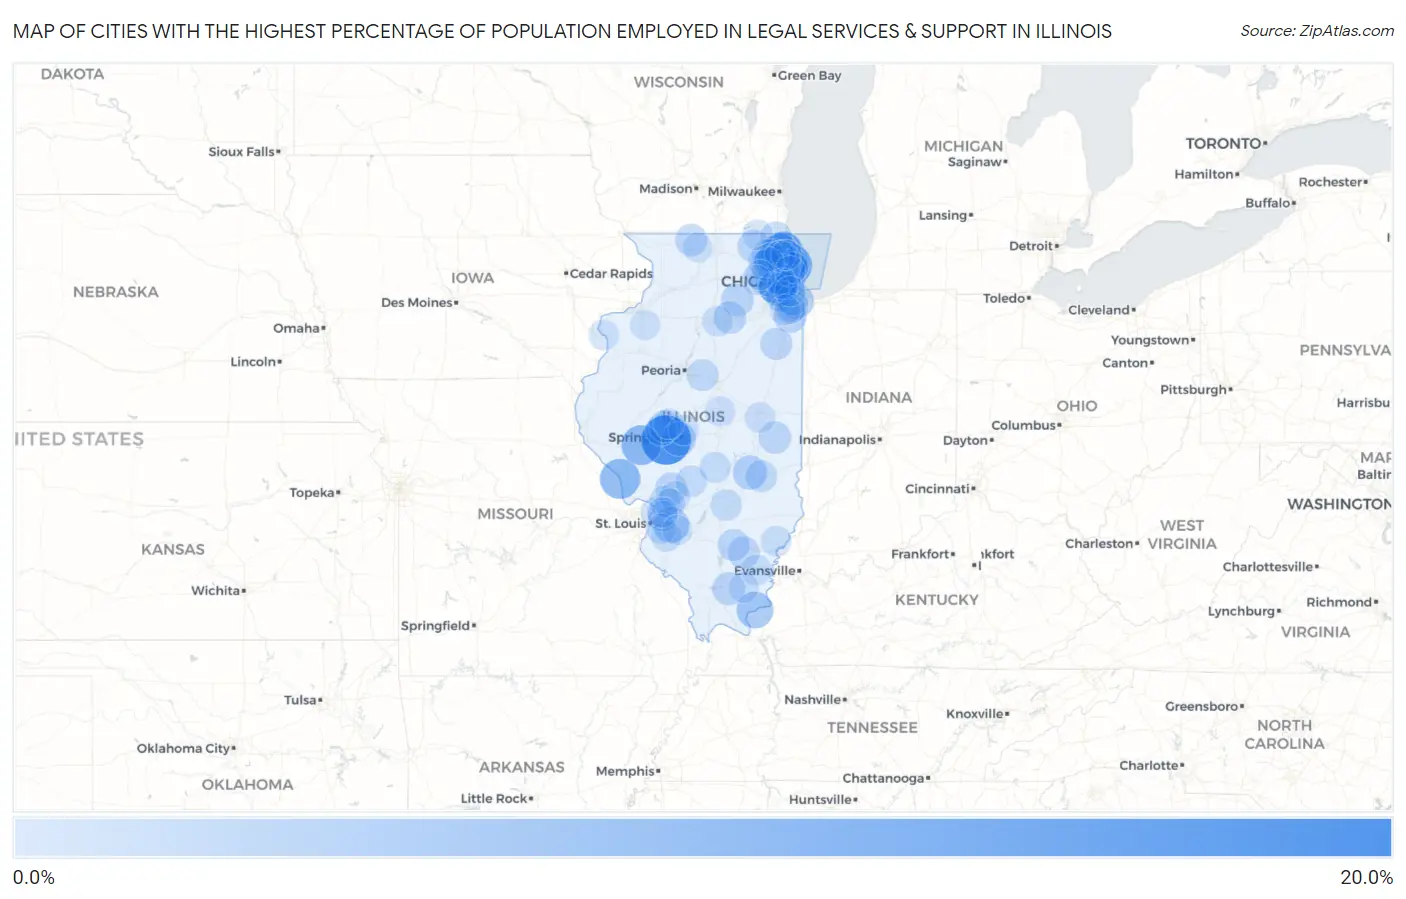
Map of Cities with the Highest Percentage of Population Employed in Legal Services & Support in Illinois
0.0%
20.0%
Cities with the Highest Percentage of Population Employed in Legal Services & Support in Illinois
| City | % Employed | vs State | vs National | |
| 1. | Berlin | 18.2% | 1.3%(+16.8)#1 | 1.2%(+17.0)#75 |
| 2. | Golf | 13.3% | 1.3%(+11.9)#2 | 1.2%(+12.1)#136 |
| 3. | Kenilworth | 11.8% | 1.3%(+10.5)#3 | 1.2%(+10.6)#162 |
| 4. | River Forest | 11.2% | 1.3%(+9.82)#4 | 1.2%(+9.98)#177 |
| 5. | Lake Forest | 10.4% | 1.3%(+9.09)#5 | 1.2%(+9.25)#203 |
| 6. | Hamburg | 10.3% | 1.3%(+9.00)#6 | 1.2%(+9.16)#207 |
| 7. | Winnetka | 10.0% | 1.3%(+8.69)#7 | 1.2%(+8.86)#218 |
| 8. | Lynnville | 10.0% | 1.3%(+8.65)#8 | 1.2%(+8.82)#222 |
| 9. | Glencoe | 8.6% | 1.3%(+7.24)#9 | 1.2%(+7.40)#298 |
| 10. | Clarendon Hills | 8.5% | 1.3%(+7.16)#10 | 1.2%(+7.32)#305 |
| 11. | Hinsdale | 8.3% | 1.3%(+6.97)#11 | 1.2%(+7.13)#320 |
| 12. | Northfield | 8.1% | 1.3%(+6.74)#12 | 1.2%(+6.91)#337 |
| 13. | Rosiclare | 7.6% | 1.3%(+6.21)#13 | 1.2%(+6.38)#370 |
| 14. | Mettawa | 7.4% | 1.3%(+6.02)#14 | 1.2%(+6.18)#395 |
| 15. | Wilmette | 7.3% | 1.3%(+5.98)#15 | 1.2%(+6.15)#400 |
| 16. | Lebanon | 6.7% | 1.3%(+5.40)#16 | 1.2%(+5.56)#466 |
| 17. | Phoenix | 6.3% | 1.3%(+5.00)#17 | 1.2%(+5.16)#539 |
| 18. | Highland Park | 6.3% | 1.3%(+4.90)#18 | 1.2%(+5.07)#557 |
| 19. | Lake Bluff | 6.0% | 1.3%(+4.69)#19 | 1.2%(+4.86)#594 |
| 20. | Riverwoods | 5.7% | 1.3%(+4.37)#20 | 1.2%(+4.54)#658 |
| 21. | Leland Grove | 5.7% | 1.3%(+4.31)#21 | 1.2%(+4.48)#668 |
| 22. | Neoga | 5.6% | 1.3%(+4.28)#22 | 1.2%(+4.45)#674 |
| 23. | Northbrook | 5.3% | 1.3%(+4.00)#23 | 1.2%(+4.16)#744 |
| 24. | Western Springs | 5.1% | 1.3%(+3.70)#24 | 1.2%(+3.87)#830 |
| 25. | Monee | 4.8% | 1.3%(+3.41)#25 | 1.2%(+3.57)#927 |
| 26. | Deerfield | 4.7% | 1.3%(+3.39)#26 | 1.2%(+3.56)#929 |
| 27. | Burr Ridge | 4.7% | 1.3%(+3.35)#27 | 1.2%(+3.51)#949 |
| 28. | Crab Orchard | 4.6% | 1.3%(+3.23)#28 | 1.2%(+3.39)#995 |
| 29. | Lake Holiday | 4.3% | 1.3%(+3.00)#29 | 1.2%(+3.16)#1,067 |
| 30. | Gulfport | 4.3% | 1.3%(+3.00)#30 | 1.2%(+3.16)#1,072 |
| 31. | Indian Head Park | 4.3% | 1.3%(+2.99)#31 | 1.2%(+3.16)#1,076 |
| 32. | Newman | 4.3% | 1.3%(+2.94)#32 | 1.2%(+3.11)#1,092 |
| 33. | Green Oaks | 4.3% | 1.3%(+2.94)#33 | 1.2%(+3.10)#1,093 |
| 34. | Oak Park | 4.2% | 1.3%(+2.86)#34 | 1.2%(+3.02)#1,134 |
| 35. | Bull Valley | 4.2% | 1.3%(+2.83)#35 | 1.2%(+3.00)#1,145 |
| 36. | Forest Lake | 4.2% | 1.3%(+2.80)#36 | 1.2%(+2.97)#1,156 |
| 37. | Dayton | 4.1% | 1.3%(+2.78)#37 | 1.2%(+2.95)#1,161 |
| 38. | Mount Clare | 4.1% | 1.3%(+2.77)#38 | 1.2%(+2.94)#1,165 |
| 39. | Rock City | 4.1% | 1.3%(+2.72)#39 | 1.2%(+2.89)#1,198 |
| 40. | Glen Ellyn | 4.1% | 1.3%(+2.70)#40 | 1.2%(+2.87)#1,207 |
| 41. | Tallula | 4.0% | 1.3%(+2.65)#41 | 1.2%(+2.82)#1,229 |
| 42. | Forest Park | 4.0% | 1.3%(+2.61)#42 | 1.2%(+2.78)#1,249 |
| 43. | Belle Prairie City | 3.8% | 1.3%(+2.50)#43 | 1.2%(+2.66)#1,310 |
| 44. | Irwin | 3.8% | 1.3%(+2.50)#44 | 1.2%(+2.66)#1,311 |
| 45. | Bluford | 3.8% | 1.3%(+2.48)#45 | 1.2%(+2.65)#1,315 |
| 46. | Winfield | 3.8% | 1.3%(+2.48)#46 | 1.2%(+2.64)#1,317 |
| 47. | Glenview | 3.8% | 1.3%(+2.46)#47 | 1.2%(+2.63)#1,321 |
| 48. | Old Mill Creek | 3.8% | 1.3%(+2.42)#48 | 1.2%(+2.59)#1,336 |
| 49. | Toledo | 3.8% | 1.3%(+2.41)#49 | 1.2%(+2.57)#1,347 |
| 50. | Flossmoor | 3.7% | 1.3%(+2.40)#50 | 1.2%(+2.57)#1,357 |
| 51. | Goodfield | 3.6% | 1.3%(+2.27)#51 | 1.2%(+2.43)#1,455 |
| 52. | Barrington | 3.6% | 1.3%(+2.21)#52 | 1.2%(+2.38)#1,493 |
| 53. | Hillsboro | 3.5% | 1.3%(+2.14)#53 | 1.2%(+2.30)#1,549 |
| 54. | North Barrington | 3.4% | 1.3%(+2.08)#54 | 1.2%(+2.24)#1,590 |
| 55. | Park Ridge | 3.4% | 1.3%(+2.07)#55 | 1.2%(+2.24)#1,597 |
| 56. | Barrington Hills | 3.4% | 1.3%(+2.07)#56 | 1.2%(+2.24)#1,599 |
| 57. | South Barrington | 3.4% | 1.3%(+2.01)#57 | 1.2%(+2.18)#1,636 |
| 58. | Deer Park | 3.3% | 1.3%(+1.99)#58 | 1.2%(+2.16)#1,646 |
| 59. | Mitchell | 3.3% | 1.3%(+1.99)#59 | 1.2%(+2.16)#1,648 |
| 60. | St Peter | 3.3% | 1.3%(+1.96)#60 | 1.2%(+2.12)#1,681 |
| 61. | Holiday Shores | 3.3% | 1.3%(+1.94)#61 | 1.2%(+2.10)#1,693 |
| 62. | Riverside | 3.3% | 1.3%(+1.94)#62 | 1.2%(+2.10)#1,694 |
| 63. | Palos Park | 3.3% | 1.3%(+1.93)#63 | 1.2%(+2.09)#1,700 |
| 64. | Elmhurst | 3.3% | 1.3%(+1.92)#64 | 1.2%(+2.08)#1,706 |
| 65. | Ashland | 3.2% | 1.3%(+1.88)#65 | 1.2%(+2.04)#1,735 |
| 66. | Posen | 3.2% | 1.3%(+1.86)#66 | 1.2%(+2.02)#1,754 |
| 67. | Pana | 3.2% | 1.3%(+1.80)#67 | 1.2%(+1.97)#1,808 |
| 68. | Freeburg | 3.1% | 1.3%(+1.71)#68 | 1.2%(+1.87)#1,876 |
| 69. | Matteson | 2.9% | 1.3%(+1.60)#69 | 1.2%(+1.76)#1,984 |
| 70. | Evanston | 2.9% | 1.3%(+1.56)#70 | 1.2%(+1.73)#2,019 |
| 71. | Norris City | 2.9% | 1.3%(+1.51)#71 | 1.2%(+1.67)#2,062 |
| 72. | Kildeer | 2.9% | 1.3%(+1.51)#72 | 1.2%(+1.67)#2,067 |
| 73. | North Utica | 2.8% | 1.3%(+1.49)#73 | 1.2%(+1.65)#2,089 |
| 74. | Lincolnshire | 2.8% | 1.3%(+1.48)#74 | 1.2%(+1.65)#2,090 |
| 75. | Williamson | 2.8% | 1.3%(+1.47)#75 | 1.2%(+1.63)#2,110 |
| 76. | La Grange | 2.8% | 1.3%(+1.46)#76 | 1.2%(+1.62)#2,123 |
| 77. | Browns | 2.8% | 1.3%(+1.43)#77 | 1.2%(+1.59)#2,158 |
| 78. | Downers Grove | 2.8% | 1.3%(+1.42)#78 | 1.2%(+1.59)#2,167 |
| 79. | Savoy | 2.7% | 1.3%(+1.39)#79 | 1.2%(+1.55)#2,198 |
| 80. | Harrisburg | 2.7% | 1.3%(+1.37)#80 | 1.2%(+1.54)#2,219 |
| 81. | Frankfort | 2.7% | 1.3%(+1.37)#81 | 1.2%(+1.53)#2,224 |
| 82. | Richmond | 2.7% | 1.3%(+1.36)#82 | 1.2%(+1.53)#2,230 |
| 83. | Lincolnwood | 2.7% | 1.3%(+1.35)#83 | 1.2%(+1.51)#2,236 |
| 84. | Sherman | 2.7% | 1.3%(+1.33)#84 | 1.2%(+1.49)#2,263 |
| 85. | Maryville | 2.6% | 1.3%(+1.28)#85 | 1.2%(+1.45)#2,305 |
| 86. | New Boston | 2.6% | 1.3%(+1.27)#86 | 1.2%(+1.44)#2,317 |
| 87. | Inverness | 2.6% | 1.3%(+1.26)#87 | 1.2%(+1.43)#2,334 |
| 88. | Lake Petersburg | 2.6% | 1.3%(+1.25)#88 | 1.2%(+1.42)#2,350 |
| 89. | La Grange Park | 2.6% | 1.3%(+1.25)#89 | 1.2%(+1.42)#2,351 |
| 90. | Hamel | 2.6% | 1.3%(+1.21)#90 | 1.2%(+1.38)#2,387 |
| 91. | Swansea | 2.6% | 1.3%(+1.20)#91 | 1.2%(+1.37)#2,397 |
| 92. | Clinton | 2.5% | 1.3%(+1.20)#92 | 1.2%(+1.36)#2,405 |
| 93. | Glen Carbon | 2.5% | 1.3%(+1.14)#93 | 1.2%(+1.30)#2,459 |
| 94. | Hometown | 2.5% | 1.3%(+1.13)#94 | 1.2%(+1.30)#2,462 |
| 95. | Highwood | 2.5% | 1.3%(+1.13)#95 | 1.2%(+1.29)#2,472 |
| 96. | Andover | 2.4% | 1.3%(+1.09)#96 | 1.2%(+1.26)#2,521 |
| 97. | New Baden | 2.4% | 1.3%(+1.08)#97 | 1.2%(+1.25)#2,534 |
| 98. | Geneva | 2.4% | 1.3%(+1.07)#98 | 1.2%(+1.24)#2,550 |
| 99. | Wayne | 2.4% | 1.3%(+1.02)#99 | 1.2%(+1.19)#2,619 |
| 100. | Pecatonica | 2.4% | 1.3%(+1.00)#100 | 1.2%(+1.17)#2,651 |
Common Questions
What are the Top 10 Cities with the Highest Percentage of Population Employed in Legal Services & Support in Illinois?
Top 10 Cities with the Highest Percentage of Population Employed in Legal Services & Support in Illinois are:
#1
18.2%
#2
13.3%
#3
11.8%
#4
11.2%
#5
10.4%
#6
10.3%
#7
10.0%
#8
10.0%
#9
8.6%
#10
8.5%
What city has the Highest Percentage of Population Employed in Legal Services & Support in Illinois?
Berlin has the Highest Percentage of Population Employed in Legal Services & Support in Illinois with 18.2%.
What is the Percentage of Population Employed in Legal Services & Support in the State of Illinois?
Percentage of Population Employed in Legal Services & Support in Illinois is 1.3%.
What is the Percentage of Population Employed in Legal Services & Support in the United States?
Percentage of Population Employed in Legal Services & Support in the United States is 1.2%.