Cities with the Highest Percentage of Mexican Population in Illinois
RELATED REPORTS & OPTIONS
Mexican
Illinois
Compare Cities
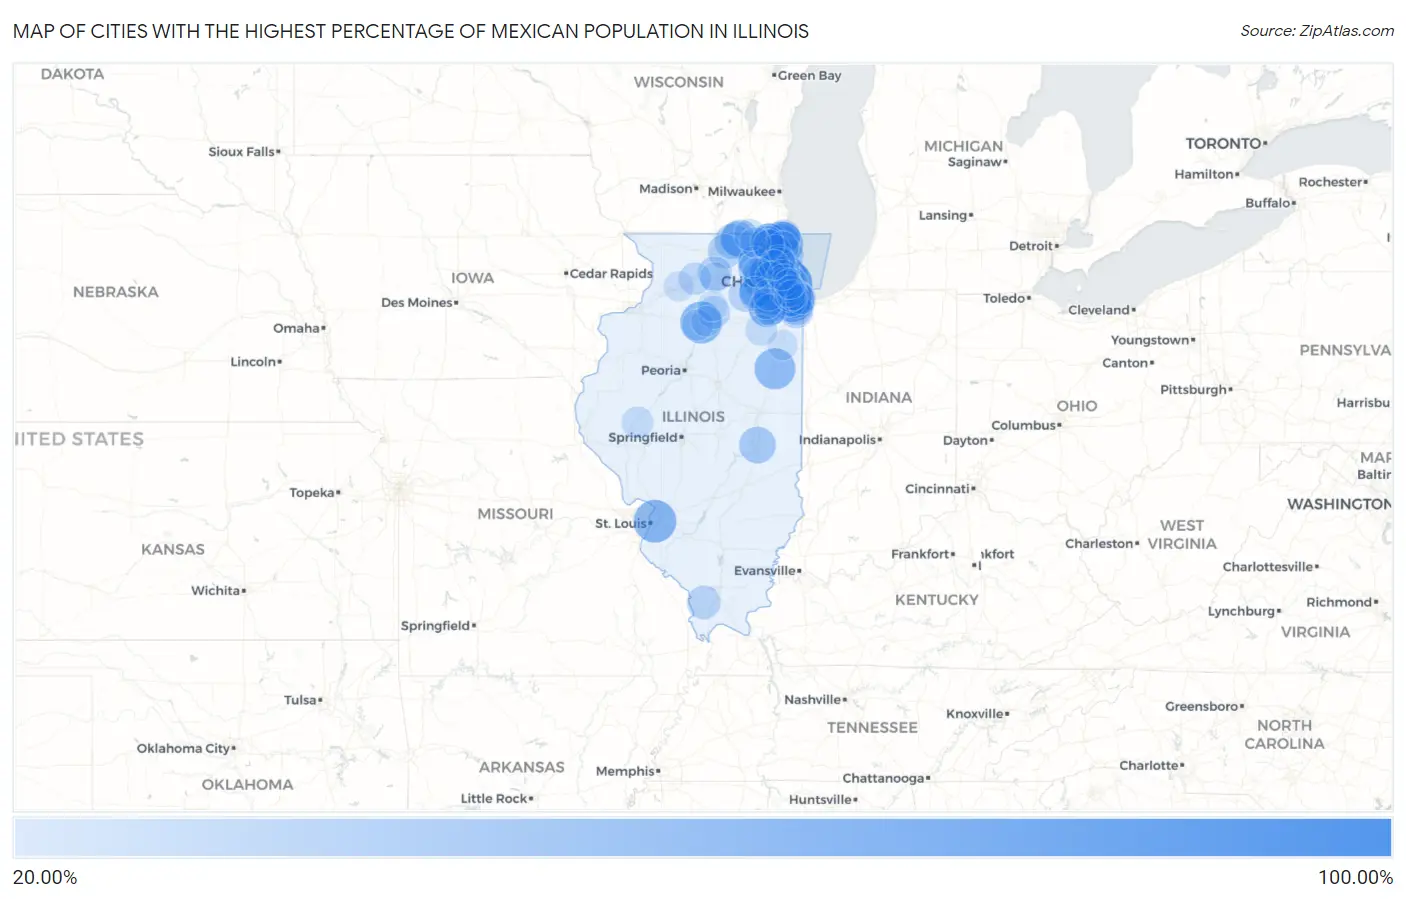
Map of Cities with the Highest Percentage of Mexican Population in Illinois
0.00%
100.00%
Cities with the Highest Percentage of Mexican Population in Illinois
| City | Mexican | vs State | vs National | |
| 1. | Alden | 100.00% | 13.83%(+86.2)#1 | 11.22%(+88.8)#76 |
| 2. | Stone Park | 86.84% | 13.83%(+73.0)#2 | 11.22%(+75.6)#397 |
| 3. | Cicero | 78.85% | 13.83%(+65.0)#3 | 11.22%(+67.6)#531 |
| 4. | Summit | 67.88% | 13.83%(+54.0)#4 | 11.22%(+56.7)#732 |
| 5. | Posen | 67.20% | 13.83%(+53.4)#5 | 11.22%(+56.0)#752 |
| 6. | Park City | 66.49% | 13.83%(+52.7)#6 | 11.22%(+55.3)#764 |
| 7. | Fairmont City | 63.29% | 13.83%(+49.5)#7 | 11.22%(+52.1)#821 |
| 8. | Melrose Park | 62.47% | 13.83%(+48.6)#8 | 11.22%(+51.3)#840 |
| 9. | Kings | 61.96% | 13.83%(+48.1)#9 | 11.22%(+50.7)#850 |
| 10. | Ridgewood | 61.94% | 13.83%(+48.1)#10 | 11.22%(+50.7)#851 |
| 11. | De Pue | 60.73% | 13.83%(+46.9)#11 | 11.22%(+49.5)#878 |
| 12. | Stickney | 59.52% | 13.83%(+45.7)#12 | 11.22%(+48.3)#905 |
| 13. | Onarga | 56.83% | 13.83%(+43.0)#13 | 11.22%(+45.6)#967 |
| 14. | Dixmoor | 55.88% | 13.83%(+42.0)#14 | 11.22%(+44.7)#992 |
| 15. | Serena | 54.85% | 13.83%(+41.0)#15 | 11.22%(+43.6)#1,016 |
| 16. | Northlake | 51.45% | 13.83%(+37.6)#16 | 11.22%(+40.2)#1,097 |
| 17. | Berwyn | 48.66% | 13.83%(+34.8)#17 | 11.22%(+37.4)#1,186 |
| 18. | Round Lake Beach | 46.12% | 13.83%(+32.3)#18 | 11.22%(+34.9)#1,290 |
| 19. | Harvard | 45.89% | 13.83%(+32.1)#19 | 11.22%(+34.7)#1,297 |
| 20. | Carpentersville | 45.82% | 13.83%(+32.0)#20 | 11.22%(+34.6)#1,300 |
| 21. | Shirley | 45.16% | 13.83%(+31.3)#21 | 11.22%(+33.9)#1,322 |
| 22. | Franklin Park | 45.12% | 13.83%(+31.3)#22 | 11.22%(+33.9)#1,327 |
| 23. | West Chicago | 45.04% | 13.83%(+31.2)#23 | 11.22%(+33.8)#1,333 |
| 24. | Waukegan | 43.61% | 13.83%(+29.8)#24 | 11.22%(+32.4)#1,386 |
| 25. | Berkeley | 43.33% | 13.83%(+29.5)#25 | 11.22%(+32.1)#1,393 |
| 26. | Rockdale | 43.30% | 13.83%(+29.5)#26 | 11.22%(+32.1)#1,395 |
| 27. | Burbank | 42.75% | 13.83%(+28.9)#27 | 11.22%(+31.5)#1,413 |
| 28. | Blue Island | 42.66% | 13.83%(+28.8)#28 | 11.22%(+31.4)#1,418 |
| 29. | Arcola | 42.59% | 13.83%(+28.8)#29 | 11.22%(+31.4)#1,423 |
| 30. | Hodgkins | 42.36% | 13.83%(+28.5)#30 | 11.22%(+31.1)#1,434 |
| 31. | Mccook | 42.14% | 13.83%(+28.3)#31 | 11.22%(+30.9)#1,444 |
| 32. | Lyons | 40.66% | 13.83%(+26.8)#32 | 11.22%(+29.4)#1,502 |
| 33. | Elgin | 40.05% | 13.83%(+26.2)#33 | 11.22%(+28.8)#1,523 |
| 34. | Bedford Park | 39.26% | 13.83%(+25.4)#34 | 11.22%(+28.0)#1,558 |
| 35. | Round Lake Heights | 38.93% | 13.83%(+25.1)#35 | 11.22%(+27.7)#1,574 |
| 36. | Round Lake Park | 38.04% | 13.83%(+24.2)#36 | 11.22%(+26.8)#1,612 |
| 37. | Capron | 37.64% | 13.83%(+23.8)#37 | 11.22%(+26.4)#1,636 |
| 38. | Aurora | 36.93% | 13.83%(+23.1)#38 | 11.22%(+25.7)#1,664 |
| 39. | Highwood | 36.62% | 13.83%(+22.8)#39 | 11.22%(+25.4)#1,680 |
| 40. | Chemung | 36.01% | 13.83%(+22.2)#40 | 11.22%(+24.8)#1,710 |
| 41. | Boulder Hill | 35.53% | 13.83%(+21.7)#41 | 11.22%(+24.3)#1,743 |
| 42. | Rosemont | 34.89% | 13.83%(+21.1)#42 | 11.22%(+23.7)#1,785 |
| 43. | Belvidere | 34.56% | 13.83%(+20.7)#43 | 11.22%(+23.3)#1,808 |
| 44. | Addison | 34.25% | 13.83%(+20.4)#44 | 11.22%(+23.0)#1,826 |
| 45. | Hillcrest | 34.18% | 13.83%(+20.3)#45 | 11.22%(+23.0)#1,833 |
| 46. | Bensenville | 34.10% | 13.83%(+20.3)#46 | 11.22%(+22.9)#1,841 |
| 47. | South Chicago Heights | 32.87% | 13.83%(+19.0)#47 | 11.22%(+21.6)#1,930 |
| 48. | Cobden | 32.45% | 13.83%(+18.6)#48 | 11.22%(+21.2)#1,963 |
| 49. | Beach Park | 32.41% | 13.83%(+18.6)#49 | 11.22%(+21.2)#1,965 |
| 50. | Fairmont | 31.95% | 13.83%(+18.1)#50 | 11.22%(+20.7)#1,990 |
| 51. | Zion | 31.21% | 13.83%(+17.4)#51 | 11.22%(+20.0)#2,029 |
| 52. | Chicago Heights | 31.05% | 13.83%(+17.2)#52 | 11.22%(+19.8)#2,040 |
| 53. | Ingalls Park | 31.01% | 13.83%(+17.2)#53 | 11.22%(+19.8)#2,043 |
| 54. | Streamwood | 30.98% | 13.83%(+17.1)#54 | 11.22%(+19.8)#2,044 |
| 55. | Plano | 30.95% | 13.83%(+17.1)#55 | 11.22%(+19.7)#2,047 |
| 56. | Romeoville | 30.70% | 13.83%(+16.9)#56 | 11.22%(+19.5)#2,072 |
| 57. | Long Lake | 30.38% | 13.83%(+16.5)#57 | 11.22%(+19.2)#2,095 |
| 58. | Harvey | 30.33% | 13.83%(+16.5)#58 | 11.22%(+19.1)#2,099 |
| 59. | Midlothian | 30.30% | 13.83%(+16.5)#59 | 11.22%(+19.1)#2,103 |
| 60. | Joliet | 29.42% | 13.83%(+15.6)#60 | 11.22%(+18.2)#2,165 |
| 61. | Hanover Park | 29.36% | 13.83%(+15.5)#61 | 11.22%(+18.1)#2,170 |
| 62. | Troy Grove | 29.00% | 13.83%(+15.2)#62 | 11.22%(+17.8)#2,193 |
| 63. | Mundelein | 28.90% | 13.83%(+15.1)#63 | 11.22%(+17.7)#2,197 |
| 64. | Grand Detour | 28.48% | 13.83%(+14.6)#64 | 11.22%(+17.3)#2,231 |
| 65. | North Chicago | 27.90% | 13.83%(+14.1)#65 | 11.22%(+16.7)#2,283 |
| 66. | Hillside | 27.63% | 13.83%(+13.8)#66 | 11.22%(+16.4)#2,304 |
| 67. | Ritchie | 27.27% | 13.83%(+13.4)#67 | 11.22%(+16.1)#2,347 |
| 68. | Prospect Heights | 27.19% | 13.83%(+13.4)#68 | 11.22%(+16.0)#2,356 |
| 69. | Wheeling | 27.03% | 13.83%(+13.2)#69 | 11.22%(+15.8)#2,368 |
| 70. | Gilberts | 26.37% | 13.83%(+12.5)#70 | 11.22%(+15.2)#2,428 |
| 71. | Glendale Heights | 26.32% | 13.83%(+12.5)#71 | 11.22%(+15.1)#2,430 |
| 72. | Bridgeview | 26.15% | 13.83%(+12.3)#72 | 11.22%(+14.9)#2,441 |
| 73. | Hebron | 26.10% | 13.83%(+12.3)#73 | 11.22%(+14.9)#2,445 |
| 74. | Beardstown | 26.07% | 13.83%(+12.2)#74 | 11.22%(+14.9)#2,448 |
| 75. | Forest View | 26.07% | 13.83%(+12.2)#75 | 11.22%(+14.8)#2,449 |
| 76. | Riverside | 25.47% | 13.83%(+11.6)#76 | 11.22%(+14.3)#2,510 |
| 77. | Maywood | 25.38% | 13.83%(+11.5)#77 | 11.22%(+14.2)#2,520 |
| 78. | Montgomery | 25.32% | 13.83%(+11.5)#78 | 11.22%(+14.1)#2,527 |
| 79. | Braceville | 25.24% | 13.83%(+11.4)#79 | 11.22%(+14.0)#2,538 |
| 80. | Preston Heights | 25.10% | 13.83%(+11.3)#80 | 11.22%(+13.9)#2,549 |
| 81. | Hometown | 24.91% | 13.83%(+11.1)#81 | 11.22%(+13.7)#2,562 |
| 82. | Sunnyland | 23.83% | 13.83%(+9.99)#82 | 11.22%(+12.6)#2,652 |
| 83. | Bureau Junction | 23.79% | 13.83%(+9.96)#83 | 11.22%(+12.6)#2,655 |
| 84. | Round Lake | 23.61% | 13.83%(+9.78)#84 | 11.22%(+12.4)#2,677 |
| 85. | Bolingbrook | 23.56% | 13.83%(+9.73)#85 | 11.22%(+12.3)#2,683 |
| 86. | Crystal Lawns | 23.05% | 13.83%(+9.22)#86 | 11.22%(+11.8)#2,730 |
| 87. | Alsip | 22.74% | 13.83%(+8.90)#87 | 11.22%(+11.5)#2,757 |
| 88. | Wonder Lake | 21.86% | 13.83%(+8.03)#88 | 11.22%(+10.6)#2,847 |
| 89. | Burnham | 21.85% | 13.83%(+8.01)#89 | 11.22%(+10.6)#2,850 |
| 90. | Merrionette Park | 21.55% | 13.83%(+7.71)#90 | 11.22%(+10.3)#2,887 |
| 91. | Spring Valley | 21.53% | 13.83%(+7.69)#91 | 11.22%(+10.3)#2,889 |
| 92. | Schiller Park | 21.46% | 13.83%(+7.62)#92 | 11.22%(+10.2)#2,898 |
| 93. | Sterling | 21.38% | 13.83%(+7.55)#93 | 11.22%(+10.2)#2,911 |
| 94. | Chicago | 21.38% | 13.83%(+7.55)#94 | 11.22%(+10.2)#2,912 |
| 95. | Rochelle | 21.32% | 13.83%(+7.49)#95 | 11.22%(+10.1)#2,920 |
| 96. | Sammons Point | 21.20% | 13.83%(+7.36)#96 | 11.22%(+9.98)#2,932 |
| 97. | Holcomb | 20.96% | 13.83%(+7.12)#97 | 11.22%(+9.74)#2,948 |
| 98. | Mendota | 20.80% | 13.83%(+6.97)#98 | 11.22%(+9.58)#2,961 |
| 99. | Rolling Meadows | 20.72% | 13.83%(+6.88)#99 | 11.22%(+9.50)#2,973 |
| 100. | South Elgin | 20.47% | 13.83%(+6.64)#100 | 11.22%(+9.25)#3,005 |
Common Questions
What are the Top 10 Cities with the Highest Percentage of Mexican Population in Illinois?
Top 10 Cities with the Highest Percentage of Mexican Population in Illinois are:
#1
86.84%
#2
78.85%
#3
67.88%
#4
67.20%
#5
66.49%
#6
63.29%
#7
62.47%
#8
60.73%
#9
59.52%
#10
56.83%
What city has the Highest Percentage of Mexican Population in Illinois?
Stone Park has the Highest Percentage of Mexican Population in Illinois with 86.84%.
What is the Percentage of Mexican Population in the State of Illinois?
Percentage of Mexican Population in Illinois is 13.83%.
What is the Percentage of Mexican Population in the United States?
Percentage of Mexican Population in the United States is 11.22%.