Grayslake, IL Map & Demographics
Grayslake Map
Grayslake Overview
$53,486
PER CAPITA INCOME
$135,615
AVG FAMILY INCOME
$110,662
AVG HOUSEHOLD INCOME
32.8%
WAGE / INCOME GAP [ % ]
67.2¢/ $1
WAGE / INCOME GAP [ $ ]
$7,483
FAMILY INCOME DEFICIT
0.41
INEQUALITY / GINI INDEX
20,801
TOTAL POPULATION
10,610
MALE POPULATION
10,191
FEMALE POPULATION
104.11
MALES / 100 FEMALES
96.05
FEMALES / 100 MALES
37.6
MEDIAN AGE
3.1
AVG FAMILY SIZE
2.6
AVG HOUSEHOLD SIZE
12,159
LABOR FORCE [ PEOPLE ]
73.3%
PERCENT IN LABOR FORCE
6.2%
UNEMPLOYMENT RATE
Grayslake Zip Codes
Income in Grayslake
Income Overview in Grayslake
Per Capita Income in Grayslake is $53,486, while median incomes of families and households are $135,615 and $110,662 respectively.
| Characteristic | Number | Measure |
| Per Capita Income | 20,801 | $53,486 |
| Median Family Income | 5,483 | $135,615 |
| Mean Family Income | 5,483 | $153,584 |
| Median Household Income | 8,066 | $110,662 |
| Mean Household Income | 8,066 | $136,498 |
| Income Deficit | 5,483 | $7,483 |
| Wage / Income Gap (%) | 20,801 | 32.80% |
| Wage / Income Gap ($) | 20,801 | 67.20¢ per $1 |
| Gini / Inequality Index | 20,801 | 0.41 |
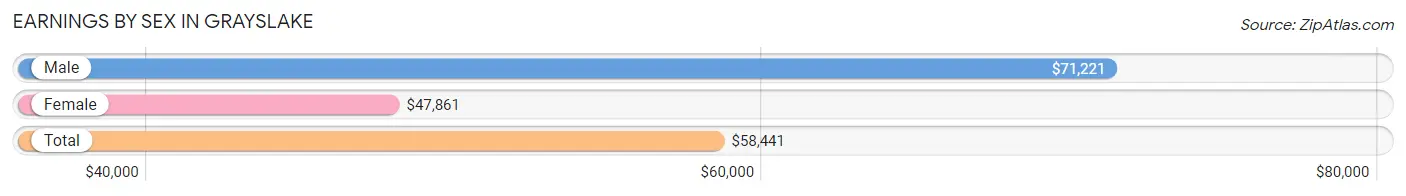
Earnings by Sex in Grayslake
Average Earnings in Grayslake are $58,441, $71,221 for men and $47,861 for women, a difference of 32.8%.
| Sex | Number | Average Earnings |
| Male | 6,513 (53.5%) | $71,221 |
| Female | 5,657 (46.5%) | $47,861 |
| Total | 12,170 (100.0%) | $58,441 |
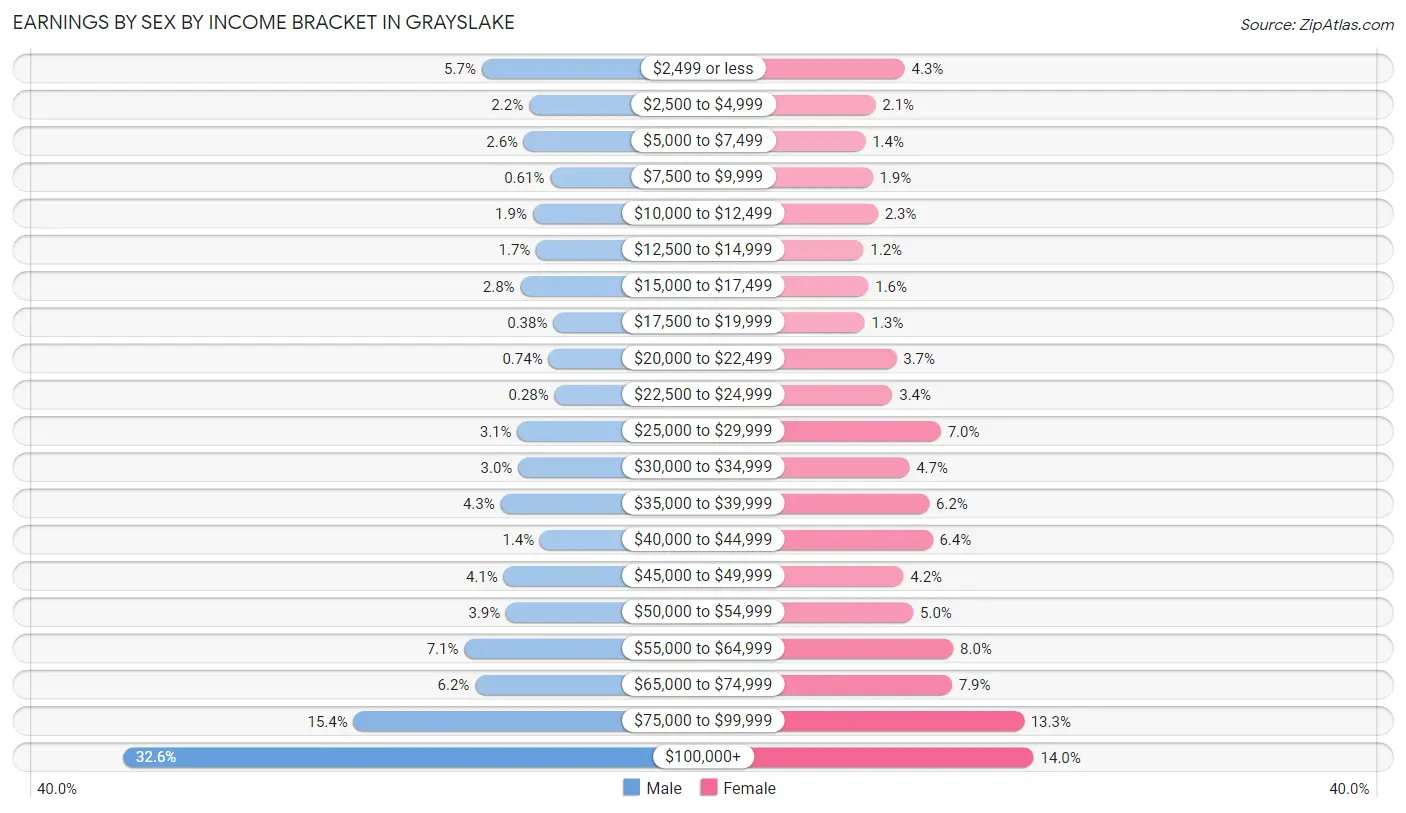
Earnings by Sex by Income Bracket in Grayslake
The most common earnings brackets in Grayslake are $100,000+ for men (2,125 | 32.6%) and $100,000+ for women (792 | 14.0%).
| Income | Male | Female |
| $2,499 or less | 374 (5.7%) | 245 (4.3%) |
| $2,500 to $4,999 | 143 (2.2%) | 121 (2.1%) |
| $5,000 to $7,499 | 168 (2.6%) | 78 (1.4%) |
| $7,500 to $9,999 | 40 (0.6%) | 109 (1.9%) |
| $10,000 to $12,499 | 125 (1.9%) | 131 (2.3%) |
| $12,500 to $14,999 | 108 (1.7%) | 70 (1.2%) |
| $15,000 to $17,499 | 185 (2.8%) | 91 (1.6%) |
| $17,500 to $19,999 | 25 (0.4%) | 75 (1.3%) |
| $20,000 to $22,499 | 48 (0.7%) | 210 (3.7%) |
| $22,500 to $24,999 | 18 (0.3%) | 193 (3.4%) |
| $25,000 to $29,999 | 200 (3.1%) | 398 (7.0%) |
| $30,000 to $34,999 | 196 (3.0%) | 265 (4.7%) |
| $35,000 to $39,999 | 282 (4.3%) | 349 (6.2%) |
| $40,000 to $44,999 | 89 (1.4%) | 363 (6.4%) |
| $45,000 to $49,999 | 267 (4.1%) | 240 (4.2%) |
| $50,000 to $54,999 | 255 (3.9%) | 281 (5.0%) |
| $55,000 to $64,999 | 459 (7.0%) | 451 (8.0%) |
| $65,000 to $74,999 | 406 (6.2%) | 445 (7.9%) |
| $75,000 to $99,999 | 1,000 (15.3%) | 750 (13.3%) |
| $100,000+ | 2,125 (32.6%) | 792 (14.0%) |
| Total | 6,513 (100.0%) | 5,657 (100.0%) |
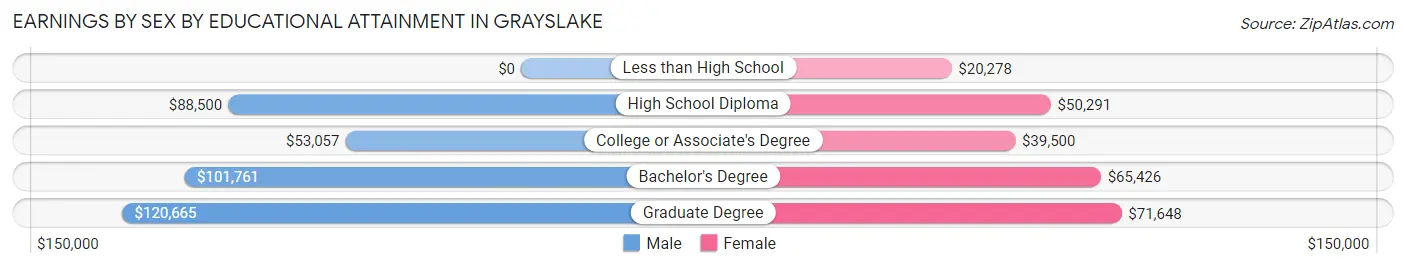
Earnings by Sex by Educational Attainment in Grayslake
Average earnings in Grayslake are $85,488 for men and $52,791 for women, a difference of 38.3%. Men with an educational attainment of graduate degree enjoy the highest average annual earnings of $120,665, while those with college or associate's degree education earn the least with $53,057. Women with an educational attainment of graduate degree earn the most with the average annual earnings of $71,648, while those with less than high school education have the smallest earnings of $20,278.
| Educational Attainment | Male Income | Female Income |
| Less than High School | - | - |
| High School Diploma | $88,500 | $50,291 |
| College or Associate's Degree | $53,057 | $39,500 |
| Bachelor's Degree | $101,761 | $65,426 |
| Graduate Degree | $120,665 | $71,648 |
| Total | $85,488 | $52,791 |
Family Income in Grayslake
Family Income Brackets in Grayslake
According to the Grayslake family income data, there are 1,552 families falling into the $200,000+ income range, which is the most common income bracket and makes up 28.3% of all families. Conversely, the $10,000 to $14,999 income bracket is the least frequent group with only 38 families (0.7%) belonging to this category.
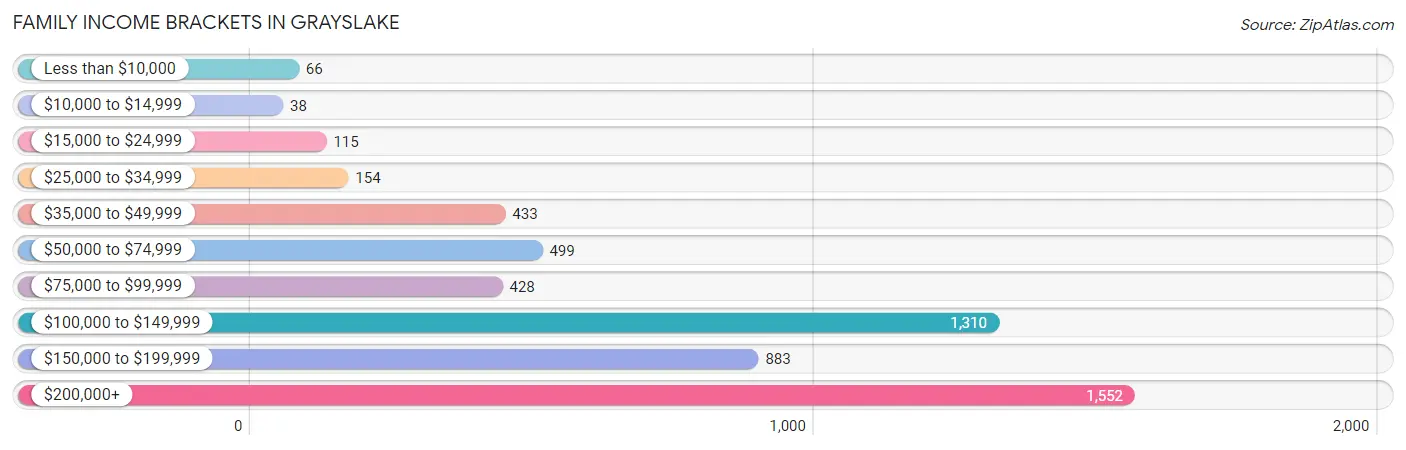
| Income Bracket | # Families | % Families |
| Less than $10,000 | 66 | 1.2% |
| $10,000 to $14,999 | 38 | 0.7% |
| $15,000 to $24,999 | 115 | 2.1% |
| $25,000 to $34,999 | 154 | 2.8% |
| $35,000 to $49,999 | 433 | 7.9% |
| $50,000 to $74,999 | 499 | 9.1% |
| $75,000 to $99,999 | 428 | 7.8% |
| $100,000 to $149,999 | 1,310 | 23.9% |
| $150,000 to $199,999 | 883 | 16.1% |
| $200,000+ | 1,552 | 28.3% |
Family Income by Famaliy Size in Grayslake
4-person families (1,084 | 19.8%) account for the highest median family income in Grayslake with $167,979 per family, while 2-person families (2,347 | 42.8%) have the highest median income of $57,385 per family member.
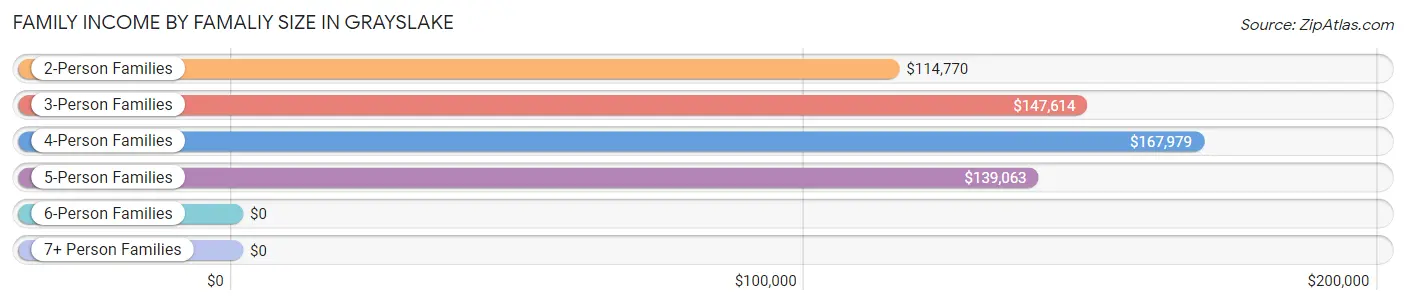
| Income Bracket | # Families | Median Income |
| 2-Person Families | 2,347 (42.8%) | $114,770 |
| 3-Person Families | 1,485 (27.1%) | $147,614 |
| 4-Person Families | 1,084 (19.8%) | $167,979 |
| 5-Person Families | 377 (6.9%) | $139,063 |
| 6-Person Families | 129 (2.4%) | $0 |
| 7+ Person Families | 61 (1.1%) | $0 |
| Total | 5,483 (100.0%) | $135,615 |
Family Income by Number of Earners in Grayslake
The median family income in Grayslake is $135,615, with families comprising 3+ earners (689) having the highest median family income of $189,042, while families with no earners (659) have the lowest median family income of $73,568, accounting for 12.6% and 12.0% of families, respectively.
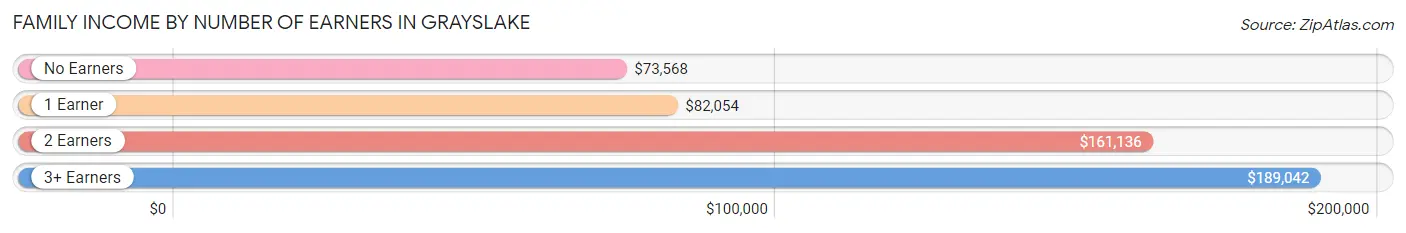
| Number of Earners | # Families | Median Income |
| No Earners | 659 (12.0%) | $73,568 |
| 1 Earner | 1,243 (22.7%) | $82,054 |
| 2 Earners | 2,892 (52.7%) | $161,136 |
| 3+ Earners | 689 (12.6%) | $189,042 |
| Total | 5,483 (100.0%) | $135,615 |
Household Income in Grayslake
Household Income Brackets in Grayslake
With 1,718 households falling in the category, the $100,000 to $149,999 income range is the most frequent in Grayslake, accounting for 21.3% of all households. In contrast, only 161 households (2.0%) fall into the less than $10,000 income bracket, making it the least populous group.
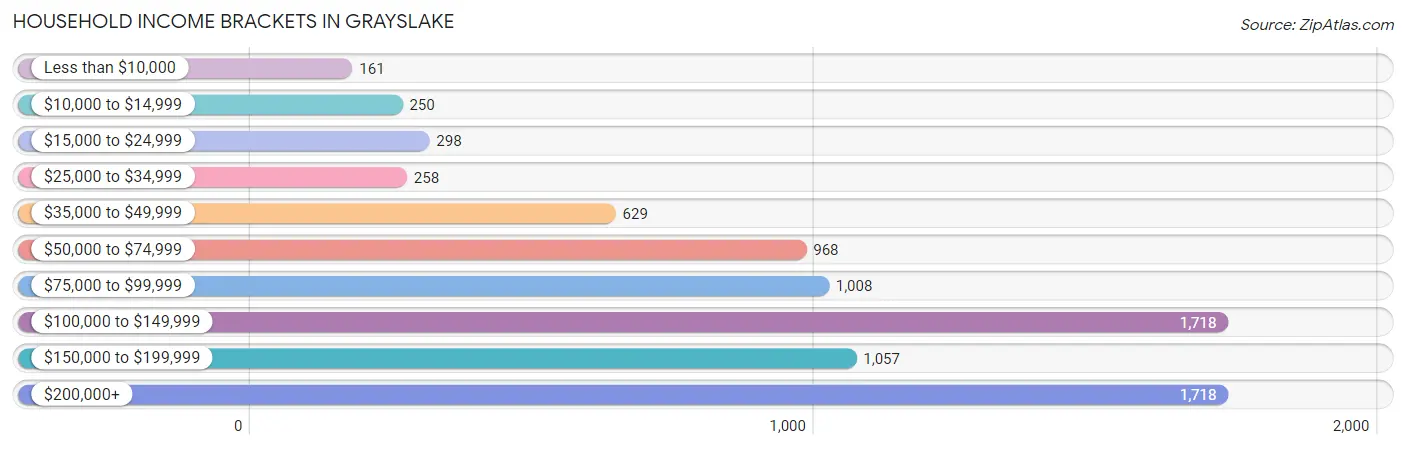
| Income Bracket | # Households | % Households |
| Less than $10,000 | 161 | 2.0% |
| $10,000 to $14,999 | 250 | 3.1% |
| $15,000 to $24,999 | 298 | 3.7% |
| $25,000 to $34,999 | 258 | 3.2% |
| $35,000 to $49,999 | 629 | 7.8% |
| $50,000 to $74,999 | 968 | 12.0% |
| $75,000 to $99,999 | 1,008 | 12.5% |
| $100,000 to $149,999 | 1,718 | 21.3% |
| $150,000 to $199,999 | 1,057 | 13.1% |
| $200,000+ | 1,718 | 21.3% |
Household Income by Householder Age in Grayslake
The median household income in Grayslake is $110,662, with the highest median household income of $152,297 found in the 45 to 64 years age bracket for the primary householder. A total of 3,231 households (40.1%) fall into this category. Meanwhile, the 65+ years age bracket for the primary householder has the lowest median household income of $54,063, with 1,674 households (20.7%) in this group.
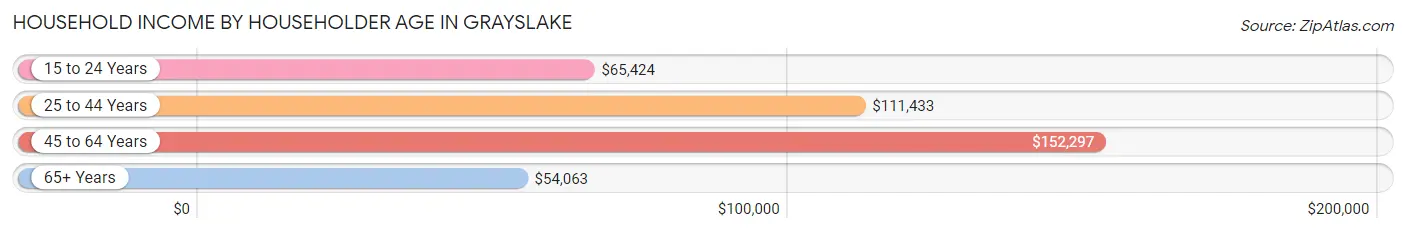
| Income Bracket | # Households | Median Income |
| 15 to 24 Years | 168 (2.1%) | $65,424 |
| 25 to 44 Years | 2,993 (37.1%) | $111,433 |
| 45 to 64 Years | 3,231 (40.1%) | $152,297 |
| 65+ Years | 1,674 (20.7%) | $54,063 |
| Total | 8,066 (100.0%) | $110,662 |
Poverty in Grayslake
Income Below Poverty by Sex and Age in Grayslake
With 6.7% poverty level for males and 7.0% for females among the residents of Grayslake, under 5 year old males and 5 year old females are the most vulnerable to poverty, with 134 males (14.0%) and 18 females (15.9%) in their respective age groups living below the poverty level.
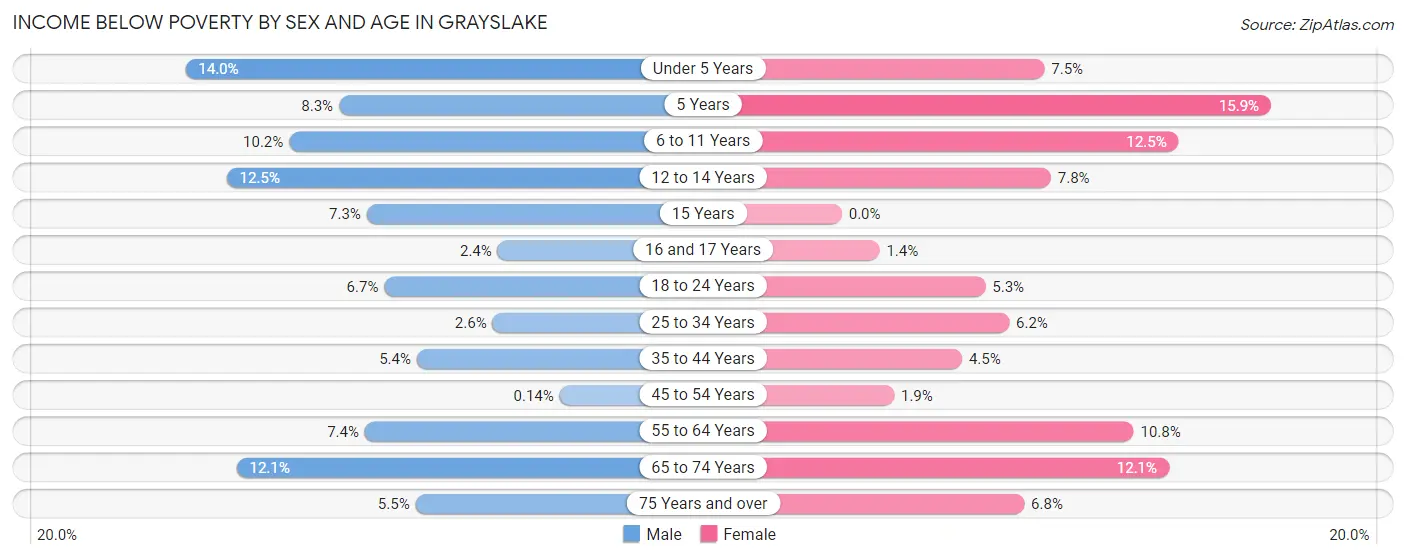
| Age Bracket | Male | Female |
| Under 5 Years | 134 (14.0%) | 37 (7.5%) |
| 5 Years | 9 (8.3%) | 18 (15.9%) |
| 6 to 11 Years | 83 (10.2%) | 87 (12.5%) |
| 12 to 14 Years | 43 (12.5%) | 33 (7.8%) |
| 15 Years | 10 (7.3%) | 0 (0.0%) |
| 16 and 17 Years | 10 (2.4%) | 3 (1.4%) |
| 18 to 24 Years | 64 (6.7%) | 49 (5.3%) |
| 25 to 34 Years | 35 (2.6%) | 96 (6.2%) |
| 35 to 44 Years | 77 (5.4%) | 65 (4.5%) |
| 45 to 54 Years | 2 (0.1%) | 26 (1.9%) |
| 55 to 64 Years | 105 (7.4%) | 169 (10.8%) |
| 65 to 74 Years | 111 (12.1%) | 88 (12.1%) |
| 75 Years and over | 22 (5.5%) | 38 (6.8%) |
| Total | 705 (6.7%) | 709 (7.0%) |
Income Above Poverty by Sex and Age in Grayslake
According to the poverty statistics in Grayslake, males aged 45 to 54 years and females aged 15 years are the age groups that are most secure financially, with 99.9% of males and 100.0% of females in these age groups living above the poverty line.
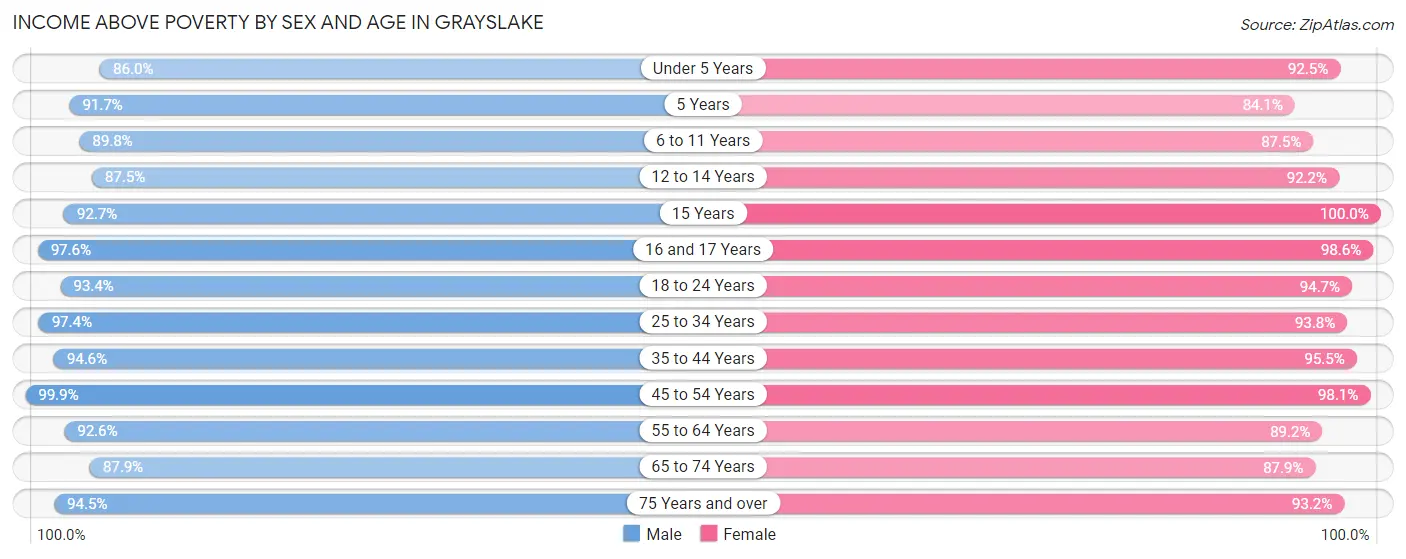
| Age Bracket | Male | Female |
| Under 5 Years | 821 (86.0%) | 455 (92.5%) |
| 5 Years | 99 (91.7%) | 95 (84.1%) |
| 6 to 11 Years | 732 (89.8%) | 609 (87.5%) |
| 12 to 14 Years | 301 (87.5%) | 392 (92.2%) |
| 15 Years | 127 (92.7%) | 128 (100.0%) |
| 16 and 17 Years | 400 (97.6%) | 212 (98.6%) |
| 18 to 24 Years | 899 (93.3%) | 871 (94.7%) |
| 25 to 34 Years | 1,295 (97.4%) | 1,449 (93.8%) |
| 35 to 44 Years | 1,338 (94.6%) | 1,394 (95.5%) |
| 45 to 54 Years | 1,379 (99.9%) | 1,314 (98.1%) |
| 55 to 64 Years | 1,320 (92.6%) | 1,392 (89.2%) |
| 65 to 74 Years | 804 (87.9%) | 637 (87.9%) |
| 75 Years and over | 379 (94.5%) | 523 (93.2%) |
| Total | 9,894 (93.3%) | 9,471 (93.0%) |
Income Below Poverty Among Married-Couple Families in Grayslake
The poverty statistics for married-couple families in Grayslake show that 3.1% or 143 of the total 4,642 families live below the poverty line. Families with 3 or 4 children have the highest poverty rate of 15.9%, comprising of 57 families. On the other hand, families with 5 or more children have the lowest poverty rate of 0.0%, which includes 0 families.
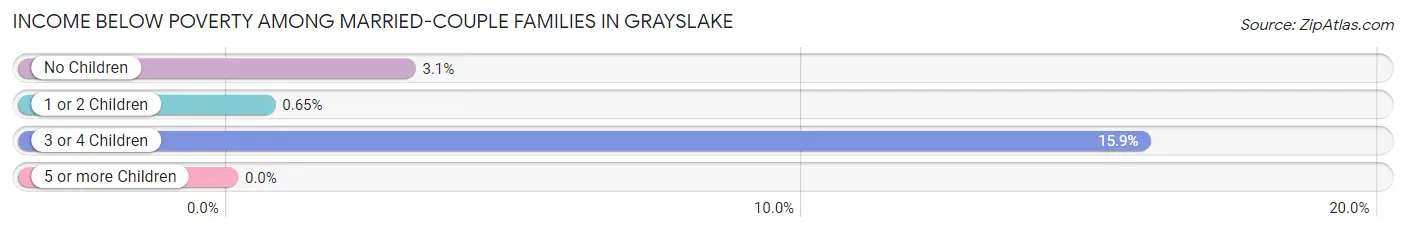
| Children | Above Poverty | Below Poverty |
| No Children | 2,324 (96.9%) | 74 (3.1%) |
| 1 or 2 Children | 1,842 (99.4%) | 12 (0.6%) |
| 3 or 4 Children | 302 (84.1%) | 57 (15.9%) |
| 5 or more Children | 31 (100.0%) | 0 (0.0%) |
| Total | 4,499 (96.9%) | 143 (3.1%) |
Income Below Poverty Among Single-Parent Households in Grayslake
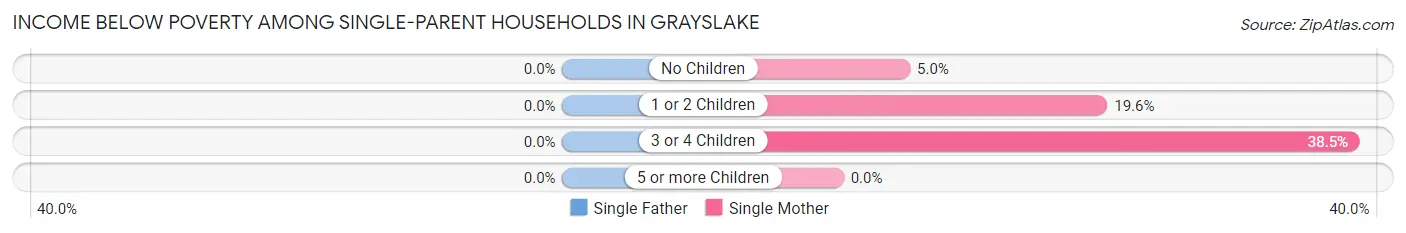
| Children | Single Father | Single Mother |
| No Children | 0 (0.0%) | 15 (5.0%) |
| 1 or 2 Children | 0 (0.0%) | 66 (19.6%) |
| 3 or 4 Children | 0 (0.0%) | 20 (38.5%) |
| 5 or more Children | 0 (0.0%) | 0 (0.0%) |
| Total | 0 (0.0%) | 101 (14.6%) |
Income Below Poverty Among Married-Couple vs Single-Parent Households in Grayslake
The poverty data for Grayslake shows that 143 of the married-couple family households (3.1%) and 101 of the single-parent households (12.0%) are living below the poverty level. Within the married-couple family households, those with 3 or 4 children have the highest poverty rate, with 57 households (15.9%) falling below the poverty line. Among the single-parent households, those with 3 or 4 children have the highest poverty rate, with 20 household (38.5%) living below poverty.
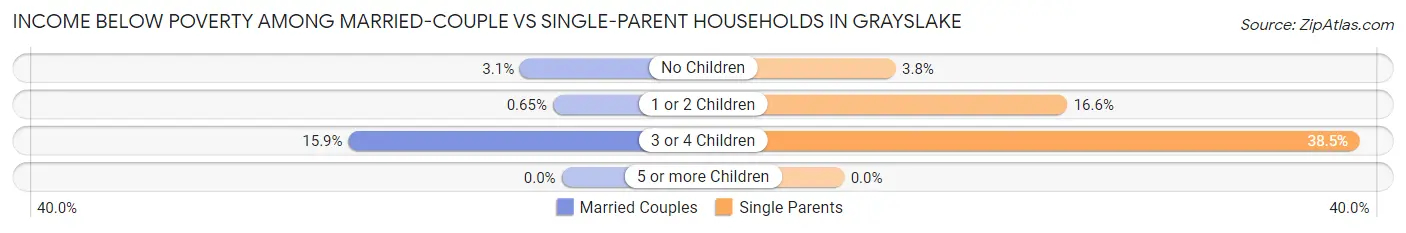
| Children | Married-Couple Families | Single-Parent Households |
| No Children | 74 (3.1%) | 15 (3.8%) |
| 1 or 2 Children | 12 (0.6%) | 66 (16.6%) |
| 3 or 4 Children | 57 (15.9%) | 20 (38.5%) |
| 5 or more Children | 0 (0.0%) | 0 (0.0%) |
| Total | 143 (3.1%) | 101 (12.0%) |
Race in Grayslake
The most populous races in Grayslake are White / Caucasian (15,360 | 73.8%), Hispanic or Latino (2,201 | 10.6%), and Black / African American (1,892 | 9.1%).
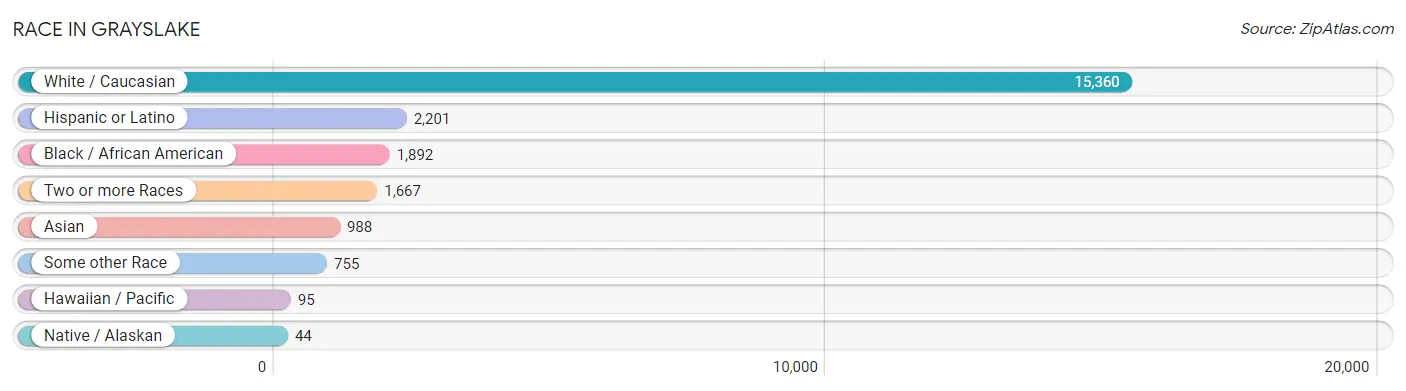
| Race | # Population | % Population |
| Asian | 988 | 4.8% |
| Black / African American | 1,892 | 9.1% |
| Hawaiian / Pacific | 95 | 0.5% |
| Hispanic or Latino | 2,201 | 10.6% |
| Native / Alaskan | 44 | 0.2% |
| White / Caucasian | 15,360 | 73.8% |
| Two or more Races | 1,667 | 8.0% |
| Some other Race | 755 | 3.6% |
| Total | 20,801 | 100.0% |
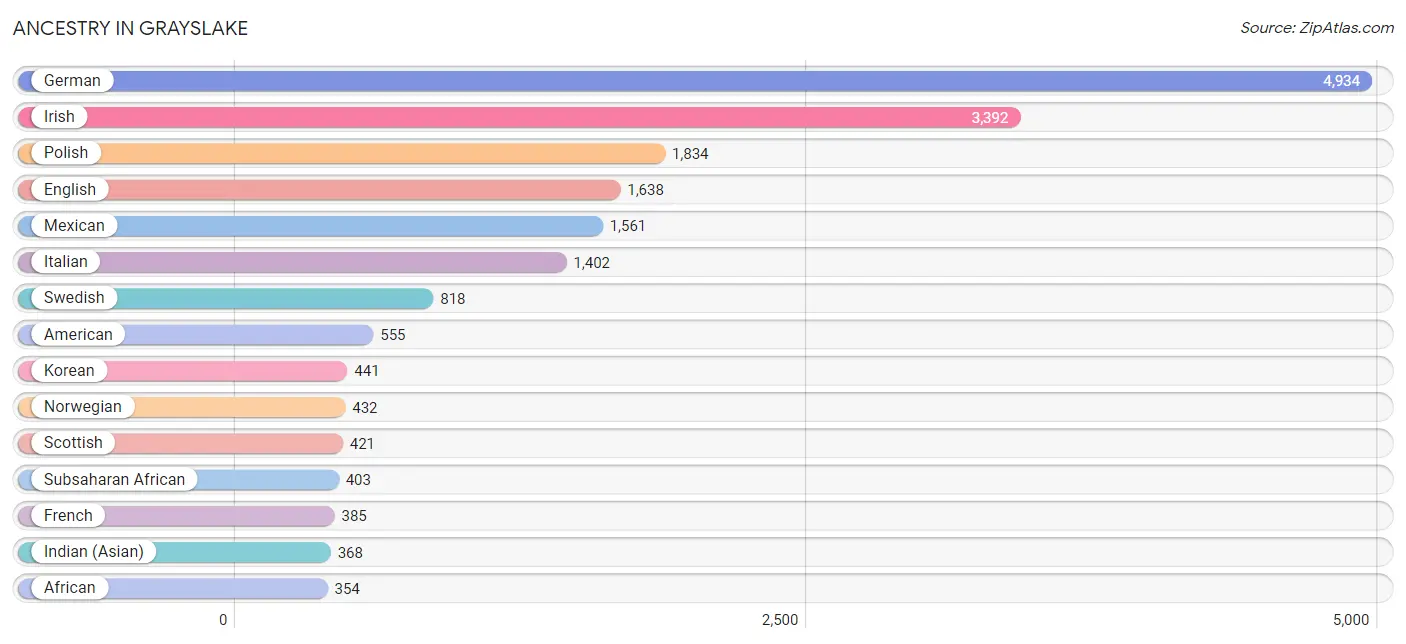
Ancestry in Grayslake
The most populous ancestries reported in Grayslake are German (4,934 | 23.7%), Irish (3,392 | 16.3%), Polish (1,834 | 8.8%), English (1,638 | 7.9%), and Mexican (1,561 | 7.5%), together accounting for 64.2% of all Grayslake residents.
| Ancestry | # Population | % Population |
| African | 354 | 1.7% |
| Albanian | 23 | 0.1% |
| American | 555 | 2.7% |
| Arab | 11 | 0.1% |
| Argentinean | 28 | 0.1% |
| Austrian | 103 | 0.5% |
| Belgian | 99 | 0.5% |
| Belizean | 76 | 0.4% |
| Bhutanese | 194 | 0.9% |
| Brazilian | 12 | 0.1% |
| British | 97 | 0.5% |
| Bulgarian | 20 | 0.1% |
| Burmese | 99 | 0.5% |
| Canadian | 36 | 0.2% |
| Central American | 42 | 0.2% |
| Central American Indian | 35 | 0.2% |
| Cherokee | 4 | 0.0% |
| Choctaw | 84 | 0.4% |
| Colombian | 14 | 0.1% |
| Croatian | 75 | 0.4% |
| Cypriot | 10 | 0.1% |
| Czech | 118 | 0.6% |
| Czechoslovakian | 38 | 0.2% |
| Danish | 149 | 0.7% |
| Dutch | 349 | 1.7% |
| Eastern European | 116 | 0.6% |
| Ecuadorian | 135 | 0.6% |
| English | 1,638 | 7.9% |
| Estonian | 15 | 0.1% |
| European | 287 | 1.4% |
| Finnish | 56 | 0.3% |
| French | 385 | 1.8% |
| French Canadian | 40 | 0.2% |
| German | 4,934 | 23.7% |
| Ghanaian | 25 | 0.1% |
| Greek | 232 | 1.1% |
| Guamanian / Chamorro | 11 | 0.1% |
| Guyanese | 11 | 0.1% |
| Haitian | 298 | 1.4% |
| Honduran | 16 | 0.1% |
| Hungarian | 52 | 0.3% |
| Indian (Asian) | 368 | 1.8% |
| Iranian | 123 | 0.6% |
| Irish | 3,392 | 16.3% |
| Italian | 1,402 | 6.7% |
| Jamaican | 177 | 0.9% |
| Korean | 441 | 2.1% |
| Latvian | 211 | 1.0% |
| Lebanese | 11 | 0.1% |
| Lithuanian | 74 | 0.4% |
| Luxembourger | 7 | 0.0% |
| Mexican | 1,561 | 7.5% |
| Mexican American Indian | 30 | 0.1% |
| Native Hawaiian | 84 | 0.4% |
| Nigerian | 24 | 0.1% |
| Northern European | 82 | 0.4% |
| Norwegian | 432 | 2.1% |
| Pakistani | 10 | 0.1% |
| Polish | 1,834 | 8.8% |
| Portuguese | 74 | 0.4% |
| Puerto Rican | 295 | 1.4% |
| Romanian | 66 | 0.3% |
| Russian | 337 | 1.6% |
| Salvadoran | 26 | 0.1% |
| Scandinavian | 44 | 0.2% |
| Scotch-Irish | 158 | 0.8% |
| Scottish | 421 | 2.0% |
| Sioux | 11 | 0.1% |
| Slavic | 16 | 0.1% |
| Slovak | 69 | 0.3% |
| Slovene | 23 | 0.1% |
| South American | 280 | 1.3% |
| South American Indian | 70 | 0.3% |
| Spanish | 11 | 0.1% |
| Sri Lankan | 210 | 1.0% |
| Subsaharan African | 403 | 1.9% |
| Swedish | 818 | 3.9% |
| Swiss | 57 | 0.3% |
| Thai | 351 | 1.7% |
| Ukrainian | 122 | 0.6% |
| Venezuelan | 103 | 0.5% |
| Welsh | 23 | 0.1% |
| Yugoslavian | 56 | 0.3% | View All 83 Rows |
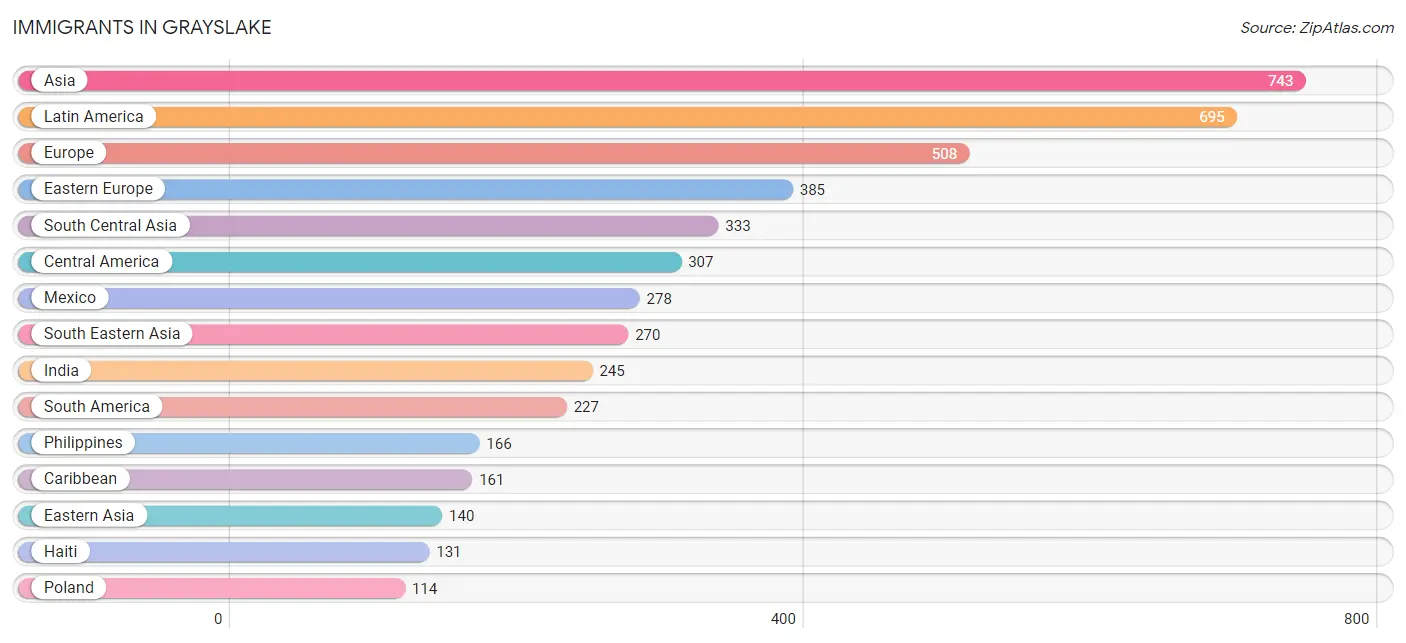
Immigrants in Grayslake
The most numerous immigrant groups reported in Grayslake came from Asia (743 | 3.6%), Latin America (695 | 3.3%), Europe (508 | 2.4%), Eastern Europe (385 | 1.8%), and South Central Asia (333 | 1.6%), together accounting for 12.8% of all Grayslake residents.
| Immigration Origin | # Population | % Population |
| Africa | 72 | 0.4% |
| Argentina | 28 | 0.1% |
| Asia | 743 | 3.6% |
| Australia | 17 | 0.1% |
| Brazil | 47 | 0.2% |
| Bulgaria | 10 | 0.1% |
| Canada | 81 | 0.4% |
| Caribbean | 161 | 0.8% |
| Central America | 307 | 1.5% |
| China | 62 | 0.3% |
| Czechoslovakia | 11 | 0.1% |
| Eastern Asia | 140 | 0.7% |
| Eastern Europe | 385 | 1.8% |
| Ecuador | 38 | 0.2% |
| El Salvador | 13 | 0.1% |
| England | 11 | 0.1% |
| Europe | 508 | 2.4% |
| Germany | 37 | 0.2% |
| Ghana | 25 | 0.1% |
| Greece | 18 | 0.1% |
| Guyana | 11 | 0.1% |
| Haiti | 131 | 0.6% |
| Honduras | 16 | 0.1% |
| India | 245 | 1.2% |
| Iran | 36 | 0.2% |
| Jamaica | 30 | 0.1% |
| Japan | 55 | 0.3% |
| Kazakhstan | 10 | 0.1% |
| Korea | 23 | 0.1% |
| Latin America | 695 | 3.3% |
| Latvia | 85 | 0.4% |
| Mexico | 278 | 1.3% |
| Nigeria | 47 | 0.2% |
| Northern Europe | 68 | 0.3% |
| Oceania | 67 | 0.3% |
| Pakistan | 42 | 0.2% |
| Philippines | 166 | 0.8% |
| Poland | 114 | 0.5% |
| Romania | 66 | 0.3% |
| Russia | 30 | 0.1% |
| Singapore | 29 | 0.1% |
| South America | 227 | 1.1% |
| South Central Asia | 333 | 1.6% |
| South Eastern Asia | 270 | 1.3% |
| Southern Europe | 18 | 0.1% |
| Ukraine | 60 | 0.3% |
| Venezuela | 103 | 0.5% |
| Vietnam | 75 | 0.4% |
| Western Africa | 72 | 0.4% |
| Western Europe | 37 | 0.2% | View All 50 Rows |
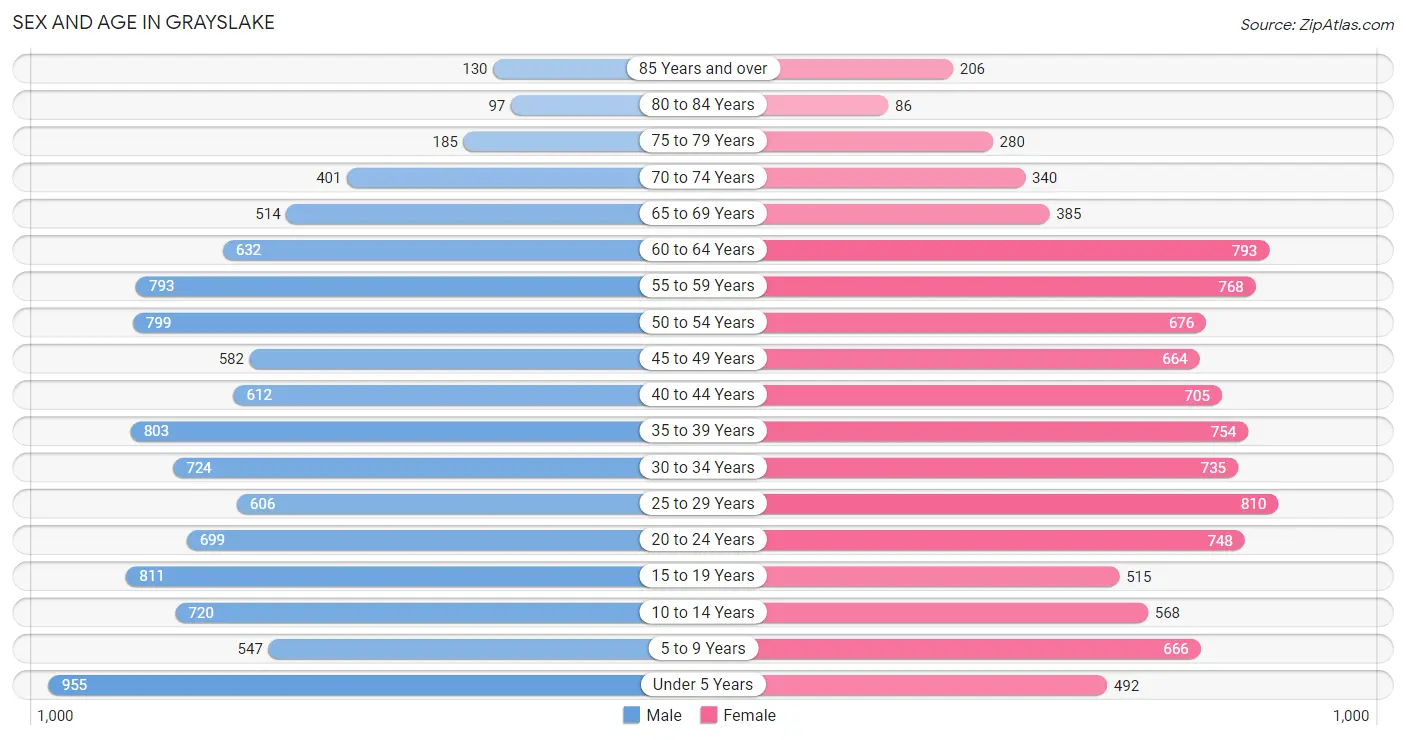
Sex and Age in Grayslake
Sex and Age in Grayslake
The most populous age groups in Grayslake are Under 5 Years (955 | 9.0%) for men and 25 to 29 Years (810 | 8.0%) for women.
| Age Bracket | Male | Female |
| Under 5 Years | 955 (9.0%) | 492 (4.8%) |
| 5 to 9 Years | 547 (5.2%) | 666 (6.5%) |
| 10 to 14 Years | 720 (6.8%) | 568 (5.6%) |
| 15 to 19 Years | 811 (7.6%) | 515 (5.1%) |
| 20 to 24 Years | 699 (6.6%) | 748 (7.3%) |
| 25 to 29 Years | 606 (5.7%) | 810 (8.0%) |
| 30 to 34 Years | 724 (6.8%) | 735 (7.2%) |
| 35 to 39 Years | 803 (7.6%) | 754 (7.4%) |
| 40 to 44 Years | 612 (5.8%) | 705 (6.9%) |
| 45 to 49 Years | 582 (5.5%) | 664 (6.5%) |
| 50 to 54 Years | 799 (7.5%) | 676 (6.6%) |
| 55 to 59 Years | 793 (7.5%) | 768 (7.5%) |
| 60 to 64 Years | 632 (6.0%) | 793 (7.8%) |
| 65 to 69 Years | 514 (4.8%) | 385 (3.8%) |
| 70 to 74 Years | 401 (3.8%) | 340 (3.3%) |
| 75 to 79 Years | 185 (1.7%) | 280 (2.8%) |
| 80 to 84 Years | 97 (0.9%) | 86 (0.8%) |
| 85 Years and over | 130 (1.2%) | 206 (2.0%) |
| Total | 10,610 (100.0%) | 10,191 (100.0%) |
Families and Households in Grayslake
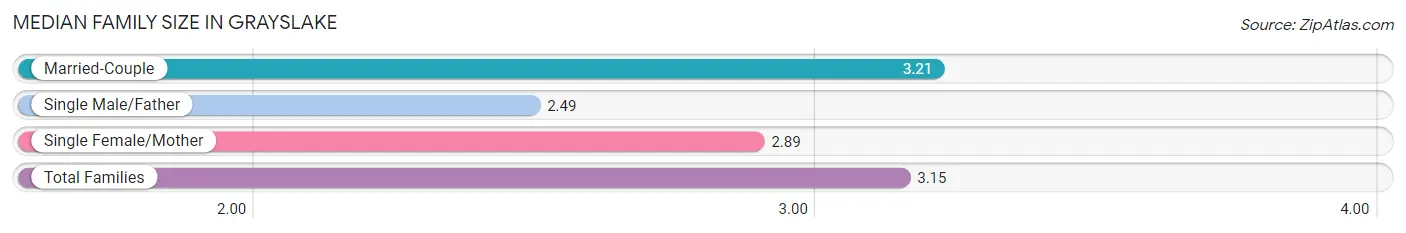
Median Family Size in Grayslake
The median family size in Grayslake is 3.15 persons per family, with married-couple families (4,642 | 84.7%) accounting for the largest median family size of 3.21 persons per family. On the other hand, single male/father families (150 | 2.7%) represent the smallest median family size with 2.49 persons per family.
| Family Type | # Families | Family Size |
| Married-Couple | 4,642 (84.7%) | 3.21 |
| Single Male/Father | 150 (2.7%) | 2.49 |
| Single Female/Mother | 691 (12.6%) | 2.89 |
| Total Families | 5,483 (100.0%) | 3.15 |
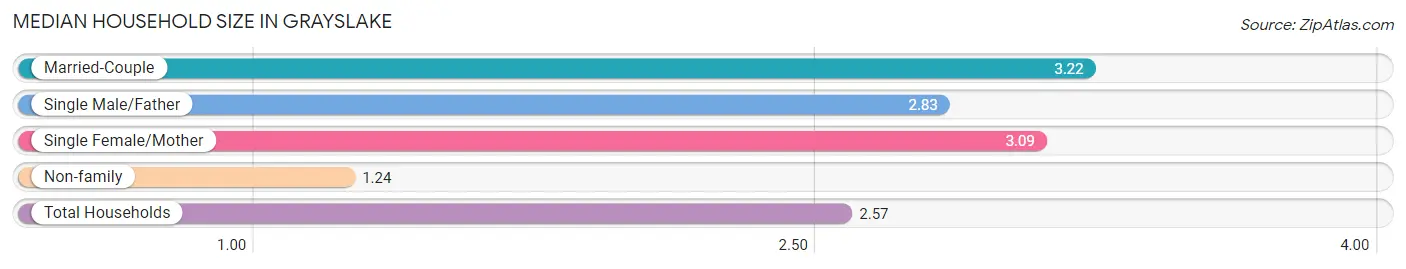
Median Household Size in Grayslake
The median household size in Grayslake is 2.57 persons per household, with married-couple households (4,642 | 57.6%) accounting for the largest median household size of 3.22 persons per household. non-family households (2,583 | 32.0%) represent the smallest median household size with 1.24 persons per household.
| Household Type | # Households | Household Size |
| Married-Couple | 4,642 (57.6%) | 3.22 |
| Single Male/Father | 150 (1.9%) | 2.83 |
| Single Female/Mother | 691 (8.6%) | 3.09 |
| Non-family | 2,583 (32.0%) | 1.24 |
| Total Households | 8,066 (100.0%) | 2.57 |
Household Size by Marriage Status in Grayslake
Out of a total of 8,066 households in Grayslake, 5,483 (68.0%) are family households, while 2,583 (32.0%) are nonfamily households. The most numerous type of family households are 2-person households, comprising 2,250, and the most common type of nonfamily households are 1-person households, comprising 2,097.
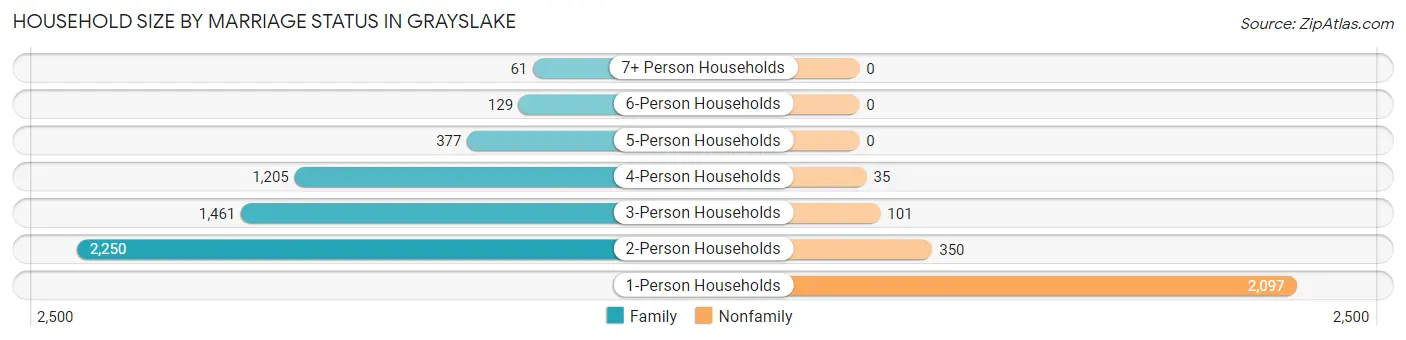
| Household Size | Family Households | Nonfamily Households |
| 1-Person Households | - | 2,097 (26.0%) |
| 2-Person Households | 2,250 (27.9%) | 350 (4.3%) |
| 3-Person Households | 1,461 (18.1%) | 101 (1.3%) |
| 4-Person Households | 1,205 (14.9%) | 35 (0.4%) |
| 5-Person Households | 377 (4.7%) | 0 (0.0%) |
| 6-Person Households | 129 (1.6%) | 0 (0.0%) |
| 7+ Person Households | 61 (0.8%) | 0 (0.0%) |
| Total | 5,483 (68.0%) | 2,583 (32.0%) |
Female Fertility in Grayslake
Fertility by Age in Grayslake
Average fertility rate in Grayslake is 36.0 births per 1,000 women. Women in the age bracket of 20 to 34 years have the highest fertility rate with 58.0 births per 1,000 women. Women in the age bracket of 20 to 34 years acount for 72.8% of all women with births.
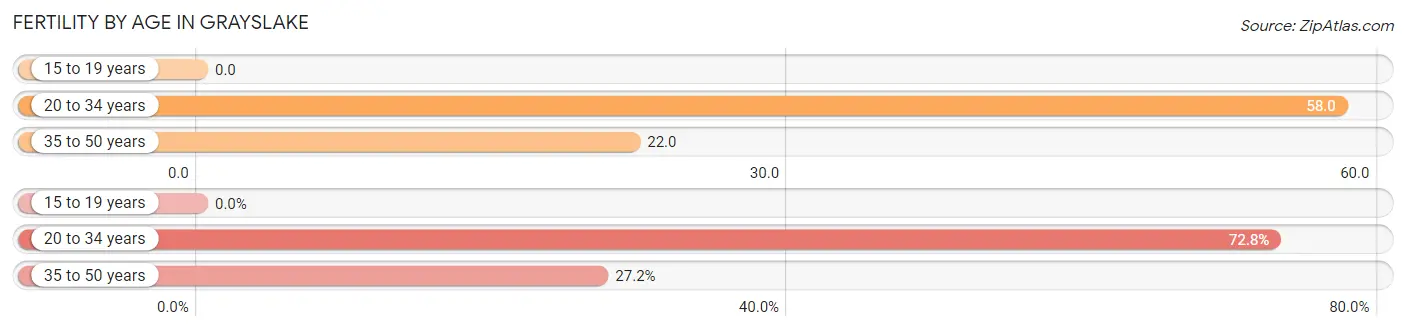
| Age Bracket | Women with Births | Births / 1,000 Women |
| 15 to 19 years | 0 (0.0%) | 0.0 |
| 20 to 34 years | 134 (72.8%) | 58.0 |
| 35 to 50 years | 50 (27.2%) | 22.0 |
| Total | 184 (100.0%) | 36.0 |
Fertility by Age by Marriage Status in Grayslake
85.3% of women with births (184) in Grayslake are married. The highest percentage of unmarried women with births falls into 20 to 34 years age bracket with 14.9% of them unmarried at the time of birth, while the lowest percentage of unmarried women with births belong to 35 to 50 years age bracket with 14.0% of them unmarried.
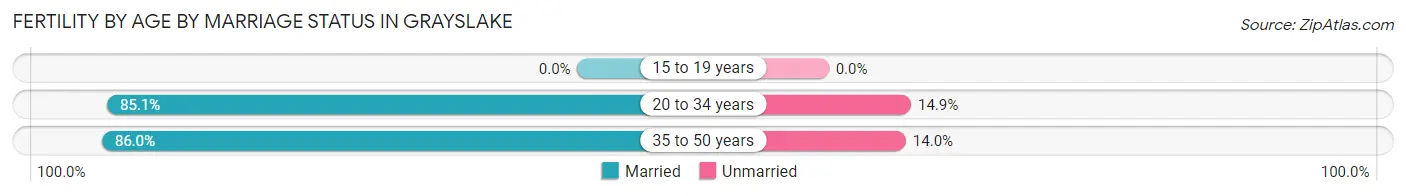
| Age Bracket | Married | Unmarried |
| 15 to 19 years | 0 (0.0%) | 0 (0.0%) |
| 20 to 34 years | 114 (85.1%) | 20 (14.9%) |
| 35 to 50 years | 43 (86.0%) | 7 (14.0%) |
| Total | 157 (85.3%) | 27 (14.7%) |
Fertility by Education in Grayslake
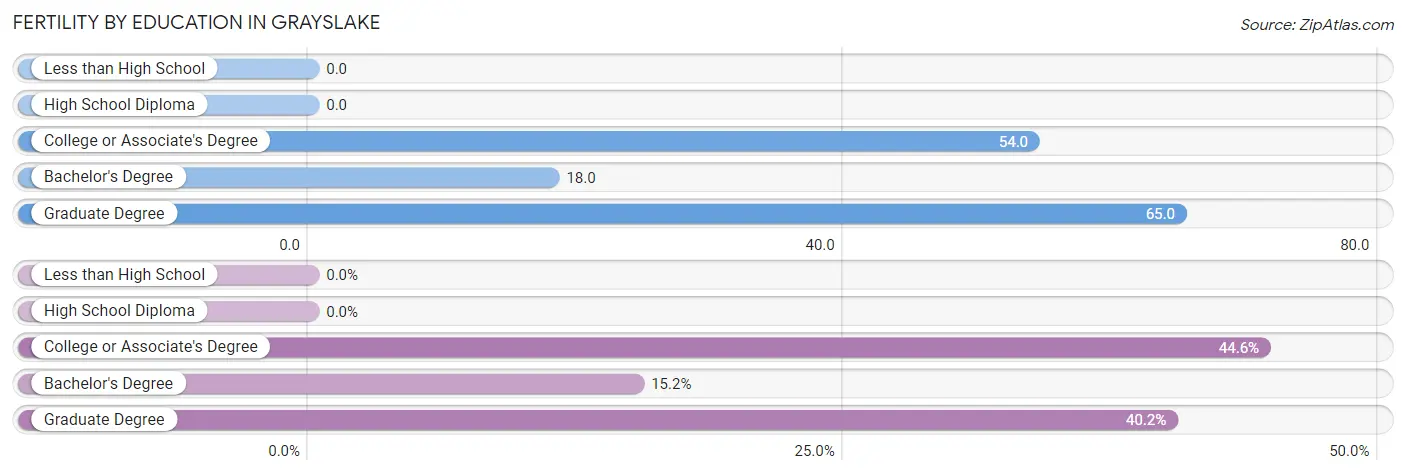
| Educational Attainment | Women with Births | Births / 1,000 Women |
| Less than High School | 0 (0.0%) | 0.0 |
| High School Diploma | 0 (0.0%) | 0.0 |
| College or Associate's Degree | 82 (44.6%) | 54.0 |
| Bachelor's Degree | 28 (15.2%) | 18.0 |
| Graduate Degree | 74 (40.2%) | 65.0 |
| Total | 184 (100.0%) | 36.0 |
Fertility by Education by Marriage Status in Grayslake
14.7% of women with births in Grayslake are unmarried. Women with the educational attainment of bachelor's degree are most likely to be married with 100.0% of them married at childbirth, while women with the educational attainment of college or associate's degree are least likely to be married with 32.9% of them unmarried at childbirth.
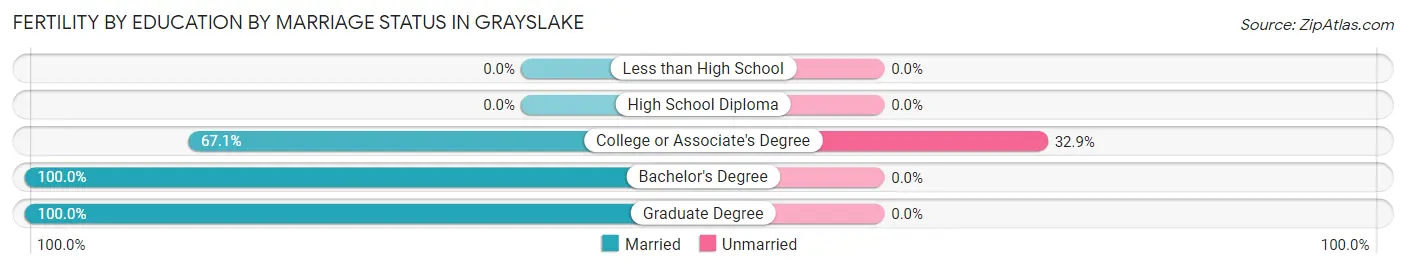
| Educational Attainment | Married | Unmarried |
| Less than High School | 0 (0.0%) | 0 (0.0%) |
| High School Diploma | 0 (0.0%) | 0 (0.0%) |
| College or Associate's Degree | 55 (67.1%) | 27 (32.9%) |
| Bachelor's Degree | 28 (100.0%) | 0 (0.0%) |
| Graduate Degree | 74 (100.0%) | 0 (0.0%) |
| Total | 157 (85.3%) | 27 (14.7%) |
Employment Characteristics in Grayslake
Employment by Class of Employer in Grayslake
Among the 11,334 employed individuals in Grayslake, private company employees (7,516 | 66.3%), not-for-profit organizations (1,251 | 11.0%), and local government employees (1,206 | 10.6%) make up the most common classes of employment.
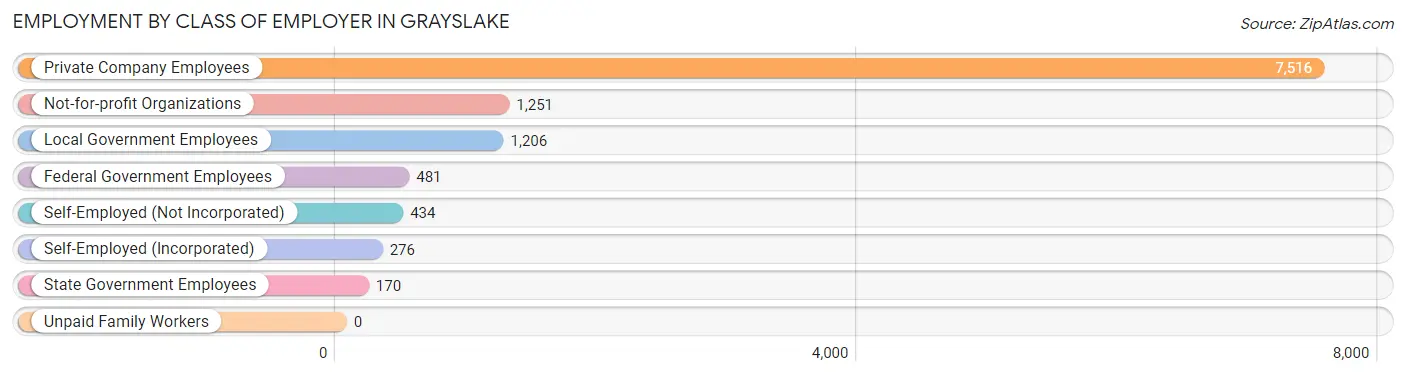
| Employer Class | # Employees | % Employees |
| Private Company Employees | 7,516 | 66.3% |
| Self-Employed (Incorporated) | 276 | 2.4% |
| Self-Employed (Not Incorporated) | 434 | 3.8% |
| Not-for-profit Organizations | 1,251 | 11.0% |
| Local Government Employees | 1,206 | 10.6% |
| State Government Employees | 170 | 1.5% |
| Federal Government Employees | 481 | 4.2% |
| Unpaid Family Workers | 0 | 0.0% |
| Total | 11,334 | 100.0% |
Employment Status by Age in Grayslake
According to the labor force statistics for Grayslake, out of the total population over 16 years of age (16,588), 73.3% or 12,159 individuals are in the labor force, with 6.2% or 754 of them unemployed. The age group with the highest labor force participation rate is 45 to 54 years, with 93.9% or 2,555 individuals in the labor force. Within the labor force, the 20 to 24 years age range has the highest percentage of unemployed individuals, with 25.9% or 305 of them being unemployed.
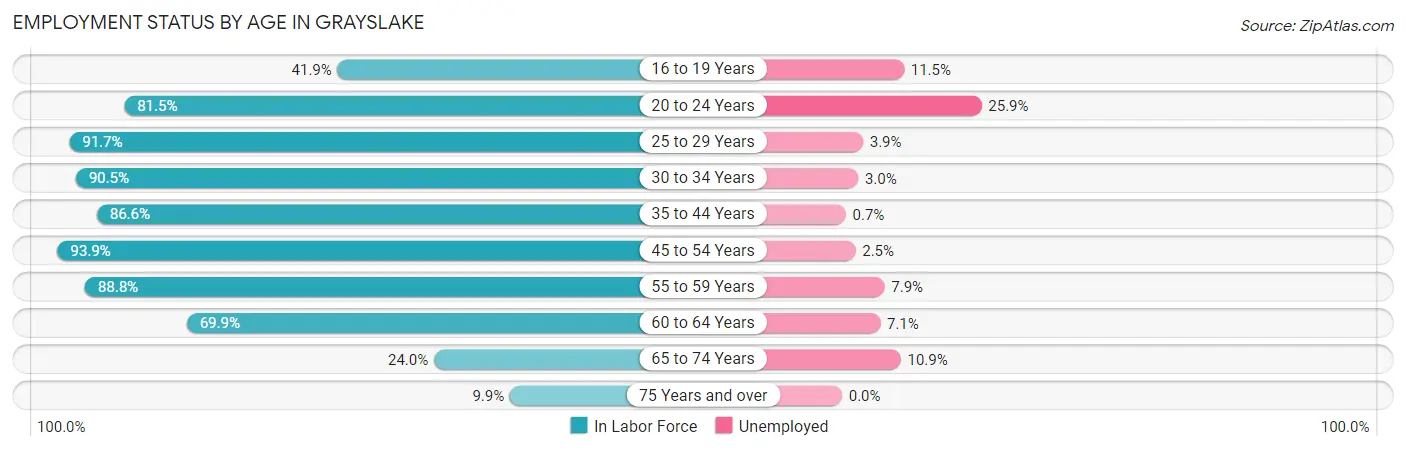
| Age Bracket | In Labor Force | Unemployed |
| 16 to 19 Years | 445 (41.9%) | 51 (11.5%) |
| 20 to 24 Years | 1,179 (81.5%) | 305 (25.9%) |
| 25 to 29 Years | 1,298 (91.7%) | 51 (3.9%) |
| 30 to 34 Years | 1,320 (90.5%) | 40 (3.0%) |
| 35 to 44 Years | 2,489 (86.6%) | 17 (0.7%) |
| 45 to 54 Years | 2,555 (93.9%) | 64 (2.5%) |
| 55 to 59 Years | 1,386 (88.8%) | 109 (7.9%) |
| 60 to 64 Years | 996 (69.9%) | 71 (7.1%) |
| 65 to 74 Years | 394 (24.0%) | 43 (10.9%) |
| 75 Years and over | 97 (9.9%) | 0 (0.0%) |
| Total | 12,159 (73.3%) | 754 (6.2%) |
Employment Status by Educational Attainment in Grayslake
According to labor force statistics for Grayslake, 87.7% of individuals (10,047) out of the total population between 25 and 64 years of age (11,456) are in the labor force, with 3.5% or 352 of them being unemployed. The group with the highest labor force participation rate are those with the educational attainment of college / associate degree, with 90.9% or 2,876 individuals in the labor force. Within the labor force, individuals with less than high school education have the highest percentage of unemployment, with 15.1% or 24 of them being unemployed.
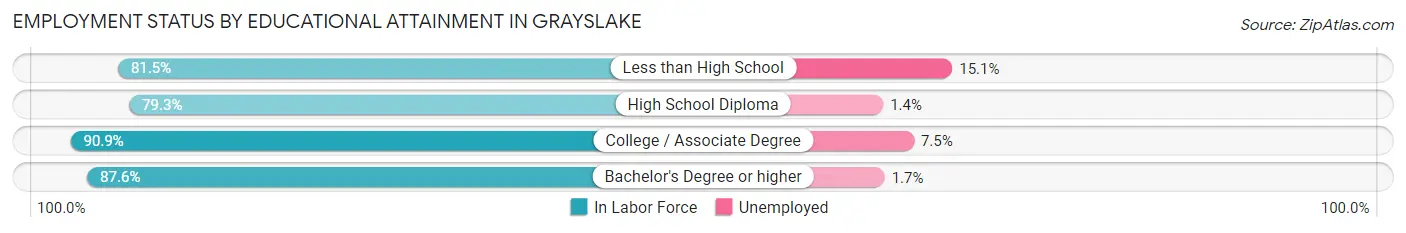
| Educational Attainment | In Labor Force | Unemployed |
| Less than High School | 159 (81.5%) | 29 (15.1%) |
| High School Diploma | 783 (79.3%) | 14 (1.4%) |
| College / Associate Degree | 2,876 (90.9%) | 237 (7.5%) |
| Bachelor's Degree or higher | 6,228 (87.6%) | 121 (1.7%) |
| Total | 10,047 (87.7%) | 401 (3.5%) |
Employment Occupations by Sex in Grayslake
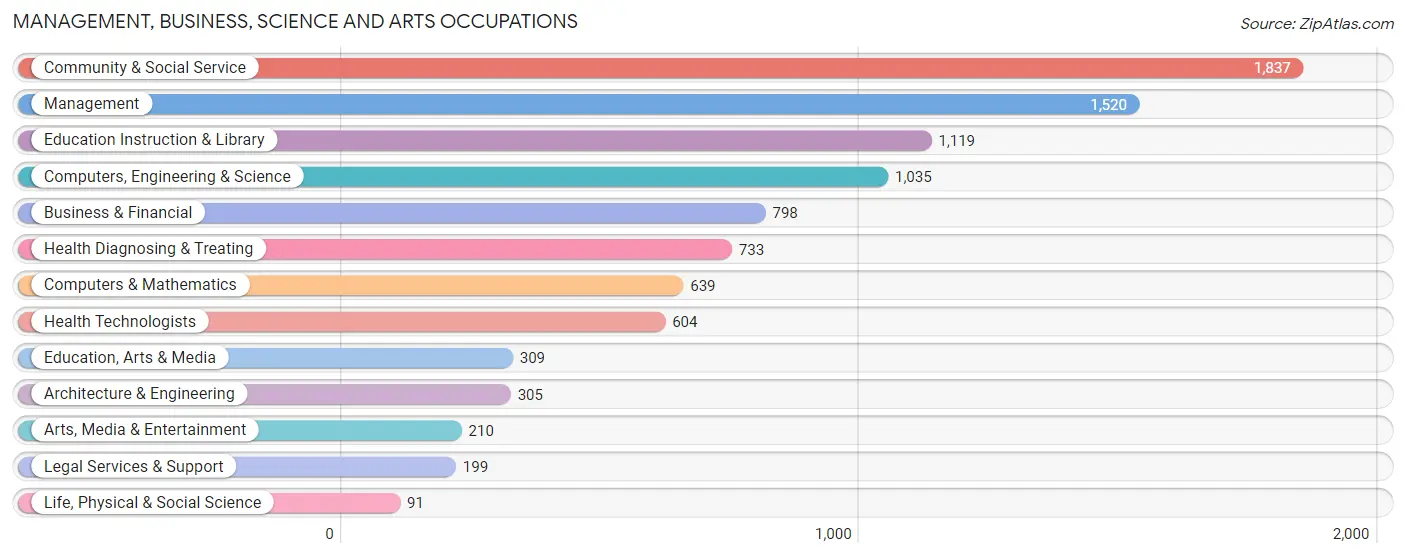
Management, Business, Science and Arts Occupations
The most common Management, Business, Science and Arts occupations in Grayslake are Community & Social Service (1,837 | 16.4%), Management (1,520 | 13.6%), Education Instruction & Library (1,119 | 10.0%), Computers, Engineering & Science (1,035 | 9.3%), and Business & Financial (798 | 7.1%).
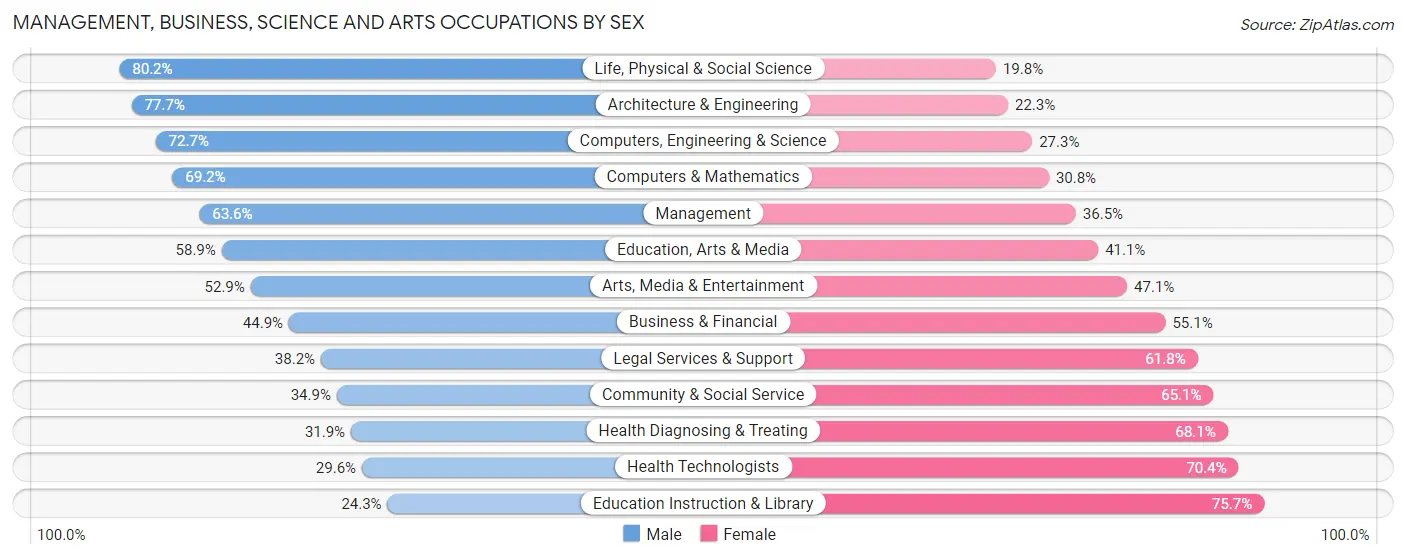
Management, Business, Science and Arts Occupations by Sex
Within the Management, Business, Science and Arts occupations in Grayslake, the most male-oriented occupations are Life, Physical & Social Science (80.2%), Architecture & Engineering (77.7%), and Computers, Engineering & Science (72.7%), while the most female-oriented occupations are Education Instruction & Library (75.7%), Health Technologists (70.4%), and Health Diagnosing & Treating (68.1%).
| Occupation | Male | Female |
| Management | 966 (63.5%) | 554 (36.4%) |
| Business & Financial | 358 (44.9%) | 440 (55.1%) |
| Computers, Engineering & Science | 752 (72.7%) | 283 (27.3%) |
| Computers & Mathematics | 442 (69.2%) | 197 (30.8%) |
| Architecture & Engineering | 237 (77.7%) | 68 (22.3%) |
| Life, Physical & Social Science | 73 (80.2%) | 18 (19.8%) |
| Community & Social Service | 641 (34.9%) | 1,196 (65.1%) |
| Education, Arts & Media | 182 (58.9%) | 127 (41.1%) |
| Legal Services & Support | 76 (38.2%) | 123 (61.8%) |
| Education Instruction & Library | 272 (24.3%) | 847 (75.7%) |
| Arts, Media & Entertainment | 111 (52.9%) | 99 (47.1%) |
| Health Diagnosing & Treating | 234 (31.9%) | 499 (68.1%) |
| Health Technologists | 179 (29.6%) | 425 (70.4%) |
| Total (Category) | 2,951 (49.8%) | 2,972 (50.2%) |
| Total (Overall) | 5,977 (53.5%) | 5,200 (46.5%) |
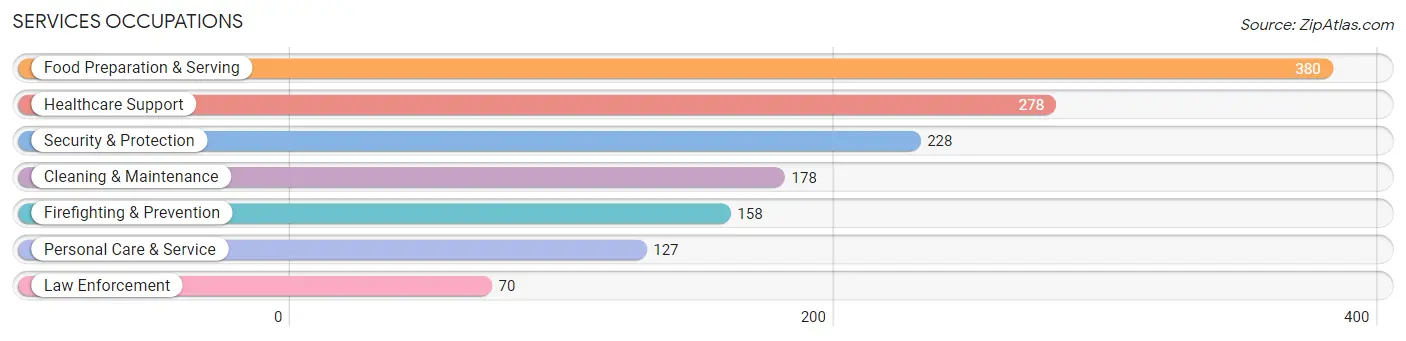
Services Occupations
The most common Services occupations in Grayslake are Food Preparation & Serving (380 | 3.4%), Healthcare Support (278 | 2.5%), Security & Protection (228 | 2.0%), Cleaning & Maintenance (178 | 1.6%), and Firefighting & Prevention (158 | 1.4%).
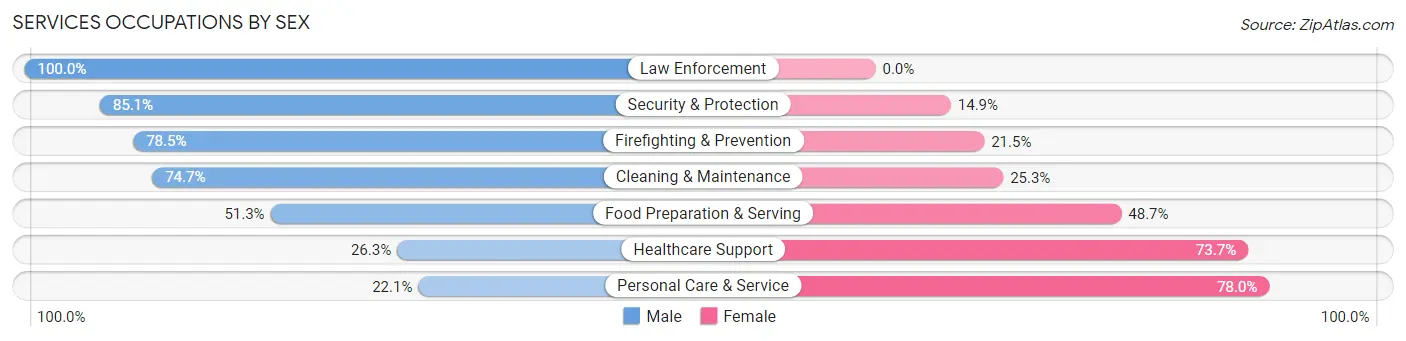
Services Occupations by Sex
Within the Services occupations in Grayslake, the most male-oriented occupations are Law Enforcement (100.0%), Security & Protection (85.1%), and Firefighting & Prevention (78.5%), while the most female-oriented occupations are Personal Care & Service (77.9%), Healthcare Support (73.7%), and Food Preparation & Serving (48.7%).
| Occupation | Male | Female |
| Healthcare Support | 73 (26.3%) | 205 (73.7%) |
| Security & Protection | 194 (85.1%) | 34 (14.9%) |
| Firefighting & Prevention | 124 (78.5%) | 34 (21.5%) |
| Law Enforcement | 70 (100.0%) | 0 (0.0%) |
| Food Preparation & Serving | 195 (51.3%) | 185 (48.7%) |
| Cleaning & Maintenance | 133 (74.7%) | 45 (25.3%) |
| Personal Care & Service | 28 (22.1%) | 99 (77.9%) |
| Total (Category) | 623 (52.3%) | 568 (47.7%) |
| Total (Overall) | 5,977 (53.5%) | 5,200 (46.5%) |
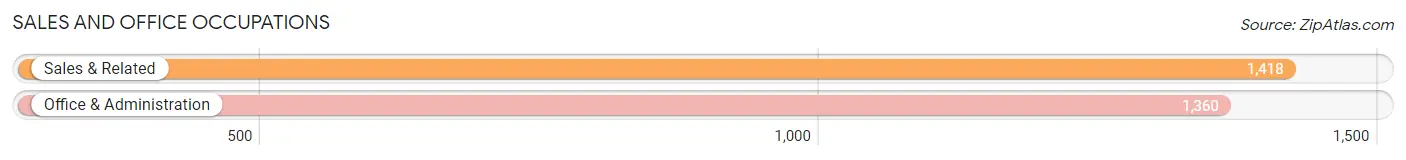
Sales and Office Occupations
The most common Sales and Office occupations in Grayslake are Sales & Related (1,418 | 12.7%), and Office & Administration (1,360 | 12.2%).
Sales and Office Occupations by Sex
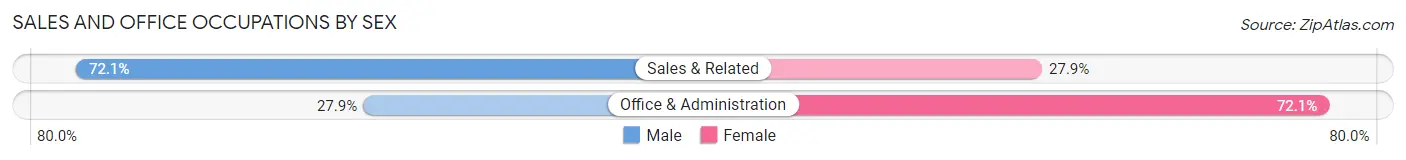
| Occupation | Male | Female |
| Sales & Related | 1,022 (72.1%) | 396 (27.9%) |
| Office & Administration | 380 (27.9%) | 980 (72.1%) |
| Total (Category) | 1,402 (50.5%) | 1,376 (49.5%) |
| Total (Overall) | 5,977 (53.5%) | 5,200 (46.5%) |
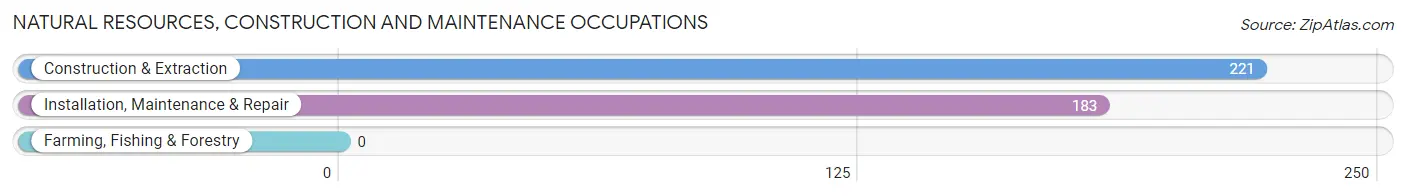
Natural Resources, Construction and Maintenance Occupations
The most common Natural Resources, Construction and Maintenance occupations in Grayslake are Construction & Extraction (221 | 2.0%), and Installation, Maintenance & Repair (183 | 1.6%).
Natural Resources, Construction and Maintenance Occupations by Sex
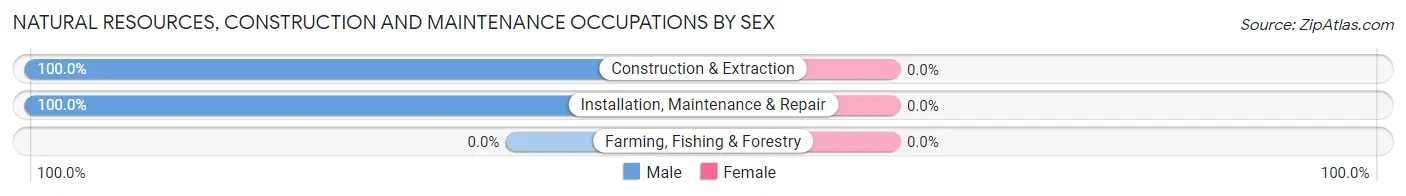
| Occupation | Male | Female |
| Farming, Fishing & Forestry | 0 (0.0%) | 0 (0.0%) |
| Construction & Extraction | 221 (100.0%) | 0 (0.0%) |
| Installation, Maintenance & Repair | 183 (100.0%) | 0 (0.0%) |
| Total (Category) | 404 (100.0%) | 0 (0.0%) |
| Total (Overall) | 5,977 (53.5%) | 5,200 (46.5%) |
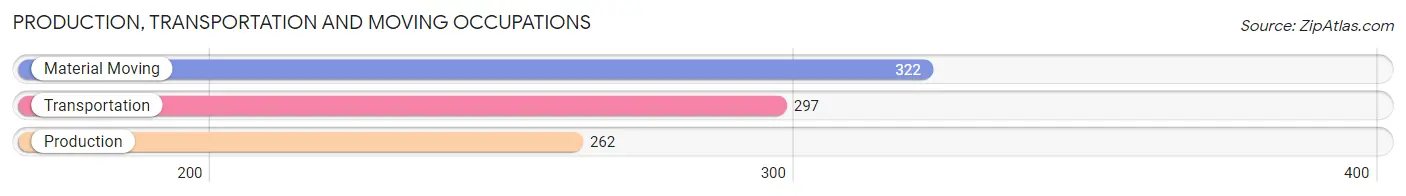
Production, Transportation and Moving Occupations
The most common Production, Transportation and Moving occupations in Grayslake are Material Moving (322 | 2.9%), Transportation (297 | 2.7%), and Production (262 | 2.3%).
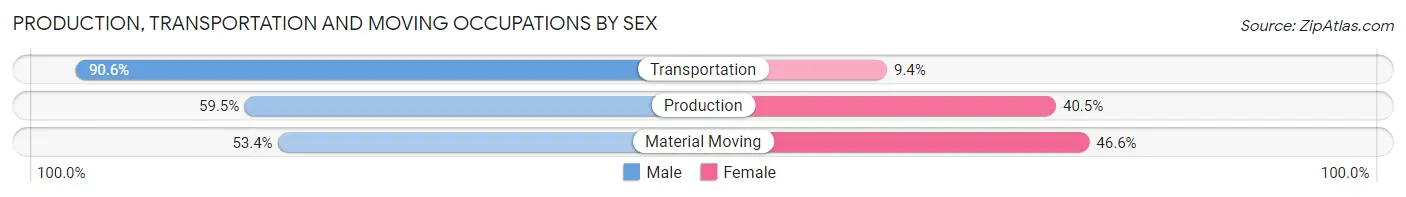
Production, Transportation and Moving Occupations by Sex
| Occupation | Male | Female |
| Production | 156 (59.5%) | 106 (40.5%) |
| Transportation | 269 (90.6%) | 28 (9.4%) |
| Material Moving | 172 (53.4%) | 150 (46.6%) |
| Total (Category) | 597 (67.8%) | 284 (32.2%) |
| Total (Overall) | 5,977 (53.5%) | 5,200 (46.5%) |
Employment Industries by Sex in Grayslake
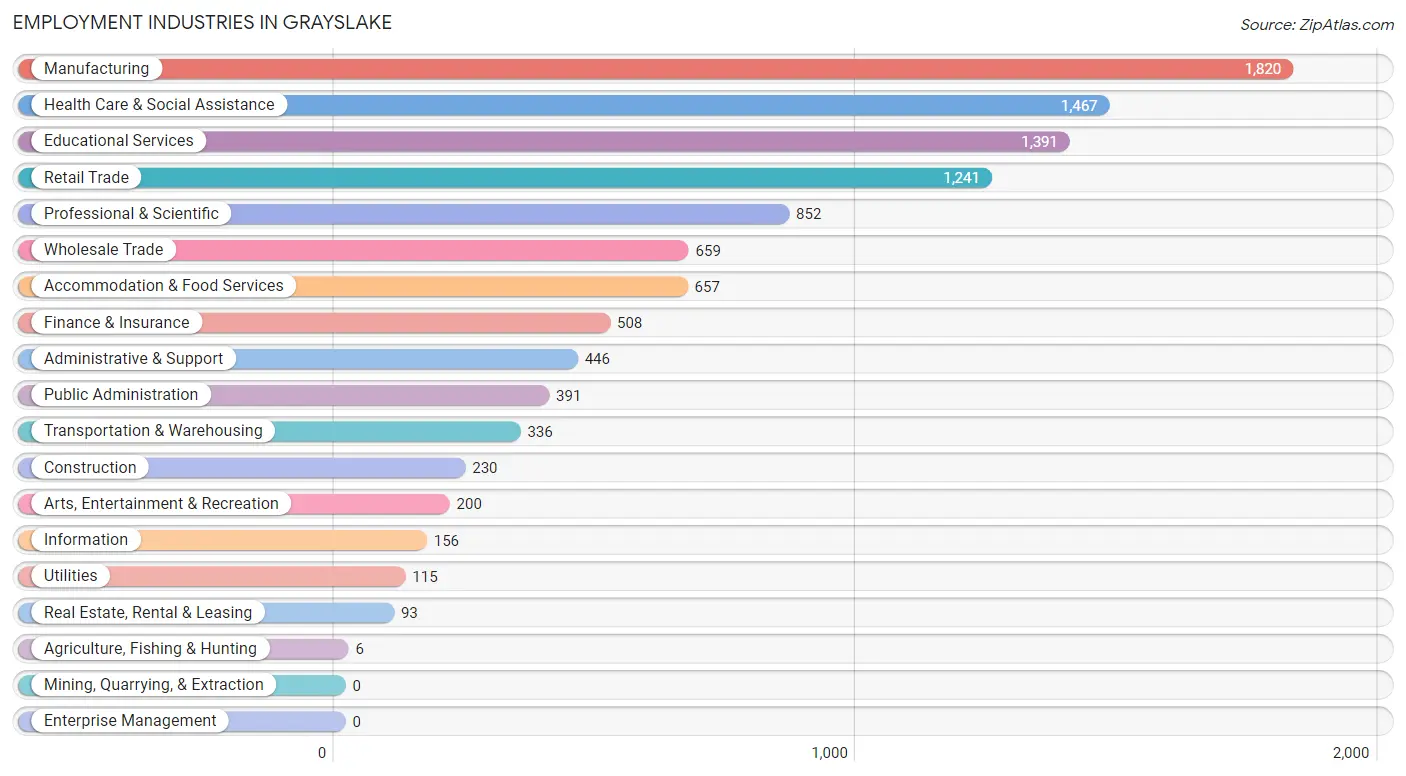
Employment Industries in Grayslake
The major employment industries in Grayslake include Manufacturing (1,820 | 16.3%), Health Care & Social Assistance (1,467 | 13.1%), Educational Services (1,391 | 12.4%), Retail Trade (1,241 | 11.1%), and Professional & Scientific (852 | 7.6%).
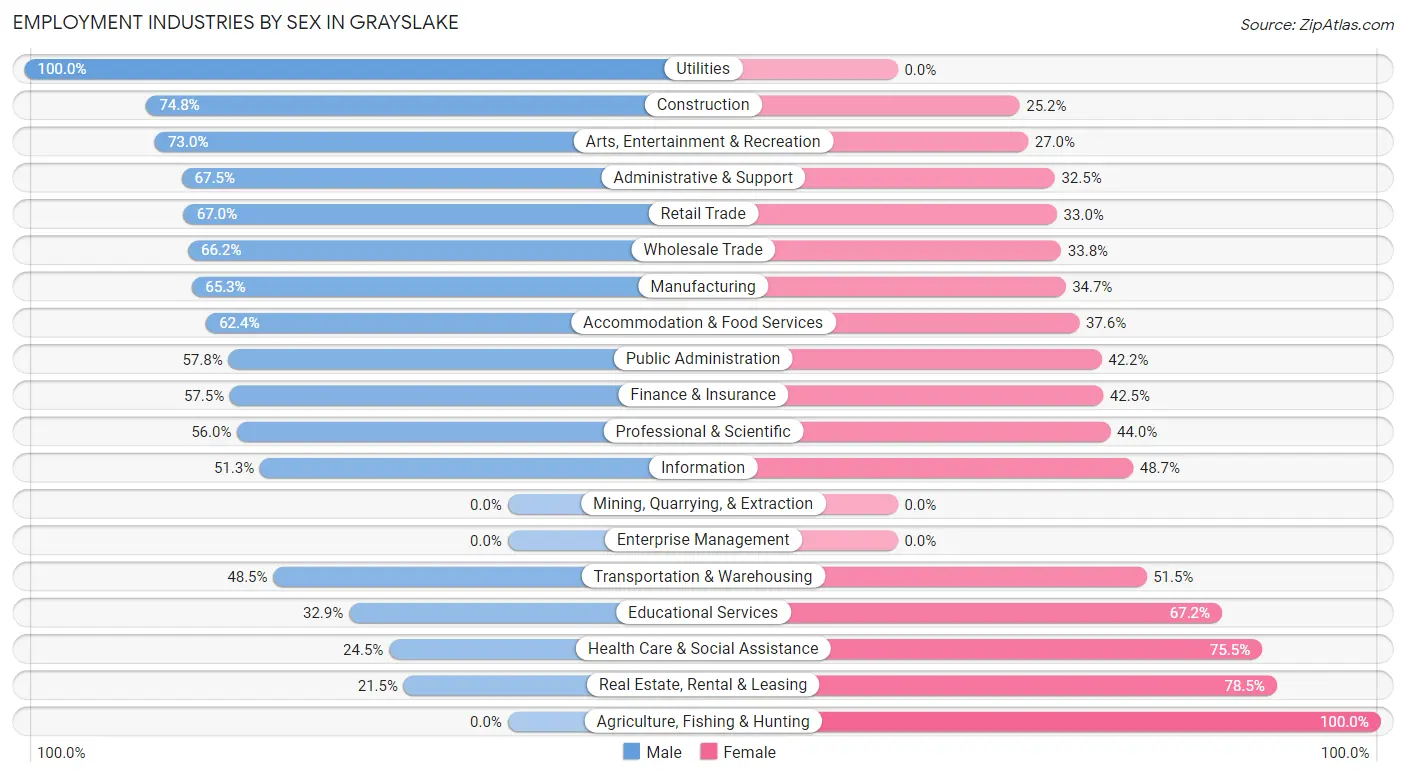
Employment Industries by Sex in Grayslake
The Grayslake industries that see more men than women are Utilities (100.0%), Construction (74.8%), and Arts, Entertainment & Recreation (73.0%), whereas the industries that tend to have a higher number of women are Agriculture, Fishing & Hunting (100.0%), Real Estate, Rental & Leasing (78.5%), and Health Care & Social Assistance (75.5%).
| Industry | Male | Female |
| Agriculture, Fishing & Hunting | 0 (0.0%) | 6 (100.0%) |
| Mining, Quarrying, & Extraction | 0 (0.0%) | 0 (0.0%) |
| Construction | 172 (74.8%) | 58 (25.2%) |
| Manufacturing | 1,188 (65.3%) | 632 (34.7%) |
| Wholesale Trade | 436 (66.2%) | 223 (33.8%) |
| Retail Trade | 832 (67.0%) | 409 (33.0%) |
| Transportation & Warehousing | 163 (48.5%) | 173 (51.5%) |
| Utilities | 115 (100.0%) | 0 (0.0%) |
| Information | 80 (51.3%) | 76 (48.7%) |
| Finance & Insurance | 292 (57.5%) | 216 (42.5%) |
| Real Estate, Rental & Leasing | 20 (21.5%) | 73 (78.5%) |
| Professional & Scientific | 477 (56.0%) | 375 (44.0%) |
| Enterprise Management | 0 (0.0%) | 0 (0.0%) |
| Administrative & Support | 301 (67.5%) | 145 (32.5%) |
| Educational Services | 457 (32.9%) | 934 (67.1%) |
| Health Care & Social Assistance | 360 (24.5%) | 1,107 (75.5%) |
| Arts, Entertainment & Recreation | 146 (73.0%) | 54 (27.0%) |
| Accommodation & Food Services | 410 (62.4%) | 247 (37.6%) |
| Public Administration | 226 (57.8%) | 165 (42.2%) |
| Total | 5,977 (53.5%) | 5,200 (46.5%) |
Education in Grayslake
School Enrollment in Grayslake
The most common levels of schooling among the 5,333 students in Grayslake are high school (1,184 | 22.2%), middle school (1,110 | 20.8%), and college / undergraduate (1,010 | 18.9%).
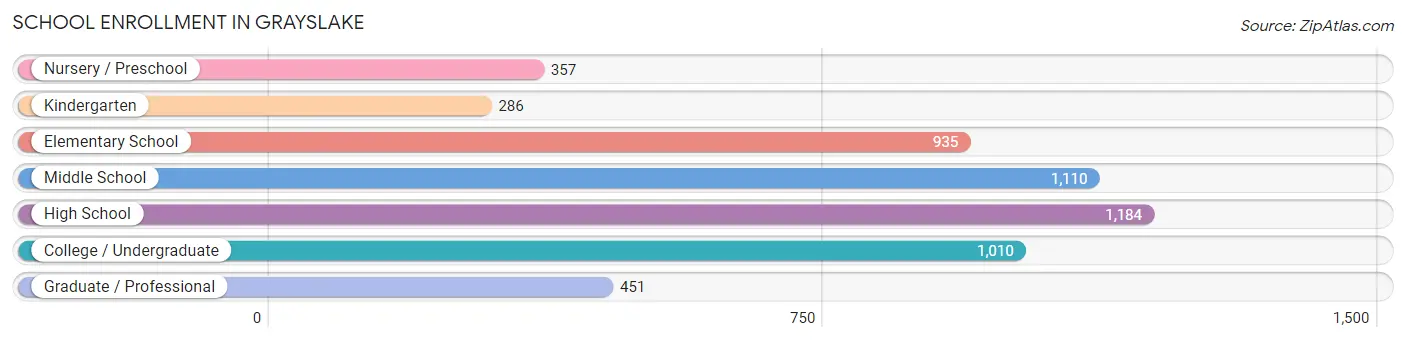
| School Level | # Students | % Students |
| Nursery / Preschool | 357 | 6.7% |
| Kindergarten | 286 | 5.4% |
| Elementary School | 935 | 17.5% |
| Middle School | 1,110 | 20.8% |
| High School | 1,184 | 22.2% |
| College / Undergraduate | 1,010 | 18.9% |
| Graduate / Professional | 451 | 8.5% |
| Total | 5,333 | 100.0% |
School Enrollment by Age by Funding Source in Grayslake
Out of a total of 5,333 students who are enrolled in schools in Grayslake, 795 (14.9%) attend a private institution, while the remaining 4,538 (85.1%) are enrolled in public schools. The age group of 25 to 34 year olds has the highest likelihood of being enrolled in private schools, with 156 (54.0% in the age bracket) enrolled. Conversely, the age group of 18 to 19 year olds has the lowest likelihood of being enrolled in a private school, with 351 (96.4% in the age bracket) attending a public institution.
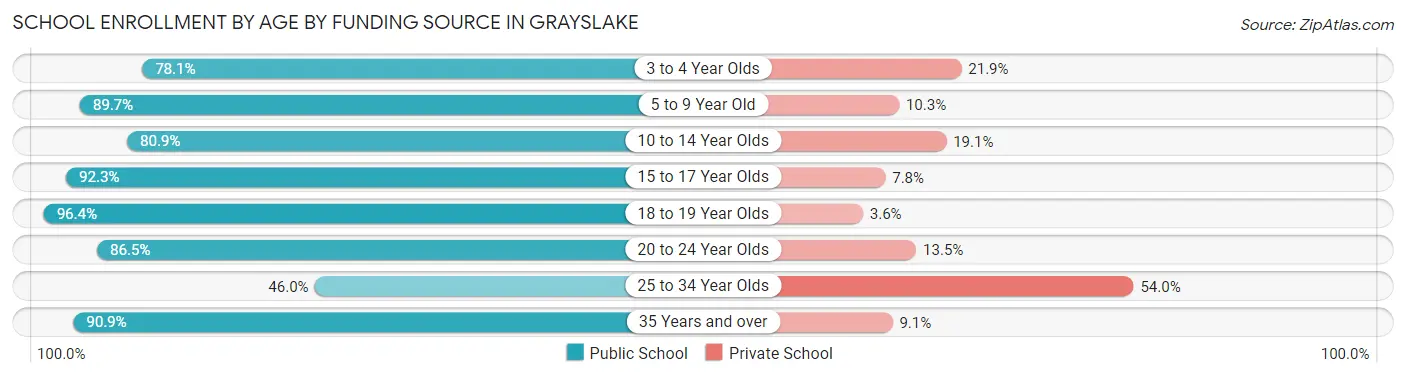
| Age Bracket | Public School | Private School |
| 3 to 4 Year Olds | 228 (78.1%) | 64 (21.9%) |
| 5 to 9 Year Old | 1,071 (89.7%) | 123 (10.3%) |
| 10 to 14 Year Olds | 1,042 (80.9%) | 246 (19.1%) |
| 15 to 17 Year Olds | 821 (92.2%) | 69 (7.7%) |
| 18 to 19 Year Olds | 351 (96.4%) | 13 (3.6%) |
| 20 to 24 Year Olds | 660 (86.5%) | 103 (13.5%) |
| 25 to 34 Year Olds | 133 (46.0%) | 156 (54.0%) |
| 35 Years and over | 230 (90.9%) | 23 (9.1%) |
| Total | 4,538 (85.1%) | 795 (14.9%) |
Educational Attainment by Field of Study in Grayslake
Business (1,876 | 21.1%), engineering (886 | 10.0%), social sciences (834 | 9.4%), science & technology (788 | 8.9%), and arts & humanities (725 | 8.2%) are the most common fields of study among 8,880 individuals in Grayslake who have obtained a bachelor's degree or higher.
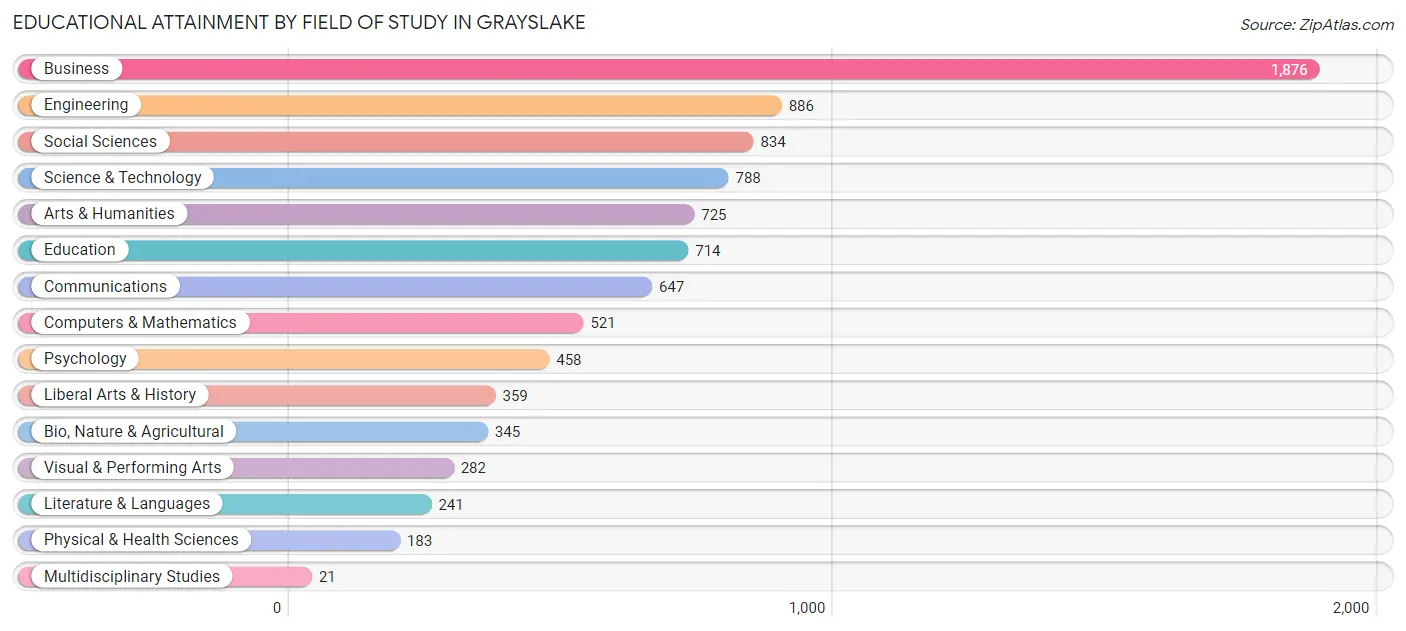
| Field of Study | # Graduates | % Graduates |
| Computers & Mathematics | 521 | 5.9% |
| Bio, Nature & Agricultural | 345 | 3.9% |
| Physical & Health Sciences | 183 | 2.1% |
| Psychology | 458 | 5.2% |
| Social Sciences | 834 | 9.4% |
| Engineering | 886 | 10.0% |
| Multidisciplinary Studies | 21 | 0.2% |
| Science & Technology | 788 | 8.9% |
| Business | 1,876 | 21.1% |
| Education | 714 | 8.0% |
| Literature & Languages | 241 | 2.7% |
| Liberal Arts & History | 359 | 4.0% |
| Visual & Performing Arts | 282 | 3.2% |
| Communications | 647 | 7.3% |
| Arts & Humanities | 725 | 8.2% |
| Total | 8,880 | 100.0% |
Transportation & Commute in Grayslake
Vehicle Availability by Sex in Grayslake
The most prevalent vehicle ownership categories in Grayslake are males with 2 vehicles (3,311, accounting for 54.6%) and females with 2 vehicles (2,766, making up 63.2%).
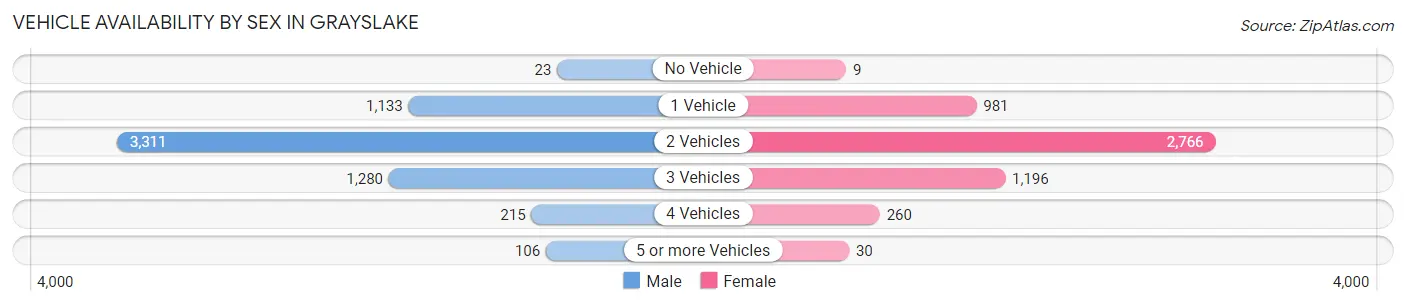
| Vehicles Available | Male | Female |
| No Vehicle | 23 (0.4%) | 9 (0.2%) |
| 1 Vehicle | 1,133 (18.7%) | 981 (18.7%) |
| 2 Vehicles | 3,311 (54.6%) | 2,766 (52.8%) |
| 3 Vehicles | 1,280 (21.1%) | 1,196 (22.8%) |
| 4 Vehicles | 215 (3.5%) | 260 (5.0%) |
| 5 or more Vehicles | 106 (1.8%) | 30 (0.6%) |
| Total | 6,068 (100.0%) | 5,242 (100.0%) |
Commute Time in Grayslake
The most frequently occuring commute durations in Grayslake are 20 to 24 minutes (1,533 commuters, 16.0%), 30 to 34 minutes (1,515 commuters, 15.8%), and 25 to 29 minutes (1,203 commuters, 12.5%).
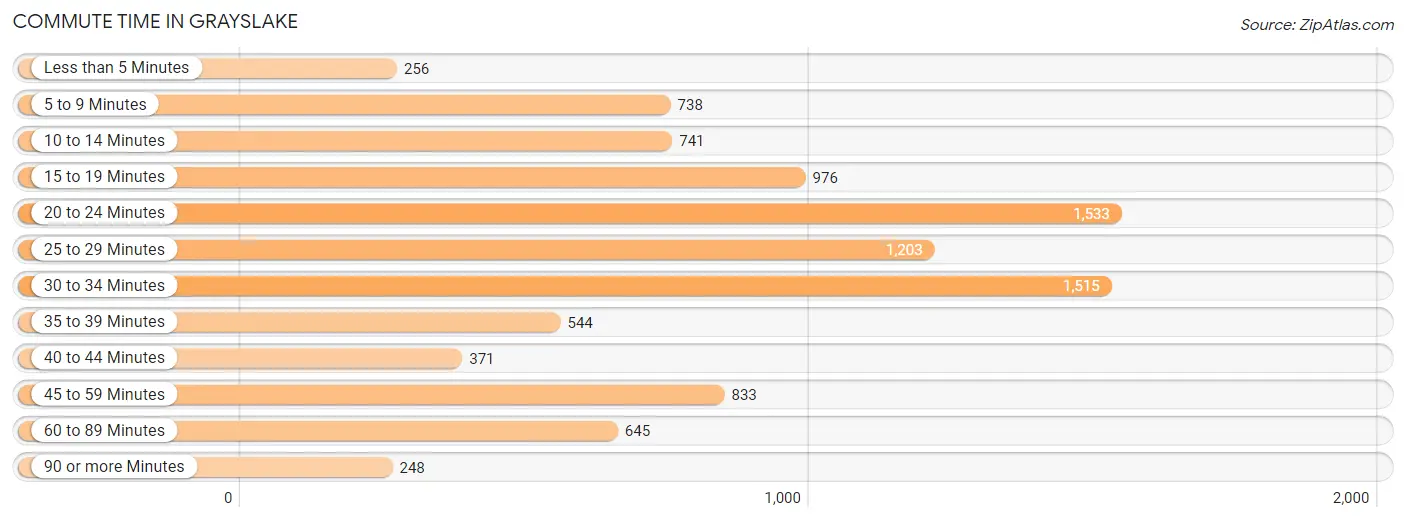
| Commute Time | # Commuters | % Commuters |
| Less than 5 Minutes | 256 | 2.7% |
| 5 to 9 Minutes | 738 | 7.7% |
| 10 to 14 Minutes | 741 | 7.7% |
| 15 to 19 Minutes | 976 | 10.2% |
| 20 to 24 Minutes | 1,533 | 16.0% |
| 25 to 29 Minutes | 1,203 | 12.5% |
| 30 to 34 Minutes | 1,515 | 15.8% |
| 35 to 39 Minutes | 544 | 5.7% |
| 40 to 44 Minutes | 371 | 3.9% |
| 45 to 59 Minutes | 833 | 8.7% |
| 60 to 89 Minutes | 645 | 6.7% |
| 90 or more Minutes | 248 | 2.6% |
Commute Time by Sex in Grayslake
The most common commute times in Grayslake are 30 to 34 minutes (885 commuters, 16.9%) for males and 20 to 24 minutes (792 commuters, 18.2%) for females.
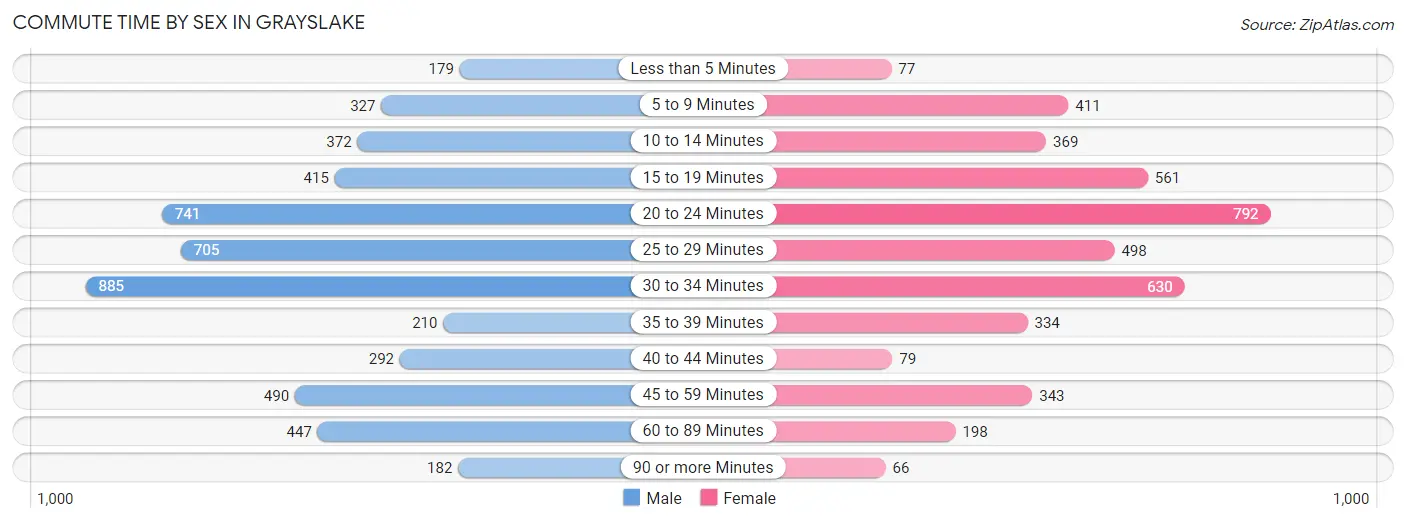
| Commute Time | Male | Female |
| Less than 5 Minutes | 179 (3.4%) | 77 (1.8%) |
| 5 to 9 Minutes | 327 (6.2%) | 411 (9.4%) |
| 10 to 14 Minutes | 372 (7.1%) | 369 (8.5%) |
| 15 to 19 Minutes | 415 (7.9%) | 561 (12.9%) |
| 20 to 24 Minutes | 741 (14.1%) | 792 (18.2%) |
| 25 to 29 Minutes | 705 (13.4%) | 498 (11.4%) |
| 30 to 34 Minutes | 885 (16.9%) | 630 (14.5%) |
| 35 to 39 Minutes | 210 (4.0%) | 334 (7.7%) |
| 40 to 44 Minutes | 292 (5.6%) | 79 (1.8%) |
| 45 to 59 Minutes | 490 (9.3%) | 343 (7.9%) |
| 60 to 89 Minutes | 447 (8.5%) | 198 (4.5%) |
| 90 or more Minutes | 182 (3.5%) | 66 (1.5%) |
Time of Departure to Work by Sex in Grayslake
The most frequent times of departure to work in Grayslake are 7:00 AM to 7:29 AM (982, 18.7%) for males and 7:30 AM to 7:59 AM (894, 20.5%) for females.
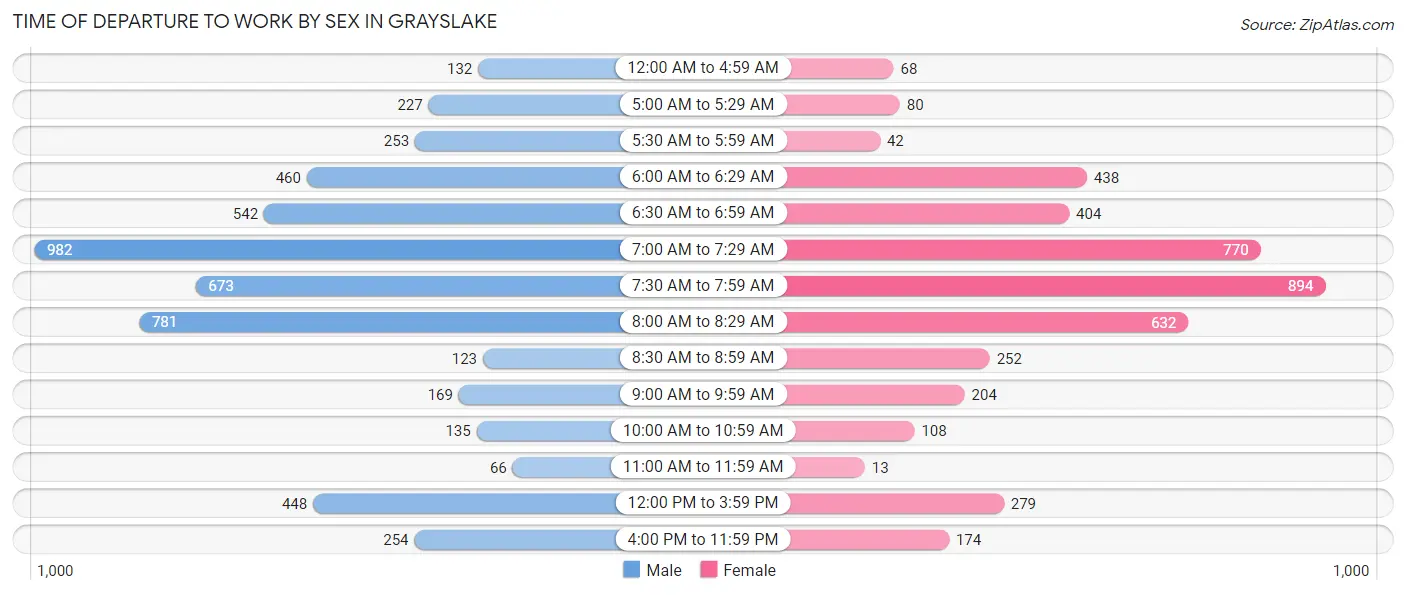
| Time of Departure | Male | Female |
| 12:00 AM to 4:59 AM | 132 (2.5%) | 68 (1.6%) |
| 5:00 AM to 5:29 AM | 227 (4.3%) | 80 (1.8%) |
| 5:30 AM to 5:59 AM | 253 (4.8%) | 42 (1.0%) |
| 6:00 AM to 6:29 AM | 460 (8.8%) | 438 (10.1%) |
| 6:30 AM to 6:59 AM | 542 (10.3%) | 404 (9.3%) |
| 7:00 AM to 7:29 AM | 982 (18.7%) | 770 (17.7%) |
| 7:30 AM to 7:59 AM | 673 (12.8%) | 894 (20.5%) |
| 8:00 AM to 8:29 AM | 781 (14.9%) | 632 (14.5%) |
| 8:30 AM to 8:59 AM | 123 (2.4%) | 252 (5.8%) |
| 9:00 AM to 9:59 AM | 169 (3.2%) | 204 (4.7%) |
| 10:00 AM to 10:59 AM | 135 (2.6%) | 108 (2.5%) |
| 11:00 AM to 11:59 AM | 66 (1.3%) | 13 (0.3%) |
| 12:00 PM to 3:59 PM | 448 (8.5%) | 279 (6.4%) |
| 4:00 PM to 11:59 PM | 254 (4.8%) | 174 (4.0%) |
| Total | 5,245 (100.0%) | 4,358 (100.0%) |
Housing Occupancy in Grayslake
Occupancy by Ownership in Grayslake
Of the total 8,066 dwellings in Grayslake, owner-occupied units account for 6,011 (74.5%), while renter-occupied units make up 2,055 (25.5%).
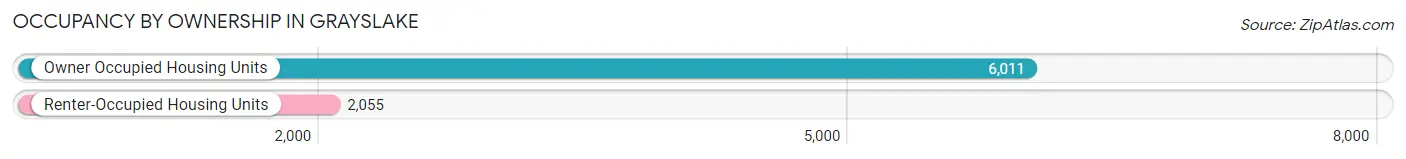
| Occupancy | # Housing Units | % Housing Units |
| Owner Occupied Housing Units | 6,011 | 74.5% |
| Renter-Occupied Housing Units | 2,055 | 25.5% |
| Total Occupied Housing Units | 8,066 | 100.0% |
Occupancy by Household Size in Grayslake
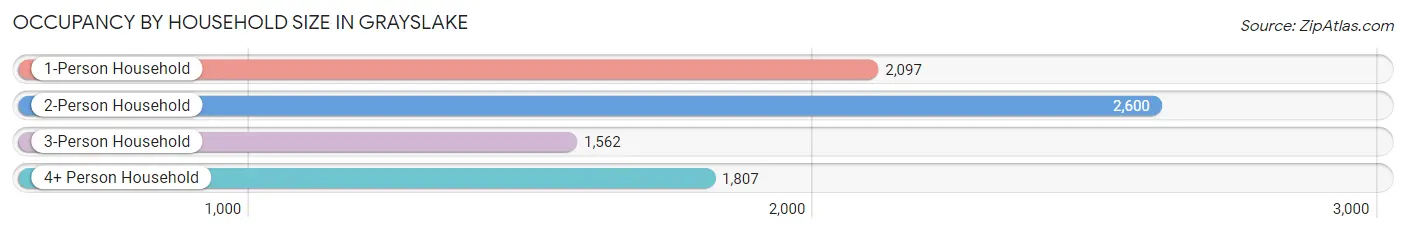
| Household Size | # Housing Units | % Housing Units |
| 1-Person Household | 2,097 | 26.0% |
| 2-Person Household | 2,600 | 32.2% |
| 3-Person Household | 1,562 | 19.4% |
| 4+ Person Household | 1,807 | 22.4% |
| Total Housing Units | 8,066 | 100.0% |
Occupancy by Ownership by Household Size in Grayslake
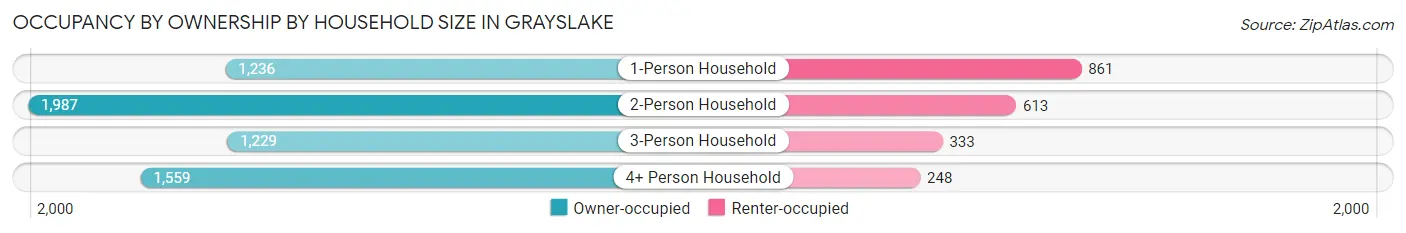
| Household Size | Owner-occupied | Renter-occupied |
| 1-Person Household | 1,236 (58.9%) | 861 (41.1%) |
| 2-Person Household | 1,987 (76.4%) | 613 (23.6%) |
| 3-Person Household | 1,229 (78.7%) | 333 (21.3%) |
| 4+ Person Household | 1,559 (86.3%) | 248 (13.7%) |
| Total Housing Units | 6,011 (74.5%) | 2,055 (25.5%) |
Occupancy by Educational Attainment in Grayslake
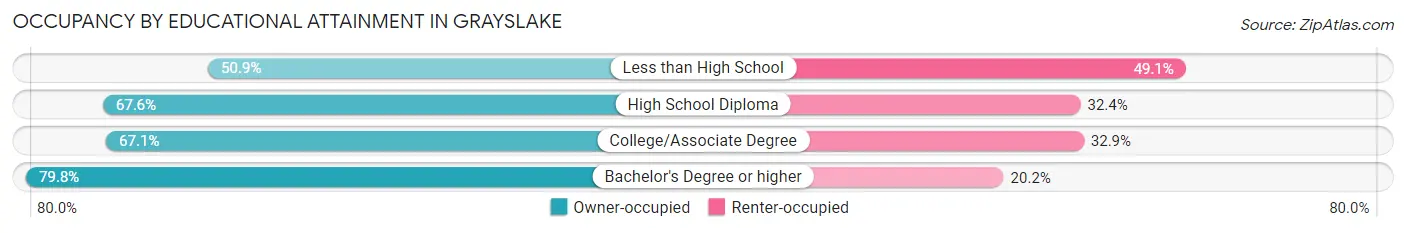
| Household Size | Owner-occupied | Renter-occupied |
| Less than High School | 84 (50.9%) | 81 (49.1%) |
| High School Diploma | 542 (67.6%) | 260 (32.4%) |
| College/Associate Degree | 1,470 (67.1%) | 722 (32.9%) |
| Bachelor's Degree or higher | 3,915 (79.8%) | 992 (20.2%) |
Occupancy by Age of Householder in Grayslake
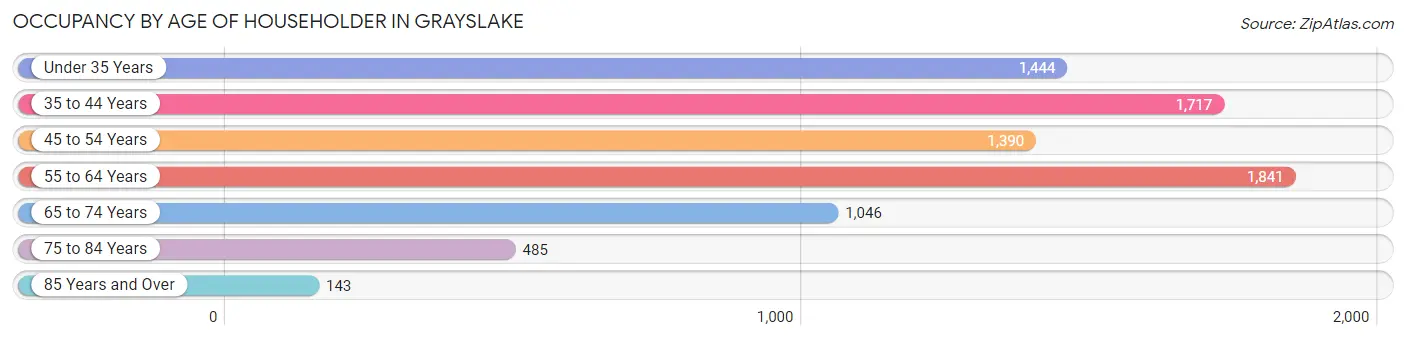
| Age Bracket | # Households | % Households |
| Under 35 Years | 1,444 | 17.9% |
| 35 to 44 Years | 1,717 | 21.3% |
| 45 to 54 Years | 1,390 | 17.2% |
| 55 to 64 Years | 1,841 | 22.8% |
| 65 to 74 Years | 1,046 | 13.0% |
| 75 to 84 Years | 485 | 6.0% |
| 85 Years and Over | 143 | 1.8% |
| Total | 8,066 | 100.0% |
Housing Finances in Grayslake
Median Income by Occupancy in Grayslake
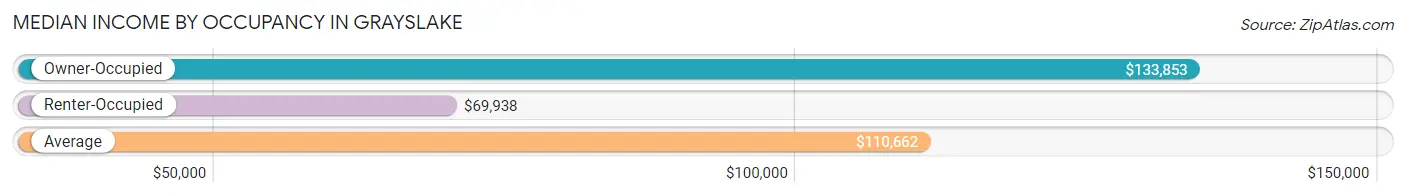
| Occupancy Type | # Households | Median Income |
| Owner-Occupied | 6,011 (74.5%) | $133,853 |
| Renter-Occupied | 2,055 (25.5%) | $69,938 |
| Average | 8,066 (100.0%) | $110,662 |
Occupancy by Householder Income Bracket in Grayslake
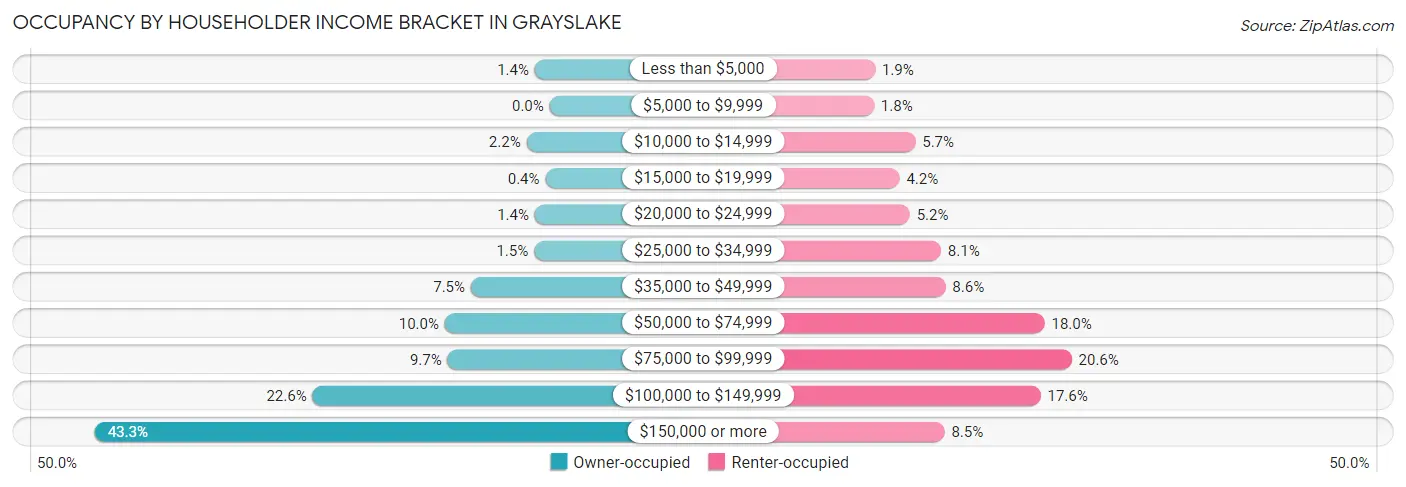
| Income Bracket | Owner-occupied | Renter-occupied |
| Less than $5,000 | 85 (1.4%) | 38 (1.8%) |
| $5,000 to $9,999 | 0 (0.0%) | 36 (1.8%) |
| $10,000 to $14,999 | 132 (2.2%) | 117 (5.7%) |
| $15,000 to $19,999 | 24 (0.4%) | 86 (4.2%) |
| $20,000 to $24,999 | 85 (1.4%) | 106 (5.2%) |
| $25,000 to $34,999 | 89 (1.5%) | 167 (8.1%) |
| $35,000 to $49,999 | 451 (7.5%) | 176 (8.6%) |
| $50,000 to $74,999 | 600 (10.0%) | 370 (18.0%) |
| $75,000 to $99,999 | 584 (9.7%) | 423 (20.6%) |
| $100,000 to $149,999 | 1,357 (22.6%) | 362 (17.6%) |
| $150,000 or more | 2,604 (43.3%) | 174 (8.5%) |
| Total | 6,011 (100.0%) | 2,055 (100.0%) |
Monthly Housing Cost Tiers in Grayslake
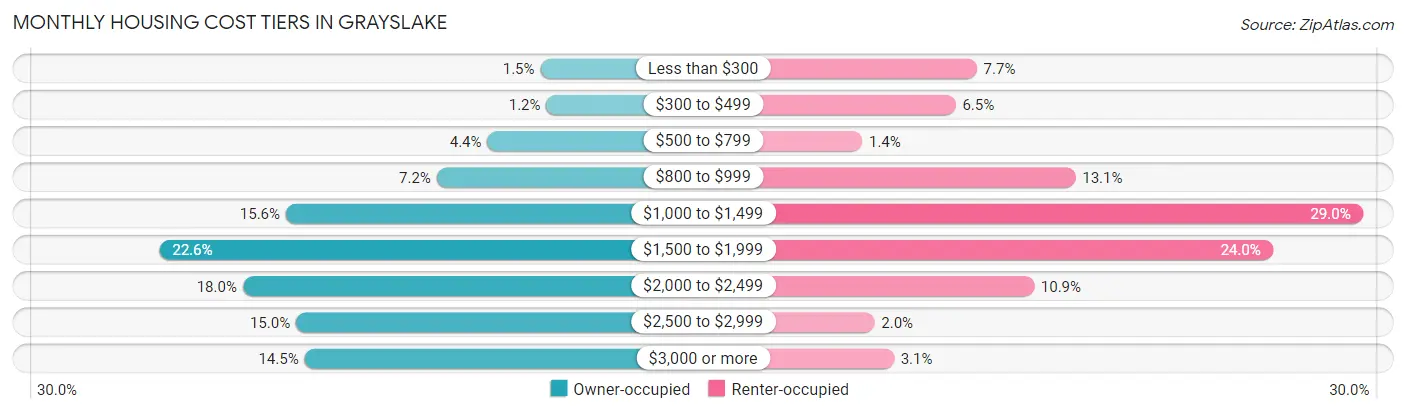
| Monthly Cost | Owner-occupied | Renter-occupied |
| Less than $300 | 91 (1.5%) | 158 (7.7%) |
| $300 to $499 | 71 (1.2%) | 134 (6.5%) |
| $500 to $799 | 267 (4.4%) | 28 (1.4%) |
| $800 to $999 | 435 (7.2%) | 270 (13.1%) |
| $1,000 to $1,499 | 936 (15.6%) | 596 (29.0%) |
| $1,500 to $1,999 | 1,356 (22.6%) | 494 (24.0%) |
| $2,000 to $2,499 | 1,079 (17.9%) | 223 (10.8%) |
| $2,500 to $2,999 | 902 (15.0%) | 42 (2.0%) |
| $3,000 or more | 874 (14.5%) | 64 (3.1%) |
| Total | 6,011 (100.0%) | 2,055 (100.0%) |
Physical Housing Characteristics in Grayslake
Housing Structures in Grayslake
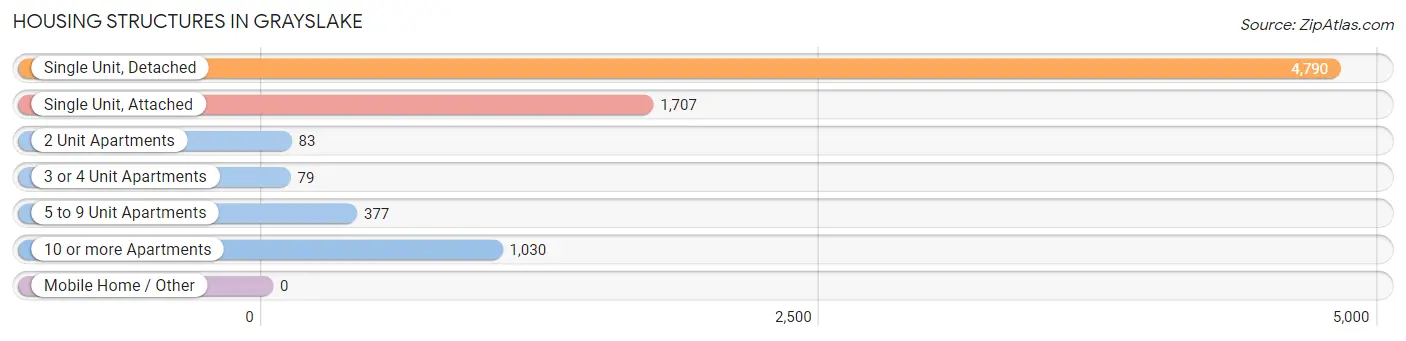
| Structure Type | # Housing Units | % Housing Units |
| Single Unit, Detached | 4,790 | 59.4% |
| Single Unit, Attached | 1,707 | 21.2% |
| 2 Unit Apartments | 83 | 1.0% |
| 3 or 4 Unit Apartments | 79 | 1.0% |
| 5 to 9 Unit Apartments | 377 | 4.7% |
| 10 or more Apartments | 1,030 | 12.8% |
| Mobile Home / Other | 0 | 0.0% |
| Total | 8,066 | 100.0% |
Housing Structures by Occupancy in Grayslake
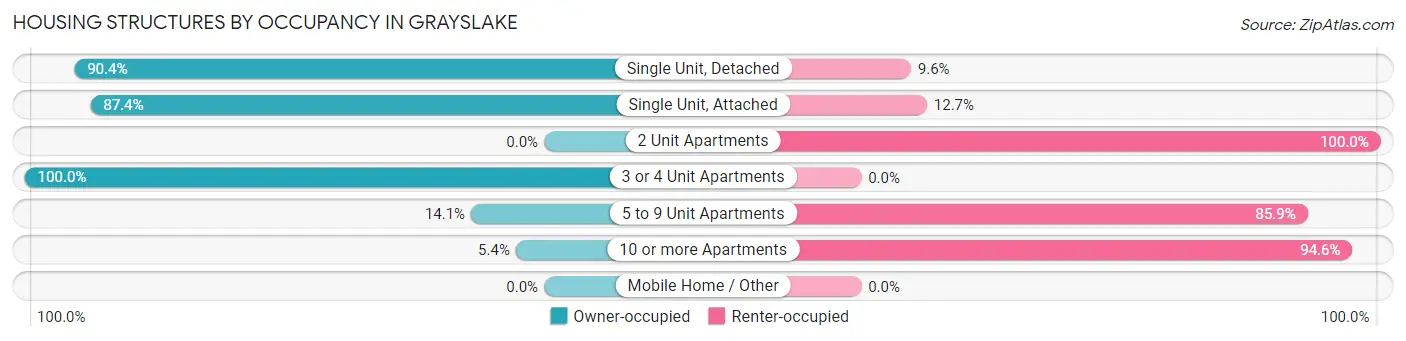
| Structure Type | Owner-occupied | Renter-occupied |
| Single Unit, Detached | 4,332 (90.4%) | 458 (9.6%) |
| Single Unit, Attached | 1,491 (87.4%) | 216 (12.7%) |
| 2 Unit Apartments | 0 (0.0%) | 83 (100.0%) |
| 3 or 4 Unit Apartments | 79 (100.0%) | 0 (0.0%) |
| 5 to 9 Unit Apartments | 53 (14.1%) | 324 (85.9%) |
| 10 or more Apartments | 56 (5.4%) | 974 (94.6%) |
| Mobile Home / Other | 0 (0.0%) | 0 (0.0%) |
| Total | 6,011 (74.5%) | 2,055 (25.5%) |
Housing Structures by Number of Rooms in Grayslake
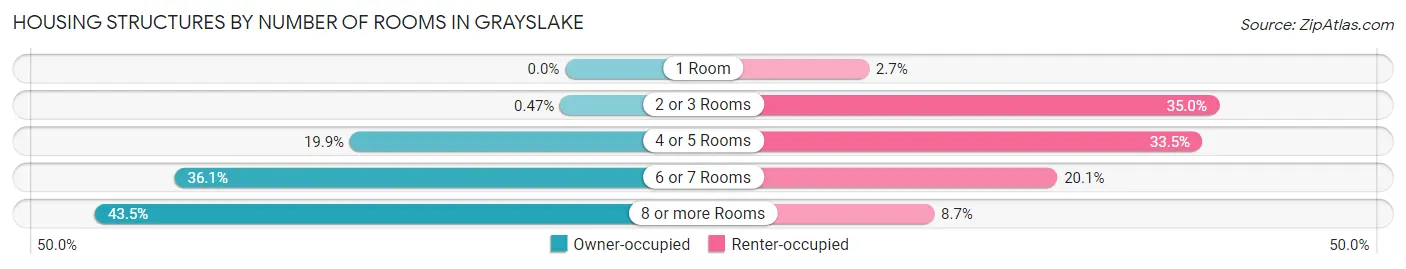
| Number of Rooms | Owner-occupied | Renter-occupied |
| 1 Room | 0 (0.0%) | 55 (2.7%) |
| 2 or 3 Rooms | 28 (0.5%) | 720 (35.0%) |
| 4 or 5 Rooms | 1,197 (19.9%) | 688 (33.5%) |
| 6 or 7 Rooms | 2,172 (36.1%) | 413 (20.1%) |
| 8 or more Rooms | 2,614 (43.5%) | 179 (8.7%) |
| Total | 6,011 (100.0%) | 2,055 (100.0%) |
Housing Structure by Heating Type in Grayslake
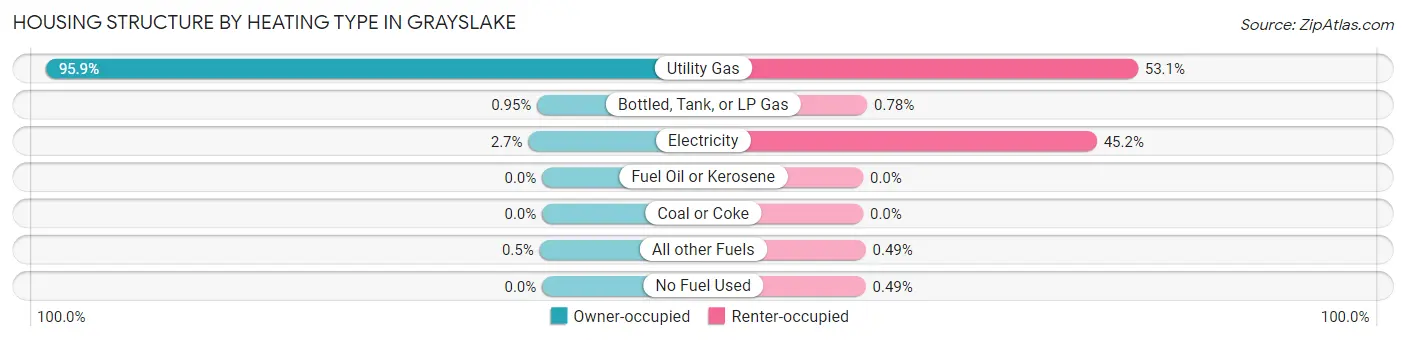
| Heating Type | Owner-occupied | Renter-occupied |
| Utility Gas | 5,765 (95.9%) | 1,091 (53.1%) |
| Bottled, Tank, or LP Gas | 57 (0.9%) | 16 (0.8%) |
| Electricity | 159 (2.6%) | 928 (45.2%) |
| Fuel Oil or Kerosene | 0 (0.0%) | 0 (0.0%) |
| Coal or Coke | 0 (0.0%) | 0 (0.0%) |
| All other Fuels | 30 (0.5%) | 10 (0.5%) |
| No Fuel Used | 0 (0.0%) | 10 (0.5%) |
| Total | 6,011 (100.0%) | 2,055 (100.0%) |
Household Vehicle Usage in Grayslake
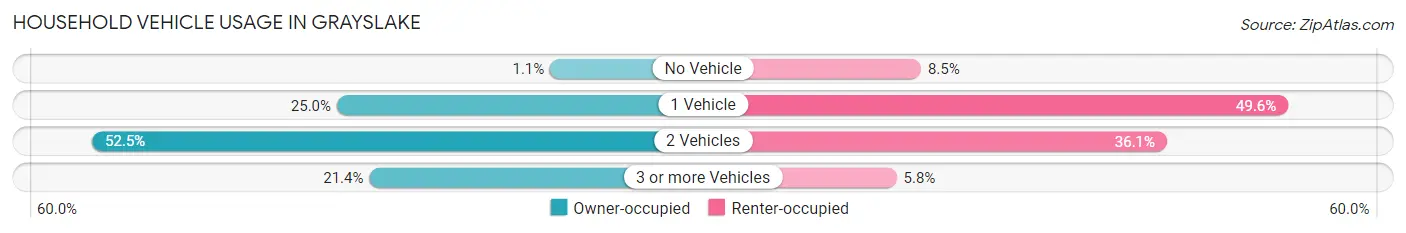
| Vehicles per Household | Owner-occupied | Renter-occupied |
| No Vehicle | 68 (1.1%) | 175 (8.5%) |
| 1 Vehicle | 1,504 (25.0%) | 1,020 (49.6%) |
| 2 Vehicles | 3,153 (52.4%) | 741 (36.1%) |
| 3 or more Vehicles | 1,286 (21.4%) | 119 (5.8%) |
| Total | 6,011 (100.0%) | 2,055 (100.0%) |
Real Estate & Mortgages in Grayslake
Real Estate and Mortgage Overview in Grayslake
| Characteristic | Without Mortgage | With Mortgage |
| Housing Units | 1,686 | 4,325 |
| Median Property Value | $273,800 | $282,000 |
| Median Household Income | $78,690 | $2,165 |
| Monthly Housing Costs | $1,139 | $874 |
| Real Estate Taxes | $9,334 | $140 |
Property Value by Mortgage Status in Grayslake
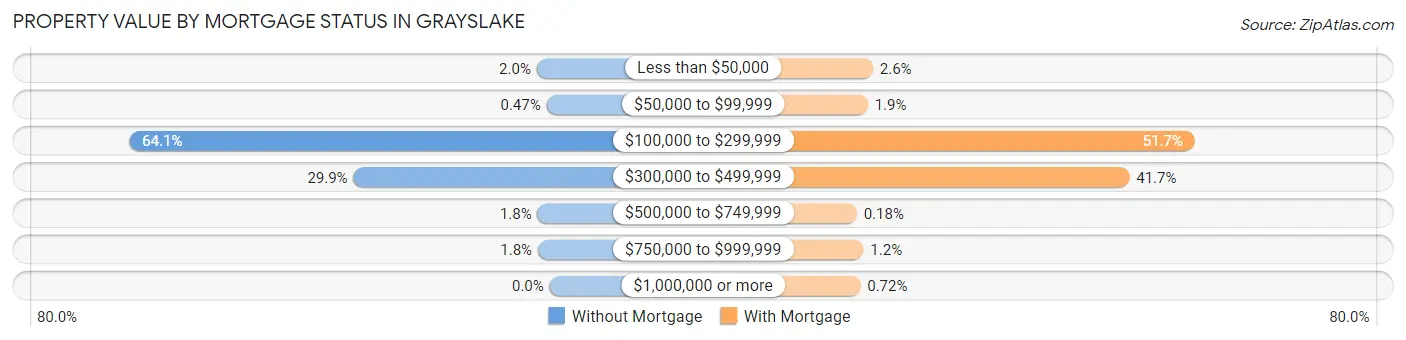
| Property Value | Without Mortgage | With Mortgage |
| Less than $50,000 | 33 (2.0%) | 114 (2.6%) |
| $50,000 to $99,999 | 8 (0.5%) | 80 (1.8%) |
| $100,000 to $299,999 | 1,080 (64.1%) | 2,236 (51.7%) |
| $300,000 to $499,999 | 504 (29.9%) | 1,804 (41.7%) |
| $500,000 to $749,999 | 31 (1.8%) | 8 (0.2%) |
| $750,000 to $999,999 | 30 (1.8%) | 52 (1.2%) |
| $1,000,000 or more | 0 (0.0%) | 31 (0.7%) |
| Total | 1,686 (100.0%) | 4,325 (100.0%) |
Household Income by Mortgage Status in Grayslake
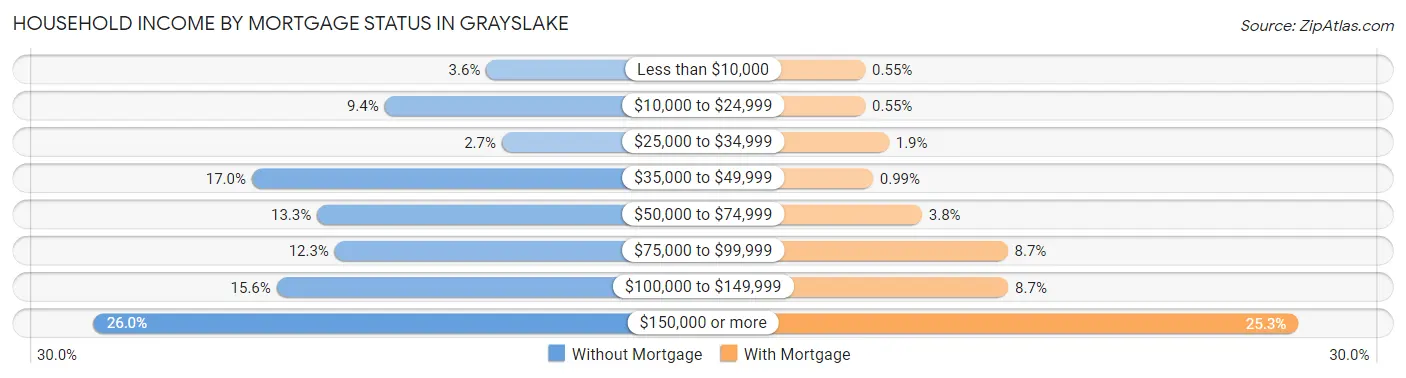
| Household Income | Without Mortgage | With Mortgage |
| Less than $10,000 | 61 (3.6%) | 24 (0.5%) |
| $10,000 to $24,999 | 159 (9.4%) | 24 (0.5%) |
| $25,000 to $34,999 | 46 (2.7%) | 82 (1.9%) |
| $35,000 to $49,999 | 287 (17.0%) | 43 (1.0%) |
| $50,000 to $74,999 | 224 (13.3%) | 164 (3.8%) |
| $75,000 to $99,999 | 207 (12.3%) | 376 (8.7%) |
| $100,000 to $149,999 | 263 (15.6%) | 377 (8.7%) |
| $150,000 or more | 439 (26.0%) | 1,094 (25.3%) |
| Total | 1,686 (100.0%) | 4,325 (100.0%) |
Property Value to Household Income Ratio in Grayslake
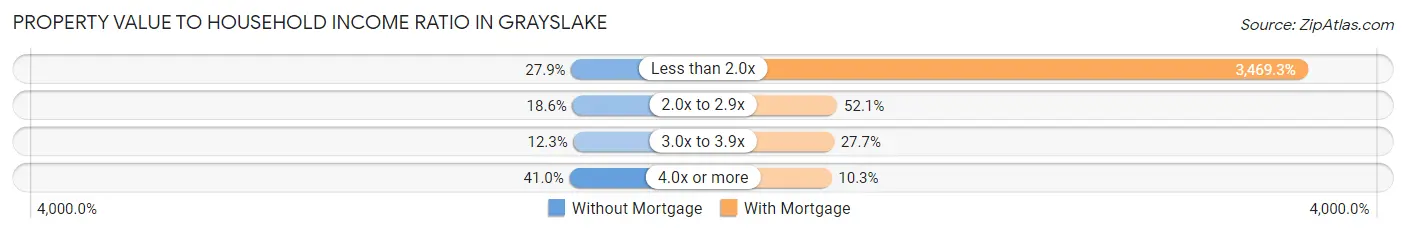
| Value-to-Income Ratio | Without Mortgage | With Mortgage |
| Less than 2.0x | 470 (27.9%) | 150,045 (3,469.3%) |
| 2.0x to 2.9x | 313 (18.6%) | 2,254 (52.1%) |
| 3.0x to 3.9x | 208 (12.3%) | 1,199 (27.7%) |
| 4.0x or more | 691 (41.0%) | 445 (10.3%) |
| Total | 1,686 (100.0%) | 4,325 (100.0%) |
Real Estate Taxes by Mortgage Status in Grayslake
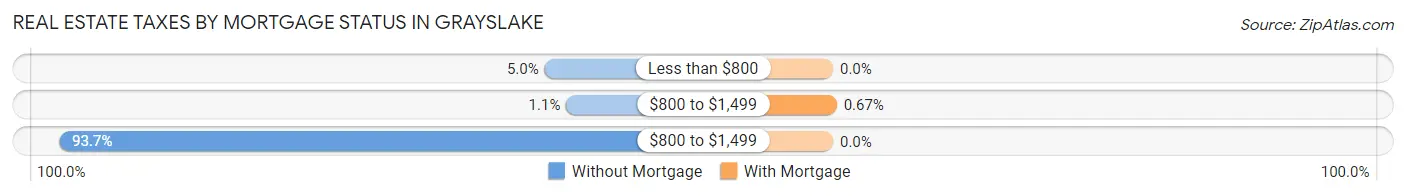
| Property Taxes | Without Mortgage | With Mortgage |
| Less than $800 | 85 (5.0%) | 0 (0.0%) |
| $800 to $1,499 | 18 (1.1%) | 29 (0.7%) |
| $800 to $1,499 | 1,580 (93.7%) | 0 (0.0%) |
| Total | 1,686 (100.0%) | 4,325 (100.0%) |
Health & Disability in Grayslake
Health Insurance Coverage by Age in Grayslake
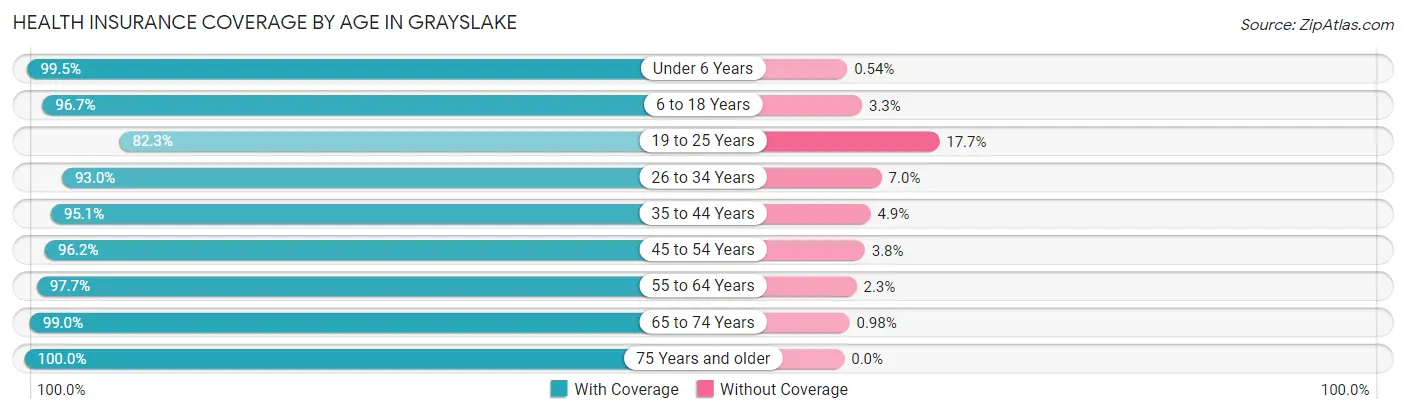
| Age Bracket | With Coverage | Without Coverage |
| Under 6 Years | 1,659 (99.5%) | 9 (0.5%) |
| 6 to 18 Years | 3,418 (96.7%) | 117 (3.3%) |
| 19 to 25 Years | 1,417 (82.3%) | 305 (17.7%) |
| 26 to 34 Years | 2,308 (93.0%) | 173 (7.0%) |
| 35 to 44 Years | 2,683 (95.1%) | 138 (4.9%) |
| 45 to 54 Years | 2,617 (96.2%) | 104 (3.8%) |
| 55 to 64 Years | 2,918 (97.7%) | 68 (2.3%) |
| 65 to 74 Years | 1,624 (99.0%) | 16 (1.0%) |
| 75 Years and older | 962 (100.0%) | 0 (0.0%) |
| Total | 19,606 (95.5%) | 930 (4.5%) |
Health Insurance Coverage by Citizenship Status in Grayslake
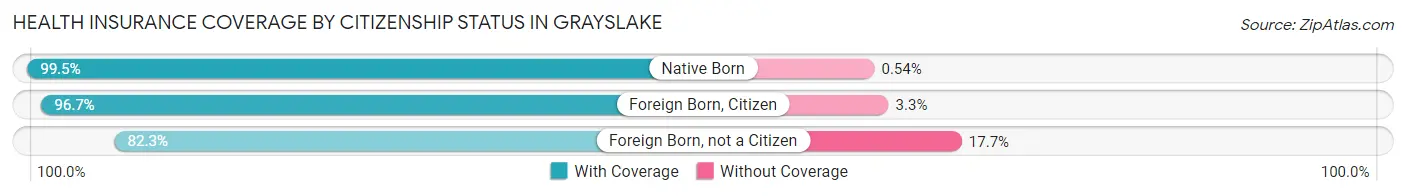
| Citizenship Status | With Coverage | Without Coverage |
| Native Born | 1,659 (99.5%) | 9 (0.5%) |
| Foreign Born, Citizen | 3,418 (96.7%) | 117 (3.3%) |
| Foreign Born, not a Citizen | 1,417 (82.3%) | 305 (17.7%) |
Health Insurance Coverage by Household Income in Grayslake
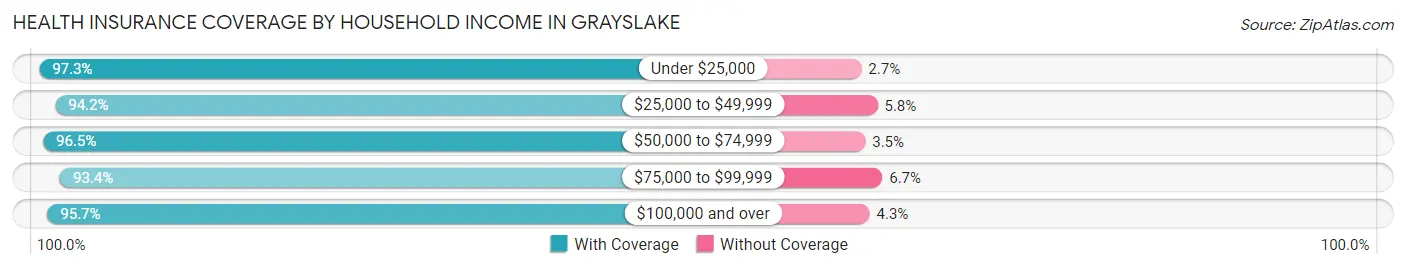
| Household Income | With Coverage | Without Coverage |
| Under $25,000 | 1,099 (97.3%) | 31 (2.7%) |
| $25,000 to $49,999 | 1,767 (94.2%) | 108 (5.8%) |
| $50,000 to $74,999 | 1,814 (96.5%) | 65 (3.5%) |
| $75,000 to $99,999 | 1,950 (93.3%) | 139 (6.7%) |
| $100,000 and over | 12,902 (95.7%) | 576 (4.3%) |
Public vs Private Health Insurance Coverage by Age in Grayslake
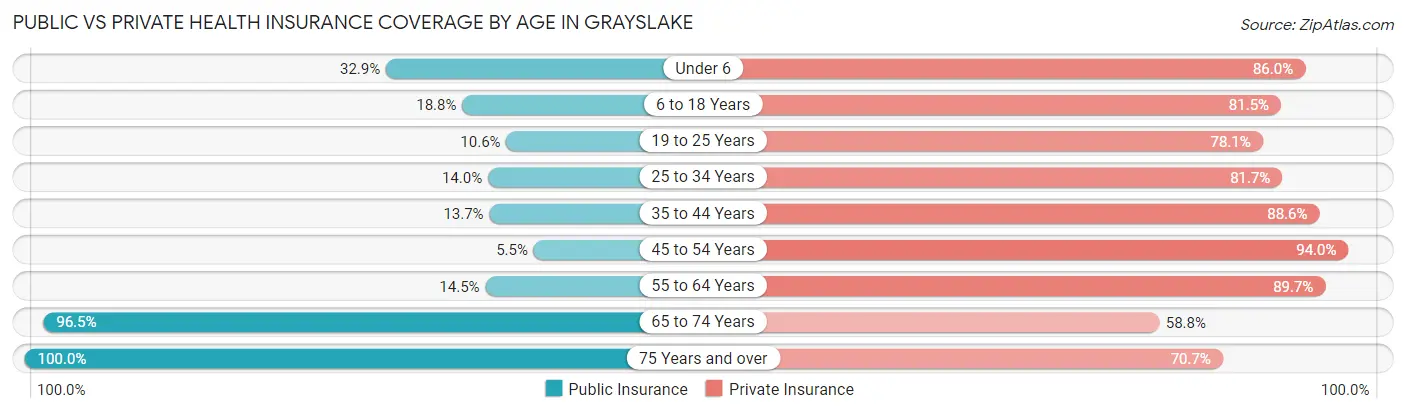
| Age Bracket | Public Insurance | Private Insurance |
| Under 6 | 549 (32.9%) | 1,434 (86.0%) |
| 6 to 18 Years | 663 (18.8%) | 2,881 (81.5%) |
| 19 to 25 Years | 182 (10.6%) | 1,345 (78.1%) |
| 25 to 34 Years | 347 (14.0%) | 2,028 (81.7%) |
| 35 to 44 Years | 387 (13.7%) | 2,500 (88.6%) |
| 45 to 54 Years | 149 (5.5%) | 2,558 (94.0%) |
| 55 to 64 Years | 432 (14.5%) | 2,679 (89.7%) |
| 65 to 74 Years | 1,583 (96.5%) | 965 (58.8%) |
| 75 Years and over | 962 (100.0%) | 680 (70.7%) |
| Total | 5,254 (25.6%) | 17,070 (83.1%) |
Disability Status by Sex by Age in Grayslake
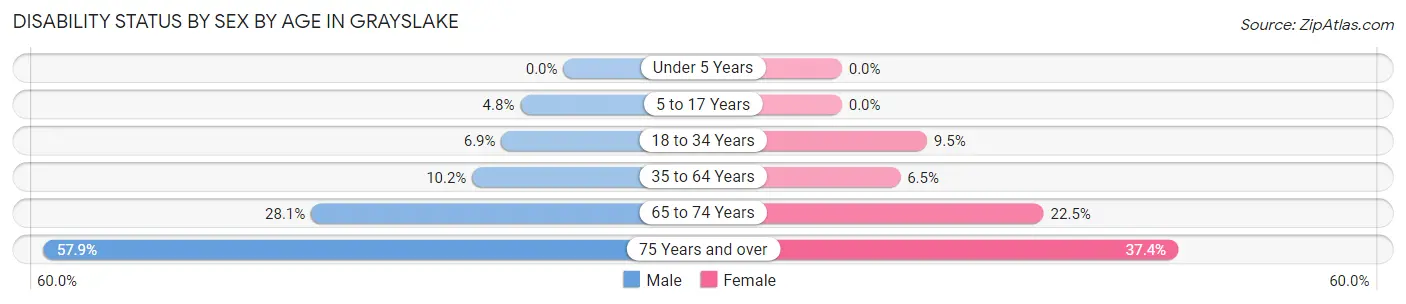
| Age Bracket | Male | Female |
| Under 5 Years | 0 (0.0%) | 0 (0.0%) |
| 5 to 17 Years | 87 (4.8%) | 0 (0.0%) |
| 18 to 34 Years | 150 (6.9%) | 227 (9.5%) |
| 35 to 64 Years | 426 (10.2%) | 282 (6.5%) |
| 65 to 74 Years | 257 (28.1%) | 163 (22.5%) |
| 75 Years and over | 232 (57.9%) | 210 (37.4%) |
Disability Class by Sex by Age in Grayslake
Disability Class: Hearing Difficulty
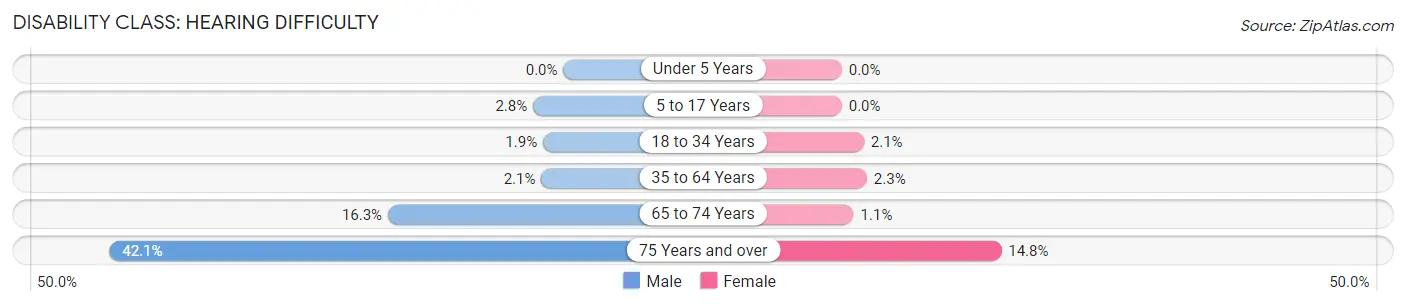
| Age Bracket | Male | Female |
| Under 5 Years | 0 (0.0%) | 0 (0.0%) |
| 5 to 17 Years | 51 (2.8%) | 0 (0.0%) |
| 18 to 34 Years | 41 (1.9%) | 49 (2.1%) |
| 35 to 64 Years | 86 (2.1%) | 101 (2.3%) |
| 65 to 74 Years | 149 (16.3%) | 8 (1.1%) |
| 75 Years and over | 169 (42.1%) | 83 (14.8%) |
Disability Class: Vision Difficulty

| Age Bracket | Male | Female |
| Under 5 Years | 0 (0.0%) | 0 (0.0%) |
| 5 to 17 Years | 0 (0.0%) | 0 (0.0%) |
| 18 to 34 Years | 0 (0.0%) | 62 (2.6%) |
| 35 to 64 Years | 73 (1.7%) | 47 (1.1%) |
| 65 to 74 Years | 0 (0.0%) | 0 (0.0%) |
| 75 Years and over | 0 (0.0%) | 44 (7.8%) |
Disability Class: Cognitive Difficulty
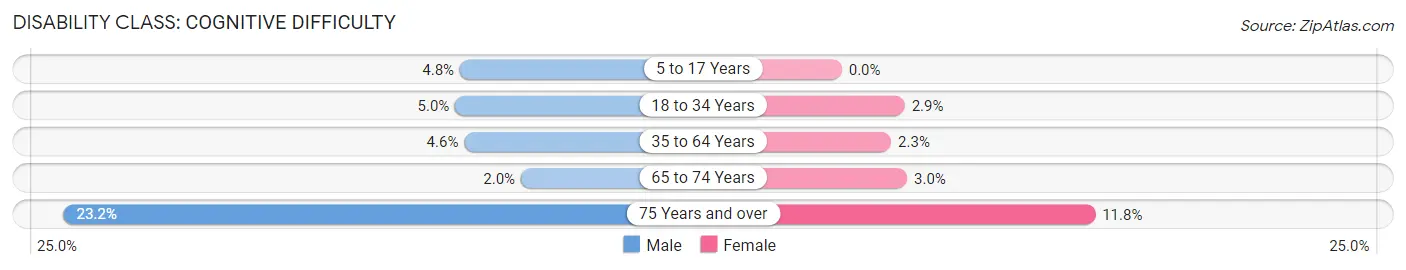
| Age Bracket | Male | Female |
| 5 to 17 Years | 87 (4.8%) | 0 (0.0%) |
| 18 to 34 Years | 109 (5.0%) | 70 (2.9%) |
| 35 to 64 Years | 193 (4.6%) | 99 (2.3%) |
| 65 to 74 Years | 18 (2.0%) | 22 (3.0%) |
| 75 Years and over | 93 (23.2%) | 66 (11.8%) |
Disability Class: Ambulatory Difficulty
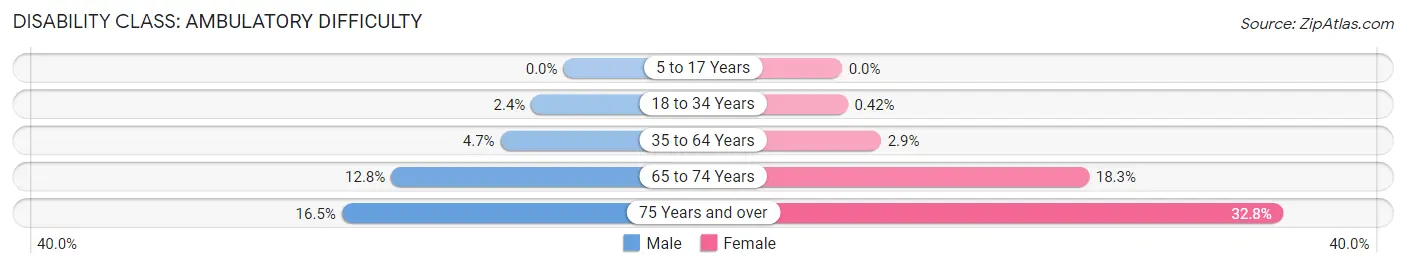
| Age Bracket | Male | Female |
| 5 to 17 Years | 0 (0.0%) | 0 (0.0%) |
| 18 to 34 Years | 52 (2.4%) | 10 (0.4%) |
| 35 to 64 Years | 196 (4.7%) | 125 (2.9%) |
| 65 to 74 Years | 117 (12.8%) | 133 (18.3%) |
| 75 Years and over | 66 (16.5%) | 184 (32.8%) |
Disability Class: Self-Care Difficulty
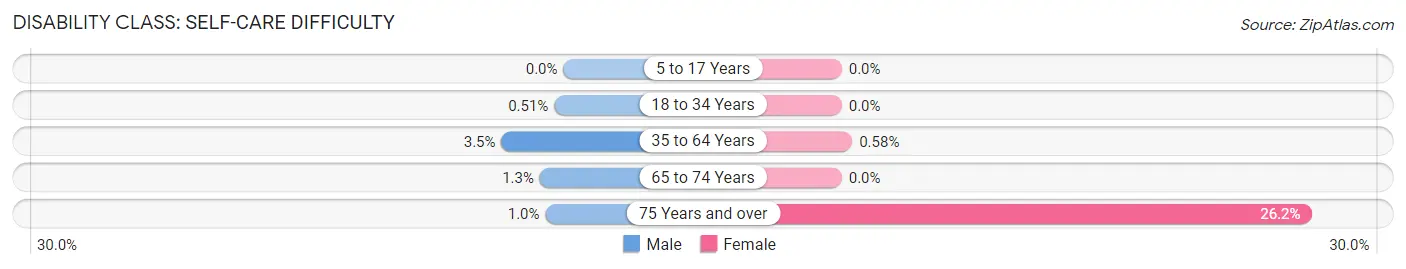
| Age Bracket | Male | Female |
| 5 to 17 Years | 0 (0.0%) | 0 (0.0%) |
| 18 to 34 Years | 11 (0.5%) | 0 (0.0%) |
| 35 to 64 Years | 145 (3.5%) | 25 (0.6%) |
| 65 to 74 Years | 12 (1.3%) | 0 (0.0%) |
| 75 Years and over | 4 (1.0%) | 147 (26.2%) |
Technology Access in Grayslake
Computing Device Access in Grayslake
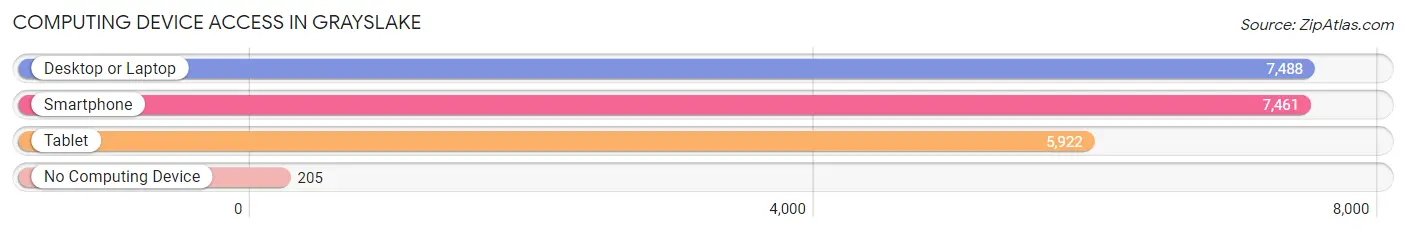
| Device Type | # Households | % Households |
| Desktop or Laptop | 7,488 | 92.8% |
| Smartphone | 7,461 | 92.5% |
| Tablet | 5,922 | 73.4% |
| No Computing Device | 205 | 2.5% |
| Total | 8,066 | 100.0% |
Internet Access in Grayslake
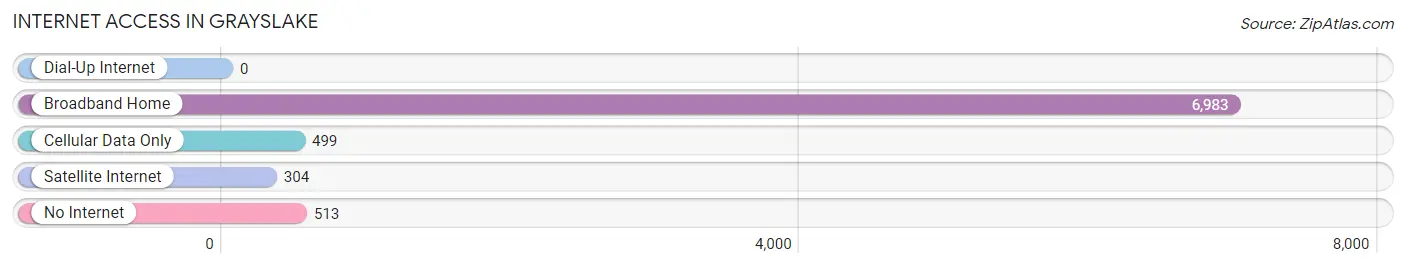
| Internet Type | # Households | % Households |
| Dial-Up Internet | 0 | 0.0% |
| Broadband Home | 6,983 | 86.6% |
| Cellular Data Only | 499 | 6.2% |
| Satellite Internet | 304 | 3.8% |
| No Internet | 513 | 6.4% |
| Total | 8,066 | 100.0% |
Grayslake Summary
Grayslake is a village located in Lake County, Illinois, United States. It is a part of the Chicago metropolitan area and is located about 40 miles northwest of downtown Chicago. The population of Grayslake was 20,957 at the 2010 census.
History
Grayslake was first settled in 1836 by a man named John Gray. He built a log cabin on the banks of Nippersink Creek and named the area after himself. The area was originally known as Gray’s Settlement. In 1848, the settlement was officially incorporated as the Village of Grayslake.
The village grew slowly over the years, but it wasn’t until the 1950s that it began to experience rapid growth. This was due to the construction of the nearby Great Lakes Naval Training Center, which brought many new residents to the area. The village was also home to a large number of farms, which provided employment for many of the residents.
Geography
Grayslake is located in northeastern Illinois, about 40 miles northwest of downtown Chicago. It is situated in Lake County, and is bordered by the villages of Round Lake Beach, Hainesville, and Third Lake to the north, Gurnee to the east, Wildwood to the south, and Round Lake to the west.
The village covers an area of 8.3 square miles, of which 8.2 square miles is land and 0.1 square miles is water. The terrain is mostly flat, with some rolling hills in the northern part of the village. The highest point in Grayslake is located at an elevation of 845 feet above sea level.
Economy
Grayslake’s economy is largely based on the service industry, with many residents employed in retail, healthcare, and education. The village is also home to several manufacturing companies, including a large paper mill and a plastics factory.
The village is also home to the College of Lake County, which provides educational opportunities for residents and serves as an economic engine for the area. The college has an enrollment of over 10,000 students and employs over 1,000 faculty and staff.
Demographics
As of the 2010 census, the population of Grayslake was 20,957. The racial makeup of the village was 87.3% White, 5.2% African American, 0.3% Native American, 2.7% Asian, 0.1% Pacific Islander, 1.9% from other races, and 2.6% from two or more races. Hispanic or Latino of any race were 6.3% of the population.
The median household income in Grayslake was $68,945 in 2018, and the median family income was $77,945. The per capita income was $30,945. About 5.3% of families and 7.2% of the population were below the poverty line, including 8.3% of those under age 18 and 4.2% of those age 65 or over.
Grayslake is a diverse and vibrant community that offers a variety of opportunities for its residents. The village is home to a number of businesses, educational institutions, and recreational activities, making it an attractive place to live and work.
Common Questions
What is Per Capita Income in Grayslake?
Per Capita income in Grayslake is $53,486.
What is the Median Family Income in Grayslake?
Median Family Income in Grayslake is $135,615.
What is the Median Household income in Grayslake?
Median Household Income in Grayslake is $110,662.
What is Income or Wage Gap in Grayslake?
Income or Wage Gap in Grayslake is 32.8%.
Women in Grayslake earn 67.2 cents for every dollar earned by a man.
What is Family Income Deficit in Grayslake?
Family Income Deficit in Grayslake is $7,483.
Families that are below poverty line in Grayslake earn $7,483 less on average than the poverty threshold level.
What is Inequality or Gini Index in Grayslake?
Inequality or Gini Index in Grayslake is 0.41.
What is the Total Population of Grayslake?
Total Population of Grayslake is 20,801.
What is the Total Male Population of Grayslake?
Total Male Population of Grayslake is 10,610.
What is the Total Female Population of Grayslake?
Total Female Population of Grayslake is 10,191.
What is the Ratio of Males per 100 Females in Grayslake?
There are 104.11 Males per 100 Females in Grayslake.
What is the Ratio of Females per 100 Males in Grayslake?
There are 96.05 Females per 100 Males in Grayslake.
What is the Median Population Age in Grayslake?
Median Population Age in Grayslake is 37.6 Years.
What is the Average Family Size in Grayslake
Average Family Size in Grayslake is 3.1 People.
What is the Average Household Size in Grayslake
Average Household Size in Grayslake is 2.6 People.
How Large is the Labor Force in Grayslake?
There are 12,159 People in the Labor Forcein in Grayslake.
What is the Percentage of People in the Labor Force in Grayslake?
73.3% of People are in the Labor Force in Grayslake.
What is the Unemployment Rate in Grayslake?
Unemployment Rate in Grayslake is 6.2%.