Melrose Park, IL Map & Demographics
Melrose Park Map
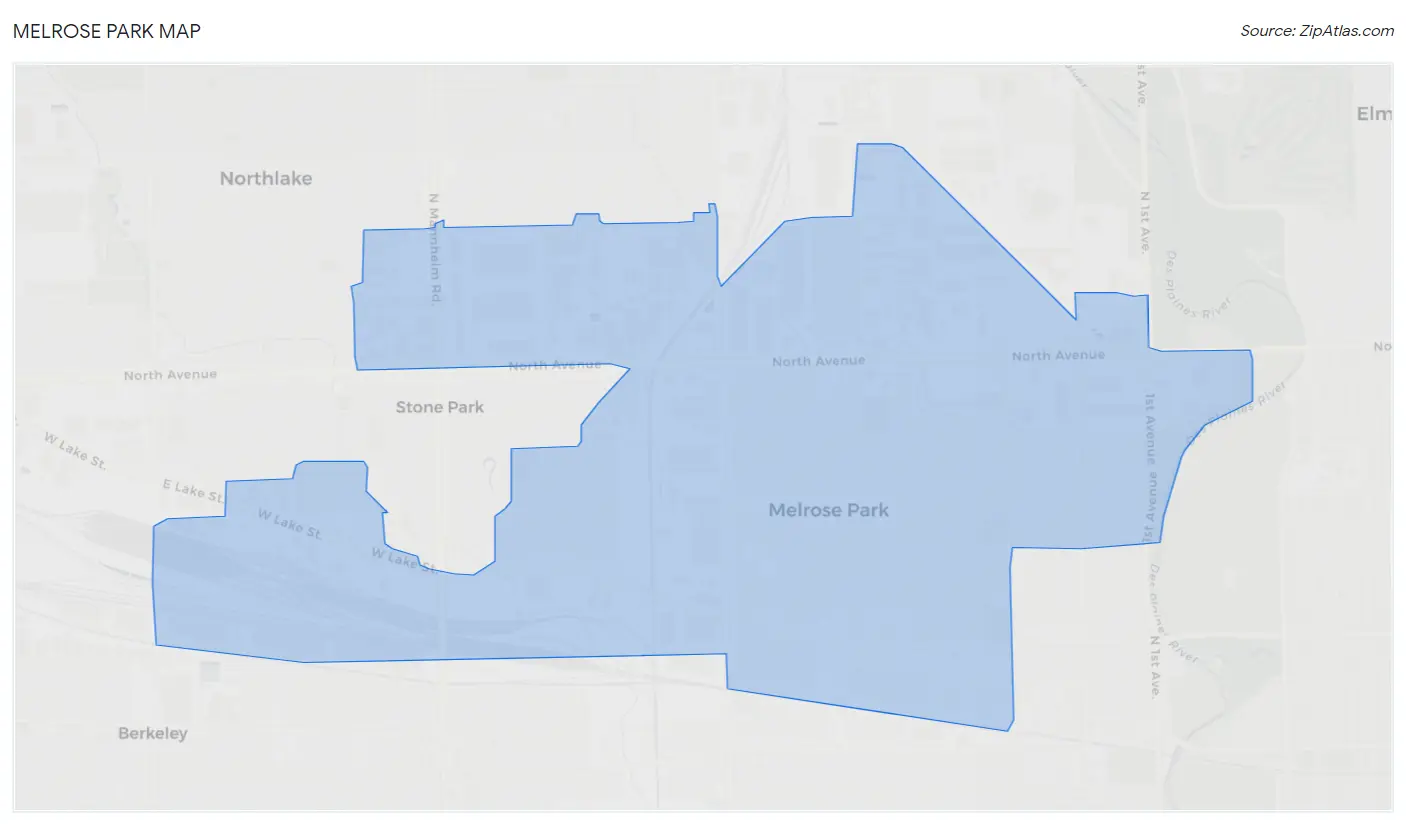
Melrose Park Overview
$27,791
PER CAPITA INCOME
$72,418
AVG FAMILY INCOME
$64,400
AVG HOUSEHOLD INCOME
17.8%
WAGE / INCOME GAP [ % ]
82.2¢/ $1
WAGE / INCOME GAP [ $ ]
$9,797
FAMILY INCOME DEFICIT
0.39
INEQUALITY / GINI INDEX
25,177
TOTAL POPULATION
12,911
MALE POPULATION
12,266
FEMALE POPULATION
105.26
MALES / 100 FEMALES
95.00
FEMALES / 100 MALES
34.5
MEDIAN AGE
3.7
AVG FAMILY SIZE
3.1
AVG HOUSEHOLD SIZE
13,057
LABOR FORCE [ PEOPLE ]
66.6%
PERCENT IN LABOR FORCE
5.0%
UNEMPLOYMENT RATE
Income in Melrose Park
Income Overview in Melrose Park
Per Capita Income in Melrose Park is $27,791, while median incomes of families and households are $72,418 and $64,400 respectively.
| Characteristic | Number | Measure |
| Per Capita Income | 25,177 | $27,791 |
| Median Family Income | 5,678 | $72,418 |
| Mean Family Income | 5,678 | $92,053 |
| Median Household Income | 8,104 | $64,400 |
| Mean Household Income | 8,104 | $85,004 |
| Income Deficit | 5,678 | $9,797 |
| Wage / Income Gap (%) | 25,177 | 17.84% |
| Wage / Income Gap ($) | 25,177 | 82.16¢ per $1 |
| Gini / Inequality Index | 25,177 | 0.39 |
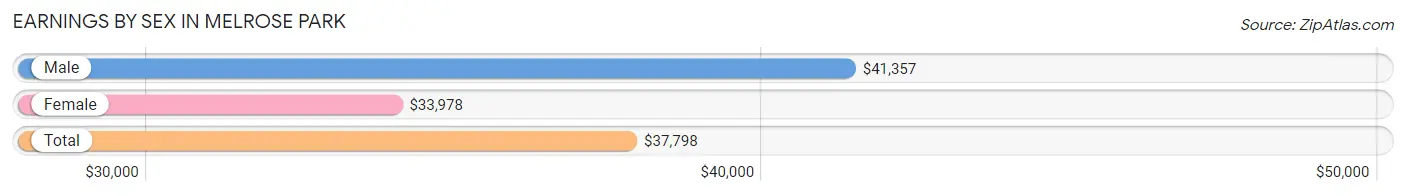
Earnings by Sex in Melrose Park
Average Earnings in Melrose Park are $37,798, $41,357 for men and $33,978 for women, a difference of 17.8%.
| Sex | Number | Average Earnings |
| Male | 7,754 (58.4%) | $41,357 |
| Female | 5,525 (41.6%) | $33,978 |
| Total | 13,279 (100.0%) | $37,798 |
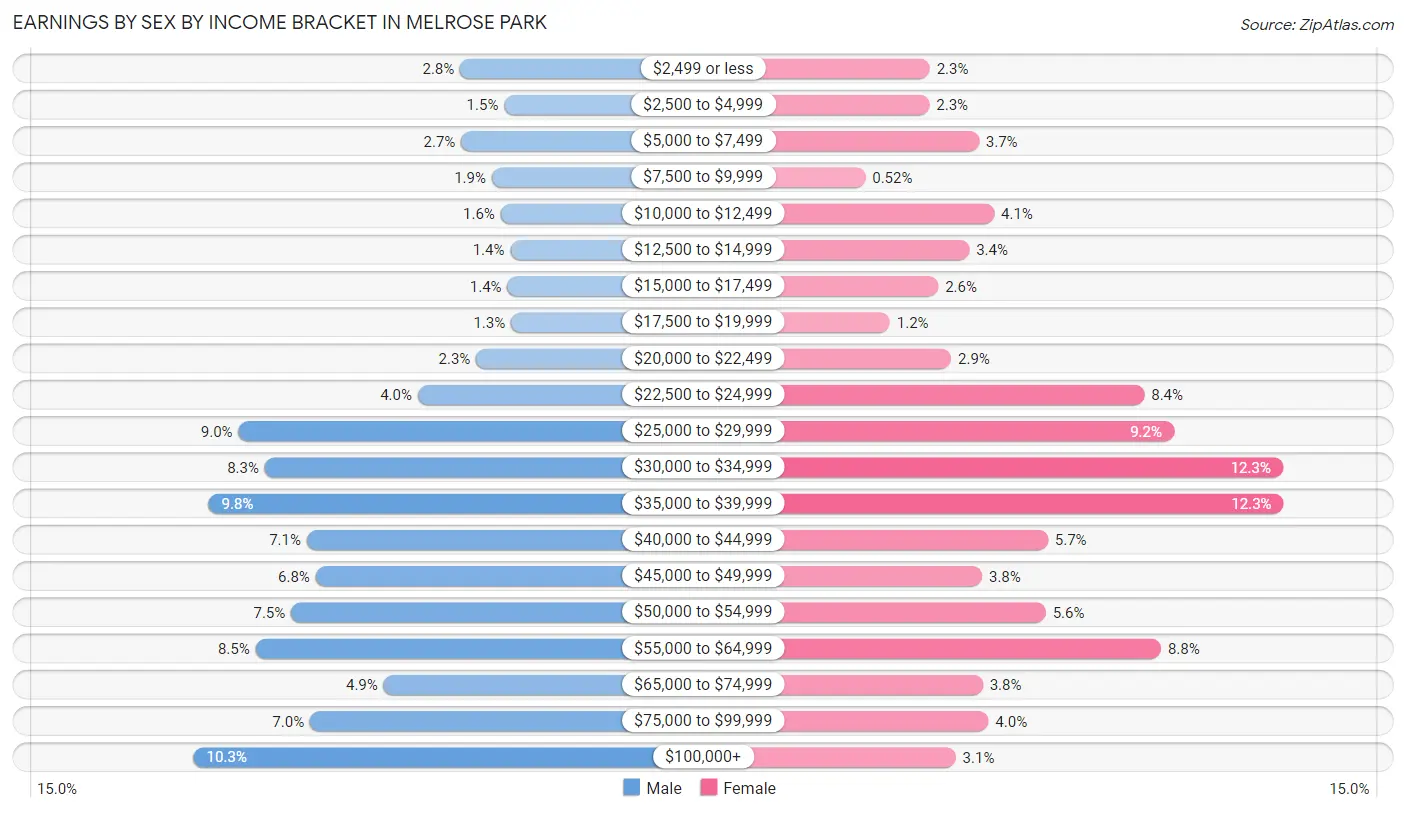
Earnings by Sex by Income Bracket in Melrose Park
The most common earnings brackets in Melrose Park are $100,000+ for men (795 | 10.2%) and $35,000 to $39,999 for women (678 | 12.3%).
| Income | Male | Female |
| $2,499 or less | 214 (2.8%) | 129 (2.3%) |
| $2,500 to $4,999 | 118 (1.5%) | 128 (2.3%) |
| $5,000 to $7,499 | 212 (2.7%) | 205 (3.7%) |
| $7,500 to $9,999 | 145 (1.9%) | 29 (0.5%) |
| $10,000 to $12,499 | 126 (1.6%) | 229 (4.1%) |
| $12,500 to $14,999 | 105 (1.3%) | 190 (3.4%) |
| $15,000 to $17,499 | 111 (1.4%) | 142 (2.6%) |
| $17,500 to $19,999 | 103 (1.3%) | 67 (1.2%) |
| $20,000 to $22,499 | 179 (2.3%) | 162 (2.9%) |
| $22,500 to $24,999 | 306 (4.0%) | 462 (8.4%) |
| $25,000 to $29,999 | 697 (9.0%) | 508 (9.2%) |
| $30,000 to $34,999 | 640 (8.3%) | 677 (12.2%) |
| $35,000 to $39,999 | 762 (9.8%) | 678 (12.3%) |
| $40,000 to $44,999 | 548 (7.1%) | 312 (5.7%) |
| $45,000 to $49,999 | 529 (6.8%) | 210 (3.8%) |
| $50,000 to $54,999 | 582 (7.5%) | 309 (5.6%) |
| $55,000 to $64,999 | 660 (8.5%) | 488 (8.8%) |
| $65,000 to $74,999 | 381 (4.9%) | 211 (3.8%) |
| $75,000 to $99,999 | 541 (7.0%) | 220 (4.0%) |
| $100,000+ | 795 (10.2%) | 169 (3.1%) |
| Total | 7,754 (100.0%) | 5,525 (100.0%) |
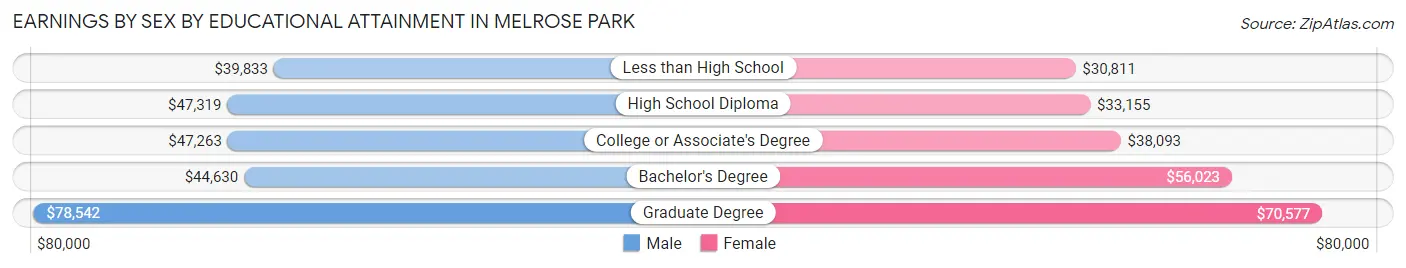
Earnings by Sex by Educational Attainment in Melrose Park
Average earnings in Melrose Park are $45,612 for men and $36,490 for women, a difference of 20.0%. Men with an educational attainment of graduate degree enjoy the highest average annual earnings of $78,542, while those with less than high school education earn the least with $39,833. Women with an educational attainment of graduate degree earn the most with the average annual earnings of $70,577, while those with less than high school education have the smallest earnings of $30,811.
| Educational Attainment | Male Income | Female Income |
| Less than High School | $39,833 | $30,811 |
| High School Diploma | $47,319 | $33,155 |
| College or Associate's Degree | $47,263 | $38,093 |
| Bachelor's Degree | $44,630 | $56,023 |
| Graduate Degree | $78,542 | $70,577 |
| Total | $45,612 | $36,490 |
Family Income in Melrose Park
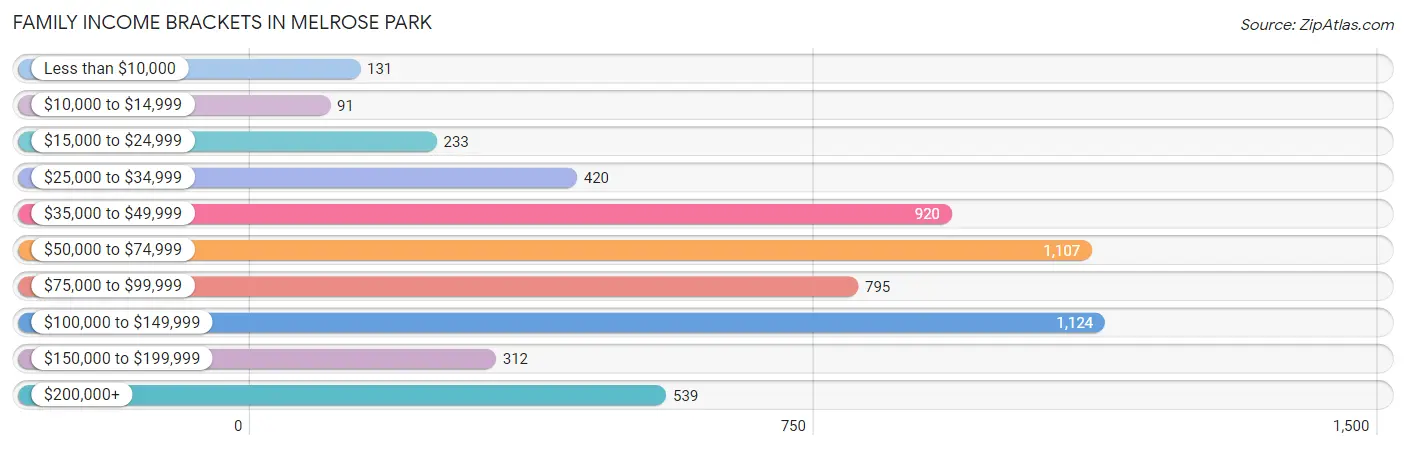
Family Income Brackets in Melrose Park
According to the Melrose Park family income data, there are 1,124 families falling into the $100,000 to $149,999 income range, which is the most common income bracket and makes up 19.8% of all families. Conversely, the $10,000 to $14,999 income bracket is the least frequent group with only 91 families (1.6%) belonging to this category.
| Income Bracket | # Families | % Families |
| Less than $10,000 | 131 | 2.3% |
| $10,000 to $14,999 | 91 | 1.6% |
| $15,000 to $24,999 | 233 | 4.1% |
| $25,000 to $34,999 | 420 | 7.4% |
| $35,000 to $49,999 | 920 | 16.2% |
| $50,000 to $74,999 | 1,107 | 19.5% |
| $75,000 to $99,999 | 795 | 14.0% |
| $100,000 to $149,999 | 1,124 | 19.8% |
| $150,000 to $199,999 | 312 | 5.5% |
| $200,000+ | 539 | 9.5% |
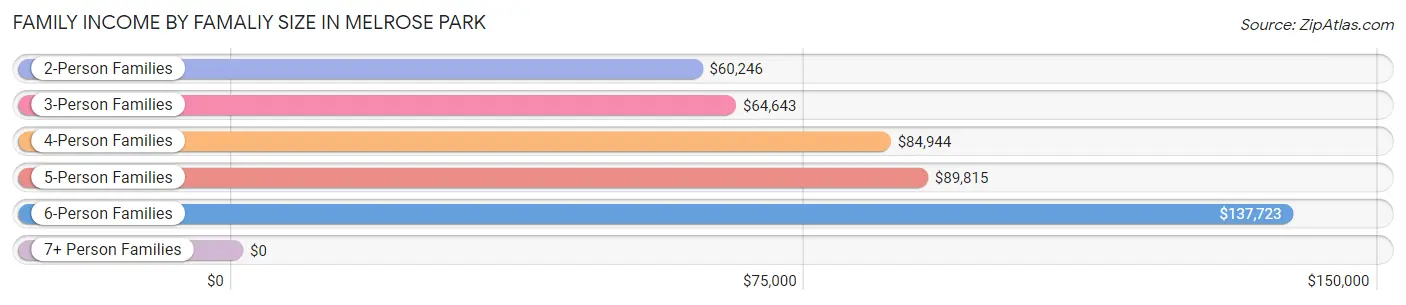
Family Income by Famaliy Size in Melrose Park
6-person families (247 | 4.3%) account for the highest median family income in Melrose Park with $137,723 per family, while 2-person families (1,509 | 26.6%) have the highest median income of $30,123 per family member.
| Income Bracket | # Families | Median Income |
| 2-Person Families | 1,509 (26.6%) | $60,246 |
| 3-Person Families | 1,584 (27.9%) | $64,643 |
| 4-Person Families | 1,266 (22.3%) | $84,944 |
| 5-Person Families | 792 (14.0%) | $89,815 |
| 6-Person Families | 247 (4.3%) | $137,723 |
| 7+ Person Families | 280 (4.9%) | $0 |
| Total | 5,678 (100.0%) | $72,418 |
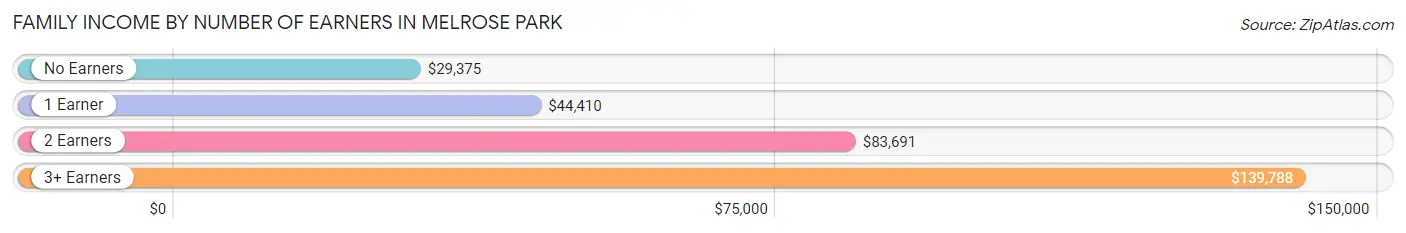
Family Income by Number of Earners in Melrose Park
The median family income in Melrose Park is $72,418, with families comprising 3+ earners (1,248) having the highest median family income of $139,788, while families with no earners (420) have the lowest median family income of $29,375, accounting for 22.0% and 7.4% of families, respectively.
| Number of Earners | # Families | Median Income |
| No Earners | 420 (7.4%) | $29,375 |
| 1 Earner | 2,055 (36.2%) | $44,410 |
| 2 Earners | 1,955 (34.4%) | $83,691 |
| 3+ Earners | 1,248 (22.0%) | $139,788 |
| Total | 5,678 (100.0%) | $72,418 |
Household Income in Melrose Park
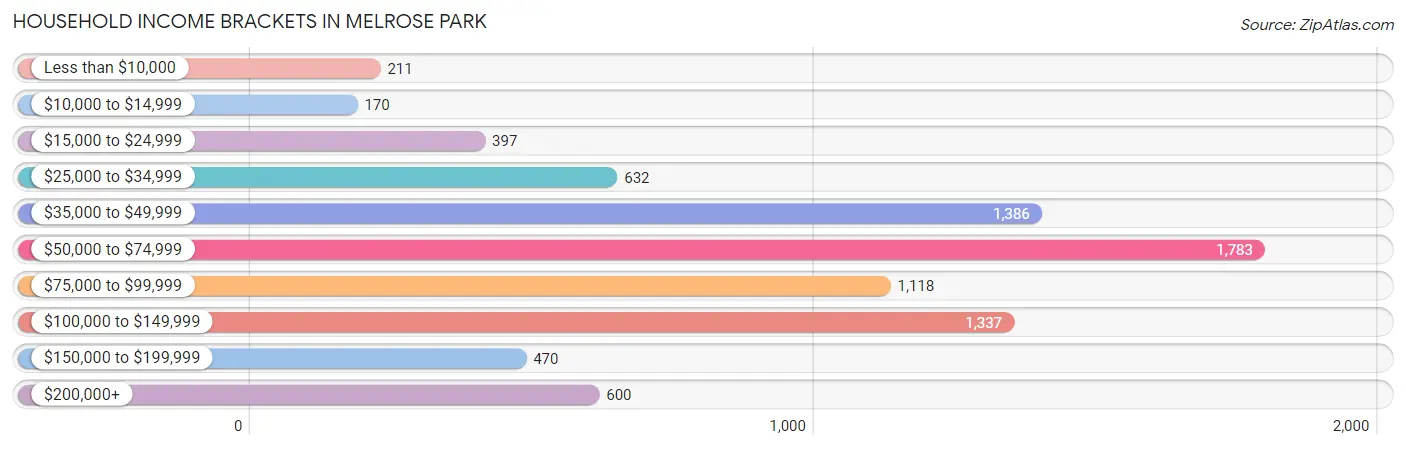
Household Income Brackets in Melrose Park
With 1,783 households falling in the category, the $50,000 to $74,999 income range is the most frequent in Melrose Park, accounting for 22.0% of all households. In contrast, only 170 households (2.1%) fall into the $10,000 to $14,999 income bracket, making it the least populous group.
| Income Bracket | # Households | % Households |
| Less than $10,000 | 211 | 2.6% |
| $10,000 to $14,999 | 170 | 2.1% |
| $15,000 to $24,999 | 397 | 4.9% |
| $25,000 to $34,999 | 632 | 7.8% |
| $35,000 to $49,999 | 1,386 | 17.1% |
| $50,000 to $74,999 | 1,783 | 22.0% |
| $75,000 to $99,999 | 1,118 | 13.8% |
| $100,000 to $149,999 | 1,337 | 16.5% |
| $150,000 to $199,999 | 470 | 5.8% |
| $200,000+ | 600 | 7.4% |
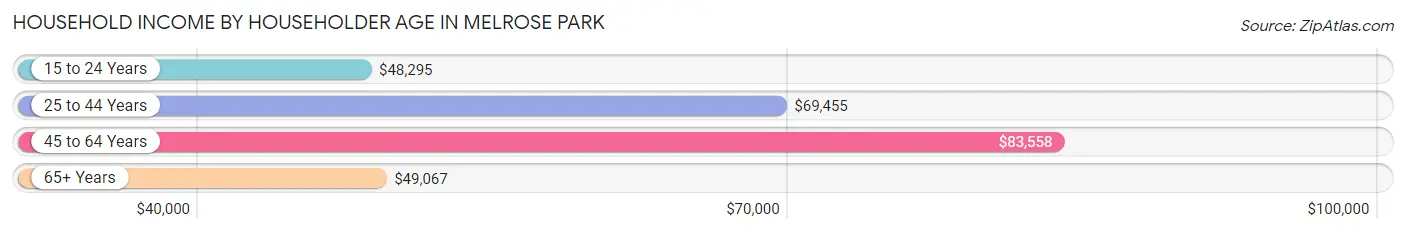
Household Income by Householder Age in Melrose Park
The median household income in Melrose Park is $64,400, with the highest median household income of $83,558 found in the 45 to 64 years age bracket for the primary householder. A total of 3,159 households (39.0%) fall into this category. Meanwhile, the 15 to 24 years age bracket for the primary householder has the lowest median household income of $48,295, with 343 households (4.2%) in this group.
| Income Bracket | # Households | Median Income |
| 15 to 24 Years | 343 (4.2%) | $48,295 |
| 25 to 44 Years | 2,914 (36.0%) | $69,455 |
| 45 to 64 Years | 3,159 (39.0%) | $83,558 |
| 65+ Years | 1,688 (20.8%) | $49,067 |
| Total | 8,104 (100.0%) | $64,400 |
Poverty in Melrose Park
Income Below Poverty by Sex and Age in Melrose Park
With 9.0% poverty level for males and 12.5% for females among the residents of Melrose Park, 6 to 11 year old males and 6 to 11 year old females are the most vulnerable to poverty, with 204 males (21.6%) and 322 females (31.6%) in their respective age groups living below the poverty level.
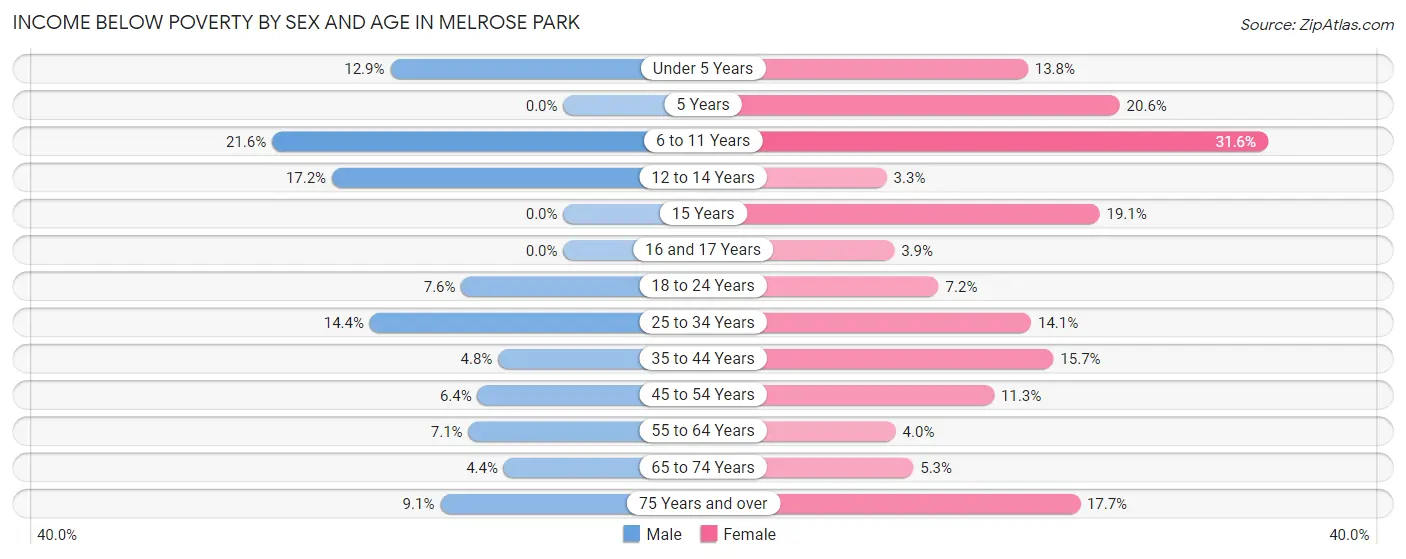
| Age Bracket | Male | Female |
| Under 5 Years | 92 (12.9%) | 119 (13.8%) |
| 5 Years | 0 (0.0%) | 26 (20.6%) |
| 6 to 11 Years | 204 (21.6%) | 322 (31.6%) |
| 12 to 14 Years | 111 (17.2%) | 18 (3.3%) |
| 15 Years | 0 (0.0%) | 49 (19.1%) |
| 16 and 17 Years | 0 (0.0%) | 15 (3.9%) |
| 18 to 24 Years | 116 (7.6%) | 96 (7.2%) |
| 25 to 34 Years | 253 (14.4%) | 251 (14.1%) |
| 35 to 44 Years | 97 (4.8%) | 213 (15.7%) |
| 45 to 54 Years | 109 (6.4%) | 183 (11.3%) |
| 55 to 64 Years | 103 (7.0%) | 60 (4.0%) |
| 65 to 74 Years | 41 (4.4%) | 33 (5.3%) |
| 75 Years and over | 36 (9.1%) | 137 (17.7%) |
| Total | 1,162 (9.0%) | 1,522 (12.5%) |
Income Above Poverty by Sex and Age in Melrose Park
According to the poverty statistics in Melrose Park, males aged 5 years and females aged 12 to 14 years are the age groups that are most secure financially, with 100.0% of males and 96.7% of females in these age groups living above the poverty line.
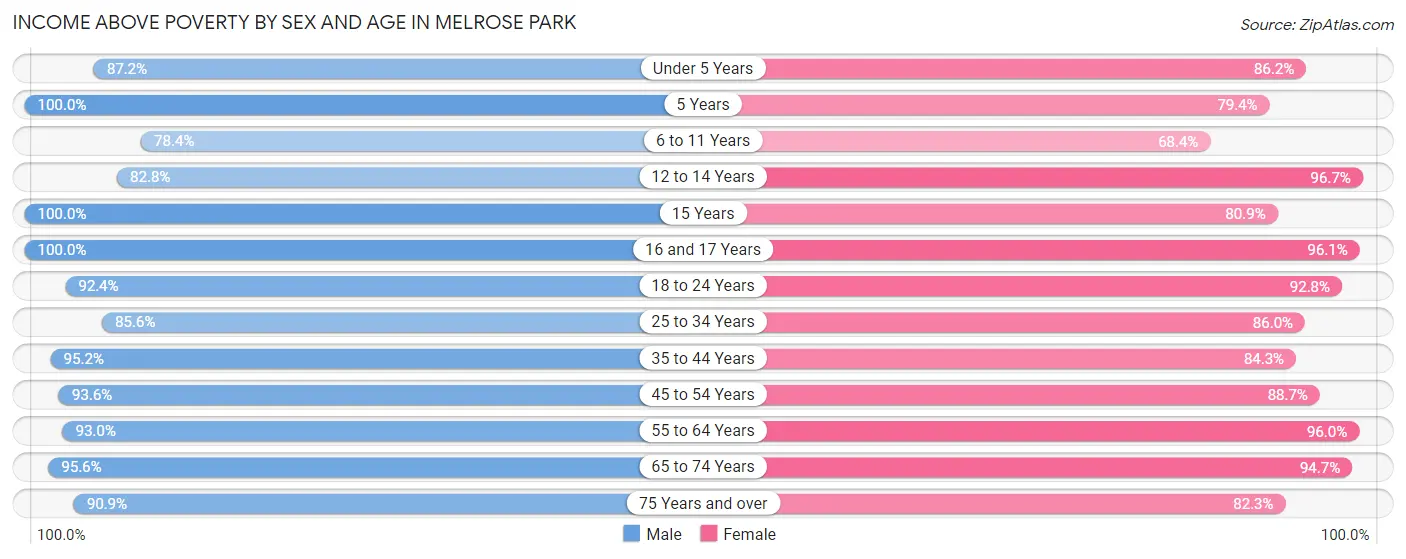
| Age Bracket | Male | Female |
| Under 5 Years | 624 (87.2%) | 743 (86.2%) |
| 5 Years | 223 (100.0%) | 100 (79.4%) |
| 6 to 11 Years | 739 (78.4%) | 696 (68.4%) |
| 12 to 14 Years | 535 (82.8%) | 522 (96.7%) |
| 15 Years | 175 (100.0%) | 207 (80.9%) |
| 16 and 17 Years | 400 (100.0%) | 371 (96.1%) |
| 18 to 24 Years | 1,416 (92.4%) | 1,240 (92.8%) |
| 25 to 34 Years | 1,508 (85.6%) | 1,536 (86.0%) |
| 35 to 44 Years | 1,909 (95.2%) | 1,143 (84.3%) |
| 45 to 54 Years | 1,601 (93.6%) | 1,437 (88.7%) |
| 55 to 64 Years | 1,357 (92.9%) | 1,441 (96.0%) |
| 65 to 74 Years | 887 (95.6%) | 588 (94.7%) |
| 75 Years and over | 358 (90.9%) | 638 (82.3%) |
| Total | 11,732 (91.0%) | 10,662 (87.5%) |
Income Below Poverty Among Married-Couple Families in Melrose Park
The poverty statistics for married-couple families in Melrose Park show that 5.6% or 201 of the total 3,592 families live below the poverty line. Families with 5 or more children have the highest poverty rate of 100.0%, comprising of 9 families. On the other hand, families with no children have the lowest poverty rate of 2.8%, which includes 46 families.
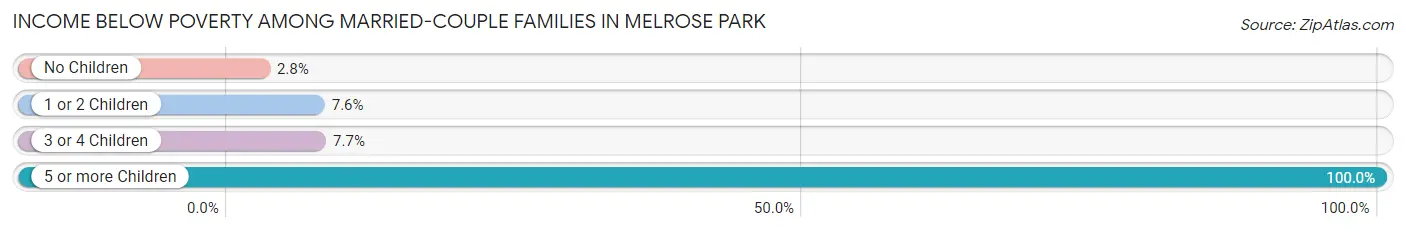
| Children | Above Poverty | Below Poverty |
| No Children | 1,608 (97.2%) | 46 (2.8%) |
| 1 or 2 Children | 1,494 (92.4%) | 122 (7.5%) |
| 3 or 4 Children | 289 (92.3%) | 24 (7.7%) |
| 5 or more Children | 0 (0.0%) | 9 (100.0%) |
| Total | 3,391 (94.4%) | 201 (5.6%) |
Income Below Poverty Among Single-Parent Households in Melrose Park
According to the poverty data in Melrose Park, 3.4% or 35 single-father households and 22.6% or 238 single-mother households are living below the poverty line. Among single-father households, those with 1 or 2 children have the highest poverty rate, with 29 households (5.1%) experiencing poverty. Likewise, among single-mother households, those with 5 or more children have the highest poverty rate, with 19 households (100.0%) falling below the poverty line.
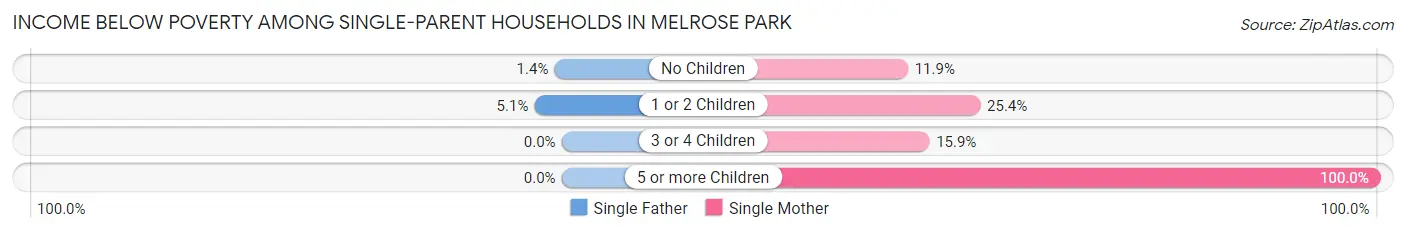
| Children | Single Father | Single Mother |
| No Children | 6 (1.3%) | 29 (11.9%) |
| 1 or 2 Children | 29 (5.1%) | 172 (25.4%) |
| 3 or 4 Children | 0 (0.0%) | 18 (15.9%) |
| 5 or more Children | 0 (0.0%) | 19 (100.0%) |
| Total | 35 (3.4%) | 238 (22.6%) |
Income Below Poverty Among Married-Couple vs Single-Parent Households in Melrose Park
The poverty data for Melrose Park shows that 201 of the married-couple family households (5.6%) and 273 of the single-parent households (13.1%) are living below the poverty level. Within the married-couple family households, those with 5 or more children have the highest poverty rate, with 9 households (100.0%) falling below the poverty line. Among the single-parent households, those with 5 or more children have the highest poverty rate, with 19 household (100.0%) living below poverty.
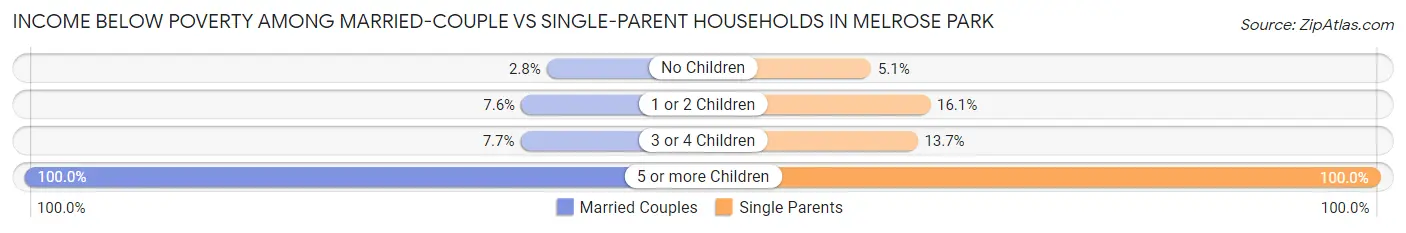
| Children | Married-Couple Families | Single-Parent Households |
| No Children | 46 (2.8%) | 35 (5.1%) |
| 1 or 2 Children | 122 (7.5%) | 201 (16.1%) |
| 3 or 4 Children | 24 (7.7%) | 18 (13.7%) |
| 5 or more Children | 9 (100.0%) | 19 (100.0%) |
| Total | 201 (5.6%) | 273 (13.1%) |
Race in Melrose Park
The most populous races in Melrose Park are Hispanic or Latino (19,882 | 79.0%), White / Caucasian (9,882 | 39.3%), and Some other Race (8,524 | 33.9%).
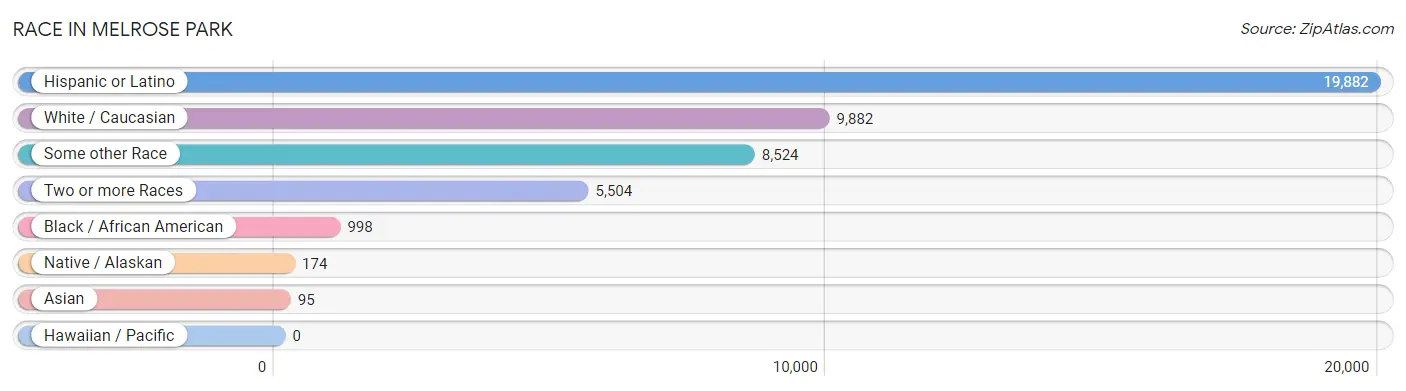
| Race | # Population | % Population |
| Asian | 95 | 0.4% |
| Black / African American | 998 | 4.0% |
| Hawaiian / Pacific | 0 | 0.0% |
| Hispanic or Latino | 19,882 | 79.0% |
| Native / Alaskan | 174 | 0.7% |
| White / Caucasian | 9,882 | 39.3% |
| Two or more Races | 5,504 | 21.9% |
| Some other Race | 8,524 | 33.9% |
| Total | 25,177 | 100.0% |
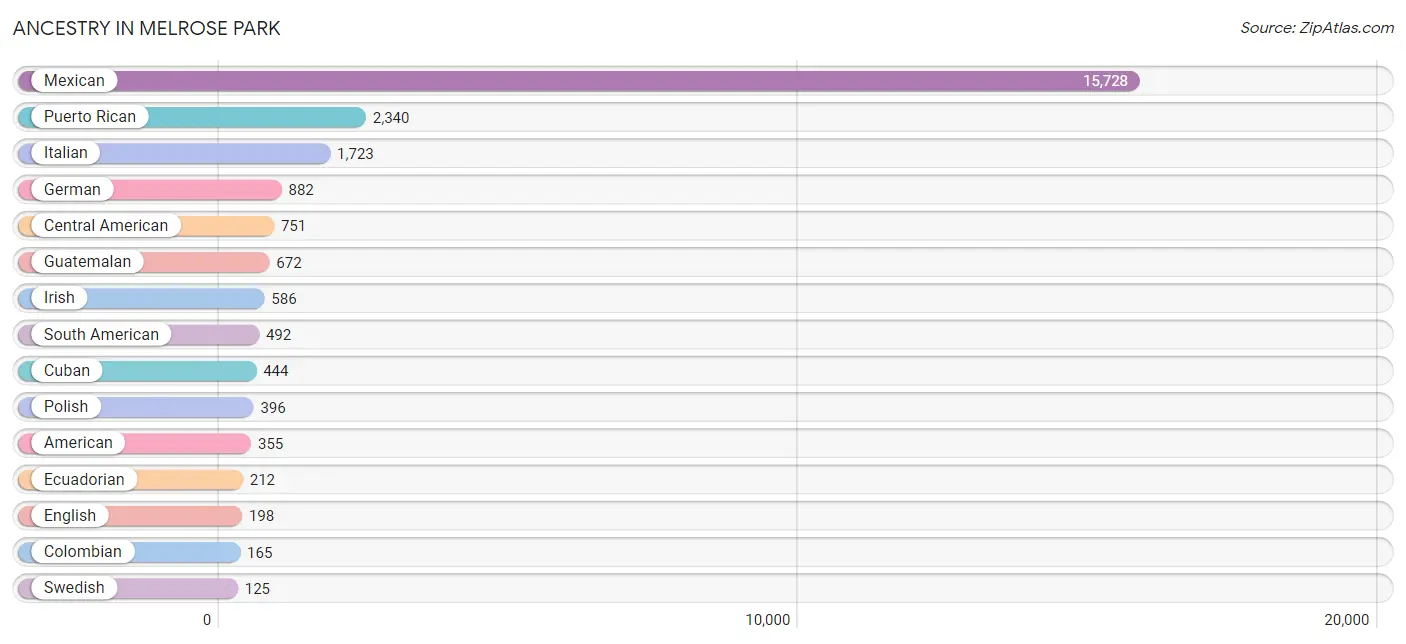
Ancestry in Melrose Park
The most populous ancestries reported in Melrose Park are Mexican (15,728 | 62.5%), Puerto Rican (2,340 | 9.3%), Italian (1,723 | 6.8%), German (882 | 3.5%), and Central American (751 | 3.0%), together accounting for 85.1% of all Melrose Park residents.
| Ancestry | # Population | % Population |
| African | 19 | 0.1% |
| Albanian | 64 | 0.3% |
| American | 355 | 1.4% |
| Arab | 21 | 0.1% |
| Argentinean | 3 | 0.0% |
| Austrian | 83 | 0.3% |
| Bhutanese | 7 | 0.0% |
| Bolivian | 9 | 0.0% |
| Brazilian | 9 | 0.0% |
| British | 13 | 0.1% |
| Central American | 751 | 3.0% |
| Central American Indian | 28 | 0.1% |
| Choctaw | 6 | 0.0% |
| Colombian | 165 | 0.7% |
| Croatian | 19 | 0.1% |
| Cuban | 444 | 1.8% |
| Czech | 25 | 0.1% |
| Dutch | 13 | 0.1% |
| Ecuadorian | 212 | 0.8% |
| English | 198 | 0.8% |
| European | 35 | 0.1% |
| French | 51 | 0.2% |
| French Canadian | 21 | 0.1% |
| German | 882 | 3.5% |
| Greek | 68 | 0.3% |
| Guatemalan | 672 | 2.7% |
| Honduran | 57 | 0.2% |
| Hungarian | 24 | 0.1% |
| Indian (Asian) | 6 | 0.0% |
| Iranian | 12 | 0.1% |
| Irish | 586 | 2.3% |
| Italian | 1,723 | 6.8% |
| Jamaican | 102 | 0.4% |
| Jordanian | 21 | 0.1% |
| Korean | 97 | 0.4% |
| Lithuanian | 85 | 0.3% |
| Luxembourger | 6 | 0.0% |
| Mexican | 15,728 | 62.5% |
| Mexican American Indian | 76 | 0.3% |
| Norwegian | 100 | 0.4% |
| Peruvian | 103 | 0.4% |
| Polish | 396 | 1.6% |
| Portuguese | 39 | 0.2% |
| Puerto Rican | 2,340 | 9.3% |
| Russian | 26 | 0.1% |
| Salvadoran | 22 | 0.1% |
| Scotch-Irish | 16 | 0.1% |
| Slavic | 21 | 0.1% |
| South American | 492 | 1.9% |
| Sri Lankan | 16 | 0.1% |
| Subsaharan African | 19 | 0.1% |
| Swedish | 125 | 0.5% |
| Thai | 5 | 0.0% |
| Ukrainian | 25 | 0.1% |
| Welsh | 17 | 0.1% |
| Yugoslavian | 19 | 0.1% | View All 56 Rows |
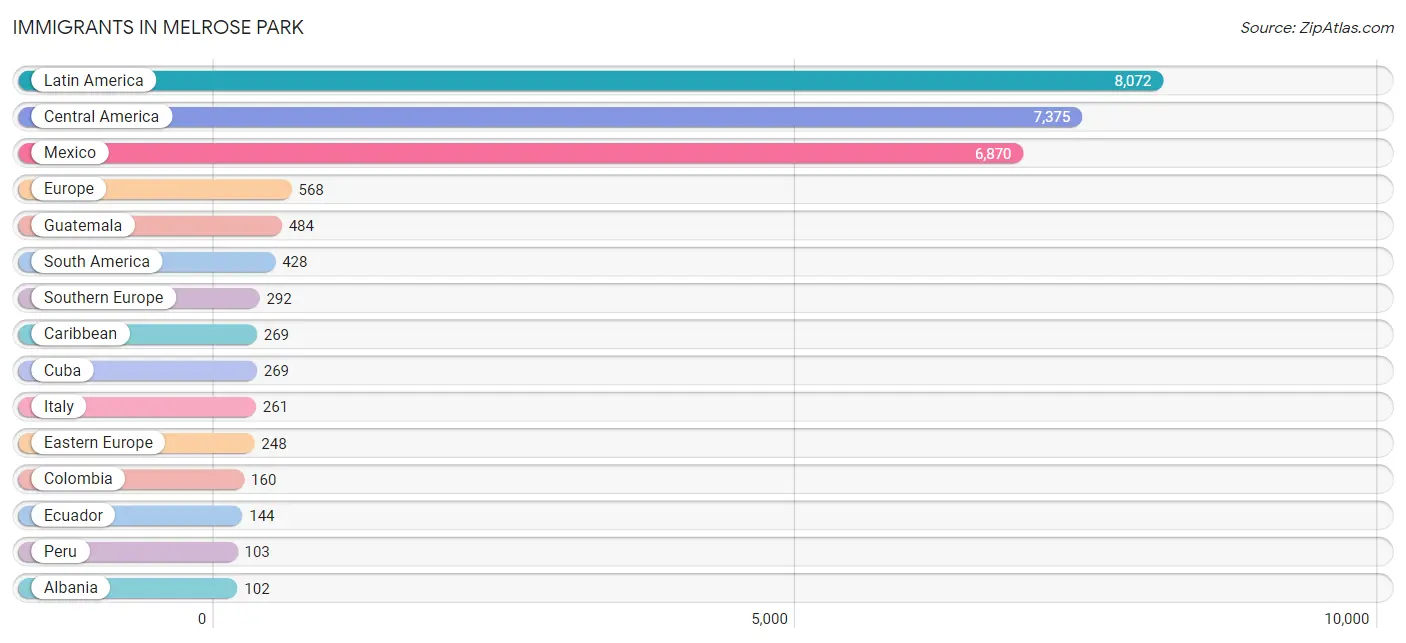
Immigrants in Melrose Park
The most numerous immigrant groups reported in Melrose Park came from Latin America (8,072 | 32.1%), Central America (7,375 | 29.3%), Mexico (6,870 | 27.3%), Europe (568 | 2.3%), and Guatemala (484 | 1.9%), together accounting for 92.8% of all Melrose Park residents.
| Immigration Origin | # Population | % Population |
| Albania | 102 | 0.4% |
| Argentina | 3 | 0.0% |
| Asia | 89 | 0.4% |
| Bolivia | 9 | 0.0% |
| Brazil | 9 | 0.0% |
| Caribbean | 269 | 1.1% |
| Central America | 7,375 | 29.3% |
| China | 14 | 0.1% |
| Colombia | 160 | 0.6% |
| Cuba | 269 | 1.1% |
| Eastern Asia | 21 | 0.1% |
| Eastern Europe | 248 | 1.0% |
| Ecuador | 144 | 0.6% |
| Europe | 568 | 2.3% |
| Germany | 10 | 0.0% |
| Guatemala | 484 | 1.9% |
| Honduras | 21 | 0.1% |
| India | 5 | 0.0% |
| Iran | 11 | 0.0% |
| Italy | 261 | 1.0% |
| Japan | 7 | 0.0% |
| Jordan | 14 | 0.1% |
| Latin America | 8,072 | 32.1% |
| Mexico | 6,870 | 27.3% |
| Northern Europe | 18 | 0.1% |
| Peru | 103 | 0.4% |
| Philippines | 29 | 0.1% |
| Poland | 91 | 0.4% |
| Portugal | 31 | 0.1% |
| Russia | 55 | 0.2% |
| South America | 428 | 1.7% |
| South Central Asia | 16 | 0.1% |
| South Eastern Asia | 38 | 0.2% |
| Southern Europe | 292 | 1.2% |
| Vietnam | 9 | 0.0% |
| Western Asia | 14 | 0.1% |
| Western Europe | 10 | 0.0% | View All 37 Rows |
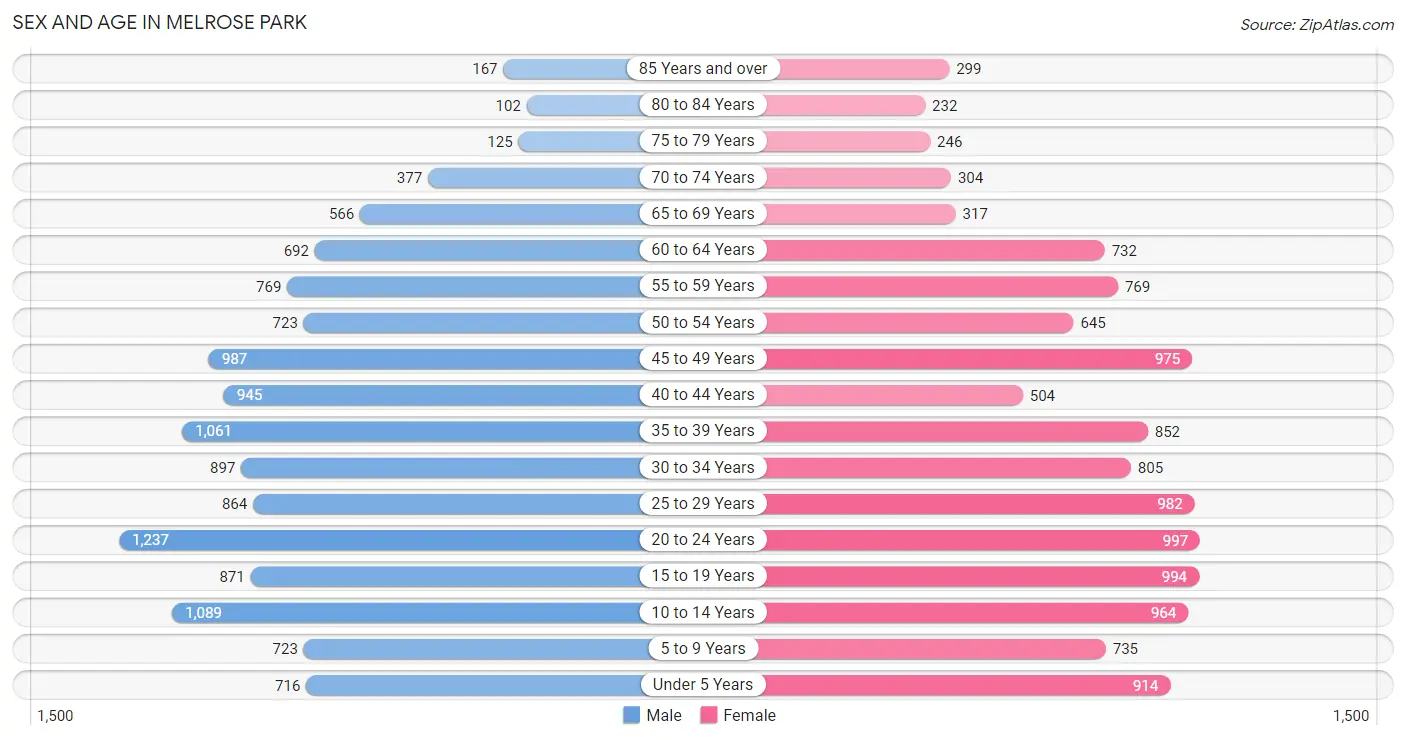
Sex and Age in Melrose Park
Sex and Age in Melrose Park
The most populous age groups in Melrose Park are 20 to 24 Years (1,237 | 9.6%) for men and 20 to 24 Years (997 | 8.1%) for women.
| Age Bracket | Male | Female |
| Under 5 Years | 716 (5.6%) | 914 (7.4%) |
| 5 to 9 Years | 723 (5.6%) | 735 (6.0%) |
| 10 to 14 Years | 1,089 (8.4%) | 964 (7.9%) |
| 15 to 19 Years | 871 (6.8%) | 994 (8.1%) |
| 20 to 24 Years | 1,237 (9.6%) | 997 (8.1%) |
| 25 to 29 Years | 864 (6.7%) | 982 (8.0%) |
| 30 to 34 Years | 897 (7.0%) | 805 (6.6%) |
| 35 to 39 Years | 1,061 (8.2%) | 852 (7.0%) |
| 40 to 44 Years | 945 (7.3%) | 504 (4.1%) |
| 45 to 49 Years | 987 (7.6%) | 975 (8.0%) |
| 50 to 54 Years | 723 (5.6%) | 645 (5.3%) |
| 55 to 59 Years | 769 (6.0%) | 769 (6.3%) |
| 60 to 64 Years | 692 (5.4%) | 732 (6.0%) |
| 65 to 69 Years | 566 (4.4%) | 317 (2.6%) |
| 70 to 74 Years | 377 (2.9%) | 304 (2.5%) |
| 75 to 79 Years | 125 (1.0%) | 246 (2.0%) |
| 80 to 84 Years | 102 (0.8%) | 232 (1.9%) |
| 85 Years and over | 167 (1.3%) | 299 (2.4%) |
| Total | 12,911 (100.0%) | 12,266 (100.0%) |
Families and Households in Melrose Park
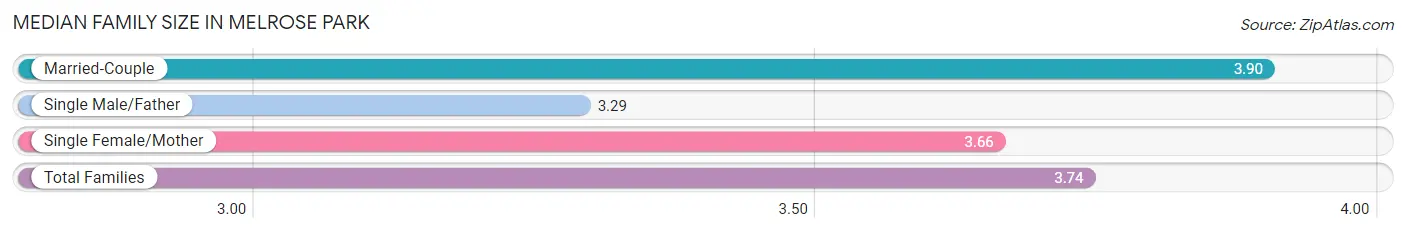
Median Family Size in Melrose Park
The median family size in Melrose Park is 3.74 persons per family, with married-couple families (3,592 | 63.3%) accounting for the largest median family size of 3.9 persons per family. On the other hand, single male/father families (1,034 | 18.2%) represent the smallest median family size with 3.29 persons per family.
| Family Type | # Families | Family Size |
| Married-Couple | 3,592 (63.3%) | 3.90 |
| Single Male/Father | 1,034 (18.2%) | 3.29 |
| Single Female/Mother | 1,052 (18.5%) | 3.66 |
| Total Families | 5,678 (100.0%) | 3.74 |
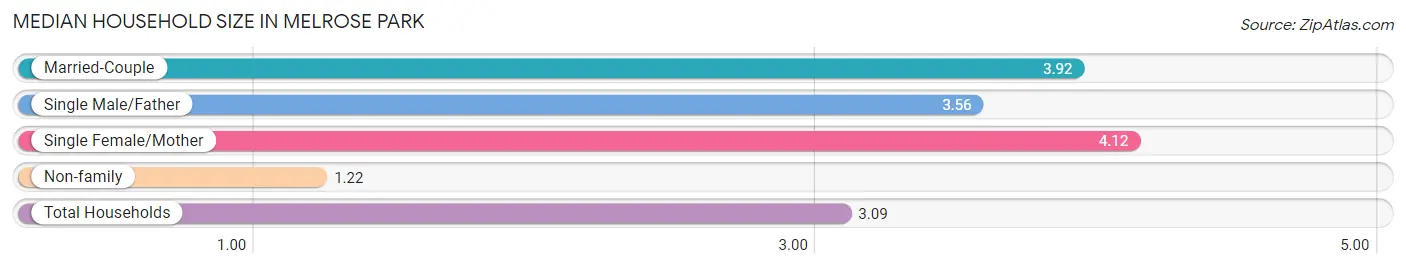
Median Household Size in Melrose Park
The median household size in Melrose Park is 3.09 persons per household, with single female/mother households (1,052 | 13.0%) accounting for the largest median household size of 4.12 persons per household. non-family households (2,426 | 29.9%) represent the smallest median household size with 1.22 persons per household.
| Household Type | # Households | Household Size |
| Married-Couple | 3,592 (44.3%) | 3.92 |
| Single Male/Father | 1,034 (12.8%) | 3.56 |
| Single Female/Mother | 1,052 (13.0%) | 4.12 |
| Non-family | 2,426 (29.9%) | 1.22 |
| Total Households | 8,104 (100.0%) | 3.09 |
Household Size by Marriage Status in Melrose Park
Out of a total of 8,104 households in Melrose Park, 5,678 (70.1%) are family households, while 2,426 (29.9%) are nonfamily households. The most numerous type of family households are 4-person households, comprising 1,519, and the most common type of nonfamily households are 1-person households, comprising 2,005.
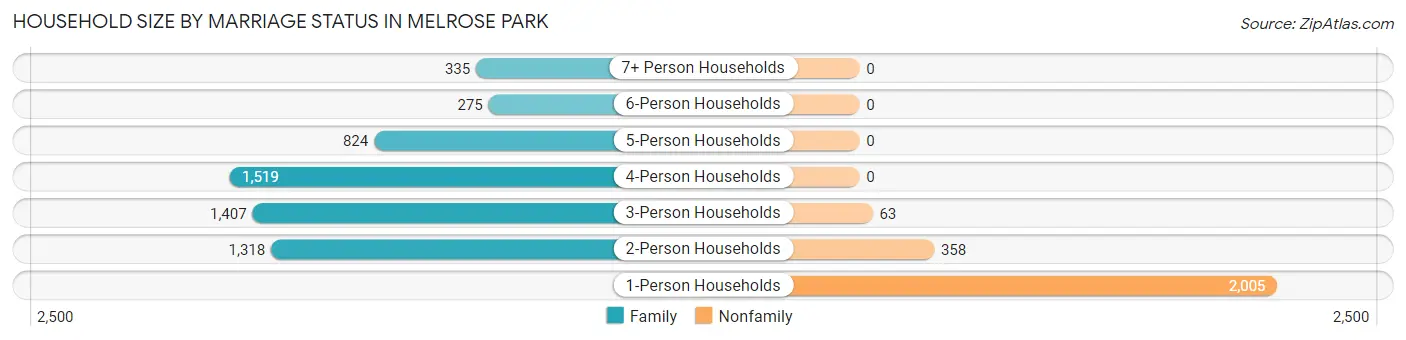
| Household Size | Family Households | Nonfamily Households |
| 1-Person Households | - | 2,005 (24.7%) |
| 2-Person Households | 1,318 (16.3%) | 358 (4.4%) |
| 3-Person Households | 1,407 (17.4%) | 63 (0.8%) |
| 4-Person Households | 1,519 (18.7%) | 0 (0.0%) |
| 5-Person Households | 824 (10.2%) | 0 (0.0%) |
| 6-Person Households | 275 (3.4%) | 0 (0.0%) |
| 7+ Person Households | 335 (4.1%) | 0 (0.0%) |
| Total | 5,678 (70.1%) | 2,426 (29.9%) |
Female Fertility in Melrose Park
Fertility by Age in Melrose Park
Average fertility rate in Melrose Park is 27.0 births per 1,000 women. Women in the age bracket of 20 to 34 years have the highest fertility rate with 45.0 births per 1,000 women. Women in the age bracket of 20 to 34 years acount for 73.8% of all women with births.
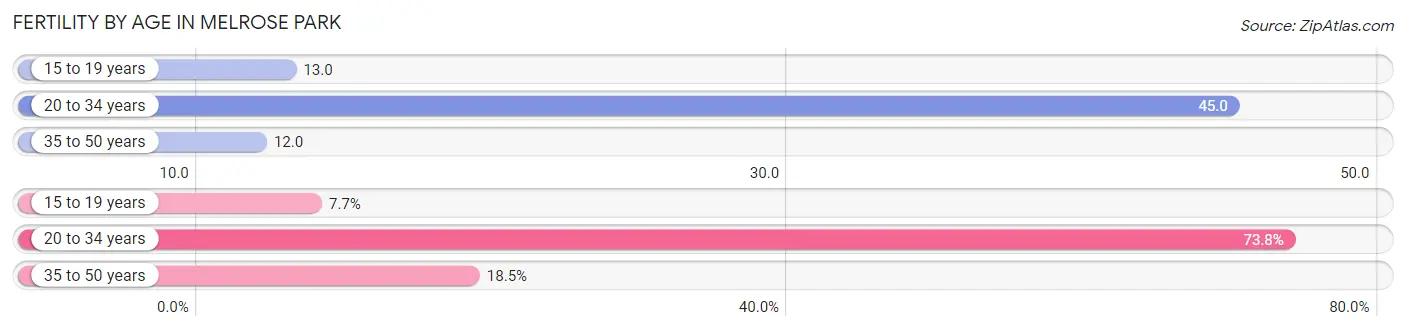
| Age Bracket | Women with Births | Births / 1,000 Women |
| 15 to 19 years | 13 (7.7%) | 13.0 |
| 20 to 34 years | 124 (73.8%) | 45.0 |
| 35 to 50 years | 31 (18.4%) | 12.0 |
| Total | 168 (100.0%) | 27.0 |
Fertility by Age by Marriage Status in Melrose Park
66.1% of women with births (168) in Melrose Park are married. The highest percentage of unmarried women with births falls into 15 to 19 years age bracket with 100.0% of them unmarried at the time of birth, while the lowest percentage of unmarried women with births belong to 20 to 34 years age bracket with 19.4% of them unmarried.
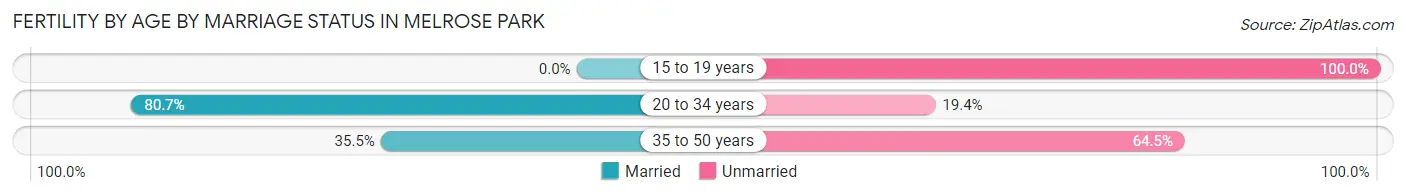
| Age Bracket | Married | Unmarried |
| 15 to 19 years | 0 (0.0%) | 13 (100.0%) |
| 20 to 34 years | 100 (80.6%) | 24 (19.4%) |
| 35 to 50 years | 11 (35.5%) | 20 (64.5%) |
| Total | 111 (66.1%) | 57 (33.9%) |
Fertility by Education in Melrose Park
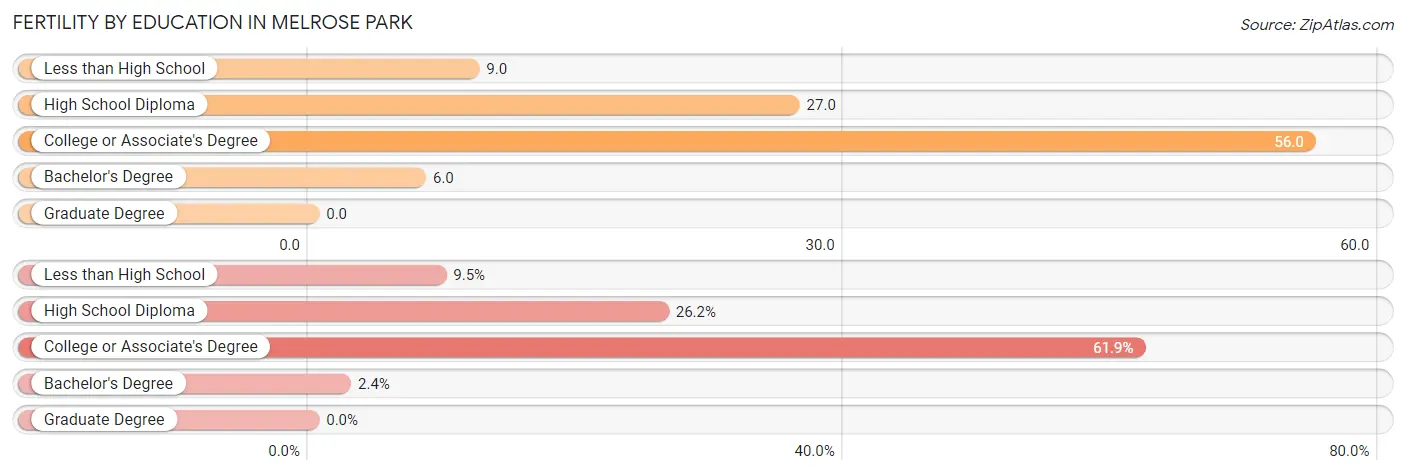
| Educational Attainment | Women with Births | Births / 1,000 Women |
| Less than High School | 16 (9.5%) | 9.0 |
| High School Diploma | 44 (26.2%) | 27.0 |
| College or Associate's Degree | 104 (61.9%) | 56.0 |
| Bachelor's Degree | 4 (2.4%) | 6.0 |
| Graduate Degree | 0 (0.0%) | 0.0 |
| Total | 168 (100.0%) | 27.0 |
Fertility by Education by Marriage Status in Melrose Park
33.9% of women with births in Melrose Park are unmarried. Women with the educational attainment of high school diploma are most likely to be married with 100.0% of them married at childbirth, while women with the educational attainment of less than high school are least likely to be married with 100.0% of them unmarried at childbirth.
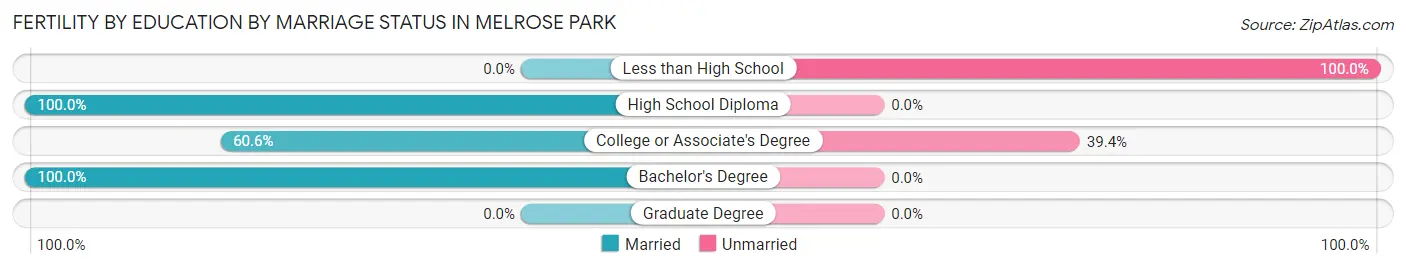
| Educational Attainment | Married | Unmarried |
| Less than High School | 0 (0.0%) | 16 (100.0%) |
| High School Diploma | 44 (100.0%) | 0 (0.0%) |
| College or Associate's Degree | 63 (60.6%) | 41 (39.4%) |
| Bachelor's Degree | 4 (100.0%) | 0 (0.0%) |
| Graduate Degree | 0 (0.0%) | 0 (0.0%) |
| Total | 111 (66.1%) | 57 (33.9%) |
Employment Characteristics in Melrose Park
Employment by Class of Employer in Melrose Park
Among the 12,205 employed individuals in Melrose Park, private company employees (9,866 | 80.8%), local government employees (870 | 7.1%), and not-for-profit organizations (584 | 4.8%) make up the most common classes of employment.
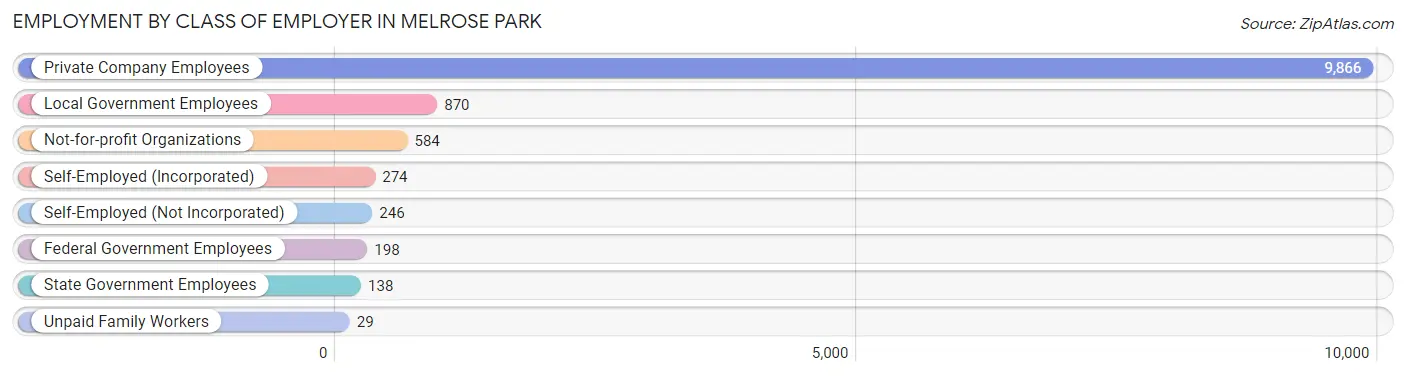
| Employer Class | # Employees | % Employees |
| Private Company Employees | 9,866 | 80.8% |
| Self-Employed (Incorporated) | 274 | 2.2% |
| Self-Employed (Not Incorporated) | 246 | 2.0% |
| Not-for-profit Organizations | 584 | 4.8% |
| Local Government Employees | 870 | 7.1% |
| State Government Employees | 138 | 1.1% |
| Federal Government Employees | 198 | 1.6% |
| Unpaid Family Workers | 29 | 0.2% |
| Total | 12,205 | 100.0% |
Employment Status by Age in Melrose Park
According to the labor force statistics for Melrose Park, out of the total population over 16 years of age (19,605), 66.6% or 13,057 individuals are in the labor force, with 5.0% or 653 of them unemployed. The age group with the highest labor force participation rate is 35 to 44 years, with 86.8% or 2,918 individuals in the labor force. Within the labor force, the 75 years and over age range has the highest percentage of unemployed individuals, with 29.1% or 34 of them being unemployed.
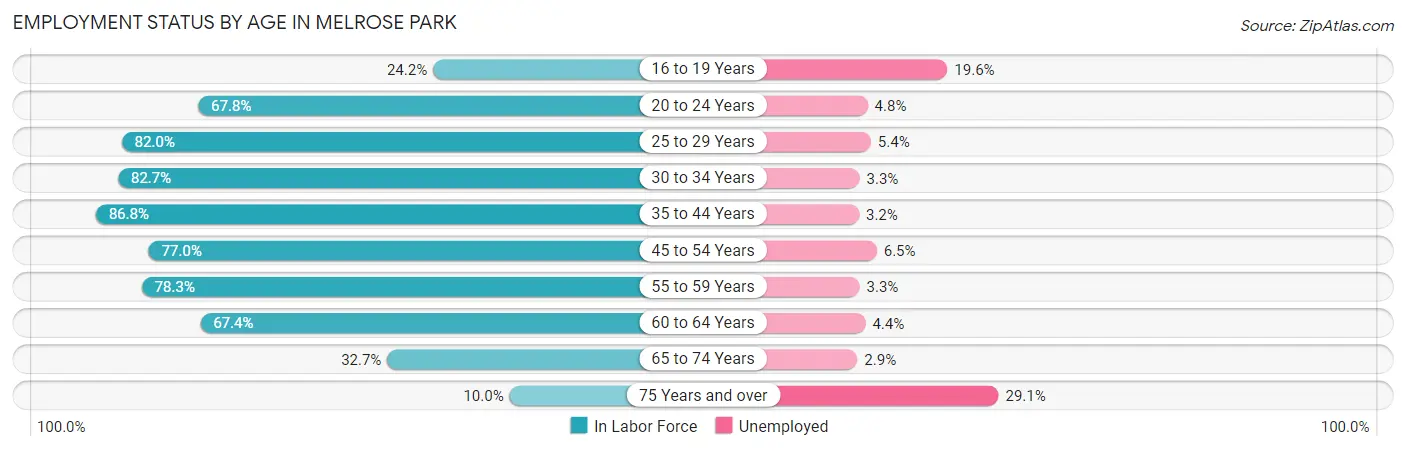
| Age Bracket | In Labor Force | Unemployed |
| 16 to 19 Years | 347 (24.2%) | 68 (19.6%) |
| 20 to 24 Years | 1,515 (67.8%) | 73 (4.8%) |
| 25 to 29 Years | 1,514 (82.0%) | 82 (5.4%) |
| 30 to 34 Years | 1,408 (82.7%) | 46 (3.3%) |
| 35 to 44 Years | 2,918 (86.8%) | 93 (3.2%) |
| 45 to 54 Years | 2,564 (77.0%) | 167 (6.5%) |
| 55 to 59 Years | 1,204 (78.3%) | 40 (3.3%) |
| 60 to 64 Years | 960 (67.4%) | 42 (4.4%) |
| 65 to 74 Years | 511 (32.7%) | 15 (2.9%) |
| 75 Years and over | 117 (10.0%) | 34 (29.1%) |
| Total | 13,057 (66.6%) | 653 (5.0%) |
Employment Status by Educational Attainment in Melrose Park
According to labor force statistics for Melrose Park, 80.0% of individuals (10,562) out of the total population between 25 and 64 years of age (13,202) are in the labor force, with 4.4% or 465 of them being unemployed. The group with the highest labor force participation rate are those with the educational attainment of bachelor's degree or higher, with 86.1% or 1,556 individuals in the labor force. Within the labor force, individuals with high school diploma education have the highest percentage of unemployment, with 7.0% or 245 of them being unemployed.
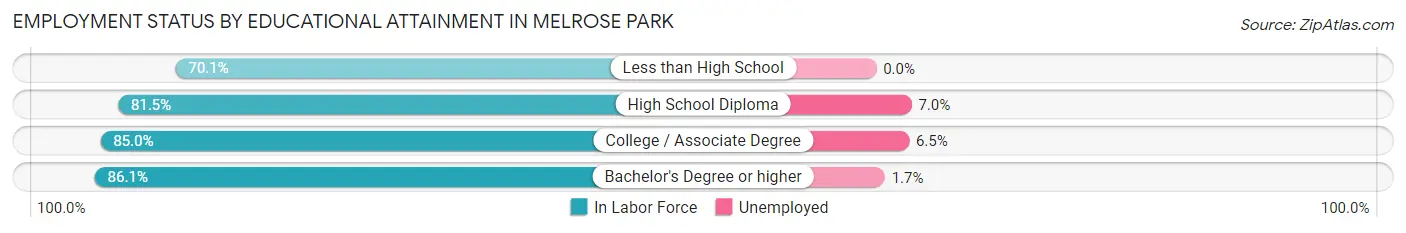
| Educational Attainment | In Labor Force | Unemployed |
| Less than High School | 2,454 (70.1%) | 0 (0.0%) |
| High School Diploma | 3,500 (81.5%) | 301 (7.0%) |
| College / Associate Degree | 3,060 (85.0%) | 234 (6.5%) |
| Bachelor's Degree or higher | 1,556 (86.1%) | 31 (1.7%) |
| Total | 10,562 (80.0%) | 581 (4.4%) |
Employment Occupations by Sex in Melrose Park
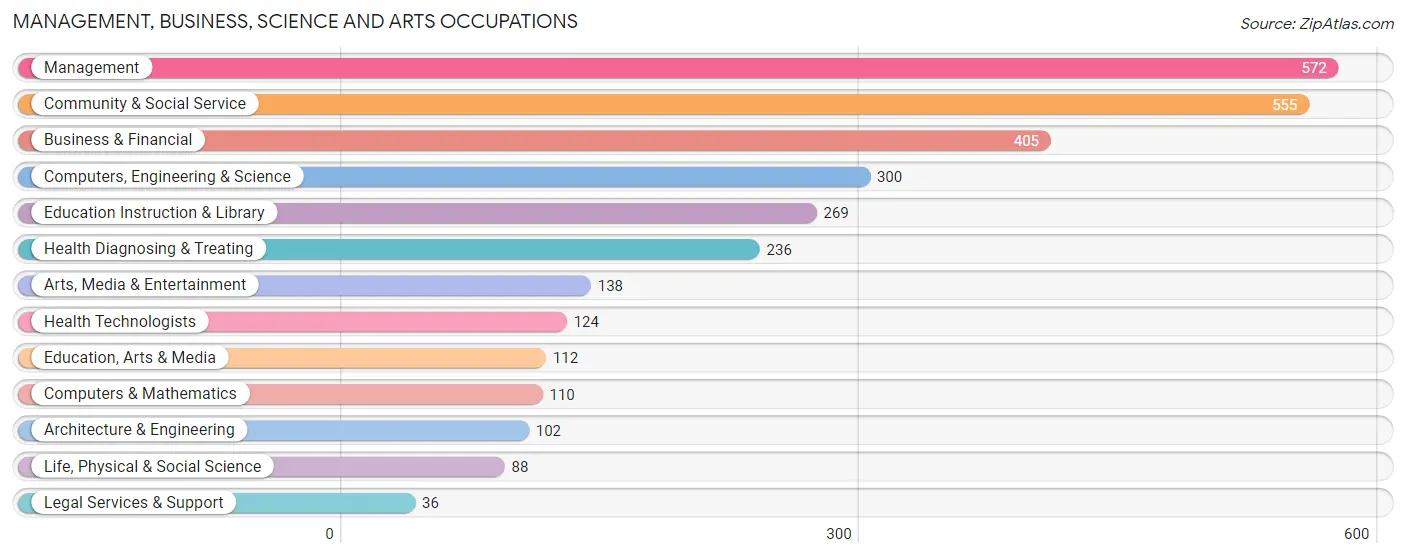
Management, Business, Science and Arts Occupations
The most common Management, Business, Science and Arts occupations in Melrose Park are Management (572 | 4.6%), Community & Social Service (555 | 4.5%), Business & Financial (405 | 3.3%), Computers, Engineering & Science (300 | 2.4%), and Education Instruction & Library (269 | 2.2%).
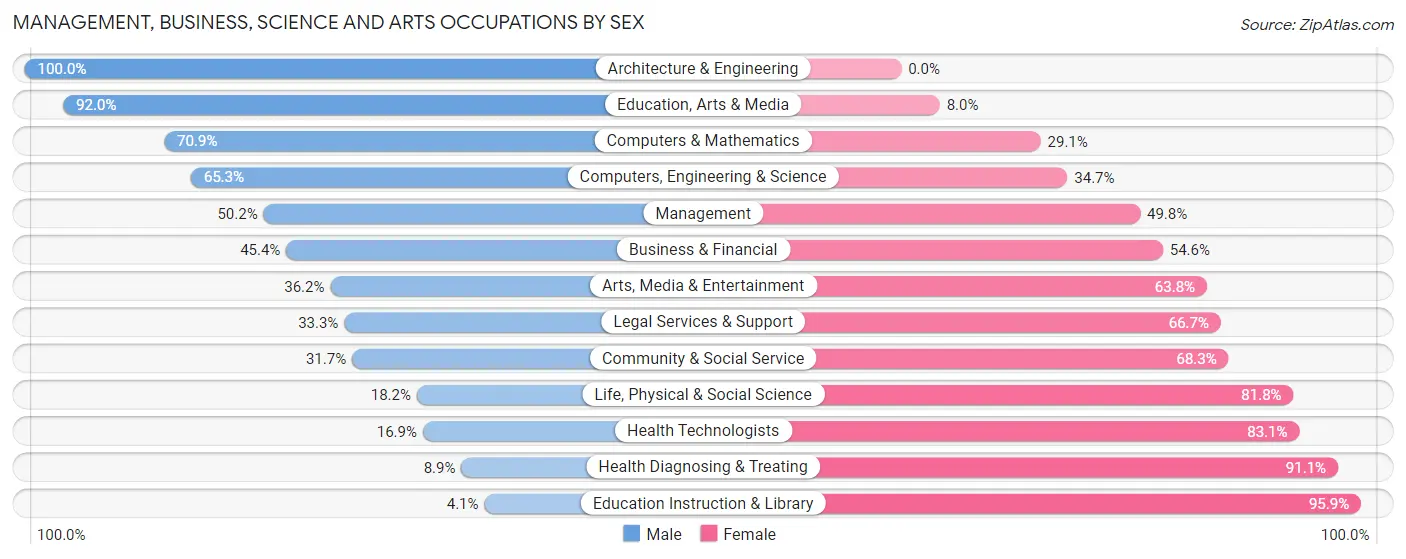
Management, Business, Science and Arts Occupations by Sex
Within the Management, Business, Science and Arts occupations in Melrose Park, the most male-oriented occupations are Architecture & Engineering (100.0%), Education, Arts & Media (92.0%), and Computers & Mathematics (70.9%), while the most female-oriented occupations are Education Instruction & Library (95.9%), Health Diagnosing & Treating (91.1%), and Health Technologists (83.1%).
| Occupation | Male | Female |
| Management | 287 (50.2%) | 285 (49.8%) |
| Business & Financial | 184 (45.4%) | 221 (54.6%) |
| Computers, Engineering & Science | 196 (65.3%) | 104 (34.7%) |
| Computers & Mathematics | 78 (70.9%) | 32 (29.1%) |
| Architecture & Engineering | 102 (100.0%) | 0 (0.0%) |
| Life, Physical & Social Science | 16 (18.2%) | 72 (81.8%) |
| Community & Social Service | 176 (31.7%) | 379 (68.3%) |
| Education, Arts & Media | 103 (92.0%) | 9 (8.0%) |
| Legal Services & Support | 12 (33.3%) | 24 (66.7%) |
| Education Instruction & Library | 11 (4.1%) | 258 (95.9%) |
| Arts, Media & Entertainment | 50 (36.2%) | 88 (63.8%) |
| Health Diagnosing & Treating | 21 (8.9%) | 215 (91.1%) |
| Health Technologists | 21 (16.9%) | 103 (83.1%) |
| Total (Category) | 864 (41.8%) | 1,204 (58.2%) |
| Total (Overall) | 7,139 (57.6%) | 5,246 (42.4%) |
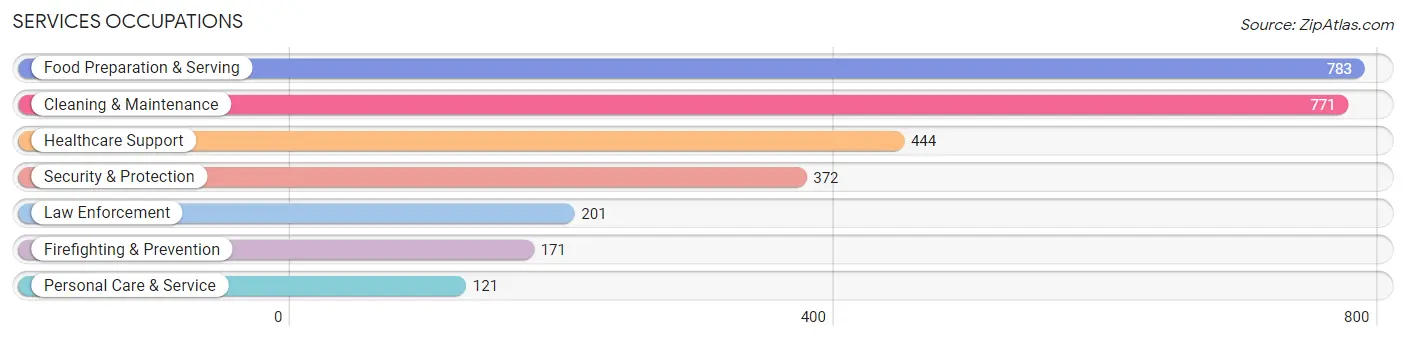
Services Occupations
The most common Services occupations in Melrose Park are Food Preparation & Serving (783 | 6.3%), Cleaning & Maintenance (771 | 6.2%), Healthcare Support (444 | 3.6%), Security & Protection (372 | 3.0%), and Law Enforcement (201 | 1.6%).
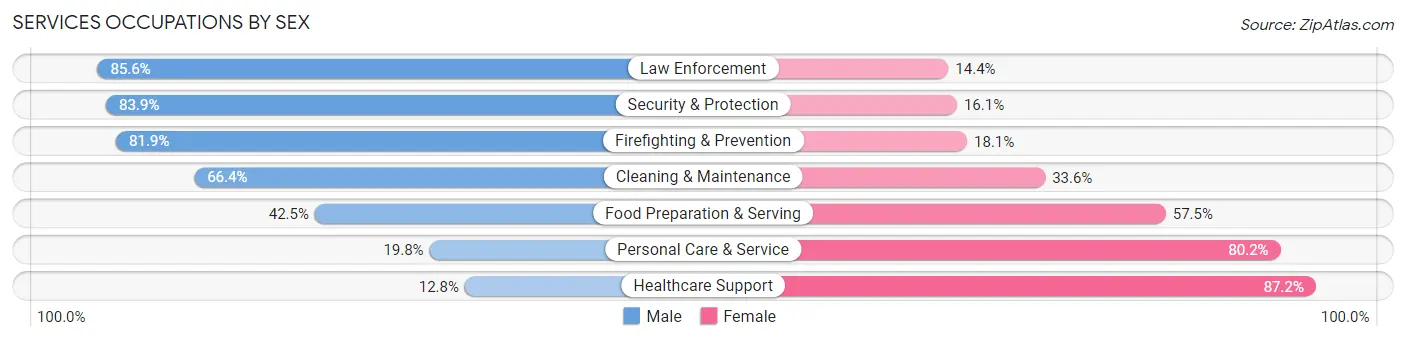
Services Occupations by Sex
Within the Services occupations in Melrose Park, the most male-oriented occupations are Law Enforcement (85.6%), Security & Protection (83.9%), and Firefighting & Prevention (81.9%), while the most female-oriented occupations are Healthcare Support (87.2%), Personal Care & Service (80.2%), and Food Preparation & Serving (57.5%).
| Occupation | Male | Female |
| Healthcare Support | 57 (12.8%) | 387 (87.2%) |
| Security & Protection | 312 (83.9%) | 60 (16.1%) |
| Firefighting & Prevention | 140 (81.9%) | 31 (18.1%) |
| Law Enforcement | 172 (85.6%) | 29 (14.4%) |
| Food Preparation & Serving | 333 (42.5%) | 450 (57.5%) |
| Cleaning & Maintenance | 512 (66.4%) | 259 (33.6%) |
| Personal Care & Service | 24 (19.8%) | 97 (80.2%) |
| Total (Category) | 1,238 (49.7%) | 1,253 (50.3%) |
| Total (Overall) | 7,139 (57.6%) | 5,246 (42.4%) |
Sales and Office Occupations
The most common Sales and Office occupations in Melrose Park are Office & Administration (1,611 | 13.0%), and Sales & Related (1,031 | 8.3%).
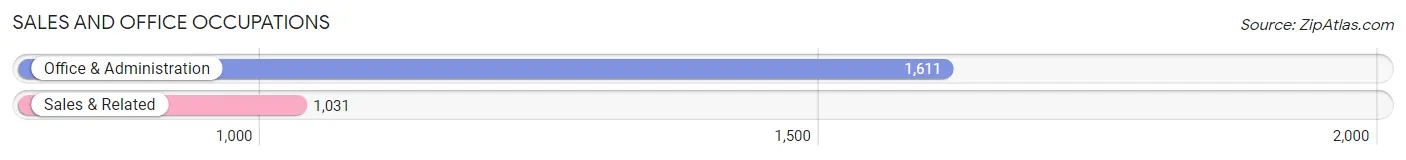
Sales and Office Occupations by Sex

| Occupation | Male | Female |
| Sales & Related | 465 (45.1%) | 566 (54.9%) |
| Office & Administration | 250 (15.5%) | 1,361 (84.5%) |
| Total (Category) | 715 (27.1%) | 1,927 (72.9%) |
| Total (Overall) | 7,139 (57.6%) | 5,246 (42.4%) |
Natural Resources, Construction and Maintenance Occupations
The most common Natural Resources, Construction and Maintenance occupations in Melrose Park are Construction & Extraction (1,007 | 8.1%), Installation, Maintenance & Repair (556 | 4.5%), and Farming, Fishing & Forestry (37 | 0.3%).
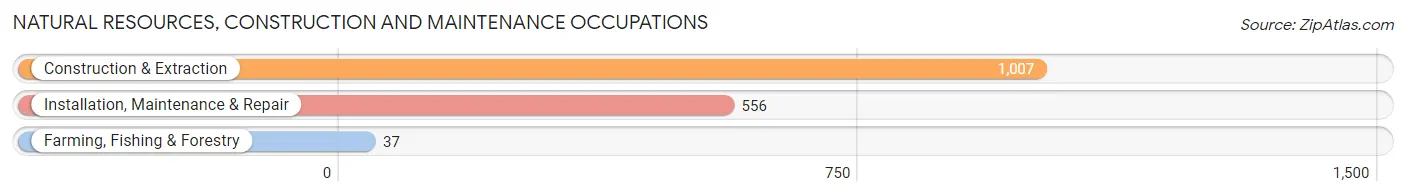
Natural Resources, Construction and Maintenance Occupations by Sex
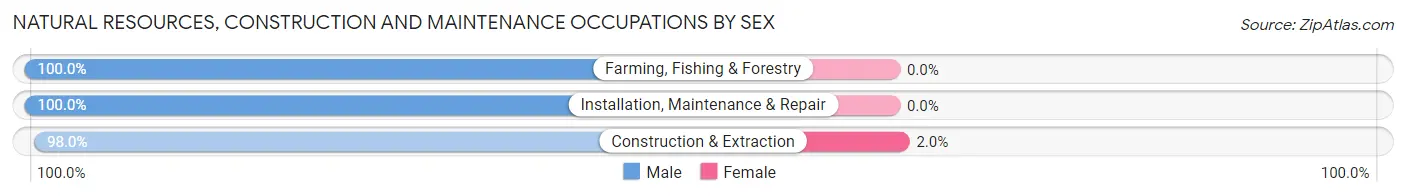
| Occupation | Male | Female |
| Farming, Fishing & Forestry | 37 (100.0%) | 0 (0.0%) |
| Construction & Extraction | 987 (98.0%) | 20 (2.0%) |
| Installation, Maintenance & Repair | 556 (100.0%) | 0 (0.0%) |
| Total (Category) | 1,580 (98.8%) | 20 (1.3%) |
| Total (Overall) | 7,139 (57.6%) | 5,246 (42.4%) |
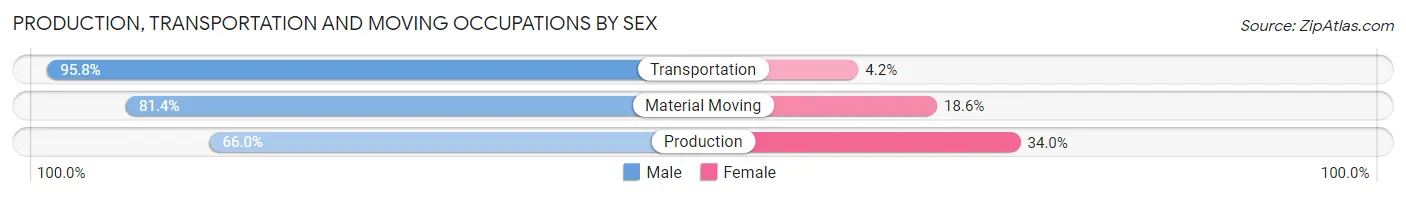
Production, Transportation and Moving Occupations
The most common Production, Transportation and Moving occupations in Melrose Park are Production (1,767 | 14.3%), Material Moving (1,148 | 9.3%), and Transportation (669 | 5.4%).
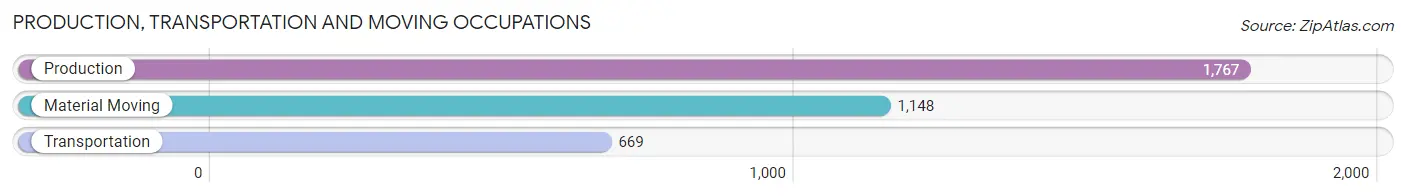
Production, Transportation and Moving Occupations by Sex
| Occupation | Male | Female |
| Production | 1,167 (66.0%) | 600 (34.0%) |
| Transportation | 641 (95.8%) | 28 (4.2%) |
| Material Moving | 934 (81.4%) | 214 (18.6%) |
| Total (Category) | 2,742 (76.5%) | 842 (23.5%) |
| Total (Overall) | 7,139 (57.6%) | 5,246 (42.4%) |
Employment Industries by Sex in Melrose Park
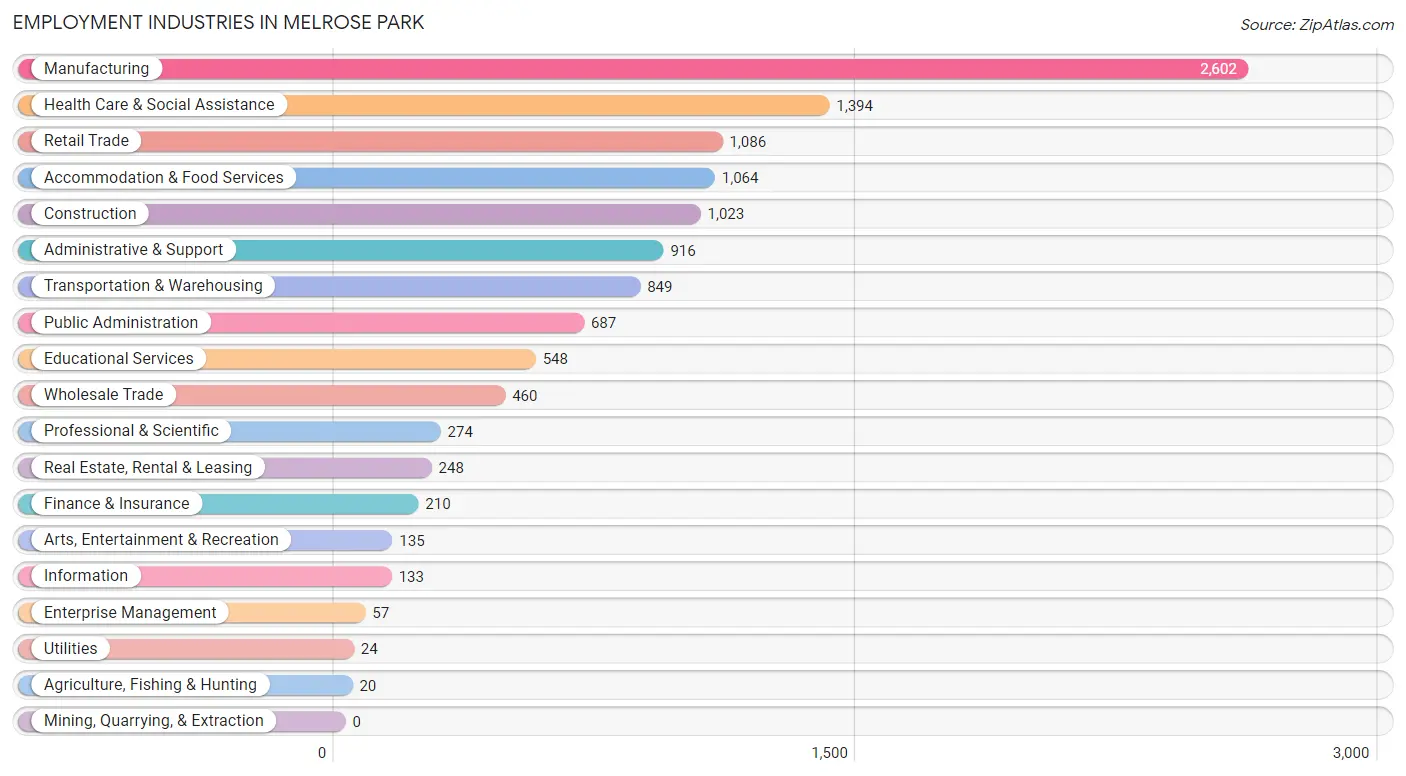
Employment Industries in Melrose Park
The major employment industries in Melrose Park include Manufacturing (2,602 | 21.0%), Health Care & Social Assistance (1,394 | 11.3%), Retail Trade (1,086 | 8.8%), Accommodation & Food Services (1,064 | 8.6%), and Construction (1,023 | 8.3%).
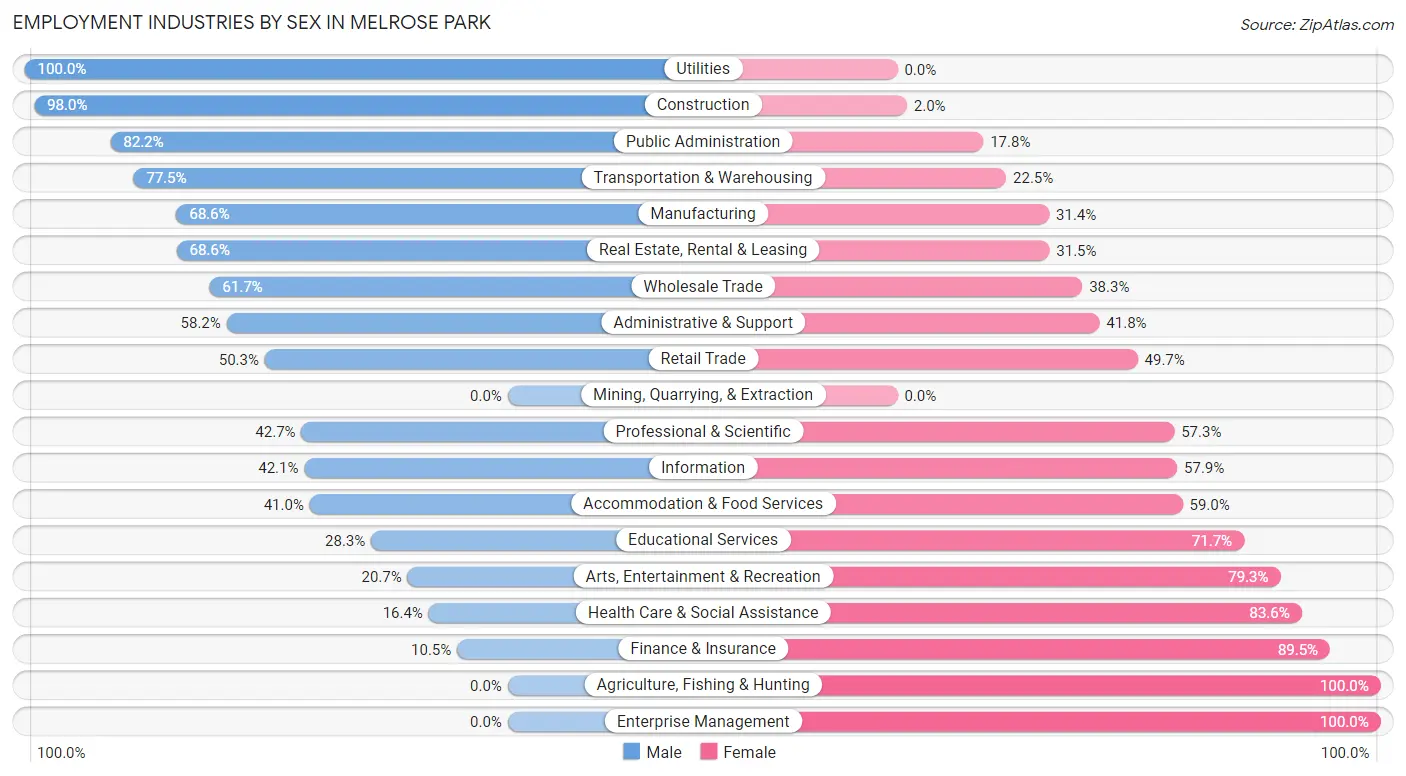
Employment Industries by Sex in Melrose Park
The Melrose Park industries that see more men than women are Utilities (100.0%), Construction (98.0%), and Public Administration (82.2%), whereas the industries that tend to have a higher number of women are Agriculture, Fishing & Hunting (100.0%), Enterprise Management (100.0%), and Finance & Insurance (89.5%).
| Industry | Male | Female |
| Agriculture, Fishing & Hunting | 0 (0.0%) | 20 (100.0%) |
| Mining, Quarrying, & Extraction | 0 (0.0%) | 0 (0.0%) |
| Construction | 1,003 (98.0%) | 20 (2.0%) |
| Manufacturing | 1,785 (68.6%) | 817 (31.4%) |
| Wholesale Trade | 284 (61.7%) | 176 (38.3%) |
| Retail Trade | 546 (50.3%) | 540 (49.7%) |
| Transportation & Warehousing | 658 (77.5%) | 191 (22.5%) |
| Utilities | 24 (100.0%) | 0 (0.0%) |
| Information | 56 (42.1%) | 77 (57.9%) |
| Finance & Insurance | 22 (10.5%) | 188 (89.5%) |
| Real Estate, Rental & Leasing | 170 (68.5%) | 78 (31.5%) |
| Professional & Scientific | 117 (42.7%) | 157 (57.3%) |
| Enterprise Management | 0 (0.0%) | 57 (100.0%) |
| Administrative & Support | 533 (58.2%) | 383 (41.8%) |
| Educational Services | 155 (28.3%) | 393 (71.7%) |
| Health Care & Social Assistance | 228 (16.4%) | 1,166 (83.6%) |
| Arts, Entertainment & Recreation | 28 (20.7%) | 107 (79.3%) |
| Accommodation & Food Services | 436 (41.0%) | 628 (59.0%) |
| Public Administration | 565 (82.2%) | 122 (17.8%) |
| Total | 7,139 (57.6%) | 5,246 (42.4%) |
Education in Melrose Park
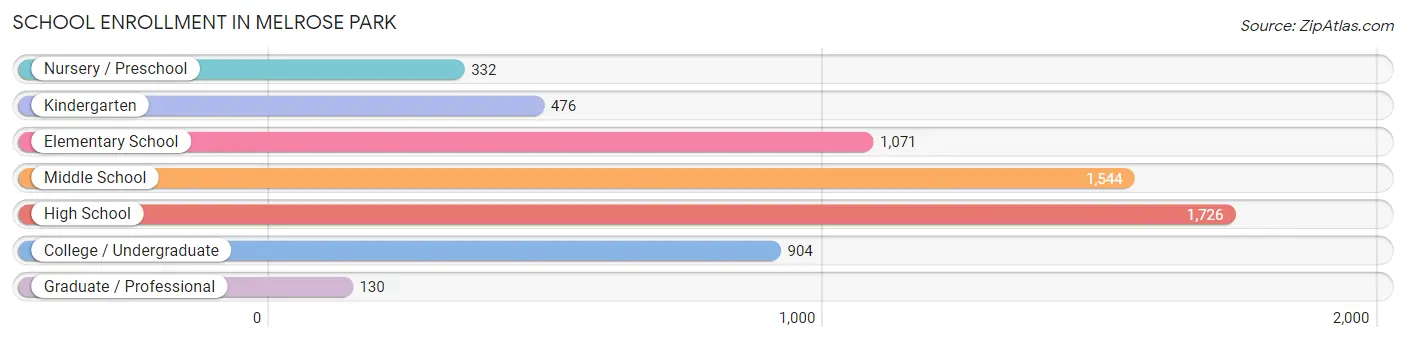
School Enrollment in Melrose Park
The most common levels of schooling among the 6,183 students in Melrose Park are high school (1,726 | 27.9%), middle school (1,544 | 25.0%), and elementary school (1,071 | 17.3%).
| School Level | # Students | % Students |
| Nursery / Preschool | 332 | 5.4% |
| Kindergarten | 476 | 7.7% |
| Elementary School | 1,071 | 17.3% |
| Middle School | 1,544 | 25.0% |
| High School | 1,726 | 27.9% |
| College / Undergraduate | 904 | 14.6% |
| Graduate / Professional | 130 | 2.1% |
| Total | 6,183 | 100.0% |
School Enrollment by Age by Funding Source in Melrose Park
Out of a total of 6,183 students who are enrolled in schools in Melrose Park, 779 (12.6%) attend a private institution, while the remaining 5,404 (87.4%) are enrolled in public schools. The age group of 35 years and over has the highest likelihood of being enrolled in private schools, with 68 (49.3% in the age bracket) enrolled. Conversely, the age group of 15 to 17 year olds has the lowest likelihood of being enrolled in a private school, with 1,129 (96.4% in the age bracket) attending a public institution.
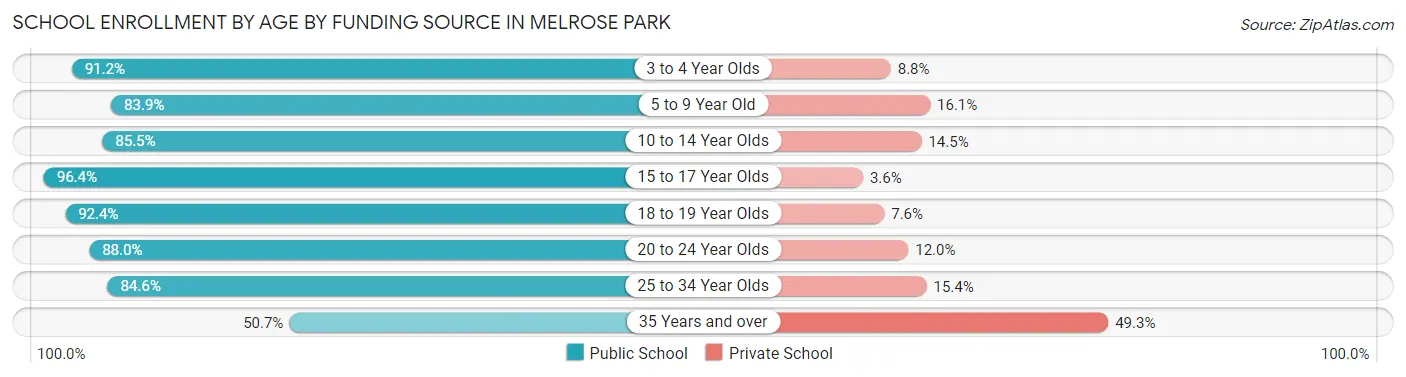
| Age Bracket | Public School | Private School |
| 3 to 4 Year Olds | 239 (91.2%) | 23 (8.8%) |
| 5 to 9 Year Old | 1,152 (83.9%) | 221 (16.1%) |
| 10 to 14 Year Olds | 1,717 (85.5%) | 291 (14.5%) |
| 15 to 17 Year Olds | 1,129 (96.4%) | 42 (3.6%) |
| 18 to 19 Year Olds | 464 (92.4%) | 38 (7.6%) |
| 20 to 24 Year Olds | 402 (88.0%) | 55 (12.0%) |
| 25 to 34 Year Olds | 230 (84.6%) | 42 (15.4%) |
| 35 Years and over | 70 (50.7%) | 68 (49.3%) |
| Total | 5,404 (87.4%) | 779 (12.6%) |
Educational Attainment by Field of Study in Melrose Park
Business (633 | 26.9%), education (364 | 15.5%), arts & humanities (313 | 13.3%), science & technology (204 | 8.7%), and engineering (157 | 6.7%) are the most common fields of study among 2,355 individuals in Melrose Park who have obtained a bachelor's degree or higher.
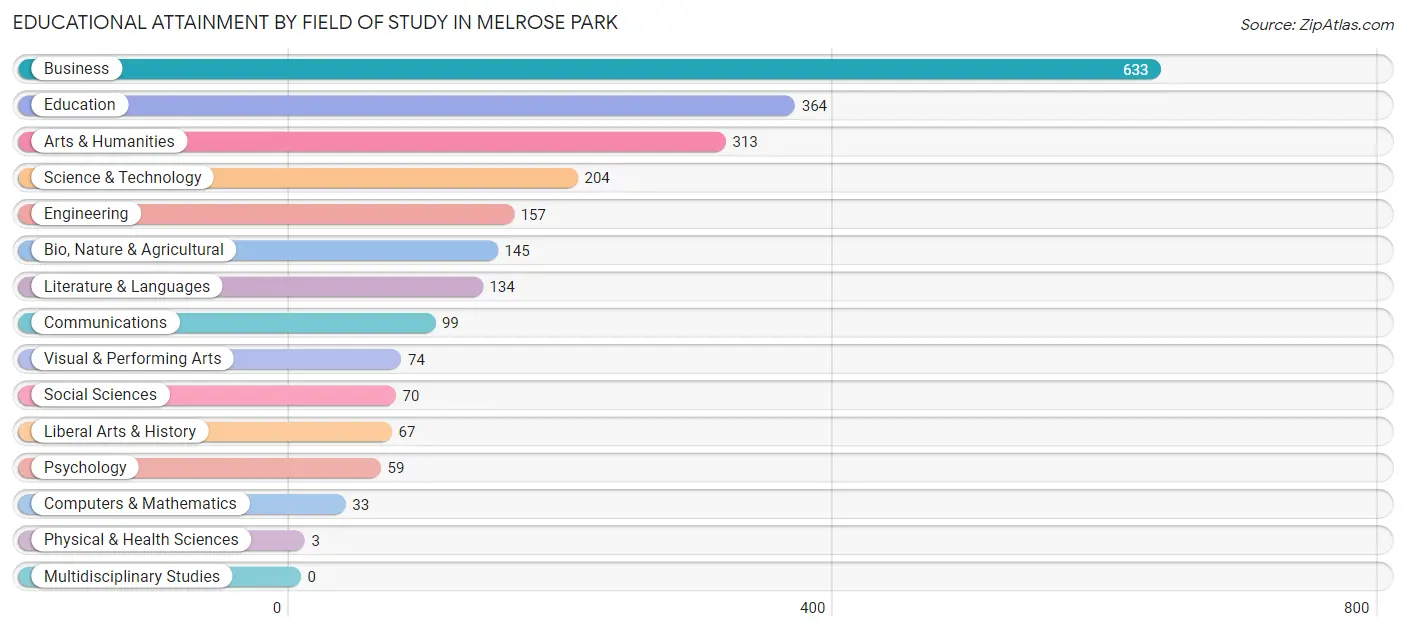
| Field of Study | # Graduates | % Graduates |
| Computers & Mathematics | 33 | 1.4% |
| Bio, Nature & Agricultural | 145 | 6.2% |
| Physical & Health Sciences | 3 | 0.1% |
| Psychology | 59 | 2.5% |
| Social Sciences | 70 | 3.0% |
| Engineering | 157 | 6.7% |
| Multidisciplinary Studies | 0 | 0.0% |
| Science & Technology | 204 | 8.7% |
| Business | 633 | 26.9% |
| Education | 364 | 15.5% |
| Literature & Languages | 134 | 5.7% |
| Liberal Arts & History | 67 | 2.9% |
| Visual & Performing Arts | 74 | 3.1% |
| Communications | 99 | 4.2% |
| Arts & Humanities | 313 | 13.3% |
| Total | 2,355 | 100.0% |
Transportation & Commute in Melrose Park
Vehicle Availability by Sex in Melrose Park
The most prevalent vehicle ownership categories in Melrose Park are males with 2 vehicles (2,378, accounting for 33.5%) and females with 2 vehicles (1,565, making up 46.6%).
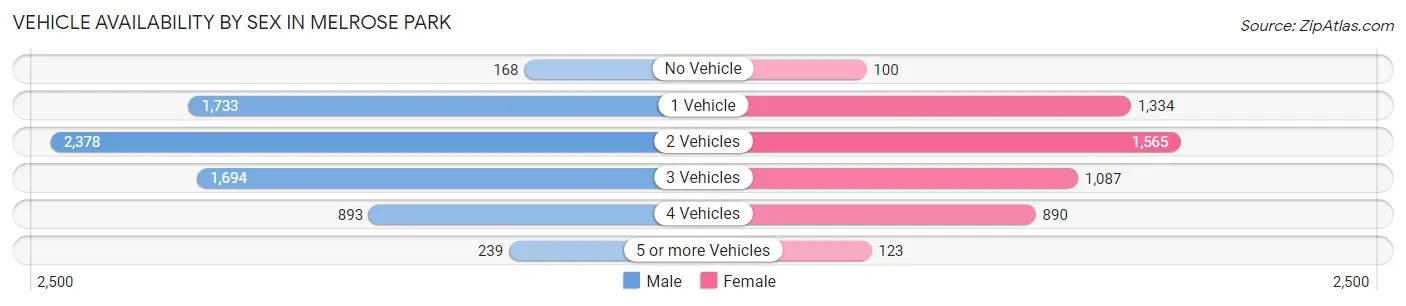
| Vehicles Available | Male | Female |
| No Vehicle | 168 (2.4%) | 100 (2.0%) |
| 1 Vehicle | 1,733 (24.4%) | 1,334 (26.2%) |
| 2 Vehicles | 2,378 (33.5%) | 1,565 (30.7%) |
| 3 Vehicles | 1,694 (23.8%) | 1,087 (21.3%) |
| 4 Vehicles | 893 (12.6%) | 890 (17.4%) |
| 5 or more Vehicles | 239 (3.4%) | 123 (2.4%) |
| Total | 7,105 (100.0%) | 5,099 (100.0%) |
Commute Time in Melrose Park
The most frequently occuring commute durations in Melrose Park are 30 to 34 minutes (2,055 commuters, 17.5%), 20 to 24 minutes (1,750 commuters, 14.9%), and 5 to 9 minutes (1,259 commuters, 10.7%).
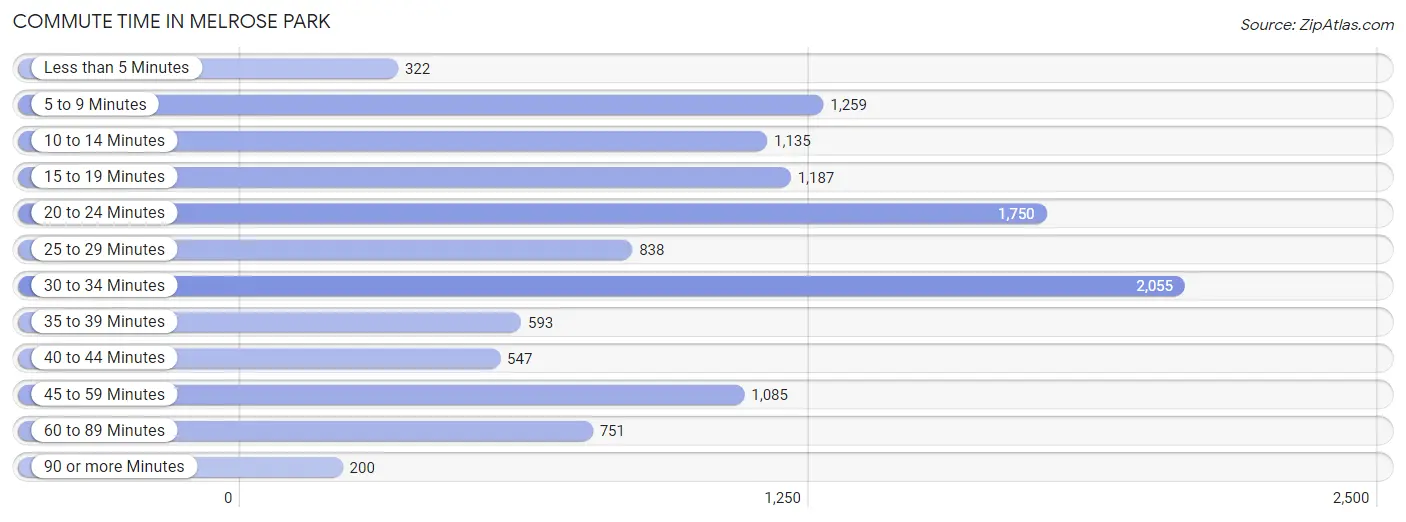
| Commute Time | # Commuters | % Commuters |
| Less than 5 Minutes | 322 | 2.8% |
| 5 to 9 Minutes | 1,259 | 10.7% |
| 10 to 14 Minutes | 1,135 | 9.7% |
| 15 to 19 Minutes | 1,187 | 10.1% |
| 20 to 24 Minutes | 1,750 | 14.9% |
| 25 to 29 Minutes | 838 | 7.1% |
| 30 to 34 Minutes | 2,055 | 17.5% |
| 35 to 39 Minutes | 593 | 5.1% |
| 40 to 44 Minutes | 547 | 4.7% |
| 45 to 59 Minutes | 1,085 | 9.3% |
| 60 to 89 Minutes | 751 | 6.4% |
| 90 or more Minutes | 200 | 1.7% |
Commute Time by Sex in Melrose Park
The most common commute times in Melrose Park are 20 to 24 minutes (1,160 commuters, 16.9%) for males and 30 to 34 minutes (963 commuters, 19.8%) for females.
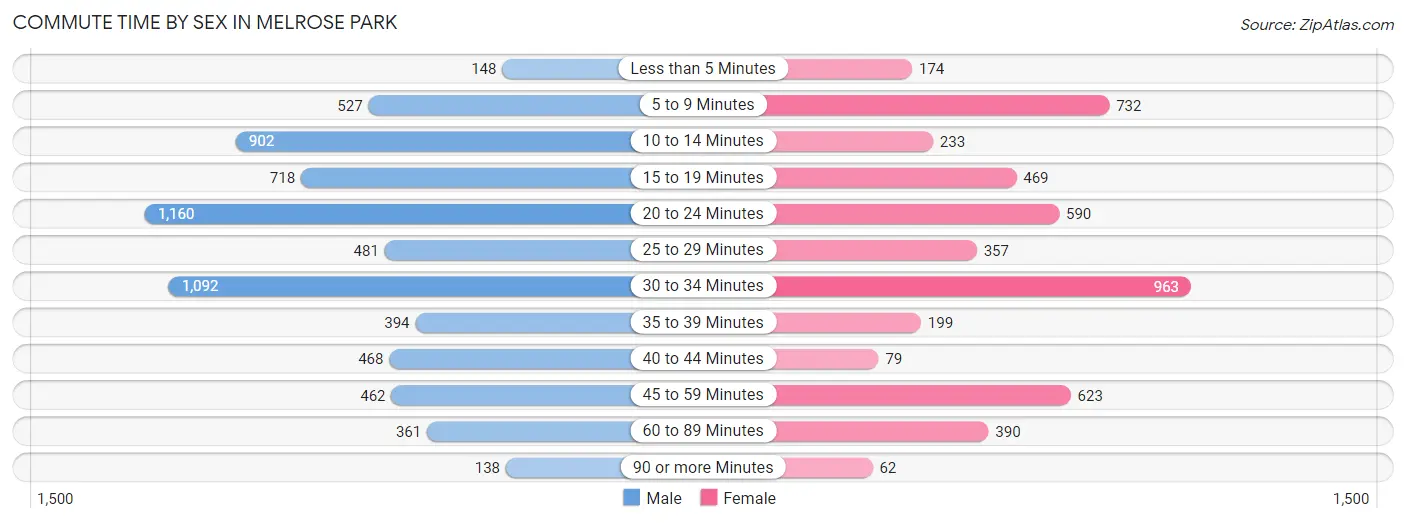
| Commute Time | Male | Female |
| Less than 5 Minutes | 148 (2.2%) | 174 (3.6%) |
| 5 to 9 Minutes | 527 (7.7%) | 732 (15.0%) |
| 10 to 14 Minutes | 902 (13.2%) | 233 (4.8%) |
| 15 to 19 Minutes | 718 (10.5%) | 469 (9.6%) |
| 20 to 24 Minutes | 1,160 (16.9%) | 590 (12.1%) |
| 25 to 29 Minutes | 481 (7.0%) | 357 (7.3%) |
| 30 to 34 Minutes | 1,092 (15.9%) | 963 (19.8%) |
| 35 to 39 Minutes | 394 (5.8%) | 199 (4.1%) |
| 40 to 44 Minutes | 468 (6.8%) | 79 (1.6%) |
| 45 to 59 Minutes | 462 (6.7%) | 623 (12.8%) |
| 60 to 89 Minutes | 361 (5.3%) | 390 (8.0%) |
| 90 or more Minutes | 138 (2.0%) | 62 (1.3%) |
Time of Departure to Work by Sex in Melrose Park
The most frequent times of departure to work in Melrose Park are 6:00 AM to 6:29 AM (1,172, 17.1%) for males and 7:00 AM to 7:29 AM (824, 16.9%) for females.
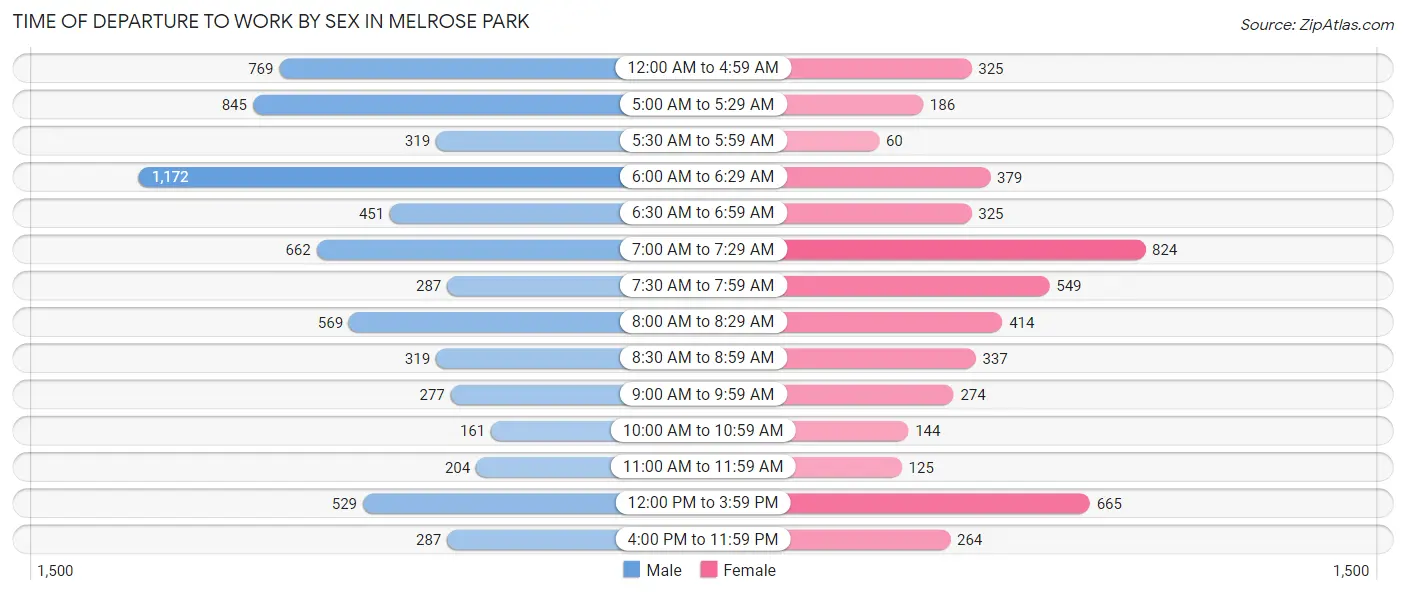
| Time of Departure | Male | Female |
| 12:00 AM to 4:59 AM | 769 (11.2%) | 325 (6.7%) |
| 5:00 AM to 5:29 AM | 845 (12.3%) | 186 (3.8%) |
| 5:30 AM to 5:59 AM | 319 (4.7%) | 60 (1.2%) |
| 6:00 AM to 6:29 AM | 1,172 (17.1%) | 379 (7.8%) |
| 6:30 AM to 6:59 AM | 451 (6.6%) | 325 (6.7%) |
| 7:00 AM to 7:29 AM | 662 (9.7%) | 824 (16.9%) |
| 7:30 AM to 7:59 AM | 287 (4.2%) | 549 (11.3%) |
| 8:00 AM to 8:29 AM | 569 (8.3%) | 414 (8.5%) |
| 8:30 AM to 8:59 AM | 319 (4.7%) | 337 (6.9%) |
| 9:00 AM to 9:59 AM | 277 (4.0%) | 274 (5.6%) |
| 10:00 AM to 10:59 AM | 161 (2.4%) | 144 (3.0%) |
| 11:00 AM to 11:59 AM | 204 (3.0%) | 125 (2.6%) |
| 12:00 PM to 3:59 PM | 529 (7.7%) | 665 (13.7%) |
| 4:00 PM to 11:59 PM | 287 (4.2%) | 264 (5.4%) |
| Total | 6,851 (100.0%) | 4,871 (100.0%) |
Housing Occupancy in Melrose Park
Occupancy by Ownership in Melrose Park
Of the total 8,104 dwellings in Melrose Park, owner-occupied units account for 4,463 (55.1%), while renter-occupied units make up 3,641 (44.9%).
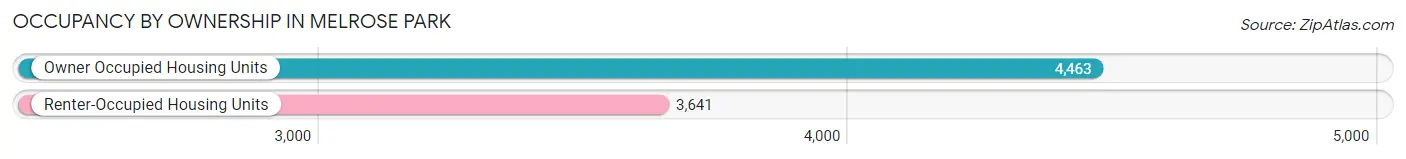
| Occupancy | # Housing Units | % Housing Units |
| Owner Occupied Housing Units | 4,463 | 55.1% |
| Renter-Occupied Housing Units | 3,641 | 44.9% |
| Total Occupied Housing Units | 8,104 | 100.0% |
Occupancy by Household Size in Melrose Park
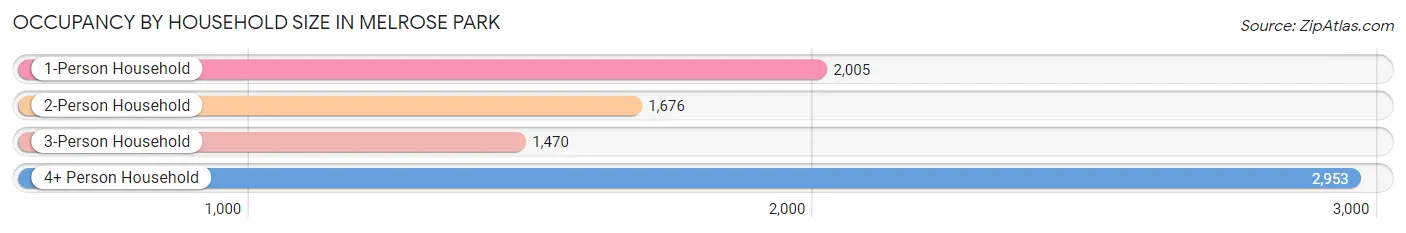
| Household Size | # Housing Units | % Housing Units |
| 1-Person Household | 2,005 | 24.7% |
| 2-Person Household | 1,676 | 20.7% |
| 3-Person Household | 1,470 | 18.1% |
| 4+ Person Household | 2,953 | 36.4% |
| Total Housing Units | 8,104 | 100.0% |
Occupancy by Ownership by Household Size in Melrose Park
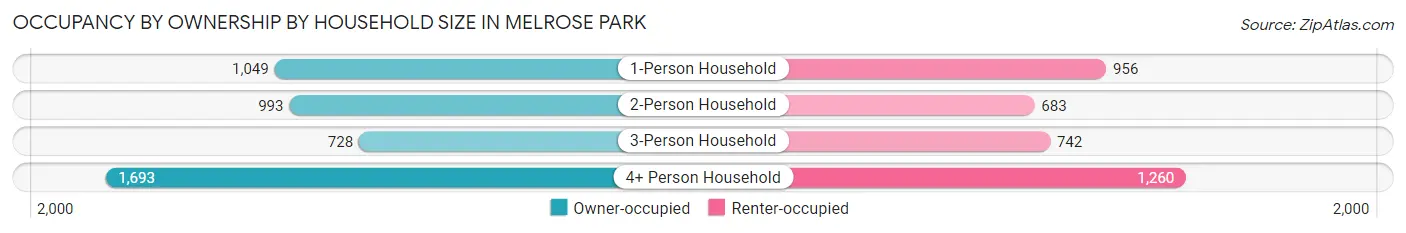
| Household Size | Owner-occupied | Renter-occupied |
| 1-Person Household | 1,049 (52.3%) | 956 (47.7%) |
| 2-Person Household | 993 (59.3%) | 683 (40.7%) |
| 3-Person Household | 728 (49.5%) | 742 (50.5%) |
| 4+ Person Household | 1,693 (57.3%) | 1,260 (42.7%) |
| Total Housing Units | 4,463 (55.1%) | 3,641 (44.9%) |
Occupancy by Educational Attainment in Melrose Park
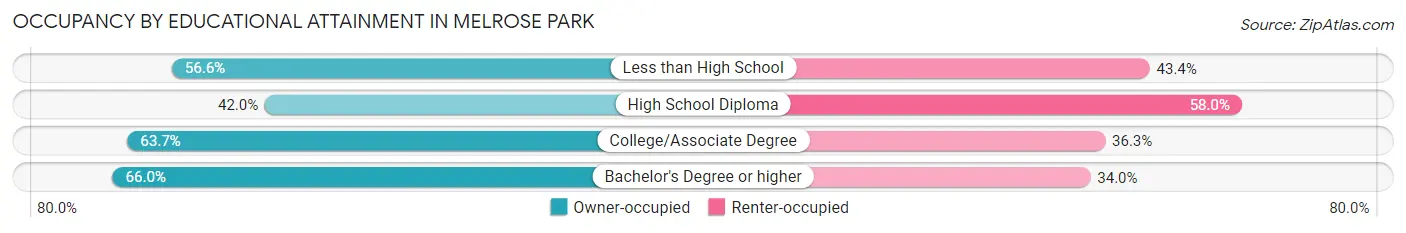
| Household Size | Owner-occupied | Renter-occupied |
| Less than High School | 1,127 (56.6%) | 863 (43.4%) |
| High School Diploma | 1,130 (42.0%) | 1,559 (58.0%) |
| College/Associate Degree | 1,514 (63.7%) | 863 (36.3%) |
| Bachelor's Degree or higher | 692 (66.0%) | 356 (34.0%) |
Occupancy by Age of Householder in Melrose Park
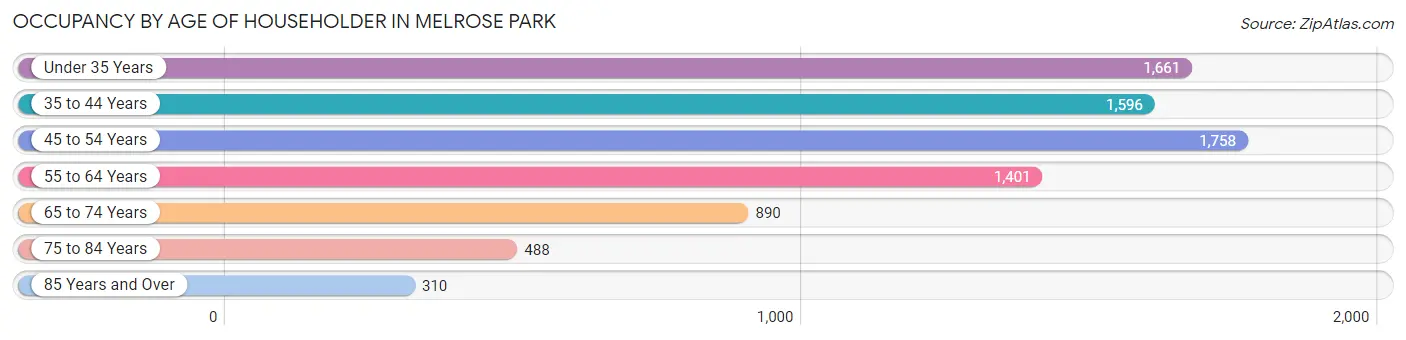
| Age Bracket | # Households | % Households |
| Under 35 Years | 1,661 | 20.5% |
| 35 to 44 Years | 1,596 | 19.7% |
| 45 to 54 Years | 1,758 | 21.7% |
| 55 to 64 Years | 1,401 | 17.3% |
| 65 to 74 Years | 890 | 11.0% |
| 75 to 84 Years | 488 | 6.0% |
| 85 Years and Over | 310 | 3.8% |
| Total | 8,104 | 100.0% |
Housing Finances in Melrose Park
Median Income by Occupancy in Melrose Park
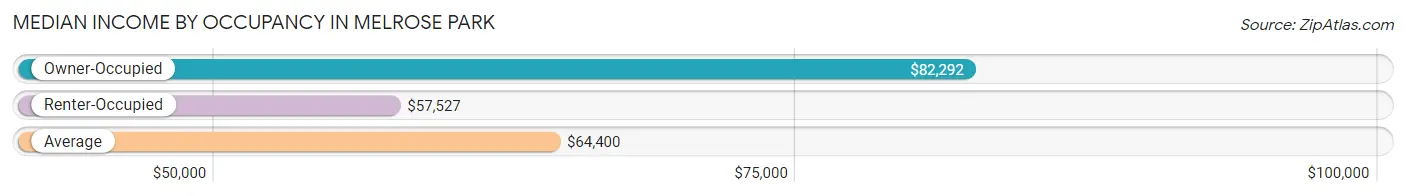
| Occupancy Type | # Households | Median Income |
| Owner-Occupied | 4,463 (55.1%) | $82,292 |
| Renter-Occupied | 3,641 (44.9%) | $57,527 |
| Average | 8,104 (100.0%) | $64,400 |
Occupancy by Householder Income Bracket in Melrose Park
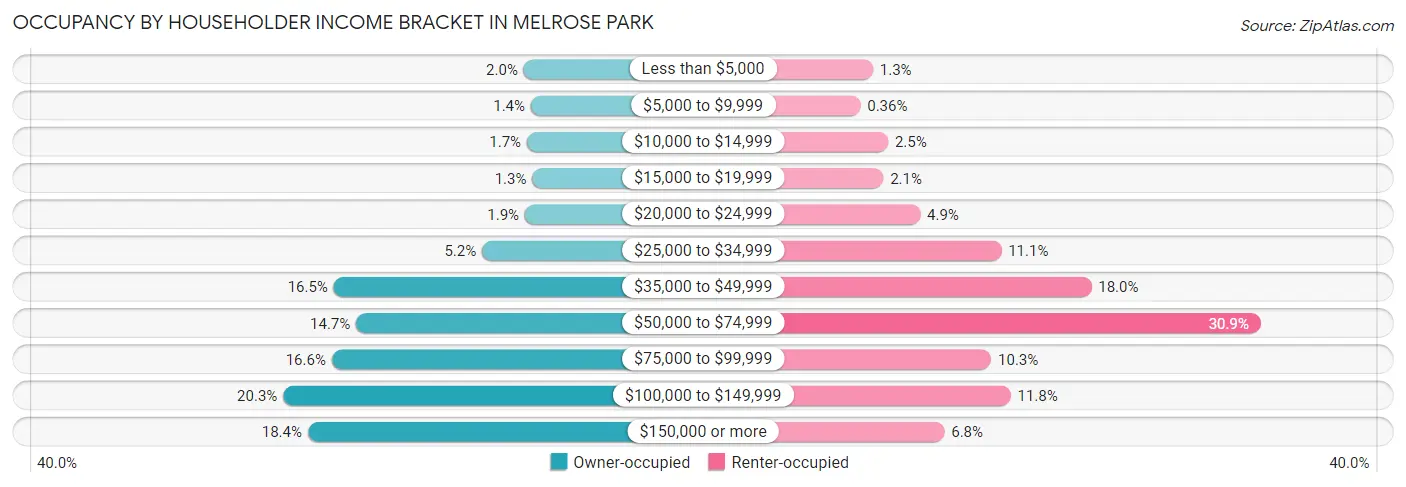
| Income Bracket | Owner-occupied | Renter-occupied |
| Less than $5,000 | 88 (2.0%) | 48 (1.3%) |
| $5,000 to $9,999 | 64 (1.4%) | 13 (0.4%) |
| $10,000 to $14,999 | 77 (1.7%) | 90 (2.5%) |
| $15,000 to $19,999 | 59 (1.3%) | 77 (2.1%) |
| $20,000 to $24,999 | 84 (1.9%) | 179 (4.9%) |
| $25,000 to $34,999 | 230 (5.1%) | 404 (11.1%) |
| $35,000 to $49,999 | 734 (16.5%) | 654 (18.0%) |
| $50,000 to $74,999 | 658 (14.7%) | 1,124 (30.9%) |
| $75,000 to $99,999 | 741 (16.6%) | 376 (10.3%) |
| $100,000 to $149,999 | 906 (20.3%) | 430 (11.8%) |
| $150,000 or more | 822 (18.4%) | 246 (6.8%) |
| Total | 4,463 (100.0%) | 3,641 (100.0%) |
Monthly Housing Cost Tiers in Melrose Park
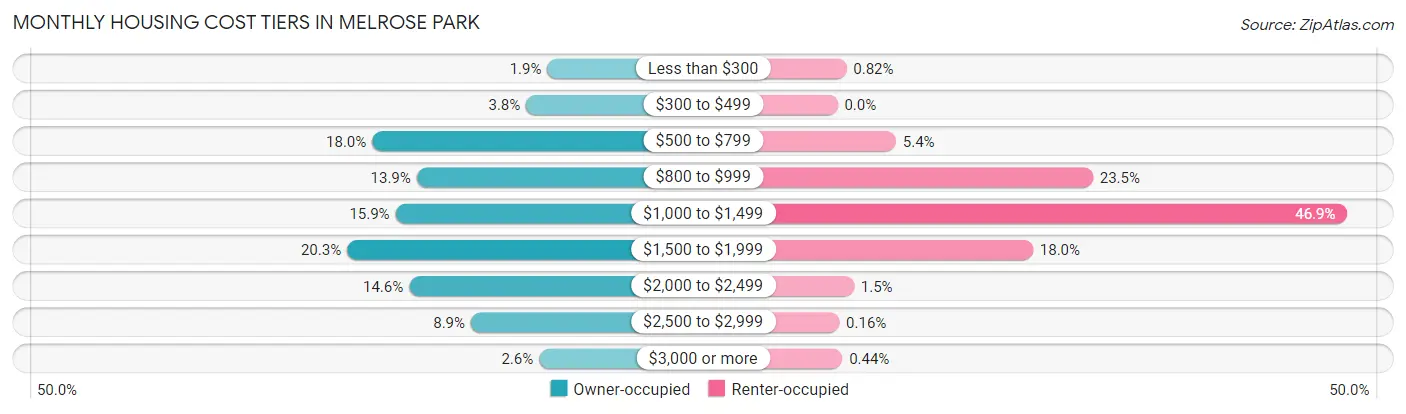
| Monthly Cost | Owner-occupied | Renter-occupied |
| Less than $300 | 84 (1.9%) | 30 (0.8%) |
| $300 to $499 | 171 (3.8%) | 0 (0.0%) |
| $500 to $799 | 804 (18.0%) | 196 (5.4%) |
| $800 to $999 | 621 (13.9%) | 856 (23.5%) |
| $1,000 to $1,499 | 708 (15.9%) | 1,709 (46.9%) |
| $1,500 to $1,999 | 907 (20.3%) | 655 (18.0%) |
| $2,000 to $2,499 | 652 (14.6%) | 55 (1.5%) |
| $2,500 to $2,999 | 398 (8.9%) | 6 (0.2%) |
| $3,000 or more | 118 (2.6%) | 16 (0.4%) |
| Total | 4,463 (100.0%) | 3,641 (100.0%) |
Physical Housing Characteristics in Melrose Park
Housing Structures in Melrose Park
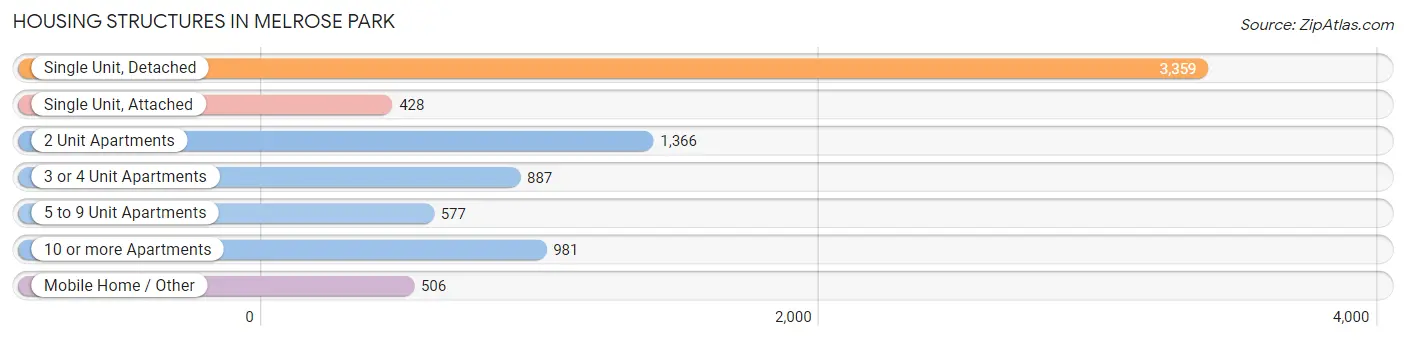
| Structure Type | # Housing Units | % Housing Units |
| Single Unit, Detached | 3,359 | 41.4% |
| Single Unit, Attached | 428 | 5.3% |
| 2 Unit Apartments | 1,366 | 16.9% |
| 3 or 4 Unit Apartments | 887 | 11.0% |
| 5 to 9 Unit Apartments | 577 | 7.1% |
| 10 or more Apartments | 981 | 12.1% |
| Mobile Home / Other | 506 | 6.2% |
| Total | 8,104 | 100.0% |
Housing Structures by Occupancy in Melrose Park
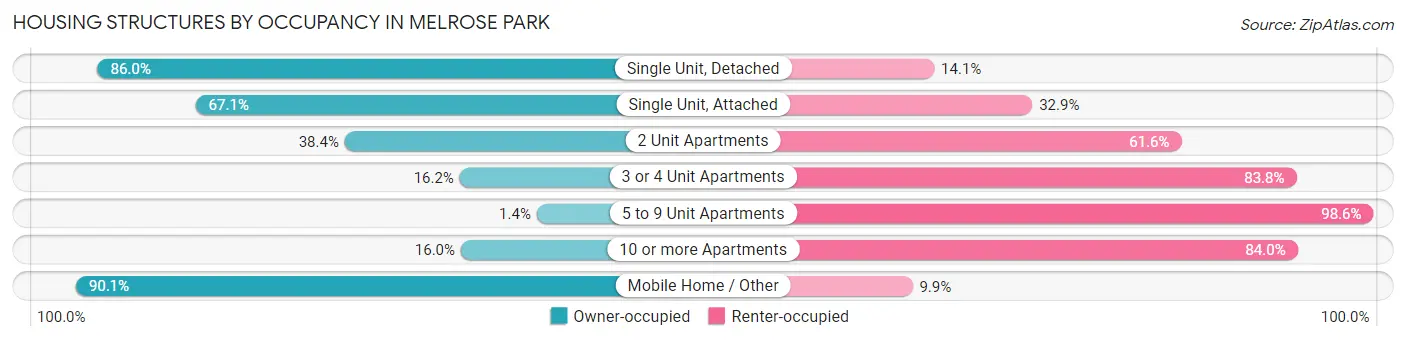
| Structure Type | Owner-occupied | Renter-occupied |
| Single Unit, Detached | 2,887 (86.0%) | 472 (14.1%) |
| Single Unit, Attached | 287 (67.1%) | 141 (32.9%) |
| 2 Unit Apartments | 524 (38.4%) | 842 (61.6%) |
| 3 or 4 Unit Apartments | 144 (16.2%) | 743 (83.8%) |
| 5 to 9 Unit Apartments | 8 (1.4%) | 569 (98.6%) |
| 10 or more Apartments | 157 (16.0%) | 824 (84.0%) |
| Mobile Home / Other | 456 (90.1%) | 50 (9.9%) |
| Total | 4,463 (55.1%) | 3,641 (44.9%) |
Housing Structures by Number of Rooms in Melrose Park
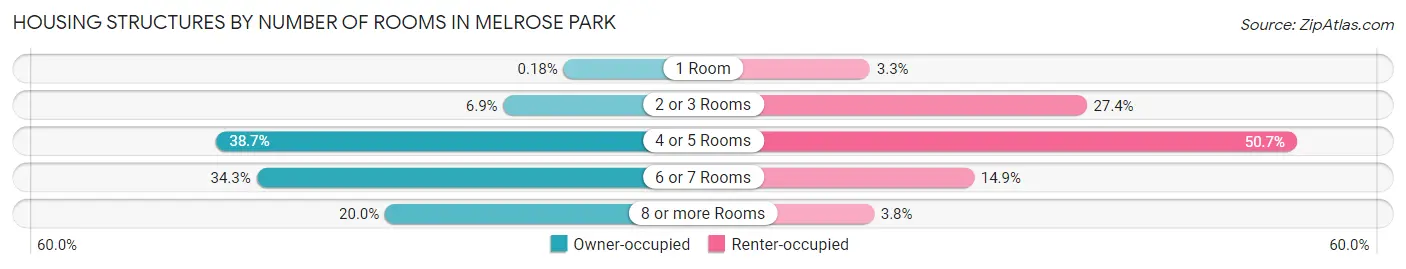
| Number of Rooms | Owner-occupied | Renter-occupied |
| 1 Room | 8 (0.2%) | 121 (3.3%) |
| 2 or 3 Rooms | 306 (6.9%) | 996 (27.4%) |
| 4 or 5 Rooms | 1,728 (38.7%) | 1,846 (50.7%) |
| 6 or 7 Rooms | 1,529 (34.3%) | 541 (14.9%) |
| 8 or more Rooms | 892 (20.0%) | 137 (3.8%) |
| Total | 4,463 (100.0%) | 3,641 (100.0%) |
Housing Structure by Heating Type in Melrose Park
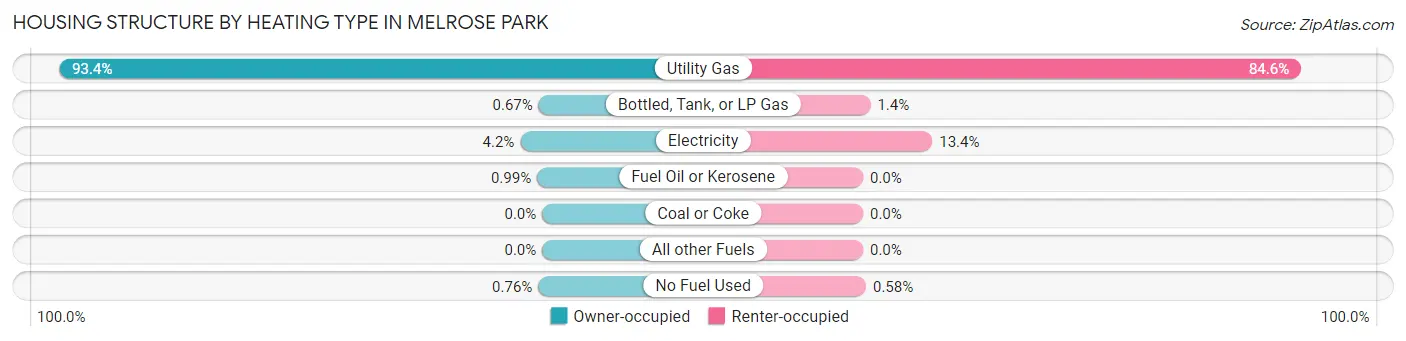
| Heating Type | Owner-occupied | Renter-occupied |
| Utility Gas | 4,166 (93.3%) | 3,081 (84.6%) |
| Bottled, Tank, or LP Gas | 30 (0.7%) | 52 (1.4%) |
| Electricity | 189 (4.2%) | 487 (13.4%) |
| Fuel Oil or Kerosene | 44 (1.0%) | 0 (0.0%) |
| Coal or Coke | 0 (0.0%) | 0 (0.0%) |
| All other Fuels | 0 (0.0%) | 0 (0.0%) |
| No Fuel Used | 34 (0.8%) | 21 (0.6%) |
| Total | 4,463 (100.0%) | 3,641 (100.0%) |
Household Vehicle Usage in Melrose Park
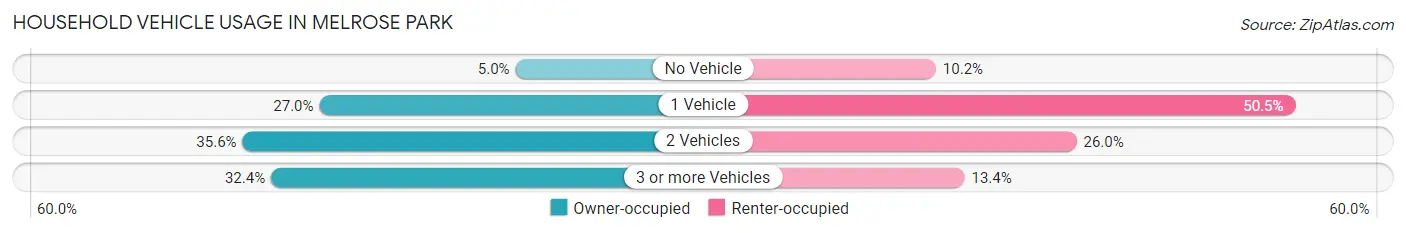
| Vehicles per Household | Owner-occupied | Renter-occupied |
| No Vehicle | 224 (5.0%) | 371 (10.2%) |
| 1 Vehicle | 1,204 (27.0%) | 1,837 (50.4%) |
| 2 Vehicles | 1,589 (35.6%) | 945 (26.0%) |
| 3 or more Vehicles | 1,446 (32.4%) | 488 (13.4%) |
| Total | 4,463 (100.0%) | 3,641 (100.0%) |
Real Estate & Mortgages in Melrose Park
Real Estate and Mortgage Overview in Melrose Park
| Characteristic | Without Mortgage | With Mortgage |
| Housing Units | 1,896 | 2,567 |
| Median Property Value | $219,800 | $263,100 |
| Median Household Income | $58,840 | $617 |
| Monthly Housing Costs | $801 | $113 |
| Real Estate Taxes | $5,347 | $116 |
Property Value by Mortgage Status in Melrose Park
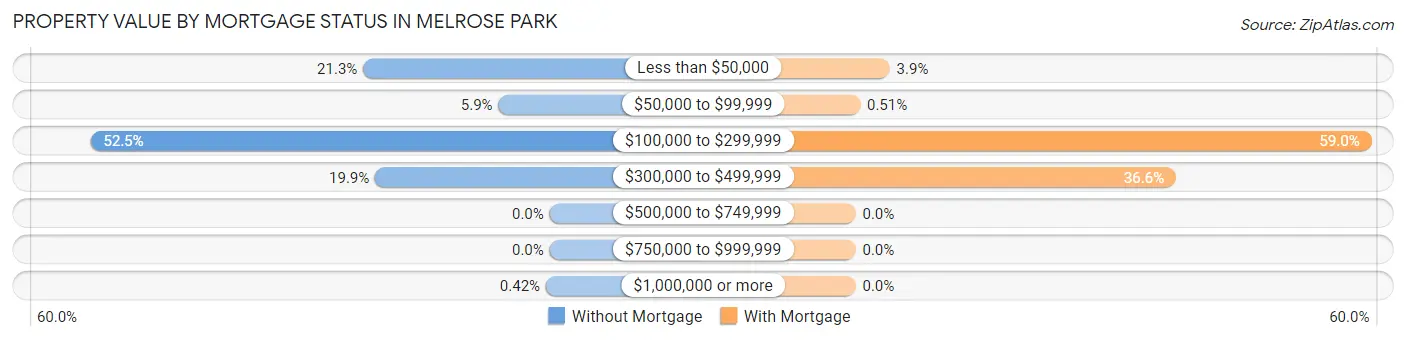
| Property Value | Without Mortgage | With Mortgage |
| Less than $50,000 | 404 (21.3%) | 100 (3.9%) |
| $50,000 to $99,999 | 111 (5.9%) | 13 (0.5%) |
| $100,000 to $299,999 | 995 (52.5%) | 1,514 (59.0%) |
| $300,000 to $499,999 | 378 (19.9%) | 940 (36.6%) |
| $500,000 to $749,999 | 0 (0.0%) | 0 (0.0%) |
| $750,000 to $999,999 | 0 (0.0%) | 0 (0.0%) |
| $1,000,000 or more | 8 (0.4%) | 0 (0.0%) |
| Total | 1,896 (100.0%) | 2,567 (100.0%) |
Household Income by Mortgage Status in Melrose Park
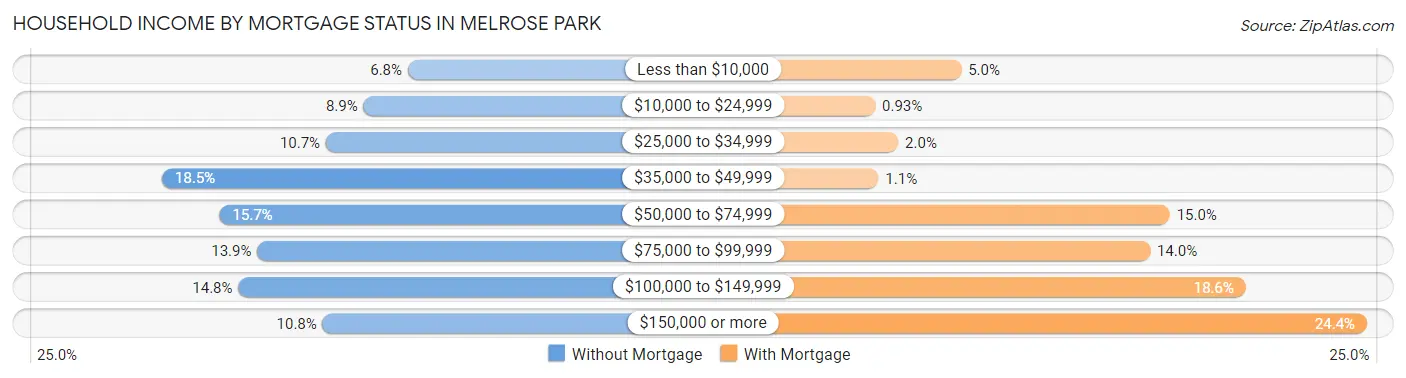
| Household Income | Without Mortgage | With Mortgage |
| Less than $10,000 | 128 (6.8%) | 129 (5.0%) |
| $10,000 to $24,999 | 168 (8.9%) | 24 (0.9%) |
| $25,000 to $34,999 | 202 (10.6%) | 52 (2.0%) |
| $35,000 to $49,999 | 350 (18.5%) | 28 (1.1%) |
| $50,000 to $74,999 | 298 (15.7%) | 384 (15.0%) |
| $75,000 to $99,999 | 264 (13.9%) | 360 (14.0%) |
| $100,000 to $149,999 | 281 (14.8%) | 477 (18.6%) |
| $150,000 or more | 205 (10.8%) | 625 (24.3%) |
| Total | 1,896 (100.0%) | 2,567 (100.0%) |
Property Value to Household Income Ratio in Melrose Park
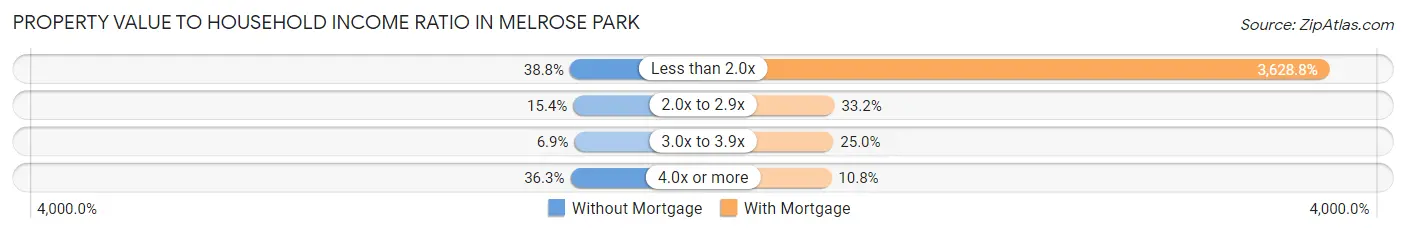
| Value-to-Income Ratio | Without Mortgage | With Mortgage |
| Less than 2.0x | 736 (38.8%) | 93,150 (3,628.8%) |
| 2.0x to 2.9x | 291 (15.3%) | 852 (33.2%) |
| 3.0x to 3.9x | 130 (6.9%) | 641 (25.0%) |
| 4.0x or more | 688 (36.3%) | 278 (10.8%) |
| Total | 1,896 (100.0%) | 2,567 (100.0%) |
Real Estate Taxes by Mortgage Status in Melrose Park
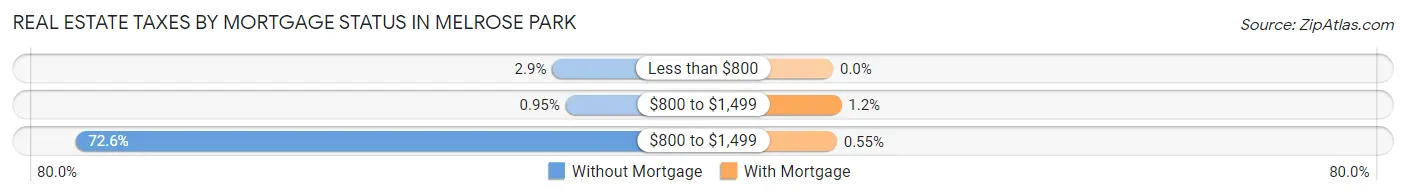
| Property Taxes | Without Mortgage | With Mortgage |
| Less than $800 | 55 (2.9%) | 0 (0.0%) |
| $800 to $1,499 | 18 (0.9%) | 31 (1.2%) |
| $800 to $1,499 | 1,376 (72.6%) | 14 (0.5%) |
| Total | 1,896 (100.0%) | 2,567 (100.0%) |
Health & Disability in Melrose Park
Health Insurance Coverage by Age in Melrose Park
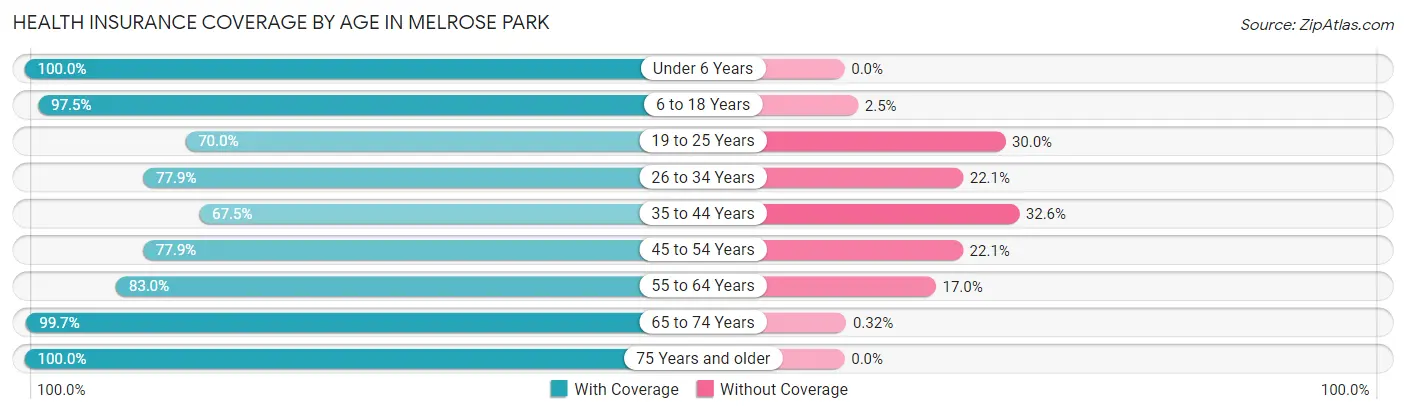
| Age Bracket | With Coverage | Without Coverage |
| Under 6 Years | 1,979 (100.0%) | 0 (0.0%) |
| 6 to 18 Years | 4,700 (97.5%) | 122 (2.5%) |
| 19 to 25 Years | 1,999 (70.0%) | 855 (30.0%) |
| 26 to 34 Years | 2,430 (77.9%) | 689 (22.1%) |
| 35 to 44 Years | 2,259 (67.4%) | 1,090 (32.6%) |
| 45 to 54 Years | 2,595 (77.9%) | 735 (22.1%) |
| 55 to 64 Years | 2,457 (83.0%) | 504 (17.0%) |
| 65 to 74 Years | 1,544 (99.7%) | 5 (0.3%) |
| 75 Years and older | 1,169 (100.0%) | 0 (0.0%) |
| Total | 21,132 (84.1%) | 4,000 (15.9%) |
Health Insurance Coverage by Citizenship Status in Melrose Park

| Citizenship Status | With Coverage | Without Coverage |
| Native Born | 1,979 (100.0%) | 0 (0.0%) |
| Foreign Born, Citizen | 4,700 (97.5%) | 122 (2.5%) |
| Foreign Born, not a Citizen | 1,999 (70.0%) | 855 (30.0%) |
Health Insurance Coverage by Household Income in Melrose Park
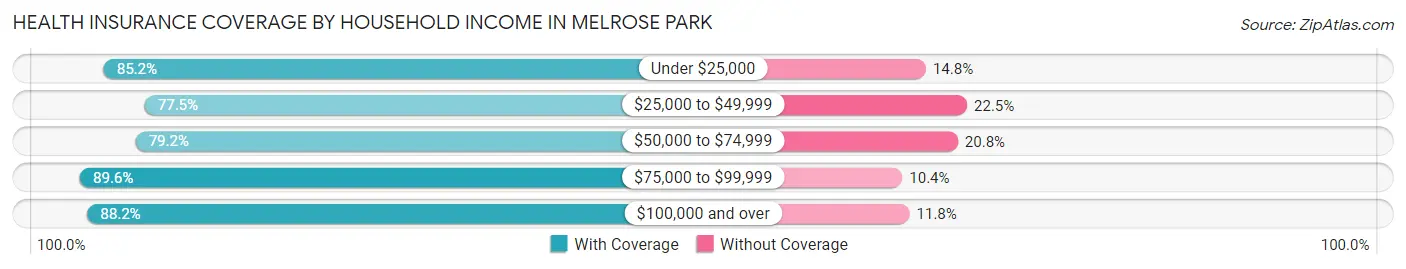
| Household Income | With Coverage | Without Coverage |
| Under $25,000 | 1,326 (85.2%) | 231 (14.8%) |
| $25,000 to $49,999 | 3,986 (77.5%) | 1,160 (22.5%) |
| $50,000 to $74,999 | 4,123 (79.2%) | 1,084 (20.8%) |
| $75,000 to $99,999 | 3,392 (89.6%) | 394 (10.4%) |
| $100,000 and over | 8,250 (88.2%) | 1,101 (11.8%) |
Public vs Private Health Insurance Coverage by Age in Melrose Park
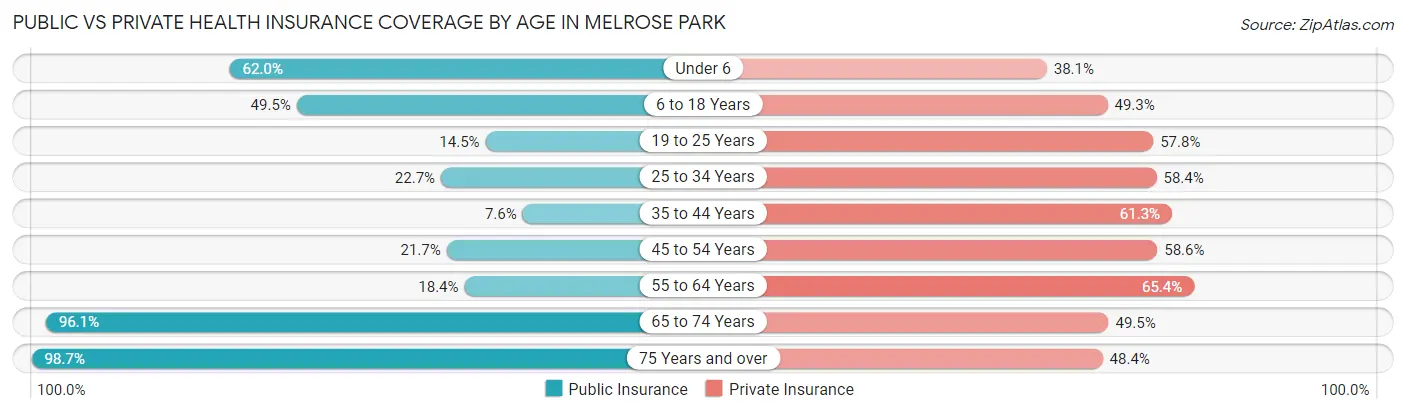
| Age Bracket | Public Insurance | Private Insurance |
| Under 6 | 1,226 (62.0%) | 753 (38.1%) |
| 6 to 18 Years | 2,387 (49.5%) | 2,378 (49.3%) |
| 19 to 25 Years | 413 (14.5%) | 1,650 (57.8%) |
| 25 to 34 Years | 709 (22.7%) | 1,822 (58.4%) |
| 35 to 44 Years | 254 (7.6%) | 2,052 (61.3%) |
| 45 to 54 Years | 722 (21.7%) | 1,950 (58.6%) |
| 55 to 64 Years | 544 (18.4%) | 1,936 (65.4%) |
| 65 to 74 Years | 1,488 (96.1%) | 767 (49.5%) |
| 75 Years and over | 1,154 (98.7%) | 566 (48.4%) |
| Total | 8,897 (35.4%) | 13,874 (55.2%) |
Disability Status by Sex by Age in Melrose Park
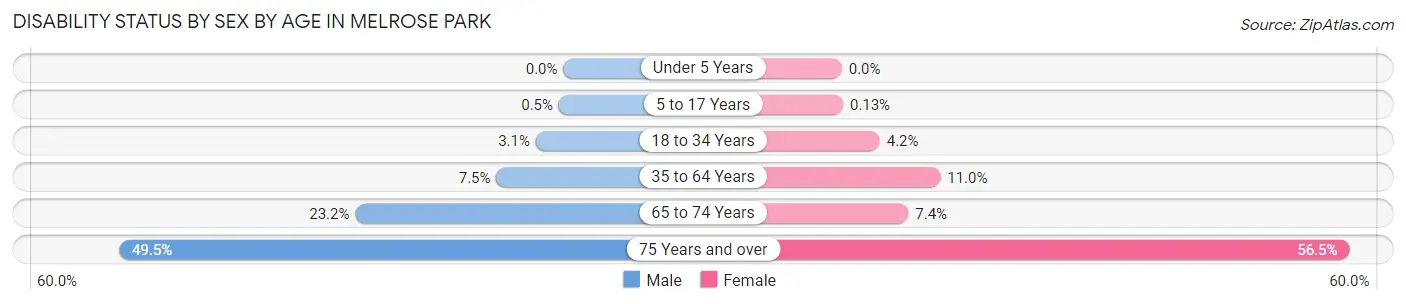
| Age Bracket | Male | Female |
| Under 5 Years | 0 (0.0%) | 0 (0.0%) |
| 5 to 17 Years | 12 (0.5%) | 3 (0.1%) |
| 18 to 34 Years | 101 (3.1%) | 132 (4.2%) |
| 35 to 64 Years | 385 (7.5%) | 491 (11.0%) |
| 65 to 74 Years | 215 (23.2%) | 46 (7.4%) |
| 75 Years and over | 195 (49.5%) | 438 (56.5%) |
Disability Class by Sex by Age in Melrose Park
Disability Class: Hearing Difficulty
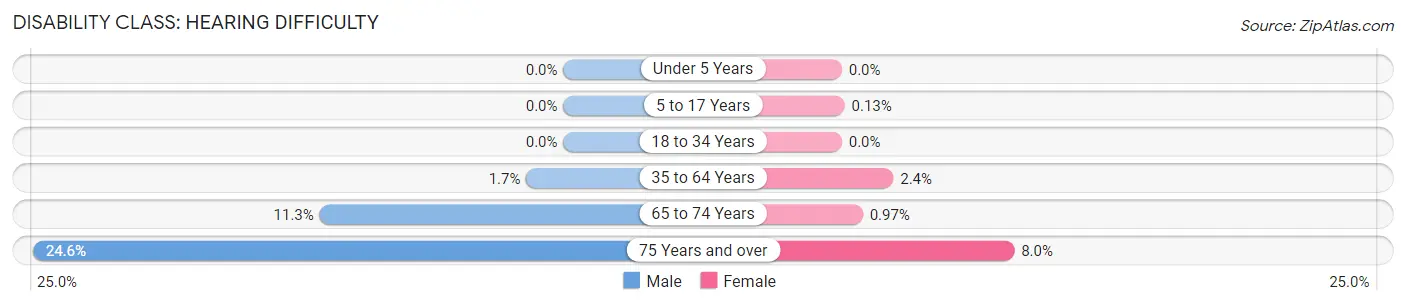
| Age Bracket | Male | Female |
| Under 5 Years | 0 (0.0%) | 0 (0.0%) |
| 5 to 17 Years | 0 (0.0%) | 3 (0.1%) |
| 18 to 34 Years | 0 (0.0%) | 0 (0.0%) |
| 35 to 64 Years | 89 (1.7%) | 107 (2.4%) |
| 65 to 74 Years | 105 (11.3%) | 6 (1.0%) |
| 75 Years and over | 97 (24.6%) | 62 (8.0%) |
Disability Class: Vision Difficulty
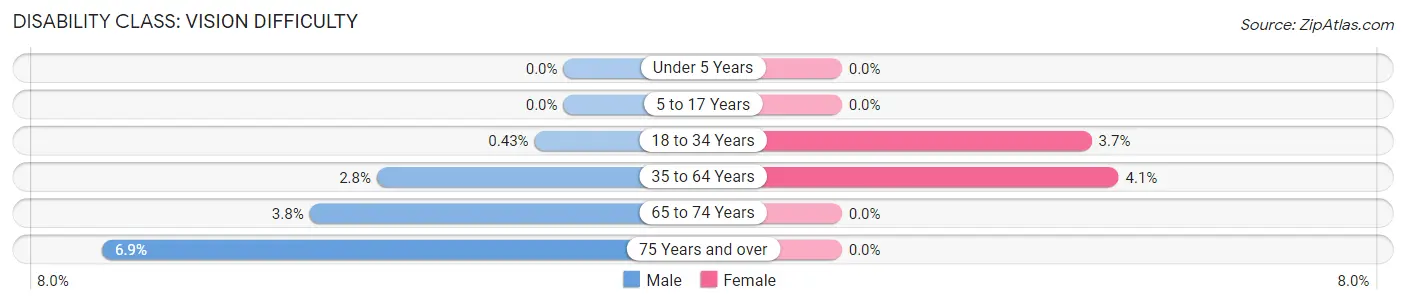
| Age Bracket | Male | Female |
| Under 5 Years | 0 (0.0%) | 0 (0.0%) |
| 5 to 17 Years | 0 (0.0%) | 0 (0.0%) |
| 18 to 34 Years | 14 (0.4%) | 116 (3.7%) |
| 35 to 64 Years | 143 (2.8%) | 184 (4.1%) |
| 65 to 74 Years | 35 (3.8%) | 0 (0.0%) |
| 75 Years and over | 27 (6.9%) | 0 (0.0%) |
Disability Class: Cognitive Difficulty
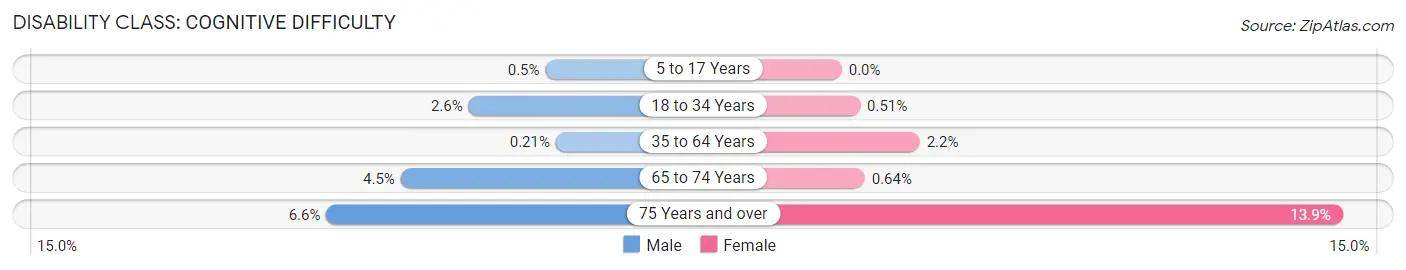
| Age Bracket | Male | Female |
| 5 to 17 Years | 12 (0.5%) | 0 (0.0%) |
| 18 to 34 Years | 87 (2.6%) | 16 (0.5%) |
| 35 to 64 Years | 11 (0.2%) | 97 (2.2%) |
| 65 to 74 Years | 42 (4.5%) | 4 (0.6%) |
| 75 Years and over | 26 (6.6%) | 108 (13.9%) |
Disability Class: Ambulatory Difficulty
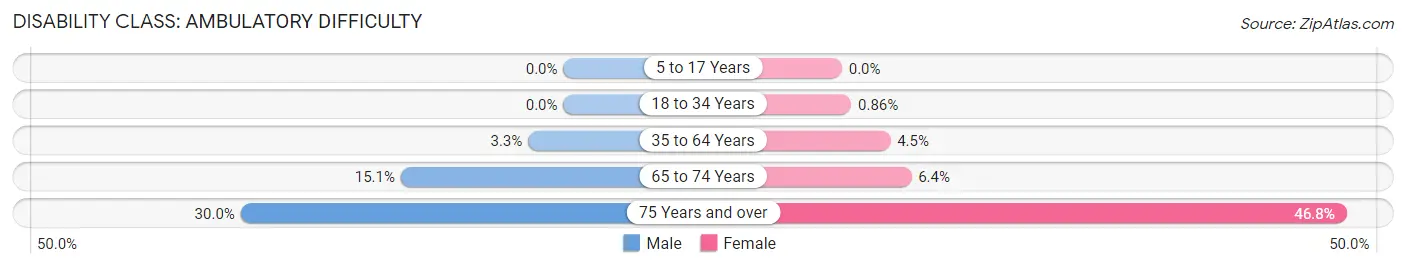
| Age Bracket | Male | Female |
| 5 to 17 Years | 0 (0.0%) | 0 (0.0%) |
| 18 to 34 Years | 0 (0.0%) | 27 (0.9%) |
| 35 to 64 Years | 169 (3.3%) | 201 (4.5%) |
| 65 to 74 Years | 140 (15.1%) | 40 (6.4%) |
| 75 Years and over | 118 (29.9%) | 363 (46.8%) |
Disability Class: Self-Care Difficulty
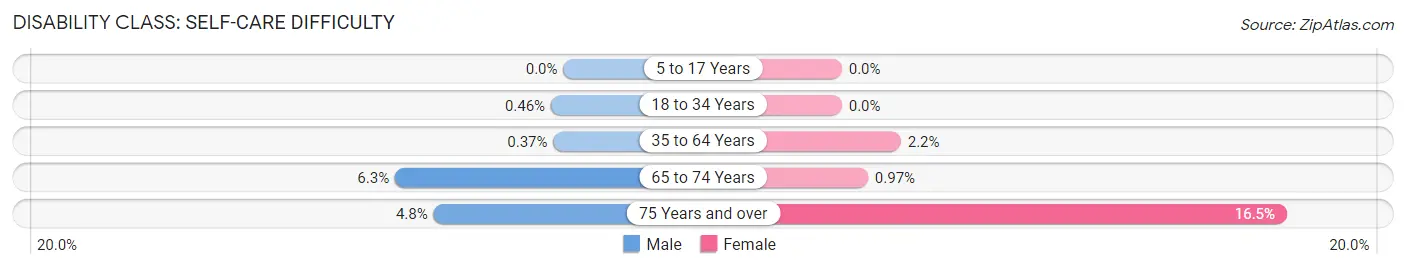
| Age Bracket | Male | Female |
| 5 to 17 Years | 0 (0.0%) | 0 (0.0%) |
| 18 to 34 Years | 15 (0.5%) | 0 (0.0%) |
| 35 to 64 Years | 19 (0.4%) | 98 (2.2%) |
| 65 to 74 Years | 58 (6.2%) | 6 (1.0%) |
| 75 Years and over | 19 (4.8%) | 128 (16.5%) |
Technology Access in Melrose Park
Computing Device Access in Melrose Park
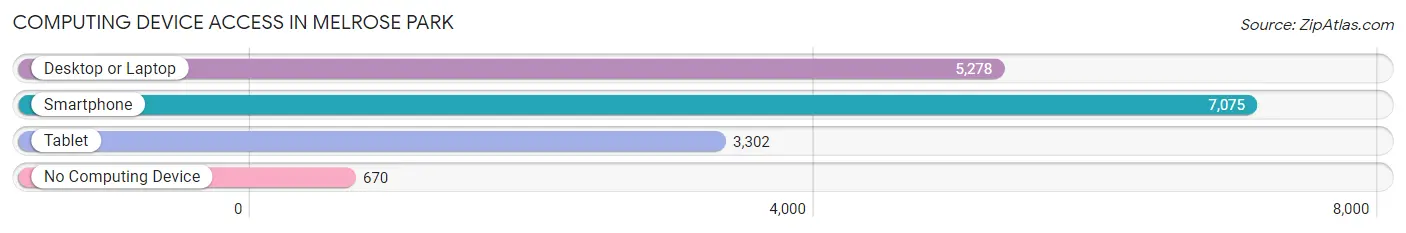
| Device Type | # Households | % Households |
| Desktop or Laptop | 5,278 | 65.1% |
| Smartphone | 7,075 | 87.3% |
| Tablet | 3,302 | 40.7% |
| No Computing Device | 670 | 8.3% |
| Total | 8,104 | 100.0% |
Internet Access in Melrose Park
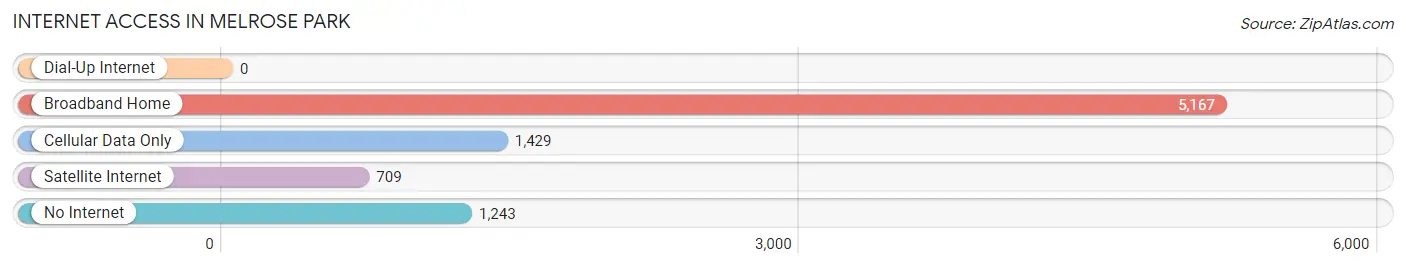
| Internet Type | # Households | % Households |
| Dial-Up Internet | 0 | 0.0% |
| Broadband Home | 5,167 | 63.8% |
| Cellular Data Only | 1,429 | 17.6% |
| Satellite Internet | 709 | 8.7% |
| No Internet | 1,243 | 15.3% |
| Total | 8,104 | 100.0% |
Melrose Park Summary
Melrose Park, Illinois is a village located in Cook County, Illinois, United States. It is a suburb of Chicago, located approximately 13 miles west of the city. The population was 25,411 at the 2010 census.
History
The area that is now Melrose Park was first settled in the 1830s by German and Dutch immigrants. The village was originally known as “Mannheim” and was incorporated in 1882. The name was changed to Melrose Park in 1887, after the Melrose House, a hotel built by the area’s first postmaster.
In the early 20th century, Melrose Park was a popular destination for Chicagoans looking to escape the city. The village was home to several amusement parks, including the Melrose Park Amusement Park, which opened in 1906 and closed in the 1950s.
In the 1950s, Melrose Park began to experience a period of rapid growth and development. The village was home to several large manufacturing companies, including the Zenith Electronics Corporation, which opened a television and radio manufacturing plant in the village in 1953. The village also became home to several large shopping centers, including the Melrose Park Mall, which opened in 1965.
Geography
Melrose Park is located at 41°53′17″N 87°52′17″W (41.8879, -87.8714). According to the 2010 census, the village has a total area of 4.9 square miles (12.7 km2), all land.
Economy
Melrose Park is home to several large manufacturing companies, including Zenith Electronics Corporation, which opened a television and radio manufacturing plant in the village in 1953. The village is also home to several large shopping centers, including the Melrose Park Mall, which opened in 1965.
Demographics
As of the 2010 census, there were 25,411 people, 9,845 households, and 6,717 families residing in the village. The population density was 5,164.2 people per square mile (1,989.2/km2). There were 10,541 housing units at an average density of 2,139.2 per square mile (824.2/km2). The racial makeup of the village was 63.2% White, 5.2% African American, 0.4% Native American, 1.2% Asian, 0.1% Pacific Islander, 27.2% from other races, and 2.9% from two or more races. Hispanic or Latino of any race were 57.2% of the population.
There were 9,845 households, out of which 33.2% had children under the age of 18 living with them, 44.2% were married couples living together, 17.2% had a female householder with no husband present, and 31.2% were non-families. 25.7% of all households were made up of individuals, and 10.2% had someone living alone who was 65 years of age or older. The average household size was 2.58 and the average family size was 3.13.
In the village, the population was spread out, with 25.2% under the age of 18, 9.7% from 18 to 24, 30.2% from 25 to 44, 21.2% from 45 to 64, and 13.7% who were 65 years of age or older. The median age was 34 years. For every 100 females, there were 95.2 males. For every 100 females age 18 and over, there were 91.7 males.
The median income for a household in the village was $41,945, and the median income for a family was $48,945. Males had a median income of $35,945 versus $27,945 for females. The per capita income for the village was $19,945. About 8.2% of families and 10.2% of the population were below the poverty line, including 14.2% of those under age 18 and 8.2% of those age 65 or over.
Common Questions
What is Per Capita Income in Melrose Park?
Per Capita income in Melrose Park is $27,791.
What is the Median Family Income in Melrose Park?
Median Family Income in Melrose Park is $72,418.
What is the Median Household income in Melrose Park?
Median Household Income in Melrose Park is $64,400.
What is Income or Wage Gap in Melrose Park?
Income or Wage Gap in Melrose Park is 17.8%.
Women in Melrose Park earn 82.2 cents for every dollar earned by a man.
What is Family Income Deficit in Melrose Park?
Family Income Deficit in Melrose Park is $9,797.
Families that are below poverty line in Melrose Park earn $9,797 less on average than the poverty threshold level.
What is Inequality or Gini Index in Melrose Park?
Inequality or Gini Index in Melrose Park is 0.39.
What is the Total Population of Melrose Park?
Total Population of Melrose Park is 25,177.
What is the Total Male Population of Melrose Park?
Total Male Population of Melrose Park is 12,911.
What is the Total Female Population of Melrose Park?
Total Female Population of Melrose Park is 12,266.
What is the Ratio of Males per 100 Females in Melrose Park?
There are 105.26 Males per 100 Females in Melrose Park.
What is the Ratio of Females per 100 Males in Melrose Park?
There are 95.00 Females per 100 Males in Melrose Park.
What is the Median Population Age in Melrose Park?
Median Population Age in Melrose Park is 34.5 Years.
What is the Average Family Size in Melrose Park
Average Family Size in Melrose Park is 3.7 People.
What is the Average Household Size in Melrose Park
Average Household Size in Melrose Park is 3.1 People.
How Large is the Labor Force in Melrose Park?
There are 13,057 People in the Labor Forcein in Melrose Park.
What is the Percentage of People in the Labor Force in Melrose Park?
66.6% of People are in the Labor Force in Melrose Park.
What is the Unemployment Rate in Melrose Park?
Unemployment Rate in Melrose Park is 5.0%.