Centralia, IL Map & Demographics
Centralia Map
Centralia Overview
$27,687
PER CAPITA INCOME
$76,739
AVG FAMILY INCOME
$46,468
AVG HOUSEHOLD INCOME
33.4%
WAGE / INCOME GAP [ % ]
66.6¢/ $1
WAGE / INCOME GAP [ $ ]
0.45
INEQUALITY / GINI INDEX
12,096
TOTAL POPULATION
5,929
MALE POPULATION
6,167
FEMALE POPULATION
96.14
MALES / 100 FEMALES
104.01
FEMALES / 100 MALES
40.7
MEDIAN AGE
3.1
AVG FAMILY SIZE
2.3
AVG HOUSEHOLD SIZE
5,232
LABOR FORCE [ PEOPLE ]
55.0%
PERCENT IN LABOR FORCE
12.4%
UNEMPLOYMENT RATE
Centralia Zip Codes
Centralia Area Codes
Income in Centralia
Income Overview in Centralia
Per Capita Income in Centralia is $27,687, while median incomes of families and households are $76,739 and $46,468 respectively.
| Characteristic | Number | Measure |
| Per Capita Income | 12,096 | $27,687 |
| Median Family Income | 2,604 | $76,739 |
| Mean Family Income | 2,604 | $82,250 |
| Median Household Income | 5,127 | $46,468 |
| Mean Household Income | 5,127 | $64,206 |
| Income Deficit | 2,604 | $0 |
| Wage / Income Gap (%) | 12,096 | 33.36% |
| Wage / Income Gap ($) | 12,096 | 66.64¢ per $1 |
| Gini / Inequality Index | 12,096 | 0.45 |
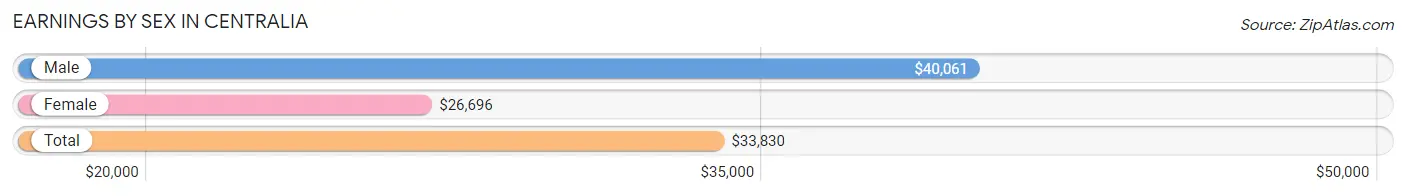
Earnings by Sex in Centralia
Average Earnings in Centralia are $33,830, $40,061 for men and $26,696 for women, a difference of 33.4%.
| Sex | Number | Average Earnings |
| Male | 2,918 (54.7%) | $40,061 |
| Female | 2,412 (45.3%) | $26,696 |
| Total | 5,330 (100.0%) | $33,830 |
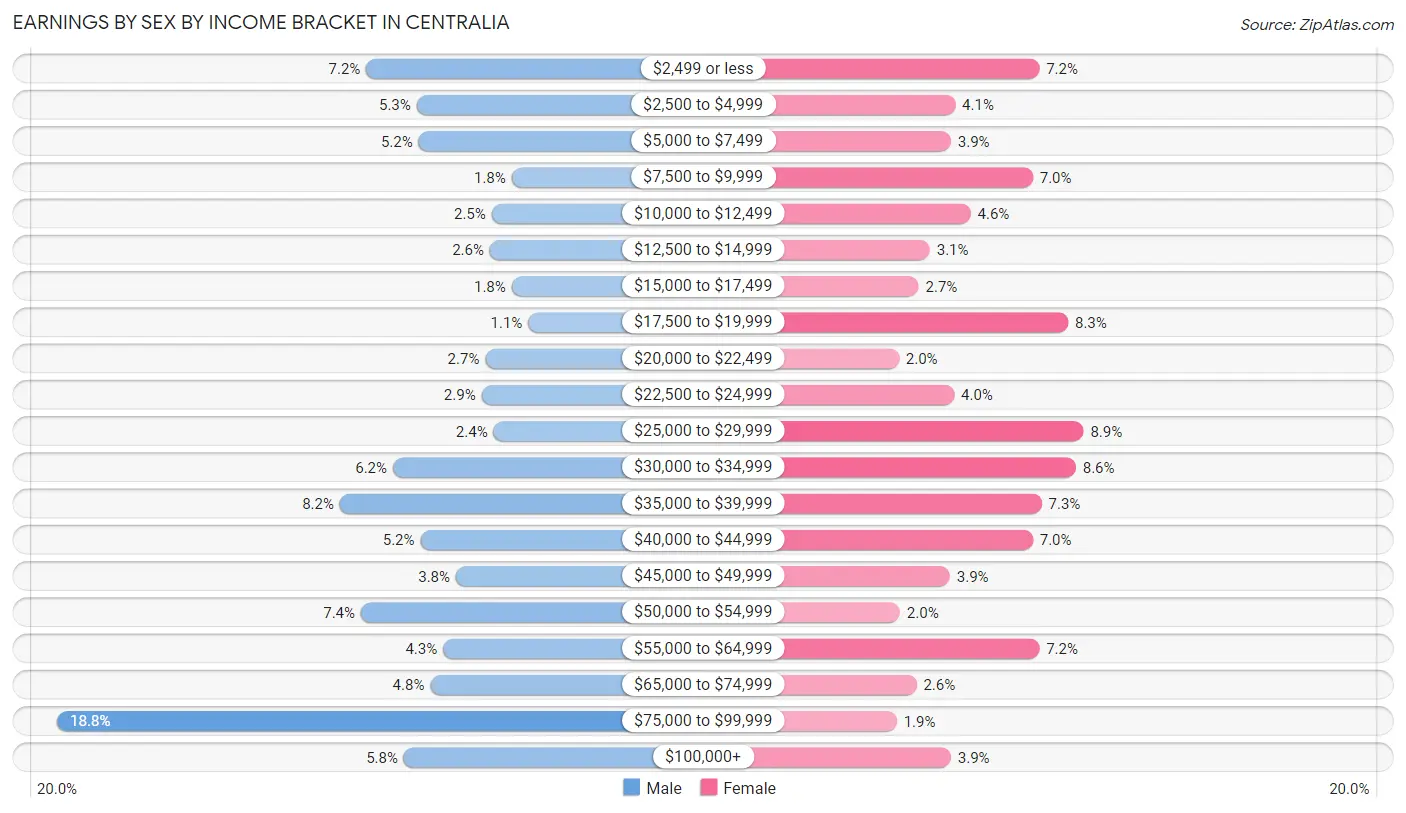
Earnings by Sex by Income Bracket in Centralia
The most common earnings brackets in Centralia are $75,000 to $99,999 for men (548 | 18.8%) and $25,000 to $29,999 for women (214 | 8.9%).
| Income | Male | Female |
| $2,499 or less | 210 (7.2%) | 174 (7.2%) |
| $2,500 to $4,999 | 155 (5.3%) | 98 (4.1%) |
| $5,000 to $7,499 | 153 (5.2%) | 94 (3.9%) |
| $7,500 to $9,999 | 51 (1.8%) | 168 (7.0%) |
| $10,000 to $12,499 | 73 (2.5%) | 112 (4.6%) |
| $12,500 to $14,999 | 75 (2.6%) | 75 (3.1%) |
| $15,000 to $17,499 | 51 (1.8%) | 65 (2.7%) |
| $17,500 to $19,999 | 33 (1.1%) | 200 (8.3%) |
| $20,000 to $22,499 | 80 (2.7%) | 47 (1.9%) |
| $22,500 to $24,999 | 84 (2.9%) | 97 (4.0%) |
| $25,000 to $29,999 | 71 (2.4%) | 214 (8.9%) |
| $30,000 to $34,999 | 181 (6.2%) | 207 (8.6%) |
| $35,000 to $39,999 | 239 (8.2%) | 176 (7.3%) |
| $40,000 to $44,999 | 151 (5.2%) | 168 (7.0%) |
| $45,000 to $49,999 | 112 (3.8%) | 93 (3.9%) |
| $50,000 to $54,999 | 216 (7.4%) | 48 (2.0%) |
| $55,000 to $64,999 | 126 (4.3%) | 174 (7.2%) |
| $65,000 to $74,999 | 140 (4.8%) | 63 (2.6%) |
| $75,000 to $99,999 | 548 (18.8%) | 45 (1.9%) |
| $100,000+ | 169 (5.8%) | 94 (3.9%) |
| Total | 2,918 (100.0%) | 2,412 (100.0%) |
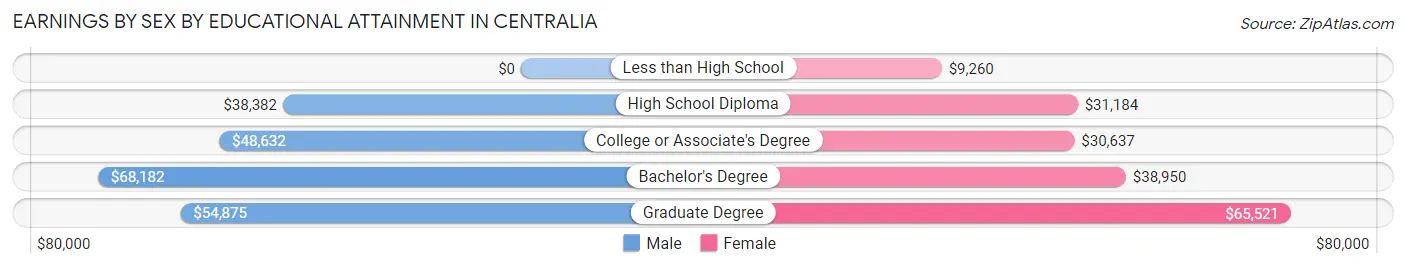
Earnings by Sex by Educational Attainment in Centralia
Average earnings in Centralia are $44,107 for men and $30,946 for women, a difference of 29.8%. Men with an educational attainment of bachelor's degree enjoy the highest average annual earnings of $68,182, while those with high school diploma education earn the least with $38,382. Women with an educational attainment of graduate degree earn the most with the average annual earnings of $65,521, while those with less than high school education have the smallest earnings of $9,260.
| Educational Attainment | Male Income | Female Income |
| Less than High School | - | - |
| High School Diploma | $38,382 | $31,184 |
| College or Associate's Degree | $48,632 | $30,637 |
| Bachelor's Degree | $68,182 | $38,950 |
| Graduate Degree | $54,875 | $65,521 |
| Total | $44,107 | $30,946 |
Family Income in Centralia
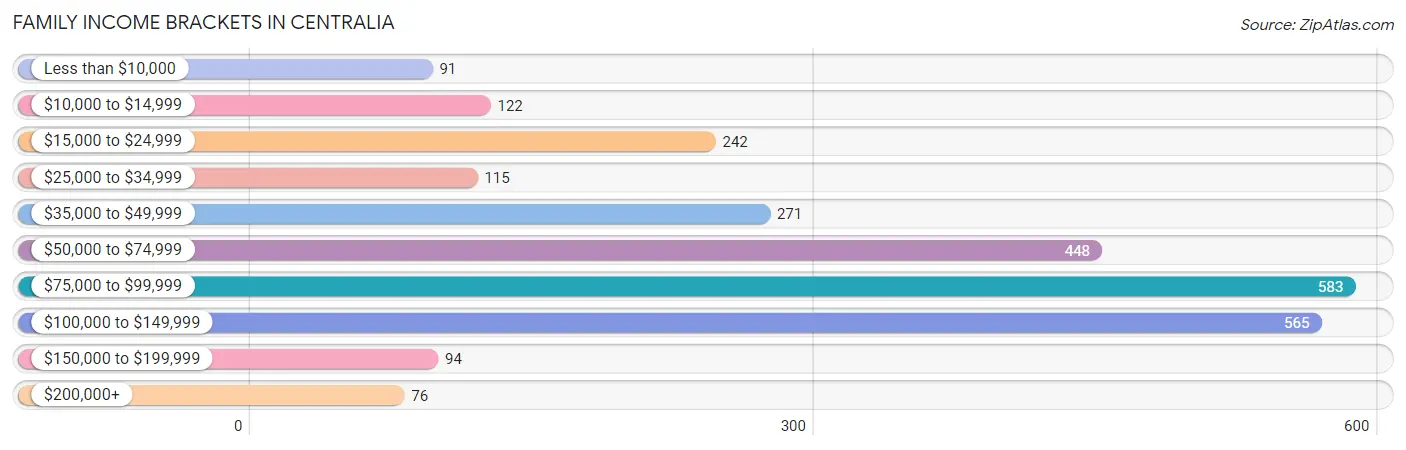
Family Income Brackets in Centralia
According to the Centralia family income data, there are 583 families falling into the $75,000 to $99,999 income range, which is the most common income bracket and makes up 22.4% of all families. Conversely, the $200,000+ income bracket is the least frequent group with only 76 families (2.9%) belonging to this category.
| Income Bracket | # Families | % Families |
| Less than $10,000 | 91 | 3.5% |
| $10,000 to $14,999 | 122 | 4.7% |
| $15,000 to $24,999 | 242 | 9.3% |
| $25,000 to $34,999 | 115 | 4.4% |
| $35,000 to $49,999 | 271 | 10.4% |
| $50,000 to $74,999 | 448 | 17.2% |
| $75,000 to $99,999 | 583 | 22.4% |
| $100,000 to $149,999 | 565 | 21.7% |
| $150,000 to $199,999 | 94 | 3.6% |
| $200,000+ | 76 | 2.9% |
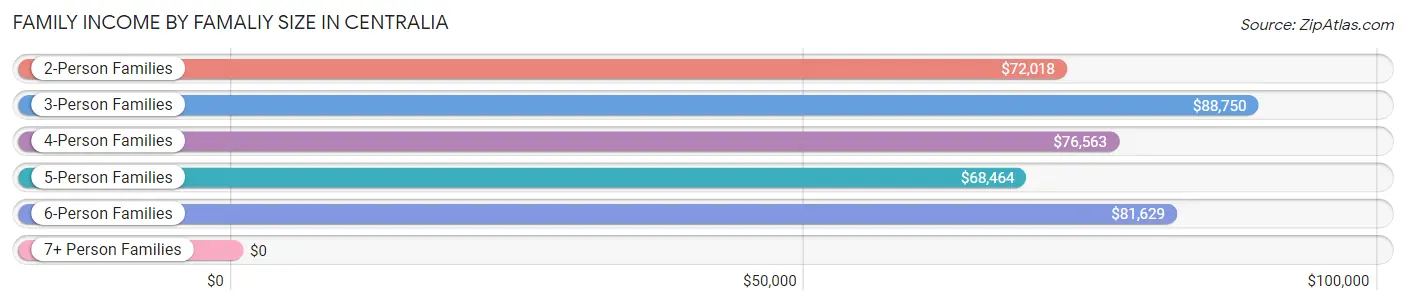
Family Income by Famaliy Size in Centralia
3-person families (697 | 26.8%) account for the highest median family income in Centralia with $88,750 per family, while 2-person families (1,241 | 47.7%) have the highest median income of $36,009 per family member.
| Income Bracket | # Families | Median Income |
| 2-Person Families | 1,241 (47.7%) | $72,018 |
| 3-Person Families | 697 (26.8%) | $88,750 |
| 4-Person Families | 457 (17.5%) | $76,563 |
| 5-Person Families | 99 (3.8%) | $68,464 |
| 6-Person Families | 105 (4.0%) | $81,629 |
| 7+ Person Families | 5 (0.2%) | $0 |
| Total | 2,604 (100.0%) | $76,739 |
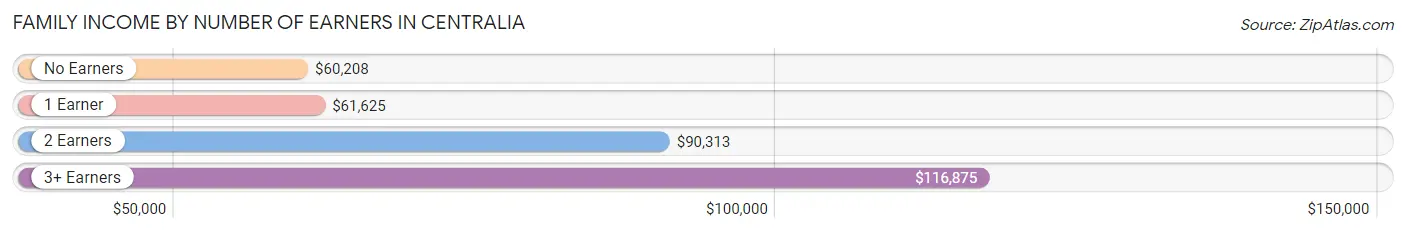
Family Income by Number of Earners in Centralia
The median family income in Centralia is $76,739, with families comprising 3+ earners (155) having the highest median family income of $116,875, while families with no earners (492) have the lowest median family income of $60,208, accounting for 5.9% and 18.9% of families, respectively.
| Number of Earners | # Families | Median Income |
| No Earners | 492 (18.9%) | $60,208 |
| 1 Earner | 1,006 (38.6%) | $61,625 |
| 2 Earners | 951 (36.5%) | $90,313 |
| 3+ Earners | 155 (5.9%) | $116,875 |
| Total | 2,604 (100.0%) | $76,739 |
Household Income in Centralia
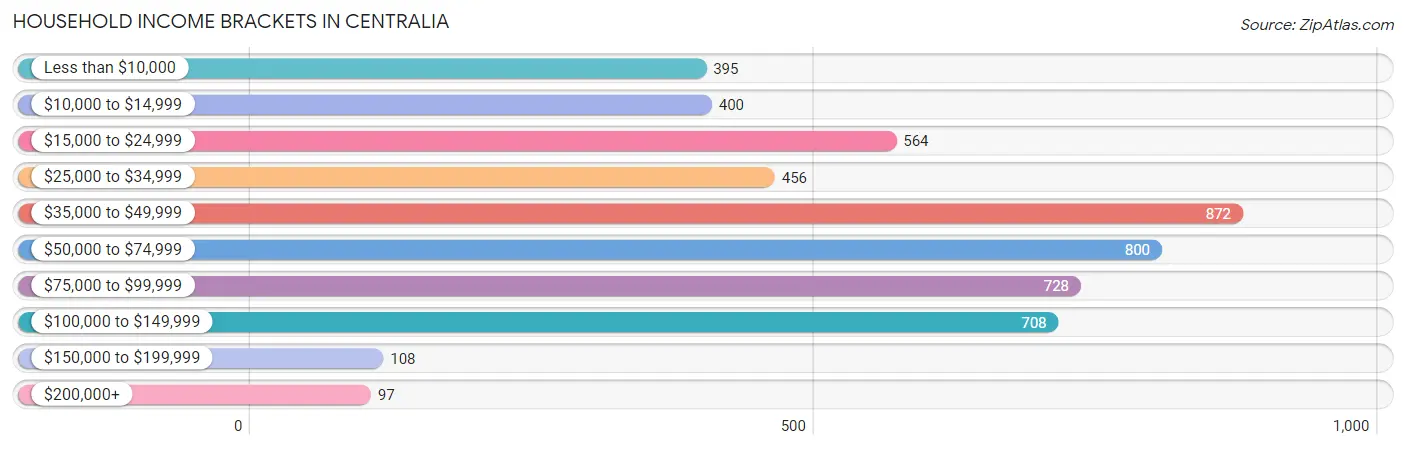
Household Income Brackets in Centralia
With 872 households falling in the category, the $35,000 to $49,999 income range is the most frequent in Centralia, accounting for 17.0% of all households. In contrast, only 97 households (1.9%) fall into the $200,000+ income bracket, making it the least populous group.
| Income Bracket | # Households | % Households |
| Less than $10,000 | 395 | 7.7% |
| $10,000 to $14,999 | 400 | 7.8% |
| $15,000 to $24,999 | 564 | 11.0% |
| $25,000 to $34,999 | 456 | 8.9% |
| $35,000 to $49,999 | 872 | 17.0% |
| $50,000 to $74,999 | 800 | 15.6% |
| $75,000 to $99,999 | 728 | 14.2% |
| $100,000 to $149,999 | 708 | 13.8% |
| $150,000 to $199,999 | 108 | 2.1% |
| $200,000+ | 97 | 1.9% |
Household Income by Householder Age in Centralia
The median household income in Centralia is $46,468, with the highest median household income of $53,571 found in the 45 to 64 years age bracket for the primary householder. A total of 1,640 households (32.0%) fall into this category. Meanwhile, the 15 to 24 years age bracket for the primary householder has the lowest median household income of $38,843, with 195 households (3.8%) in this group.
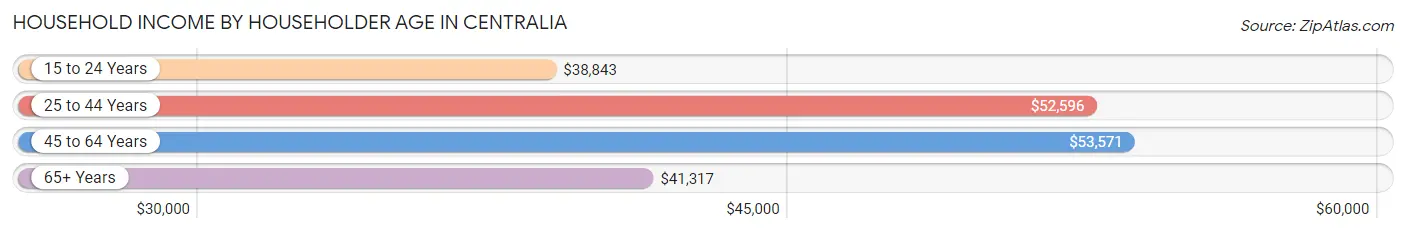
| Income Bracket | # Households | Median Income |
| 15 to 24 Years | 195 (3.8%) | $38,843 |
| 25 to 44 Years | 1,480 (28.9%) | $52,596 |
| 45 to 64 Years | 1,640 (32.0%) | $53,571 |
| 65+ Years | 1,812 (35.3%) | $41,317 |
| Total | 5,127 (100.0%) | $46,468 |
Poverty in Centralia
Income Below Poverty by Sex and Age in Centralia
With 19.3% poverty level for males and 27.4% for females among the residents of Centralia, 16 and 17 year old males and under 5 year old females are the most vulnerable to poverty, with 67 males (64.4%) and 170 females (52.8%) in their respective age groups living below the poverty level.
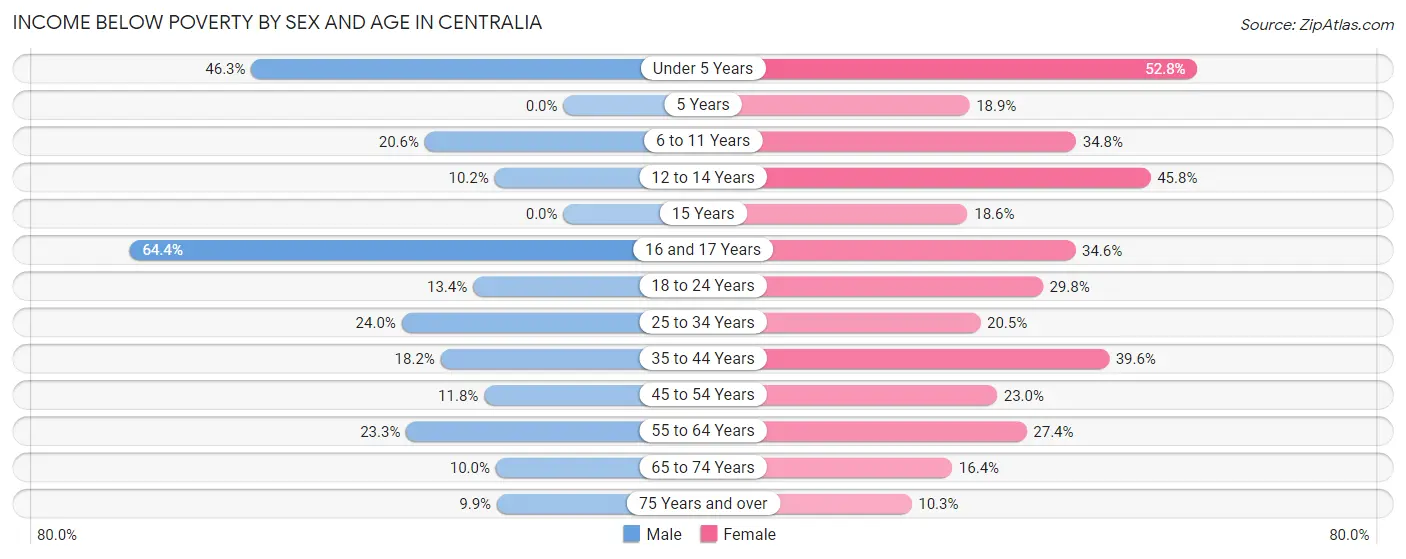
| Age Bracket | Male | Female |
| Under 5 Years | 202 (46.3%) | 170 (52.8%) |
| 5 Years | 0 (0.0%) | 7 (18.9%) |
| 6 to 11 Years | 86 (20.6%) | 139 (34.7%) |
| 12 to 14 Years | 23 (10.2%) | 109 (45.8%) |
| 15 Years | 0 (0.0%) | 11 (18.6%) |
| 16 and 17 Years | 67 (64.4%) | 62 (34.6%) |
| 18 to 24 Years | 55 (13.4%) | 152 (29.8%) |
| 25 to 34 Years | 170 (24.0%) | 132 (20.5%) |
| 35 to 44 Years | 131 (18.2%) | 275 (39.6%) |
| 45 to 54 Years | 58 (11.8%) | 131 (23.0%) |
| 55 to 64 Years | 171 (23.3%) | 253 (27.4%) |
| 65 to 74 Years | 62 (10.0%) | 104 (16.4%) |
| 75 Years and over | 56 (9.9%) | 70 (10.3%) |
| Total | 1,081 (19.3%) | 1,615 (27.4%) |
Income Above Poverty by Sex and Age in Centralia
According to the poverty statistics in Centralia, males aged 5 years and females aged 75 years and over are the age groups that are most secure financially, with 100.0% of males and 89.7% of females in these age groups living above the poverty line.
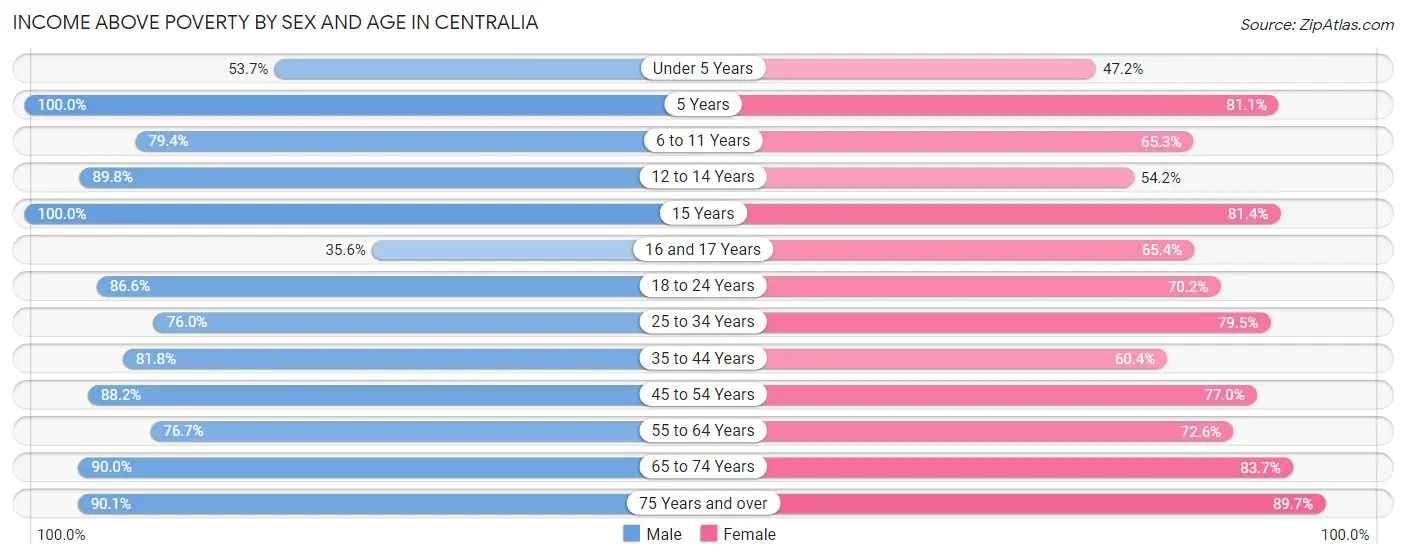
| Age Bracket | Male | Female |
| Under 5 Years | 234 (53.7%) | 152 (47.2%) |
| 5 Years | 62 (100.0%) | 30 (81.1%) |
| 6 to 11 Years | 332 (79.4%) | 261 (65.2%) |
| 12 to 14 Years | 202 (89.8%) | 129 (54.2%) |
| 15 Years | 121 (100.0%) | 48 (81.4%) |
| 16 and 17 Years | 37 (35.6%) | 117 (65.4%) |
| 18 to 24 Years | 355 (86.6%) | 358 (70.2%) |
| 25 to 34 Years | 538 (76.0%) | 511 (79.5%) |
| 35 to 44 Years | 588 (81.8%) | 419 (60.4%) |
| 45 to 54 Years | 435 (88.2%) | 438 (77.0%) |
| 55 to 64 Years | 562 (76.7%) | 670 (72.6%) |
| 65 to 74 Years | 556 (90.0%) | 532 (83.7%) |
| 75 Years and over | 512 (90.1%) | 608 (89.7%) |
| Total | 4,534 (80.7%) | 4,273 (72.6%) |
Income Below Poverty Among Married-Couple Families in Centralia
The poverty statistics for married-couple families in Centralia show that 4.9% or 94 of the total 1,911 families live below the poverty line. Families with 1 or 2 children have the highest poverty rate of 7.8%, comprising of 48 families. On the other hand, families with no children have the lowest poverty rate of 3.5%, which includes 41 families.
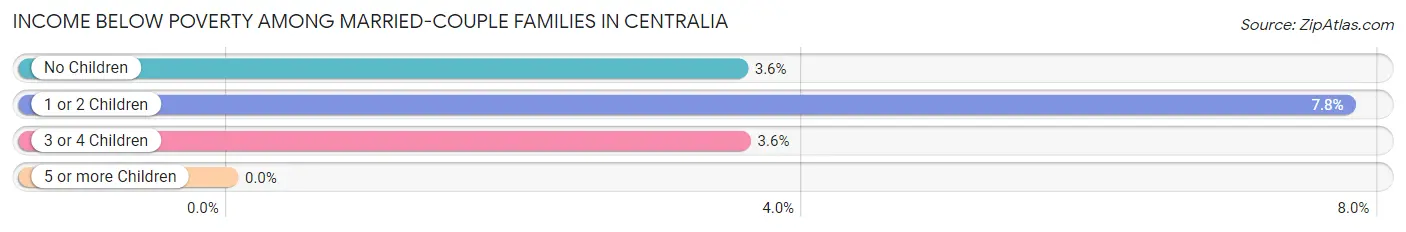
| Children | Above Poverty | Below Poverty |
| No Children | 1,113 (96.5%) | 41 (3.5%) |
| 1 or 2 Children | 569 (92.2%) | 48 (7.8%) |
| 3 or 4 Children | 135 (96.4%) | 5 (3.6%) |
| 5 or more Children | 0 (0.0%) | 0 (0.0%) |
| Total | 1,817 (95.1%) | 94 (4.9%) |
Income Below Poverty Among Single-Parent Households in Centralia
According to the poverty data in Centralia, 8.1% or 11 single-father households and 52.8% or 294 single-mother households are living below the poverty line. Among single-father households, those with no children have the highest poverty rate, with 7 households (16.3%) experiencing poverty. Likewise, among single-mother households, those with 3 or 4 children have the highest poverty rate, with 58 households (100.0%) falling below the poverty line.
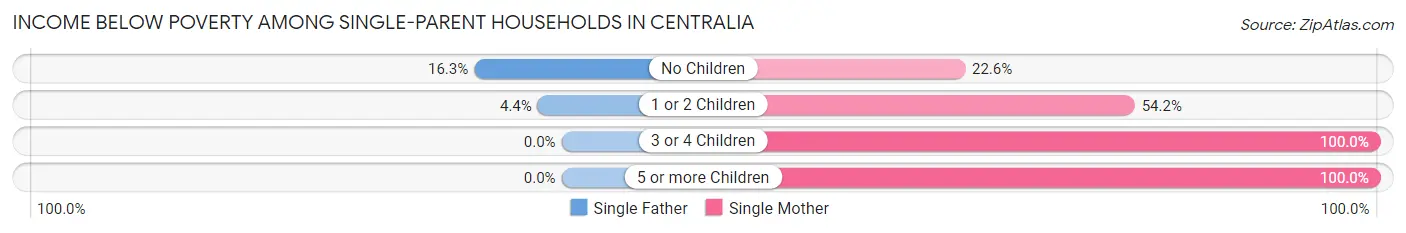
| Children | Single Father | Single Mother |
| No Children | 7 (16.3%) | 26 (22.6%) |
| 1 or 2 Children | 4 (4.4%) | 206 (54.2%) |
| 3 or 4 Children | 0 (0.0%) | 58 (100.0%) |
| 5 or more Children | 0 (0.0%) | 4 (100.0%) |
| Total | 11 (8.1%) | 294 (52.8%) |
Income Below Poverty Among Married-Couple vs Single-Parent Households in Centralia
The poverty data for Centralia shows that 94 of the married-couple family households (4.9%) and 305 of the single-parent households (44.0%) are living below the poverty level. Within the married-couple family households, those with 1 or 2 children have the highest poverty rate, with 48 households (7.8%) falling below the poverty line. Among the single-parent households, those with 3 or 4 children have the highest poverty rate, with 58 household (100.0%) living below poverty.
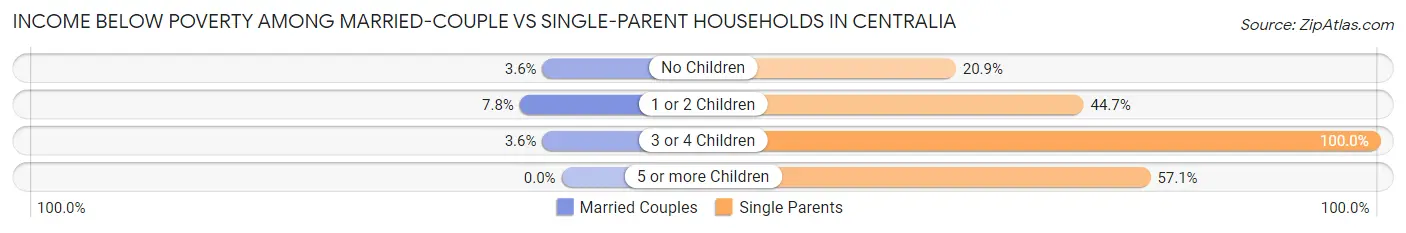
| Children | Married-Couple Families | Single-Parent Households |
| No Children | 41 (3.5%) | 33 (20.9%) |
| 1 or 2 Children | 48 (7.8%) | 210 (44.7%) |
| 3 or 4 Children | 5 (3.6%) | 58 (100.0%) |
| 5 or more Children | 0 (0.0%) | 4 (57.1%) |
| Total | 94 (4.9%) | 305 (44.0%) |
Race in Centralia
The most populous races in Centralia are White / Caucasian (9,888 | 81.8%), Black / African American (1,237 | 10.2%), and Two or more Races (580 | 4.8%).
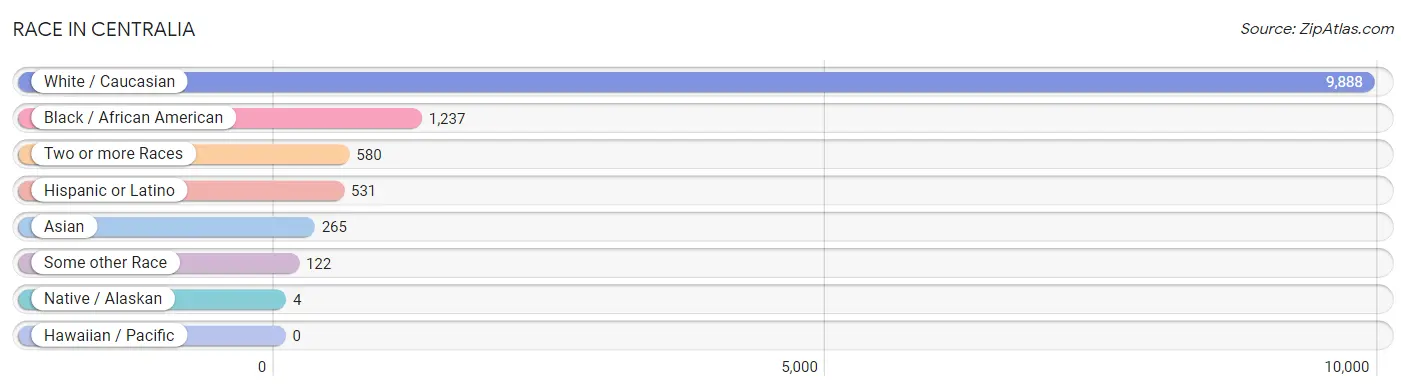
| Race | # Population | % Population |
| Asian | 265 | 2.2% |
| Black / African American | 1,237 | 10.2% |
| Hawaiian / Pacific | 0 | 0.0% |
| Hispanic or Latino | 531 | 4.4% |
| Native / Alaskan | 4 | 0.0% |
| White / Caucasian | 9,888 | 81.8% |
| Two or more Races | 580 | 4.8% |
| Some other Race | 122 | 1.0% |
| Total | 12,096 | 100.0% |
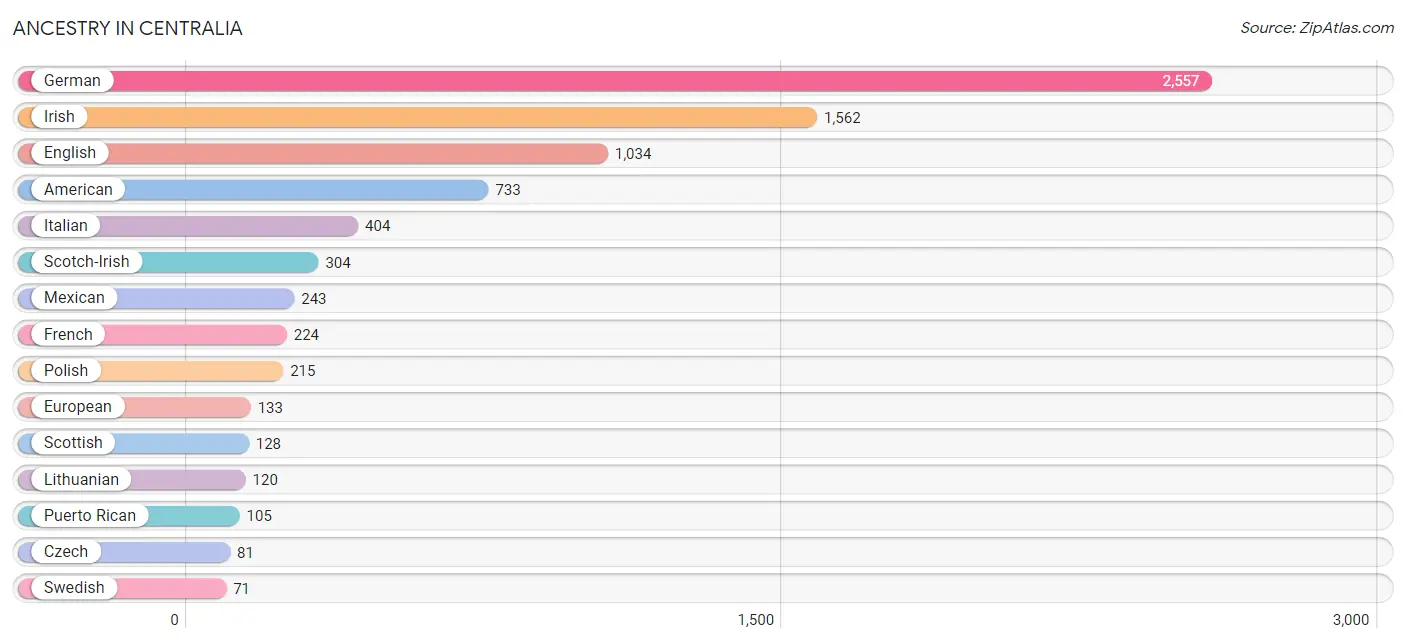
Ancestry in Centralia
The most populous ancestries reported in Centralia are German (2,557 | 21.1%), Irish (1,562 | 12.9%), English (1,034 | 8.6%), American (733 | 6.1%), and Italian (404 | 3.3%), together accounting for 52.0% of all Centralia residents.
| Ancestry | # Population | % Population |
| African | 5 | 0.0% |
| American | 733 | 6.1% |
| Arab | 36 | 0.3% |
| Austrian | 7 | 0.1% |
| Bhutanese | 5 | 0.0% |
| Blackfeet | 14 | 0.1% |
| British | 33 | 0.3% |
| Burmese | 15 | 0.1% |
| Central American | 49 | 0.4% |
| Cherokee | 12 | 0.1% |
| Creek | 4 | 0.0% |
| Croatian | 21 | 0.2% |
| Czech | 81 | 0.7% |
| Czechoslovakian | 2 | 0.0% |
| Danish | 14 | 0.1% |
| Dutch | 65 | 0.5% |
| Egyptian | 10 | 0.1% |
| English | 1,034 | 8.6% |
| European | 133 | 1.1% |
| French | 224 | 1.8% |
| French Canadian | 12 | 0.1% |
| German | 2,557 | 21.1% |
| Greek | 19 | 0.2% |
| Honduran | 25 | 0.2% |
| Hungarian | 12 | 0.1% |
| Indian (Asian) | 56 | 0.5% |
| Iraqi | 16 | 0.1% |
| Irish | 1,562 | 12.9% |
| Italian | 404 | 3.3% |
| Jamaican | 11 | 0.1% |
| Korean | 58 | 0.5% |
| Lebanese | 1 | 0.0% |
| Lithuanian | 120 | 1.0% |
| Mexican | 243 | 2.0% |
| Norwegian | 12 | 0.1% |
| Peruvian | 64 | 0.5% |
| Polish | 215 | 1.8% |
| Puerto Rican | 105 | 0.9% |
| Russian | 33 | 0.3% |
| Salvadoran | 24 | 0.2% |
| Scotch-Irish | 304 | 2.5% |
| Scottish | 128 | 1.1% |
| Sioux | 6 | 0.1% |
| Slovak | 4 | 0.0% |
| South American | 64 | 0.5% |
| Spaniard | 23 | 0.2% |
| Spanish | 42 | 0.4% |
| Sri Lankan | 8 | 0.1% |
| Subsaharan African | 5 | 0.0% |
| Swedish | 71 | 0.6% |
| Swiss | 35 | 0.3% |
| Thai | 45 | 0.4% |
| Turkish | 1 | 0.0% |
| Welsh | 51 | 0.4% | View All 54 Rows |
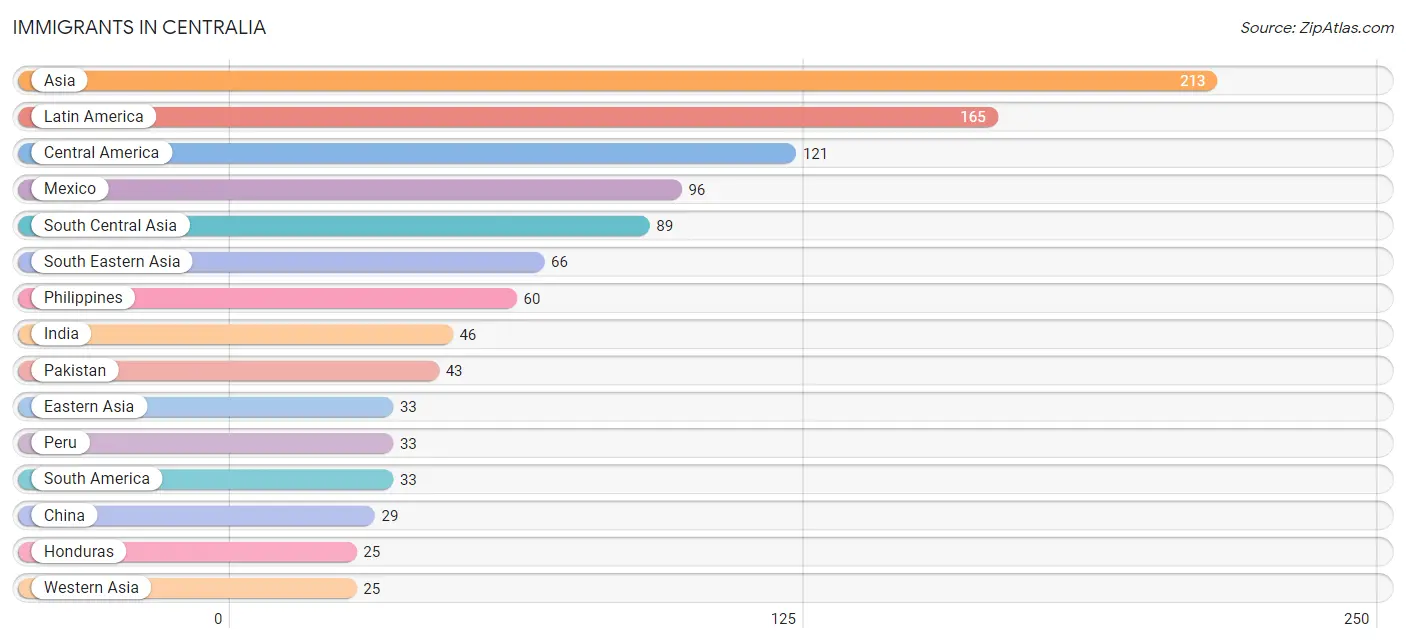
Immigrants in Centralia
The most numerous immigrant groups reported in Centralia came from Asia (213 | 1.8%), Latin America (165 | 1.4%), Central America (121 | 1.0%), Mexico (96 | 0.8%), and South Central Asia (89 | 0.7%), together accounting for 5.7% of all Centralia residents.
| Immigration Origin | # Population | % Population |
| Asia | 213 | 1.8% |
| Canada | 7 | 0.1% |
| Caribbean | 11 | 0.1% |
| Central America | 121 | 1.0% |
| China | 29 | 0.2% |
| Eastern Asia | 33 | 0.3% |
| England | 13 | 0.1% |
| Europe | 24 | 0.2% |
| Germany | 8 | 0.1% |
| Honduras | 25 | 0.2% |
| India | 46 | 0.4% |
| Iraq | 16 | 0.1% |
| Italy | 3 | 0.0% |
| Jamaica | 11 | 0.1% |
| Korea | 4 | 0.0% |
| Latin America | 165 | 1.4% |
| Mexico | 96 | 0.8% |
| Northern Europe | 13 | 0.1% |
| Pakistan | 43 | 0.4% |
| Peru | 33 | 0.3% |
| Philippines | 60 | 0.5% |
| South America | 33 | 0.3% |
| South Central Asia | 89 | 0.7% |
| South Eastern Asia | 66 | 0.5% |
| Southern Europe | 3 | 0.0% |
| Syria | 9 | 0.1% |
| Vietnam | 6 | 0.1% |
| Western Asia | 25 | 0.2% |
| Western Europe | 8 | 0.1% | View All 29 Rows |
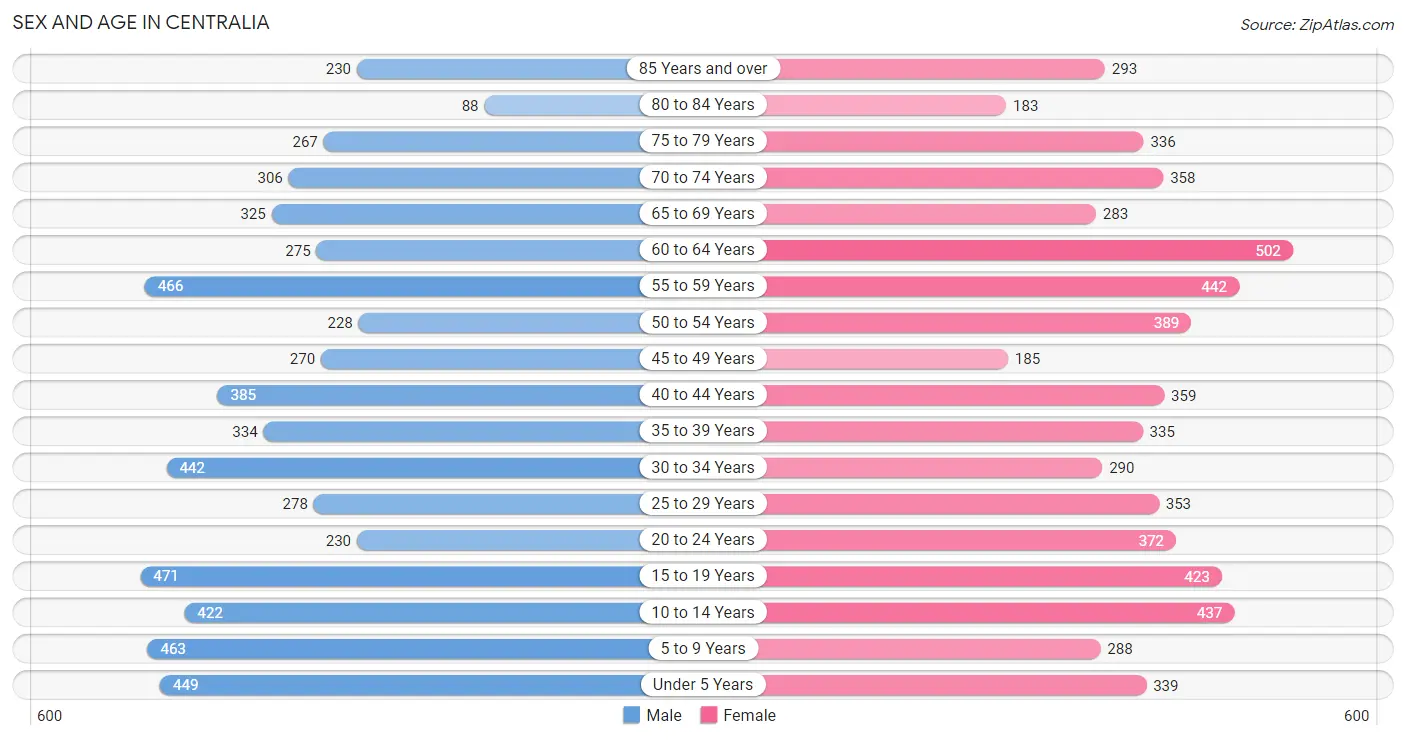
Sex and Age in Centralia
Sex and Age in Centralia
The most populous age groups in Centralia are 15 to 19 Years (471 | 7.9%) for men and 60 to 64 Years (502 | 8.1%) for women.
| Age Bracket | Male | Female |
| Under 5 Years | 449 (7.6%) | 339 (5.5%) |
| 5 to 9 Years | 463 (7.8%) | 288 (4.7%) |
| 10 to 14 Years | 422 (7.1%) | 437 (7.1%) |
| 15 to 19 Years | 471 (7.9%) | 423 (6.9%) |
| 20 to 24 Years | 230 (3.9%) | 372 (6.0%) |
| 25 to 29 Years | 278 (4.7%) | 353 (5.7%) |
| 30 to 34 Years | 442 (7.4%) | 290 (4.7%) |
| 35 to 39 Years | 334 (5.6%) | 335 (5.4%) |
| 40 to 44 Years | 385 (6.5%) | 359 (5.8%) |
| 45 to 49 Years | 270 (4.5%) | 185 (3.0%) |
| 50 to 54 Years | 228 (3.8%) | 389 (6.3%) |
| 55 to 59 Years | 466 (7.9%) | 442 (7.2%) |
| 60 to 64 Years | 275 (4.6%) | 502 (8.1%) |
| 65 to 69 Years | 325 (5.5%) | 283 (4.6%) |
| 70 to 74 Years | 306 (5.2%) | 358 (5.8%) |
| 75 to 79 Years | 267 (4.5%) | 336 (5.4%) |
| 80 to 84 Years | 88 (1.5%) | 183 (3.0%) |
| 85 Years and over | 230 (3.9%) | 293 (4.8%) |
| Total | 5,929 (100.0%) | 6,167 (100.0%) |
Families and Households in Centralia
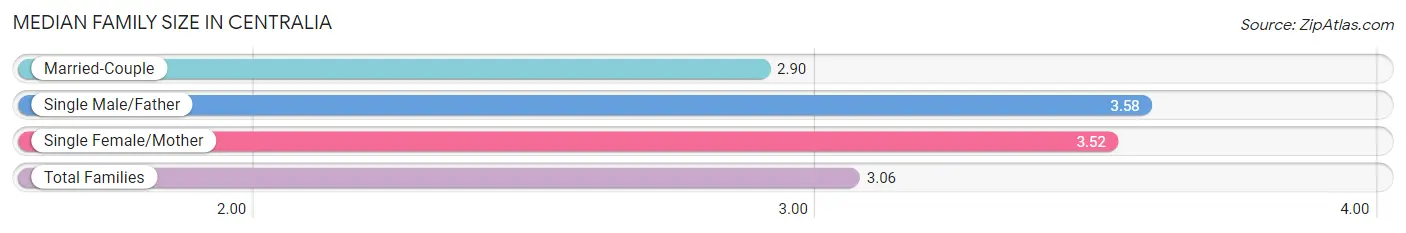
Median Family Size in Centralia
The median family size in Centralia is 3.06 persons per family, with single male/father families (136 | 5.2%) accounting for the largest median family size of 3.58 persons per family. On the other hand, married-couple families (1,911 | 73.4%) represent the smallest median family size with 2.90 persons per family.
| Family Type | # Families | Family Size |
| Married-Couple | 1,911 (73.4%) | 2.90 |
| Single Male/Father | 136 (5.2%) | 3.58 |
| Single Female/Mother | 557 (21.4%) | 3.52 |
| Total Families | 2,604 (100.0%) | 3.06 |
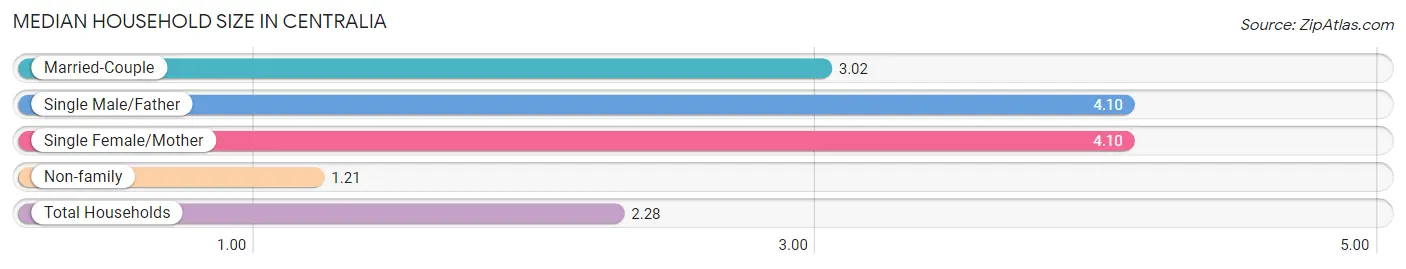
Median Household Size in Centralia
The median household size in Centralia is 2.28 persons per household, with single male/father households (136 | 2.6%) accounting for the largest median household size of 4.1 persons per household. non-family households (2,523 | 49.2%) represent the smallest median household size with 1.21 persons per household.
| Household Type | # Households | Household Size |
| Married-Couple | 1,911 (37.3%) | 3.02 |
| Single Male/Father | 136 (2.6%) | 4.10 |
| Single Female/Mother | 557 (10.9%) | 4.10 |
| Non-family | 2,523 (49.2%) | 1.21 |
| Total Households | 5,127 (100.0%) | 2.28 |
Household Size by Marriage Status in Centralia
Out of a total of 5,127 households in Centralia, 2,604 (50.8%) are family households, while 2,523 (49.2%) are nonfamily households. The most numerous type of family households are 2-person households, comprising 1,126, and the most common type of nonfamily households are 1-person households, comprising 2,136.
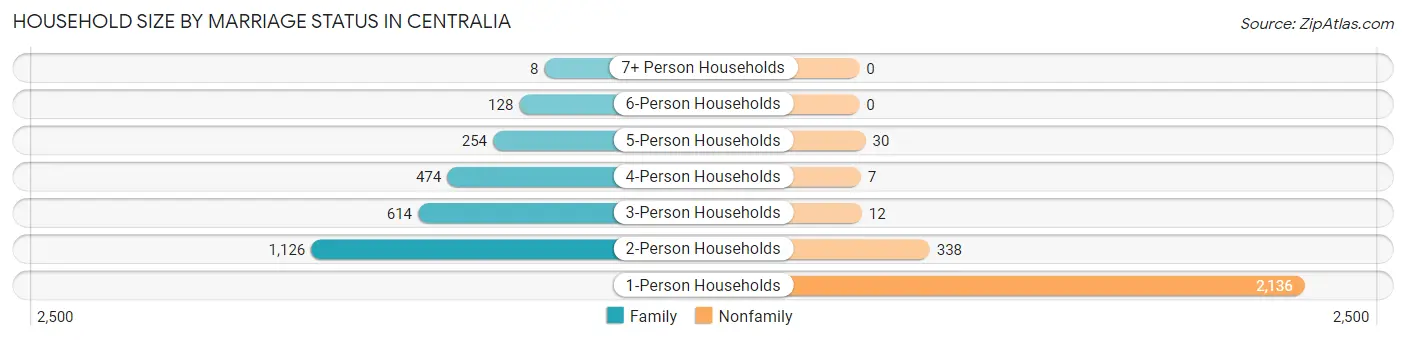
| Household Size | Family Households | Nonfamily Households |
| 1-Person Households | - | 2,136 (41.7%) |
| 2-Person Households | 1,126 (22.0%) | 338 (6.6%) |
| 3-Person Households | 614 (12.0%) | 12 (0.2%) |
| 4-Person Households | 474 (9.2%) | 7 (0.1%) |
| 5-Person Households | 254 (5.0%) | 30 (0.6%) |
| 6-Person Households | 128 (2.5%) | 0 (0.0%) |
| 7+ Person Households | 8 (0.2%) | 0 (0.0%) |
| Total | 2,604 (50.8%) | 2,523 (49.2%) |
Female Fertility in Centralia
Fertility by Age in Centralia
Average fertility rate in Centralia is 64.0 births per 1,000 women. Women in the age bracket of 20 to 34 years have the highest fertility rate with 141.0 births per 1,000 women. Women in the age bracket of 20 to 34 years acount for 94.7% of all women with births.
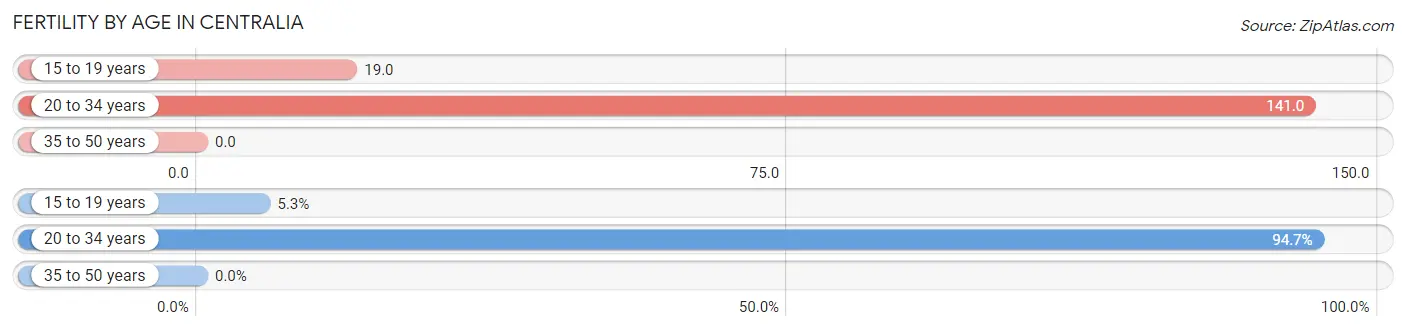
| Age Bracket | Women with Births | Births / 1,000 Women |
| 15 to 19 years | 8 (5.3%) | 19.0 |
| 20 to 34 years | 143 (94.7%) | 141.0 |
| 35 to 50 years | 0 (0.0%) | 0.0 |
| Total | 151 (100.0%) | 64.0 |
Fertility by Age by Marriage Status in Centralia
84.1% of women with births (151) in Centralia are married. The highest percentage of unmarried women with births falls into 15 to 19 years age bracket with 100.0% of them unmarried at the time of birth, while the lowest percentage of unmarried women with births belong to 20 to 34 years age bracket with 11.2% of them unmarried.
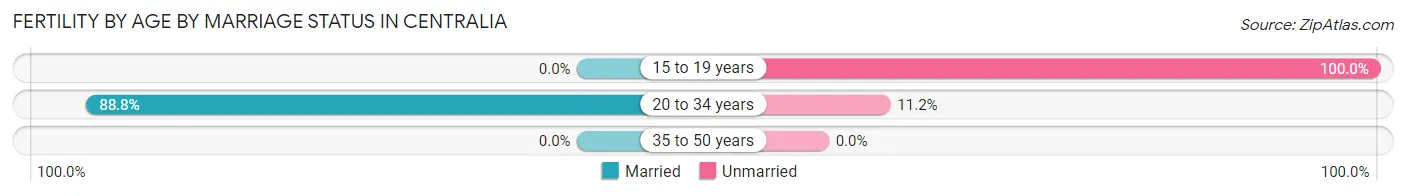
| Age Bracket | Married | Unmarried |
| 15 to 19 years | 0 (0.0%) | 8 (100.0%) |
| 20 to 34 years | 127 (88.8%) | 16 (11.2%) |
| 35 to 50 years | 0 (0.0%) | 0 (0.0%) |
| Total | 127 (84.1%) | 24 (15.9%) |
Fertility by Education in Centralia
Average fertility rate in Centralia is 64.0 births per 1,000 women. Women with the education attainment of college or associate's degree have the highest fertility rate of 96.0 births per 1,000 women, while women with the education attainment of bachelor's degree have the lowest fertility at 30.0 births per 1,000 women. Women with the education attainment of college or associate's degree represent 66.2% of all women with births.
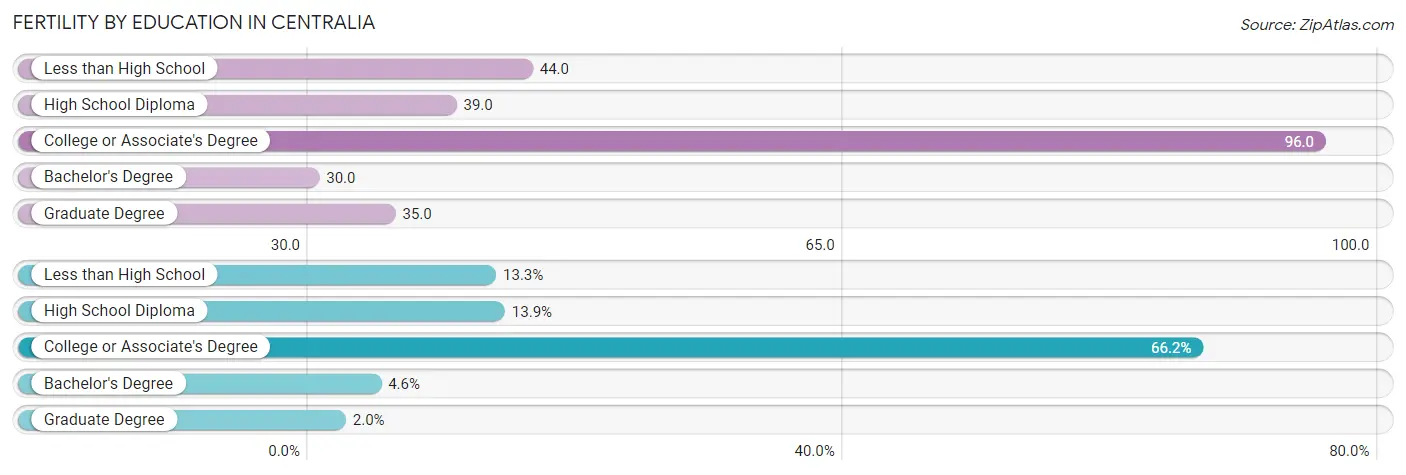
| Educational Attainment | Women with Births | Births / 1,000 Women |
| Less than High School | 20 (13.3%) | 44.0 |
| High School Diploma | 21 (13.9%) | 39.0 |
| College or Associate's Degree | 100 (66.2%) | 96.0 |
| Bachelor's Degree | 7 (4.6%) | 30.0 |
| Graduate Degree | 3 (2.0%) | 35.0 |
| Total | 151 (100.0%) | 64.0 |
Fertility by Education by Marriage Status in Centralia
15.9% of women with births in Centralia are unmarried. Women with the educational attainment of bachelor's degree are most likely to be married with 100.0% of them married at childbirth, while women with the educational attainment of high school diploma are least likely to be married with 38.1% of them unmarried at childbirth.
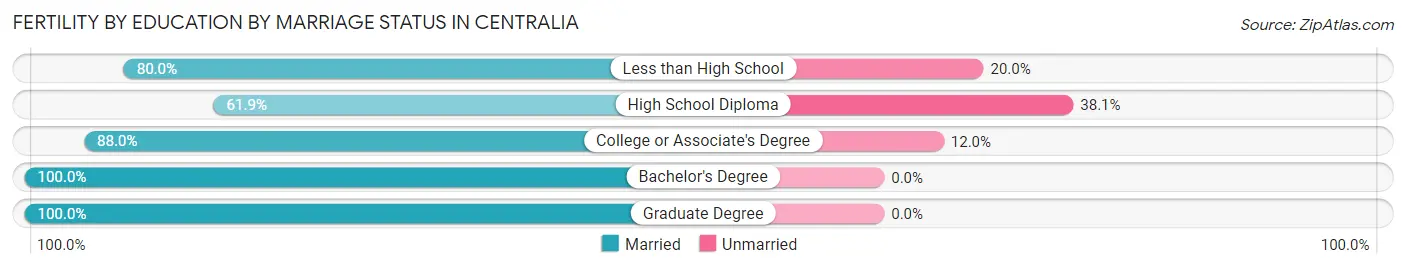
| Educational Attainment | Married | Unmarried |
| Less than High School | 16 (80.0%) | 4 (20.0%) |
| High School Diploma | 13 (61.9%) | 8 (38.1%) |
| College or Associate's Degree | 88 (88.0%) | 12 (12.0%) |
| Bachelor's Degree | 7 (100.0%) | 0 (0.0%) |
| Graduate Degree | 3 (100.0%) | 0 (0.0%) |
| Total | 127 (84.1%) | 24 (15.9%) |
Employment Characteristics in Centralia
Employment by Class of Employer in Centralia
Among the 4,490 employed individuals in Centralia, private company employees (2,797 | 62.3%), not-for-profit organizations (467 | 10.4%), and local government employees (354 | 7.9%) make up the most common classes of employment.
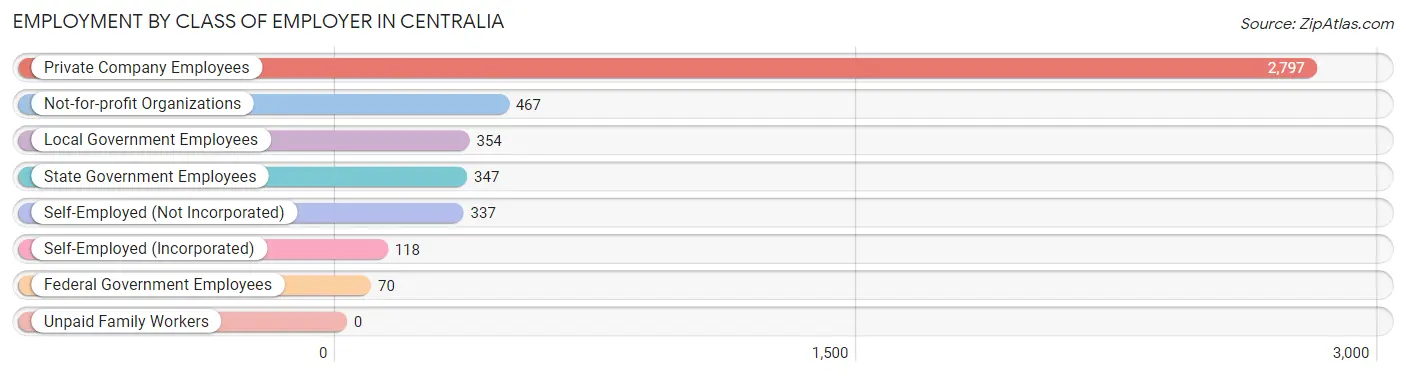
| Employer Class | # Employees | % Employees |
| Private Company Employees | 2,797 | 62.3% |
| Self-Employed (Incorporated) | 118 | 2.6% |
| Self-Employed (Not Incorporated) | 337 | 7.5% |
| Not-for-profit Organizations | 467 | 10.4% |
| Local Government Employees | 354 | 7.9% |
| State Government Employees | 347 | 7.7% |
| Federal Government Employees | 70 | 1.6% |
| Unpaid Family Workers | 0 | 0.0% |
| Total | 4,490 | 100.0% |
Employment Status by Age in Centralia
According to the labor force statistics for Centralia, out of the total population over 16 years of age (9,513), 55.0% or 5,232 individuals are in the labor force, with 12.4% or 649 of them unemployed. The age group with the highest labor force participation rate is 30 to 34 years, with 85.2% or 624 individuals in the labor force. Within the labor force, the 25 to 29 years age range has the highest percentage of unemployed individuals, with 40.7% or 218 of them being unemployed.
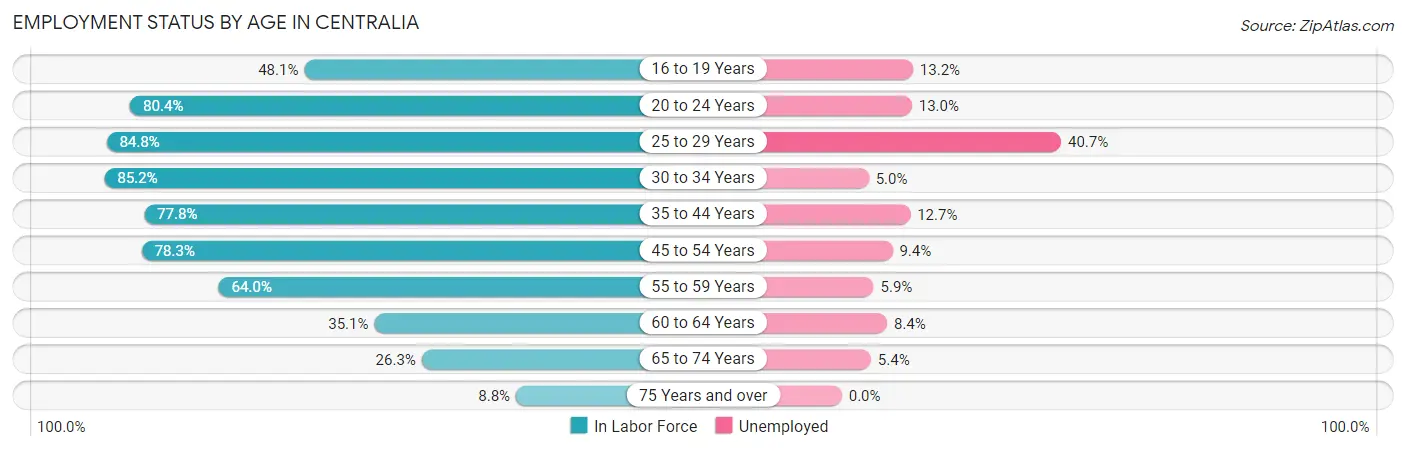
| Age Bracket | In Labor Force | Unemployed |
| 16 to 19 Years | 341 (48.1%) | 45 (13.2%) |
| 20 to 24 Years | 484 (80.4%) | 63 (13.0%) |
| 25 to 29 Years | 535 (84.8%) | 218 (40.7%) |
| 30 to 34 Years | 624 (85.2%) | 31 (5.0%) |
| 35 to 44 Years | 1,099 (77.8%) | 140 (12.7%) |
| 45 to 54 Years | 839 (78.3%) | 79 (9.4%) |
| 55 to 59 Years | 581 (64.0%) | 34 (5.9%) |
| 60 to 64 Years | 273 (35.1%) | 23 (8.4%) |
| 65 to 74 Years | 335 (26.3%) | 18 (5.4%) |
| 75 Years and over | 123 (8.8%) | 0 (0.0%) |
| Total | 5,232 (55.0%) | 649 (12.4%) |
Employment Status by Educational Attainment in Centralia
According to labor force statistics for Centralia, 71.4% of individuals (3,951) out of the total population between 25 and 64 years of age (5,533) are in the labor force, with 13.3% or 525 of them being unemployed. The group with the highest labor force participation rate are those with the educational attainment of bachelor's degree or higher, with 87.5% or 990 individuals in the labor force. Within the labor force, individuals with less than high school education have the highest percentage of unemployment, with 27.7% or 117 of them being unemployed.
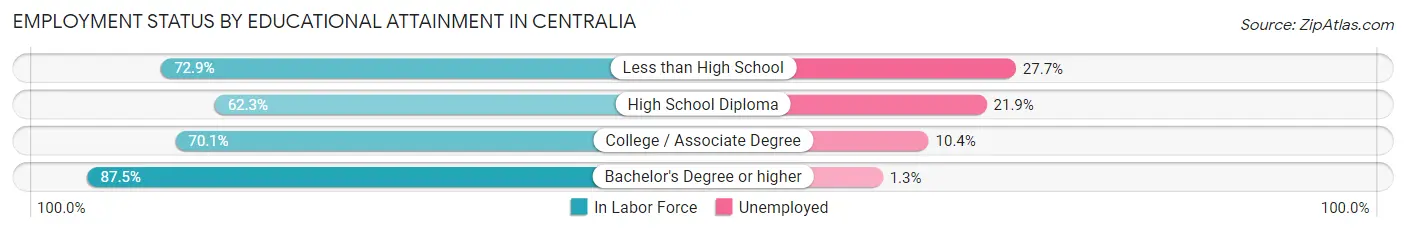
| Educational Attainment | In Labor Force | Unemployed |
| Less than High School | 422 (72.9%) | 160 (27.7%) |
| High School Diploma | 1,132 (62.3%) | 398 (21.9%) |
| College / Associate Degree | 1,406 (70.1%) | 209 (10.4%) |
| Bachelor's Degree or higher | 990 (87.5%) | 15 (1.3%) |
| Total | 3,951 (71.4%) | 736 (13.3%) |
Employment Occupations by Sex in Centralia
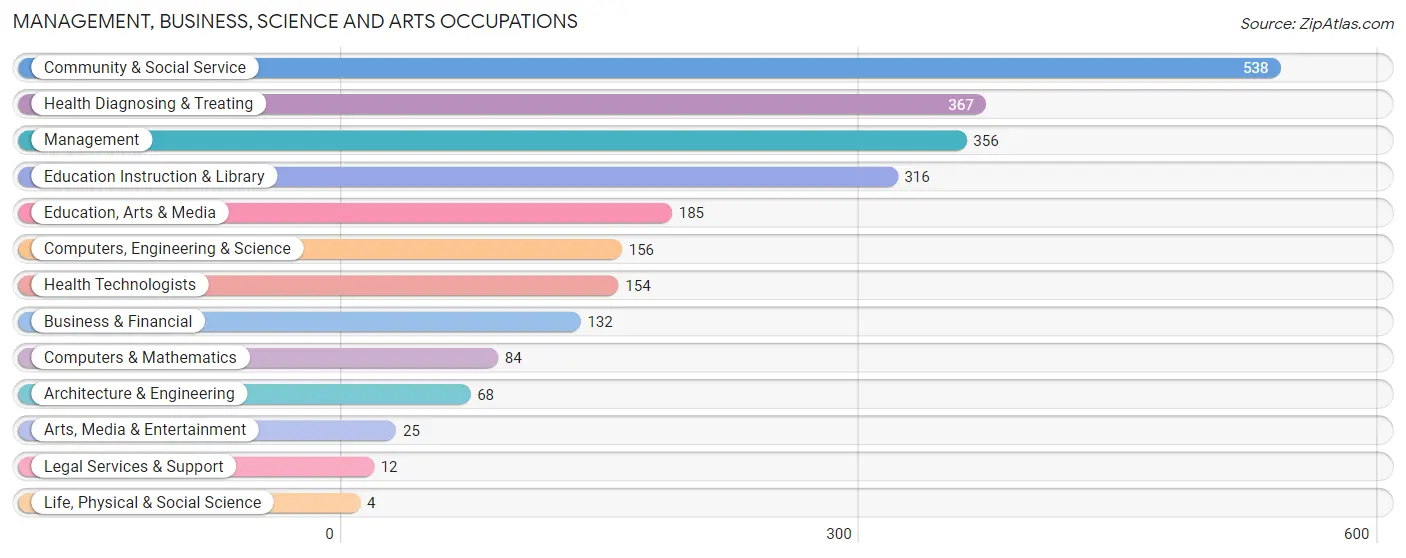
Management, Business, Science and Arts Occupations
The most common Management, Business, Science and Arts occupations in Centralia are Community & Social Service (538 | 11.7%), Health Diagnosing & Treating (367 | 8.0%), Management (356 | 7.8%), Education Instruction & Library (316 | 6.9%), and Education, Arts & Media (185 | 4.0%).
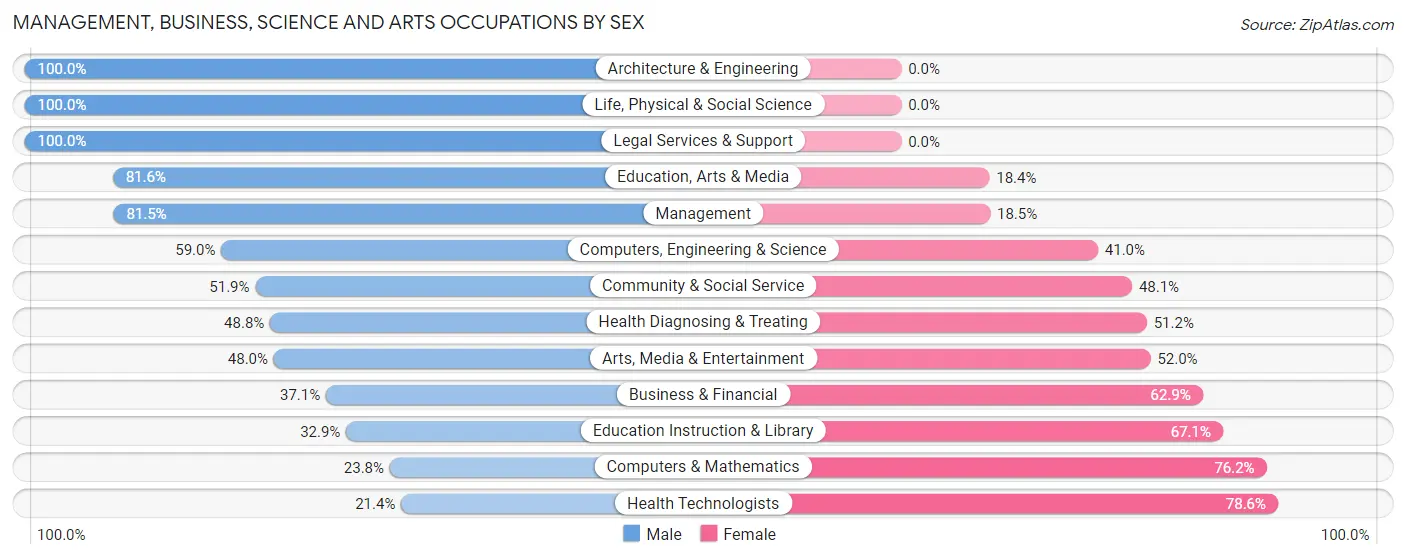
Management, Business, Science and Arts Occupations by Sex
Within the Management, Business, Science and Arts occupations in Centralia, the most male-oriented occupations are Architecture & Engineering (100.0%), Life, Physical & Social Science (100.0%), and Legal Services & Support (100.0%), while the most female-oriented occupations are Health Technologists (78.6%), Computers & Mathematics (76.2%), and Education Instruction & Library (67.1%).
| Occupation | Male | Female |
| Management | 290 (81.5%) | 66 (18.5%) |
| Business & Financial | 49 (37.1%) | 83 (62.9%) |
| Computers, Engineering & Science | 92 (59.0%) | 64 (41.0%) |
| Computers & Mathematics | 20 (23.8%) | 64 (76.2%) |
| Architecture & Engineering | 68 (100.0%) | 0 (0.0%) |
| Life, Physical & Social Science | 4 (100.0%) | 0 (0.0%) |
| Community & Social Service | 279 (51.9%) | 259 (48.1%) |
| Education, Arts & Media | 151 (81.6%) | 34 (18.4%) |
| Legal Services & Support | 12 (100.0%) | 0 (0.0%) |
| Education Instruction & Library | 104 (32.9%) | 212 (67.1%) |
| Arts, Media & Entertainment | 12 (48.0%) | 13 (52.0%) |
| Health Diagnosing & Treating | 179 (48.8%) | 188 (51.2%) |
| Health Technologists | 33 (21.4%) | 121 (78.6%) |
| Total (Category) | 889 (57.4%) | 660 (42.6%) |
| Total (Overall) | 2,456 (53.6%) | 2,125 (46.4%) |
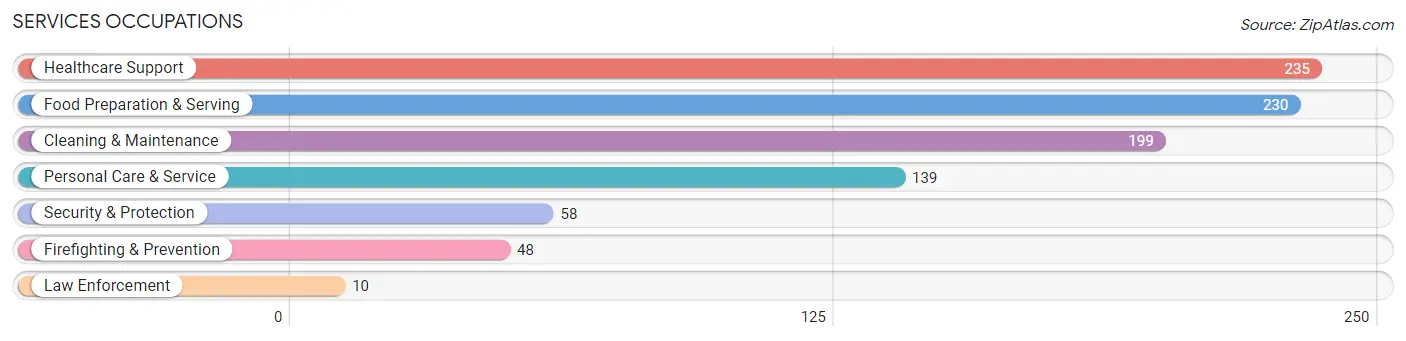
Services Occupations
The most common Services occupations in Centralia are Healthcare Support (235 | 5.1%), Food Preparation & Serving (230 | 5.0%), Cleaning & Maintenance (199 | 4.3%), Personal Care & Service (139 | 3.0%), and Security & Protection (58 | 1.3%).
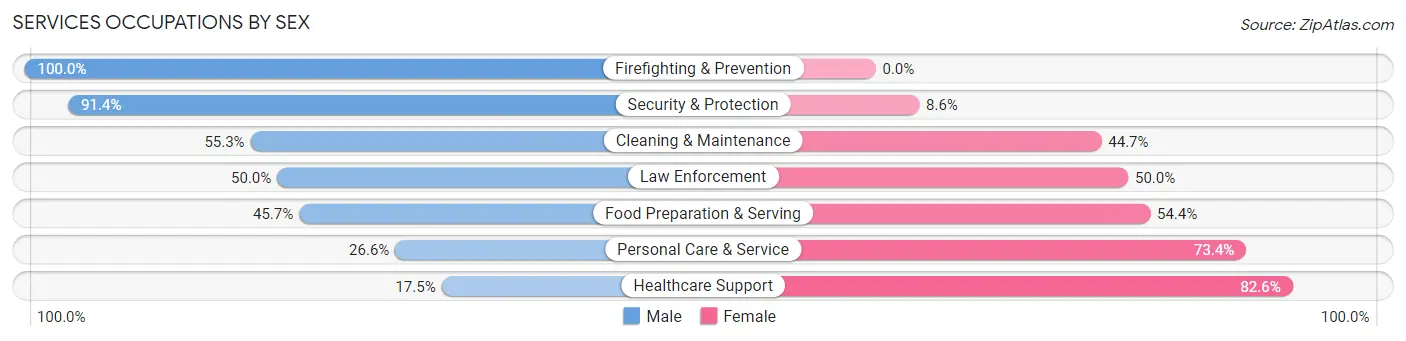
Services Occupations by Sex
Within the Services occupations in Centralia, the most male-oriented occupations are Firefighting & Prevention (100.0%), Security & Protection (91.4%), and Cleaning & Maintenance (55.3%), while the most female-oriented occupations are Healthcare Support (82.6%), Personal Care & Service (73.4%), and Food Preparation & Serving (54.3%).
| Occupation | Male | Female |
| Healthcare Support | 41 (17.4%) | 194 (82.6%) |
| Security & Protection | 53 (91.4%) | 5 (8.6%) |
| Firefighting & Prevention | 48 (100.0%) | 0 (0.0%) |
| Law Enforcement | 5 (50.0%) | 5 (50.0%) |
| Food Preparation & Serving | 105 (45.7%) | 125 (54.3%) |
| Cleaning & Maintenance | 110 (55.3%) | 89 (44.7%) |
| Personal Care & Service | 37 (26.6%) | 102 (73.4%) |
| Total (Category) | 346 (40.2%) | 515 (59.8%) |
| Total (Overall) | 2,456 (53.6%) | 2,125 (46.4%) |
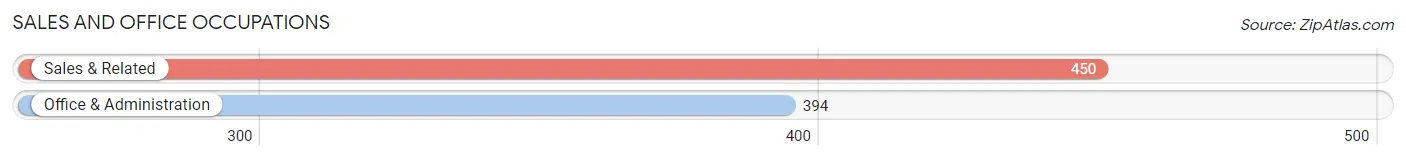
Sales and Office Occupations
The most common Sales and Office occupations in Centralia are Sales & Related (450 | 9.8%), and Office & Administration (394 | 8.6%).
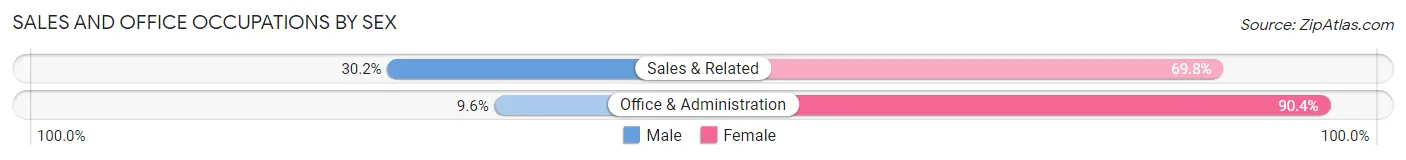
Sales and Office Occupations by Sex
| Occupation | Male | Female |
| Sales & Related | 136 (30.2%) | 314 (69.8%) |
| Office & Administration | 38 (9.6%) | 356 (90.4%) |
| Total (Category) | 174 (20.6%) | 670 (79.4%) |
| Total (Overall) | 2,456 (53.6%) | 2,125 (46.4%) |
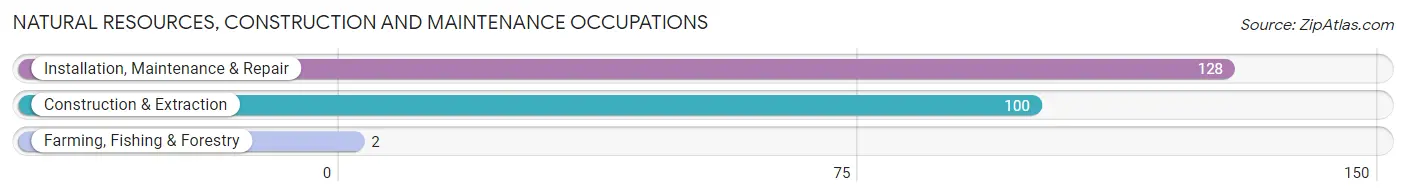
Natural Resources, Construction and Maintenance Occupations
The most common Natural Resources, Construction and Maintenance occupations in Centralia are Installation, Maintenance & Repair (128 | 2.8%), Construction & Extraction (100 | 2.2%), and Farming, Fishing & Forestry (2 | 0.0%).
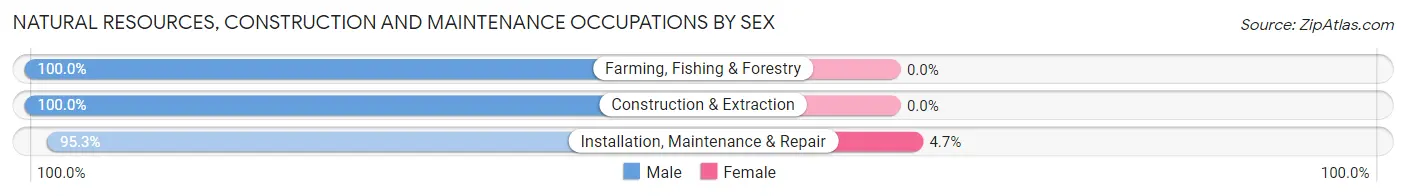
Natural Resources, Construction and Maintenance Occupations by Sex
| Occupation | Male | Female |
| Farming, Fishing & Forestry | 2 (100.0%) | 0 (0.0%) |
| Construction & Extraction | 100 (100.0%) | 0 (0.0%) |
| Installation, Maintenance & Repair | 122 (95.3%) | 6 (4.7%) |
| Total (Category) | 224 (97.4%) | 6 (2.6%) |
| Total (Overall) | 2,456 (53.6%) | 2,125 (46.4%) |
Production, Transportation and Moving Occupations
The most common Production, Transportation and Moving occupations in Centralia are Production (520 | 11.4%), Transportation (323 | 7.0%), and Material Moving (254 | 5.5%).
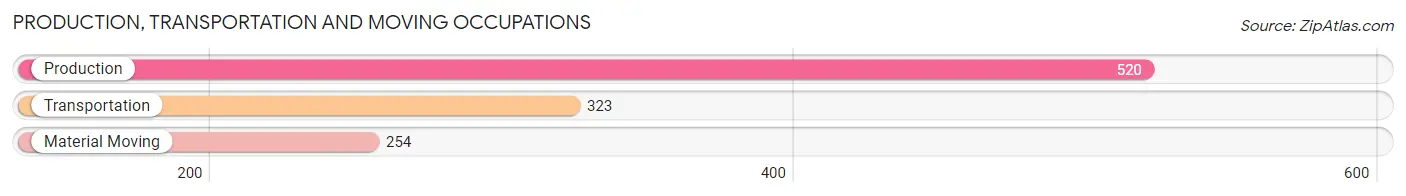
Production, Transportation and Moving Occupations by Sex
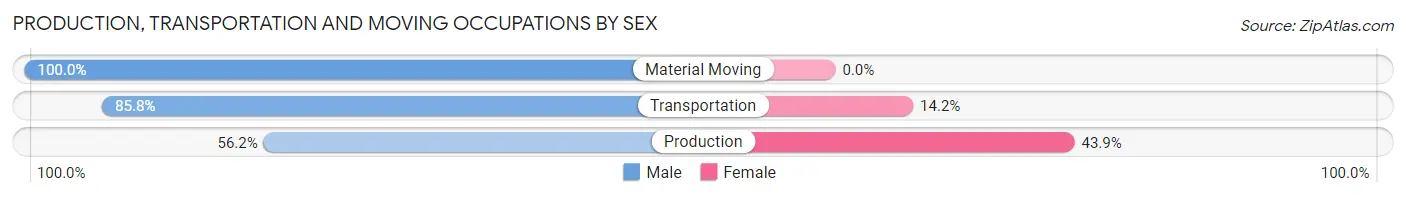
| Occupation | Male | Female |
| Production | 292 (56.1%) | 228 (43.9%) |
| Transportation | 277 (85.8%) | 46 (14.2%) |
| Material Moving | 254 (100.0%) | 0 (0.0%) |
| Total (Category) | 823 (75.0%) | 274 (25.0%) |
| Total (Overall) | 2,456 (53.6%) | 2,125 (46.4%) |
Employment Industries by Sex in Centralia
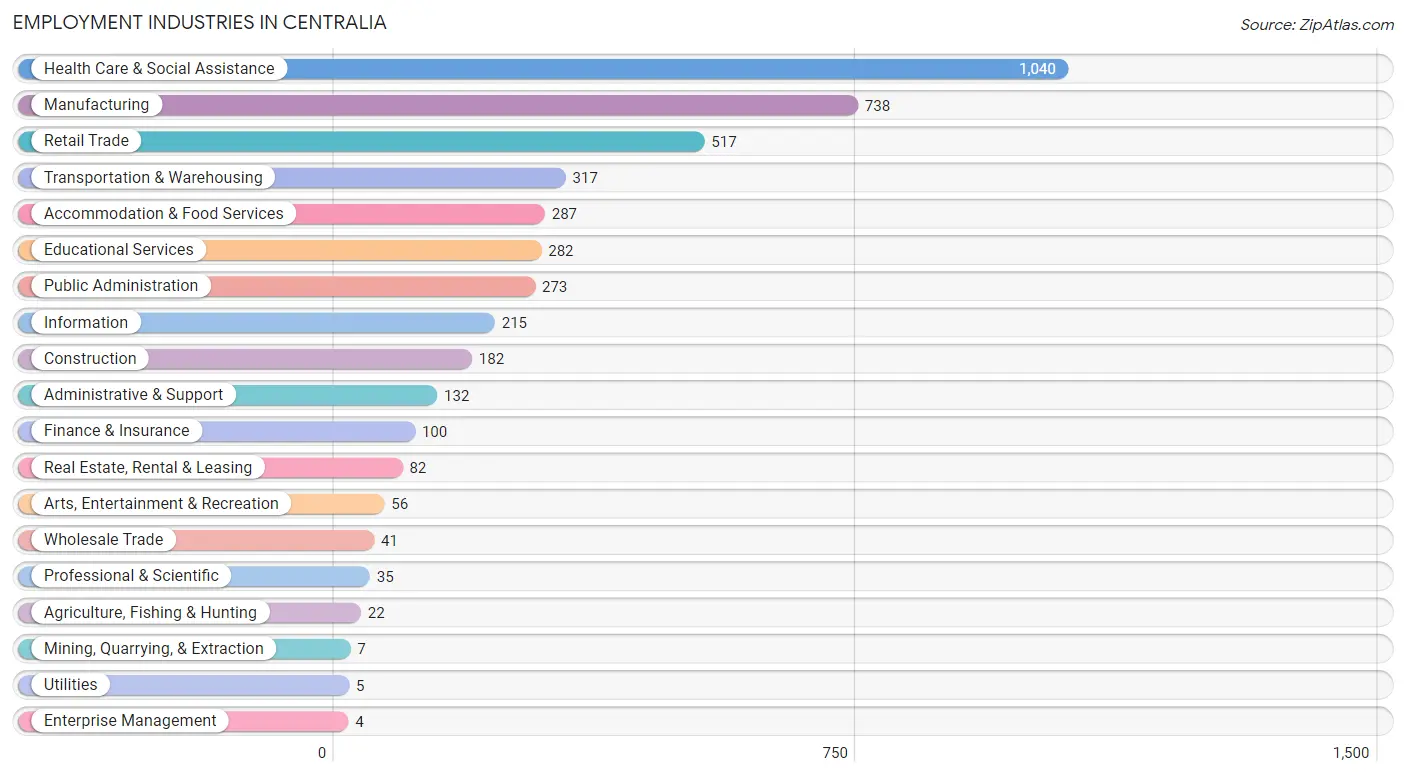
Employment Industries in Centralia
The major employment industries in Centralia include Health Care & Social Assistance (1,040 | 22.7%), Manufacturing (738 | 16.1%), Retail Trade (517 | 11.3%), Transportation & Warehousing (317 | 6.9%), and Accommodation & Food Services (287 | 6.3%).
Employment Industries by Sex in Centralia
The Centralia industries that see more men than women are Agriculture, Fishing & Hunting (100.0%), Mining, Quarrying, & Extraction (100.0%), and Construction (100.0%), whereas the industries that tend to have a higher number of women are Utilities (100.0%), Enterprise Management (100.0%), and Real Estate, Rental & Leasing (82.9%).
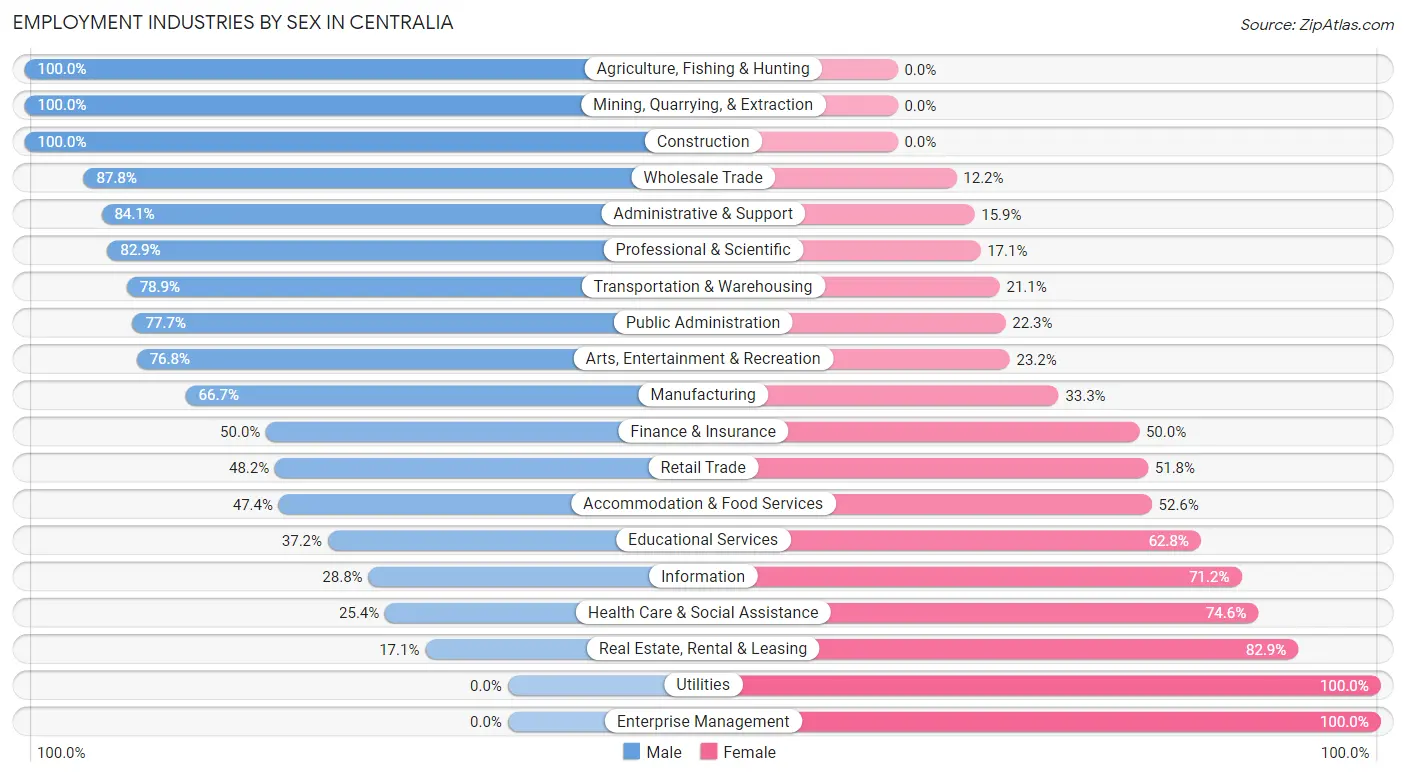
| Industry | Male | Female |
| Agriculture, Fishing & Hunting | 22 (100.0%) | 0 (0.0%) |
| Mining, Quarrying, & Extraction | 7 (100.0%) | 0 (0.0%) |
| Construction | 182 (100.0%) | 0 (0.0%) |
| Manufacturing | 492 (66.7%) | 246 (33.3%) |
| Wholesale Trade | 36 (87.8%) | 5 (12.2%) |
| Retail Trade | 249 (48.2%) | 268 (51.8%) |
| Transportation & Warehousing | 250 (78.9%) | 67 (21.1%) |
| Utilities | 0 (0.0%) | 5 (100.0%) |
| Information | 62 (28.8%) | 153 (71.2%) |
| Finance & Insurance | 50 (50.0%) | 50 (50.0%) |
| Real Estate, Rental & Leasing | 14 (17.1%) | 68 (82.9%) |
| Professional & Scientific | 29 (82.9%) | 6 (17.1%) |
| Enterprise Management | 0 (0.0%) | 4 (100.0%) |
| Administrative & Support | 111 (84.1%) | 21 (15.9%) |
| Educational Services | 105 (37.2%) | 177 (62.8%) |
| Health Care & Social Assistance | 264 (25.4%) | 776 (74.6%) |
| Arts, Entertainment & Recreation | 43 (76.8%) | 13 (23.2%) |
| Accommodation & Food Services | 136 (47.4%) | 151 (52.6%) |
| Public Administration | 212 (77.7%) | 61 (22.3%) |
| Total | 2,456 (53.6%) | 2,125 (46.4%) |
Education in Centralia
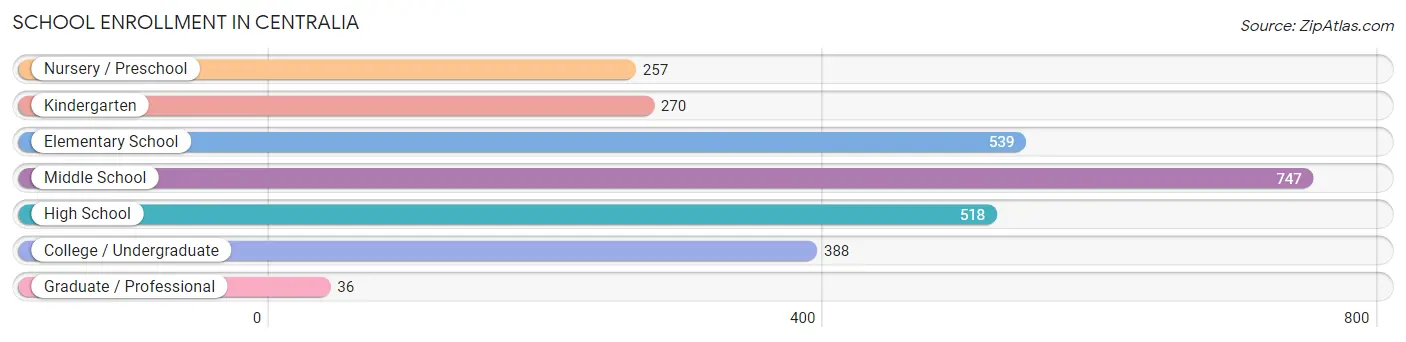
School Enrollment in Centralia
The most common levels of schooling among the 2,755 students in Centralia are middle school (747 | 27.1%), elementary school (539 | 19.6%), and high school (518 | 18.8%).
| School Level | # Students | % Students |
| Nursery / Preschool | 257 | 9.3% |
| Kindergarten | 270 | 9.8% |
| Elementary School | 539 | 19.6% |
| Middle School | 747 | 27.1% |
| High School | 518 | 18.8% |
| College / Undergraduate | 388 | 14.1% |
| Graduate / Professional | 36 | 1.3% |
| Total | 2,755 | 100.0% |
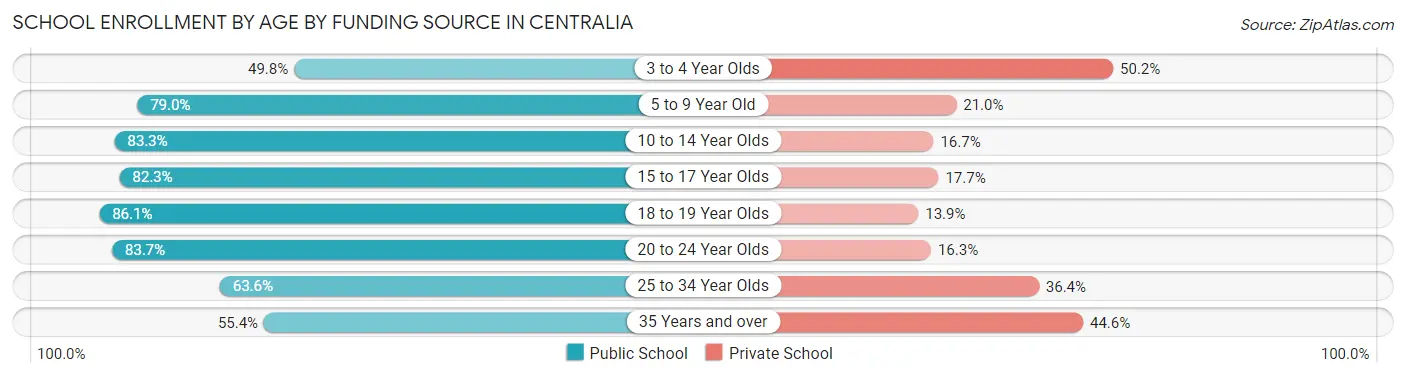
School Enrollment by Age by Funding Source in Centralia
Out of a total of 2,755 students who are enrolled in schools in Centralia, 606 (22.0%) attend a private institution, while the remaining 2,149 (78.0%) are enrolled in public schools. The age group of 3 to 4 year olds has the highest likelihood of being enrolled in private schools, with 131 (50.2% in the age bracket) enrolled. Conversely, the age group of 18 to 19 year olds has the lowest likelihood of being enrolled in a private school, with 223 (86.1% in the age bracket) attending a public institution.
| Age Bracket | Public School | Private School |
| 3 to 4 Year Olds | 130 (49.8%) | 131 (50.2%) |
| 5 to 9 Year Old | 580 (79.0%) | 154 (21.0%) |
| 10 to 14 Year Olds | 702 (83.3%) | 141 (16.7%) |
| 15 to 17 Year Olds | 345 (82.3%) | 74 (17.7%) |
| 18 to 19 Year Olds | 223 (86.1%) | 36 (13.9%) |
| 20 to 24 Year Olds | 103 (83.7%) | 20 (16.3%) |
| 25 to 34 Year Olds | 21 (63.6%) | 12 (36.4%) |
| 35 Years and over | 46 (55.4%) | 37 (44.6%) |
| Total | 2,149 (78.0%) | 606 (22.0%) |
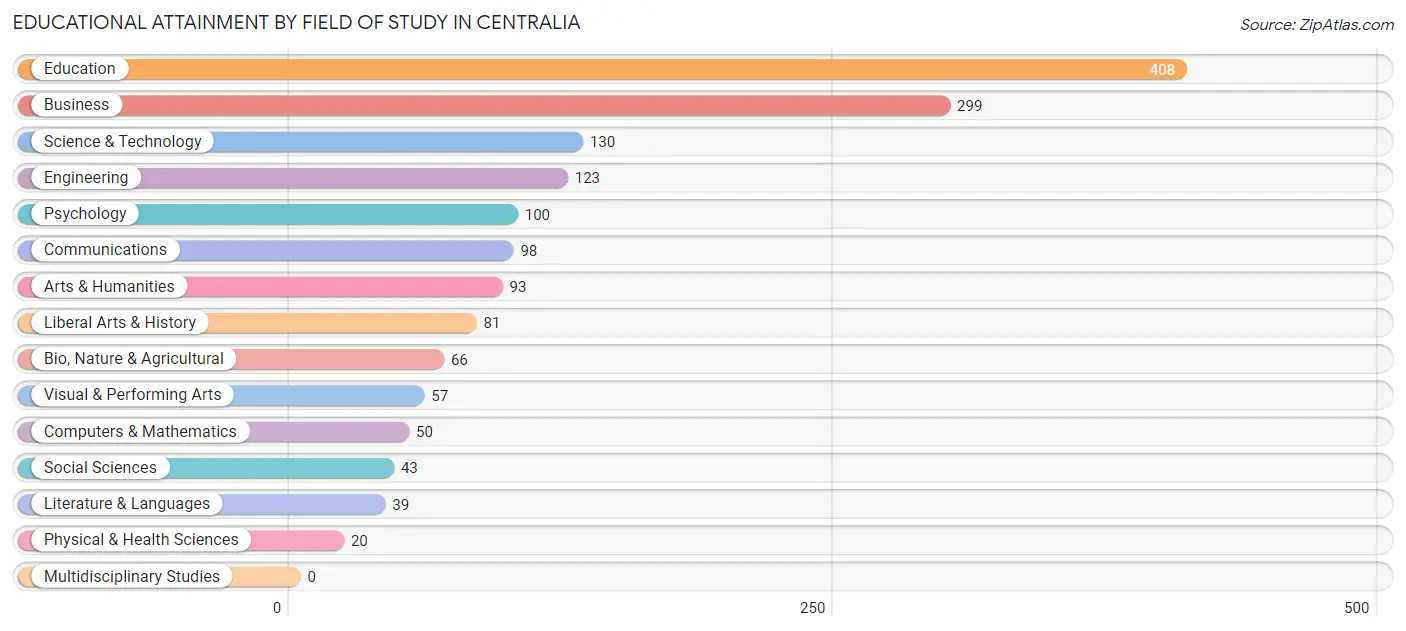
Educational Attainment by Field of Study in Centralia
Education (408 | 25.4%), business (299 | 18.6%), science & technology (130 | 8.1%), engineering (123 | 7.6%), and psychology (100 | 6.2%) are the most common fields of study among 1,607 individuals in Centralia who have obtained a bachelor's degree or higher.
| Field of Study | # Graduates | % Graduates |
| Computers & Mathematics | 50 | 3.1% |
| Bio, Nature & Agricultural | 66 | 4.1% |
| Physical & Health Sciences | 20 | 1.2% |
| Psychology | 100 | 6.2% |
| Social Sciences | 43 | 2.7% |
| Engineering | 123 | 7.6% |
| Multidisciplinary Studies | 0 | 0.0% |
| Science & Technology | 130 | 8.1% |
| Business | 299 | 18.6% |
| Education | 408 | 25.4% |
| Literature & Languages | 39 | 2.4% |
| Liberal Arts & History | 81 | 5.0% |
| Visual & Performing Arts | 57 | 3.5% |
| Communications | 98 | 6.1% |
| Arts & Humanities | 93 | 5.8% |
| Total | 1,607 | 100.0% |
Transportation & Commute in Centralia
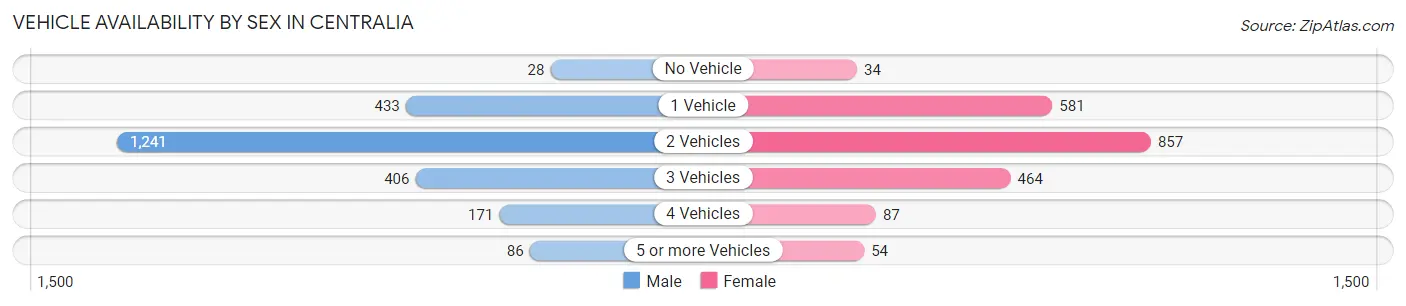
Vehicle Availability by Sex in Centralia
The most prevalent vehicle ownership categories in Centralia are males with 2 vehicles (1,241, accounting for 52.5%) and females with 2 vehicles (857, making up 59.8%).
| Vehicles Available | Male | Female |
| No Vehicle | 28 (1.2%) | 34 (1.6%) |
| 1 Vehicle | 433 (18.3%) | 581 (28.0%) |
| 2 Vehicles | 1,241 (52.5%) | 857 (41.3%) |
| 3 Vehicles | 406 (17.2%) | 464 (22.3%) |
| 4 Vehicles | 171 (7.2%) | 87 (4.2%) |
| 5 or more Vehicles | 86 (3.6%) | 54 (2.6%) |
| Total | 2,365 (100.0%) | 2,077 (100.0%) |
Commute Time in Centralia
The most frequently occuring commute durations in Centralia are 5 to 9 minutes (1,233 commuters, 29.7%), 10 to 14 minutes (963 commuters, 23.2%), and 30 to 34 minutes (467 commuters, 11.3%).
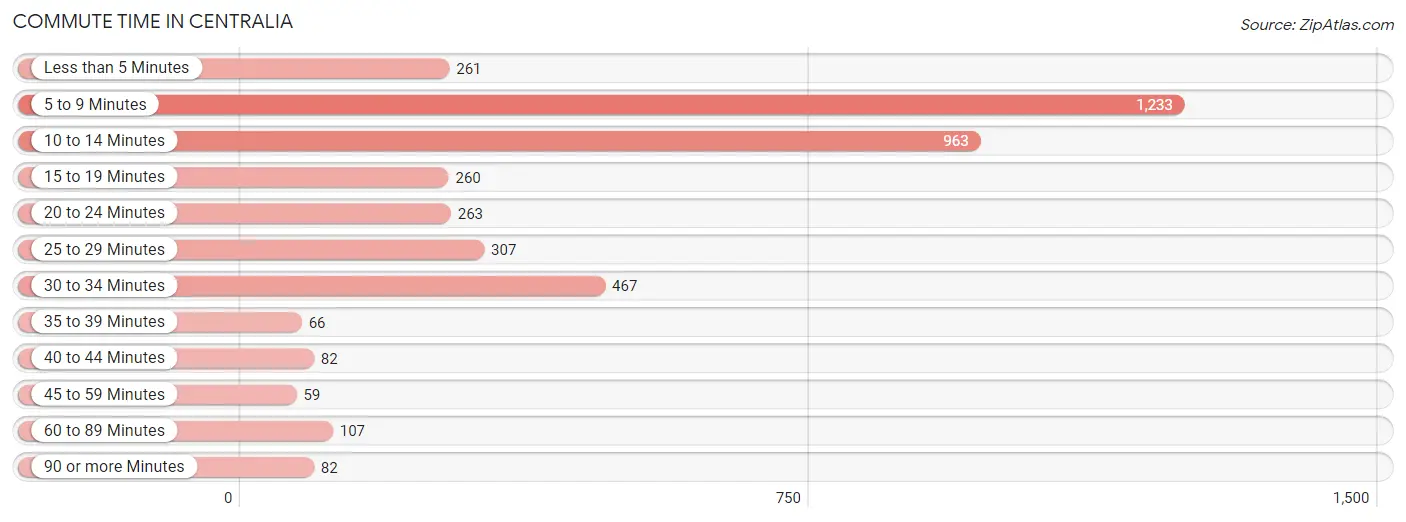
| Commute Time | # Commuters | % Commuters |
| Less than 5 Minutes | 261 | 6.3% |
| 5 to 9 Minutes | 1,233 | 29.7% |
| 10 to 14 Minutes | 963 | 23.2% |
| 15 to 19 Minutes | 260 | 6.3% |
| 20 to 24 Minutes | 263 | 6.3% |
| 25 to 29 Minutes | 307 | 7.4% |
| 30 to 34 Minutes | 467 | 11.3% |
| 35 to 39 Minutes | 66 | 1.6% |
| 40 to 44 Minutes | 82 | 2.0% |
| 45 to 59 Minutes | 59 | 1.4% |
| 60 to 89 Minutes | 107 | 2.6% |
| 90 or more Minutes | 82 | 2.0% |
Commute Time by Sex in Centralia
The most common commute times in Centralia are 5 to 9 minutes (543 commuters, 25.1%) for males and 5 to 9 minutes (690 commuters, 34.8%) for females.
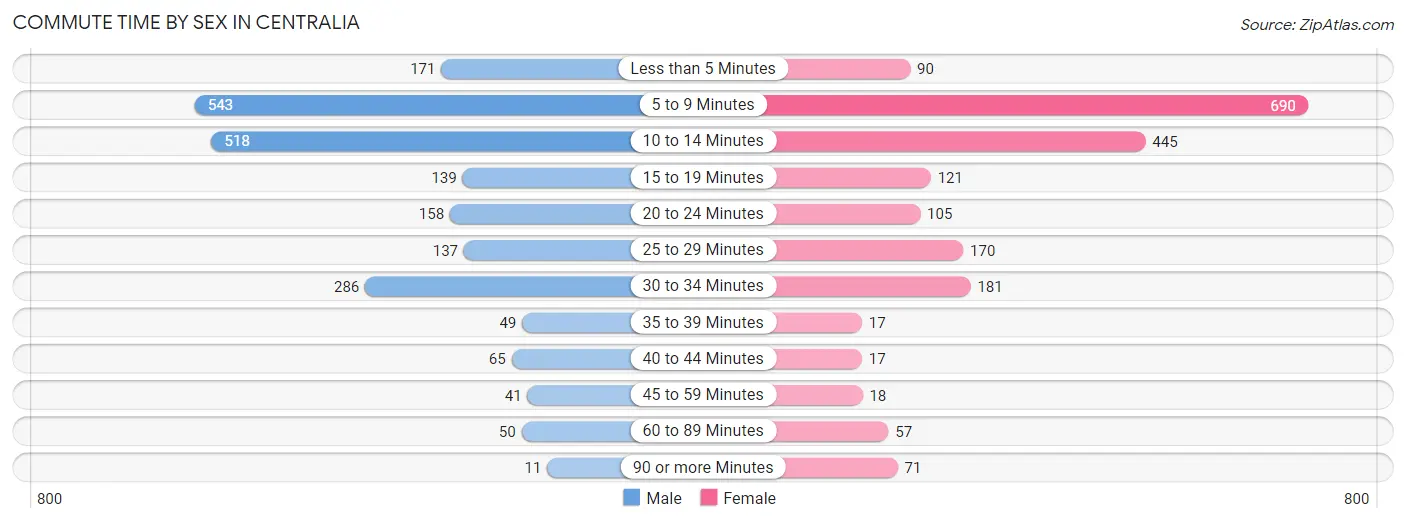
| Commute Time | Male | Female |
| Less than 5 Minutes | 171 (7.9%) | 90 (4.5%) |
| 5 to 9 Minutes | 543 (25.1%) | 690 (34.8%) |
| 10 to 14 Minutes | 518 (23.9%) | 445 (22.5%) |
| 15 to 19 Minutes | 139 (6.4%) | 121 (6.1%) |
| 20 to 24 Minutes | 158 (7.3%) | 105 (5.3%) |
| 25 to 29 Minutes | 137 (6.3%) | 170 (8.6%) |
| 30 to 34 Minutes | 286 (13.2%) | 181 (9.1%) |
| 35 to 39 Minutes | 49 (2.3%) | 17 (0.9%) |
| 40 to 44 Minutes | 65 (3.0%) | 17 (0.9%) |
| 45 to 59 Minutes | 41 (1.9%) | 18 (0.9%) |
| 60 to 89 Minutes | 50 (2.3%) | 57 (2.9%) |
| 90 or more Minutes | 11 (0.5%) | 71 (3.6%) |
Time of Departure to Work by Sex in Centralia
The most frequent times of departure to work in Centralia are 6:30 AM to 6:59 AM (333, 15.4%) for males and 7:30 AM to 7:59 AM (459, 23.2%) for females.
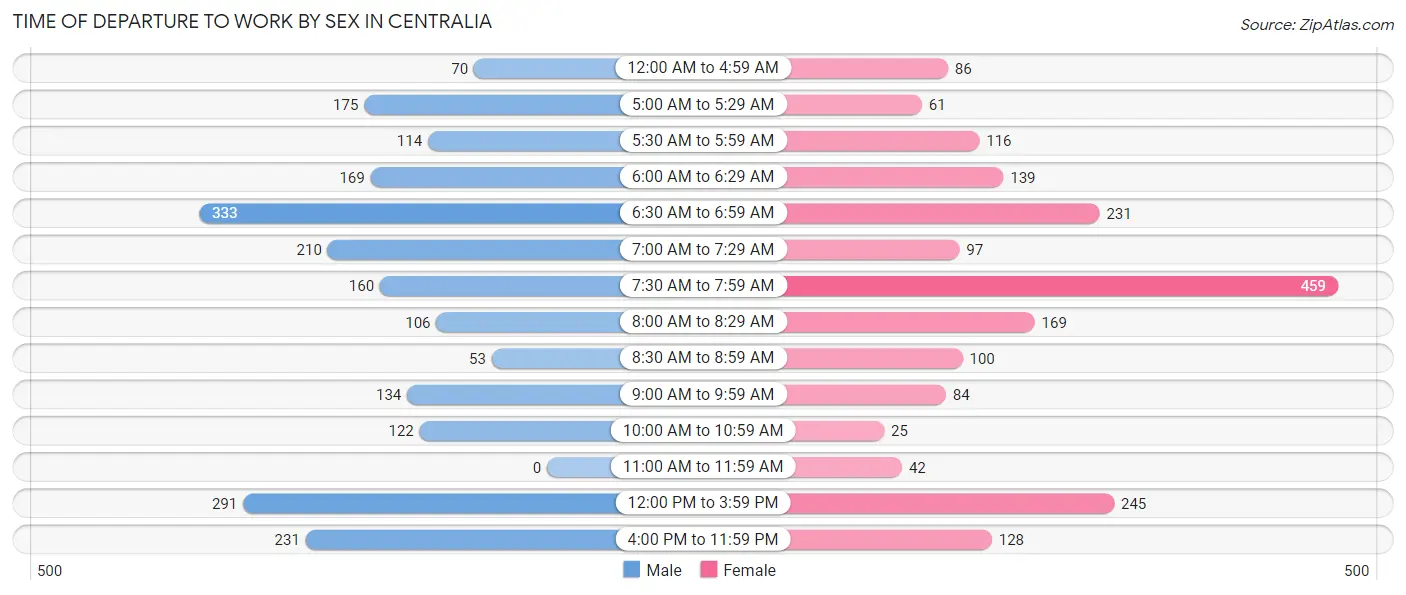
| Time of Departure | Male | Female |
| 12:00 AM to 4:59 AM | 70 (3.2%) | 86 (4.3%) |
| 5:00 AM to 5:29 AM | 175 (8.1%) | 61 (3.1%) |
| 5:30 AM to 5:59 AM | 114 (5.3%) | 116 (5.9%) |
| 6:00 AM to 6:29 AM | 169 (7.8%) | 139 (7.0%) |
| 6:30 AM to 6:59 AM | 333 (15.4%) | 231 (11.7%) |
| 7:00 AM to 7:29 AM | 210 (9.7%) | 97 (4.9%) |
| 7:30 AM to 7:59 AM | 160 (7.4%) | 459 (23.2%) |
| 8:00 AM to 8:29 AM | 106 (4.9%) | 169 (8.5%) |
| 8:30 AM to 8:59 AM | 53 (2.4%) | 100 (5.1%) |
| 9:00 AM to 9:59 AM | 134 (6.2%) | 84 (4.2%) |
| 10:00 AM to 10:59 AM | 122 (5.6%) | 25 (1.3%) |
| 11:00 AM to 11:59 AM | 0 (0.0%) | 42 (2.1%) |
| 12:00 PM to 3:59 PM | 291 (13.4%) | 245 (12.4%) |
| 4:00 PM to 11:59 PM | 231 (10.6%) | 128 (6.5%) |
| Total | 2,168 (100.0%) | 1,982 (100.0%) |
Housing Occupancy in Centralia
Occupancy by Ownership in Centralia
Of the total 5,127 dwellings in Centralia, owner-occupied units account for 3,338 (65.1%), while renter-occupied units make up 1,789 (34.9%).
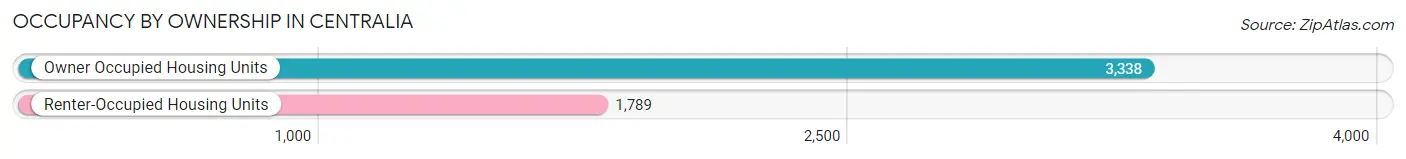
| Occupancy | # Housing Units | % Housing Units |
| Owner Occupied Housing Units | 3,338 | 65.1% |
| Renter-Occupied Housing Units | 1,789 | 34.9% |
| Total Occupied Housing Units | 5,127 | 100.0% |
Occupancy by Household Size in Centralia
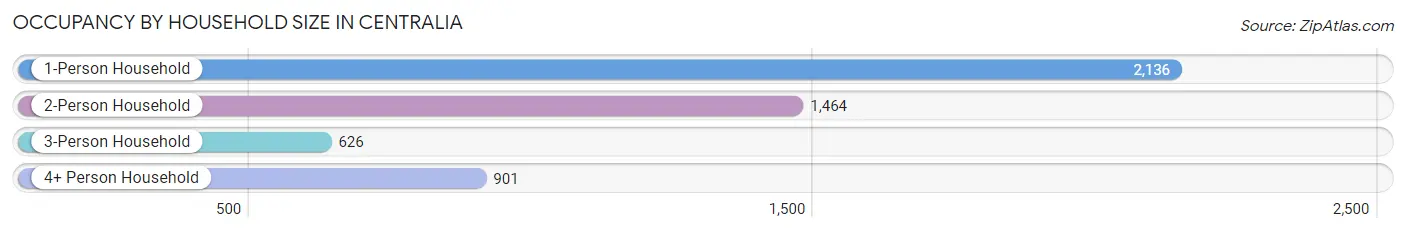
| Household Size | # Housing Units | % Housing Units |
| 1-Person Household | 2,136 | 41.7% |
| 2-Person Household | 1,464 | 28.5% |
| 3-Person Household | 626 | 12.2% |
| 4+ Person Household | 901 | 17.6% |
| Total Housing Units | 5,127 | 100.0% |
Occupancy by Ownership by Household Size in Centralia
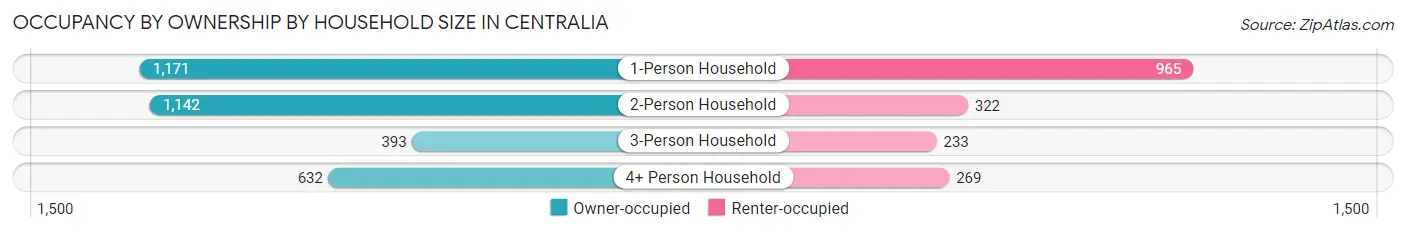
| Household Size | Owner-occupied | Renter-occupied |
| 1-Person Household | 1,171 (54.8%) | 965 (45.2%) |
| 2-Person Household | 1,142 (78.0%) | 322 (22.0%) |
| 3-Person Household | 393 (62.8%) | 233 (37.2%) |
| 4+ Person Household | 632 (70.1%) | 269 (29.9%) |
| Total Housing Units | 3,338 (65.1%) | 1,789 (34.9%) |
Occupancy by Educational Attainment in Centralia
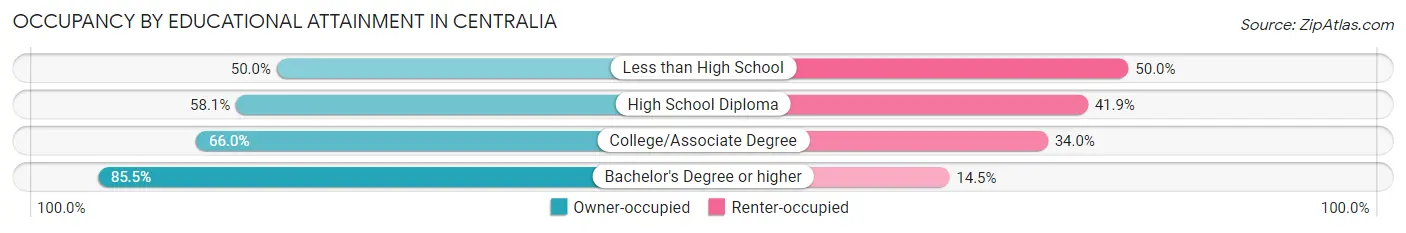
| Household Size | Owner-occupied | Renter-occupied |
| Less than High School | 270 (50.0%) | 270 (50.0%) |
| High School Diploma | 1,037 (58.1%) | 749 (41.9%) |
| College/Associate Degree | 1,230 (66.0%) | 634 (34.0%) |
| Bachelor's Degree or higher | 801 (85.5%) | 136 (14.5%) |
Occupancy by Age of Householder in Centralia
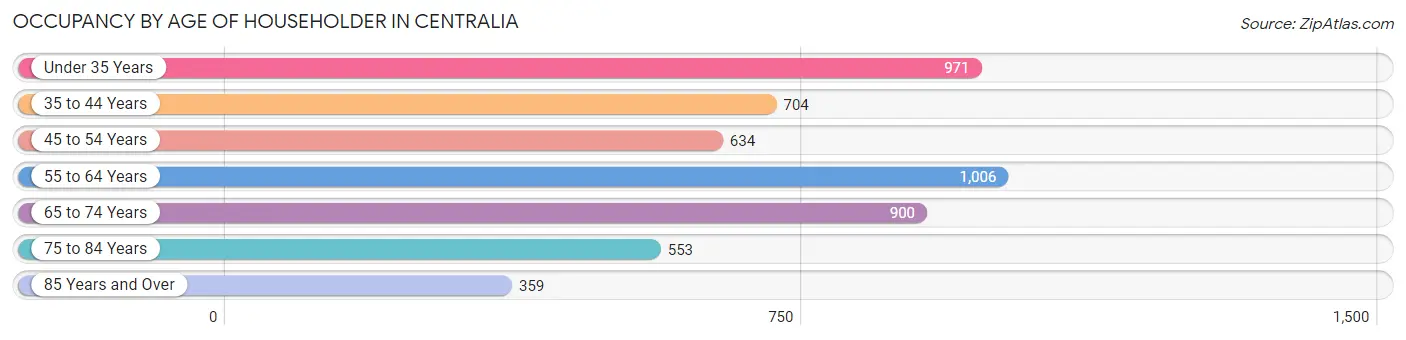
| Age Bracket | # Households | % Households |
| Under 35 Years | 971 | 18.9% |
| 35 to 44 Years | 704 | 13.7% |
| 45 to 54 Years | 634 | 12.4% |
| 55 to 64 Years | 1,006 | 19.6% |
| 65 to 74 Years | 900 | 17.5% |
| 75 to 84 Years | 553 | 10.8% |
| 85 Years and Over | 359 | 7.0% |
| Total | 5,127 | 100.0% |
Housing Finances in Centralia
Median Income by Occupancy in Centralia
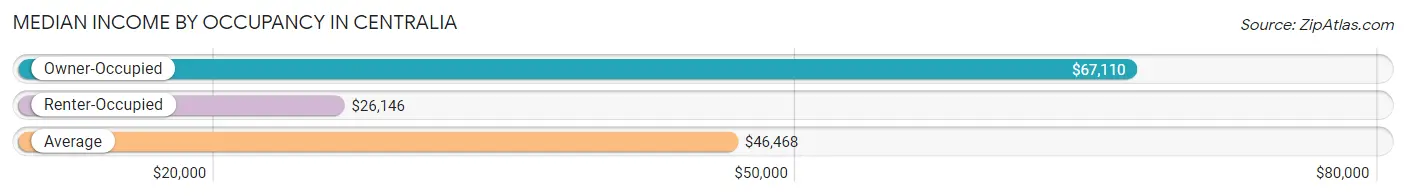
| Occupancy Type | # Households | Median Income |
| Owner-Occupied | 3,338 (65.1%) | $67,110 |
| Renter-Occupied | 1,789 (34.9%) | $26,146 |
| Average | 5,127 (100.0%) | $46,468 |
Occupancy by Householder Income Bracket in Centralia
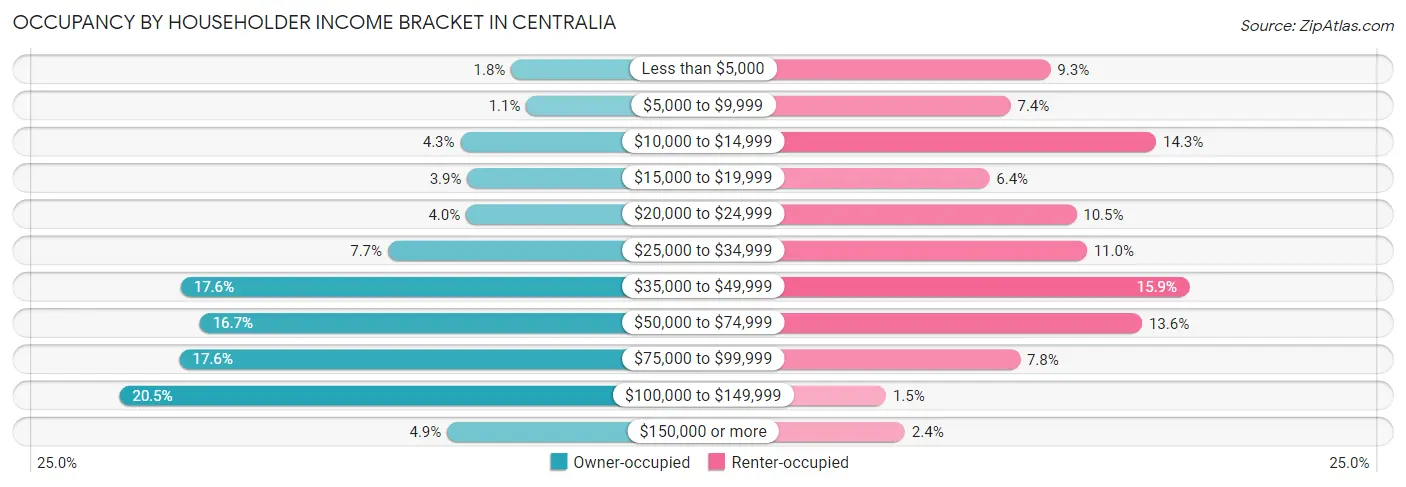
| Income Bracket | Owner-occupied | Renter-occupied |
| Less than $5,000 | 61 (1.8%) | 166 (9.3%) |
| $5,000 to $9,999 | 37 (1.1%) | 132 (7.4%) |
| $10,000 to $14,999 | 142 (4.3%) | 256 (14.3%) |
| $15,000 to $19,999 | 131 (3.9%) | 114 (6.4%) |
| $20,000 to $24,999 | 133 (4.0%) | 188 (10.5%) |
| $25,000 to $34,999 | 257 (7.7%) | 197 (11.0%) |
| $35,000 to $49,999 | 586 (17.6%) | 284 (15.9%) |
| $50,000 to $74,999 | 556 (16.7%) | 244 (13.6%) |
| $75,000 to $99,999 | 588 (17.6%) | 140 (7.8%) |
| $100,000 to $149,999 | 684 (20.5%) | 26 (1.5%) |
| $150,000 or more | 163 (4.9%) | 42 (2.4%) |
| Total | 3,338 (100.0%) | 1,789 (100.0%) |
Monthly Housing Cost Tiers in Centralia
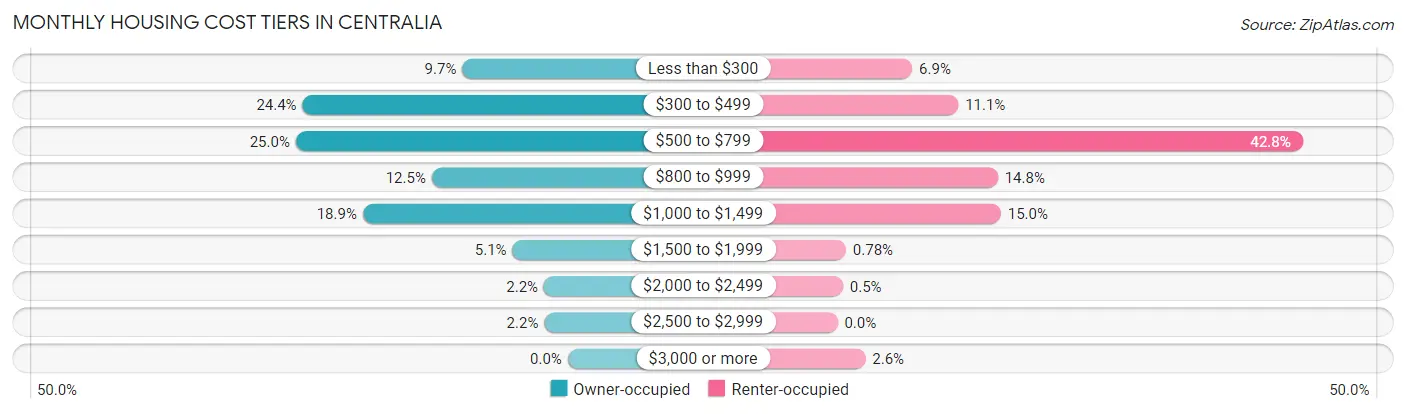
| Monthly Cost | Owner-occupied | Renter-occupied |
| Less than $300 | 324 (9.7%) | 123 (6.9%) |
| $300 to $499 | 815 (24.4%) | 199 (11.1%) |
| $500 to $799 | 836 (25.0%) | 766 (42.8%) |
| $800 to $999 | 418 (12.5%) | 264 (14.8%) |
| $1,000 to $1,499 | 630 (18.9%) | 269 (15.0%) |
| $1,500 to $1,999 | 170 (5.1%) | 14 (0.8%) |
| $2,000 to $2,499 | 73 (2.2%) | 9 (0.5%) |
| $2,500 to $2,999 | 72 (2.2%) | 0 (0.0%) |
| $3,000 or more | 0 (0.0%) | 46 (2.6%) |
| Total | 3,338 (100.0%) | 1,789 (100.0%) |
Physical Housing Characteristics in Centralia
Housing Structures in Centralia
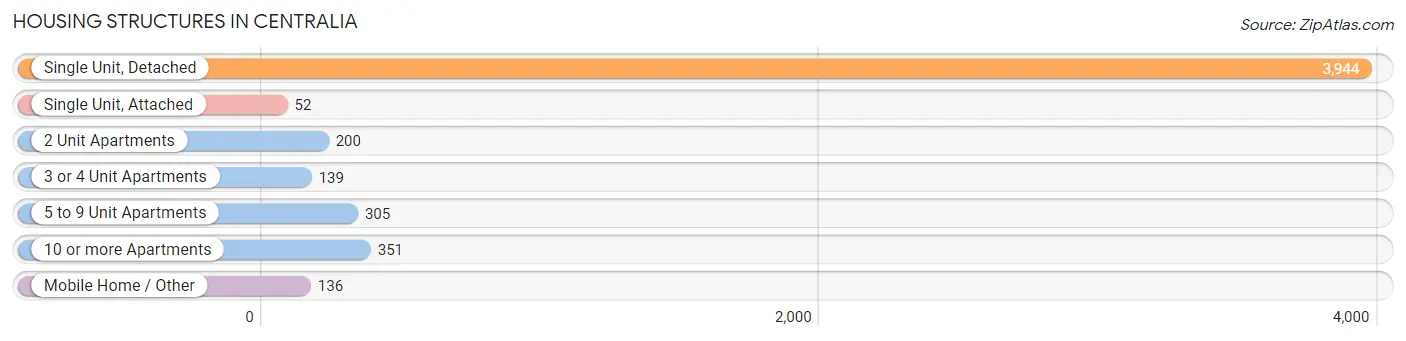
| Structure Type | # Housing Units | % Housing Units |
| Single Unit, Detached | 3,944 | 76.9% |
| Single Unit, Attached | 52 | 1.0% |
| 2 Unit Apartments | 200 | 3.9% |
| 3 or 4 Unit Apartments | 139 | 2.7% |
| 5 to 9 Unit Apartments | 305 | 5.9% |
| 10 or more Apartments | 351 | 6.9% |
| Mobile Home / Other | 136 | 2.6% |
| Total | 5,127 | 100.0% |
Housing Structures by Occupancy in Centralia
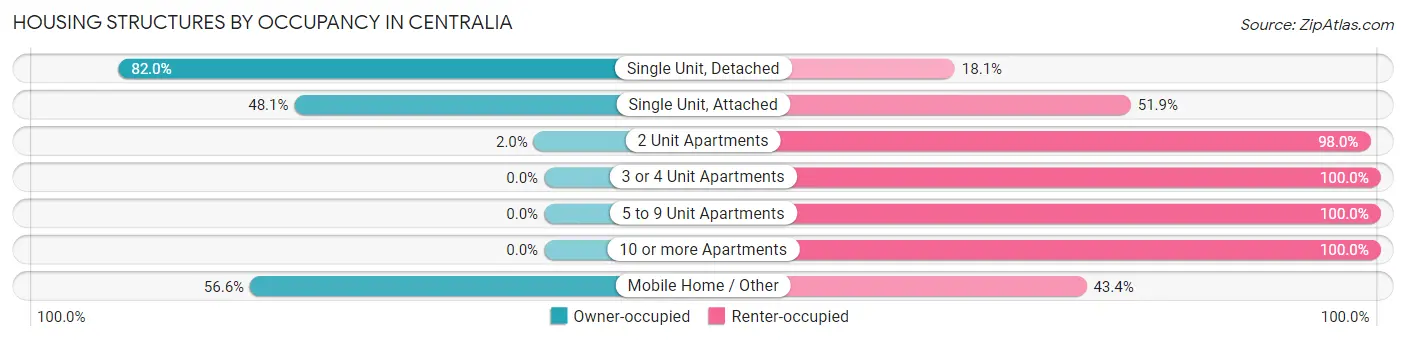
| Structure Type | Owner-occupied | Renter-occupied |
| Single Unit, Detached | 3,232 (82.0%) | 712 (18.0%) |
| Single Unit, Attached | 25 (48.1%) | 27 (51.9%) |
| 2 Unit Apartments | 4 (2.0%) | 196 (98.0%) |
| 3 or 4 Unit Apartments | 0 (0.0%) | 139 (100.0%) |
| 5 to 9 Unit Apartments | 0 (0.0%) | 305 (100.0%) |
| 10 or more Apartments | 0 (0.0%) | 351 (100.0%) |
| Mobile Home / Other | 77 (56.6%) | 59 (43.4%) |
| Total | 3,338 (65.1%) | 1,789 (34.9%) |
Housing Structures by Number of Rooms in Centralia
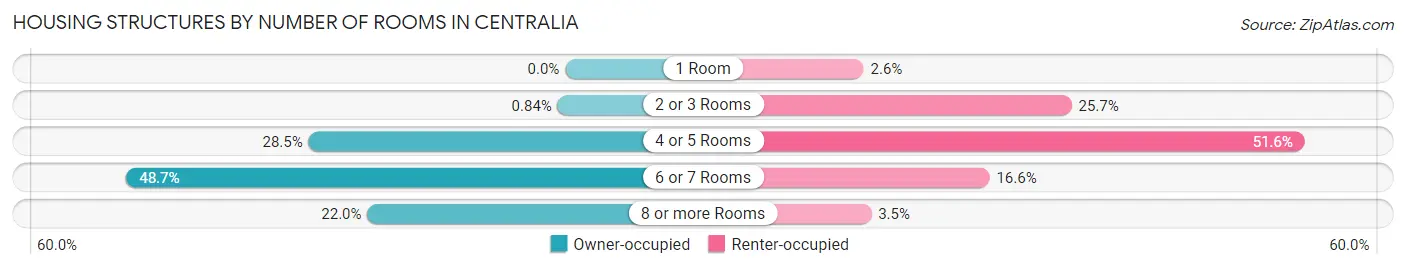
| Number of Rooms | Owner-occupied | Renter-occupied |
| 1 Room | 0 (0.0%) | 47 (2.6%) |
| 2 or 3 Rooms | 28 (0.8%) | 460 (25.7%) |
| 4 or 5 Rooms | 951 (28.5%) | 923 (51.6%) |
| 6 or 7 Rooms | 1,626 (48.7%) | 297 (16.6%) |
| 8 or more Rooms | 733 (22.0%) | 62 (3.5%) |
| Total | 3,338 (100.0%) | 1,789 (100.0%) |
Housing Structure by Heating Type in Centralia
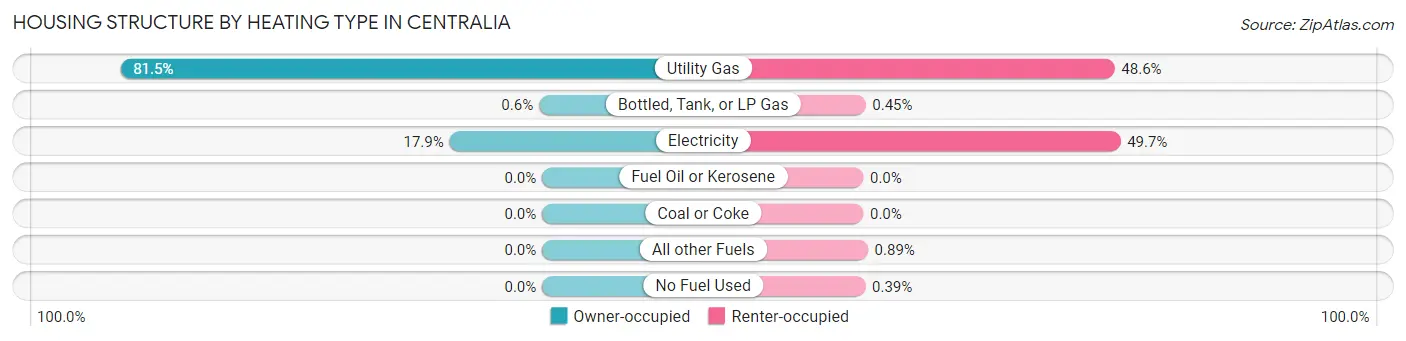
| Heating Type | Owner-occupied | Renter-occupied |
| Utility Gas | 2,721 (81.5%) | 869 (48.6%) |
| Bottled, Tank, or LP Gas | 20 (0.6%) | 8 (0.4%) |
| Electricity | 597 (17.9%) | 889 (49.7%) |
| Fuel Oil or Kerosene | 0 (0.0%) | 0 (0.0%) |
| Coal or Coke | 0 (0.0%) | 0 (0.0%) |
| All other Fuels | 0 (0.0%) | 16 (0.9%) |
| No Fuel Used | 0 (0.0%) | 7 (0.4%) |
| Total | 3,338 (100.0%) | 1,789 (100.0%) |
Household Vehicle Usage in Centralia
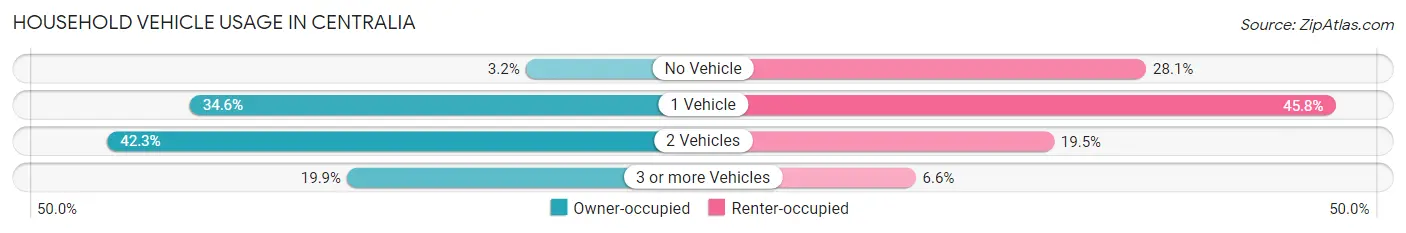
| Vehicles per Household | Owner-occupied | Renter-occupied |
| No Vehicle | 108 (3.2%) | 503 (28.1%) |
| 1 Vehicle | 1,154 (34.6%) | 819 (45.8%) |
| 2 Vehicles | 1,411 (42.3%) | 349 (19.5%) |
| 3 or more Vehicles | 665 (19.9%) | 118 (6.6%) |
| Total | 3,338 (100.0%) | 1,789 (100.0%) |
Real Estate & Mortgages in Centralia
Real Estate and Mortgage Overview in Centralia
| Characteristic | Without Mortgage | With Mortgage |
| Housing Units | 1,782 | 1,556 |
| Median Property Value | $70,300 | $97,900 |
| Median Household Income | $49,539 | $73 |
| Monthly Housing Costs | $459 | $0 |
| Real Estate Taxes | $1,294 | $51 |
Property Value by Mortgage Status in Centralia
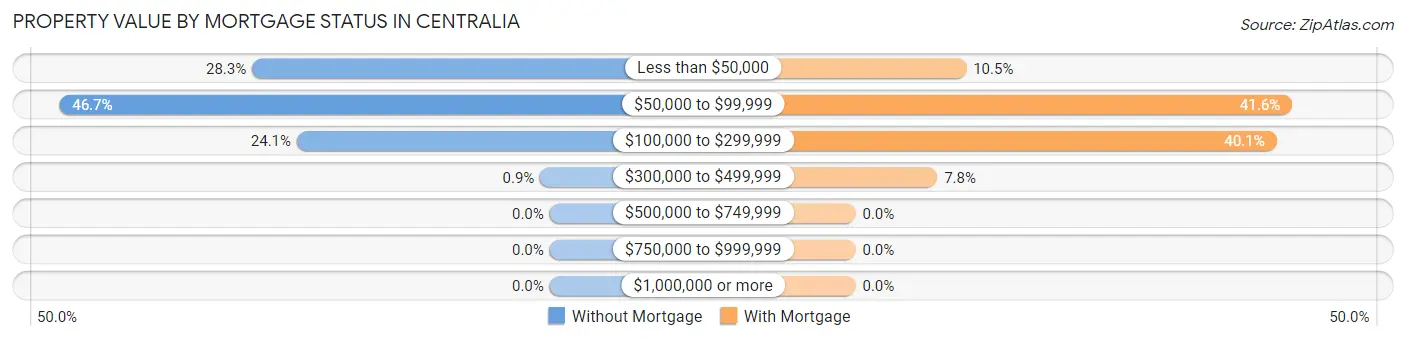
| Property Value | Without Mortgage | With Mortgage |
| Less than $50,000 | 505 (28.3%) | 164 (10.5%) |
| $50,000 to $99,999 | 832 (46.7%) | 647 (41.6%) |
| $100,000 to $299,999 | 429 (24.1%) | 624 (40.1%) |
| $300,000 to $499,999 | 16 (0.9%) | 121 (7.8%) |
| $500,000 to $749,999 | 0 (0.0%) | 0 (0.0%) |
| $750,000 to $999,999 | 0 (0.0%) | 0 (0.0%) |
| $1,000,000 or more | 0 (0.0%) | 0 (0.0%) |
| Total | 1,782 (100.0%) | 1,556 (100.0%) |
Household Income by Mortgage Status in Centralia
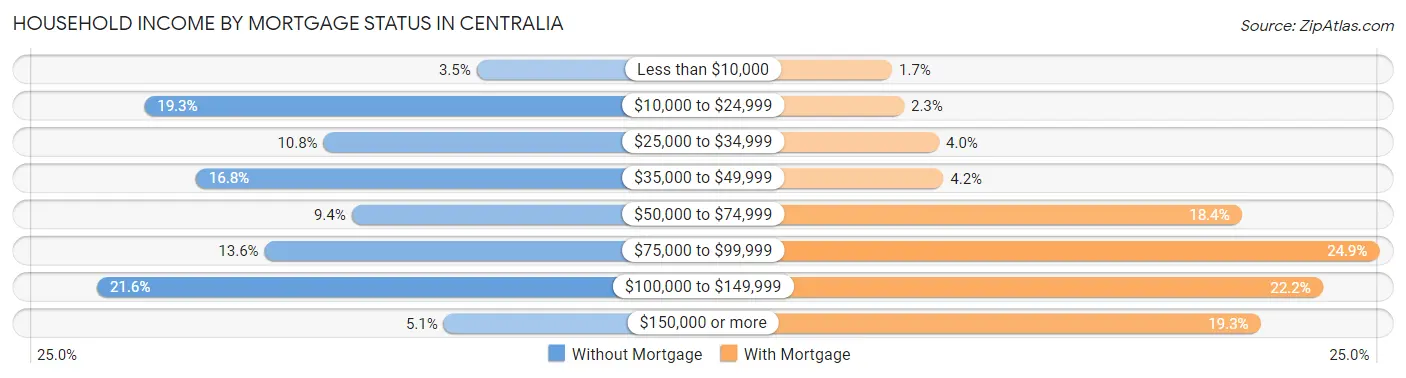
| Household Income | Without Mortgage | With Mortgage |
| Less than $10,000 | 62 (3.5%) | 27 (1.7%) |
| $10,000 to $24,999 | 344 (19.3%) | 36 (2.3%) |
| $25,000 to $34,999 | 192 (10.8%) | 62 (4.0%) |
| $35,000 to $49,999 | 300 (16.8%) | 65 (4.2%) |
| $50,000 to $74,999 | 168 (9.4%) | 286 (18.4%) |
| $75,000 to $99,999 | 242 (13.6%) | 388 (24.9%) |
| $100,000 to $149,999 | 384 (21.5%) | 346 (22.2%) |
| $150,000 or more | 90 (5.1%) | 300 (19.3%) |
| Total | 1,782 (100.0%) | 1,556 (100.0%) |
Property Value to Household Income Ratio in Centralia
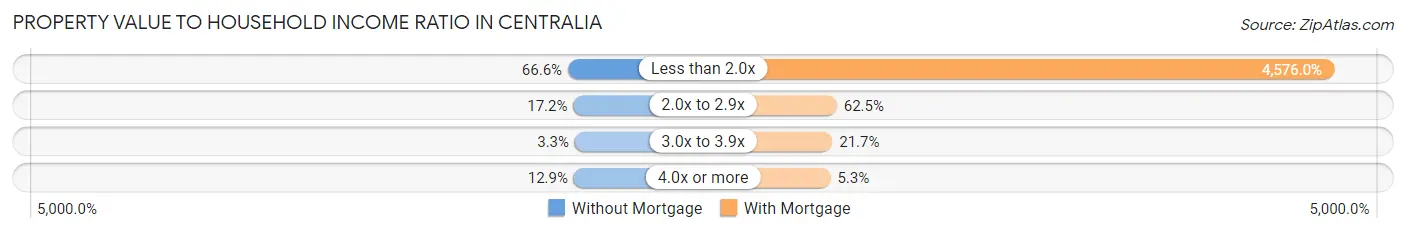
| Value-to-Income Ratio | Without Mortgage | With Mortgage |
| Less than 2.0x | 1,187 (66.6%) | 71,203 (4,576.0%) |
| 2.0x to 2.9x | 307 (17.2%) | 973 (62.5%) |
| 3.0x to 3.9x | 58 (3.3%) | 338 (21.7%) |
| 4.0x or more | 230 (12.9%) | 82 (5.3%) |
| Total | 1,782 (100.0%) | 1,556 (100.0%) |
Real Estate Taxes by Mortgage Status in Centralia
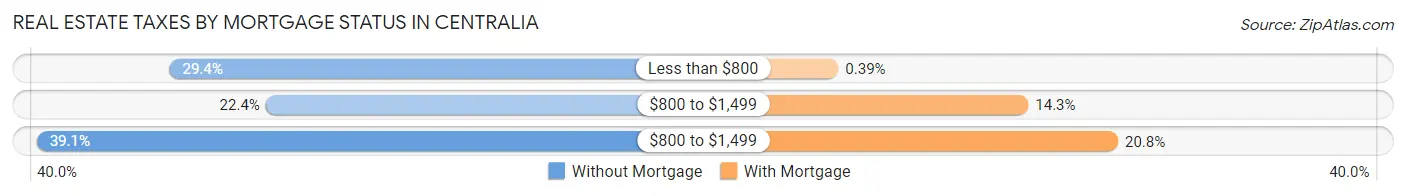
| Property Taxes | Without Mortgage | With Mortgage |
| Less than $800 | 524 (29.4%) | 6 (0.4%) |
| $800 to $1,499 | 399 (22.4%) | 222 (14.3%) |
| $800 to $1,499 | 697 (39.1%) | 324 (20.8%) |
| Total | 1,782 (100.0%) | 1,556 (100.0%) |
Health & Disability in Centralia
Health Insurance Coverage by Age in Centralia
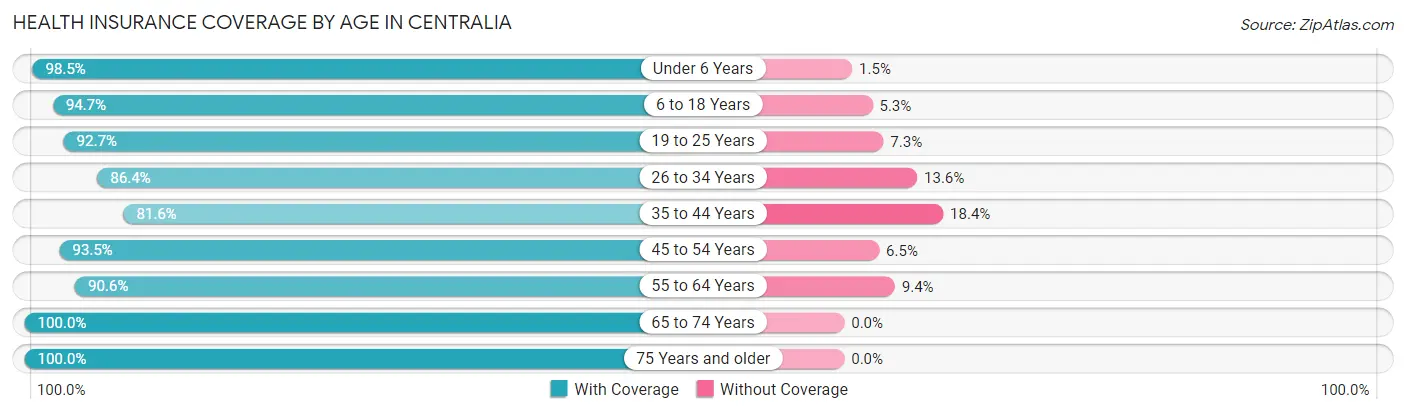
| Age Bracket | With Coverage | Without Coverage |
| Under 6 Years | 937 (98.5%) | 14 (1.5%) |
| 6 to 18 Years | 1,959 (94.7%) | 109 (5.3%) |
| 19 to 25 Years | 890 (92.7%) | 70 (7.3%) |
| 26 to 34 Years | 1,088 (86.4%) | 171 (13.6%) |
| 35 to 44 Years | 1,150 (81.6%) | 260 (18.4%) |
| 45 to 54 Years | 993 (93.5%) | 69 (6.5%) |
| 55 to 64 Years | 1,500 (90.6%) | 156 (9.4%) |
| 65 to 74 Years | 1,254 (100.0%) | 0 (0.0%) |
| 75 Years and older | 1,246 (100.0%) | 0 (0.0%) |
| Total | 11,017 (92.8%) | 849 (7.1%) |
Health Insurance Coverage by Citizenship Status in Centralia
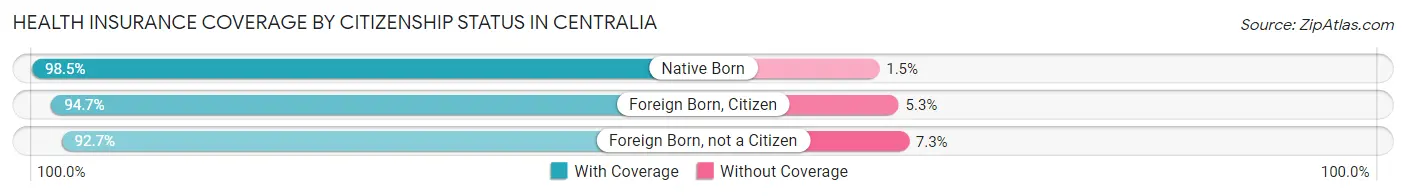
| Citizenship Status | With Coverage | Without Coverage |
| Native Born | 937 (98.5%) | 14 (1.5%) |
| Foreign Born, Citizen | 1,959 (94.7%) | 109 (5.3%) |
| Foreign Born, not a Citizen | 890 (92.7%) | 70 (7.3%) |
Health Insurance Coverage by Household Income in Centralia
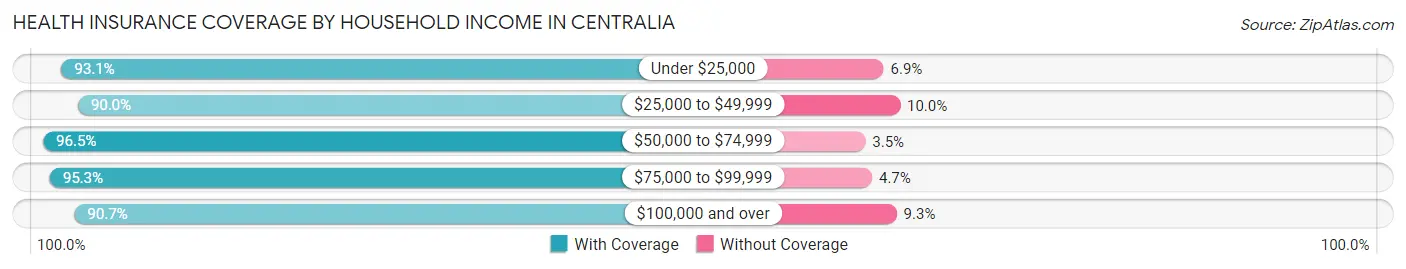
| Household Income | With Coverage | Without Coverage |
| Under $25,000 | 2,388 (93.1%) | 177 (6.9%) |
| $25,000 to $49,999 | 2,201 (90.0%) | 244 (10.0%) |
| $50,000 to $74,999 | 1,916 (96.5%) | 69 (3.5%) |
| $75,000 to $99,999 | 2,094 (95.3%) | 104 (4.7%) |
| $100,000 and over | 2,243 (90.7%) | 231 (9.3%) |
Public vs Private Health Insurance Coverage by Age in Centralia
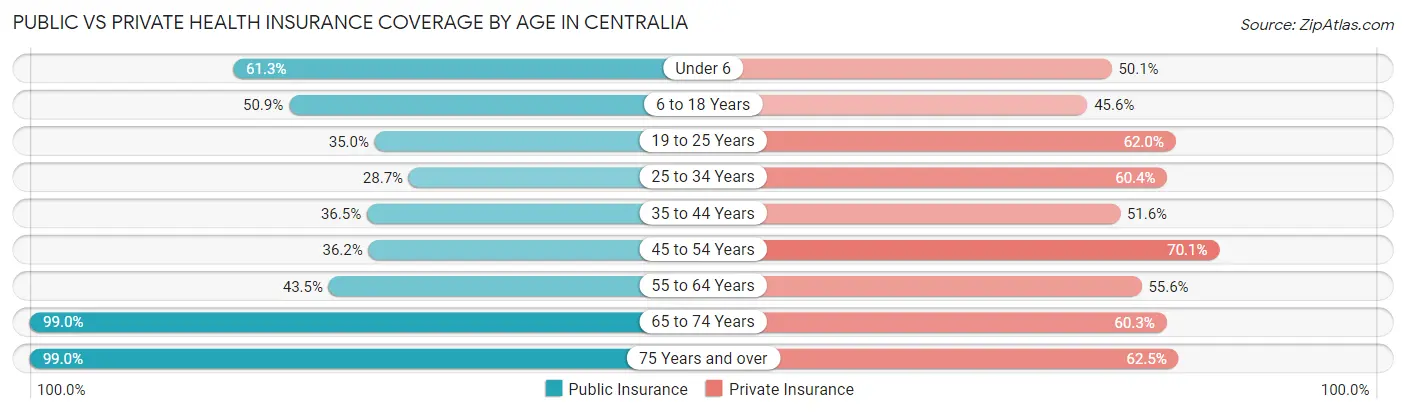
| Age Bracket | Public Insurance | Private Insurance |
| Under 6 | 583 (61.3%) | 476 (50.0%) |
| 6 to 18 Years | 1,053 (50.9%) | 942 (45.6%) |
| 19 to 25 Years | 336 (35.0%) | 595 (62.0%) |
| 25 to 34 Years | 361 (28.7%) | 761 (60.4%) |
| 35 to 44 Years | 514 (36.4%) | 728 (51.6%) |
| 45 to 54 Years | 384 (36.2%) | 744 (70.1%) |
| 55 to 64 Years | 721 (43.5%) | 921 (55.6%) |
| 65 to 74 Years | 1,241 (99.0%) | 756 (60.3%) |
| 75 Years and over | 1,234 (99.0%) | 779 (62.5%) |
| Total | 6,427 (54.2%) | 6,702 (56.5%) |
Disability Status by Sex by Age in Centralia
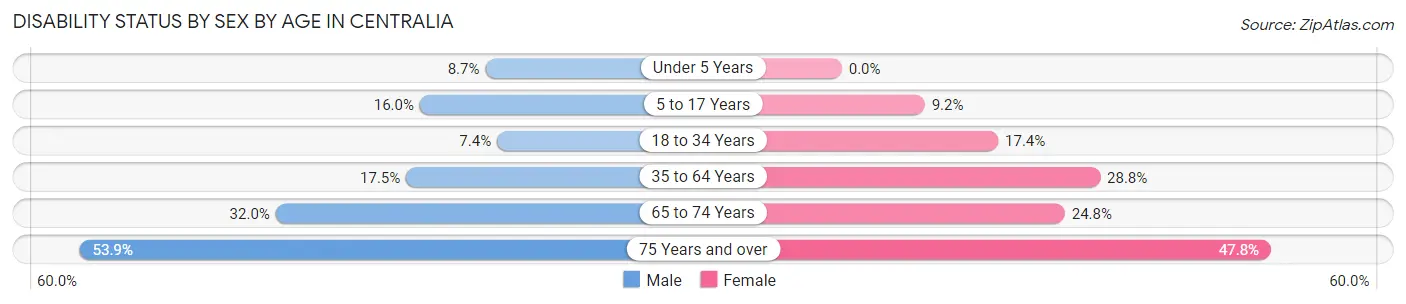
| Age Bracket | Male | Female |
| Under 5 Years | 39 (8.7%) | 0 (0.0%) |
| 5 to 17 Years | 176 (16.0%) | 89 (9.2%) |
| 18 to 34 Years | 88 (7.4%) | 208 (17.4%) |
| 35 to 64 Years | 340 (17.5%) | 629 (28.8%) |
| 65 to 74 Years | 198 (32.0%) | 158 (24.8%) |
| 75 Years and over | 306 (53.9%) | 324 (47.8%) |
Disability Class by Sex by Age in Centralia
Disability Class: Hearing Difficulty
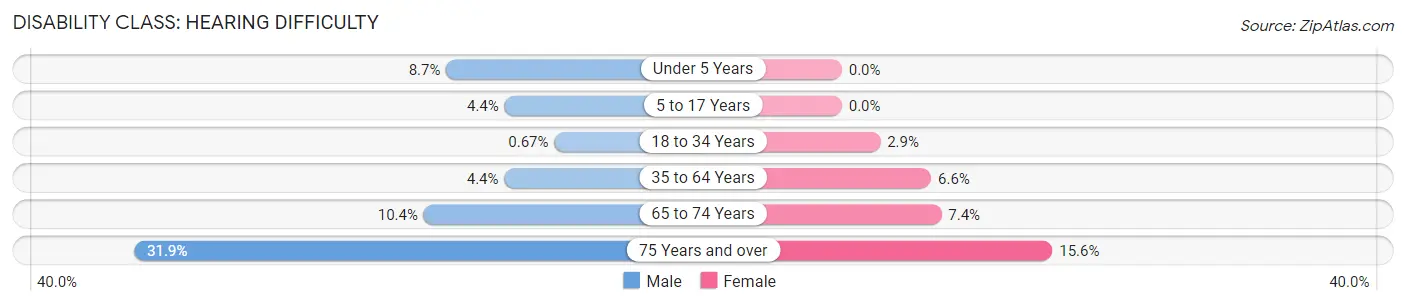
| Age Bracket | Male | Female |
| Under 5 Years | 39 (8.7%) | 0 (0.0%) |
| 5 to 17 Years | 48 (4.4%) | 0 (0.0%) |
| 18 to 34 Years | 8 (0.7%) | 34 (2.9%) |
| 35 to 64 Years | 85 (4.4%) | 145 (6.6%) |
| 65 to 74 Years | 64 (10.4%) | 47 (7.4%) |
| 75 Years and over | 181 (31.9%) | 106 (15.6%) |
Disability Class: Vision Difficulty
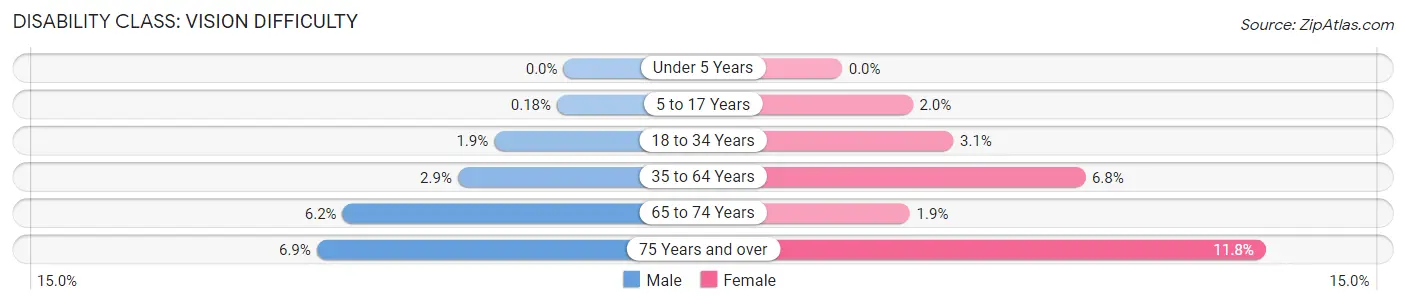
| Age Bracket | Male | Female |
| Under 5 Years | 0 (0.0%) | 0 (0.0%) |
| 5 to 17 Years | 2 (0.2%) | 19 (2.0%) |
| 18 to 34 Years | 23 (1.9%) | 37 (3.1%) |
| 35 to 64 Years | 57 (2.9%) | 148 (6.8%) |
| 65 to 74 Years | 38 (6.1%) | 12 (1.9%) |
| 75 Years and over | 39 (6.9%) | 80 (11.8%) |
Disability Class: Cognitive Difficulty
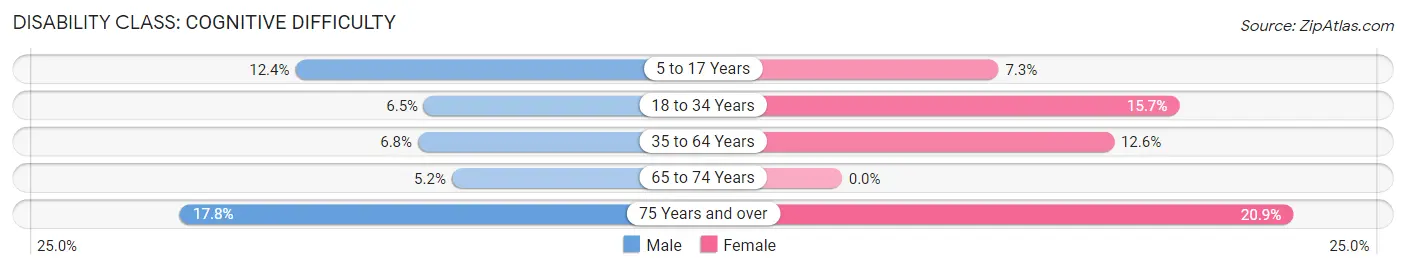
| Age Bracket | Male | Female |
| 5 to 17 Years | 137 (12.4%) | 70 (7.3%) |
| 18 to 34 Years | 77 (6.5%) | 187 (15.7%) |
| 35 to 64 Years | 131 (6.8%) | 276 (12.6%) |
| 65 to 74 Years | 32 (5.2%) | 0 (0.0%) |
| 75 Years and over | 101 (17.8%) | 142 (20.9%) |
Disability Class: Ambulatory Difficulty
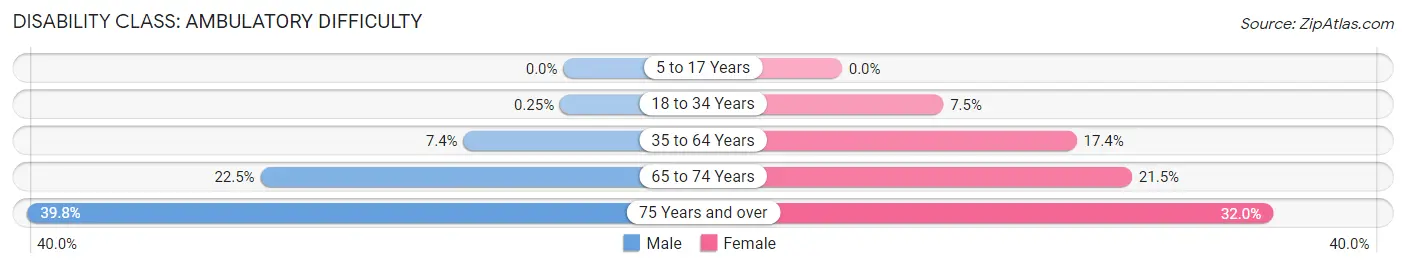
| Age Bracket | Male | Female |
| 5 to 17 Years | 0 (0.0%) | 0 (0.0%) |
| 18 to 34 Years | 3 (0.3%) | 90 (7.5%) |
| 35 to 64 Years | 144 (7.4%) | 381 (17.4%) |
| 65 to 74 Years | 139 (22.5%) | 137 (21.5%) |
| 75 Years and over | 226 (39.8%) | 217 (32.0%) |
Disability Class: Self-Care Difficulty
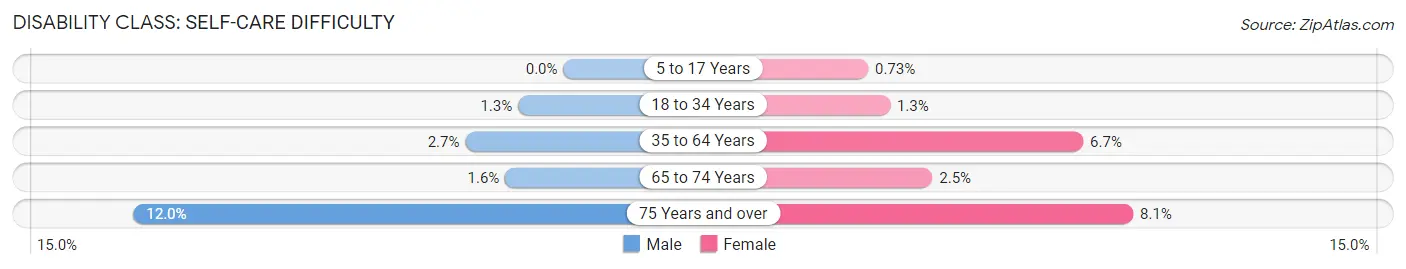
| Age Bracket | Male | Female |
| 5 to 17 Years | 0 (0.0%) | 7 (0.7%) |
| 18 to 34 Years | 15 (1.3%) | 16 (1.3%) |
| 35 to 64 Years | 53 (2.7%) | 147 (6.7%) |
| 65 to 74 Years | 10 (1.6%) | 16 (2.5%) |
| 75 Years and over | 68 (12.0%) | 55 (8.1%) |
Technology Access in Centralia
Computing Device Access in Centralia
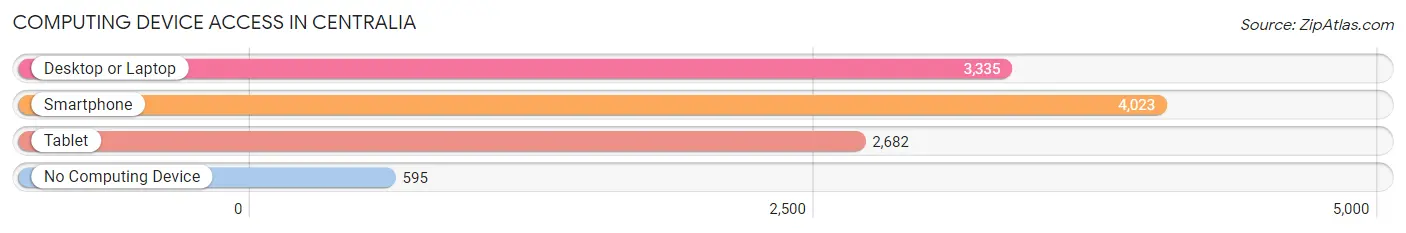
| Device Type | # Households | % Households |
| Desktop or Laptop | 3,335 | 65.0% |
| Smartphone | 4,023 | 78.5% |
| Tablet | 2,682 | 52.3% |
| No Computing Device | 595 | 11.6% |
| Total | 5,127 | 100.0% |
Internet Access in Centralia
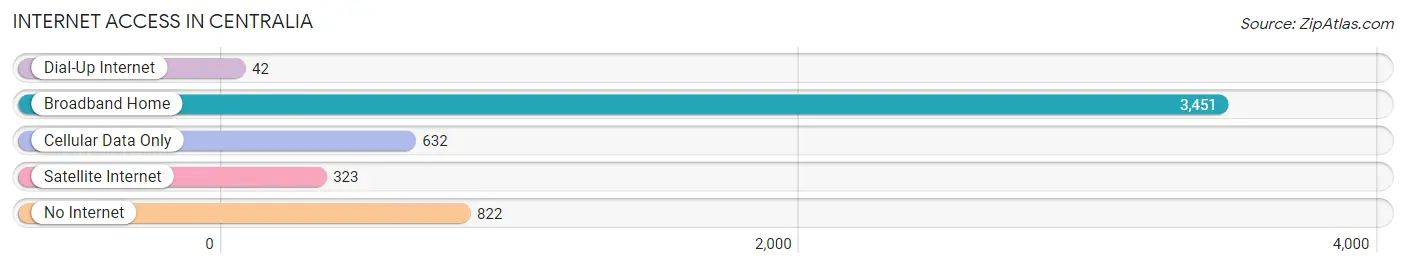
| Internet Type | # Households | % Households |
| Dial-Up Internet | 42 | 0.8% |
| Broadband Home | 3,451 | 67.3% |
| Cellular Data Only | 632 | 12.3% |
| Satellite Internet | 323 | 6.3% |
| No Internet | 822 | 16.0% |
| Total | 5,127 | 100.0% |
Centralia Summary
Centralia, Illinois is a small city located in Marion County, Illinois, United States. It is located about 50 miles east of St. Louis, Missouri, and is part of the Centralia-Mount Vernon-Salem Metropolitan Statistical Area. The city has a population of about 13,000 people, and is the county seat of Marion County.
History
Centralia was founded in 1853 by William McHenry, a settler from Kentucky. The city was named after the nearby Centralia Coal Mine, which was the first coal mine in the area. The city quickly grew, and by 1860, it had a population of over 1,000 people.
In 1864, the Centralia Massacre occurred, in which a group of Confederate guerrillas attacked the town and killed over 150 people. This event is still remembered today, and is commemorated with a memorial in the city.
In the late 19th century, Centralia became a major coal mining center, and the city's population grew to over 10,000 people. The city was also home to several large coal companies, including the Centralia Coal Company, the Centralia Coal and Iron Company, and the Centralia Coal and Coke Company.
Geography
Centralia is located in the southern part of Marion County, Illinois. It is situated on the banks of the Kaskaskia River, and is surrounded by rolling hills and farmland. The city is located about 50 miles east of St. Louis, Missouri, and is part of the Centralia-Mount Vernon-Salem Metropolitan Statistical Area.
The city has a total area of 4.2 square miles, of which 4.1 square miles is land and 0.1 square miles is water. The city is located at an elevation of 645 feet above sea level.
Economy
Centralia's economy is largely based on the coal mining industry. The city is home to several large coal companies, including the Centralia Coal Company, the Centralia Coal and Iron Company, and the Centralia Coal and Coke Company.
The city is also home to several manufacturing companies, including Centralia Manufacturing, which produces industrial equipment, and Centralia Tool and Die, which produces automotive parts.
Demographics
As of the 2010 census, Centralia had a population of 13,032 people. The racial makeup of the city was 92.3% White, 4.2% African American, 0.3% Native American, 0.7% Asian, 0.1% Pacific Islander, 0.7% from other races, and 1.9% from two or more races. Hispanic or Latino of any race were 2.2% of the population.
The median household income in Centralia was $35,945, and the median family income was $45,945. The per capita income for the city was $19,945. About 16.2% of the population was below the poverty line.
Common Questions
What is Per Capita Income in Centralia?
Per Capita income in Centralia is $27,687.
What is the Median Family Income in Centralia?
Median Family Income in Centralia is $76,739.
What is the Median Household income in Centralia?
Median Household Income in Centralia is $46,468.
What is Income or Wage Gap in Centralia?
Income or Wage Gap in Centralia is 33.4%.
Women in Centralia earn 66.6 cents for every dollar earned by a man.
What is Inequality or Gini Index in Centralia?
Inequality or Gini Index in Centralia is 0.45.
What is the Total Population of Centralia?
Total Population of Centralia is 12,096.
What is the Total Male Population of Centralia?
Total Male Population of Centralia is 5,929.
What is the Total Female Population of Centralia?
Total Female Population of Centralia is 6,167.
What is the Ratio of Males per 100 Females in Centralia?
There are 96.14 Males per 100 Females in Centralia.
What is the Ratio of Females per 100 Males in Centralia?
There are 104.01 Females per 100 Males in Centralia.
What is the Median Population Age in Centralia?
Median Population Age in Centralia is 40.7 Years.
What is the Average Family Size in Centralia
Average Family Size in Centralia is 3.1 People.
What is the Average Household Size in Centralia
Average Household Size in Centralia is 2.3 People.
How Large is the Labor Force in Centralia?
There are 5,232 People in the Labor Forcein in Centralia.
What is the Percentage of People in the Labor Force in Centralia?
55.0% of People are in the Labor Force in Centralia.
What is the Unemployment Rate in Centralia?
Unemployment Rate in Centralia is 12.4%.