Cities with the Highest Percentage of Immigrants from Hong Kong in Illinois
RELATED REPORTS & OPTIONS
Hong Kong
Illinois
Compare Cities
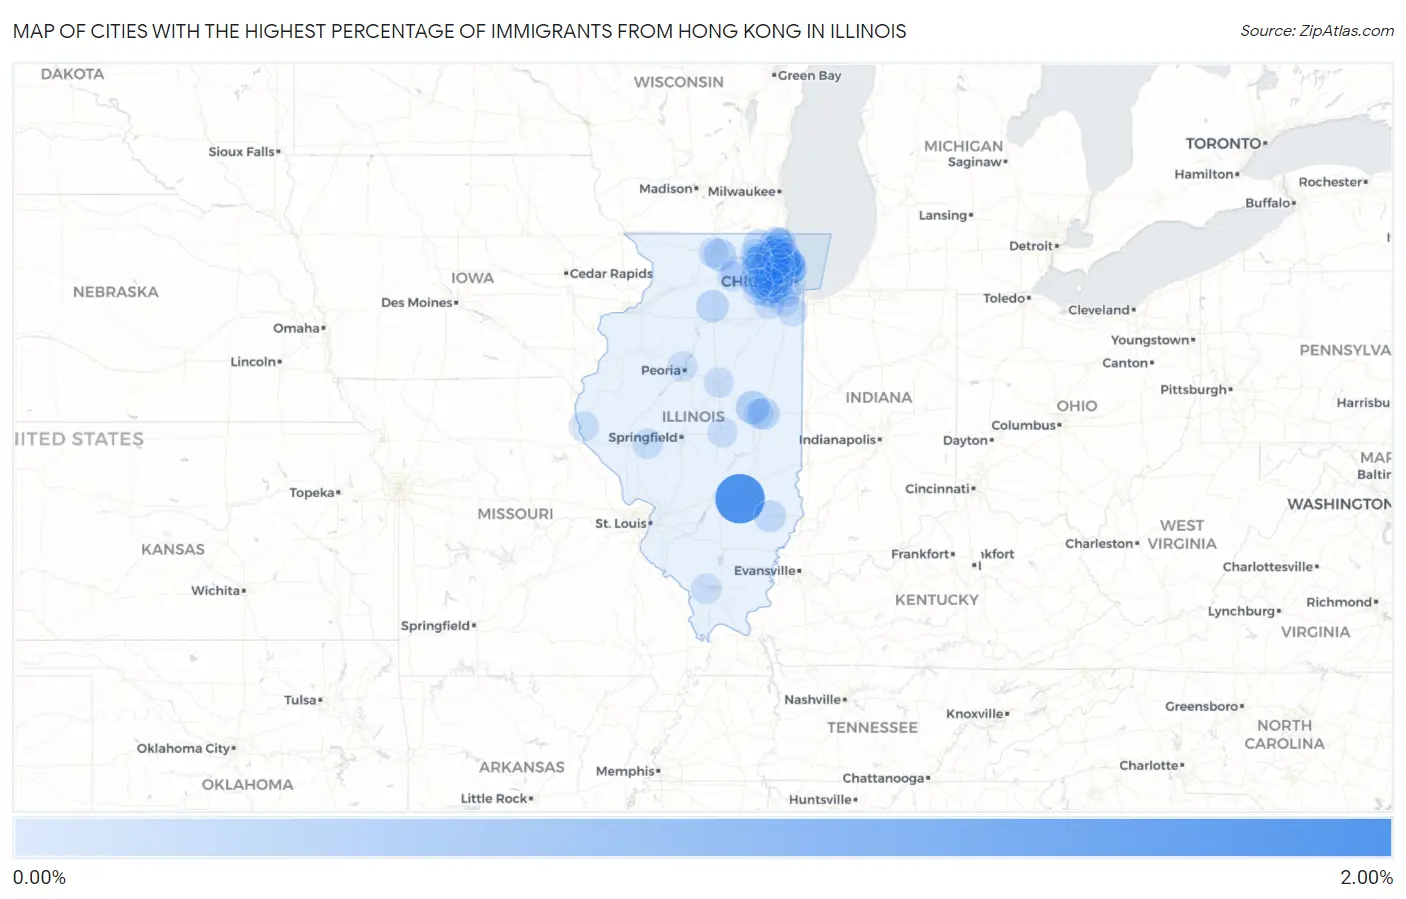
Map of Cities with the Highest Percentage of Immigrants from Hong Kong in Illinois
0.00%
2.00%
Cities with the Highest Percentage of Immigrants from Hong Kong in Illinois
| City | Hong Kong | vs State | vs National | |
| 1. | Mason | 1.89% | 0.039%(+1.85)#1 | 0.072%(+1.81)#42 |
| 2. | Barrington Hills | 0.57% | 0.039%(+0.526)#2 | 0.072%(+0.493)#257 |
| 3. | Northbrook | 0.41% | 0.039%(+0.367)#3 | 0.072%(+0.334)#382 |
| 4. | Mahomet | 0.31% | 0.039%(+0.275)#4 | 0.072%(+0.242)#485 |
| 5. | Long Grove | 0.31% | 0.039%(+0.275)#5 | 0.072%(+0.242)#486 |
| 6. | Gages Lake | 0.29% | 0.039%(+0.254)#6 | 0.072%(+0.221)#511 |
| 7. | Lisle | 0.27% | 0.039%(+0.233)#7 | 0.072%(+0.200)#539 |
| 8. | Glenview | 0.25% | 0.039%(+0.211)#8 | 0.072%(+0.178)#582 |
| 9. | Cherry Valley | 0.24% | 0.039%(+0.198)#9 | 0.072%(+0.165)#620 |
| 10. | Mendota | 0.23% | 0.039%(+0.191)#10 | 0.072%(+0.158)#636 |
| 11. | Hawthorn Woods | 0.21% | 0.039%(+0.169)#11 | 0.072%(+0.136)#696 |
| 12. | Roselle | 0.20% | 0.039%(+0.162)#12 | 0.072%(+0.129)#707 |
| 13. | Libertyville | 0.19% | 0.039%(+0.155)#13 | 0.072%(+0.122)#725 |
| 14. | Urbana | 0.18% | 0.039%(+0.141)#14 | 0.072%(+0.108)#761 |
| 15. | Mount Prospect | 0.17% | 0.039%(+0.128)#15 | 0.072%(+0.095)#806 |
| 16. | Olney | 0.17% | 0.039%(+0.127)#16 | 0.072%(+0.094)#807 |
| 17. | Skokie | 0.15% | 0.039%(+0.113)#17 | 0.072%(+0.080)#868 |
| 18. | Bartlett | 0.15% | 0.039%(+0.110)#18 | 0.072%(+0.077)#883 |
| 19. | Schaumburg | 0.14% | 0.039%(+0.100)#19 | 0.072%(+0.067)#920 |
| 20. | Westmont | 0.13% | 0.039%(+0.093)#20 | 0.072%(+0.060)#953 |
| 21. | Inverness | 0.13% | 0.039%(+0.090)#21 | 0.072%(+0.057)#966 |
| 22. | Mchenry | 0.13% | 0.039%(+0.088)#22 | 0.072%(+0.055)#978 |
| 23. | Northfield | 0.12% | 0.039%(+0.083)#23 | 0.072%(+0.050)#997 |
| 24. | Geneva | 0.12% | 0.039%(+0.082)#24 | 0.072%(+0.049)#1,003 |
| 25. | Woodridge | 0.10% | 0.039%(+0.064)#25 | 0.072%(+0.031)#1,104 |
| 26. | Naperville | 0.100% | 0.039%(+0.061)#26 | 0.072%(+0.028)#1,120 |
| 27. | Chicago | 0.100% | 0.039%(+0.060)#27 | 0.072%(+0.027)#1,121 |
| 28. | Palatine | 0.097% | 0.039%(+0.057)#28 | 0.072%(+0.024)#1,139 |
| 29. | Buffalo Grove | 0.091% | 0.039%(+0.052)#29 | 0.072%(+0.019)#1,163 |
| 30. | Lincolnwood | 0.090% | 0.039%(+0.051)#30 | 0.072%(+0.018)#1,167 |
| 31. | Warrenville | 0.079% | 0.039%(+0.040)#31 | 0.072%(+0.007)#1,247 |
| 32. | Streamwood | 0.073% | 0.039%(+0.034)#32 | 0.072%(+0.001)#1,274 |
| 33. | Mundelein | 0.073% | 0.039%(+0.034)#33 | 0.072%(+0.001)#1,283 |
| 34. | Morton Grove | 0.068% | 0.039%(+0.029)#34 | 0.072%(-0.004)#1,314 |
| 35. | Wilmette | 0.065% | 0.039%(+0.025)#35 | 0.072%(-0.008)#1,340 |
| 36. | Downers Grove | 0.064% | 0.039%(+0.025)#36 | 0.072%(-0.008)#1,348 |
| 37. | Oak Brook | 0.062% | 0.039%(+0.023)#37 | 0.072%(-0.010)#1,365 |
| 38. | Hoffman Estates | 0.062% | 0.039%(+0.023)#38 | 0.072%(-0.010)#1,368 |
| 39. | South Jacksonville | 0.061% | 0.039%(+0.022)#39 | 0.072%(-0.011)#1,384 |
| 40. | West Chicago | 0.059% | 0.039%(+0.019)#40 | 0.072%(-0.014)#1,402 |
| 41. | Lake Forest | 0.057% | 0.039%(+0.017)#41 | 0.072%(-0.016)#1,420 |
| 42. | Addison | 0.056% | 0.039%(+0.017)#42 | 0.072%(-0.016)#1,426 |
| 43. | Sycamore | 0.055% | 0.039%(+0.016)#43 | 0.072%(-0.017)#1,432 |
| 44. | Aurora | 0.052% | 0.039%(+0.013)#44 | 0.072%(-0.020)#1,455 |
| 45. | Lombard | 0.045% | 0.039%(+0.006)#45 | 0.072%(-0.027)#1,499 |
| 46. | Evanston | 0.045% | 0.039%(+0.006)#46 | 0.072%(-0.027)#1,500 |
| 47. | Crest Hill | 0.045% | 0.039%(+0.006)#47 | 0.072%(-0.027)#1,502 |
| 48. | Bloomingdale | 0.045% | 0.039%(+0.005)#48 | 0.072%(-0.028)#1,510 |
| 49. | Algonquin | 0.043% | 0.039%(+0.004)#49 | 0.072%(-0.029)#1,520 |
| 50. | Bridgeview | 0.041% | 0.039%(+0.002)#50 | 0.072%(-0.031)#1,537 |
| 51. | Carbondale | 0.041% | 0.039%(+0.002)#51 | 0.072%(-0.031)#1,547 |
| 52. | Champaign | 0.041% | 0.039%(+0.001)#52 | 0.072%(-0.032)#1,550 |
| 53. | Lake Zurich | 0.041% | 0.039%(+0.001)#53 | 0.072%(-0.032)#1,552 |
| 54. | Winnetka | 0.040% | 0.039%(+0.000)#54 | 0.072%(-0.033)#1,566 |
| 55. | Wheeling | 0.039% | 0.039%(-0.001)#55 | 0.072%(-0.034)#1,575 |
| 56. | Orland Park | 0.038% | 0.039%(-0.002)#56 | 0.072%(-0.035)#1,586 |
| 57. | Elk Grove Village | 0.034% | 0.039%(-0.005)#57 | 0.072%(-0.038)#1,632 |
| 58. | Rolling Meadows | 0.033% | 0.039%(-0.006)#58 | 0.072%(-0.039)#1,636 |
| 59. | Dekalb | 0.032% | 0.039%(-0.007)#59 | 0.072%(-0.040)#1,652 |
| 60. | Vernon Hills | 0.030% | 0.039%(-0.009)#60 | 0.072%(-0.042)#1,680 |
| 61. | Gurnee | 0.029% | 0.039%(-0.010)#61 | 0.072%(-0.043)#1,688 |
| 62. | Park Forest | 0.029% | 0.039%(-0.011)#62 | 0.072%(-0.044)#1,702 |
| 63. | Highland Park | 0.026% | 0.039%(-0.013)#63 | 0.072%(-0.046)#1,725 |
| 64. | Elmhurst | 0.026% | 0.039%(-0.013)#64 | 0.072%(-0.046)#1,730 |
| 65. | Arlington Heights | 0.026% | 0.039%(-0.013)#65 | 0.072%(-0.046)#1,738 |
| 66. | Carol Stream | 0.025% | 0.039%(-0.014)#66 | 0.072%(-0.047)#1,752 |
| 67. | Carpentersville | 0.024% | 0.039%(-0.016)#67 | 0.072%(-0.048)#1,765 |
| 68. | Quincy | 0.020% | 0.039%(-0.019)#68 | 0.072%(-0.052)#1,807 |
| 69. | Rockford | 0.020% | 0.039%(-0.019)#69 | 0.072%(-0.052)#1,808 |
| 70. | Normal | 0.019% | 0.039%(-0.020)#70 | 0.072%(-0.053)#1,826 |
| 71. | Decatur | 0.018% | 0.039%(-0.021)#71 | 0.072%(-0.054)#1,834 |
| 72. | Waukegan | 0.018% | 0.039%(-0.021)#72 | 0.072%(-0.054)#1,843 |
| 73. | Wheaton | 0.017% | 0.039%(-0.023)#73 | 0.072%(-0.056)#1,856 |
| 74. | Crystal Lake | 0.015% | 0.039%(-0.024)#74 | 0.072%(-0.057)#1,887 |
| 75. | Elgin | 0.014% | 0.039%(-0.025)#75 | 0.072%(-0.058)#1,903 |
| 76. | Des Plaines | 0.013% | 0.039%(-0.026)#76 | 0.072%(-0.059)#1,916 |
| 77. | Peoria | 0.0062% | 0.039%(-0.033)#77 | 0.072%(-0.066)#1,997 |
| 78. | Batavia | 0.0038% | 0.039%(-0.036)#78 | 0.072%(-0.068)#2,026 |
Common Questions
What are the Top 10 Cities with the Highest Percentage of Immigrants from Hong Kong in Illinois?
Top 10 Cities with the Highest Percentage of Immigrants from Hong Kong in Illinois are:
#1
1.89%
#2
0.57%
#3
0.41%
#4
0.31%
#5
0.31%
#6
0.29%
#7
0.27%
#8
0.25%
#9
0.24%
#10
0.23%
What city has the Highest Percentage of Immigrants from Hong Kong in Illinois?
Mason has the Highest Percentage of Immigrants from Hong Kong in Illinois with 1.89%.
What is the Percentage of Immigrants from Hong Kong in the State of Illinois?
Percentage of Immigrants from Hong Kong in Illinois is 0.039%.
What is the Percentage of Immigrants from Hong Kong in the United States?
Percentage of Immigrants from Hong Kong in the United States is 0.072%.