Christopher, IL Map & Demographics
Christopher Map
Christopher Overview
$25,719
PER CAPITA INCOME
$54,519
AVG FAMILY INCOME
$42,650
AVG HOUSEHOLD INCOME
4.1%
WAGE / INCOME GAP [ % ]
95.9¢/ $1
WAGE / INCOME GAP [ $ ]
$9,698
FAMILY INCOME DEFICIT
0.46
INEQUALITY / GINI INDEX
2,507
TOTAL POPULATION
1,247
MALE POPULATION
1,260
FEMALE POPULATION
98.97
MALES / 100 FEMALES
101.04
FEMALES / 100 MALES
42.1
MEDIAN AGE
3.0
AVG FAMILY SIZE
2.1
AVG HOUSEHOLD SIZE
1,029
LABOR FORCE [ PEOPLE ]
51.3%
PERCENT IN LABOR FORCE
7.4%
UNEMPLOYMENT RATE
Christopher Zip Codes
Christopher Area Codes
Income in Christopher
Income Overview in Christopher
Per Capita Income in Christopher is $25,719, while median incomes of families and households are $54,519 and $42,650 respectively.
| Characteristic | Number | Measure |
| Per Capita Income | 2,507 | $25,719 |
| Median Family Income | 634 | $54,519 |
| Mean Family Income | 634 | $71,465 |
| Median Household Income | 1,184 | $42,650 |
| Mean Household Income | 1,184 | $54,666 |
| Income Deficit | 634 | $9,698 |
| Wage / Income Gap (%) | 2,507 | 4.12% |
| Wage / Income Gap ($) | 2,507 | 95.88¢ per $1 |
| Gini / Inequality Index | 2,507 | 0.46 |
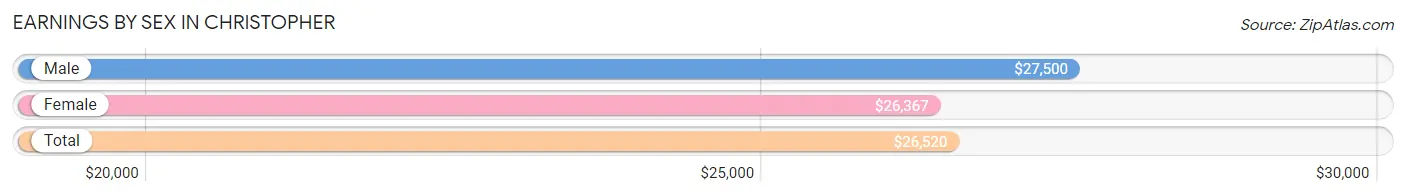
Earnings by Sex in Christopher
Average Earnings in Christopher are $26,520, $27,500 for men and $26,367 for women, a difference of 4.1%.
| Sex | Number | Average Earnings |
| Male | 542 (46.9%) | $27,500 |
| Female | 615 (53.1%) | $26,367 |
| Total | 1,157 (100.0%) | $26,520 |
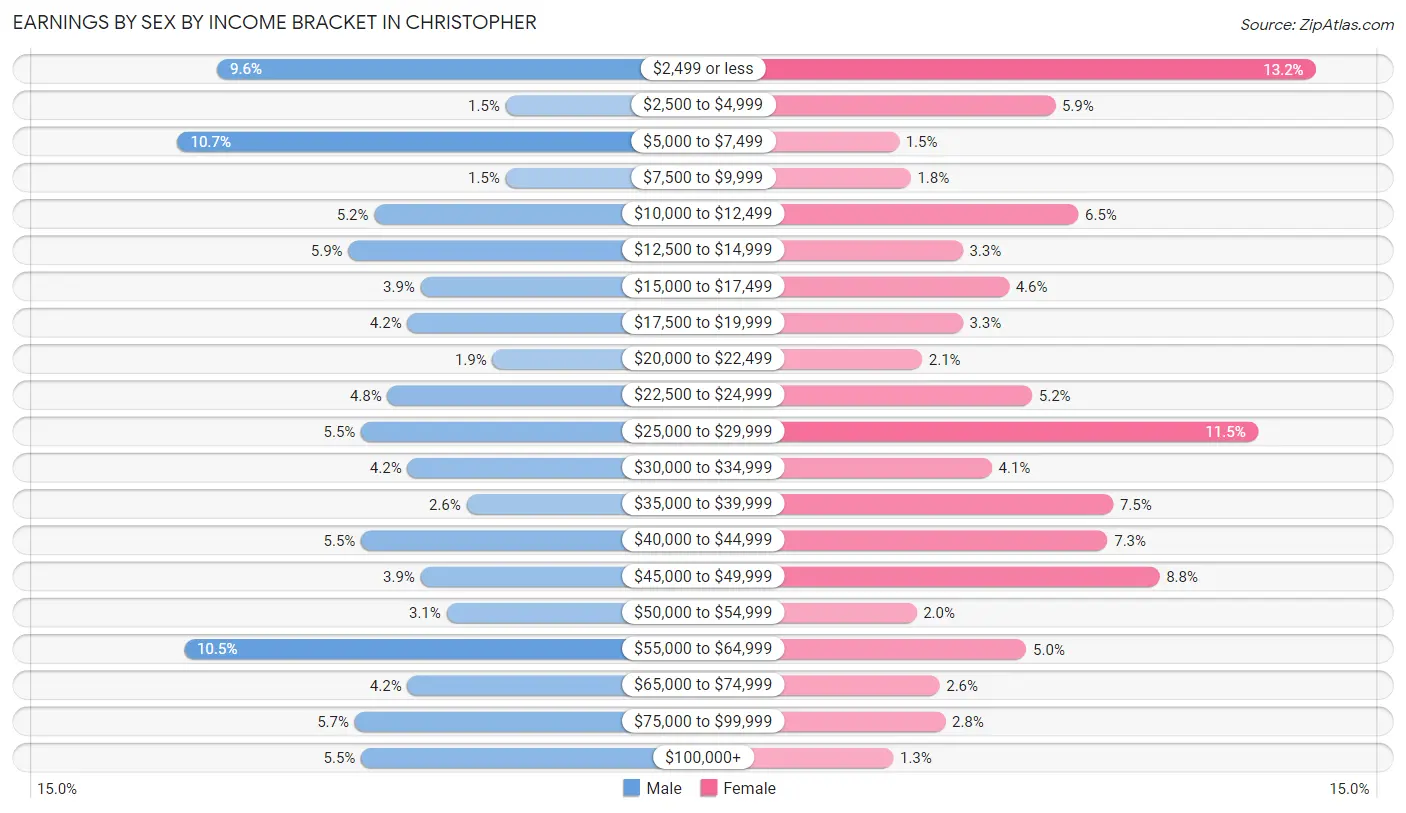
Earnings by Sex by Income Bracket in Christopher
The most common earnings brackets in Christopher are $5,000 to $7,499 for men (58 | 10.7%) and $2,499 or less for women (81 | 13.2%).
| Income | Male | Female |
| $2,499 or less | 52 (9.6%) | 81 (13.2%) |
| $2,500 to $4,999 | 8 (1.5%) | 36 (5.9%) |
| $5,000 to $7,499 | 58 (10.7%) | 9 (1.5%) |
| $7,500 to $9,999 | 8 (1.5%) | 11 (1.8%) |
| $10,000 to $12,499 | 28 (5.2%) | 40 (6.5%) |
| $12,500 to $14,999 | 32 (5.9%) | 20 (3.3%) |
| $15,000 to $17,499 | 21 (3.9%) | 28 (4.5%) |
| $17,500 to $19,999 | 23 (4.2%) | 20 (3.3%) |
| $20,000 to $22,499 | 10 (1.8%) | 13 (2.1%) |
| $22,500 to $24,999 | 26 (4.8%) | 32 (5.2%) |
| $25,000 to $29,999 | 30 (5.5%) | 71 (11.5%) |
| $30,000 to $34,999 | 23 (4.2%) | 25 (4.1%) |
| $35,000 to $39,999 | 14 (2.6%) | 46 (7.5%) |
| $40,000 to $44,999 | 30 (5.5%) | 45 (7.3%) |
| $45,000 to $49,999 | 21 (3.9%) | 54 (8.8%) |
| $50,000 to $54,999 | 17 (3.1%) | 12 (1.9%) |
| $55,000 to $64,999 | 57 (10.5%) | 31 (5.0%) |
| $65,000 to $74,999 | 23 (4.2%) | 16 (2.6%) |
| $75,000 to $99,999 | 31 (5.7%) | 17 (2.8%) |
| $100,000+ | 30 (5.5%) | 8 (1.3%) |
| Total | 542 (100.0%) | 615 (100.0%) |
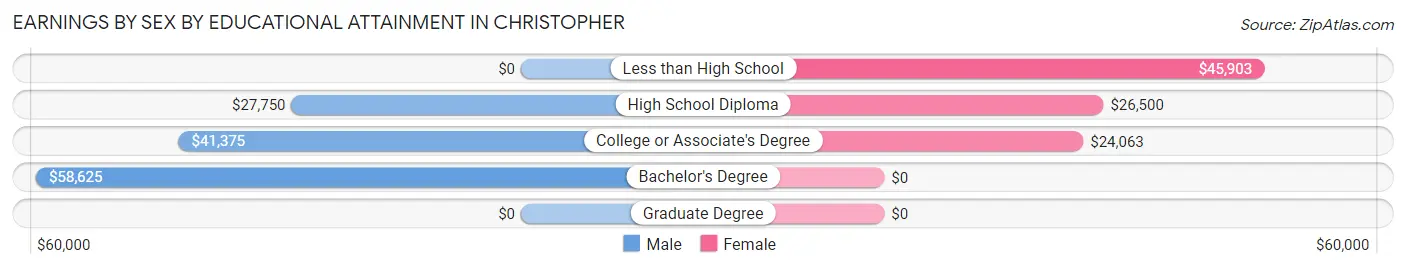
Earnings by Sex by Educational Attainment in Christopher
Average earnings in Christopher are $29,900 for men and $28,145 for women, a difference of 5.9%. Men with an educational attainment of bachelor's degree enjoy the highest average annual earnings of $58,625, while those with high school diploma education earn the least with $27,750. Women with an educational attainment of less than high school earn the most with the average annual earnings of $45,903, while those with college or associate's degree education have the smallest earnings of $24,063.
| Educational Attainment | Male Income | Female Income |
| Less than High School | - | - |
| High School Diploma | $27,750 | $26,500 |
| College or Associate's Degree | $41,375 | $24,063 |
| Bachelor's Degree | $58,625 | $0 |
| Graduate Degree | - | - |
| Total | $29,900 | $28,145 |
Family Income in Christopher
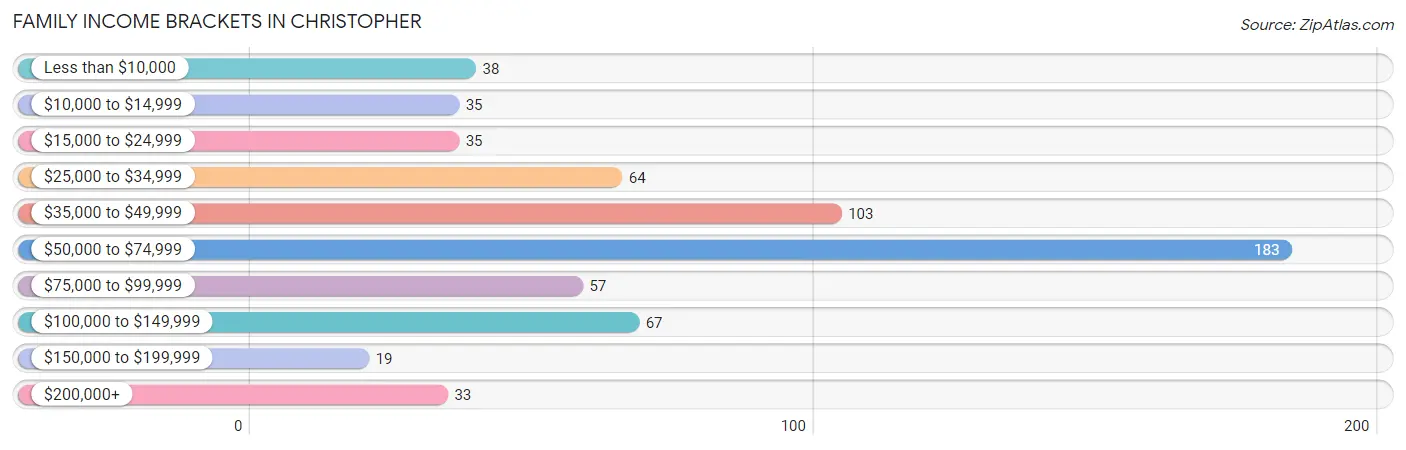
Family Income Brackets in Christopher
According to the Christopher family income data, there are 183 families falling into the $50,000 to $74,999 income range, which is the most common income bracket and makes up 28.9% of all families. Conversely, the $150,000 to $199,999 income bracket is the least frequent group with only 19 families (3.0%) belonging to this category.
| Income Bracket | # Families | % Families |
| Less than $10,000 | 38 | 6.0% |
| $10,000 to $14,999 | 35 | 5.5% |
| $15,000 to $24,999 | 35 | 5.5% |
| $25,000 to $34,999 | 64 | 10.1% |
| $35,000 to $49,999 | 103 | 16.2% |
| $50,000 to $74,999 | 183 | 28.9% |
| $75,000 to $99,999 | 57 | 9.0% |
| $100,000 to $149,999 | 67 | 10.6% |
| $150,000 to $199,999 | 19 | 3.0% |
| $200,000+ | 33 | 5.2% |
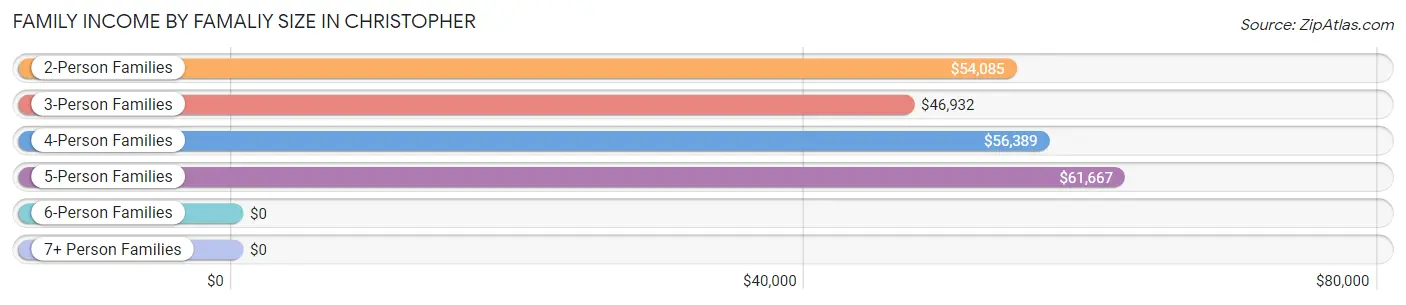
Family Income by Famaliy Size in Christopher
5-person families (86 | 13.6%) account for the highest median family income in Christopher with $61,667 per family, while 2-person families (322 | 50.8%) have the highest median income of $27,042 per family member.
| Income Bracket | # Families | Median Income |
| 2-Person Families | 322 (50.8%) | $54,085 |
| 3-Person Families | 141 (22.2%) | $46,932 |
| 4-Person Families | 80 (12.6%) | $56,389 |
| 5-Person Families | 86 (13.6%) | $61,667 |
| 6-Person Families | 0 (0.0%) | $0 |
| 7+ Person Families | 5 (0.8%) | $0 |
| Total | 634 (100.0%) | $54,519 |
Family Income by Number of Earners in Christopher
The median family income in Christopher is $54,519, with families comprising 3+ earners (70) having the highest median family income of $73,929, while families with 1 earner (278) have the lowest median family income of $35,921, accounting for 11.0% and 43.9% of families, respectively.

| Number of Earners | # Families | Median Income |
| No Earners | 94 (14.8%) | $43,750 |
| 1 Earner | 278 (43.9%) | $35,921 |
| 2 Earners | 192 (30.3%) | $67,917 |
| 3+ Earners | 70 (11.0%) | $73,929 |
| Total | 634 (100.0%) | $54,519 |
Household Income in Christopher
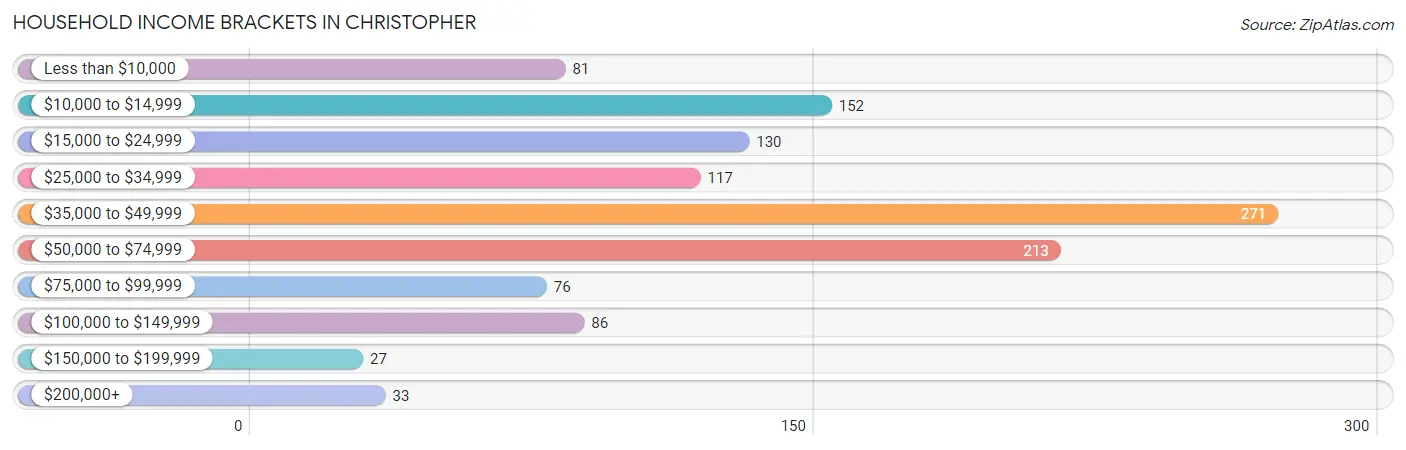
Household Income Brackets in Christopher
With 271 households falling in the category, the $35,000 to $49,999 income range is the most frequent in Christopher, accounting for 22.9% of all households. In contrast, only 27 households (2.3%) fall into the $150,000 to $199,999 income bracket, making it the least populous group.
| Income Bracket | # Households | % Households |
| Less than $10,000 | 81 | 6.8% |
| $10,000 to $14,999 | 152 | 12.8% |
| $15,000 to $24,999 | 130 | 11.0% |
| $25,000 to $34,999 | 117 | 9.9% |
| $35,000 to $49,999 | 271 | 22.9% |
| $50,000 to $74,999 | 213 | 18.0% |
| $75,000 to $99,999 | 76 | 6.4% |
| $100,000 to $149,999 | 86 | 7.3% |
| $150,000 to $199,999 | 27 | 2.3% |
| $200,000+ | 33 | 2.8% |
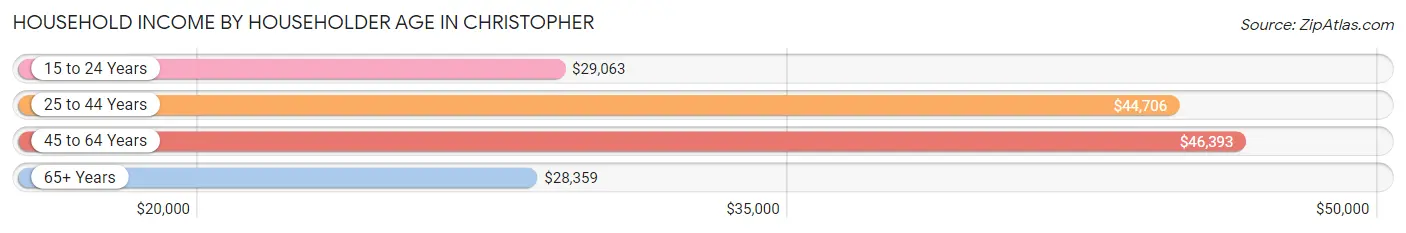
Household Income by Householder Age in Christopher
The median household income in Christopher is $42,650, with the highest median household income of $46,393 found in the 45 to 64 years age bracket for the primary householder. A total of 426 households (36.0%) fall into this category. Meanwhile, the 65+ years age bracket for the primary householder has the lowest median household income of $28,359, with 426 households (36.0%) in this group.
| Income Bracket | # Households | Median Income |
| 15 to 24 Years | 20 (1.7%) | $29,063 |
| 25 to 44 Years | 312 (26.4%) | $44,706 |
| 45 to 64 Years | 426 (36.0%) | $46,393 |
| 65+ Years | 426 (36.0%) | $28,359 |
| Total | 1,184 (100.0%) | $42,650 |
Poverty in Christopher
Income Below Poverty by Sex and Age in Christopher
With 24.9% poverty level for males and 19.9% for females among the residents of Christopher, 6 to 11 year old males and under 5 year old females are the most vulnerable to poverty, with 55 males (50.9%) and 30 females (68.2%) in their respective age groups living below the poverty level.
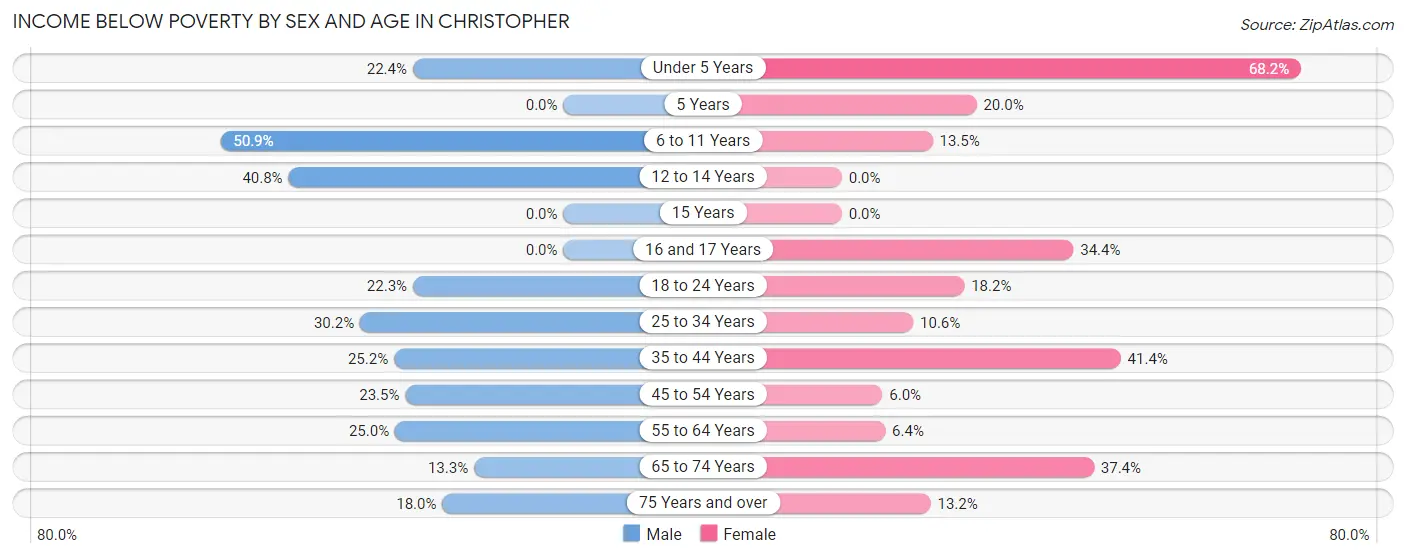
| Age Bracket | Male | Female |
| Under 5 Years | 19 (22.4%) | 30 (68.2%) |
| 5 Years | 0 (0.0%) | 5 (20.0%) |
| 6 to 11 Years | 55 (50.9%) | 19 (13.5%) |
| 12 to 14 Years | 20 (40.8%) | 0 (0.0%) |
| 15 Years | 0 (0.0%) | 0 (0.0%) |
| 16 and 17 Years | 0 (0.0%) | 11 (34.4%) |
| 18 to 24 Years | 21 (22.3%) | 10 (18.2%) |
| 25 to 34 Years | 45 (30.2%) | 18 (10.6%) |
| 35 to 44 Years | 42 (25.2%) | 53 (41.4%) |
| 45 to 54 Years | 46 (23.5%) | 8 (6.0%) |
| 55 to 64 Years | 26 (25.0%) | 13 (6.4%) |
| 65 to 74 Years | 13 (13.3%) | 67 (37.4%) |
| 75 Years and over | 23 (18.0%) | 17 (13.2%) |
| Total | 310 (24.9%) | 251 (19.9%) |
Income Above Poverty by Sex and Age in Christopher
According to the poverty statistics in Christopher, males aged 5 years and females aged 12 to 14 years are the age groups that are most secure financially, with 100.0% of males and 100.0% of females in these age groups living above the poverty line.
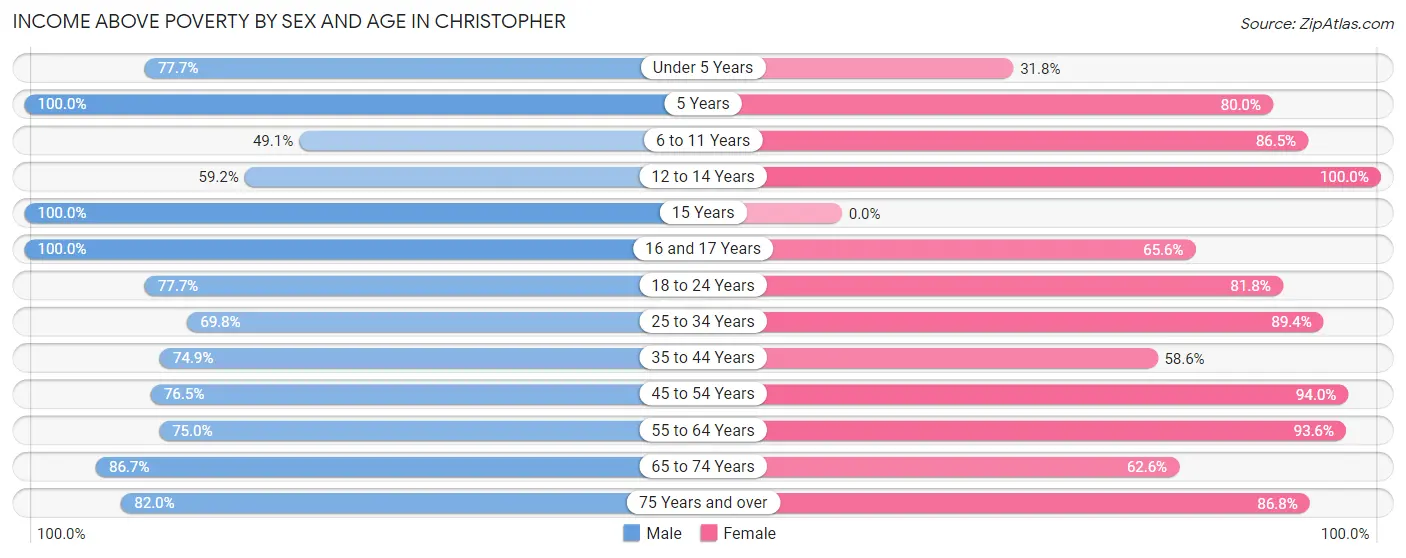
| Age Bracket | Male | Female |
| Under 5 Years | 66 (77.6%) | 14 (31.8%) |
| 5 Years | 4 (100.0%) | 20 (80.0%) |
| 6 to 11 Years | 53 (49.1%) | 122 (86.5%) |
| 12 to 14 Years | 29 (59.2%) | 22 (100.0%) |
| 15 Years | 23 (100.0%) | 0 (0.0%) |
| 16 and 17 Years | 42 (100.0%) | 21 (65.6%) |
| 18 to 24 Years | 73 (77.7%) | 45 (81.8%) |
| 25 to 34 Years | 104 (69.8%) | 152 (89.4%) |
| 35 to 44 Years | 125 (74.9%) | 75 (58.6%) |
| 45 to 54 Years | 150 (76.5%) | 125 (94.0%) |
| 55 to 64 Years | 78 (75.0%) | 189 (93.6%) |
| 65 to 74 Years | 85 (86.7%) | 112 (62.6%) |
| 75 Years and over | 105 (82.0%) | 112 (86.8%) |
| Total | 937 (75.1%) | 1,009 (80.1%) |
Income Below Poverty Among Married-Couple Families in Christopher
The poverty statistics for married-couple families in Christopher show that 6.9% or 28 of the total 405 families live below the poverty line. Families with 1 or 2 children have the highest poverty rate of 20.2%, comprising of 20 families. On the other hand, families with 3 or 4 children have the lowest poverty rate of 0.0%, which includes 0 families.
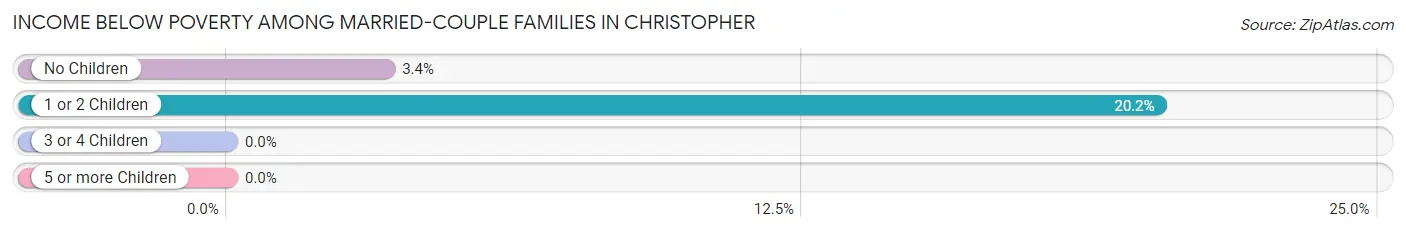
| Children | Above Poverty | Below Poverty |
| No Children | 226 (96.6%) | 8 (3.4%) |
| 1 or 2 Children | 79 (79.8%) | 20 (20.2%) |
| 3 or 4 Children | 72 (100.0%) | 0 (0.0%) |
| 5 or more Children | 0 (0.0%) | 0 (0.0%) |
| Total | 377 (93.1%) | 28 (6.9%) |
Income Below Poverty Among Single-Parent Households in Christopher
According to the poverty data in Christopher, 60.8% or 59 single-father households and 26.5% or 35 single-mother households are living below the poverty line. Among single-father households, those with 1 or 2 children have the highest poverty rate, with 42 households (76.4%) experiencing poverty. Likewise, among single-mother households, those with 3 or 4 children have the highest poverty rate, with 18 households (100.0%) falling below the poverty line.
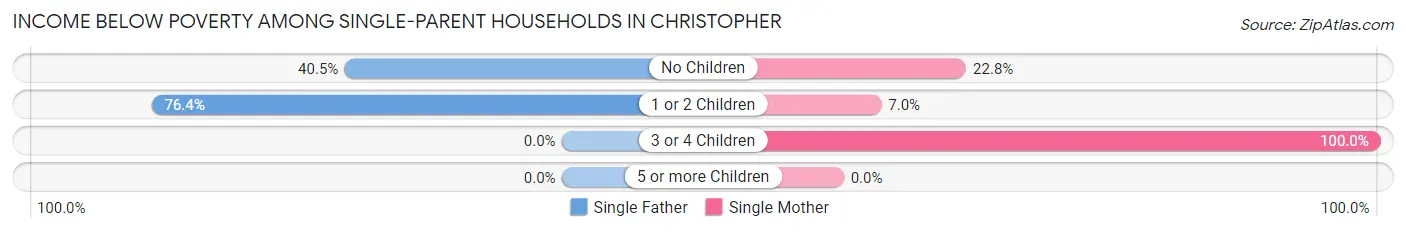
| Children | Single Father | Single Mother |
| No Children | 17 (40.5%) | 13 (22.8%) |
| 1 or 2 Children | 42 (76.4%) | 4 (7.0%) |
| 3 or 4 Children | 0 (0.0%) | 18 (100.0%) |
| 5 or more Children | 0 (0.0%) | 0 (0.0%) |
| Total | 59 (60.8%) | 35 (26.5%) |
Income Below Poverty Among Married-Couple vs Single-Parent Households in Christopher
The poverty data for Christopher shows that 28 of the married-couple family households (6.9%) and 94 of the single-parent households (41.0%) are living below the poverty level. Within the married-couple family households, those with 1 or 2 children have the highest poverty rate, with 20 households (20.2%) falling below the poverty line. Among the single-parent households, those with 3 or 4 children have the highest poverty rate, with 18 household (100.0%) living below poverty.
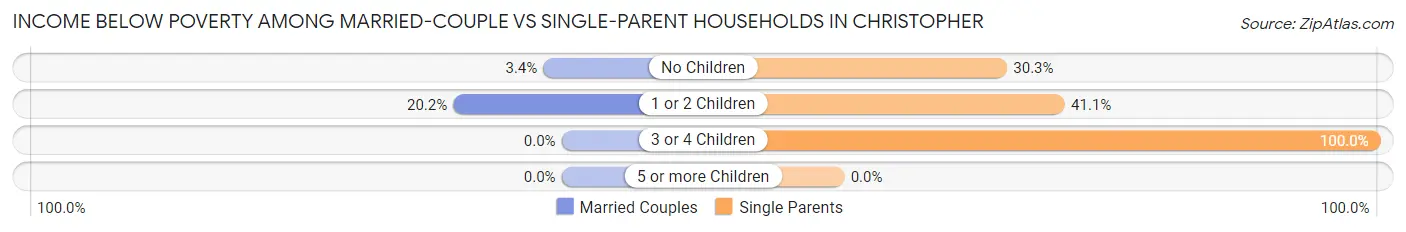
| Children | Married-Couple Families | Single-Parent Households |
| No Children | 8 (3.4%) | 30 (30.3%) |
| 1 or 2 Children | 20 (20.2%) | 46 (41.1%) |
| 3 or 4 Children | 0 (0.0%) | 18 (100.0%) |
| 5 or more Children | 0 (0.0%) | 0 (0.0%) |
| Total | 28 (6.9%) | 94 (41.0%) |
Race in Christopher
The most populous races in Christopher are White / Caucasian (2,354 | 93.9%), Two or more Races (138 | 5.5%), and Hispanic or Latino (71 | 2.8%).
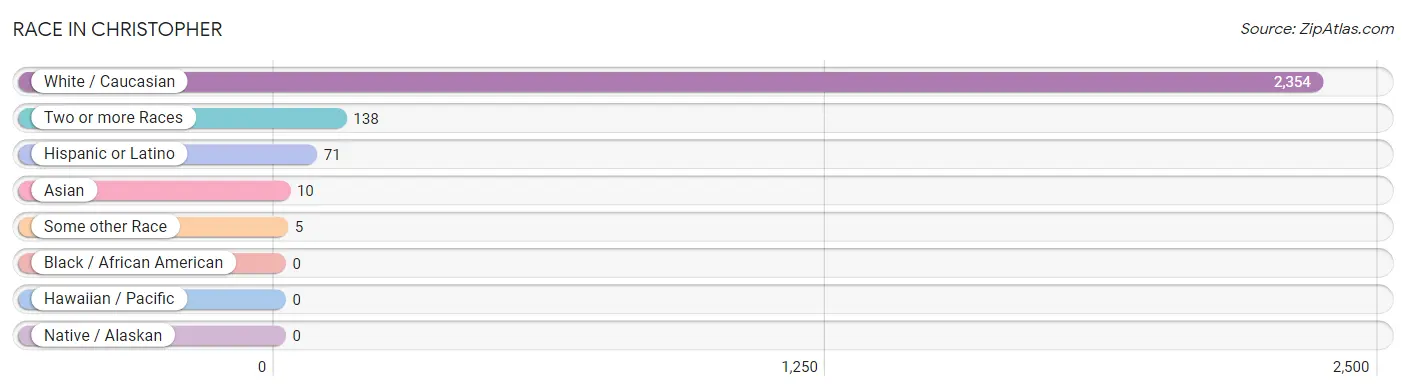
| Race | # Population | % Population |
| Asian | 10 | 0.4% |
| Black / African American | 0 | 0.0% |
| Hawaiian / Pacific | 0 | 0.0% |
| Hispanic or Latino | 71 | 2.8% |
| Native / Alaskan | 0 | 0.0% |
| White / Caucasian | 2,354 | 93.9% |
| Two or more Races | 138 | 5.5% |
| Some other Race | 5 | 0.2% |
| Total | 2,507 | 100.0% |
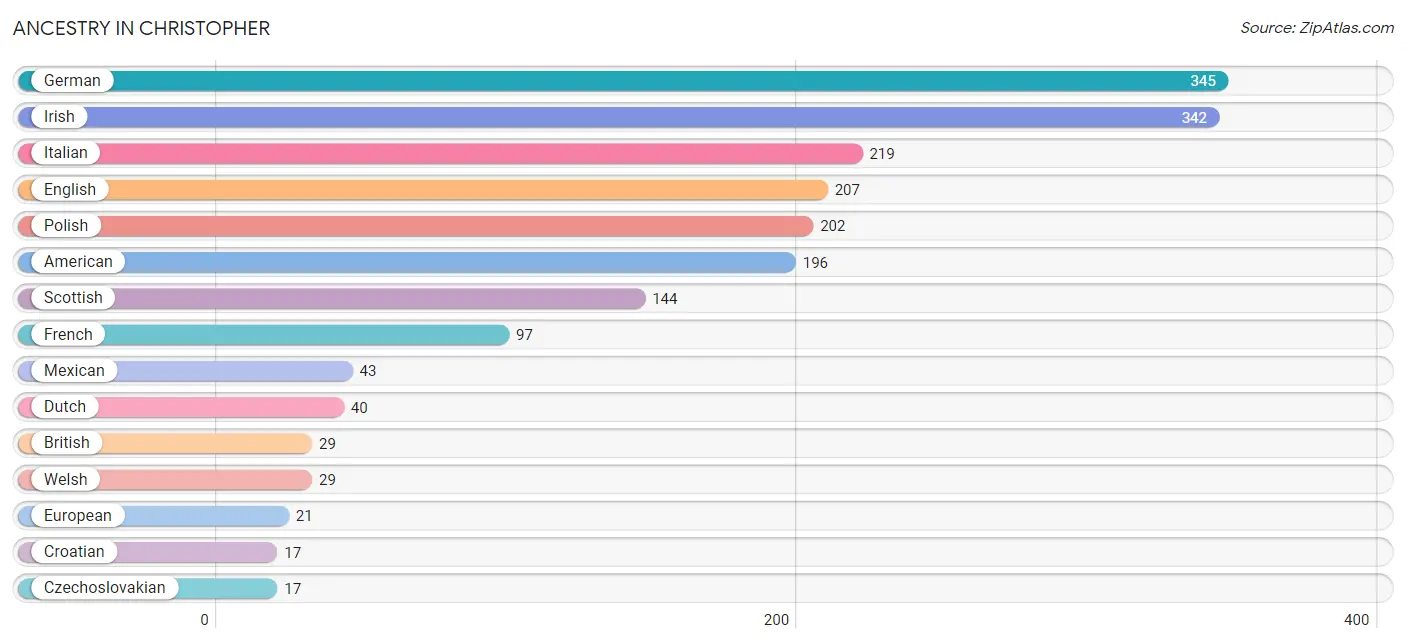
Ancestry in Christopher
The most populous ancestries reported in Christopher are German (345 | 13.8%), Irish (342 | 13.6%), Italian (219 | 8.7%), English (207 | 8.3%), and Polish (202 | 8.1%), together accounting for 52.5% of all Christopher residents.
| Ancestry | # Population | % Population |
| American | 196 | 7.8% |
| Arab | 5 | 0.2% |
| Blackfeet | 1 | 0.0% |
| British | 29 | 1.2% |
| Central American | 5 | 0.2% |
| Croatian | 17 | 0.7% |
| Czechoslovakian | 17 | 0.7% |
| Dutch | 40 | 1.6% |
| English | 207 | 8.3% |
| European | 21 | 0.8% |
| French | 97 | 3.9% |
| German | 345 | 13.8% |
| Greek | 7 | 0.3% |
| Honduran | 5 | 0.2% |
| Hungarian | 13 | 0.5% |
| Irish | 342 | 13.6% |
| Israeli | 11 | 0.4% |
| Italian | 219 | 8.7% |
| Korean | 13 | 0.5% |
| Mexican | 43 | 1.7% |
| Moroccan | 5 | 0.2% |
| Pennsylvania German | 7 | 0.3% |
| Polish | 202 | 8.1% |
| Puerto Rican | 8 | 0.3% |
| Scotch-Irish | 11 | 0.4% |
| Scottish | 144 | 5.7% |
| Slovak | 11 | 0.4% |
| Spanish | 15 | 0.6% |
| Subsaharan African | 6 | 0.2% |
| Swedish | 11 | 0.4% |
| Thai | 10 | 0.4% |
| Welsh | 29 | 1.2% | View All 32 Rows |
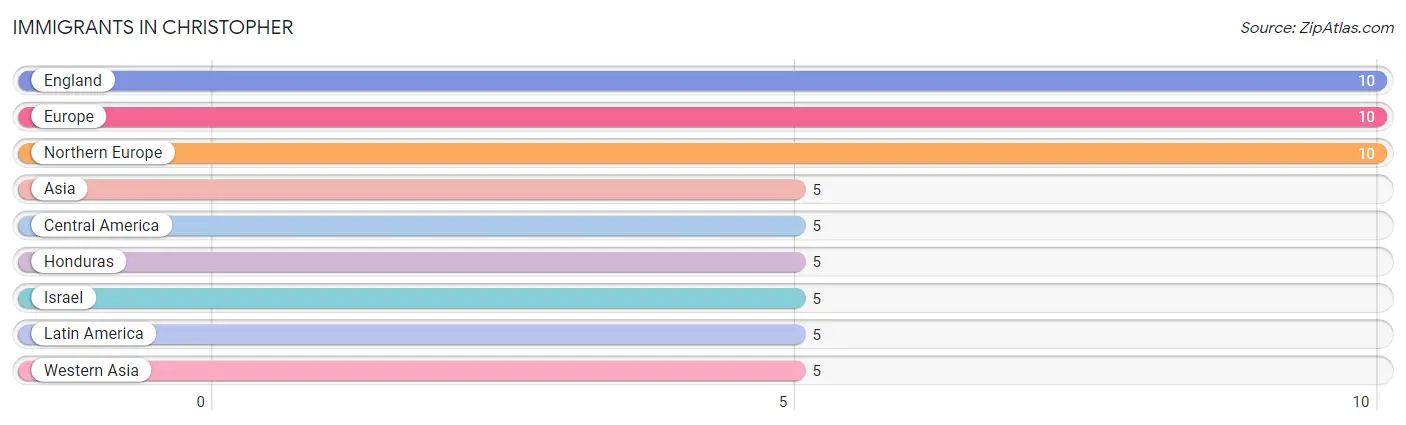
Immigrants in Christopher
The most numerous immigrant groups reported in Christopher came from England (10 | 0.4%), Europe (10 | 0.4%), Northern Europe (10 | 0.4%), Asia (5 | 0.2%), and Central America (5 | 0.2%), together accounting for 1.6% of all Christopher residents.
| Immigration Origin | # Population | % Population |
| Asia | 5 | 0.2% |
| Central America | 5 | 0.2% |
| England | 10 | 0.4% |
| Europe | 10 | 0.4% |
| Honduras | 5 | 0.2% |
| Israel | 5 | 0.2% |
| Latin America | 5 | 0.2% |
| Northern Europe | 10 | 0.4% |
| Western Asia | 5 | 0.2% | View All 9 Rows |
Sex and Age in Christopher
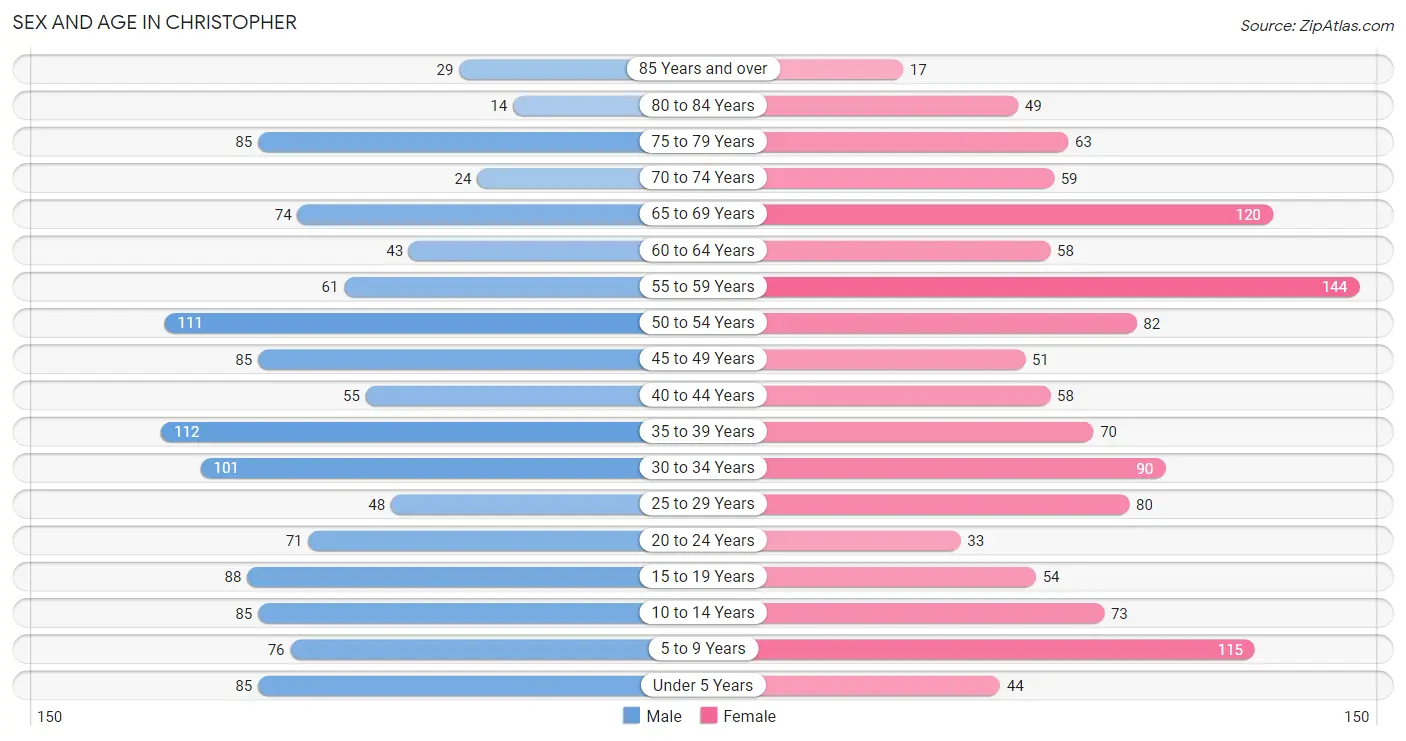
Sex and Age in Christopher
The most populous age groups in Christopher are 35 to 39 Years (112 | 9.0%) for men and 55 to 59 Years (144 | 11.4%) for women.
| Age Bracket | Male | Female |
| Under 5 Years | 85 (6.8%) | 44 (3.5%) |
| 5 to 9 Years | 76 (6.1%) | 115 (9.1%) |
| 10 to 14 Years | 85 (6.8%) | 73 (5.8%) |
| 15 to 19 Years | 88 (7.1%) | 54 (4.3%) |
| 20 to 24 Years | 71 (5.7%) | 33 (2.6%) |
| 25 to 29 Years | 48 (3.8%) | 80 (6.4%) |
| 30 to 34 Years | 101 (8.1%) | 90 (7.1%) |
| 35 to 39 Years | 112 (9.0%) | 70 (5.6%) |
| 40 to 44 Years | 55 (4.4%) | 58 (4.6%) |
| 45 to 49 Years | 85 (6.8%) | 51 (4.1%) |
| 50 to 54 Years | 111 (8.9%) | 82 (6.5%) |
| 55 to 59 Years | 61 (4.9%) | 144 (11.4%) |
| 60 to 64 Years | 43 (3.5%) | 58 (4.6%) |
| 65 to 69 Years | 74 (5.9%) | 120 (9.5%) |
| 70 to 74 Years | 24 (1.9%) | 59 (4.7%) |
| 75 to 79 Years | 85 (6.8%) | 63 (5.0%) |
| 80 to 84 Years | 14 (1.1%) | 49 (3.9%) |
| 85 Years and over | 29 (2.3%) | 17 (1.3%) |
| Total | 1,247 (100.0%) | 1,260 (100.0%) |
Families and Households in Christopher
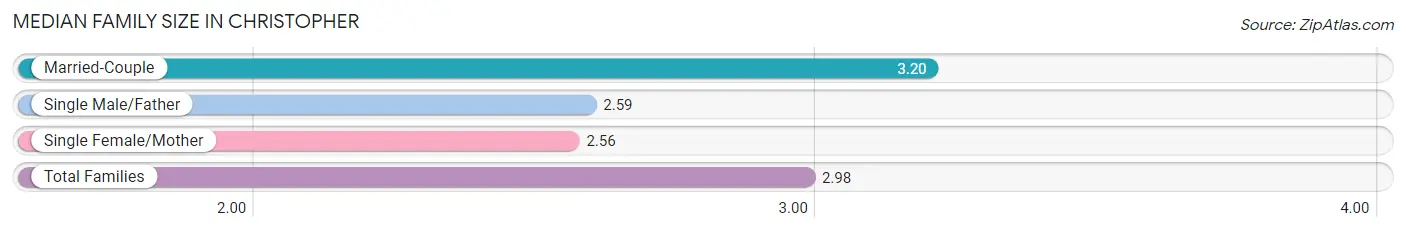
Median Family Size in Christopher
The median family size in Christopher is 2.98 persons per family, with married-couple families (405 | 63.9%) accounting for the largest median family size of 3.2 persons per family. On the other hand, single female/mother families (132 | 20.8%) represent the smallest median family size with 2.56 persons per family.
| Family Type | # Families | Family Size |
| Married-Couple | 405 (63.9%) | 3.20 |
| Single Male/Father | 97 (15.3%) | 2.59 |
| Single Female/Mother | 132 (20.8%) | 2.56 |
| Total Families | 634 (100.0%) | 2.98 |
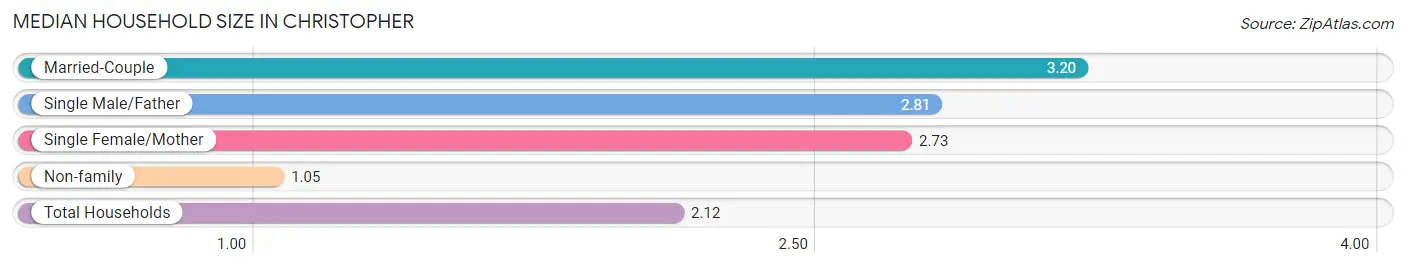
Median Household Size in Christopher
The median household size in Christopher is 2.12 persons per household, with married-couple households (405 | 34.2%) accounting for the largest median household size of 3.2 persons per household. non-family households (550 | 46.5%) represent the smallest median household size with 1.05 persons per household.
| Household Type | # Households | Household Size |
| Married-Couple | 405 (34.2%) | 3.20 |
| Single Male/Father | 97 (8.2%) | 2.81 |
| Single Female/Mother | 132 (11.2%) | 2.73 |
| Non-family | 550 (46.5%) | 1.05 |
| Total Households | 1,184 (100.0%) | 2.12 |
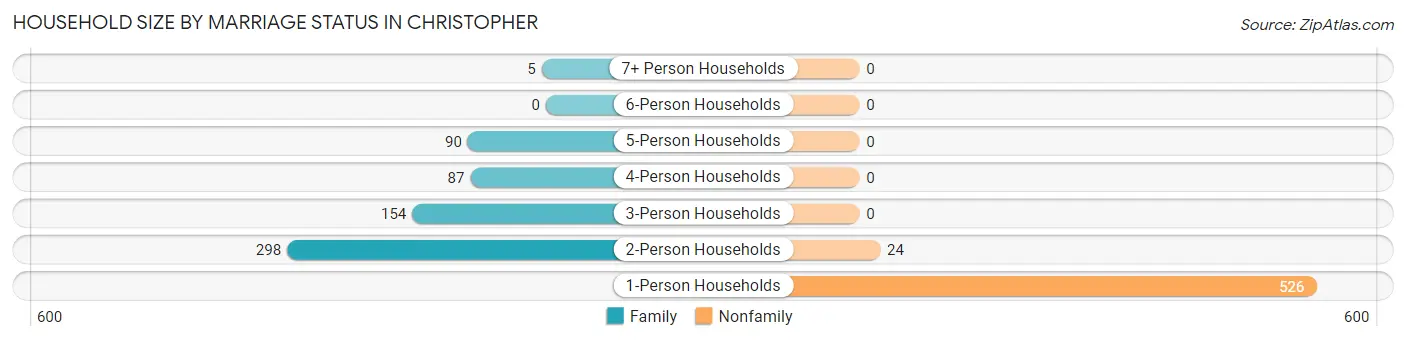
Household Size by Marriage Status in Christopher
Out of a total of 1,184 households in Christopher, 634 (53.5%) are family households, while 550 (46.5%) are nonfamily households. The most numerous type of family households are 2-person households, comprising 298, and the most common type of nonfamily households are 1-person households, comprising 526.
| Household Size | Family Households | Nonfamily Households |
| 1-Person Households | - | 526 (44.4%) |
| 2-Person Households | 298 (25.2%) | 24 (2.0%) |
| 3-Person Households | 154 (13.0%) | 0 (0.0%) |
| 4-Person Households | 87 (7.3%) | 0 (0.0%) |
| 5-Person Households | 90 (7.6%) | 0 (0.0%) |
| 6-Person Households | 0 (0.0%) | 0 (0.0%) |
| 7+ Person Households | 5 (0.4%) | 0 (0.0%) |
| Total | 634 (53.5%) | 550 (46.5%) |
Female Fertility in Christopher
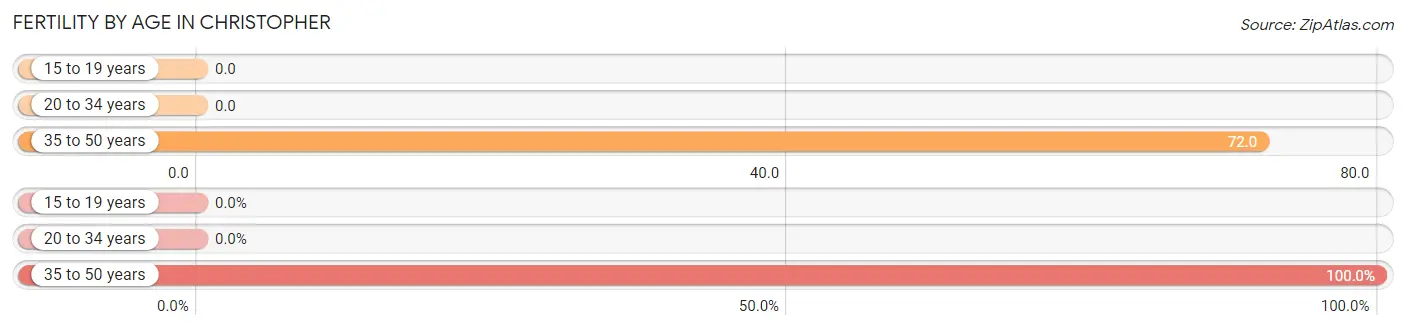
Fertility by Age in Christopher
Average fertility rate in Christopher is 30.0 births per 1,000 women. Women in the age bracket of 35 to 50 years have the highest fertility rate with 72.0 births per 1,000 women. Women in the age bracket of 35 to 50 years acount for 100.0% of all women with births.
| Age Bracket | Women with Births | Births / 1,000 Women |
| 15 to 19 years | 0 (0.0%) | 0.0 |
| 20 to 34 years | 0 (0.0%) | 0.0 |
| 35 to 50 years | 13 (100.0%) | 72.0 |
| Total | 13 (100.0%) | 30.0 |
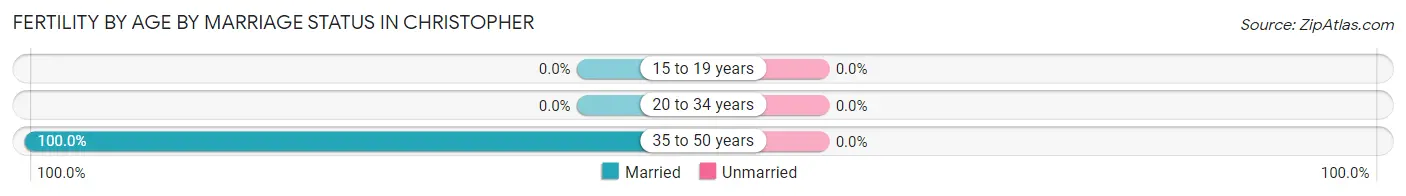
Fertility by Age by Marriage Status in Christopher
| Age Bracket | Married | Unmarried |
| 15 to 19 years | 0 (0.0%) | 0 (0.0%) |
| 20 to 34 years | 0 (0.0%) | 0 (0.0%) |
| 35 to 50 years | 13 (100.0%) | 0 (0.0%) |
| Total | 13 (100.0%) | 0 (0.0%) |
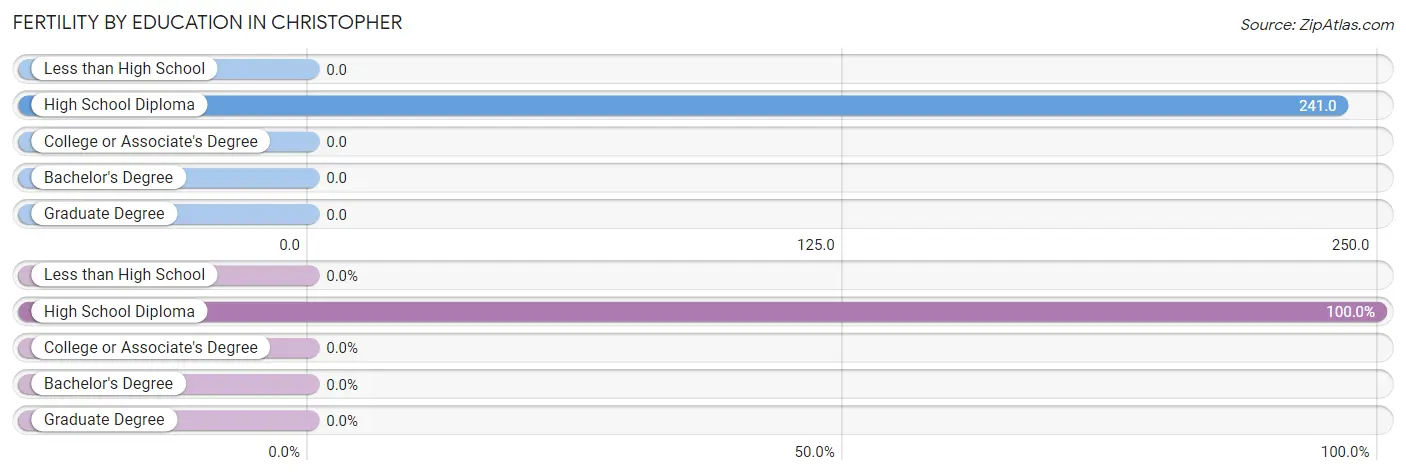
Fertility by Education in Christopher
| Educational Attainment | Women with Births | Births / 1,000 Women |
| Less than High School | 0 (0.0%) | 0.0 |
| High School Diploma | 13 (100.0%) | 241.0 |
| College or Associate's Degree | 0 (0.0%) | 0.0 |
| Bachelor's Degree | 0 (0.0%) | 0.0 |
| Graduate Degree | 0 (0.0%) | 0.0 |
| Total | 13 (100.0%) | 30.0 |
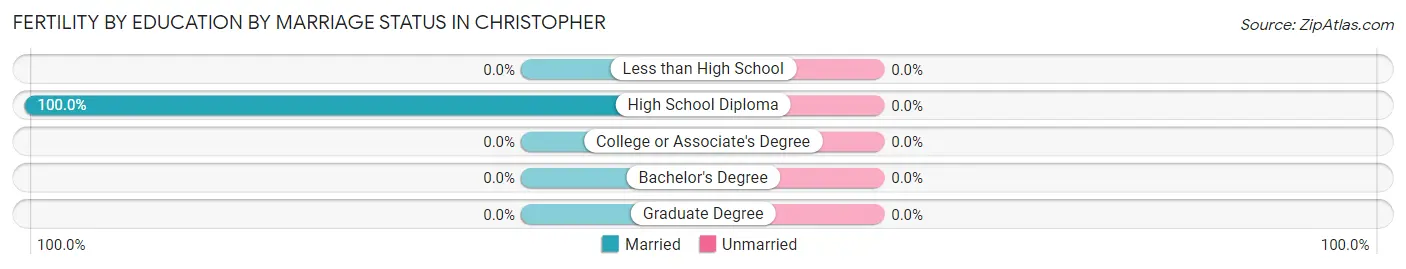
Fertility by Education by Marriage Status in Christopher
| Educational Attainment | Married | Unmarried |
| Less than High School | 0 (0.0%) | 0 (0.0%) |
| High School Diploma | 13 (100.0%) | 0 (0.0%) |
| College or Associate's Degree | 0 (0.0%) | 0 (0.0%) |
| Bachelor's Degree | 0 (0.0%) | 0 (0.0%) |
| Graduate Degree | 0 (0.0%) | 0 (0.0%) |
| Total | 13 (100.0%) | 0 (0.0%) |
Employment Characteristics in Christopher
Employment by Class of Employer in Christopher
Among the 889 employed individuals in Christopher, private company employees (604 | 67.9%), not-for-profit organizations (77 | 8.7%), and self-employed (not incorporated) (75 | 8.4%) make up the most common classes of employment.
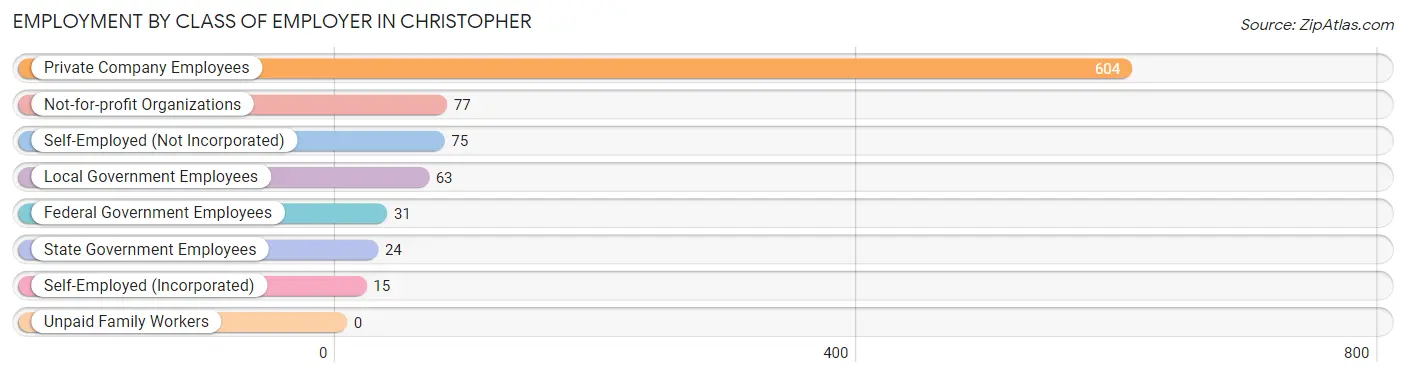
| Employer Class | # Employees | % Employees |
| Private Company Employees | 604 | 67.9% |
| Self-Employed (Incorporated) | 15 | 1.7% |
| Self-Employed (Not Incorporated) | 75 | 8.4% |
| Not-for-profit Organizations | 77 | 8.7% |
| Local Government Employees | 63 | 7.1% |
| State Government Employees | 24 | 2.7% |
| Federal Government Employees | 31 | 3.5% |
| Unpaid Family Workers | 0 | 0.0% |
| Total | 889 | 100.0% |
Employment Status by Age in Christopher
According to the labor force statistics for Christopher, out of the total population over 16 years of age (2,006), 51.3% or 1,029 individuals are in the labor force, with 7.4% or 76 of them unemployed. The age group with the highest labor force participation rate is 25 to 29 years, with 89.8% or 115 individuals in the labor force. Within the labor force, the 75 years and over age range has the highest percentage of unemployed individuals, with 33.3% or 7 of them being unemployed.
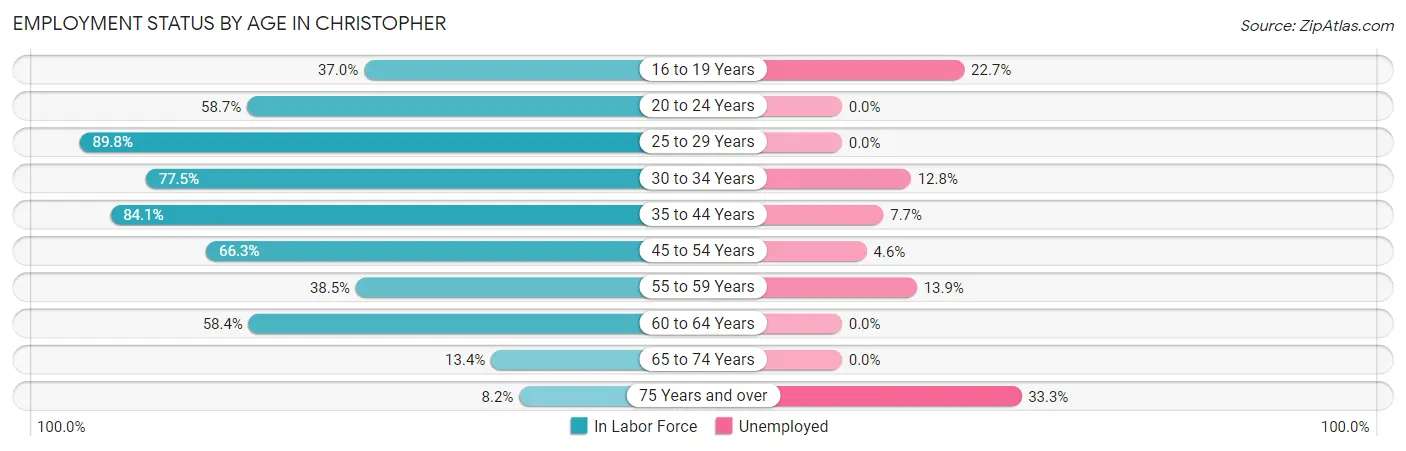
| Age Bracket | In Labor Force | Unemployed |
| 16 to 19 Years | 44 (37.0%) | 10 (22.7%) |
| 20 to 24 Years | 61 (58.7%) | 0 (0.0%) |
| 25 to 29 Years | 115 (89.8%) | 0 (0.0%) |
| 30 to 34 Years | 148 (77.5%) | 19 (12.8%) |
| 35 to 44 Years | 248 (84.1%) | 19 (7.7%) |
| 45 to 54 Years | 218 (66.3%) | 10 (4.6%) |
| 55 to 59 Years | 79 (38.5%) | 11 (13.9%) |
| 60 to 64 Years | 59 (58.4%) | 0 (0.0%) |
| 65 to 74 Years | 37 (13.4%) | 0 (0.0%) |
| 75 Years and over | 21 (8.2%) | 7 (33.3%) |
| Total | 1,029 (51.3%) | 76 (7.4%) |
Employment Status by Educational Attainment in Christopher
According to labor force statistics for Christopher, 69.4% of individuals (867) out of the total population between 25 and 64 years of age (1,249) are in the labor force, with 6.8% or 59 of them being unemployed. The group with the highest labor force participation rate are those with the educational attainment of bachelor's degree or higher, with 76.4% or 123 individuals in the labor force. Within the labor force, individuals with high school diploma education have the highest percentage of unemployment, with 12.0% or 29 of them being unemployed.
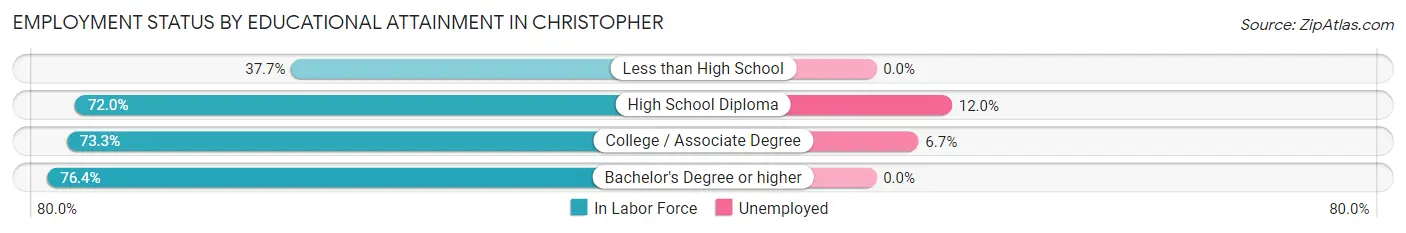
| Educational Attainment | In Labor Force | Unemployed |
| Less than High School | 52 (37.7%) | 0 (0.0%) |
| High School Diploma | 242 (72.0%) | 40 (12.0%) |
| College / Associate Degree | 450 (73.3%) | 41 (6.7%) |
| Bachelor's Degree or higher | 123 (76.4%) | 0 (0.0%) |
| Total | 867 (69.4%) | 85 (6.8%) |
Employment Occupations by Sex in Christopher
Management, Business, Science and Arts Occupations
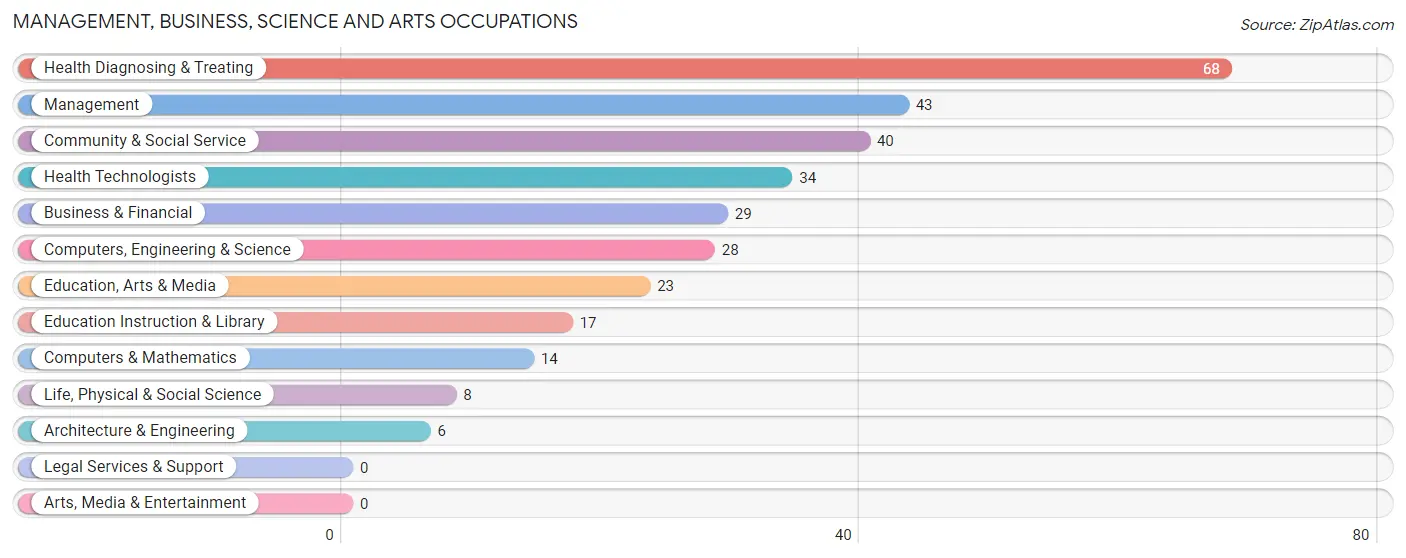
The most common Management, Business, Science and Arts occupations in Christopher are Health Diagnosing & Treating (68 | 7.2%), Management (43 | 4.5%), Community & Social Service (40 | 4.2%), Health Technologists (34 | 3.6%), and Business & Financial (29 | 3.1%).
Management, Business, Science and Arts Occupations by Sex
Within the Management, Business, Science and Arts occupations in Christopher, the most male-oriented occupations are Computers, Engineering & Science (100.0%), Computers & Mathematics (100.0%), and Architecture & Engineering (100.0%), while the most female-oriented occupations are Education, Arts & Media (100.0%), Community & Social Service (85.0%), and Business & Financial (79.3%).
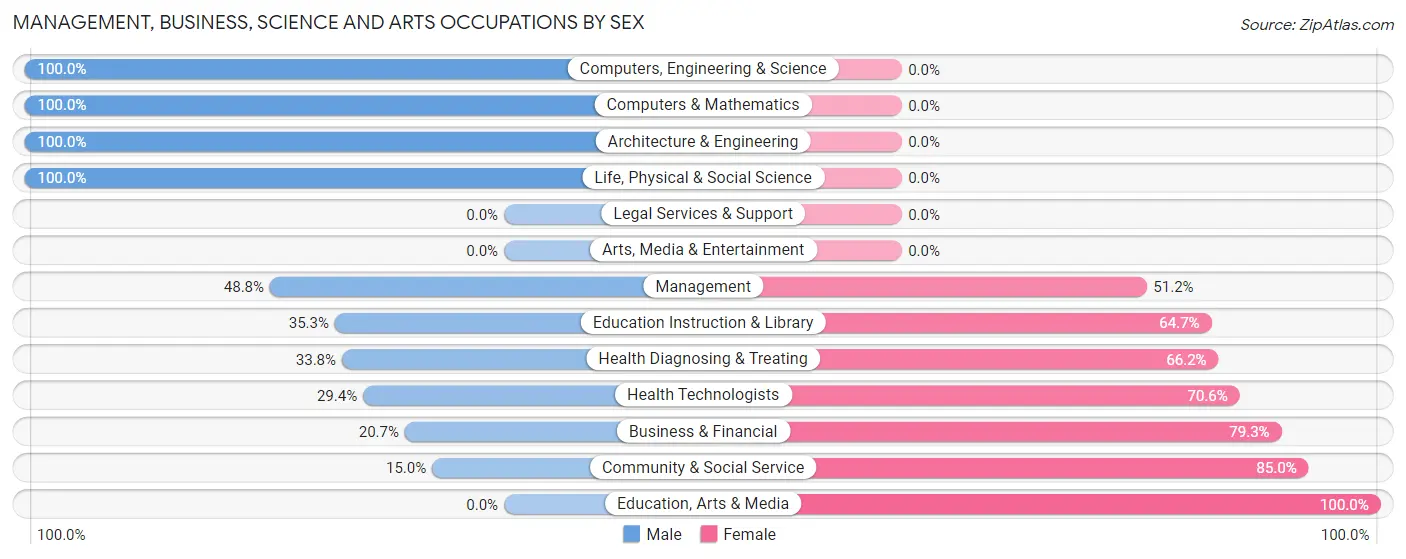
| Occupation | Male | Female |
| Management | 21 (48.8%) | 22 (51.2%) |
| Business & Financial | 6 (20.7%) | 23 (79.3%) |
| Computers, Engineering & Science | 28 (100.0%) | 0 (0.0%) |
| Computers & Mathematics | 14 (100.0%) | 0 (0.0%) |
| Architecture & Engineering | 6 (100.0%) | 0 (0.0%) |
| Life, Physical & Social Science | 8 (100.0%) | 0 (0.0%) |
| Community & Social Service | 6 (15.0%) | 34 (85.0%) |
| Education, Arts & Media | 0 (0.0%) | 23 (100.0%) |
| Legal Services & Support | 0 (0.0%) | 0 (0.0%) |
| Education Instruction & Library | 6 (35.3%) | 11 (64.7%) |
| Arts, Media & Entertainment | 0 (0.0%) | 0 (0.0%) |
| Health Diagnosing & Treating | 23 (33.8%) | 45 (66.2%) |
| Health Technologists | 10 (29.4%) | 24 (70.6%) |
| Total (Category) | 84 (40.4%) | 124 (59.6%) |
| Total (Overall) | 441 (46.6%) | 506 (53.4%) |
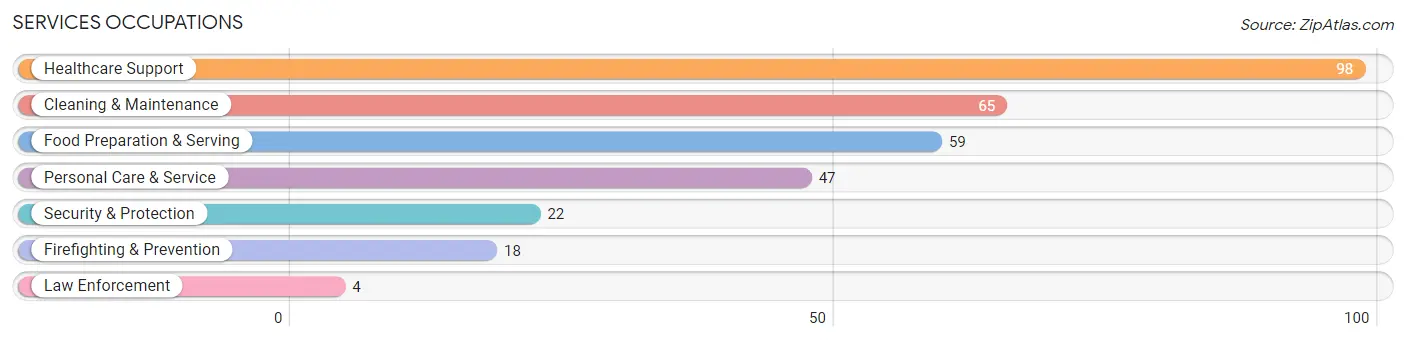
Services Occupations
The most common Services occupations in Christopher are Healthcare Support (98 | 10.3%), Cleaning & Maintenance (65 | 6.9%), Food Preparation & Serving (59 | 6.2%), Personal Care & Service (47 | 5.0%), and Security & Protection (22 | 2.3%).
Services Occupations by Sex
Within the Services occupations in Christopher, the most male-oriented occupations are Law Enforcement (100.0%), Cleaning & Maintenance (76.9%), and Security & Protection (54.5%), while the most female-oriented occupations are Personal Care & Service (100.0%), Healthcare Support (94.9%), and Food Preparation & Serving (64.4%).
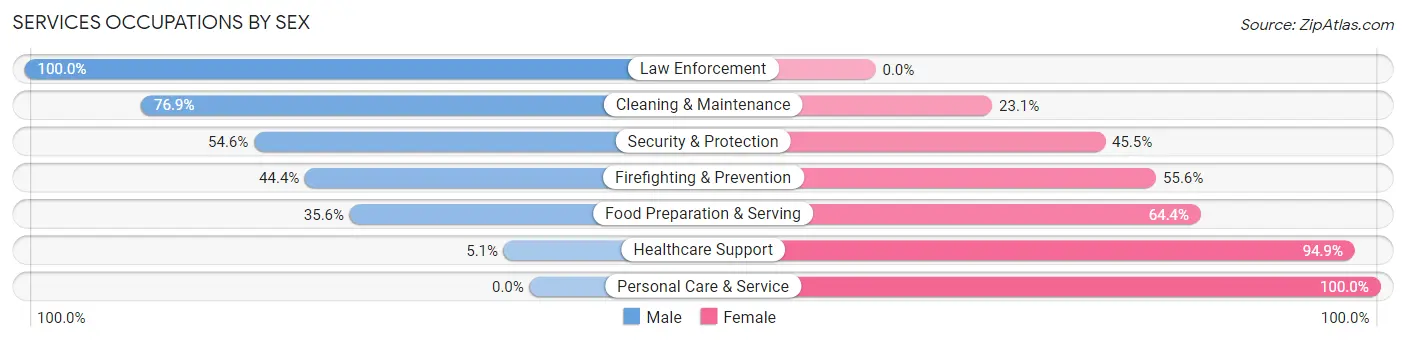
| Occupation | Male | Female |
| Healthcare Support | 5 (5.1%) | 93 (94.9%) |
| Security & Protection | 12 (54.5%) | 10 (45.5%) |
| Firefighting & Prevention | 8 (44.4%) | 10 (55.6%) |
| Law Enforcement | 4 (100.0%) | 0 (0.0%) |
| Food Preparation & Serving | 21 (35.6%) | 38 (64.4%) |
| Cleaning & Maintenance | 50 (76.9%) | 15 (23.1%) |
| Personal Care & Service | 0 (0.0%) | 47 (100.0%) |
| Total (Category) | 88 (30.2%) | 203 (69.8%) |
| Total (Overall) | 441 (46.6%) | 506 (53.4%) |
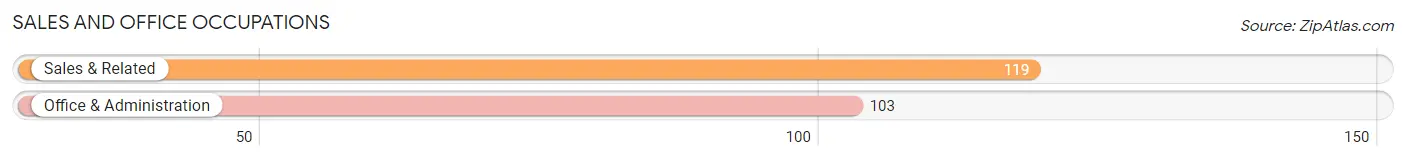
Sales and Office Occupations
The most common Sales and Office occupations in Christopher are Sales & Related (119 | 12.6%), and Office & Administration (103 | 10.9%).
Sales and Office Occupations by Sex
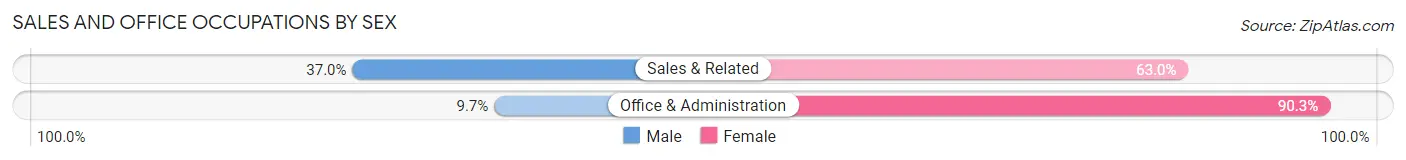
| Occupation | Male | Female |
| Sales & Related | 44 (37.0%) | 75 (63.0%) |
| Office & Administration | 10 (9.7%) | 93 (90.3%) |
| Total (Category) | 54 (24.3%) | 168 (75.7%) |
| Total (Overall) | 441 (46.6%) | 506 (53.4%) |
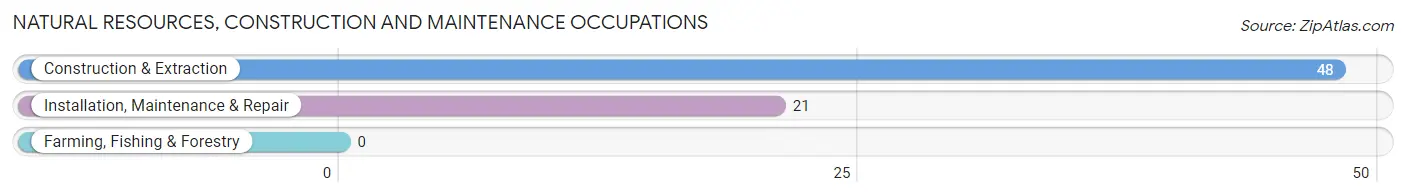
Natural Resources, Construction and Maintenance Occupations
The most common Natural Resources, Construction and Maintenance occupations in Christopher are Construction & Extraction (48 | 5.1%), and Installation, Maintenance & Repair (21 | 2.2%).
Natural Resources, Construction and Maintenance Occupations by Sex
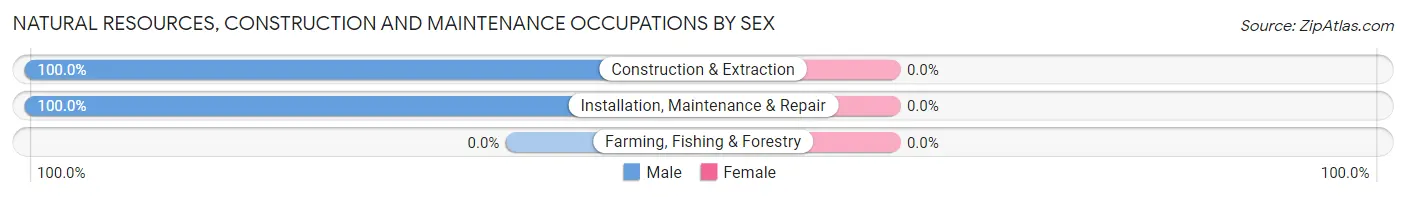
| Occupation | Male | Female |
| Farming, Fishing & Forestry | 0 (0.0%) | 0 (0.0%) |
| Construction & Extraction | 48 (100.0%) | 0 (0.0%) |
| Installation, Maintenance & Repair | 21 (100.0%) | 0 (0.0%) |
| Total (Category) | 69 (100.0%) | 0 (0.0%) |
| Total (Overall) | 441 (46.6%) | 506 (53.4%) |
Production, Transportation and Moving Occupations
The most common Production, Transportation and Moving occupations in Christopher are Production (94 | 9.9%), Material Moving (36 | 3.8%), and Transportation (27 | 2.9%).
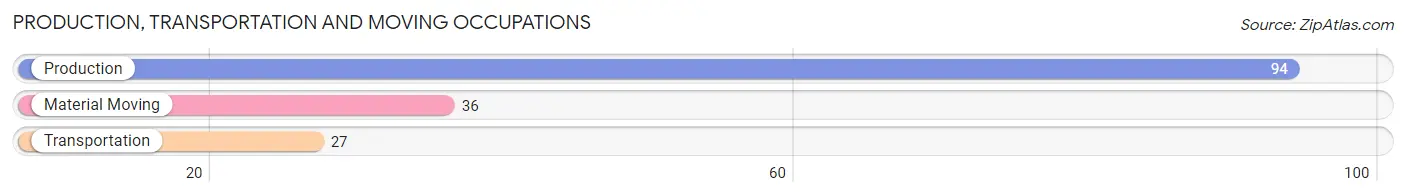
Production, Transportation and Moving Occupations by Sex
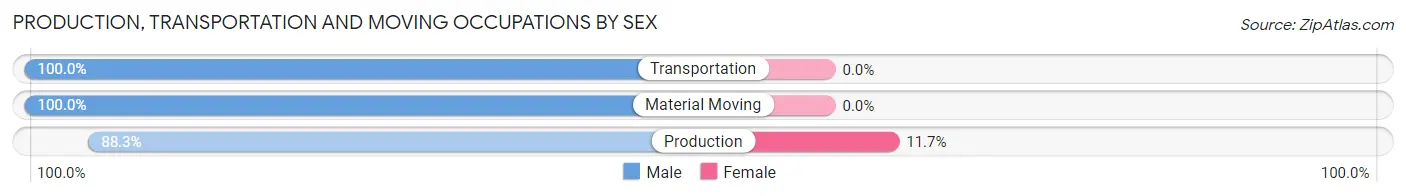
| Occupation | Male | Female |
| Production | 83 (88.3%) | 11 (11.7%) |
| Transportation | 27 (100.0%) | 0 (0.0%) |
| Material Moving | 36 (100.0%) | 0 (0.0%) |
| Total (Category) | 146 (93.0%) | 11 (7.0%) |
| Total (Overall) | 441 (46.6%) | 506 (53.4%) |
Employment Industries by Sex in Christopher
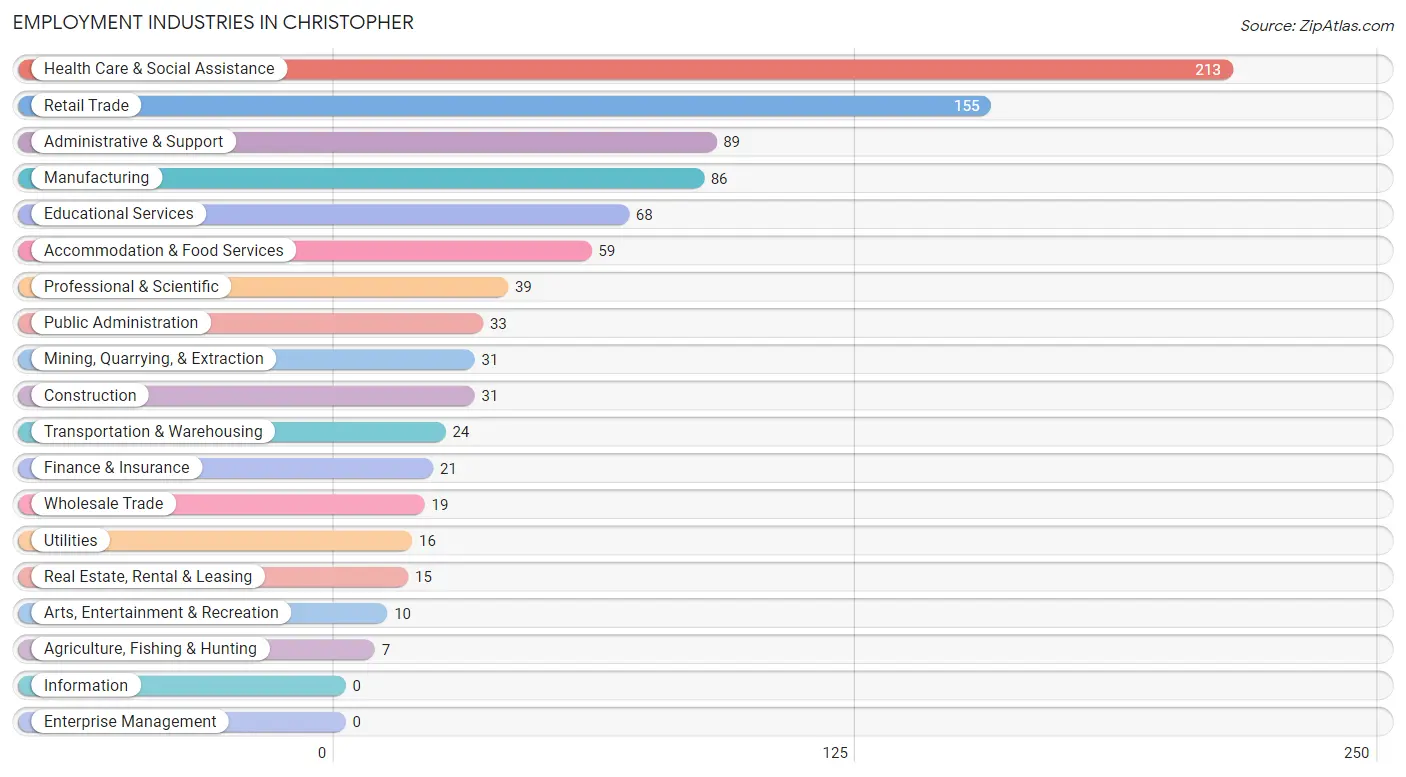
Employment Industries in Christopher
The major employment industries in Christopher include Health Care & Social Assistance (213 | 22.5%), Retail Trade (155 | 16.4%), Administrative & Support (89 | 9.4%), Manufacturing (86 | 9.1%), and Educational Services (68 | 7.2%).
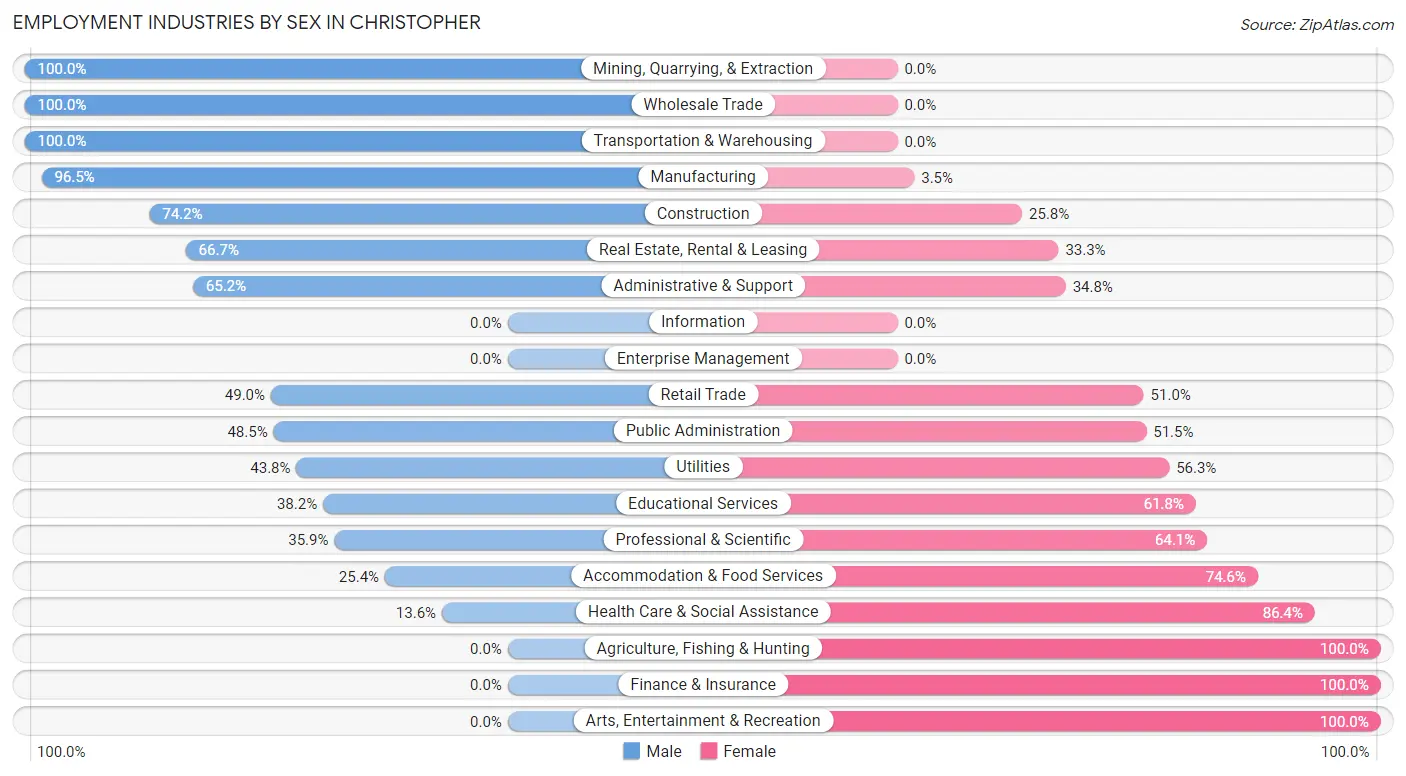
Employment Industries by Sex in Christopher
The Christopher industries that see more men than women are Mining, Quarrying, & Extraction (100.0%), Wholesale Trade (100.0%), and Transportation & Warehousing (100.0%), whereas the industries that tend to have a higher number of women are Agriculture, Fishing & Hunting (100.0%), Finance & Insurance (100.0%), and Arts, Entertainment & Recreation (100.0%).
| Industry | Male | Female |
| Agriculture, Fishing & Hunting | 0 (0.0%) | 7 (100.0%) |
| Mining, Quarrying, & Extraction | 31 (100.0%) | 0 (0.0%) |
| Construction | 23 (74.2%) | 8 (25.8%) |
| Manufacturing | 83 (96.5%) | 3 (3.5%) |
| Wholesale Trade | 19 (100.0%) | 0 (0.0%) |
| Retail Trade | 76 (49.0%) | 79 (51.0%) |
| Transportation & Warehousing | 24 (100.0%) | 0 (0.0%) |
| Utilities | 7 (43.8%) | 9 (56.2%) |
| Information | 0 (0.0%) | 0 (0.0%) |
| Finance & Insurance | 0 (0.0%) | 21 (100.0%) |
| Real Estate, Rental & Leasing | 10 (66.7%) | 5 (33.3%) |
| Professional & Scientific | 14 (35.9%) | 25 (64.1%) |
| Enterprise Management | 0 (0.0%) | 0 (0.0%) |
| Administrative & Support | 58 (65.2%) | 31 (34.8%) |
| Educational Services | 26 (38.2%) | 42 (61.8%) |
| Health Care & Social Assistance | 29 (13.6%) | 184 (86.4%) |
| Arts, Entertainment & Recreation | 0 (0.0%) | 10 (100.0%) |
| Accommodation & Food Services | 15 (25.4%) | 44 (74.6%) |
| Public Administration | 16 (48.5%) | 17 (51.5%) |
| Total | 441 (46.6%) | 506 (53.4%) |
Education in Christopher
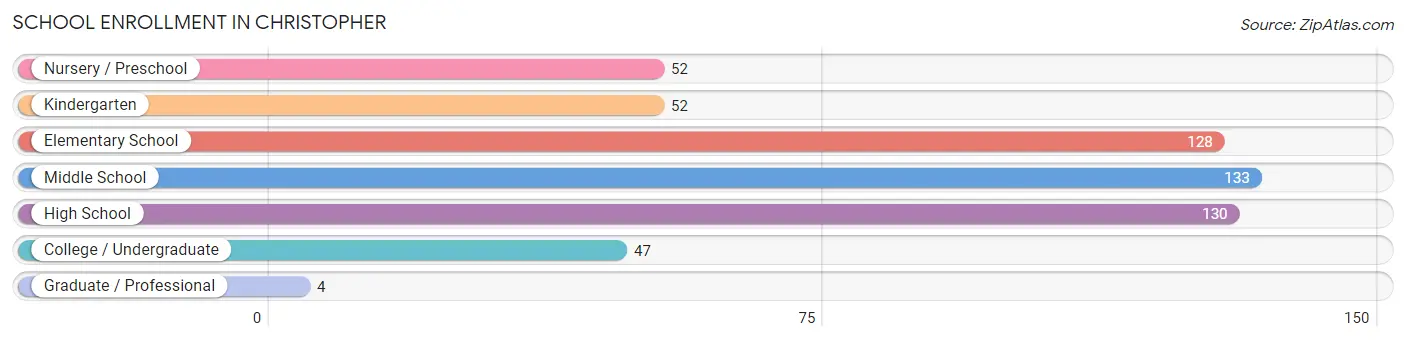
School Enrollment in Christopher
The most common levels of schooling among the 546 students in Christopher are middle school (133 | 24.4%), high school (130 | 23.8%), and elementary school (128 | 23.4%).
| School Level | # Students | % Students |
| Nursery / Preschool | 52 | 9.5% |
| Kindergarten | 52 | 9.5% |
| Elementary School | 128 | 23.4% |
| Middle School | 133 | 24.4% |
| High School | 130 | 23.8% |
| College / Undergraduate | 47 | 8.6% |
| Graduate / Professional | 4 | 0.7% |
| Total | 546 | 100.0% |
School Enrollment by Age by Funding Source in Christopher
Out of a total of 546 students who are enrolled in schools in Christopher, 14 (2.6%) attend a private institution, while the remaining 532 (97.4%) are enrolled in public schools. The age group of 25 to 34 year olds has the highest likelihood of being enrolled in private schools, with 4 (20.0% in the age bracket) enrolled. Conversely, the age group of 3 to 4 year olds has the lowest likelihood of being enrolled in a private school, with 28 (100.0% in the age bracket) attending a public institution.
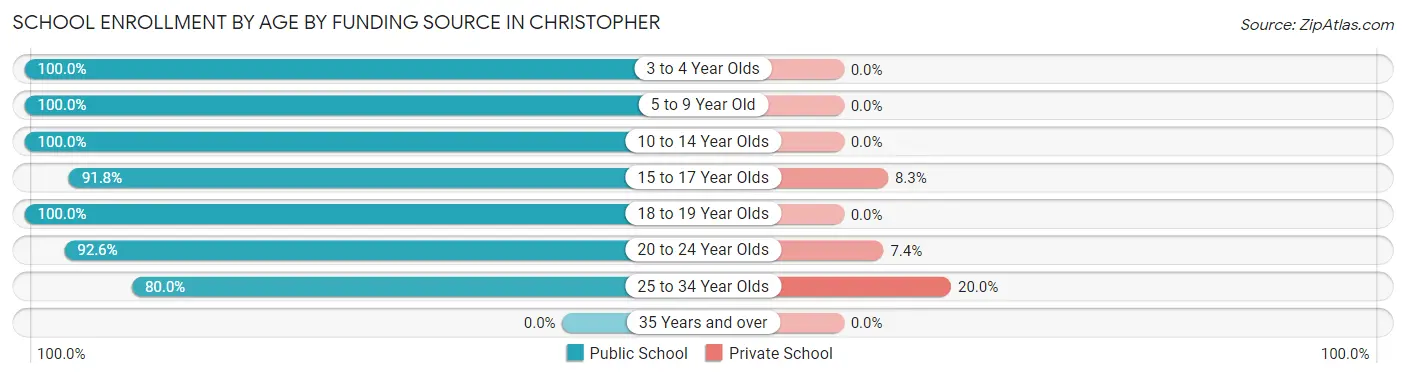
| Age Bracket | Public School | Private School |
| 3 to 4 Year Olds | 28 (100.0%) | 0 (0.0%) |
| 5 to 9 Year Old | 183 (100.0%) | 0 (0.0%) |
| 10 to 14 Year Olds | 158 (100.0%) | 0 (0.0%) |
| 15 to 17 Year Olds | 89 (91.7%) | 8 (8.3%) |
| 18 to 19 Year Olds | 33 (100.0%) | 0 (0.0%) |
| 20 to 24 Year Olds | 25 (92.6%) | 2 (7.4%) |
| 25 to 34 Year Olds | 16 (80.0%) | 4 (20.0%) |
| 35 Years and over | 0 (0.0%) | 0 (0.0%) |
| Total | 532 (97.4%) | 14 (2.6%) |
Educational Attainment by Field of Study in Christopher
Education (71 | 27.2%), science & technology (51 | 19.5%), arts & humanities (43 | 16.5%), visual & performing arts (24 | 9.2%), and business (23 | 8.8%) are the most common fields of study among 261 individuals in Christopher who have obtained a bachelor's degree or higher.
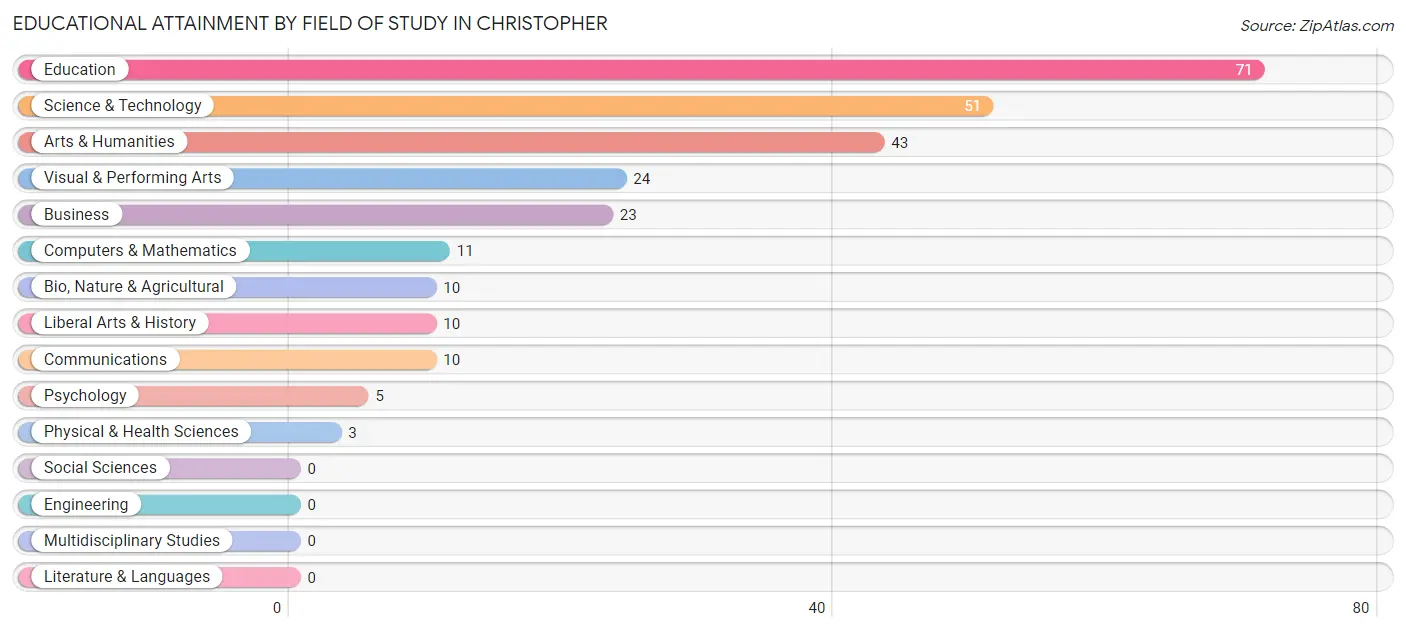
| Field of Study | # Graduates | % Graduates |
| Computers & Mathematics | 11 | 4.2% |
| Bio, Nature & Agricultural | 10 | 3.8% |
| Physical & Health Sciences | 3 | 1.1% |
| Psychology | 5 | 1.9% |
| Social Sciences | 0 | 0.0% |
| Engineering | 0 | 0.0% |
| Multidisciplinary Studies | 0 | 0.0% |
| Science & Technology | 51 | 19.5% |
| Business | 23 | 8.8% |
| Education | 71 | 27.2% |
| Literature & Languages | 0 | 0.0% |
| Liberal Arts & History | 10 | 3.8% |
| Visual & Performing Arts | 24 | 9.2% |
| Communications | 10 | 3.8% |
| Arts & Humanities | 43 | 16.5% |
| Total | 261 | 100.0% |
Transportation & Commute in Christopher
Vehicle Availability by Sex in Christopher
The most prevalent vehicle ownership categories in Christopher are males with 2 vehicles (208, accounting for 48.4%) and females with 2 vehicles (180, making up 45.3%).
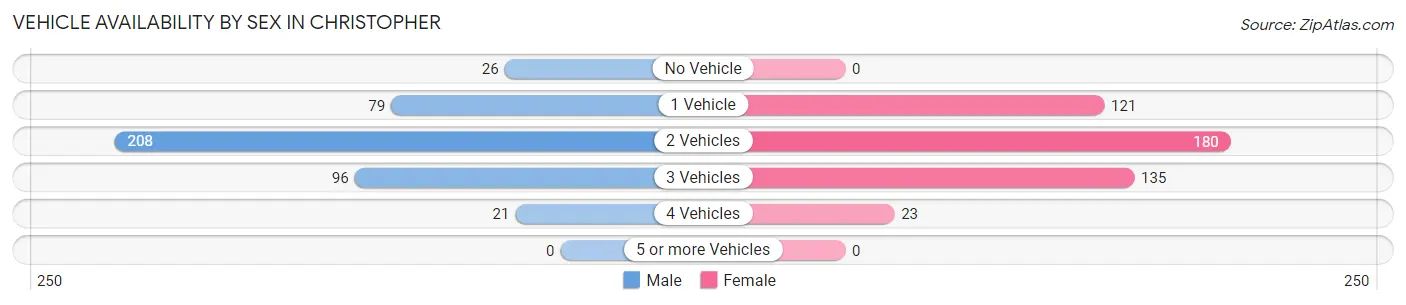
| Vehicles Available | Male | Female |
| No Vehicle | 26 (6.0%) | 0 (0.0%) |
| 1 Vehicle | 79 (18.4%) | 121 (26.4%) |
| 2 Vehicles | 208 (48.4%) | 180 (39.2%) |
| 3 Vehicles | 96 (22.3%) | 135 (29.4%) |
| 4 Vehicles | 21 (4.9%) | 23 (5.0%) |
| 5 or more Vehicles | 0 (0.0%) | 0 (0.0%) |
| Total | 430 (100.0%) | 459 (100.0%) |
Commute Time in Christopher
The most frequently occuring commute durations in Christopher are 30 to 34 minutes (146 commuters, 17.1%), 15 to 19 minutes (122 commuters, 14.2%), and less than 5 minutes (98 commuters, 11.5%).
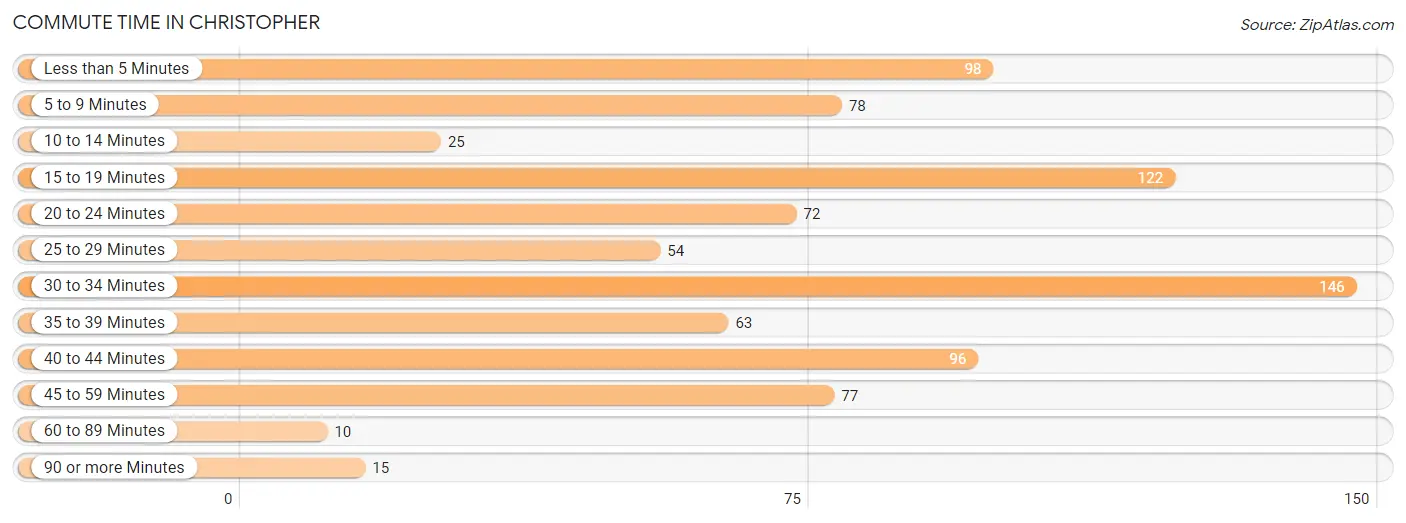
| Commute Time | # Commuters | % Commuters |
| Less than 5 Minutes | 98 | 11.5% |
| 5 to 9 Minutes | 78 | 9.1% |
| 10 to 14 Minutes | 25 | 2.9% |
| 15 to 19 Minutes | 122 | 14.2% |
| 20 to 24 Minutes | 72 | 8.4% |
| 25 to 29 Minutes | 54 | 6.3% |
| 30 to 34 Minutes | 146 | 17.1% |
| 35 to 39 Minutes | 63 | 7.4% |
| 40 to 44 Minutes | 96 | 11.2% |
| 45 to 59 Minutes | 77 | 9.0% |
| 60 to 89 Minutes | 10 | 1.2% |
| 90 or more Minutes | 15 | 1.8% |
Commute Time by Sex in Christopher
The most common commute times in Christopher are 40 to 44 minutes (78 commuters, 18.1%) for males and 30 to 34 minutes (93 commuters, 21.8%) for females.
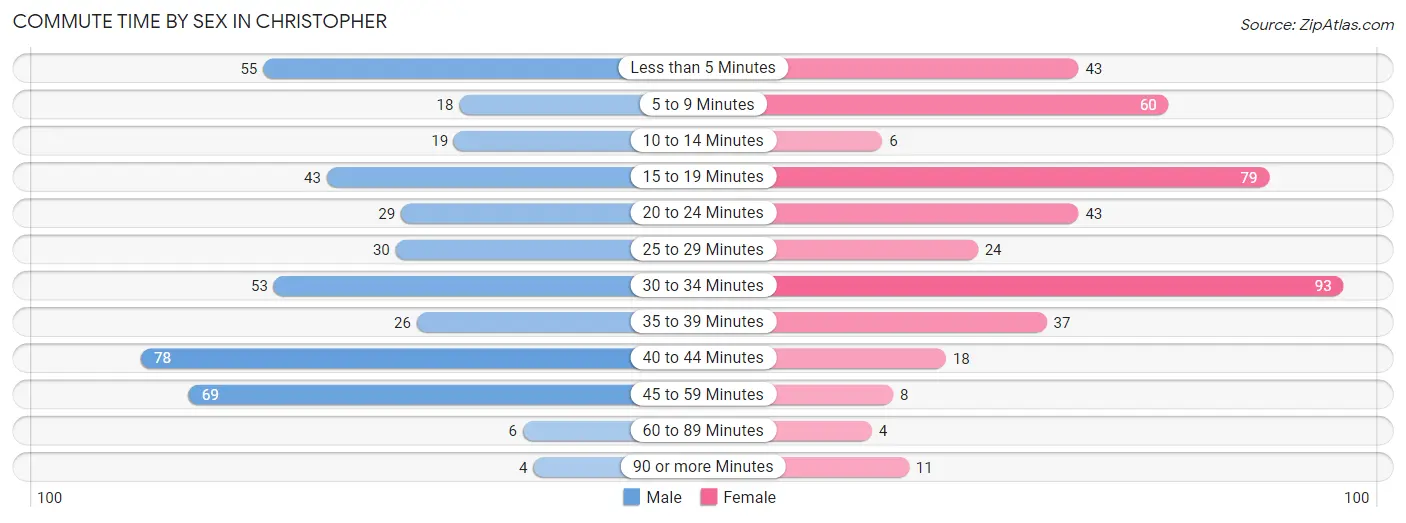
| Commute Time | Male | Female |
| Less than 5 Minutes | 55 (12.8%) | 43 (10.1%) |
| 5 to 9 Minutes | 18 (4.2%) | 60 (14.1%) |
| 10 to 14 Minutes | 19 (4.4%) | 6 (1.4%) |
| 15 to 19 Minutes | 43 (10.0%) | 79 (18.5%) |
| 20 to 24 Minutes | 29 (6.7%) | 43 (10.1%) |
| 25 to 29 Minutes | 30 (7.0%) | 24 (5.6%) |
| 30 to 34 Minutes | 53 (12.3%) | 93 (21.8%) |
| 35 to 39 Minutes | 26 (6.0%) | 37 (8.7%) |
| 40 to 44 Minutes | 78 (18.1%) | 18 (4.2%) |
| 45 to 59 Minutes | 69 (16.1%) | 8 (1.9%) |
| 60 to 89 Minutes | 6 (1.4%) | 4 (0.9%) |
| 90 or more Minutes | 4 (0.9%) | 11 (2.6%) |
Time of Departure to Work by Sex in Christopher
The most frequent times of departure to work in Christopher are 7:00 AM to 7:29 AM (81, 18.8%) for males and 7:30 AM to 7:59 AM (86, 20.2%) for females.
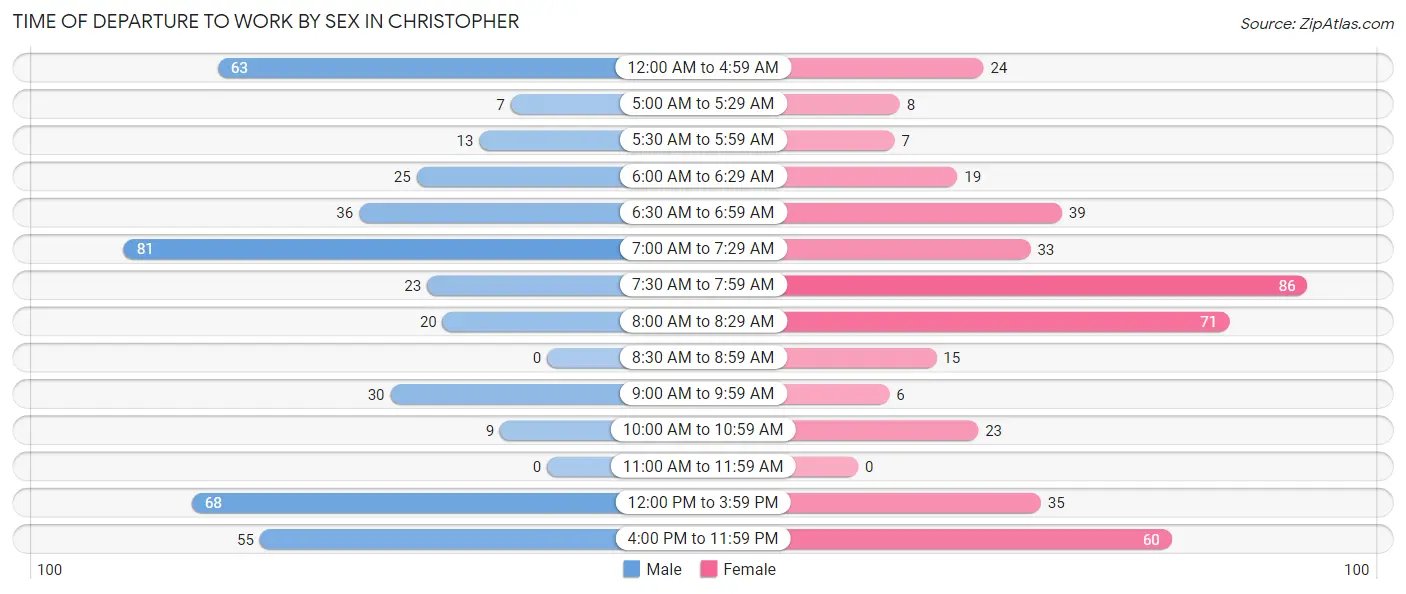
| Time of Departure | Male | Female |
| 12:00 AM to 4:59 AM | 63 (14.6%) | 24 (5.6%) |
| 5:00 AM to 5:29 AM | 7 (1.6%) | 8 (1.9%) |
| 5:30 AM to 5:59 AM | 13 (3.0%) | 7 (1.6%) |
| 6:00 AM to 6:29 AM | 25 (5.8%) | 19 (4.5%) |
| 6:30 AM to 6:59 AM | 36 (8.4%) | 39 (9.1%) |
| 7:00 AM to 7:29 AM | 81 (18.8%) | 33 (7.7%) |
| 7:30 AM to 7:59 AM | 23 (5.3%) | 86 (20.2%) |
| 8:00 AM to 8:29 AM | 20 (4.6%) | 71 (16.7%) |
| 8:30 AM to 8:59 AM | 0 (0.0%) | 15 (3.5%) |
| 9:00 AM to 9:59 AM | 30 (7.0%) | 6 (1.4%) |
| 10:00 AM to 10:59 AM | 9 (2.1%) | 23 (5.4%) |
| 11:00 AM to 11:59 AM | 0 (0.0%) | 0 (0.0%) |
| 12:00 PM to 3:59 PM | 68 (15.8%) | 35 (8.2%) |
| 4:00 PM to 11:59 PM | 55 (12.8%) | 60 (14.1%) |
| Total | 430 (100.0%) | 426 (100.0%) |
Housing Occupancy in Christopher
Occupancy by Ownership in Christopher
Of the total 1,184 dwellings in Christopher, owner-occupied units account for 806 (68.1%), while renter-occupied units make up 378 (31.9%).
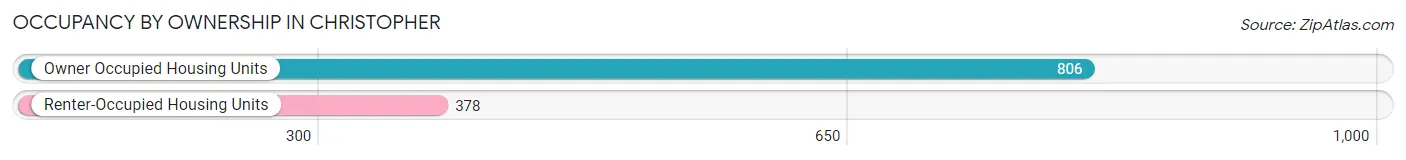
| Occupancy | # Housing Units | % Housing Units |
| Owner Occupied Housing Units | 806 | 68.1% |
| Renter-Occupied Housing Units | 378 | 31.9% |
| Total Occupied Housing Units | 1,184 | 100.0% |
Occupancy by Household Size in Christopher
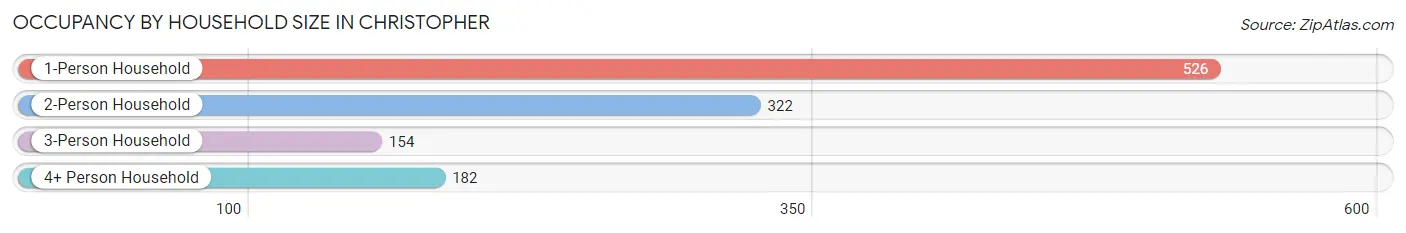
| Household Size | # Housing Units | % Housing Units |
| 1-Person Household | 526 | 44.4% |
| 2-Person Household | 322 | 27.2% |
| 3-Person Household | 154 | 13.0% |
| 4+ Person Household | 182 | 15.4% |
| Total Housing Units | 1,184 | 100.0% |
Occupancy by Ownership by Household Size in Christopher
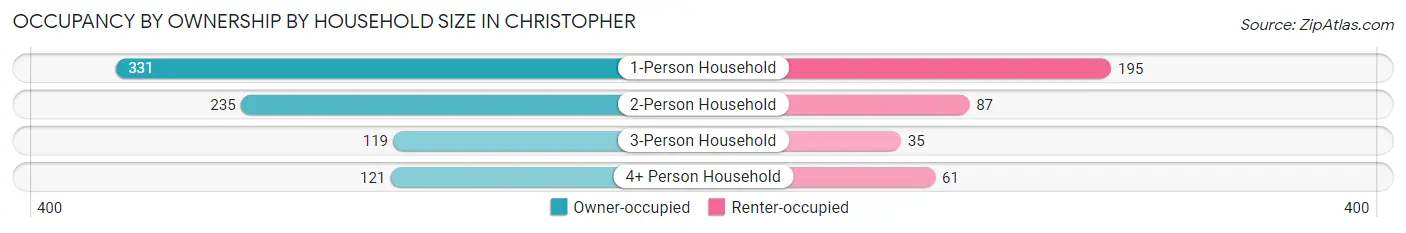
| Household Size | Owner-occupied | Renter-occupied |
| 1-Person Household | 331 (62.9%) | 195 (37.1%) |
| 2-Person Household | 235 (73.0%) | 87 (27.0%) |
| 3-Person Household | 119 (77.3%) | 35 (22.7%) |
| 4+ Person Household | 121 (66.5%) | 61 (33.5%) |
| Total Housing Units | 806 (68.1%) | 378 (31.9%) |
Occupancy by Educational Attainment in Christopher
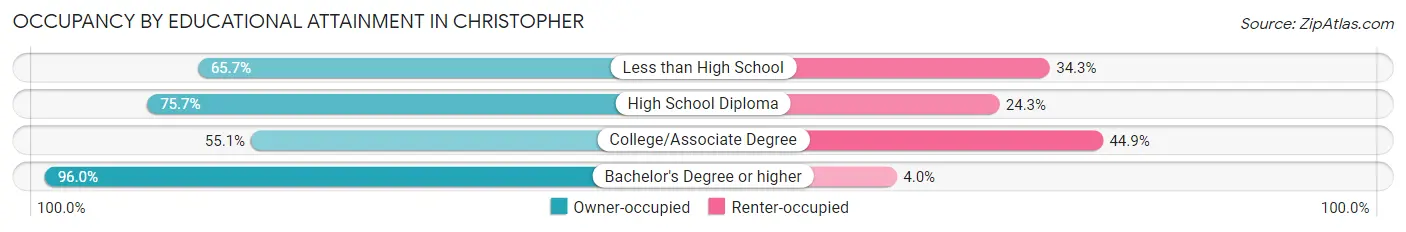
| Household Size | Owner-occupied | Renter-occupied |
| Less than High School | 88 (65.7%) | 46 (34.3%) |
| High School Diploma | 249 (75.7%) | 80 (24.3%) |
| College/Associate Degree | 301 (55.1%) | 245 (44.9%) |
| Bachelor's Degree or higher | 168 (96.0%) | 7 (4.0%) |
Occupancy by Age of Householder in Christopher
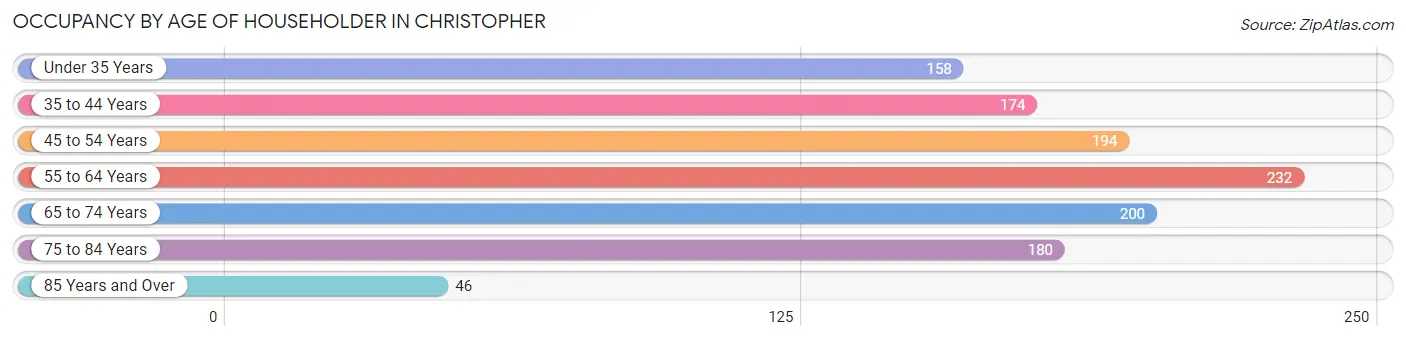
| Age Bracket | # Households | % Households |
| Under 35 Years | 158 | 13.3% |
| 35 to 44 Years | 174 | 14.7% |
| 45 to 54 Years | 194 | 16.4% |
| 55 to 64 Years | 232 | 19.6% |
| 65 to 74 Years | 200 | 16.9% |
| 75 to 84 Years | 180 | 15.2% |
| 85 Years and Over | 46 | 3.9% |
| Total | 1,184 | 100.0% |
Housing Finances in Christopher
Median Income by Occupancy in Christopher
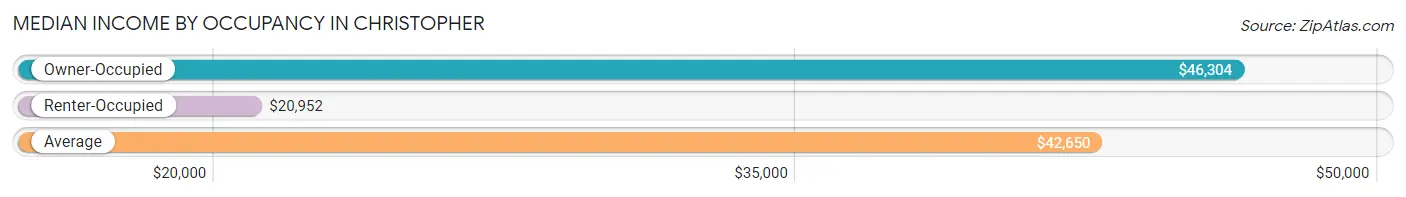
| Occupancy Type | # Households | Median Income |
| Owner-Occupied | 806 (68.1%) | $46,304 |
| Renter-Occupied | 378 (31.9%) | $20,952 |
| Average | 1,184 (100.0%) | $42,650 |
Occupancy by Householder Income Bracket in Christopher
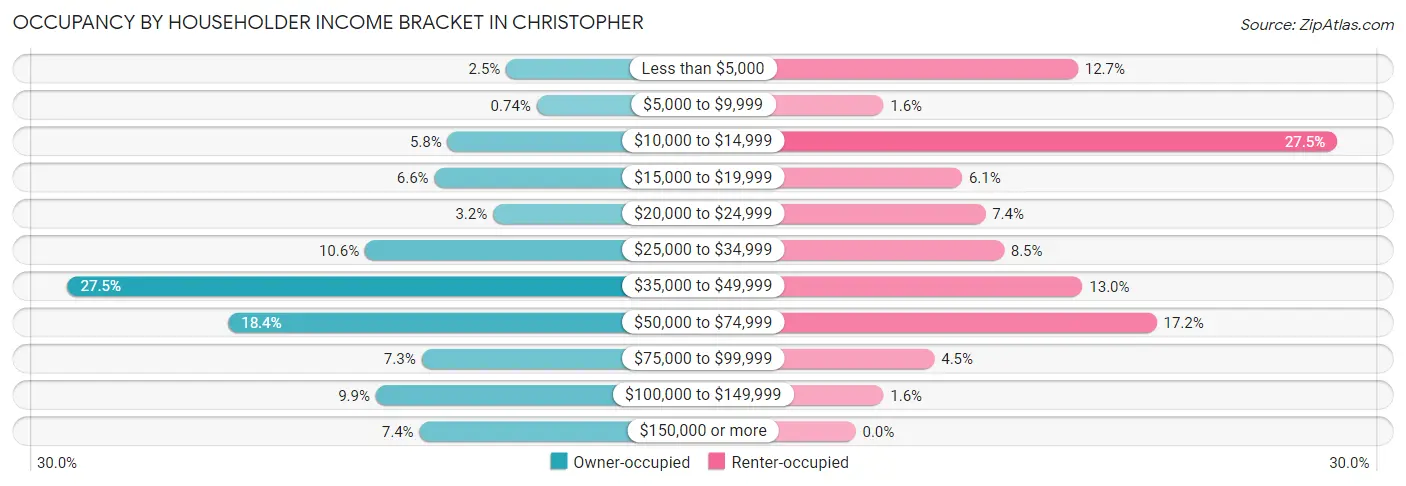
| Income Bracket | Owner-occupied | Renter-occupied |
| Less than $5,000 | 20 (2.5%) | 48 (12.7%) |
| $5,000 to $9,999 | 6 (0.7%) | 6 (1.6%) |
| $10,000 to $14,999 | 47 (5.8%) | 104 (27.5%) |
| $15,000 to $19,999 | 53 (6.6%) | 23 (6.1%) |
| $20,000 to $24,999 | 26 (3.2%) | 28 (7.4%) |
| $25,000 to $34,999 | 85 (10.5%) | 32 (8.5%) |
| $35,000 to $49,999 | 222 (27.5%) | 49 (13.0%) |
| $50,000 to $74,999 | 148 (18.4%) | 65 (17.2%) |
| $75,000 to $99,999 | 59 (7.3%) | 17 (4.5%) |
| $100,000 to $149,999 | 80 (9.9%) | 6 (1.6%) |
| $150,000 or more | 60 (7.4%) | 0 (0.0%) |
| Total | 806 (100.0%) | 378 (100.0%) |
Monthly Housing Cost Tiers in Christopher
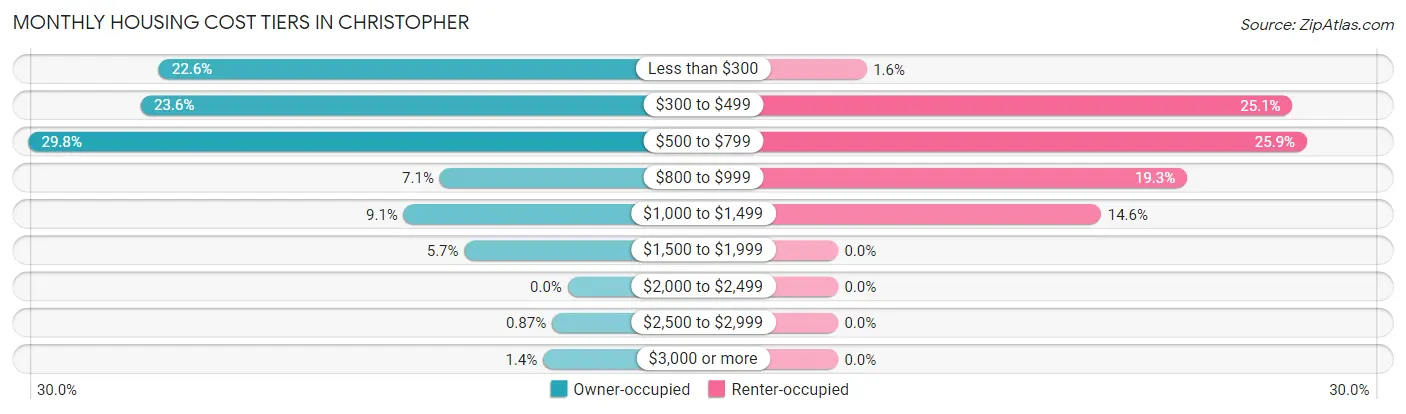
| Monthly Cost | Owner-occupied | Renter-occupied |
| Less than $300 | 182 (22.6%) | 6 (1.6%) |
| $300 to $499 | 190 (23.6%) | 95 (25.1%) |
| $500 to $799 | 240 (29.8%) | 98 (25.9%) |
| $800 to $999 | 57 (7.1%) | 73 (19.3%) |
| $1,000 to $1,499 | 73 (9.1%) | 55 (14.5%) |
| $1,500 to $1,999 | 46 (5.7%) | 0 (0.0%) |
| $2,000 to $2,499 | 0 (0.0%) | 0 (0.0%) |
| $2,500 to $2,999 | 7 (0.9%) | 0 (0.0%) |
| $3,000 or more | 11 (1.4%) | 0 (0.0%) |
| Total | 806 (100.0%) | 378 (100.0%) |
Physical Housing Characteristics in Christopher
Housing Structures in Christopher
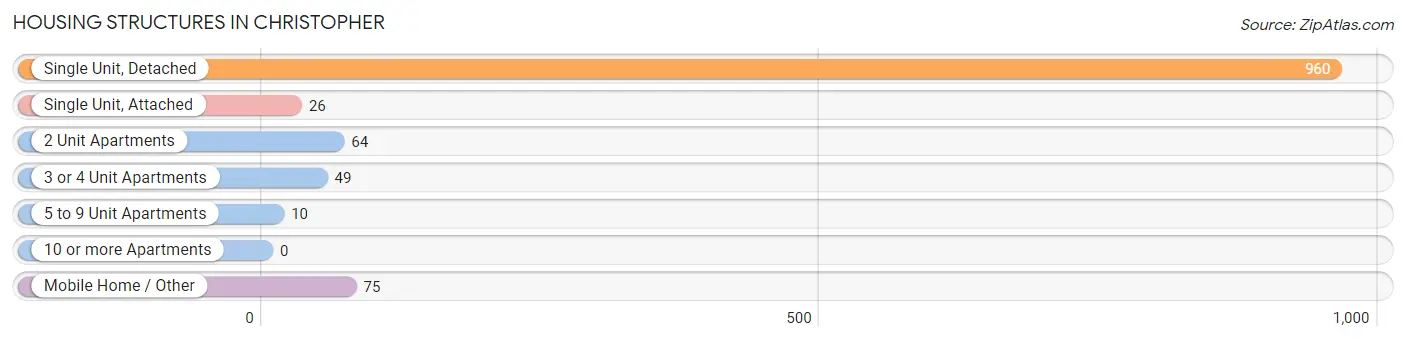
| Structure Type | # Housing Units | % Housing Units |
| Single Unit, Detached | 960 | 81.1% |
| Single Unit, Attached | 26 | 2.2% |
| 2 Unit Apartments | 64 | 5.4% |
| 3 or 4 Unit Apartments | 49 | 4.1% |
| 5 to 9 Unit Apartments | 10 | 0.8% |
| 10 or more Apartments | 0 | 0.0% |
| Mobile Home / Other | 75 | 6.3% |
| Total | 1,184 | 100.0% |
Housing Structures by Occupancy in Christopher
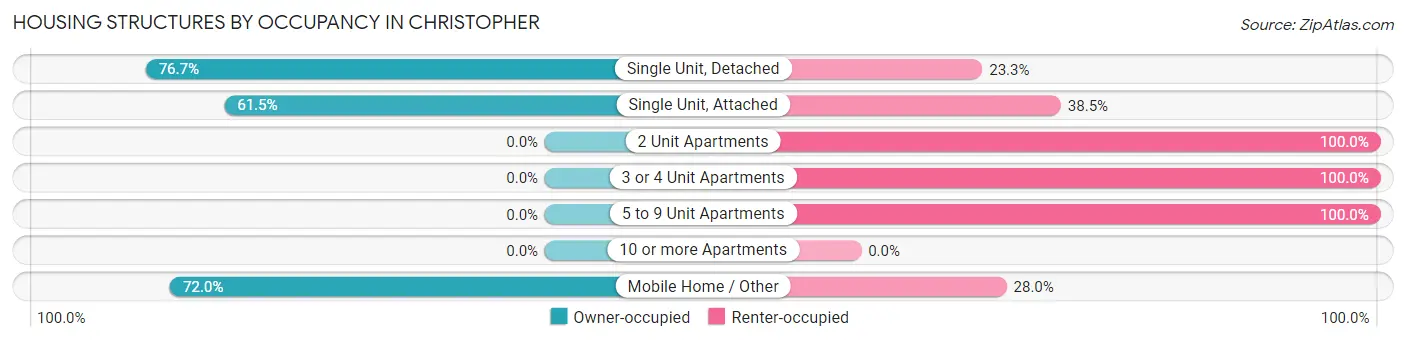
| Structure Type | Owner-occupied | Renter-occupied |
| Single Unit, Detached | 736 (76.7%) | 224 (23.3%) |
| Single Unit, Attached | 16 (61.5%) | 10 (38.5%) |
| 2 Unit Apartments | 0 (0.0%) | 64 (100.0%) |
| 3 or 4 Unit Apartments | 0 (0.0%) | 49 (100.0%) |
| 5 to 9 Unit Apartments | 0 (0.0%) | 10 (100.0%) |
| 10 or more Apartments | 0 (0.0%) | 0 (0.0%) |
| Mobile Home / Other | 54 (72.0%) | 21 (28.0%) |
| Total | 806 (68.1%) | 378 (31.9%) |
Housing Structures by Number of Rooms in Christopher
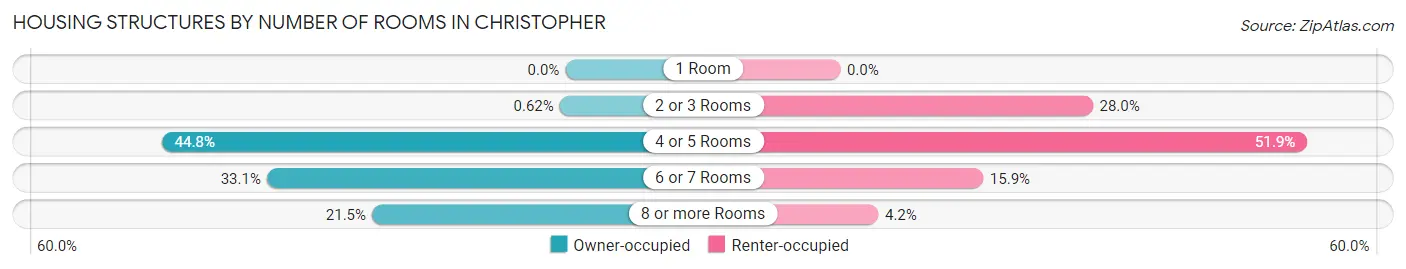
| Number of Rooms | Owner-occupied | Renter-occupied |
| 1 Room | 0 (0.0%) | 0 (0.0%) |
| 2 or 3 Rooms | 5 (0.6%) | 106 (28.0%) |
| 4 or 5 Rooms | 361 (44.8%) | 196 (51.8%) |
| 6 or 7 Rooms | 267 (33.1%) | 60 (15.9%) |
| 8 or more Rooms | 173 (21.5%) | 16 (4.2%) |
| Total | 806 (100.0%) | 378 (100.0%) |
Housing Structure by Heating Type in Christopher
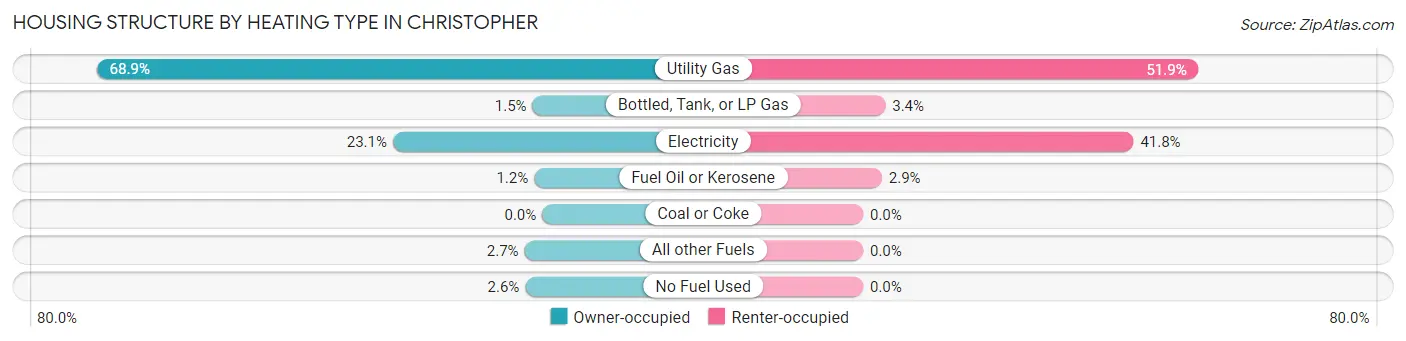
| Heating Type | Owner-occupied | Renter-occupied |
| Utility Gas | 555 (68.9%) | 196 (51.8%) |
| Bottled, Tank, or LP Gas | 12 (1.5%) | 13 (3.4%) |
| Electricity | 186 (23.1%) | 158 (41.8%) |
| Fuel Oil or Kerosene | 10 (1.2%) | 11 (2.9%) |
| Coal or Coke | 0 (0.0%) | 0 (0.0%) |
| All other Fuels | 22 (2.7%) | 0 (0.0%) |
| No Fuel Used | 21 (2.6%) | 0 (0.0%) |
| Total | 806 (100.0%) | 378 (100.0%) |
Household Vehicle Usage in Christopher
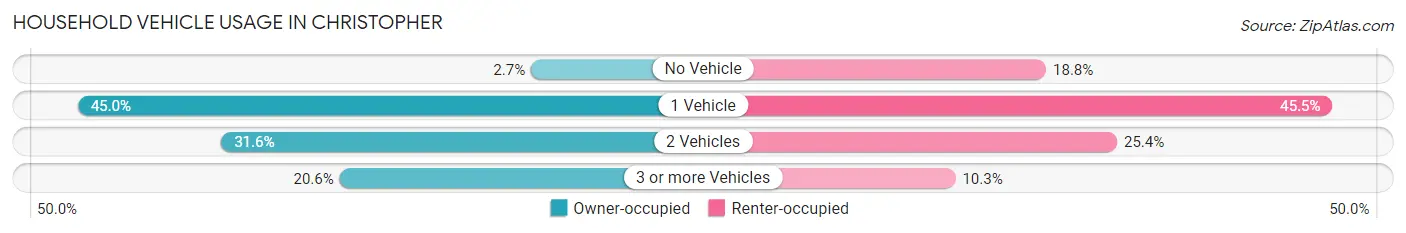
| Vehicles per Household | Owner-occupied | Renter-occupied |
| No Vehicle | 22 (2.7%) | 71 (18.8%) |
| 1 Vehicle | 363 (45.0%) | 172 (45.5%) |
| 2 Vehicles | 255 (31.6%) | 96 (25.4%) |
| 3 or more Vehicles | 166 (20.6%) | 39 (10.3%) |
| Total | 806 (100.0%) | 378 (100.0%) |
Real Estate & Mortgages in Christopher
Real Estate and Mortgage Overview in Christopher
| Characteristic | Without Mortgage | With Mortgage |
| Housing Units | 527 | 279 |
| Median Property Value | $59,600 | $83,500 |
| Median Household Income | $45,116 | $19 |
| Monthly Housing Costs | $385 | $11 |
| Real Estate Taxes | $1,101 | $11 |
Property Value by Mortgage Status in Christopher
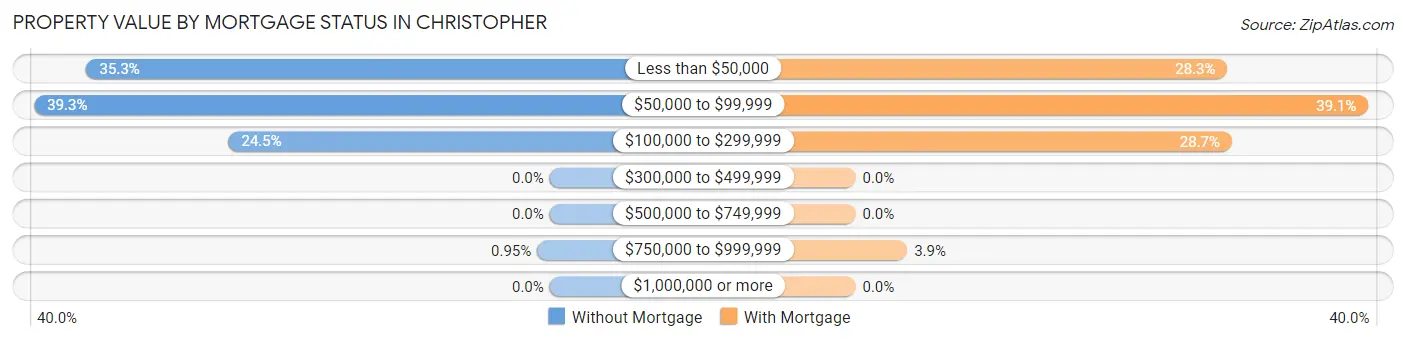
| Property Value | Without Mortgage | With Mortgage |
| Less than $50,000 | 186 (35.3%) | 79 (28.3%) |
| $50,000 to $99,999 | 207 (39.3%) | 109 (39.1%) |
| $100,000 to $299,999 | 129 (24.5%) | 80 (28.7%) |
| $300,000 to $499,999 | 0 (0.0%) | 0 (0.0%) |
| $500,000 to $749,999 | 0 (0.0%) | 0 (0.0%) |
| $750,000 to $999,999 | 5 (0.9%) | 11 (3.9%) |
| $1,000,000 or more | 0 (0.0%) | 0 (0.0%) |
| Total | 527 (100.0%) | 279 (100.0%) |
Household Income by Mortgage Status in Christopher
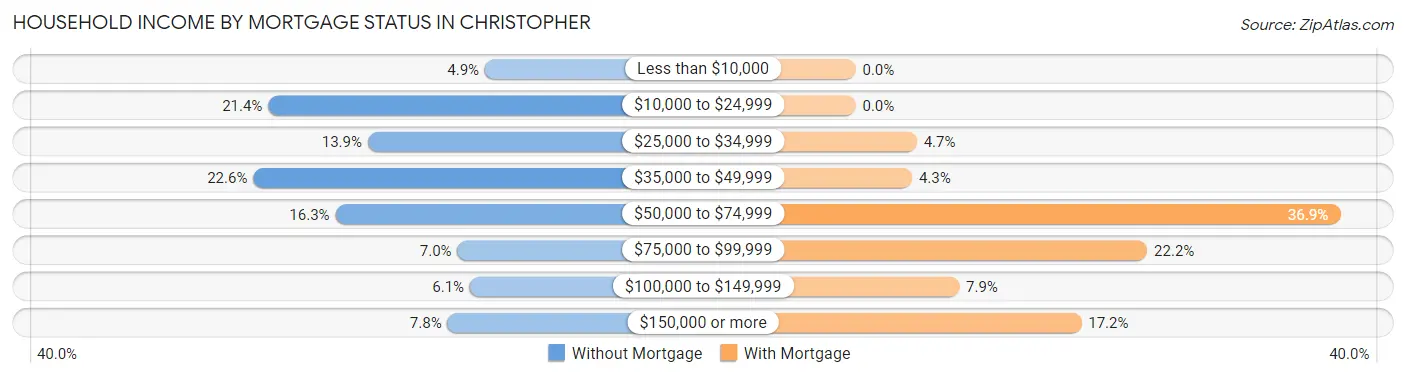
| Household Income | Without Mortgage | With Mortgage |
| Less than $10,000 | 26 (4.9%) | 0 (0.0%) |
| $10,000 to $24,999 | 113 (21.4%) | 0 (0.0%) |
| $25,000 to $34,999 | 73 (13.9%) | 13 (4.7%) |
| $35,000 to $49,999 | 119 (22.6%) | 12 (4.3%) |
| $50,000 to $74,999 | 86 (16.3%) | 103 (36.9%) |
| $75,000 to $99,999 | 37 (7.0%) | 62 (22.2%) |
| $100,000 to $149,999 | 32 (6.1%) | 22 (7.9%) |
| $150,000 or more | 41 (7.8%) | 48 (17.2%) |
| Total | 527 (100.0%) | 279 (100.0%) |
Property Value to Household Income Ratio in Christopher
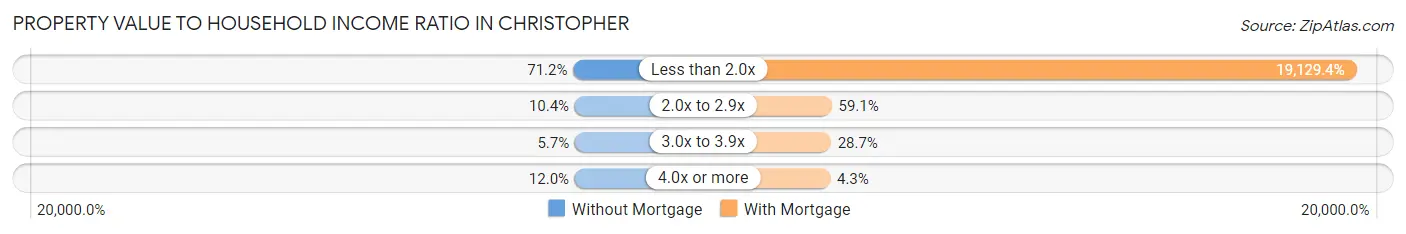
| Value-to-Income Ratio | Without Mortgage | With Mortgage |
| Less than 2.0x | 375 (71.2%) | 53,371 (19,129.4%) |
| 2.0x to 2.9x | 55 (10.4%) | 165 (59.1%) |
| 3.0x to 3.9x | 30 (5.7%) | 80 (28.7%) |
| 4.0x or more | 63 (11.9%) | 12 (4.3%) |
| Total | 527 (100.0%) | 279 (100.0%) |
Real Estate Taxes by Mortgage Status in Christopher
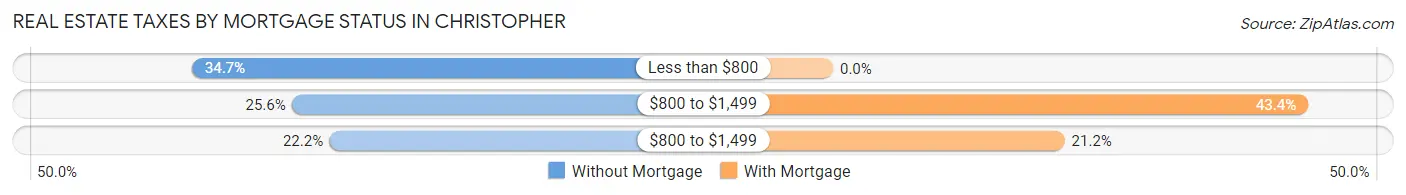
| Property Taxes | Without Mortgage | With Mortgage |
| Less than $800 | 183 (34.7%) | 0 (0.0%) |
| $800 to $1,499 | 135 (25.6%) | 121 (43.4%) |
| $800 to $1,499 | 117 (22.2%) | 59 (21.1%) |
| Total | 527 (100.0%) | 279 (100.0%) |
Health & Disability in Christopher
Health Insurance Coverage by Age in Christopher
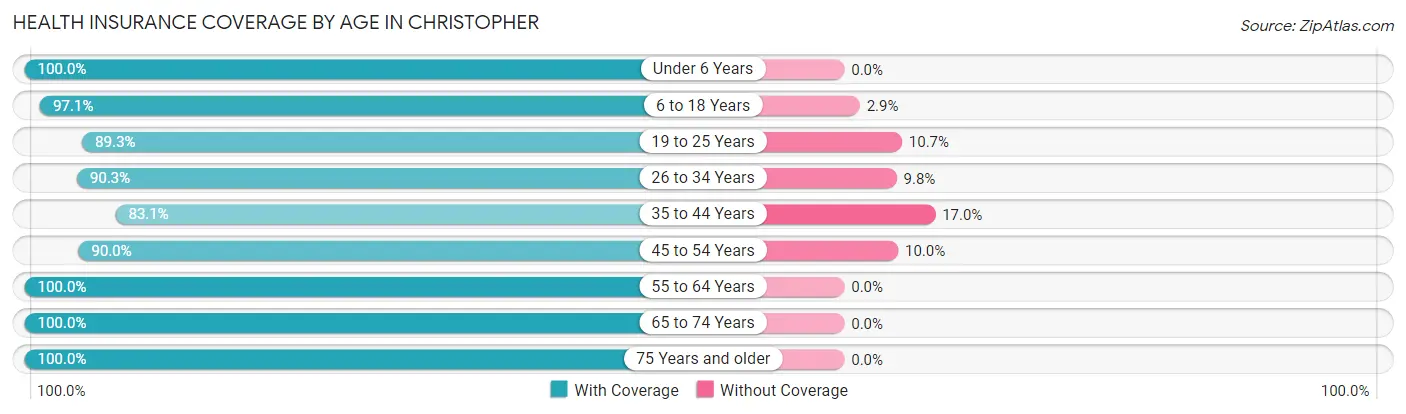
| Age Bracket | With Coverage | Without Coverage |
| Under 6 Years | 158 (100.0%) | 0 (0.0%) |
| 6 to 18 Years | 439 (97.1%) | 13 (2.9%) |
| 19 to 25 Years | 133 (89.3%) | 16 (10.7%) |
| 26 to 34 Years | 250 (90.2%) | 27 (9.8%) |
| 35 to 44 Years | 245 (83.1%) | 50 (17.0%) |
| 45 to 54 Years | 296 (90.0%) | 33 (10.0%) |
| 55 to 64 Years | 306 (100.0%) | 0 (0.0%) |
| 65 to 74 Years | 277 (100.0%) | 0 (0.0%) |
| 75 Years and older | 257 (100.0%) | 0 (0.0%) |
| Total | 2,361 (94.4%) | 139 (5.6%) |
Health Insurance Coverage by Citizenship Status in Christopher
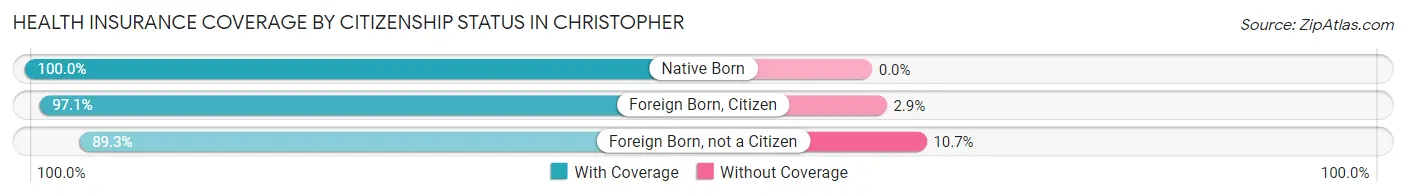
| Citizenship Status | With Coverage | Without Coverage |
| Native Born | 158 (100.0%) | 0 (0.0%) |
| Foreign Born, Citizen | 439 (97.1%) | 13 (2.9%) |
| Foreign Born, not a Citizen | 133 (89.3%) | 16 (10.7%) |
Health Insurance Coverage by Household Income in Christopher
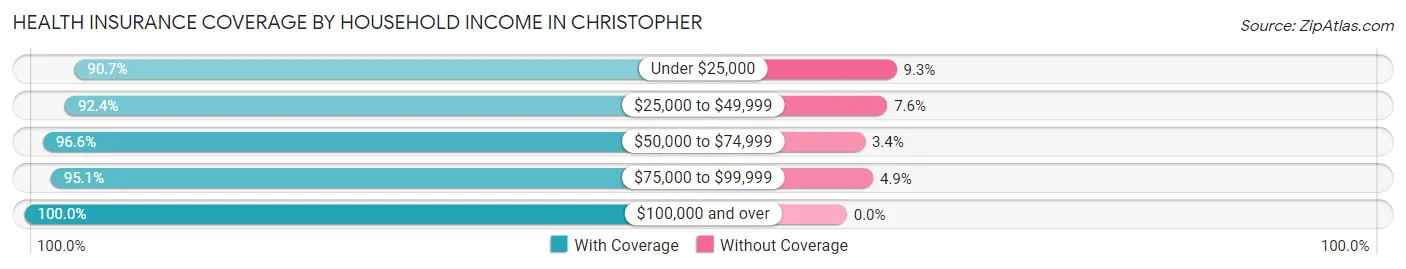
| Household Income | With Coverage | Without Coverage |
| Under $25,000 | 477 (90.7%) | 49 (9.3%) |
| $25,000 to $49,999 | 720 (92.4%) | 59 (7.6%) |
| $50,000 to $74,999 | 538 (96.6%) | 19 (3.4%) |
| $75,000 to $99,999 | 232 (95.1%) | 12 (4.9%) |
| $100,000 and over | 394 (100.0%) | 0 (0.0%) |
Public vs Private Health Insurance Coverage by Age in Christopher
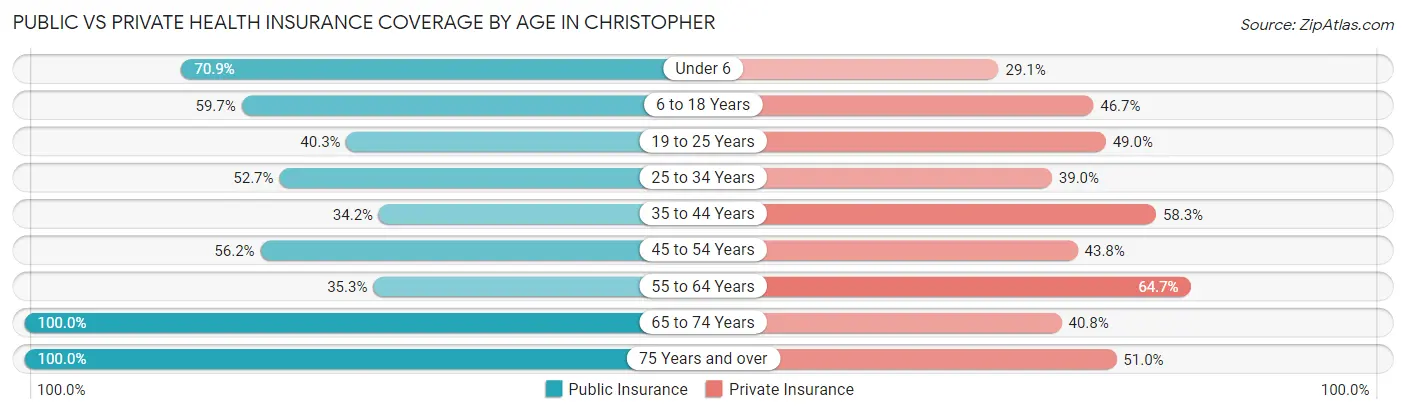
| Age Bracket | Public Insurance | Private Insurance |
| Under 6 | 112 (70.9%) | 46 (29.1%) |
| 6 to 18 Years | 270 (59.7%) | 211 (46.7%) |
| 19 to 25 Years | 60 (40.3%) | 73 (49.0%) |
| 25 to 34 Years | 146 (52.7%) | 108 (39.0%) |
| 35 to 44 Years | 101 (34.2%) | 172 (58.3%) |
| 45 to 54 Years | 185 (56.2%) | 144 (43.8%) |
| 55 to 64 Years | 108 (35.3%) | 198 (64.7%) |
| 65 to 74 Years | 277 (100.0%) | 113 (40.8%) |
| 75 Years and over | 257 (100.0%) | 131 (51.0%) |
| Total | 1,516 (60.6%) | 1,196 (47.8%) |
Disability Status by Sex by Age in Christopher
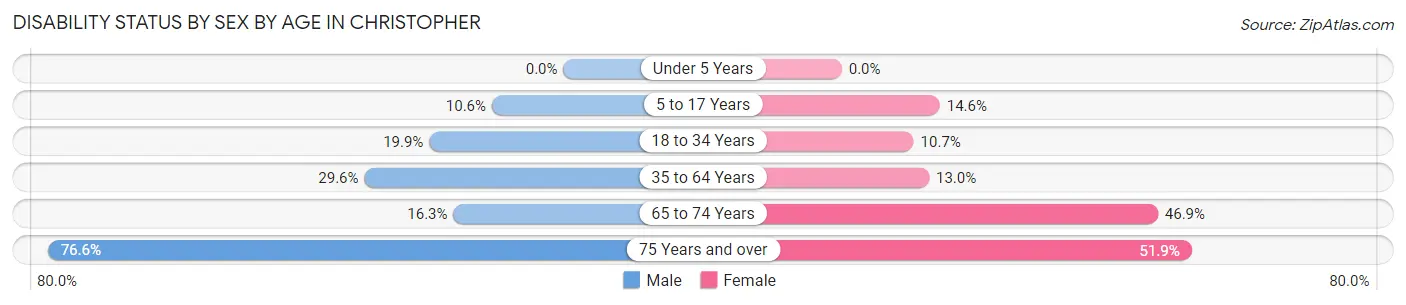
| Age Bracket | Male | Female |
| Under 5 Years | 0 (0.0%) | 0 (0.0%) |
| 5 to 17 Years | 24 (10.6%) | 32 (14.5%) |
| 18 to 34 Years | 47 (19.9%) | 24 (10.7%) |
| 35 to 64 Years | 138 (29.5%) | 60 (13.0%) |
| 65 to 74 Years | 16 (16.3%) | 84 (46.9%) |
| 75 Years and over | 98 (76.6%) | 67 (51.9%) |
Disability Class by Sex by Age in Christopher
Disability Class: Hearing Difficulty
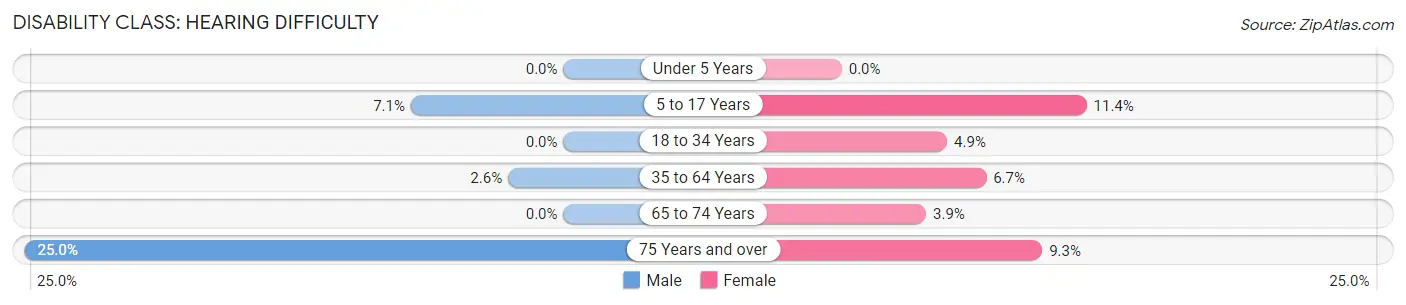
| Age Bracket | Male | Female |
| Under 5 Years | 0 (0.0%) | 0 (0.0%) |
| 5 to 17 Years | 16 (7.1%) | 25 (11.4%) |
| 18 to 34 Years | 0 (0.0%) | 11 (4.9%) |
| 35 to 64 Years | 12 (2.6%) | 31 (6.7%) |
| 65 to 74 Years | 0 (0.0%) | 7 (3.9%) |
| 75 Years and over | 32 (25.0%) | 12 (9.3%) |
Disability Class: Vision Difficulty
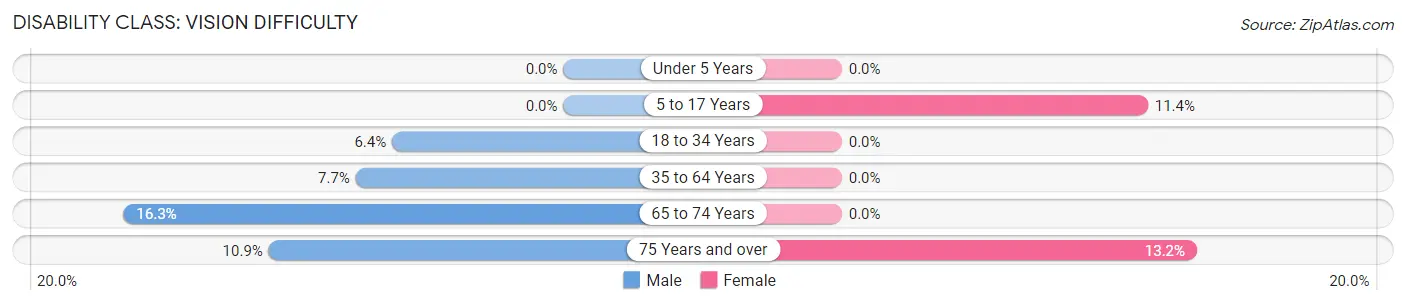
| Age Bracket | Male | Female |
| Under 5 Years | 0 (0.0%) | 0 (0.0%) |
| 5 to 17 Years | 0 (0.0%) | 25 (11.4%) |
| 18 to 34 Years | 15 (6.4%) | 0 (0.0%) |
| 35 to 64 Years | 36 (7.7%) | 0 (0.0%) |
| 65 to 74 Years | 16 (16.3%) | 0 (0.0%) |
| 75 Years and over | 14 (10.9%) | 17 (13.2%) |
Disability Class: Cognitive Difficulty
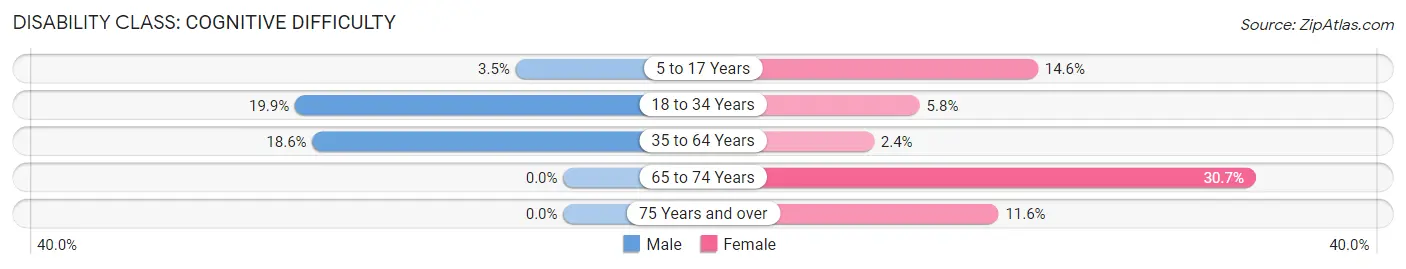
| Age Bracket | Male | Female |
| 5 to 17 Years | 8 (3.5%) | 32 (14.5%) |
| 18 to 34 Years | 47 (19.9%) | 13 (5.8%) |
| 35 to 64 Years | 87 (18.6%) | 11 (2.4%) |
| 65 to 74 Years | 0 (0.0%) | 55 (30.7%) |
| 75 Years and over | 0 (0.0%) | 15 (11.6%) |
Disability Class: Ambulatory Difficulty
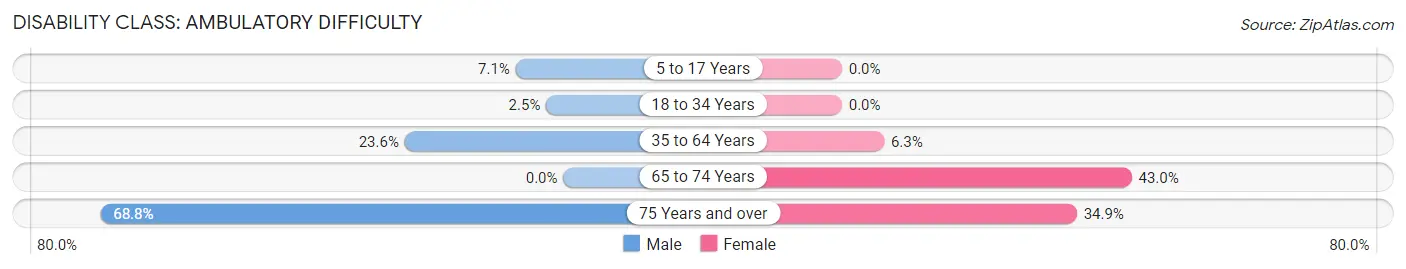
| Age Bracket | Male | Female |
| 5 to 17 Years | 16 (7.1%) | 0 (0.0%) |
| 18 to 34 Years | 6 (2.5%) | 0 (0.0%) |
| 35 to 64 Years | 110 (23.5%) | 29 (6.3%) |
| 65 to 74 Years | 0 (0.0%) | 77 (43.0%) |
| 75 Years and over | 88 (68.8%) | 45 (34.9%) |
Disability Class: Self-Care Difficulty
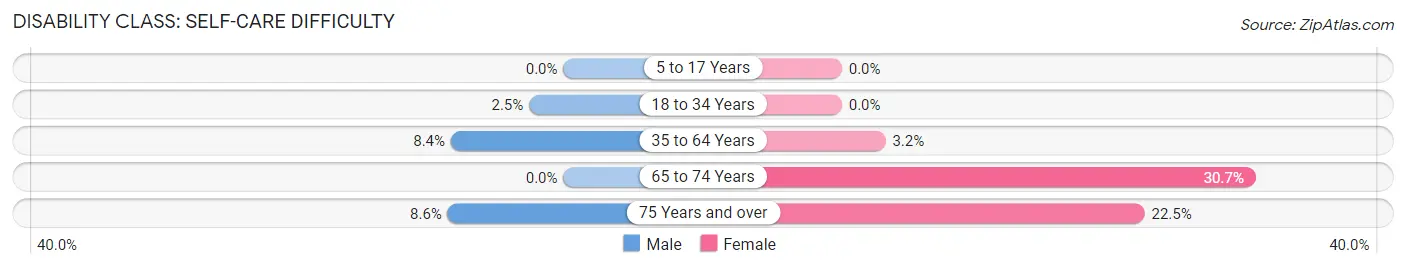
| Age Bracket | Male | Female |
| 5 to 17 Years | 0 (0.0%) | 0 (0.0%) |
| 18 to 34 Years | 6 (2.5%) | 0 (0.0%) |
| 35 to 64 Years | 39 (8.4%) | 15 (3.2%) |
| 65 to 74 Years | 0 (0.0%) | 55 (30.7%) |
| 75 Years and over | 11 (8.6%) | 29 (22.5%) |
Technology Access in Christopher
Computing Device Access in Christopher
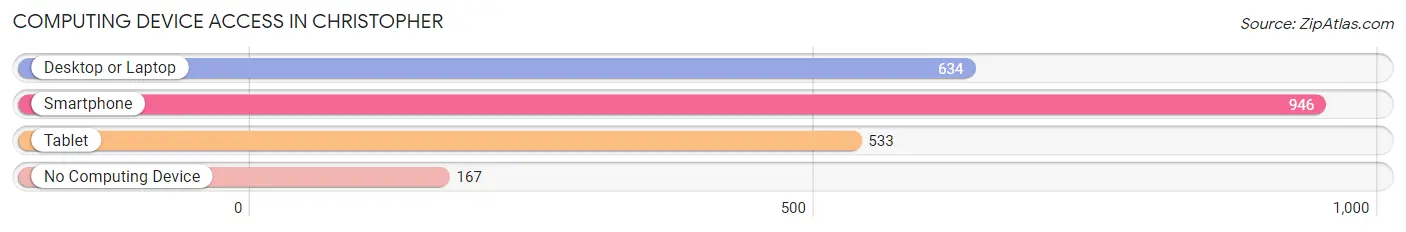
| Device Type | # Households | % Households |
| Desktop or Laptop | 634 | 53.5% |
| Smartphone | 946 | 79.9% |
| Tablet | 533 | 45.0% |
| No Computing Device | 167 | 14.1% |
| Total | 1,184 | 100.0% |
Internet Access in Christopher
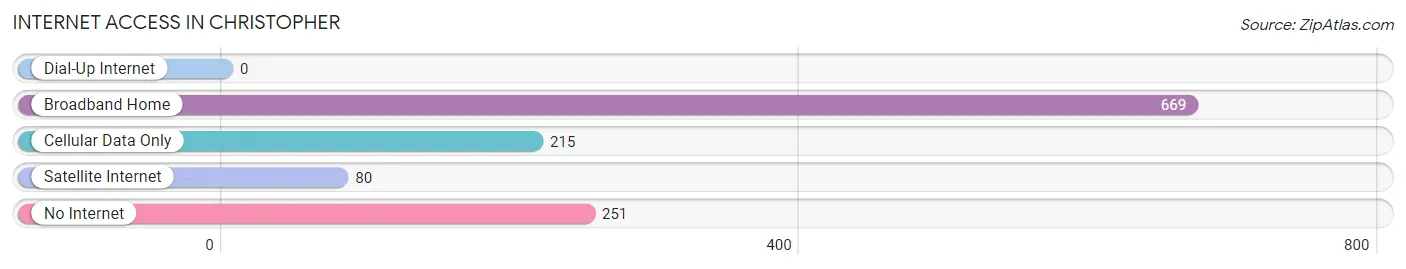
| Internet Type | # Households | % Households |
| Dial-Up Internet | 0 | 0.0% |
| Broadband Home | 669 | 56.5% |
| Cellular Data Only | 215 | 18.2% |
| Satellite Internet | 80 | 6.8% |
| No Internet | 251 | 21.2% |
| Total | 1,184 | 100.0% |
Christopher Summary
Christopher, Illinois is a small city located in Franklin County, in the southern part of the state. It is situated on the banks of the Big Muddy River, and is home to a population of just over 2,000 people. The city was founded in 1858, and has a rich history that is intertwined with the development of the region.
Geography
Christopher is located in the southern part of Illinois, in Franklin County. It is situated on the banks of the Big Muddy River, and is surrounded by rolling hills and farmland. The city is located about 30 miles from the state capital of Springfield, and is part of the St. Louis metropolitan area. The city has a total area of 1.2 square miles, all of which is land.
Economy
The economy of Christopher is largely based on agriculture and manufacturing. The city is home to several large farms, which produce a variety of crops, including corn, soybeans, and wheat. The city also has several manufacturing plants, which produce a variety of products, including furniture, clothing, and automotive parts. The city also has a thriving tourism industry, with many visitors coming to the area to enjoy the natural beauty of the region.
Demographics
As of the 2010 census, the population of Christopher was 2,072. The racial makeup of the city was 97.2% White, 0.7% African American, 0.3% Native American, 0.2% Asian, 0.1% Pacific Islander, 0.4% from other races, and 1.1% from two or more races. Hispanic or Latino of any race were 1.3% of the population.
The median income for a household in the city was $37,917, and the median income for a family was $45,000. The per capita income for the city was $18,945. About 11.2% of families and 14.2% of the population were below the poverty line, including 19.2% of those under age 18 and 8.2% of those age 65 or over.
History
Christopher was founded in 1858 by a group of settlers from Kentucky. The city was named after Christopher Columbus, and was originally intended to be a trading post for the area. The city quickly grew, and by the late 19th century, it had become a major hub for the region. The city was home to several businesses, including a flour mill, a sawmill, and a brickyard.
In the early 20th century, the city experienced a period of growth and prosperity. The city was home to several large factories, which produced a variety of products, including furniture, clothing, and automotive parts. The city also had a thriving tourism industry, with many visitors coming to the area to enjoy the natural beauty of the region.
In the late 20th century, the city experienced a period of decline. Many of the factories closed, and the city's population began to decline. In recent years, the city has seen a resurgence, with new businesses and industries moving into the area. The city is now home to a variety of businesses, including restaurants, retail stores, and manufacturing plants. The city is also home to a vibrant arts and culture scene, with several galleries, museums, and theaters.
Common Questions
What is Per Capita Income in Christopher?
Per Capita income in Christopher is $25,719.
What is the Median Family Income in Christopher?
Median Family Income in Christopher is $54,519.
What is the Median Household income in Christopher?
Median Household Income in Christopher is $42,650.
What is Income or Wage Gap in Christopher?
Income or Wage Gap in Christopher is 4.1%.
Women in Christopher earn 95.9 cents for every dollar earned by a man.
What is Family Income Deficit in Christopher?
Family Income Deficit in Christopher is $9,698.
Families that are below poverty line in Christopher earn $9,698 less on average than the poverty threshold level.
What is Inequality or Gini Index in Christopher?
Inequality or Gini Index in Christopher is 0.46.
What is the Total Population of Christopher?
Total Population of Christopher is 2,507.
What is the Total Male Population of Christopher?
Total Male Population of Christopher is 1,247.
What is the Total Female Population of Christopher?
Total Female Population of Christopher is 1,260.
What is the Ratio of Males per 100 Females in Christopher?
There are 98.97 Males per 100 Females in Christopher.
What is the Ratio of Females per 100 Males in Christopher?
There are 101.04 Females per 100 Males in Christopher.
What is the Median Population Age in Christopher?
Median Population Age in Christopher is 42.1 Years.
What is the Average Family Size in Christopher
Average Family Size in Christopher is 3.0 People.
What is the Average Household Size in Christopher
Average Household Size in Christopher is 2.1 People.
How Large is the Labor Force in Christopher?
There are 1,029 People in the Labor Forcein in Christopher.
What is the Percentage of People in the Labor Force in Christopher?
51.3% of People are in the Labor Force in Christopher.
What is the Unemployment Rate in Christopher?
Unemployment Rate in Christopher is 7.4%.