Cities with the Highest Percentage of Immigrants from Eastern Europe in Illinois
RELATED REPORTS & OPTIONS
Eastern Europe
Illinois
Compare Cities
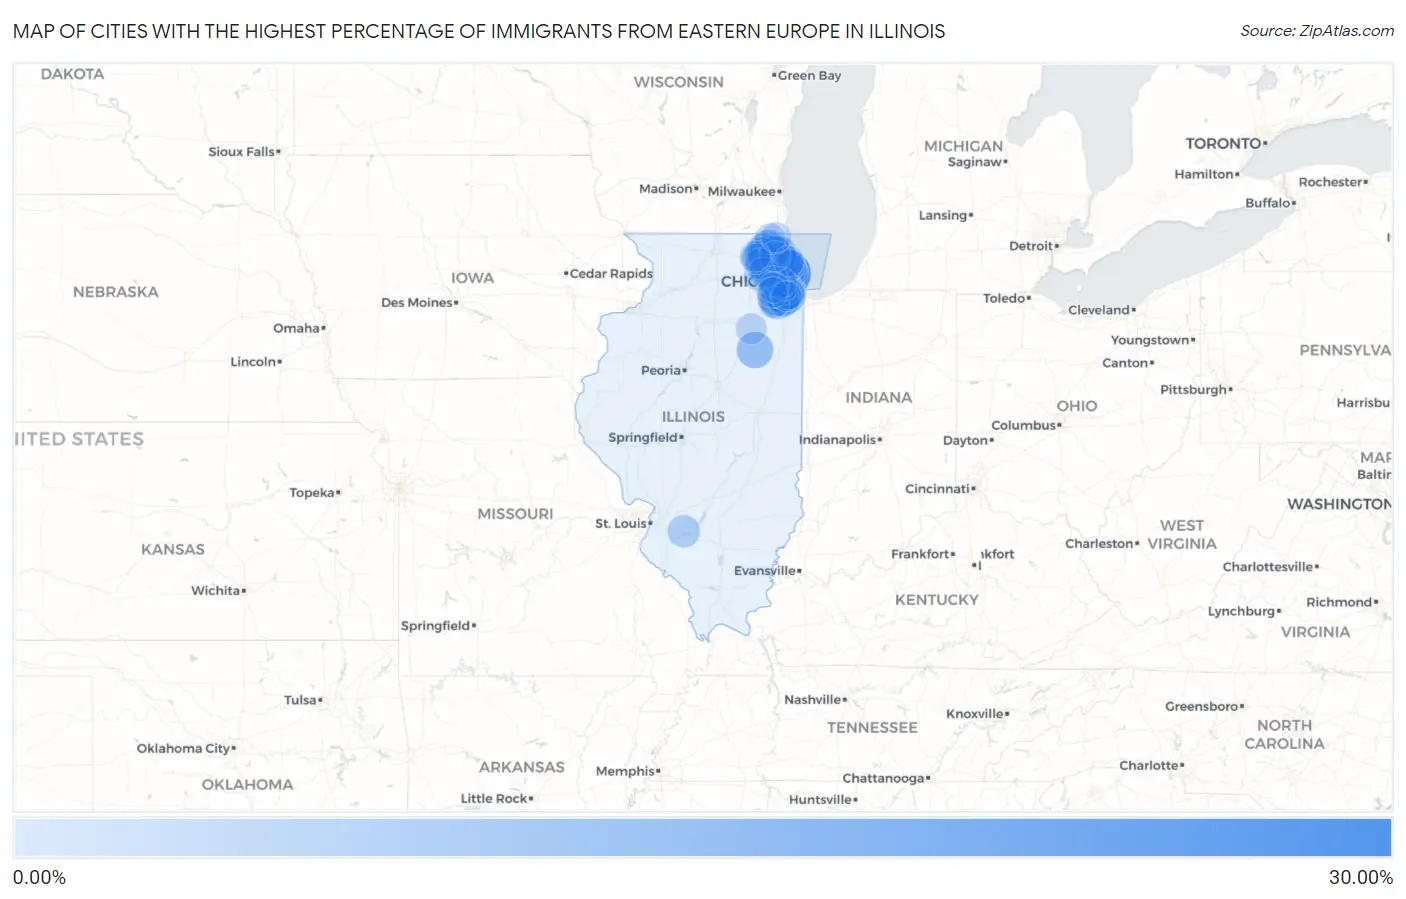
Map of Cities with the Highest Percentage of Immigrants from Eastern Europe in Illinois
0.00%
30.00%
Cities with the Highest Percentage of Immigrants from Eastern Europe in Illinois
| City | Eastern Europe | vs State | vs National | |
| 1. | Schiller Park | 25.01% | 2.13%(+22.9)#1 | 0.67%(+24.3)#10 |
| 2. | Harwood Heights | 24.50% | 2.13%(+22.4)#2 | 0.67%(+23.8)#11 |
| 3. | Norridge | 20.89% | 2.13%(+18.8)#3 | 0.67%(+20.2)#15 |
| 4. | Palos Hills | 16.18% | 2.13%(+14.0)#4 | 0.67%(+15.5)#27 |
| 5. | Hickory Hills | 15.68% | 2.13%(+13.6)#5 | 0.67%(+15.0)#29 |
| 6. | River Grove | 15.26% | 2.13%(+13.1)#6 | 0.67%(+14.6)#31 |
| 7. | Justice | 14.20% | 2.13%(+12.1)#7 | 0.67%(+13.5)#33 |
| 8. | Wheeling | 13.63% | 2.13%(+11.5)#8 | 0.67%(+13.0)#39 |
| 9. | Forest Lake | 13.62% | 2.13%(+11.5)#9 | 0.67%(+12.9)#40 |
| 10. | Wood Dale | 13.55% | 2.13%(+11.4)#10 | 0.67%(+12.9)#42 |
| 11. | Niles | 13.53% | 2.13%(+11.4)#11 | 0.67%(+12.9)#43 |
| 12. | Buffalo Grove | 12.47% | 2.13%(+10.3)#12 | 0.67%(+11.8)#50 |
| 13. | Prospect Heights | 12.43% | 2.13%(+10.3)#13 | 0.67%(+11.8)#51 |
| 14. | Elmwood Park | 12.38% | 2.13%(+10.3)#14 | 0.67%(+11.7)#52 |
| 15. | Lemont | 12.15% | 2.13%(+10.0)#15 | 0.67%(+11.5)#54 |
| 16. | Roselle | 10.86% | 2.13%(+8.72)#16 | 0.67%(+10.2)#66 |
| 17. | Mount Prospect | 10.24% | 2.13%(+8.11)#17 | 0.67%(+9.58)#71 |
| 18. | Emington | 10.00% | 2.13%(+7.87)#18 | 0.67%(+9.33)#77 |
| 19. | Countryside | 9.90% | 2.13%(+7.77)#19 | 0.67%(+9.23)#78 |
| 20. | Des Plaines | 9.82% | 2.13%(+7.69)#20 | 0.67%(+9.15)#79 |
| 21. | Bridgeview | 9.68% | 2.13%(+7.54)#21 | 0.67%(+9.01)#83 |
| 22. | Burbank | 9.16% | 2.13%(+7.03)#22 | 0.67%(+8.50)#87 |
| 23. | Itasca | 8.49% | 2.13%(+6.35)#23 | 0.67%(+7.82)#97 |
| 24. | Indian Head Park | 8.25% | 2.13%(+6.12)#24 | 0.67%(+7.59)#103 |
| 25. | Elk Grove Village | 8.20% | 2.13%(+6.07)#25 | 0.67%(+7.54)#104 |
| 26. | Arlington Heights | 7.94% | 2.13%(+5.80)#26 | 0.67%(+7.27)#112 |
| 27. | Morton Grove | 7.86% | 2.13%(+5.73)#27 | 0.67%(+7.19)#114 |
| 28. | Lincolnwood | 7.81% | 2.13%(+5.68)#28 | 0.67%(+7.14)#115 |
| 29. | Bensenville | 7.36% | 2.13%(+5.23)#29 | 0.67%(+6.70)#123 |
| 30. | Barrington Hills | 7.25% | 2.13%(+5.12)#30 | 0.67%(+6.58)#128 |
| 31. | Franklin Park | 7.22% | 2.13%(+5.08)#31 | 0.67%(+6.55)#130 |
| 32. | Vernon Hills | 7.13% | 2.13%(+5.00)#32 | 0.67%(+6.47)#133 |
| 33. | Indian Creek | 7.08% | 2.13%(+4.95)#33 | 0.67%(+6.41)#136 |
| 34. | Park Ridge | 6.81% | 2.13%(+4.68)#34 | 0.67%(+6.15)#143 |
| 35. | Homer Glen | 6.72% | 2.13%(+4.58)#35 | 0.67%(+6.05)#148 |
| 36. | Lake Zurich | 6.59% | 2.13%(+4.46)#36 | 0.67%(+5.92)#154 |
| 37. | Trout Valley | 6.58% | 2.13%(+4.44)#37 | 0.67%(+5.91)#155 |
| 38. | Schaumburg | 6.41% | 2.13%(+4.28)#38 | 0.67%(+5.74)#166 |
| 39. | Chicago Ridge | 6.34% | 2.13%(+4.21)#39 | 0.67%(+5.68)#171 |
| 40. | Addison | 6.33% | 2.13%(+4.20)#40 | 0.67%(+5.66)#172 |
| 41. | Mettawa | 6.16% | 2.13%(+4.02)#41 | 0.67%(+5.49)#180 |
| 42. | Willow Springs | 6.11% | 2.13%(+3.98)#42 | 0.67%(+5.44)#184 |
| 43. | Glenview | 6.08% | 2.13%(+3.95)#43 | 0.67%(+5.42)#186 |
| 44. | Palatine | 5.86% | 2.13%(+3.73)#44 | 0.67%(+5.19)#195 |
| 45. | Palos Park | 5.81% | 2.13%(+3.68)#45 | 0.67%(+5.14)#199 |
| 46. | Darien | 5.79% | 2.13%(+3.66)#46 | 0.67%(+5.12)#201 |
| 47. | Damiansville | 5.67% | 2.13%(+3.54)#47 | 0.67%(+5.00)#207 |
| 48. | Wayne | 5.62% | 2.13%(+3.49)#48 | 0.67%(+4.95)#208 |
| 49. | Hawthorn Woods | 5.50% | 2.13%(+3.37)#49 | 0.67%(+4.83)#219 |
| 50. | Oakbrook Terrace | 5.42% | 2.13%(+3.29)#50 | 0.67%(+4.75)#226 |
| 51. | Worth | 5.41% | 2.13%(+3.28)#51 | 0.67%(+4.75)#227 |
| 52. | Lyons | 5.35% | 2.13%(+3.22)#52 | 0.67%(+4.69)#232 |
| 53. | Skokie | 5.14% | 2.13%(+3.01)#53 | 0.67%(+4.48)#249 |
| 54. | Golf | 5.13% | 2.13%(+3.00)#54 | 0.67%(+4.46)#251 |
| 55. | Rosemont | 5.12% | 2.13%(+2.99)#55 | 0.67%(+4.46)#252 |
| 56. | Northbrook | 5.08% | 2.13%(+2.94)#56 | 0.67%(+4.41)#260 |
| 57. | Rolling Meadows | 5.03% | 2.13%(+2.90)#57 | 0.67%(+4.36)#263 |
| 58. | Bedford Park | 5.01% | 2.13%(+2.88)#58 | 0.67%(+4.34)#264 |
| 59. | Lake Barrington | 5.00% | 2.13%(+2.87)#59 | 0.67%(+4.34)#265 |
| 60. | Ridgefield | 4.74% | 2.13%(+2.60)#60 | 0.67%(+4.07)#292 |
| 61. | Bloomingdale | 4.69% | 2.13%(+2.56)#61 | 0.67%(+4.03)#297 |
| 62. | Orland Park | 4.54% | 2.13%(+2.41)#62 | 0.67%(+3.87)#317 |
| 63. | Lockport Heights | 4.52% | 2.13%(+2.39)#63 | 0.67%(+3.85)#319 |
| 64. | Hoffman Estates | 4.48% | 2.13%(+2.35)#64 | 0.67%(+3.81)#325 |
| 65. | Port Barrington | 4.37% | 2.13%(+2.24)#65 | 0.67%(+3.70)#332 |
| 66. | Northfield | 4.36% | 2.13%(+2.23)#66 | 0.67%(+3.70)#333 |
| 67. | Volo | 4.33% | 2.13%(+2.20)#67 | 0.67%(+3.67)#338 |
| 68. | Westmont | 4.26% | 2.13%(+2.13)#68 | 0.67%(+3.59)#347 |
| 69. | Kildeer | 4.23% | 2.13%(+2.10)#69 | 0.67%(+3.57)#352 |
| 70. | Round Lake | 4.21% | 2.13%(+2.08)#70 | 0.67%(+3.54)#357 |
| 71. | Deer Park | 4.20% | 2.13%(+2.06)#71 | 0.67%(+3.53)#359 |
| 72. | Holiday Hills | 4.14% | 2.13%(+2.01)#72 | 0.67%(+3.47)#370 |
| 73. | Inverness | 4.09% | 2.13%(+1.96)#73 | 0.67%(+3.43)#379 |
| 74. | Streamwood | 4.09% | 2.13%(+1.95)#74 | 0.67%(+3.42)#380 |
| 75. | Glendale Heights | 4.08% | 2.13%(+1.95)#75 | 0.67%(+3.41)#382 |
| 76. | Burr Ridge | 4.02% | 2.13%(+1.88)#76 | 0.67%(+3.35)#390 |
| 77. | Oak Lawn | 3.97% | 2.13%(+1.84)#77 | 0.67%(+3.30)#396 |
| 78. | Fox River Grove | 3.87% | 2.13%(+1.74)#78 | 0.67%(+3.20)#415 |
| 79. | Lockport | 3.82% | 2.13%(+1.69)#79 | 0.67%(+3.16)#420 |
| 80. | Brookfield | 3.82% | 2.13%(+1.69)#80 | 0.67%(+3.16)#421 |
| 81. | Mazon | 3.80% | 2.13%(+1.67)#81 | 0.67%(+3.14)#423 |
| 82. | Oakwood Hills | 3.80% | 2.13%(+1.67)#82 | 0.67%(+3.13)#424 |
| 83. | Riverwoods | 3.79% | 2.13%(+1.66)#83 | 0.67%(+3.13)#425 |
| 84. | Mundelein | 3.75% | 2.13%(+1.61)#84 | 0.67%(+3.08)#430 |
| 85. | Bonnie Brae | 3.74% | 2.13%(+1.61)#85 | 0.67%(+3.07)#433 |
| 86. | Wilmette | 3.68% | 2.13%(+1.55)#86 | 0.67%(+3.02)#443 |
| 87. | East Dundee | 3.64% | 2.13%(+1.51)#87 | 0.67%(+2.98)#453 |
| 88. | Lake Villa | 3.61% | 2.13%(+1.48)#88 | 0.67%(+2.94)#460 |
| 89. | Westchester | 3.59% | 2.13%(+1.46)#89 | 0.67%(+2.93)#469 |
| 90. | Lombard | 3.52% | 2.13%(+1.38)#90 | 0.67%(+2.85)#488 |
| 91. | Bartlett | 3.51% | 2.13%(+1.38)#91 | 0.67%(+2.84)#490 |
| 92. | Long Grove | 3.49% | 2.13%(+1.36)#92 | 0.67%(+2.82)#492 |
| 93. | Algonquin | 3.45% | 2.13%(+1.32)#93 | 0.67%(+2.78)#496 |
| 94. | Glencoe | 3.40% | 2.13%(+1.27)#94 | 0.67%(+2.74)#504 |
| 95. | Lake In The Hills | 3.40% | 2.13%(+1.27)#95 | 0.67%(+2.73)#505 |
| 96. | Downers Grove | 3.38% | 2.13%(+1.25)#96 | 0.67%(+2.71)#509 |
| 97. | Woodridge | 3.31% | 2.13%(+1.18)#97 | 0.67%(+2.64)#520 |
| 98. | Old Mill Creek | 3.28% | 2.13%(+1.15)#98 | 0.67%(+2.61)#530 |
| 99. | Ritchie | 3.25% | 2.13%(+1.11)#99 | 0.67%(+2.58)#538 |
| 100. | Palos Heights | 3.16% | 2.13%(+1.03)#100 | 0.67%(+2.49)#558 |
Common Questions
What are the Top 10 Cities with the Highest Percentage of Immigrants from Eastern Europe in Illinois?
Top 10 Cities with the Highest Percentage of Immigrants from Eastern Europe in Illinois are:
#1
25.01%
#2
24.50%
#3
20.89%
#4
16.18%
#5
15.68%
#6
15.26%
#7
14.20%
#8
13.63%
#9
13.62%
#10
13.55%
What city has the Highest Percentage of Immigrants from Eastern Europe in Illinois?
Schiller Park has the Highest Percentage of Immigrants from Eastern Europe in Illinois with 25.01%.
What is the Percentage of Immigrants from Eastern Europe in the State of Illinois?
Percentage of Immigrants from Eastern Europe in Illinois is 2.13%.
What is the Percentage of Immigrants from Eastern Europe in the United States?
Percentage of Immigrants from Eastern Europe in the United States is 0.67%.