Lindenhurst, IL Map & Demographics
Lindenhurst Map
Lindenhurst Overview
$48,582
PER CAPITA INCOME
$135,553
AVG FAMILY INCOME
$124,690
AVG HOUSEHOLD INCOME
37.3%
WAGE / INCOME GAP [ % ]
62.7¢/ $1
WAGE / INCOME GAP [ $ ]
0.33
INEQUALITY / GINI INDEX
14,403
TOTAL POPULATION
7,322
MALE POPULATION
7,081
FEMALE POPULATION
103.40
MALES / 100 FEMALES
96.71
FEMALES / 100 MALES
37.8
MEDIAN AGE
3.2
AVG FAMILY SIZE
2.8
AVG HOUSEHOLD SIZE
8,584
LABOR FORCE [ PEOPLE ]
75.8%
PERCENT IN LABOR FORCE
6.7%
UNEMPLOYMENT RATE
Income in Lindenhurst
Income Overview in Lindenhurst
Per Capita Income in Lindenhurst is $48,582, while median incomes of families and households are $135,553 and $124,690 respectively.
| Characteristic | Number | Measure |
| Per Capita Income | 14,403 | $48,582 |
| Median Family Income | 4,009 | $135,553 |
| Mean Family Income | 4,009 | $147,176 |
| Median Household Income | 5,071 | $124,690 |
| Mean Household Income | 5,071 | $137,248 |
| Income Deficit | 4,009 | $0 |
| Wage / Income Gap (%) | 14,403 | 37.29% |
| Wage / Income Gap ($) | 14,403 | 62.71¢ per $1 |
| Gini / Inequality Index | 14,403 | 0.33 |
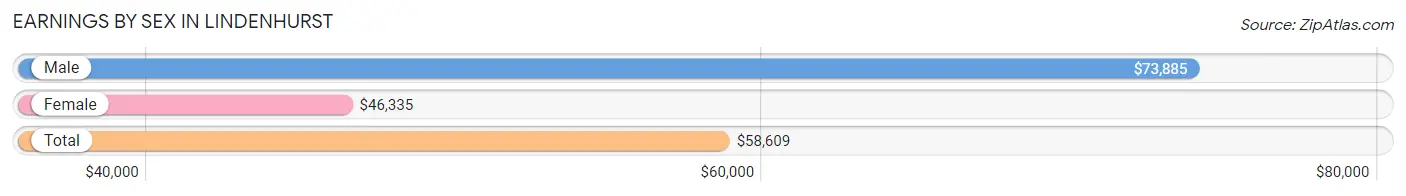
Earnings by Sex in Lindenhurst
Average Earnings in Lindenhurst are $58,609, $73,885 for men and $46,335 for women, a difference of 37.3%.
| Sex | Number | Average Earnings |
| Male | 4,592 (53.0%) | $73,885 |
| Female | 4,067 (47.0%) | $46,335 |
| Total | 8,659 (100.0%) | $58,609 |
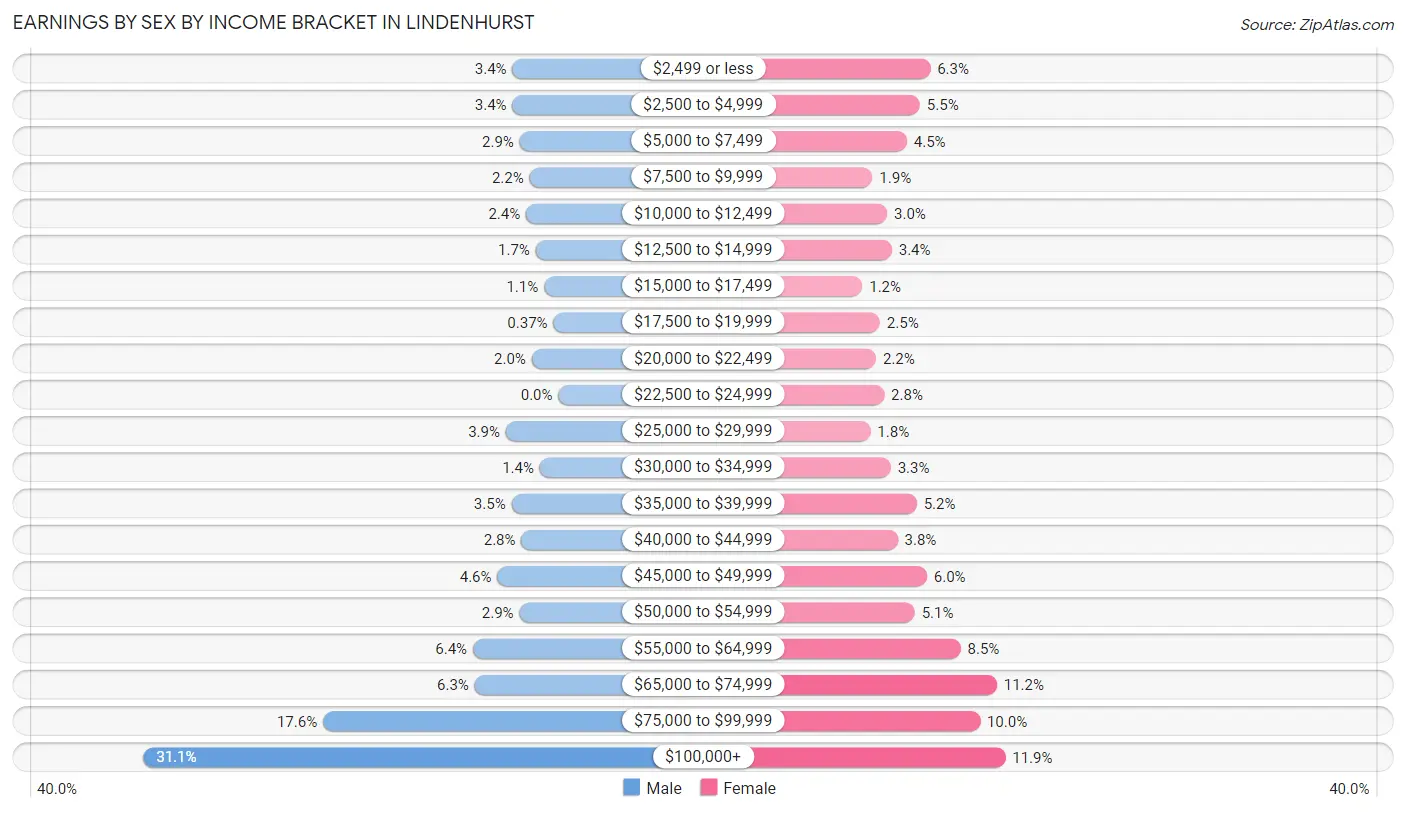
Earnings by Sex by Income Bracket in Lindenhurst
The most common earnings brackets in Lindenhurst are $100,000+ for men (1,428 | 31.1%) and $100,000+ for women (483 | 11.9%).
| Income | Male | Female |
| $2,499 or less | 158 (3.4%) | 254 (6.2%) |
| $2,500 to $4,999 | 158 (3.4%) | 223 (5.5%) |
| $5,000 to $7,499 | 133 (2.9%) | 183 (4.5%) |
| $7,500 to $9,999 | 99 (2.2%) | 78 (1.9%) |
| $10,000 to $12,499 | 111 (2.4%) | 123 (3.0%) |
| $12,500 to $14,999 | 78 (1.7%) | 137 (3.4%) |
| $15,000 to $17,499 | 49 (1.1%) | 47 (1.2%) |
| $17,500 to $19,999 | 17 (0.4%) | 101 (2.5%) |
| $20,000 to $22,499 | 92 (2.0%) | 89 (2.2%) |
| $22,500 to $24,999 | 0 (0.0%) | 114 (2.8%) |
| $25,000 to $29,999 | 181 (3.9%) | 72 (1.8%) |
| $30,000 to $34,999 | 64 (1.4%) | 134 (3.3%) |
| $35,000 to $39,999 | 161 (3.5%) | 213 (5.2%) |
| $40,000 to $44,999 | 127 (2.8%) | 155 (3.8%) |
| $45,000 to $49,999 | 210 (4.6%) | 244 (6.0%) |
| $50,000 to $54,999 | 134 (2.9%) | 207 (5.1%) |
| $55,000 to $64,999 | 294 (6.4%) | 347 (8.5%) |
| $65,000 to $74,999 | 288 (6.3%) | 457 (11.2%) |
| $75,000 to $99,999 | 810 (17.6%) | 406 (10.0%) |
| $100,000+ | 1,428 (31.1%) | 483 (11.9%) |
| Total | 4,592 (100.0%) | 4,067 (100.0%) |
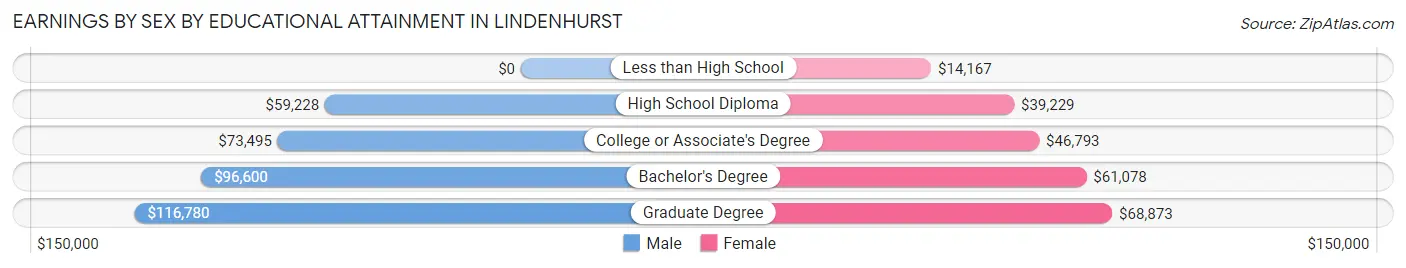
Earnings by Sex by Educational Attainment in Lindenhurst
Average earnings in Lindenhurst are $81,089 for men and $54,067 for women, a difference of 33.3%. Men with an educational attainment of graduate degree enjoy the highest average annual earnings of $116,780, while those with high school diploma education earn the least with $59,228. Women with an educational attainment of graduate degree earn the most with the average annual earnings of $68,873, while those with less than high school education have the smallest earnings of $14,167.
| Educational Attainment | Male Income | Female Income |
| Less than High School | - | - |
| High School Diploma | $59,228 | $39,229 |
| College or Associate's Degree | $73,495 | $46,793 |
| Bachelor's Degree | $96,600 | $61,078 |
| Graduate Degree | $116,780 | $68,873 |
| Total | $81,089 | $54,067 |
Family Income in Lindenhurst
Family Income Brackets in Lindenhurst
According to the Lindenhurst family income data, there are 1,187 families falling into the $100,000 to $149,999 income range, which is the most common income bracket and makes up 29.6% of all families. Conversely, the less than $10,000 income bracket is the least frequent group with only 12 families (0.3%) belonging to this category.
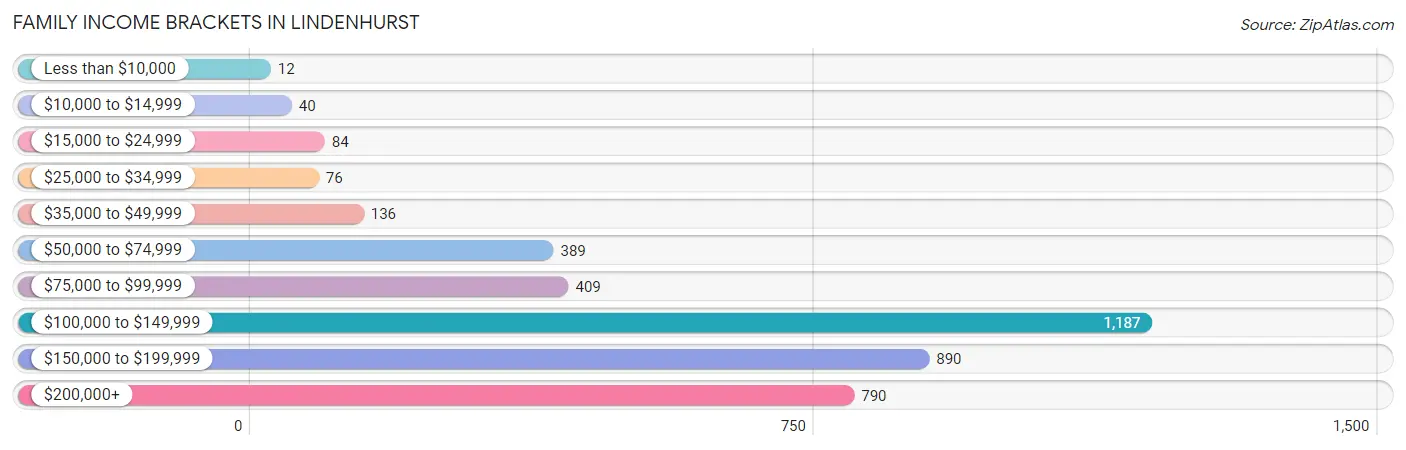
| Income Bracket | # Families | % Families |
| Less than $10,000 | 12 | 0.3% |
| $10,000 to $14,999 | 40 | 1.0% |
| $15,000 to $24,999 | 84 | 2.1% |
| $25,000 to $34,999 | 76 | 1.9% |
| $35,000 to $49,999 | 136 | 3.4% |
| $50,000 to $74,999 | 389 | 9.7% |
| $75,000 to $99,999 | 409 | 10.2% |
| $100,000 to $149,999 | 1,187 | 29.6% |
| $150,000 to $199,999 | 890 | 22.2% |
| $200,000+ | 790 | 19.7% |
Family Income by Famaliy Size in Lindenhurst
6-person families (62 | 1.5%) account for the highest median family income in Lindenhurst with $150,000 per family, while 2-person families (1,789 | 44.6%) have the highest median income of $61,086 per family member.
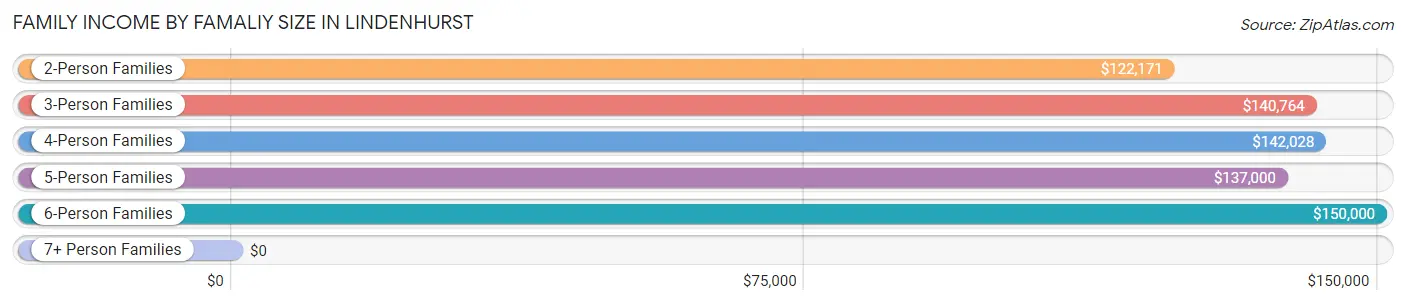
| Income Bracket | # Families | Median Income |
| 2-Person Families | 1,789 (44.6%) | $122,171 |
| 3-Person Families | 697 (17.4%) | $140,764 |
| 4-Person Families | 1,072 (26.7%) | $142,028 |
| 5-Person Families | 360 (9.0%) | $137,000 |
| 6-Person Families | 62 (1.5%) | $150,000 |
| 7+ Person Families | 29 (0.7%) | $0 |
| Total | 4,009 (100.0%) | $135,553 |
Family Income by Number of Earners in Lindenhurst
The median family income in Lindenhurst is $135,553, with families comprising 3+ earners (627) having the highest median family income of $169,879, while families with no earners (349) have the lowest median family income of $57,969, accounting for 15.6% and 8.7% of families, respectively.
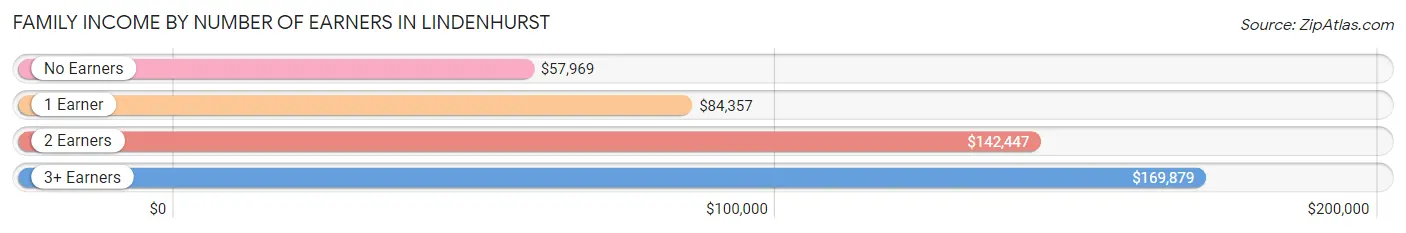
| Number of Earners | # Families | Median Income |
| No Earners | 349 (8.7%) | $57,969 |
| 1 Earner | 778 (19.4%) | $84,357 |
| 2 Earners | 2,255 (56.2%) | $142,447 |
| 3+ Earners | 627 (15.6%) | $169,879 |
| Total | 4,009 (100.0%) | $135,553 |
Household Income in Lindenhurst
Household Income Brackets in Lindenhurst
With 1,542 households falling in the category, the $100,000 to $149,999 income range is the most frequent in Lindenhurst, accounting for 30.4% of all households. In contrast, only 71 households (1.4%) fall into the $10,000 to $14,999 income bracket, making it the least populous group.
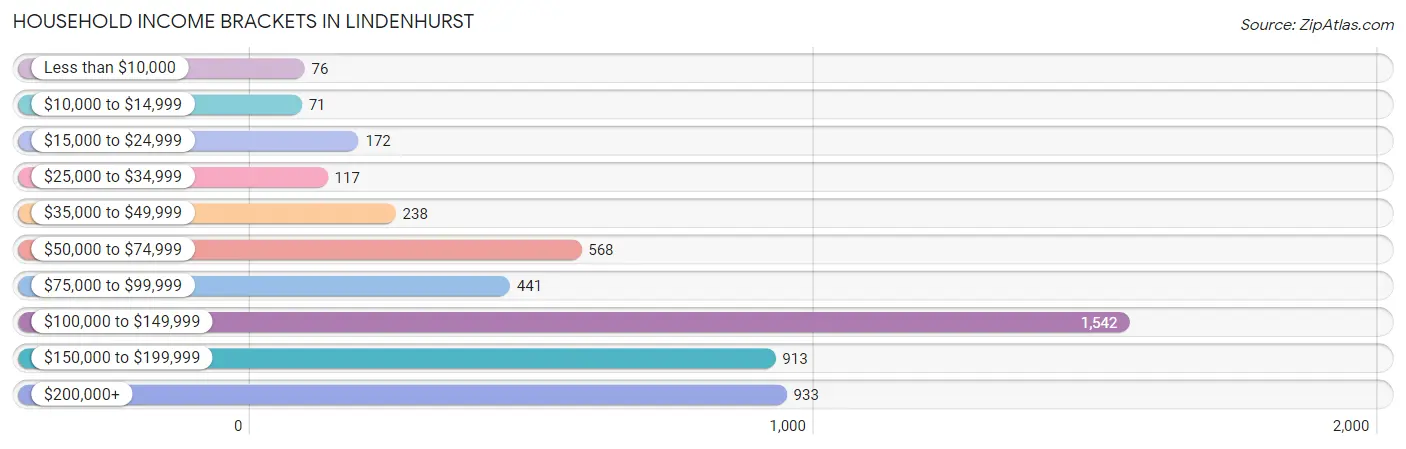
| Income Bracket | # Households | % Households |
| Less than $10,000 | 76 | 1.5% |
| $10,000 to $14,999 | 71 | 1.4% |
| $15,000 to $24,999 | 172 | 3.4% |
| $25,000 to $34,999 | 117 | 2.3% |
| $35,000 to $49,999 | 238 | 4.7% |
| $50,000 to $74,999 | 568 | 11.2% |
| $75,000 to $99,999 | 441 | 8.7% |
| $100,000 to $149,999 | 1,542 | 30.4% |
| $150,000 to $199,999 | 913 | 18.0% |
| $200,000+ | 933 | 18.4% |
Household Income by Householder Age in Lindenhurst
The median household income in Lindenhurst is $124,690, with the highest median household income of $150,323 found in the 45 to 64 years age bracket for the primary householder. A total of 2,060 households (40.6%) fall into this category. Meanwhile, the 15 to 24 years age bracket for the primary householder has the lowest median household income of $0, with 70 households (1.4%) in this group.
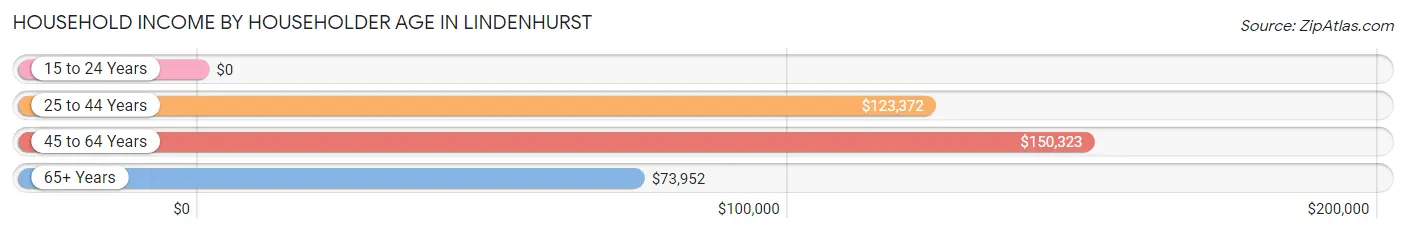
| Income Bracket | # Households | Median Income |
| 15 to 24 Years | 70 (1.4%) | $0 |
| 25 to 44 Years | 1,751 (34.5%) | $123,372 |
| 45 to 64 Years | 2,060 (40.6%) | $150,323 |
| 65+ Years | 1,190 (23.5%) | $73,952 |
| Total | 5,071 (100.0%) | $124,690 |
Poverty in Lindenhurst
Income Below Poverty by Sex and Age in Lindenhurst
With 2.8% poverty level for males and 5.4% for females among the residents of Lindenhurst, 15 year old males and 75 year old and over females are the most vulnerable to poverty, with 13 males (10.5%) and 62 females (14.8%) in their respective age groups living below the poverty level.
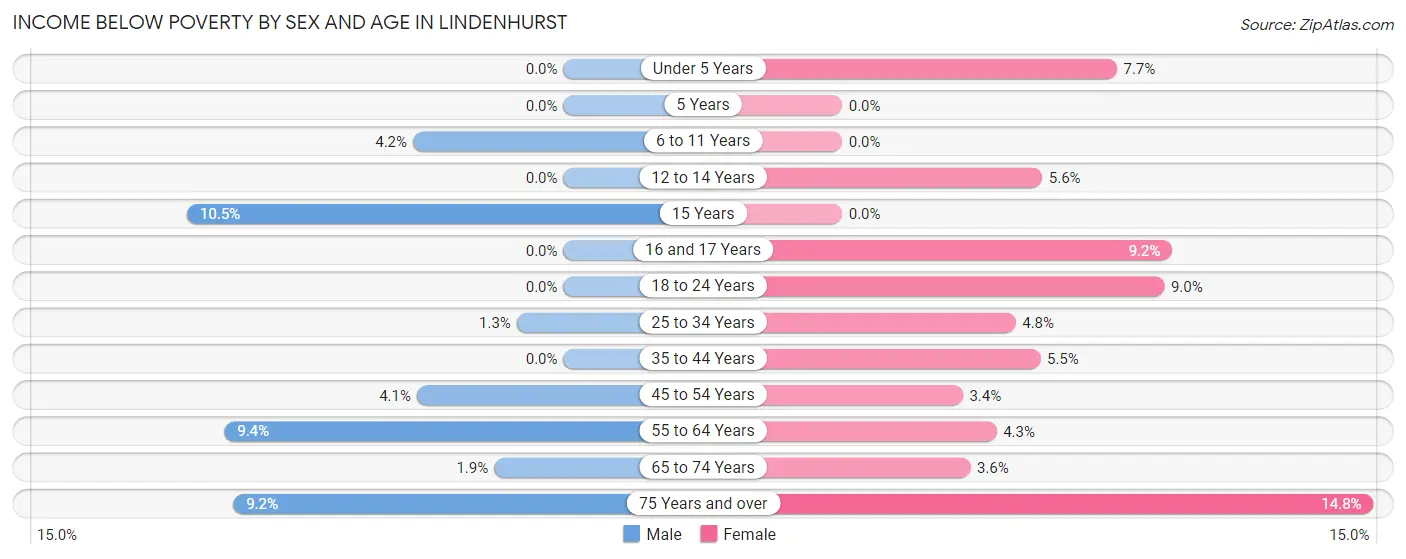
| Age Bracket | Male | Female |
| Under 5 Years | 0 (0.0%) | 27 (7.6%) |
| 5 Years | 0 (0.0%) | 0 (0.0%) |
| 6 to 11 Years | 19 (4.2%) | 0 (0.0%) |
| 12 to 14 Years | 0 (0.0%) | 20 (5.6%) |
| 15 Years | 13 (10.5%) | 0 (0.0%) |
| 16 and 17 Years | 0 (0.0%) | 23 (9.2%) |
| 18 to 24 Years | 0 (0.0%) | 56 (9.0%) |
| 25 to 34 Years | 13 (1.3%) | 41 (4.8%) |
| 35 to 44 Years | 0 (0.0%) | 53 (5.5%) |
| 45 to 54 Years | 47 (4.1%) | 36 (3.4%) |
| 55 to 64 Years | 85 (9.4%) | 37 (4.3%) |
| 65 to 74 Years | 11 (1.9%) | 21 (3.6%) |
| 75 Years and over | 17 (9.2%) | 62 (14.8%) |
| Total | 205 (2.8%) | 376 (5.4%) |
Income Above Poverty by Sex and Age in Lindenhurst
According to the poverty statistics in Lindenhurst, males aged under 5 years and females aged 5 years are the age groups that are most secure financially, with 100.0% of males and 100.0% of females in these age groups living above the poverty line.
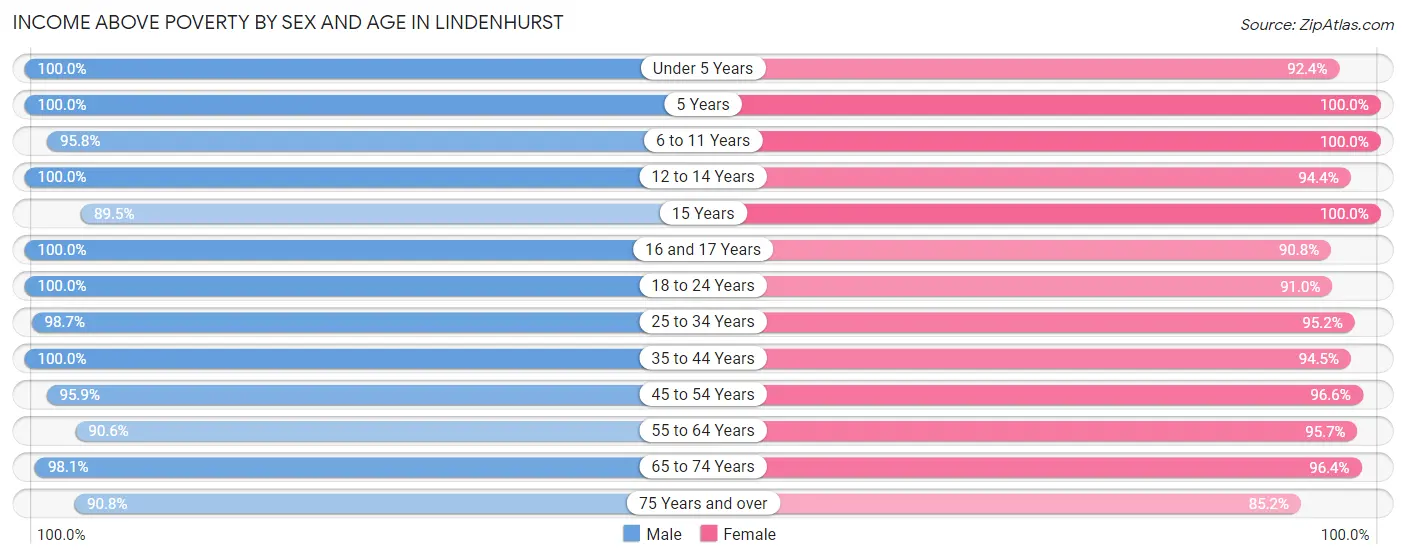
| Age Bracket | Male | Female |
| Under 5 Years | 713 (100.0%) | 326 (92.3%) |
| 5 Years | 109 (100.0%) | 77 (100.0%) |
| 6 to 11 Years | 434 (95.8%) | 534 (100.0%) |
| 12 to 14 Years | 280 (100.0%) | 339 (94.4%) |
| 15 Years | 111 (89.5%) | 66 (100.0%) |
| 16 and 17 Years | 206 (100.0%) | 227 (90.8%) |
| 18 to 24 Years | 611 (100.0%) | 568 (91.0%) |
| 25 to 34 Years | 987 (98.7%) | 808 (95.2%) |
| 35 to 44 Years | 983 (100.0%) | 908 (94.5%) |
| 45 to 54 Years | 1,105 (95.9%) | 1,037 (96.6%) |
| 55 to 64 Years | 815 (90.6%) | 824 (95.7%) |
| 65 to 74 Years | 558 (98.1%) | 568 (96.4%) |
| 75 Years and over | 168 (90.8%) | 357 (85.2%) |
| Total | 7,080 (97.2%) | 6,639 (94.6%) |
Income Below Poverty Among Married-Couple Families in Lindenhurst
The poverty statistics for married-couple families in Lindenhurst show that 1.5% or 52 of the total 3,402 families live below the poverty line. Families with 1 or 2 children have the highest poverty rate of 1.7%, comprising of 23 families. On the other hand, families with 3 or 4 children have the lowest poverty rate of 0.0%, which includes 0 families.
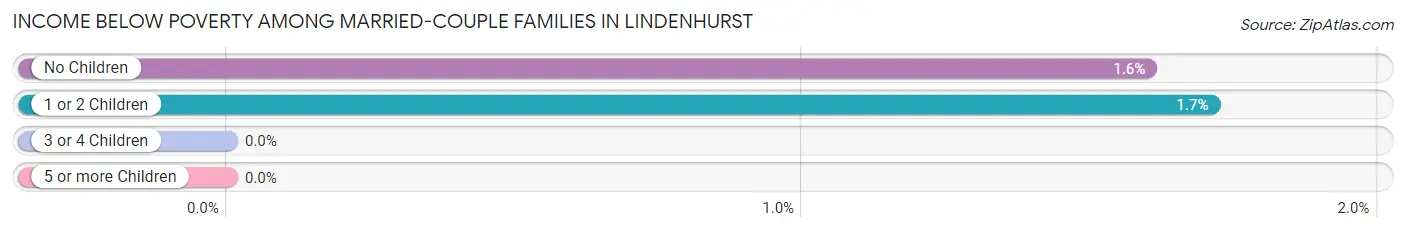
| Children | Above Poverty | Below Poverty |
| No Children | 1,784 (98.4%) | 29 (1.6%) |
| 1 or 2 Children | 1,321 (98.3%) | 23 (1.7%) |
| 3 or 4 Children | 245 (100.0%) | 0 (0.0%) |
| 5 or more Children | 0 (0.0%) | 0 (0.0%) |
| Total | 3,350 (98.5%) | 52 (1.5%) |
Income Below Poverty Among Single-Parent Households in Lindenhurst
According to the poverty data in Lindenhurst, 13.0% or 18 single-father households and 10.7% or 50 single-mother households are living below the poverty line. Among single-father households, those with no children have the highest poverty rate, with 18 households (19.4%) experiencing poverty. Likewise, among single-mother households, those with 3 or 4 children have the highest poverty rate, with 17 households (37.0%) falling below the poverty line.
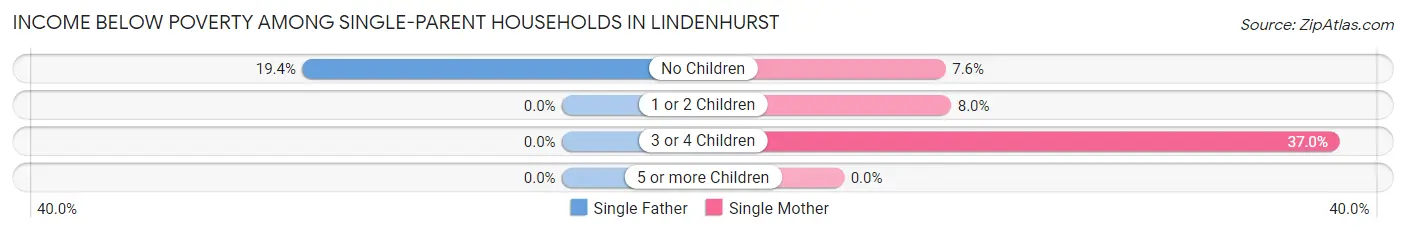
| Children | Single Father | Single Mother |
| No Children | 18 (19.4%) | 14 (7.6%) |
| 1 or 2 Children | 0 (0.0%) | 19 (8.0%) |
| 3 or 4 Children | 0 (0.0%) | 17 (37.0%) |
| 5 or more Children | 0 (0.0%) | 0 (0.0%) |
| Total | 18 (13.0%) | 50 (10.7%) |
Income Below Poverty Among Married-Couple vs Single-Parent Households in Lindenhurst
The poverty data for Lindenhurst shows that 52 of the married-couple family households (1.5%) and 68 of the single-parent households (11.2%) are living below the poverty level. Within the married-couple family households, those with 1 or 2 children have the highest poverty rate, with 23 households (1.7%) falling below the poverty line. Among the single-parent households, those with 3 or 4 children have the highest poverty rate, with 17 household (37.0%) living below poverty.
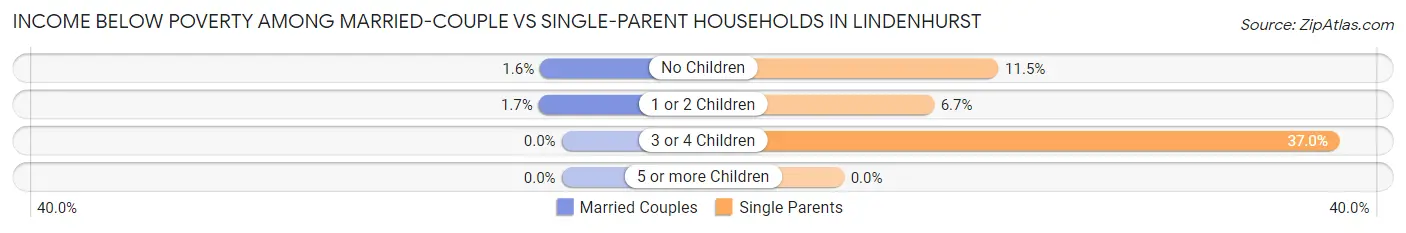
| Children | Married-Couple Families | Single-Parent Households |
| No Children | 29 (1.6%) | 32 (11.5%) |
| 1 or 2 Children | 23 (1.7%) | 19 (6.7%) |
| 3 or 4 Children | 0 (0.0%) | 17 (37.0%) |
| 5 or more Children | 0 (0.0%) | 0 (0.0%) |
| Total | 52 (1.5%) | 68 (11.2%) |
Race in Lindenhurst
The most populous races in Lindenhurst are White / Caucasian (11,832 | 82.2%), Hispanic or Latino (1,656 | 11.5%), and Asian (878 | 6.1%).
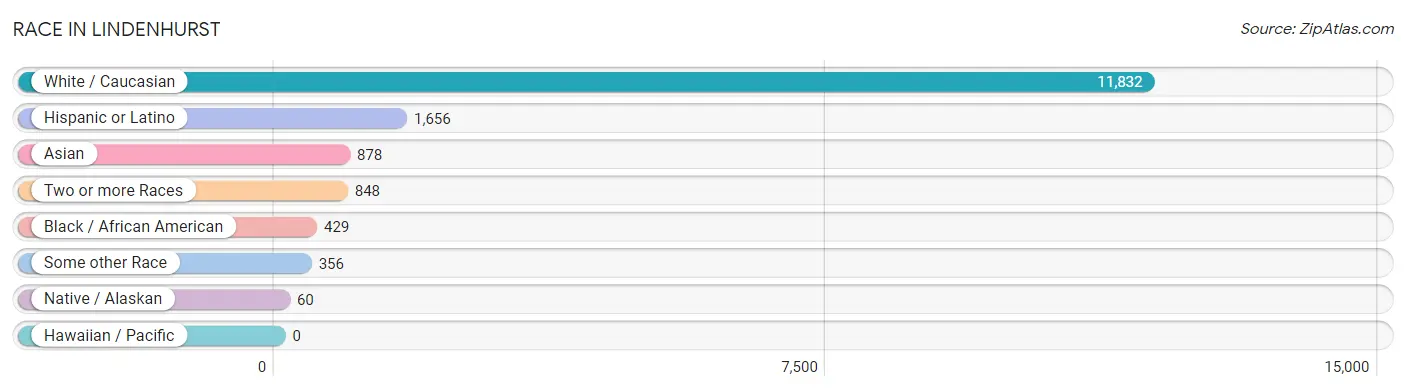
| Race | # Population | % Population |
| Asian | 878 | 6.1% |
| Black / African American | 429 | 3.0% |
| Hawaiian / Pacific | 0 | 0.0% |
| Hispanic or Latino | 1,656 | 11.5% |
| Native / Alaskan | 60 | 0.4% |
| White / Caucasian | 11,832 | 82.2% |
| Two or more Races | 848 | 5.9% |
| Some other Race | 356 | 2.5% |
| Total | 14,403 | 100.0% |
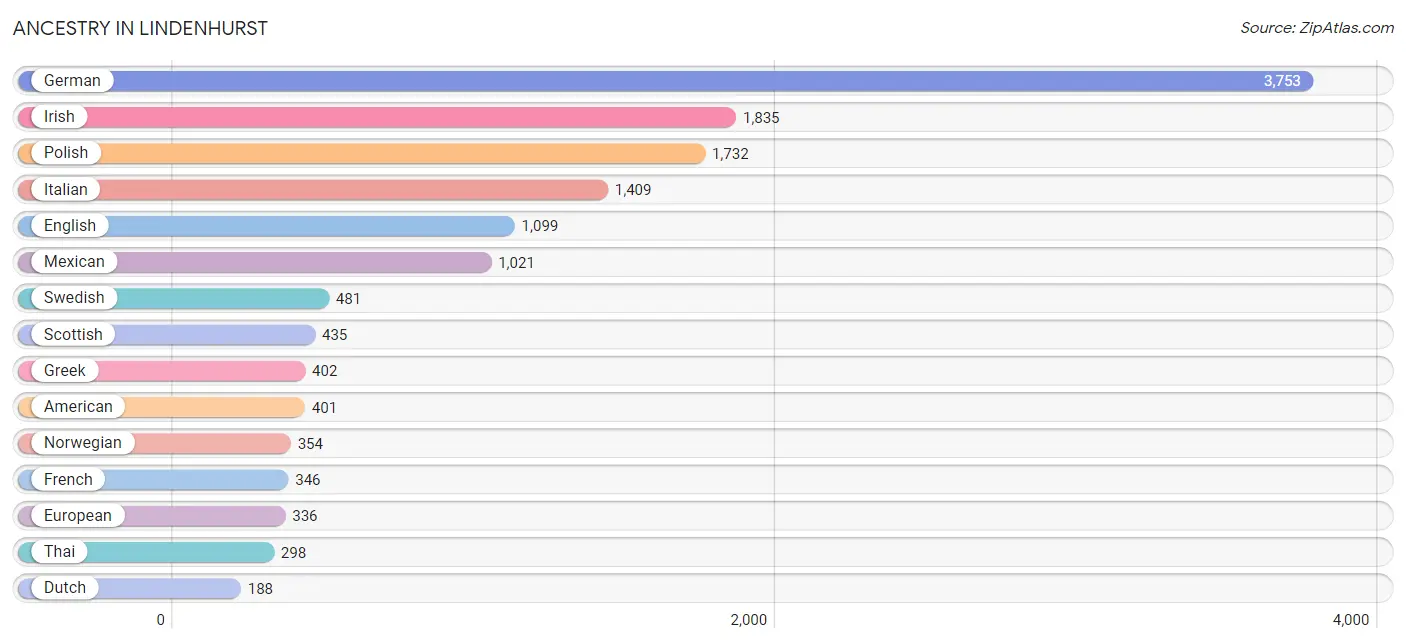
Ancestry in Lindenhurst
The most populous ancestries reported in Lindenhurst are German (3,753 | 26.1%), Irish (1,835 | 12.7%), Polish (1,732 | 12.0%), Italian (1,409 | 9.8%), and English (1,099 | 7.6%), together accounting for 68.2% of all Lindenhurst residents.
| Ancestry | # Population | % Population |
| African | 17 | 0.1% |
| American | 401 | 2.8% |
| Arab | 75 | 0.5% |
| Armenian | 9 | 0.1% |
| Austrian | 82 | 0.6% |
| Belgian | 8 | 0.1% |
| Belizean | 27 | 0.2% |
| Bhutanese | 94 | 0.6% |
| British | 82 | 0.6% |
| Bulgarian | 8 | 0.1% |
| Burmese | 59 | 0.4% |
| Carpatho Rusyn | 11 | 0.1% |
| Central American | 92 | 0.6% |
| Central American Indian | 29 | 0.2% |
| Cherokee | 41 | 0.3% |
| Chippewa | 6 | 0.0% |
| Colombian | 80 | 0.6% |
| Costa Rican | 28 | 0.2% |
| Croatian | 52 | 0.4% |
| Cuban | 24 | 0.2% |
| Czech | 155 | 1.1% |
| Czechoslovakian | 28 | 0.2% |
| Danish | 73 | 0.5% |
| Dominican | 100 | 0.7% |
| Dutch | 188 | 1.3% |
| Eastern European | 81 | 0.6% |
| Ecuadorian | 13 | 0.1% |
| English | 1,099 | 7.6% |
| Estonian | 8 | 0.1% |
| European | 336 | 2.3% |
| Finnish | 35 | 0.2% |
| French | 346 | 2.4% |
| French Canadian | 78 | 0.5% |
| German | 3,753 | 26.1% |
| Greek | 402 | 2.8% |
| Honduran | 14 | 0.1% |
| Hungarian | 96 | 0.7% |
| Icelander | 6 | 0.0% |
| Indian (Asian) | 132 | 0.9% |
| Iranian | 20 | 0.1% |
| Iraqi | 63 | 0.4% |
| Irish | 1,835 | 12.7% |
| Italian | 1,409 | 9.8% |
| Korean | 163 | 1.1% |
| Lebanese | 12 | 0.1% |
| Lithuanian | 116 | 0.8% |
| Luxembourger | 53 | 0.4% |
| Mexican | 1,021 | 7.1% |
| Mexican American Indian | 66 | 0.5% |
| Native Hawaiian | 6 | 0.0% |
| Nicaraguan | 21 | 0.2% |
| Nigerian | 53 | 0.4% |
| Norwegian | 354 | 2.5% |
| Panamanian | 29 | 0.2% |
| Pennsylvania German | 8 | 0.1% |
| Peruvian | 21 | 0.2% |
| Polish | 1,732 | 12.0% |
| Puerto Rican | 65 | 0.4% |
| Romanian | 44 | 0.3% |
| Russian | 130 | 0.9% |
| Scandinavian | 63 | 0.4% |
| Scotch-Irish | 92 | 0.6% |
| Scottish | 435 | 3.0% |
| Serbian | 60 | 0.4% |
| Sioux | 33 | 0.2% |
| Slavic | 5 | 0.0% |
| Slovak | 22 | 0.2% |
| Slovene | 41 | 0.3% |
| South American | 168 | 1.2% |
| Spaniard | 12 | 0.1% |
| Spanish | 11 | 0.1% |
| Subsaharan African | 70 | 0.5% |
| Swedish | 481 | 3.3% |
| Swiss | 17 | 0.1% |
| Thai | 298 | 2.1% |
| Ukrainian | 100 | 0.7% |
| Venezuelan | 54 | 0.4% |
| Welsh | 103 | 0.7% | View All 78 Rows |
Immigrants in Lindenhurst
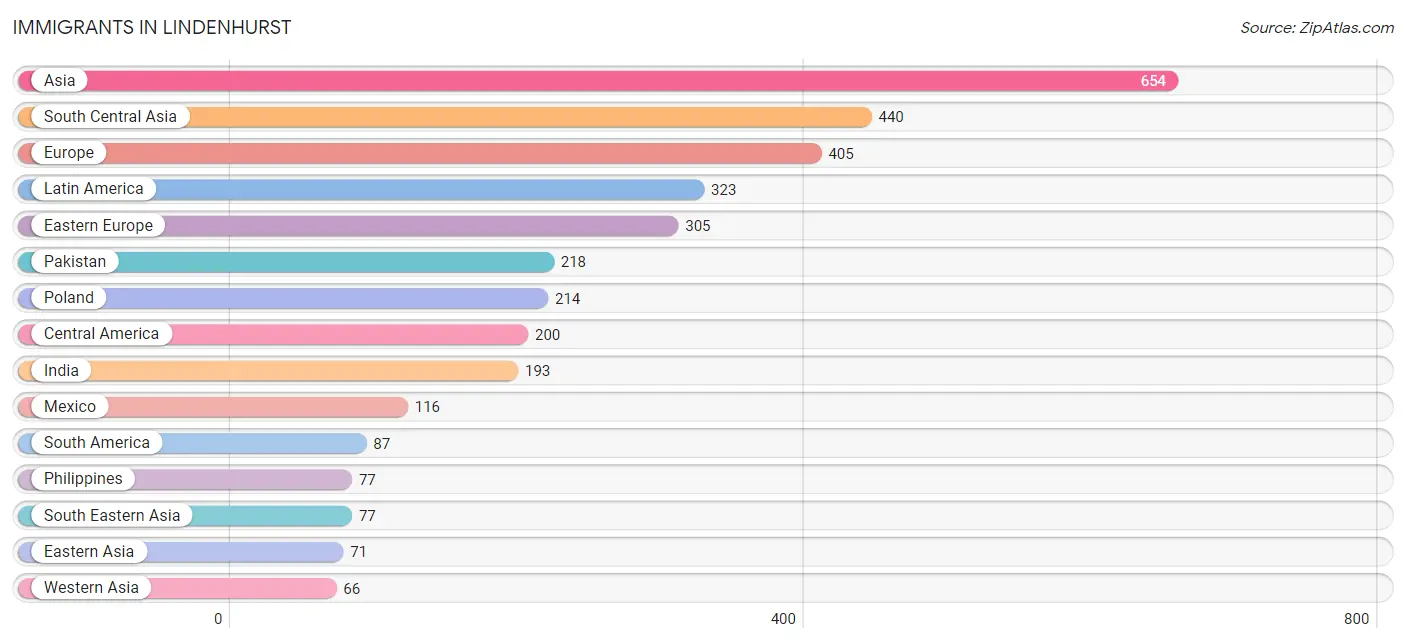
The most numerous immigrant groups reported in Lindenhurst came from Asia (654 | 4.5%), South Central Asia (440 | 3.0%), Europe (405 | 2.8%), Latin America (323 | 2.2%), and Eastern Europe (305 | 2.1%), together accounting for 14.8% of all Lindenhurst residents.
| Immigration Origin | # Population | % Population |
| Africa | 23 | 0.2% |
| Asia | 654 | 4.5% |
| Belize | 14 | 0.1% |
| Bulgaria | 8 | 0.1% |
| Canada | 18 | 0.1% |
| Caribbean | 36 | 0.3% |
| Central America | 200 | 1.4% |
| China | 36 | 0.3% |
| Colombia | 28 | 0.2% |
| Costa Rica | 11 | 0.1% |
| Czechoslovakia | 11 | 0.1% |
| Dominican Republic | 36 | 0.3% |
| Eastern Asia | 71 | 0.5% |
| Eastern Europe | 305 | 2.1% |
| England | 6 | 0.0% |
| Europe | 405 | 2.8% |
| Germany | 50 | 0.4% |
| Greece | 25 | 0.2% |
| Honduras | 14 | 0.1% |
| India | 193 | 1.3% |
| Iran | 29 | 0.2% |
| Iraq | 63 | 0.4% |
| Italy | 11 | 0.1% |
| Japan | 31 | 0.2% |
| Korea | 4 | 0.0% |
| Latin America | 323 | 2.2% |
| Lithuania | 15 | 0.1% |
| Mexico | 116 | 0.8% |
| Netherlands | 8 | 0.1% |
| Nicaragua | 45 | 0.3% |
| Nigeria | 23 | 0.2% |
| Northern Europe | 6 | 0.0% |
| Pakistan | 218 | 1.5% |
| Peru | 21 | 0.2% |
| Philippines | 77 | 0.5% |
| Poland | 214 | 1.5% |
| Romania | 19 | 0.1% |
| Serbia | 25 | 0.2% |
| South America | 87 | 0.6% |
| South Central Asia | 440 | 3.0% |
| South Eastern Asia | 77 | 0.5% |
| Southern Europe | 36 | 0.3% |
| Ukraine | 13 | 0.1% |
| Venezuela | 38 | 0.3% |
| Western Africa | 23 | 0.2% |
| Western Asia | 66 | 0.5% |
| Western Europe | 58 | 0.4% | View All 47 Rows |
Sex and Age in Lindenhurst
Sex and Age in Lindenhurst
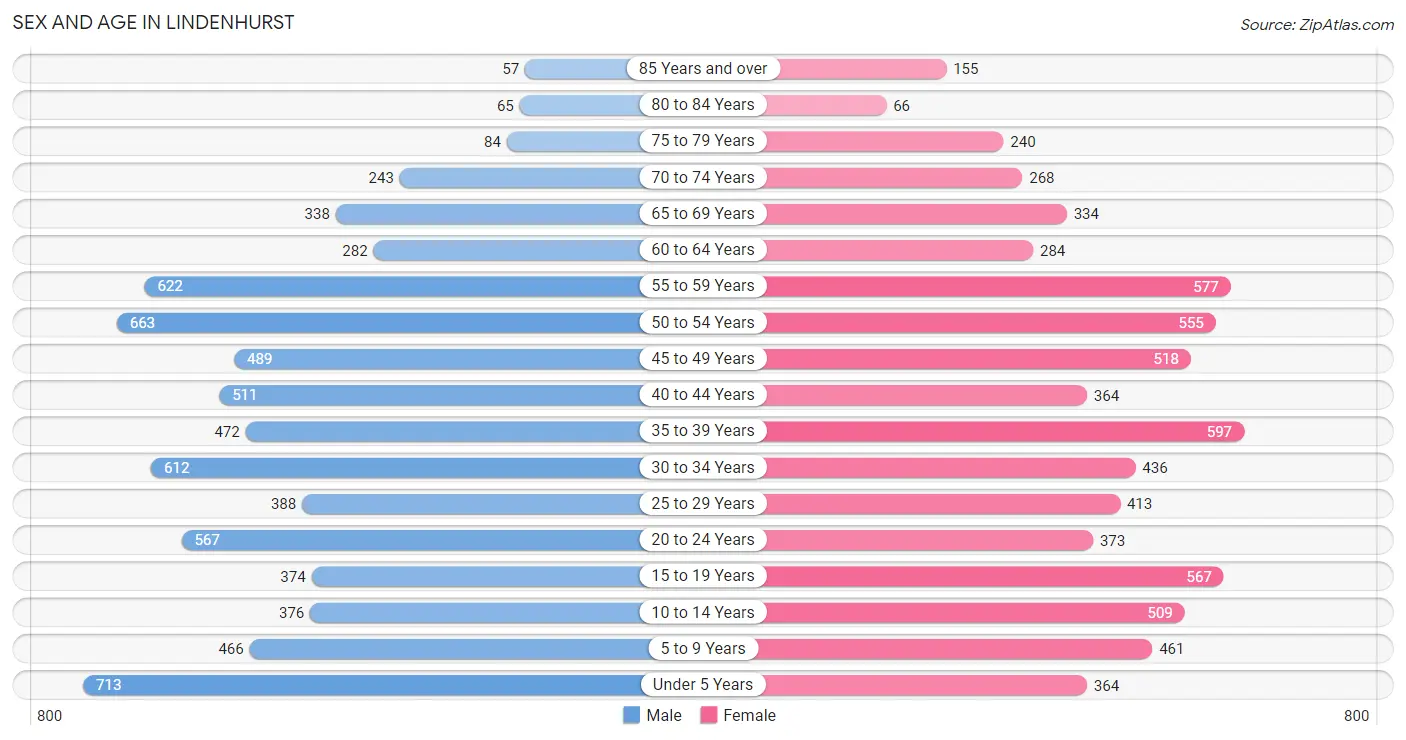
The most populous age groups in Lindenhurst are Under 5 Years (713 | 9.7%) for men and 35 to 39 Years (597 | 8.4%) for women.
| Age Bracket | Male | Female |
| Under 5 Years | 713 (9.7%) | 364 (5.1%) |
| 5 to 9 Years | 466 (6.4%) | 461 (6.5%) |
| 10 to 14 Years | 376 (5.1%) | 509 (7.2%) |
| 15 to 19 Years | 374 (5.1%) | 567 (8.0%) |
| 20 to 24 Years | 567 (7.7%) | 373 (5.3%) |
| 25 to 29 Years | 388 (5.3%) | 413 (5.8%) |
| 30 to 34 Years | 612 (8.4%) | 436 (6.2%) |
| 35 to 39 Years | 472 (6.5%) | 597 (8.4%) |
| 40 to 44 Years | 511 (7.0%) | 364 (5.1%) |
| 45 to 49 Years | 489 (6.7%) | 518 (7.3%) |
| 50 to 54 Years | 663 (9.0%) | 555 (7.8%) |
| 55 to 59 Years | 622 (8.5%) | 577 (8.2%) |
| 60 to 64 Years | 282 (3.8%) | 284 (4.0%) |
| 65 to 69 Years | 338 (4.6%) | 334 (4.7%) |
| 70 to 74 Years | 243 (3.3%) | 268 (3.8%) |
| 75 to 79 Years | 84 (1.1%) | 240 (3.4%) |
| 80 to 84 Years | 65 (0.9%) | 66 (0.9%) |
| 85 Years and over | 57 (0.8%) | 155 (2.2%) |
| Total | 7,322 (100.0%) | 7,081 (100.0%) |
Families and Households in Lindenhurst
Median Family Size in Lindenhurst
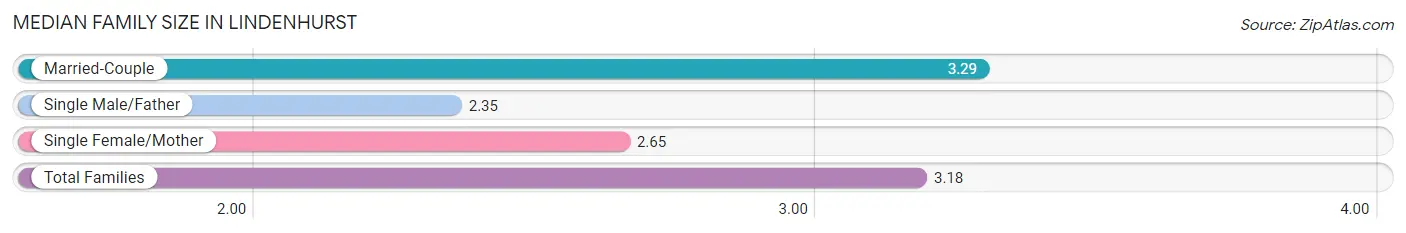
The median family size in Lindenhurst is 3.18 persons per family, with married-couple families (3,402 | 84.9%) accounting for the largest median family size of 3.29 persons per family. On the other hand, single male/father families (138 | 3.4%) represent the smallest median family size with 2.35 persons per family.
| Family Type | # Families | Family Size |
| Married-Couple | 3,402 (84.9%) | 3.29 |
| Single Male/Father | 138 (3.4%) | 2.35 |
| Single Female/Mother | 469 (11.7%) | 2.65 |
| Total Families | 4,009 (100.0%) | 3.18 |
Median Household Size in Lindenhurst
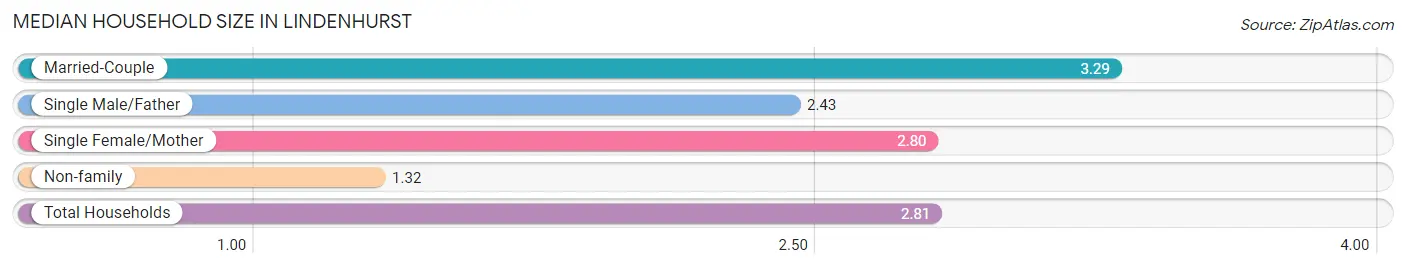
The median household size in Lindenhurst is 2.81 persons per household, with married-couple households (3,402 | 67.1%) accounting for the largest median household size of 3.29 persons per household. non-family households (1,062 | 20.9%) represent the smallest median household size with 1.32 persons per household.
| Household Type | # Households | Household Size |
| Married-Couple | 3,402 (67.1%) | 3.29 |
| Single Male/Father | 138 (2.7%) | 2.43 |
| Single Female/Mother | 469 (9.2%) | 2.80 |
| Non-family | 1,062 (20.9%) | 1.32 |
| Total Households | 5,071 (100.0%) | 2.81 |
Household Size by Marriage Status in Lindenhurst
Out of a total of 5,071 households in Lindenhurst, 4,009 (79.1%) are family households, while 1,062 (20.9%) are nonfamily households. The most numerous type of family households are 2-person households, comprising 1,725, and the most common type of nonfamily households are 1-person households, comprising 797.
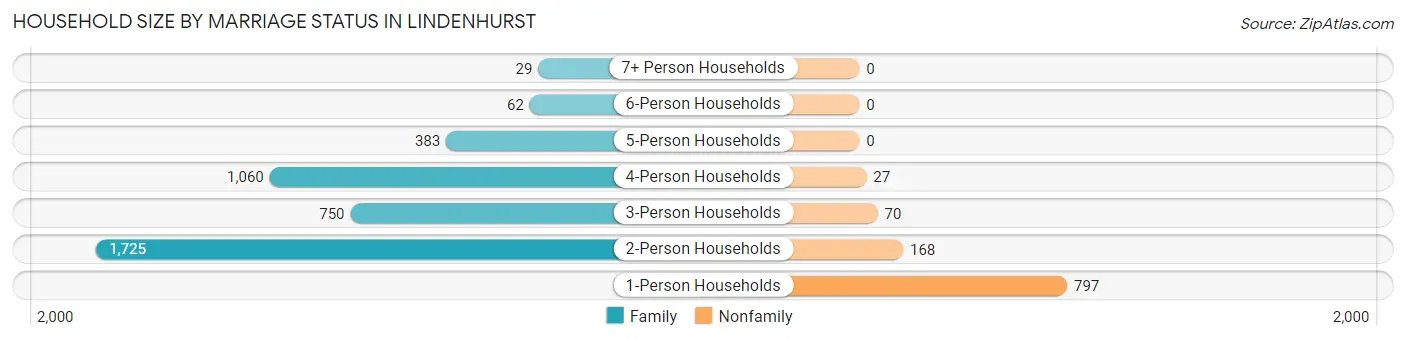
| Household Size | Family Households | Nonfamily Households |
| 1-Person Households | - | 797 (15.7%) |
| 2-Person Households | 1,725 (34.0%) | 168 (3.3%) |
| 3-Person Households | 750 (14.8%) | 70 (1.4%) |
| 4-Person Households | 1,060 (20.9%) | 27 (0.5%) |
| 5-Person Households | 383 (7.5%) | 0 (0.0%) |
| 6-Person Households | 62 (1.2%) | 0 (0.0%) |
| 7+ Person Households | 29 (0.6%) | 0 (0.0%) |
| Total | 4,009 (79.1%) | 1,062 (20.9%) |
Female Fertility in Lindenhurst
Fertility by Age in Lindenhurst
Average fertility rate in Lindenhurst is 43.0 births per 1,000 women. Women in the age bracket of 20 to 34 years have the highest fertility rate with 65.0 births per 1,000 women. Women in the age bracket of 20 to 34 years acount for 55.2% of all women with births.
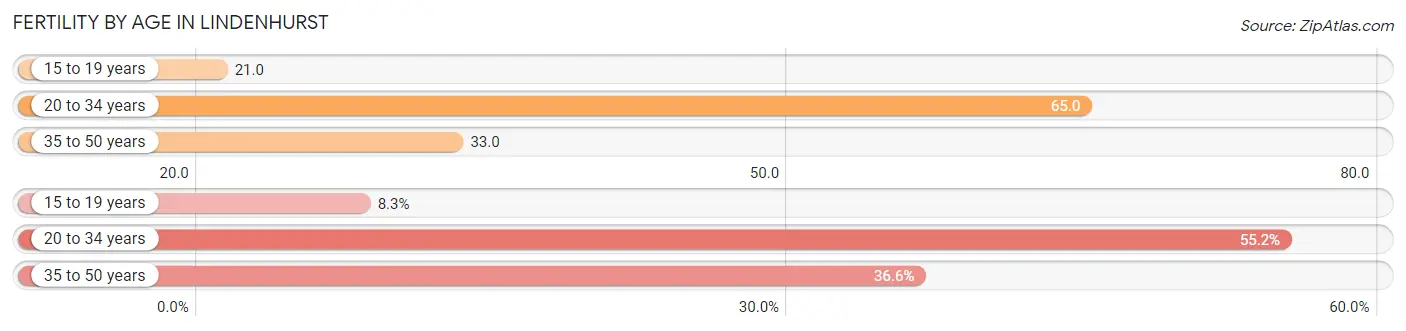
| Age Bracket | Women with Births | Births / 1,000 Women |
| 15 to 19 years | 12 (8.3%) | 21.0 |
| 20 to 34 years | 80 (55.2%) | 65.0 |
| 35 to 50 years | 53 (36.5%) | 33.0 |
| Total | 145 (100.0%) | 43.0 |
Fertility by Age by Marriage Status in Lindenhurst
91.7% of women with births (145) in Lindenhurst are married. The highest percentage of unmarried women with births falls into 15 to 19 years age bracket with 100.0% of them unmarried at the time of birth, while the lowest percentage of unmarried women with births belong to 20 to 34 years age bracket with 0.0% of them unmarried.
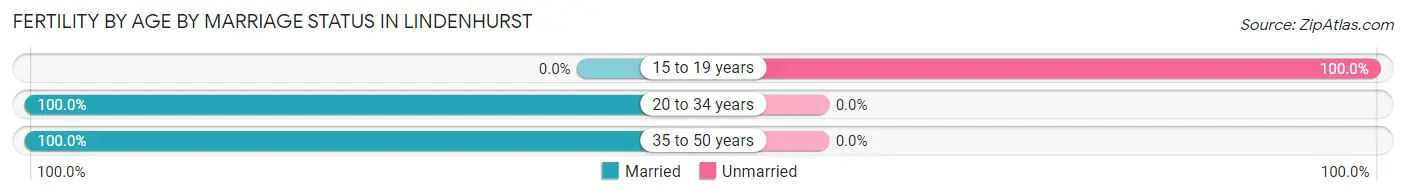
| Age Bracket | Married | Unmarried |
| 15 to 19 years | 0 (0.0%) | 12 (100.0%) |
| 20 to 34 years | 80 (100.0%) | 0 (0.0%) |
| 35 to 50 years | 53 (100.0%) | 0 (0.0%) |
| Total | 133 (91.7%) | 12 (8.3%) |
Fertility by Education in Lindenhurst
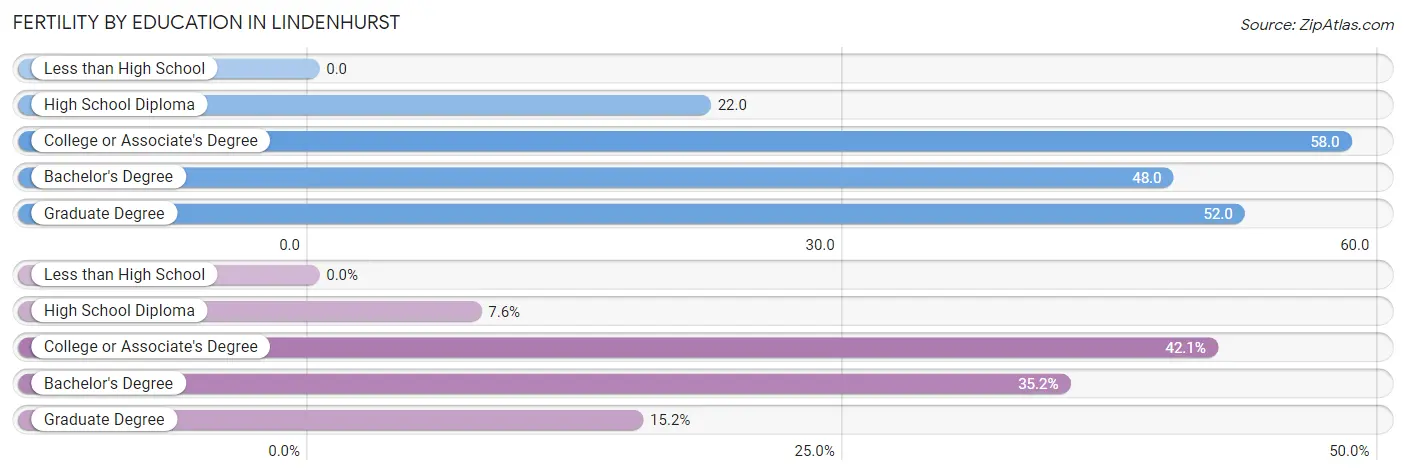
| Educational Attainment | Women with Births | Births / 1,000 Women |
| Less than High School | 0 (0.0%) | 0.0 |
| High School Diploma | 11 (7.6%) | 22.0 |
| College or Associate's Degree | 61 (42.1%) | 58.0 |
| Bachelor's Degree | 51 (35.2%) | 48.0 |
| Graduate Degree | 22 (15.2%) | 52.0 |
| Total | 145 (100.0%) | 43.0 |
Fertility by Education by Marriage Status in Lindenhurst
8.3% of women with births in Lindenhurst are unmarried. Women with the educational attainment of high school diploma are most likely to be married with 100.0% of them married at childbirth, while women with the educational attainment of college or associate's degree are least likely to be married with 19.7% of them unmarried at childbirth.
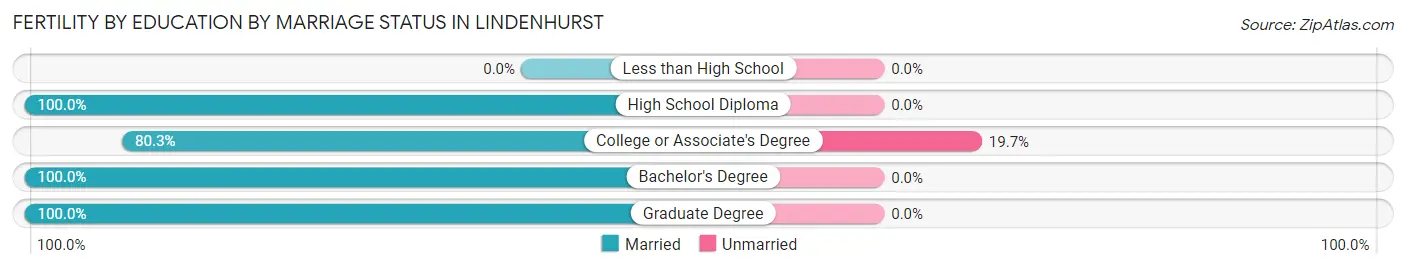
| Educational Attainment | Married | Unmarried |
| Less than High School | 0 (0.0%) | 0 (0.0%) |
| High School Diploma | 11 (100.0%) | 0 (0.0%) |
| College or Associate's Degree | 49 (80.3%) | 12 (19.7%) |
| Bachelor's Degree | 51 (100.0%) | 0 (0.0%) |
| Graduate Degree | 22 (100.0%) | 0 (0.0%) |
| Total | 133 (91.7%) | 12 (8.3%) |
Employment Characteristics in Lindenhurst
Employment by Class of Employer in Lindenhurst
Among the 7,886 employed individuals in Lindenhurst, private company employees (6,029 | 76.4%), local government employees (833 | 10.6%), and not-for-profit organizations (281 | 3.6%) make up the most common classes of employment.
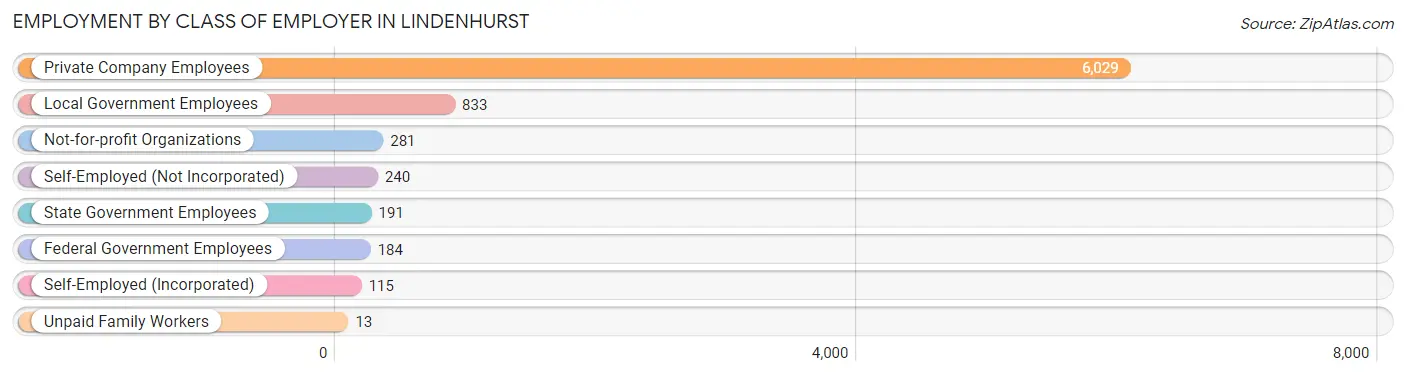
| Employer Class | # Employees | % Employees |
| Private Company Employees | 6,029 | 76.4% |
| Self-Employed (Incorporated) | 115 | 1.5% |
| Self-Employed (Not Incorporated) | 240 | 3.0% |
| Not-for-profit Organizations | 281 | 3.6% |
| Local Government Employees | 833 | 10.6% |
| State Government Employees | 191 | 2.4% |
| Federal Government Employees | 184 | 2.3% |
| Unpaid Family Workers | 13 | 0.2% |
| Total | 7,886 | 100.0% |
Employment Status by Age in Lindenhurst
According to the labor force statistics for Lindenhurst, out of the total population over 16 years of age (11,324), 75.8% or 8,584 individuals are in the labor force, with 6.7% or 575 of them unemployed. The age group with the highest labor force participation rate is 30 to 34 years, with 96.5% or 1,011 individuals in the labor force. Within the labor force, the 16 to 19 years age range has the highest percentage of unemployed individuals, with 26.1% or 128 of them being unemployed.
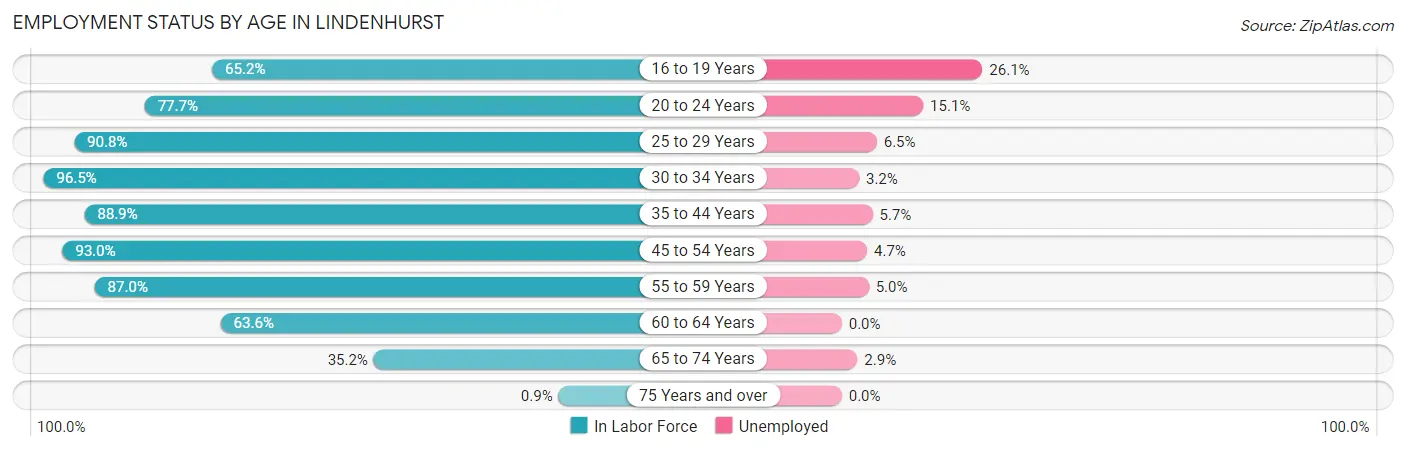
| Age Bracket | In Labor Force | Unemployed |
| 16 to 19 Years | 490 (65.2%) | 128 (26.1%) |
| 20 to 24 Years | 730 (77.7%) | 110 (15.1%) |
| 25 to 29 Years | 727 (90.8%) | 47 (6.5%) |
| 30 to 34 Years | 1,011 (96.5%) | 32 (3.2%) |
| 35 to 44 Years | 1,728 (88.9%) | 98 (5.7%) |
| 45 to 54 Years | 2,069 (93.0%) | 97 (4.7%) |
| 55 to 59 Years | 1,043 (87.0%) | 52 (5.0%) |
| 60 to 64 Years | 360 (63.6%) | 0 (0.0%) |
| 65 to 74 Years | 416 (35.2%) | 12 (2.9%) |
| 75 Years and over | 6 (0.9%) | 0 (0.0%) |
| Total | 8,584 (75.8%) | 575 (6.7%) |
Employment Status by Educational Attainment in Lindenhurst
According to labor force statistics for Lindenhurst, 89.2% of individuals (6,942) out of the total population between 25 and 64 years of age (7,783) are in the labor force, with 4.7% or 326 of them being unemployed. The group with the highest labor force participation rate are those with the educational attainment of bachelor's degree or higher, with 91.0% or 3,248 individuals in the labor force. Within the labor force, individuals with high school diploma education have the highest percentage of unemployment, with 8.4% or 105 of them being unemployed.
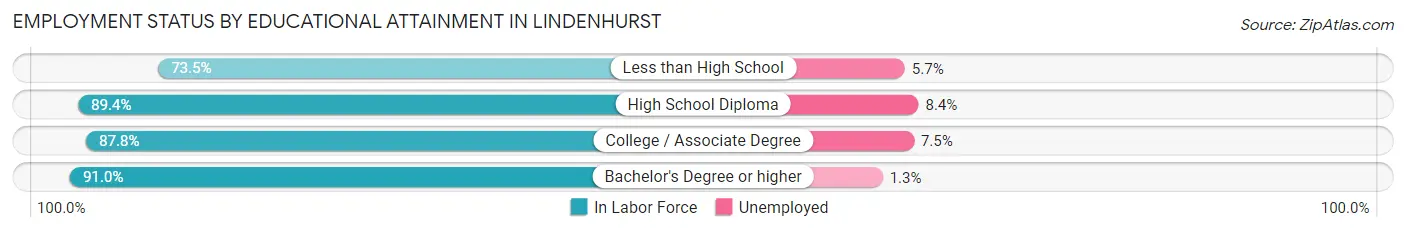
| Educational Attainment | In Labor Force | Unemployed |
| Less than High School | 158 (73.5%) | 12 (5.7%) |
| High School Diploma | 1,252 (89.4%) | 118 (8.4%) |
| College / Associate Degree | 2,281 (87.8%) | 195 (7.5%) |
| Bachelor's Degree or higher | 3,248 (91.0%) | 46 (1.3%) |
| Total | 6,942 (89.2%) | 366 (4.7%) |
Employment Occupations by Sex in Lindenhurst
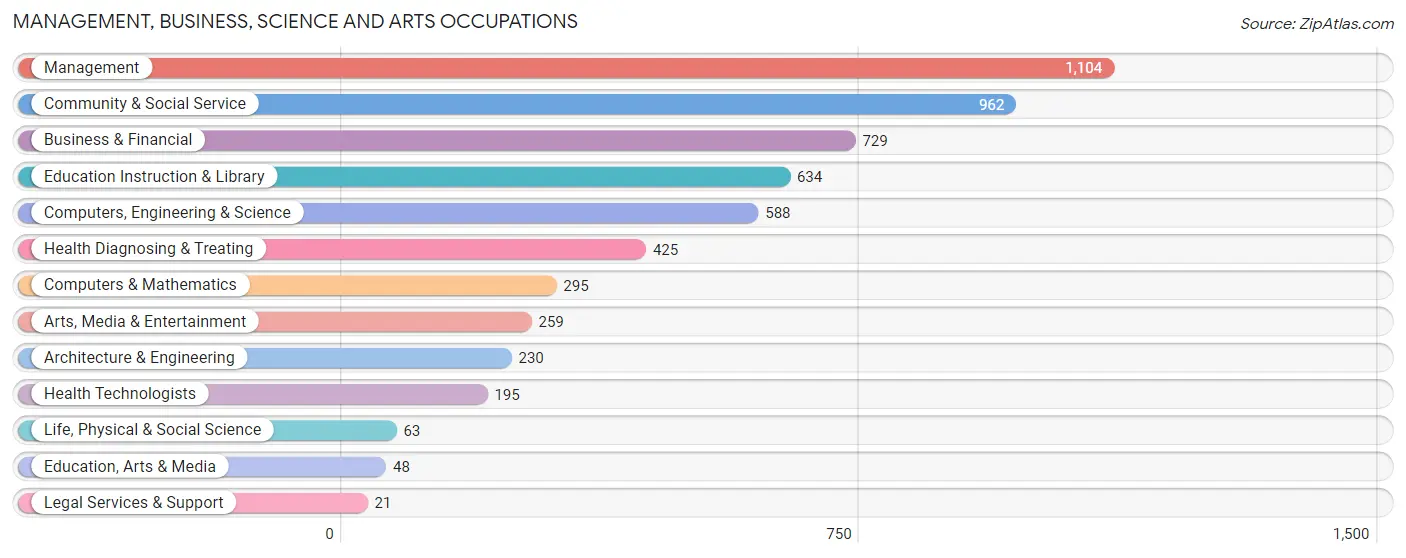
Management, Business, Science and Arts Occupations
The most common Management, Business, Science and Arts occupations in Lindenhurst are Management (1,104 | 13.9%), Community & Social Service (962 | 12.1%), Business & Financial (729 | 9.2%), Education Instruction & Library (634 | 8.0%), and Computers, Engineering & Science (588 | 7.4%).
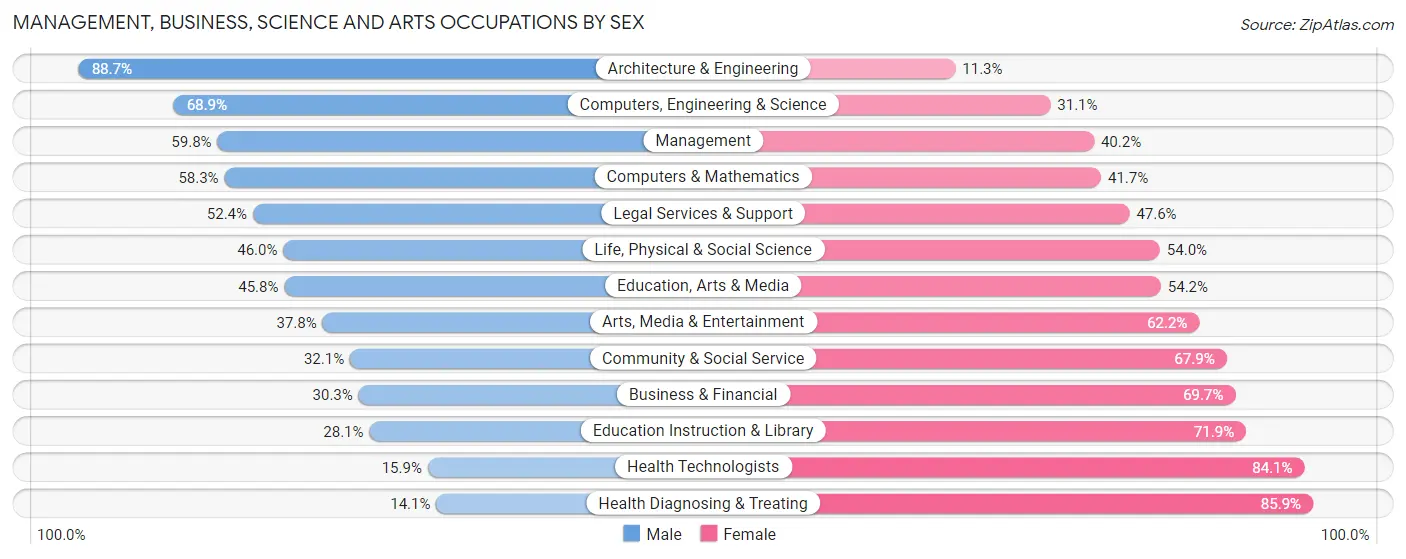
Management, Business, Science and Arts Occupations by Sex
Within the Management, Business, Science and Arts occupations in Lindenhurst, the most male-oriented occupations are Architecture & Engineering (88.7%), Computers, Engineering & Science (68.9%), and Management (59.8%), while the most female-oriented occupations are Health Diagnosing & Treating (85.9%), Health Technologists (84.1%), and Education Instruction & Library (71.9%).
| Occupation | Male | Female |
| Management | 660 (59.8%) | 444 (40.2%) |
| Business & Financial | 221 (30.3%) | 508 (69.7%) |
| Computers, Engineering & Science | 405 (68.9%) | 183 (31.1%) |
| Computers & Mathematics | 172 (58.3%) | 123 (41.7%) |
| Architecture & Engineering | 204 (88.7%) | 26 (11.3%) |
| Life, Physical & Social Science | 29 (46.0%) | 34 (54.0%) |
| Community & Social Service | 309 (32.1%) | 653 (67.9%) |
| Education, Arts & Media | 22 (45.8%) | 26 (54.2%) |
| Legal Services & Support | 11 (52.4%) | 10 (47.6%) |
| Education Instruction & Library | 178 (28.1%) | 456 (71.9%) |
| Arts, Media & Entertainment | 98 (37.8%) | 161 (62.2%) |
| Health Diagnosing & Treating | 60 (14.1%) | 365 (85.9%) |
| Health Technologists | 31 (15.9%) | 164 (84.1%) |
| Total (Category) | 1,655 (43.5%) | 2,153 (56.5%) |
| Total (Overall) | 4,219 (53.2%) | 3,705 (46.8%) |
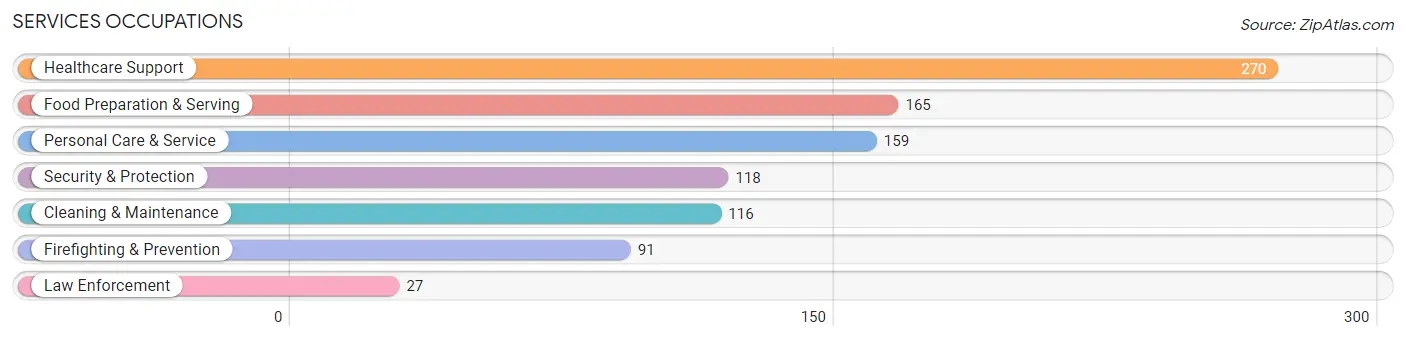
Services Occupations
The most common Services occupations in Lindenhurst are Healthcare Support (270 | 3.4%), Food Preparation & Serving (165 | 2.1%), Personal Care & Service (159 | 2.0%), Security & Protection (118 | 1.5%), and Cleaning & Maintenance (116 | 1.5%).
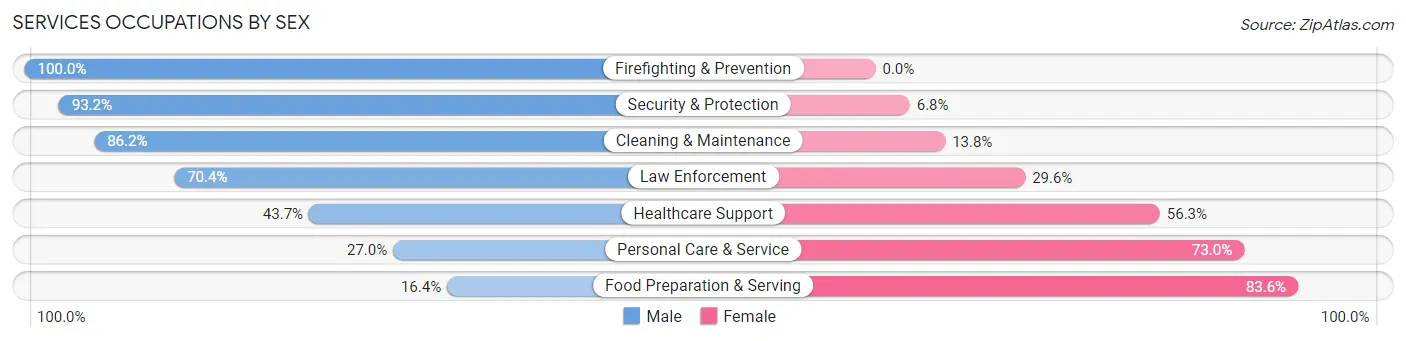
Services Occupations by Sex
Within the Services occupations in Lindenhurst, the most male-oriented occupations are Firefighting & Prevention (100.0%), Security & Protection (93.2%), and Cleaning & Maintenance (86.2%), while the most female-oriented occupations are Food Preparation & Serving (83.6%), Personal Care & Service (73.0%), and Healthcare Support (56.3%).
| Occupation | Male | Female |
| Healthcare Support | 118 (43.7%) | 152 (56.3%) |
| Security & Protection | 110 (93.2%) | 8 (6.8%) |
| Firefighting & Prevention | 91 (100.0%) | 0 (0.0%) |
| Law Enforcement | 19 (70.4%) | 8 (29.6%) |
| Food Preparation & Serving | 27 (16.4%) | 138 (83.6%) |
| Cleaning & Maintenance | 100 (86.2%) | 16 (13.8%) |
| Personal Care & Service | 43 (27.0%) | 116 (73.0%) |
| Total (Category) | 398 (48.1%) | 430 (51.9%) |
| Total (Overall) | 4,219 (53.2%) | 3,705 (46.8%) |
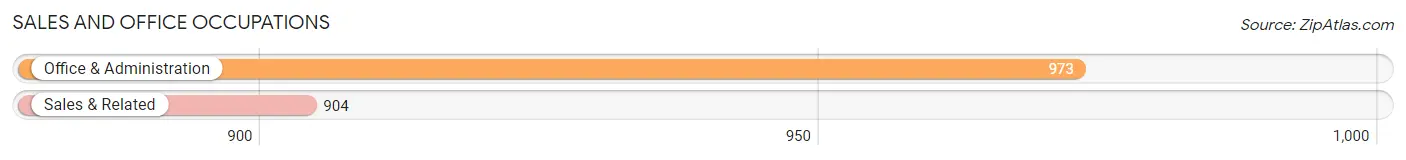
Sales and Office Occupations
The most common Sales and Office occupations in Lindenhurst are Office & Administration (973 | 12.3%), and Sales & Related (904 | 11.4%).
Sales and Office Occupations by Sex
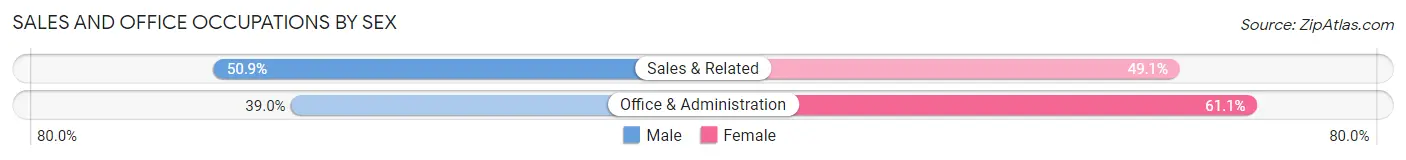
| Occupation | Male | Female |
| Sales & Related | 460 (50.9%) | 444 (49.1%) |
| Office & Administration | 379 (39.0%) | 594 (61.1%) |
| Total (Category) | 839 (44.7%) | 1,038 (55.3%) |
| Total (Overall) | 4,219 (53.2%) | 3,705 (46.8%) |
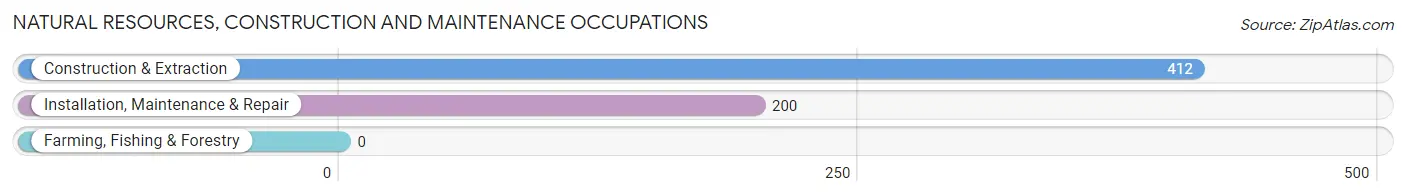
Natural Resources, Construction and Maintenance Occupations
The most common Natural Resources, Construction and Maintenance occupations in Lindenhurst are Construction & Extraction (412 | 5.2%), and Installation, Maintenance & Repair (200 | 2.5%).
Natural Resources, Construction and Maintenance Occupations by Sex
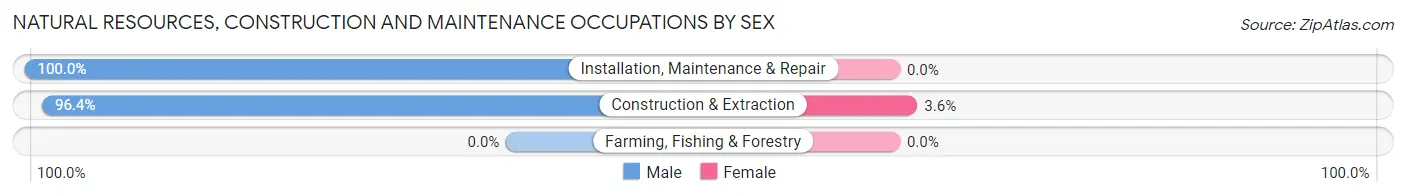
| Occupation | Male | Female |
| Farming, Fishing & Forestry | 0 (0.0%) | 0 (0.0%) |
| Construction & Extraction | 397 (96.4%) | 15 (3.6%) |
| Installation, Maintenance & Repair | 200 (100.0%) | 0 (0.0%) |
| Total (Category) | 597 (97.6%) | 15 (2.5%) |
| Total (Overall) | 4,219 (53.2%) | 3,705 (46.8%) |
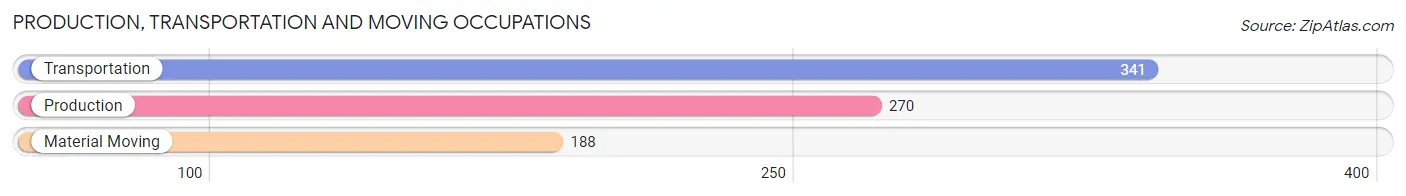
Production, Transportation and Moving Occupations
The most common Production, Transportation and Moving occupations in Lindenhurst are Transportation (341 | 4.3%), Production (270 | 3.4%), and Material Moving (188 | 2.4%).
Production, Transportation and Moving Occupations by Sex
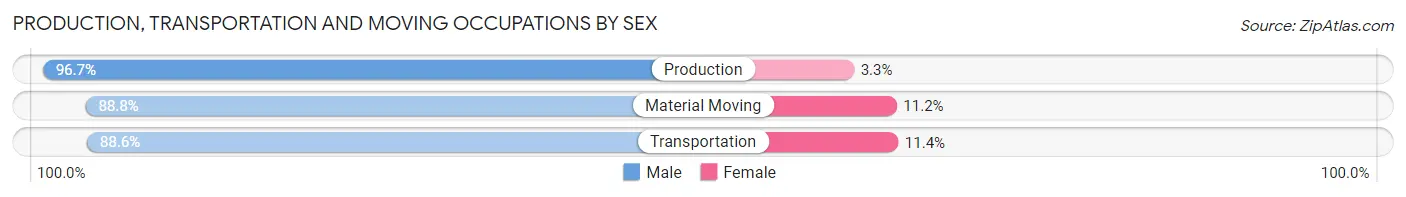
| Occupation | Male | Female |
| Production | 261 (96.7%) | 9 (3.3%) |
| Transportation | 302 (88.6%) | 39 (11.4%) |
| Material Moving | 167 (88.8%) | 21 (11.2%) |
| Total (Category) | 730 (91.4%) | 69 (8.6%) |
| Total (Overall) | 4,219 (53.2%) | 3,705 (46.8%) |
Employment Industries by Sex in Lindenhurst
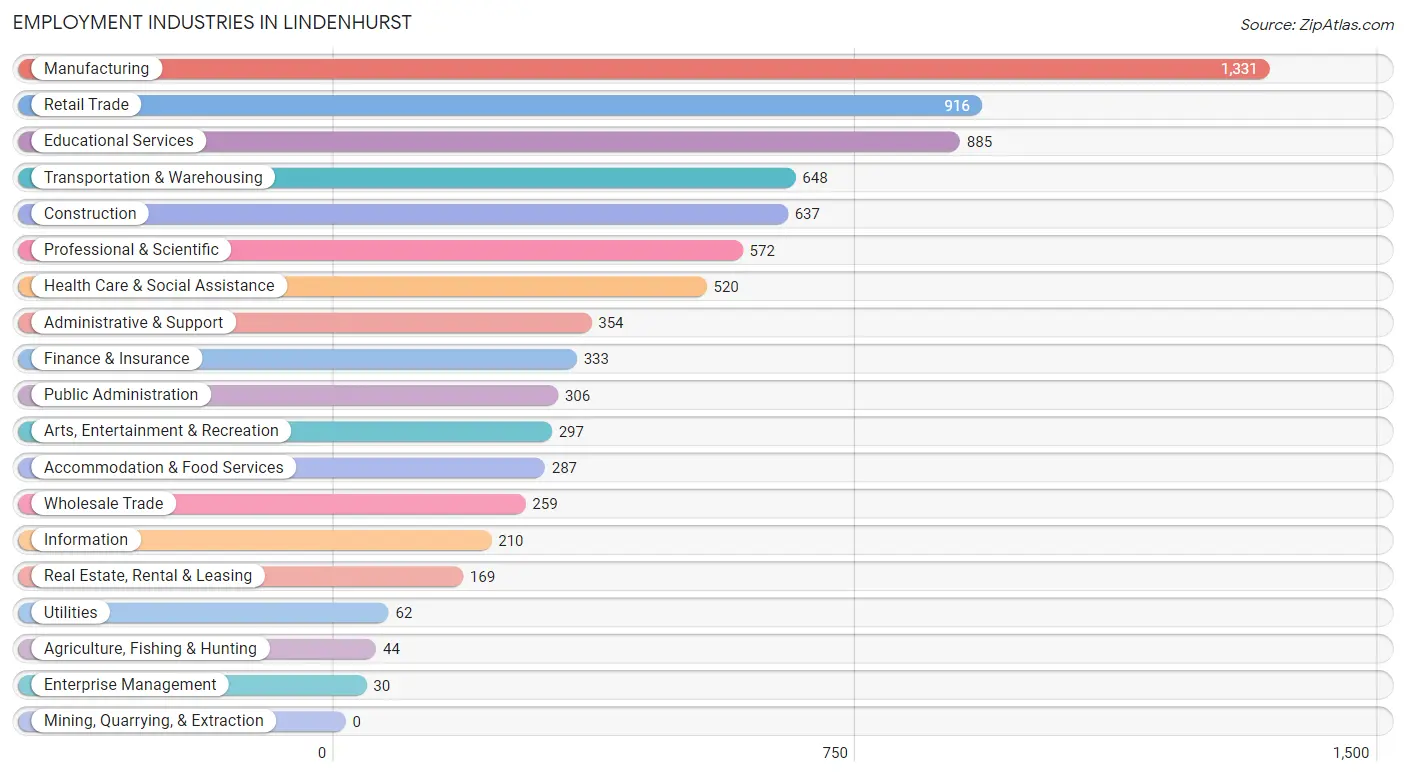
Employment Industries in Lindenhurst
The major employment industries in Lindenhurst include Manufacturing (1,331 | 16.8%), Retail Trade (916 | 11.6%), Educational Services (885 | 11.2%), Transportation & Warehousing (648 | 8.2%), and Construction (637 | 8.0%).
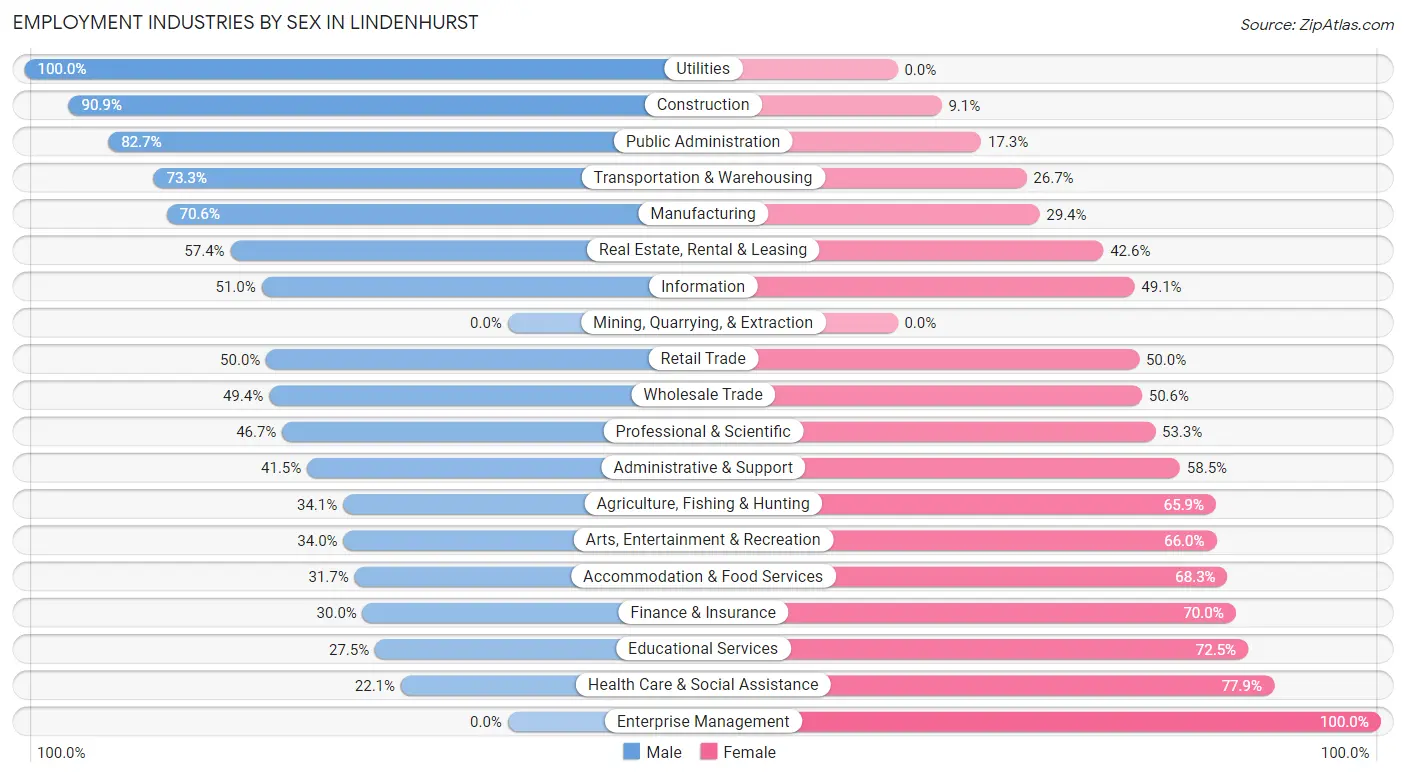
Employment Industries by Sex in Lindenhurst
The Lindenhurst industries that see more men than women are Utilities (100.0%), Construction (90.9%), and Public Administration (82.7%), whereas the industries that tend to have a higher number of women are Enterprise Management (100.0%), Health Care & Social Assistance (77.9%), and Educational Services (72.5%).
| Industry | Male | Female |
| Agriculture, Fishing & Hunting | 15 (34.1%) | 29 (65.9%) |
| Mining, Quarrying, & Extraction | 0 (0.0%) | 0 (0.0%) |
| Construction | 579 (90.9%) | 58 (9.1%) |
| Manufacturing | 940 (70.6%) | 391 (29.4%) |
| Wholesale Trade | 128 (49.4%) | 131 (50.6%) |
| Retail Trade | 458 (50.0%) | 458 (50.0%) |
| Transportation & Warehousing | 475 (73.3%) | 173 (26.7%) |
| Utilities | 62 (100.0%) | 0 (0.0%) |
| Information | 107 (50.9%) | 103 (49.0%) |
| Finance & Insurance | 100 (30.0%) | 233 (70.0%) |
| Real Estate, Rental & Leasing | 97 (57.4%) | 72 (42.6%) |
| Professional & Scientific | 267 (46.7%) | 305 (53.3%) |
| Enterprise Management | 0 (0.0%) | 30 (100.0%) |
| Administrative & Support | 147 (41.5%) | 207 (58.5%) |
| Educational Services | 243 (27.5%) | 642 (72.5%) |
| Health Care & Social Assistance | 115 (22.1%) | 405 (77.9%) |
| Arts, Entertainment & Recreation | 101 (34.0%) | 196 (66.0%) |
| Accommodation & Food Services | 91 (31.7%) | 196 (68.3%) |
| Public Administration | 253 (82.7%) | 53 (17.3%) |
| Total | 4,219 (53.2%) | 3,705 (46.8%) |
Education in Lindenhurst
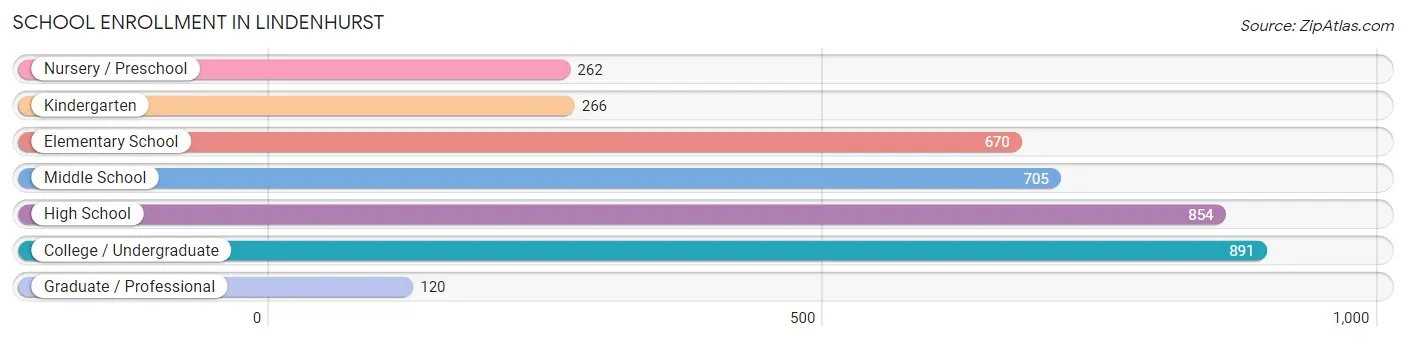
School Enrollment in Lindenhurst
The most common levels of schooling among the 3,768 students in Lindenhurst are college / undergraduate (891 | 23.6%), high school (854 | 22.7%), and middle school (705 | 18.7%).
| School Level | # Students | % Students |
| Nursery / Preschool | 262 | 7.0% |
| Kindergarten | 266 | 7.1% |
| Elementary School | 670 | 17.8% |
| Middle School | 705 | 18.7% |
| High School | 854 | 22.7% |
| College / Undergraduate | 891 | 23.6% |
| Graduate / Professional | 120 | 3.2% |
| Total | 3,768 | 100.0% |
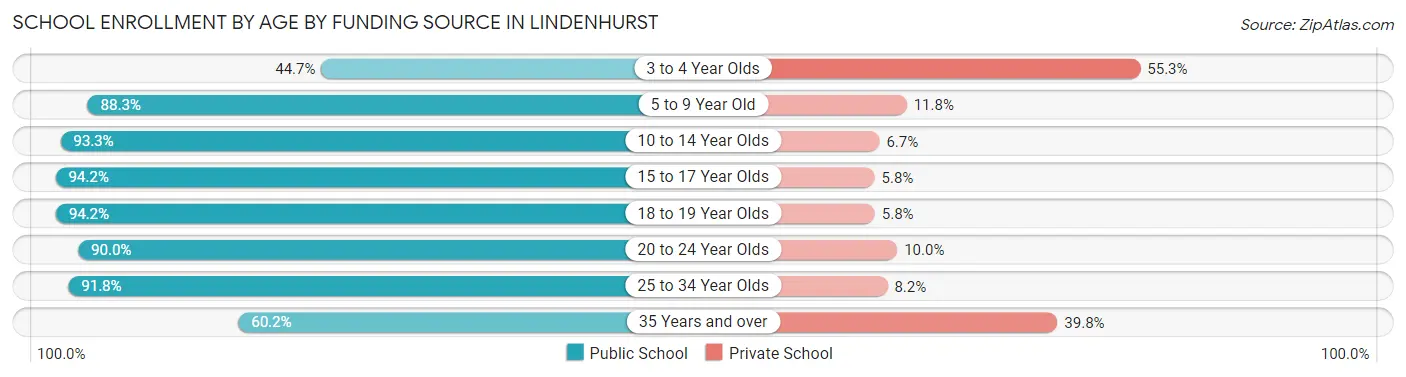
School Enrollment by Age by Funding Source in Lindenhurst
Out of a total of 3,768 students who are enrolled in schools in Lindenhurst, 490 (13.0%) attend a private institution, while the remaining 3,278 (87.0%) are enrolled in public schools. The age group of 3 to 4 year olds has the highest likelihood of being enrolled in private schools, with 126 (55.3% in the age bracket) enrolled. Conversely, the age group of 15 to 17 year olds has the lowest likelihood of being enrolled in a private school, with 573 (94.2% in the age bracket) attending a public institution.
| Age Bracket | Public School | Private School |
| 3 to 4 Year Olds | 102 (44.7%) | 126 (55.3%) |
| 5 to 9 Year Old | 804 (88.2%) | 107 (11.7%) |
| 10 to 14 Year Olds | 826 (93.3%) | 59 (6.7%) |
| 15 to 17 Year Olds | 573 (94.2%) | 35 (5.8%) |
| 18 to 19 Year Olds | 243 (94.2%) | 15 (5.8%) |
| 20 to 24 Year Olds | 424 (90.0%) | 47 (10.0%) |
| 25 to 34 Year Olds | 180 (91.8%) | 16 (8.2%) |
| 35 Years and over | 127 (60.2%) | 84 (39.8%) |
| Total | 3,278 (87.0%) | 490 (13.0%) |
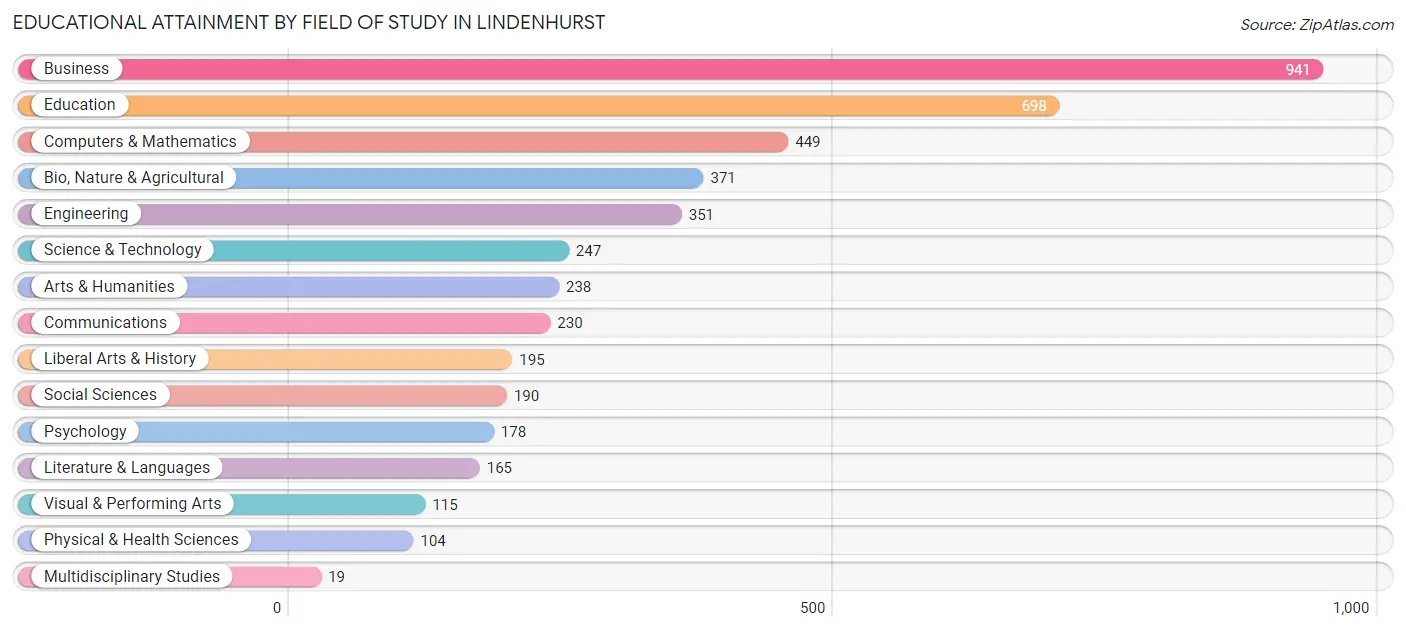
Educational Attainment by Field of Study in Lindenhurst
Business (941 | 20.9%), education (698 | 15.5%), computers & mathematics (449 | 10.0%), bio, nature & agricultural (371 | 8.3%), and engineering (351 | 7.8%) are the most common fields of study among 4,491 individuals in Lindenhurst who have obtained a bachelor's degree or higher.
| Field of Study | # Graduates | % Graduates |
| Computers & Mathematics | 449 | 10.0% |
| Bio, Nature & Agricultural | 371 | 8.3% |
| Physical & Health Sciences | 104 | 2.3% |
| Psychology | 178 | 4.0% |
| Social Sciences | 190 | 4.2% |
| Engineering | 351 | 7.8% |
| Multidisciplinary Studies | 19 | 0.4% |
| Science & Technology | 247 | 5.5% |
| Business | 941 | 20.9% |
| Education | 698 | 15.5% |
| Literature & Languages | 165 | 3.7% |
| Liberal Arts & History | 195 | 4.3% |
| Visual & Performing Arts | 115 | 2.6% |
| Communications | 230 | 5.1% |
| Arts & Humanities | 238 | 5.3% |
| Total | 4,491 | 100.0% |
Transportation & Commute in Lindenhurst
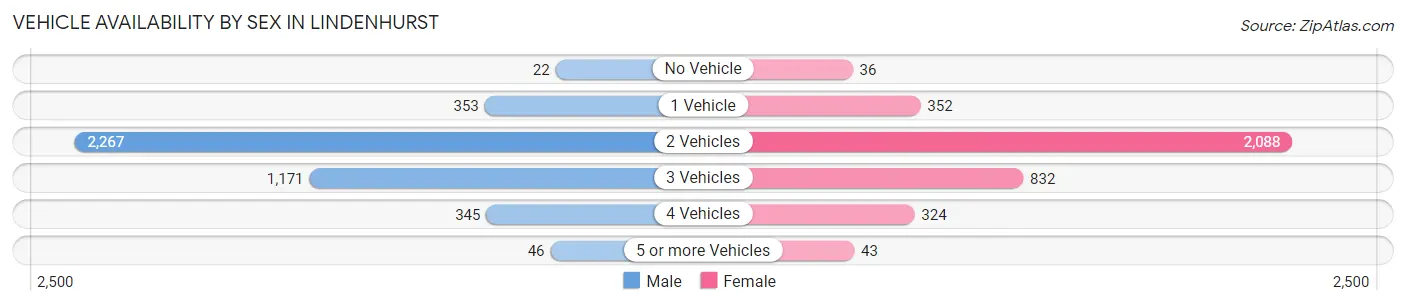
Vehicle Availability by Sex in Lindenhurst
The most prevalent vehicle ownership categories in Lindenhurst are males with 2 vehicles (2,267, accounting for 53.9%) and females with 2 vehicles (2,088, making up 61.7%).
| Vehicles Available | Male | Female |
| No Vehicle | 22 (0.5%) | 36 (1.0%) |
| 1 Vehicle | 353 (8.4%) | 352 (9.6%) |
| 2 Vehicles | 2,267 (53.9%) | 2,088 (56.8%) |
| 3 Vehicles | 1,171 (27.9%) | 832 (22.6%) |
| 4 Vehicles | 345 (8.2%) | 324 (8.8%) |
| 5 or more Vehicles | 46 (1.1%) | 43 (1.2%) |
| Total | 4,204 (100.0%) | 3,675 (100.0%) |
Commute Time in Lindenhurst
The most frequently occuring commute durations in Lindenhurst are 30 to 34 minutes (1,210 commuters, 17.8%), 20 to 24 minutes (983 commuters, 14.5%), and 45 to 59 minutes (807 commuters, 11.9%).
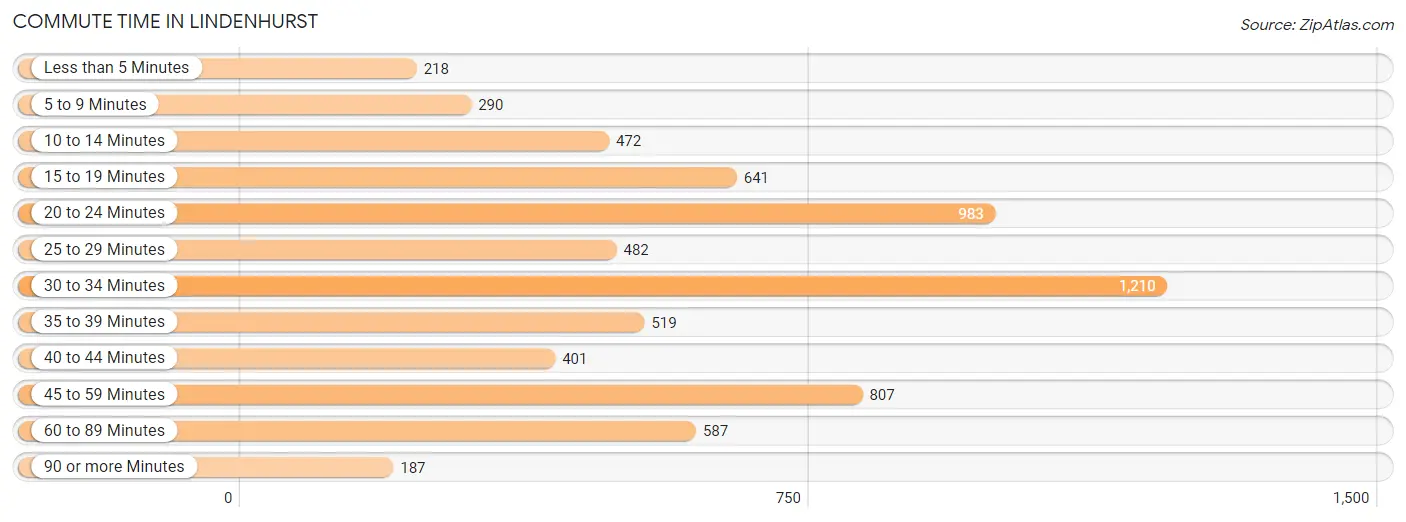
| Commute Time | # Commuters | % Commuters |
| Less than 5 Minutes | 218 | 3.2% |
| 5 to 9 Minutes | 290 | 4.3% |
| 10 to 14 Minutes | 472 | 6.9% |
| 15 to 19 Minutes | 641 | 9.4% |
| 20 to 24 Minutes | 983 | 14.5% |
| 25 to 29 Minutes | 482 | 7.1% |
| 30 to 34 Minutes | 1,210 | 17.8% |
| 35 to 39 Minutes | 519 | 7.6% |
| 40 to 44 Minutes | 401 | 5.9% |
| 45 to 59 Minutes | 807 | 11.9% |
| 60 to 89 Minutes | 587 | 8.6% |
| 90 or more Minutes | 187 | 2.8% |
Commute Time by Sex in Lindenhurst
The most common commute times in Lindenhurst are 30 to 34 minutes (644 commuters, 17.2%) for males and 30 to 34 minutes (566 commuters, 18.5%) for females.
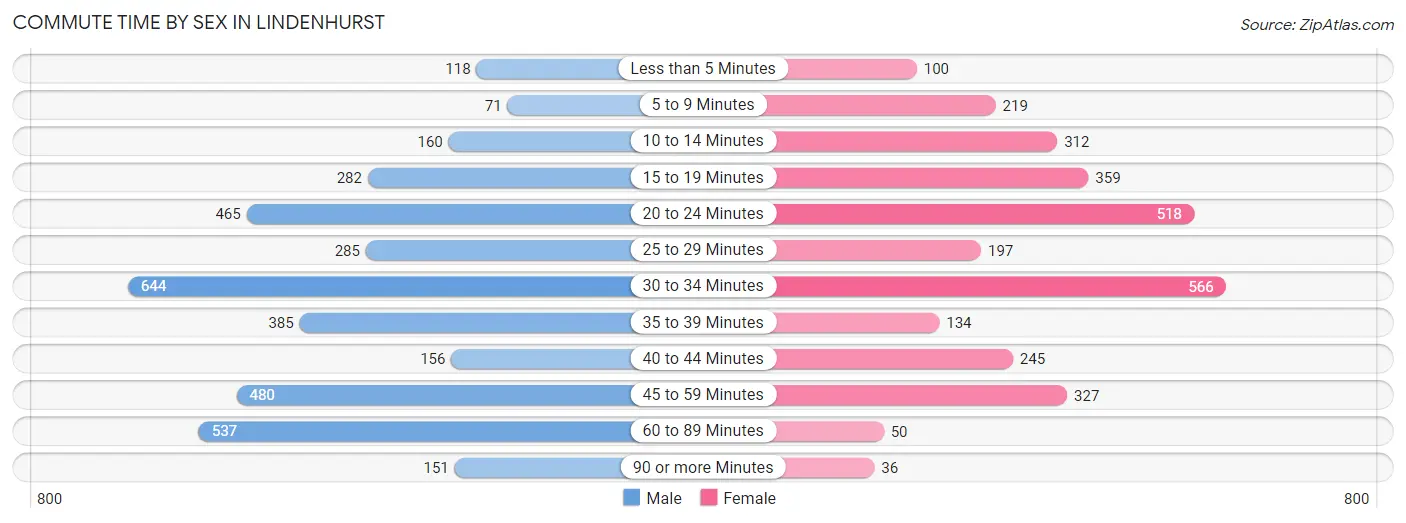
| Commute Time | Male | Female |
| Less than 5 Minutes | 118 (3.2%) | 100 (3.3%) |
| 5 to 9 Minutes | 71 (1.9%) | 219 (7.1%) |
| 10 to 14 Minutes | 160 (4.3%) | 312 (10.2%) |
| 15 to 19 Minutes | 282 (7.5%) | 359 (11.7%) |
| 20 to 24 Minutes | 465 (12.4%) | 518 (16.9%) |
| 25 to 29 Minutes | 285 (7.6%) | 197 (6.4%) |
| 30 to 34 Minutes | 644 (17.2%) | 566 (18.5%) |
| 35 to 39 Minutes | 385 (10.3%) | 134 (4.4%) |
| 40 to 44 Minutes | 156 (4.2%) | 245 (8.0%) |
| 45 to 59 Minutes | 480 (12.9%) | 327 (10.7%) |
| 60 to 89 Minutes | 537 (14.4%) | 50 (1.6%) |
| 90 or more Minutes | 151 (4.0%) | 36 (1.2%) |
Time of Departure to Work by Sex in Lindenhurst
The most frequent times of departure to work in Lindenhurst are 7:00 AM to 7:29 AM (640, 17.1%) for males and 7:00 AM to 7:29 AM (682, 22.3%) for females.
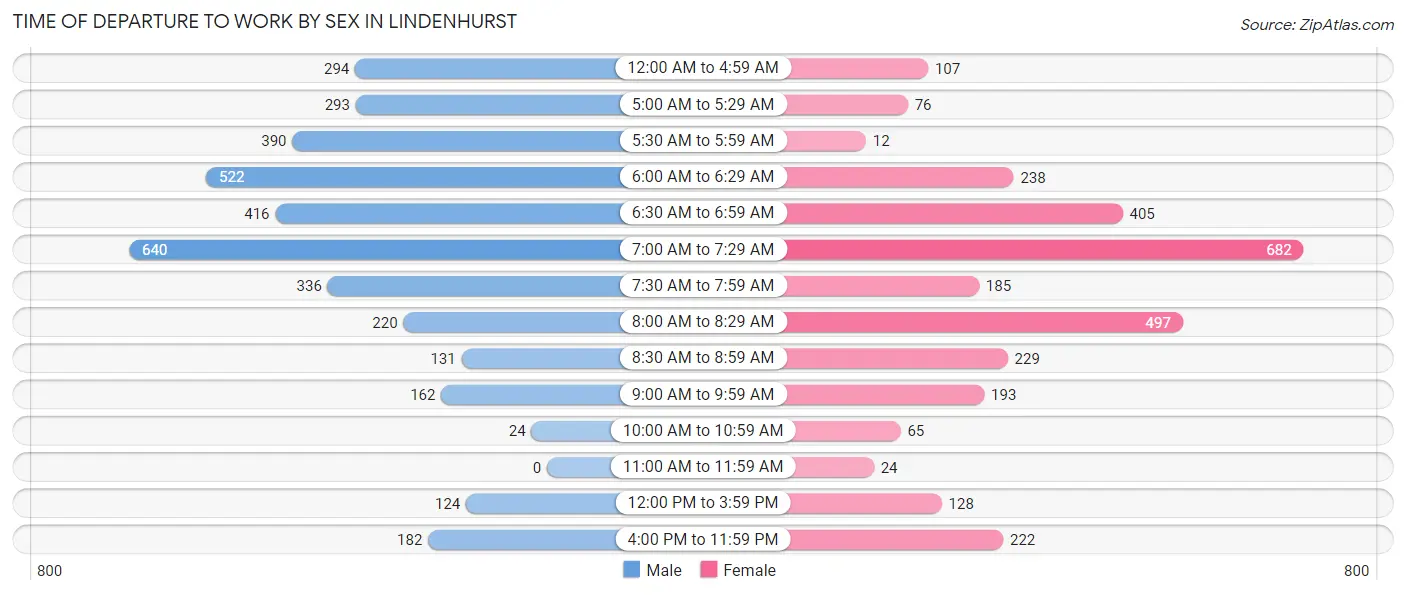
| Time of Departure | Male | Female |
| 12:00 AM to 4:59 AM | 294 (7.9%) | 107 (3.5%) |
| 5:00 AM to 5:29 AM | 293 (7.9%) | 76 (2.5%) |
| 5:30 AM to 5:59 AM | 390 (10.4%) | 12 (0.4%) |
| 6:00 AM to 6:29 AM | 522 (14.0%) | 238 (7.8%) |
| 6:30 AM to 6:59 AM | 416 (11.1%) | 405 (13.2%) |
| 7:00 AM to 7:29 AM | 640 (17.1%) | 682 (22.3%) |
| 7:30 AM to 7:59 AM | 336 (9.0%) | 185 (6.0%) |
| 8:00 AM to 8:29 AM | 220 (5.9%) | 497 (16.2%) |
| 8:30 AM to 8:59 AM | 131 (3.5%) | 229 (7.5%) |
| 9:00 AM to 9:59 AM | 162 (4.3%) | 193 (6.3%) |
| 10:00 AM to 10:59 AM | 24 (0.6%) | 65 (2.1%) |
| 11:00 AM to 11:59 AM | 0 (0.0%) | 24 (0.8%) |
| 12:00 PM to 3:59 PM | 124 (3.3%) | 128 (4.2%) |
| 4:00 PM to 11:59 PM | 182 (4.9%) | 222 (7.2%) |
| Total | 3,734 (100.0%) | 3,063 (100.0%) |
Housing Occupancy in Lindenhurst
Occupancy by Ownership in Lindenhurst
Of the total 5,071 dwellings in Lindenhurst, owner-occupied units account for 4,164 (82.1%), while renter-occupied units make up 907 (17.9%).
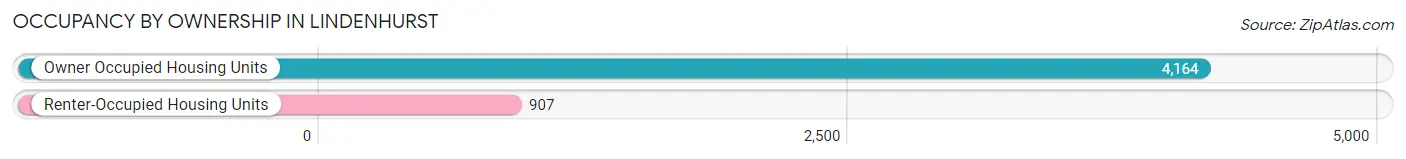
| Occupancy | # Housing Units | % Housing Units |
| Owner Occupied Housing Units | 4,164 | 82.1% |
| Renter-Occupied Housing Units | 907 | 17.9% |
| Total Occupied Housing Units | 5,071 | 100.0% |
Occupancy by Household Size in Lindenhurst
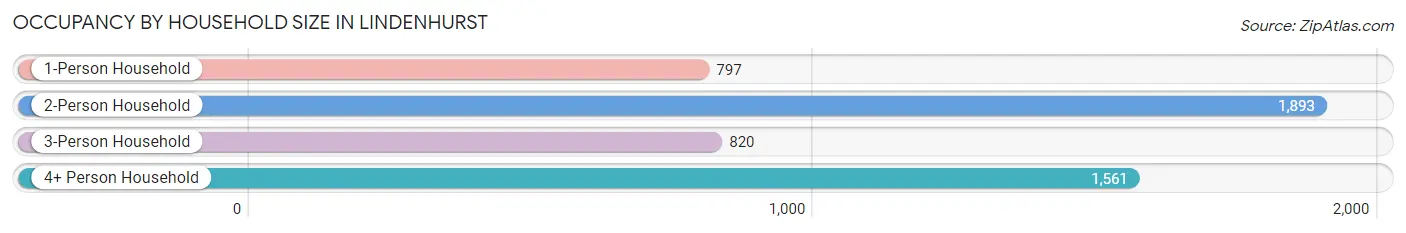
| Household Size | # Housing Units | % Housing Units |
| 1-Person Household | 797 | 15.7% |
| 2-Person Household | 1,893 | 37.3% |
| 3-Person Household | 820 | 16.2% |
| 4+ Person Household | 1,561 | 30.8% |
| Total Housing Units | 5,071 | 100.0% |
Occupancy by Ownership by Household Size in Lindenhurst
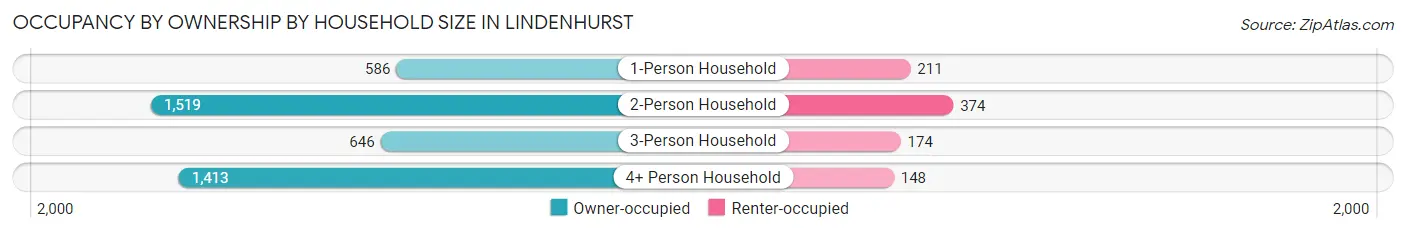
| Household Size | Owner-occupied | Renter-occupied |
| 1-Person Household | 586 (73.5%) | 211 (26.5%) |
| 2-Person Household | 1,519 (80.2%) | 374 (19.8%) |
| 3-Person Household | 646 (78.8%) | 174 (21.2%) |
| 4+ Person Household | 1,413 (90.5%) | 148 (9.5%) |
| Total Housing Units | 4,164 (82.1%) | 907 (17.9%) |
Occupancy by Educational Attainment in Lindenhurst
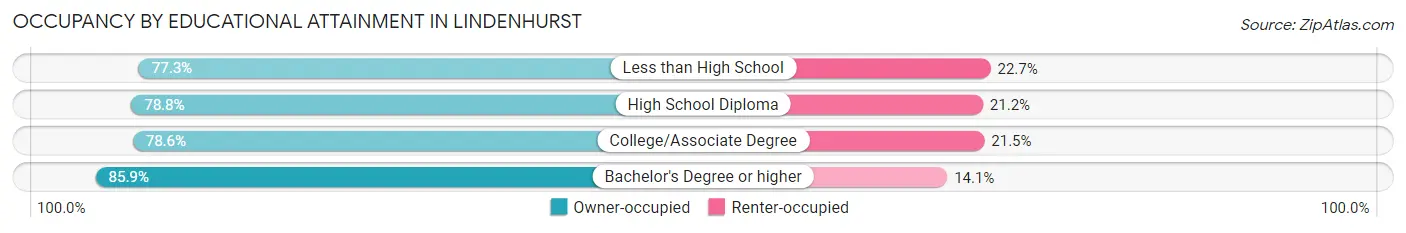
| Household Size | Owner-occupied | Renter-occupied |
| Less than High School | 133 (77.3%) | 39 (22.7%) |
| High School Diploma | 596 (78.8%) | 160 (21.2%) |
| College/Associate Degree | 1,329 (78.5%) | 363 (21.4%) |
| Bachelor's Degree or higher | 2,106 (85.9%) | 345 (14.1%) |
Occupancy by Age of Householder in Lindenhurst
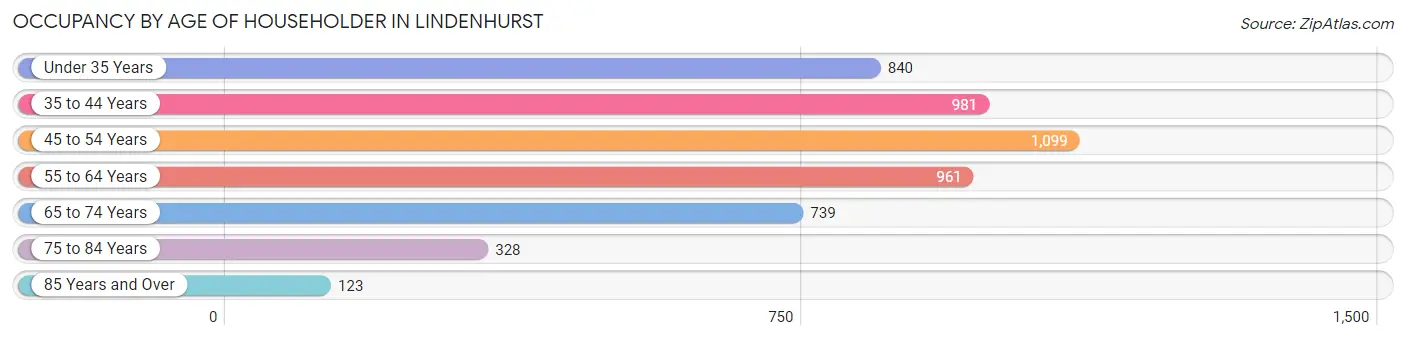
| Age Bracket | # Households | % Households |
| Under 35 Years | 840 | 16.6% |
| 35 to 44 Years | 981 | 19.4% |
| 45 to 54 Years | 1,099 | 21.7% |
| 55 to 64 Years | 961 | 19.0% |
| 65 to 74 Years | 739 | 14.6% |
| 75 to 84 Years | 328 | 6.5% |
| 85 Years and Over | 123 | 2.4% |
| Total | 5,071 | 100.0% |
Housing Finances in Lindenhurst
Median Income by Occupancy in Lindenhurst
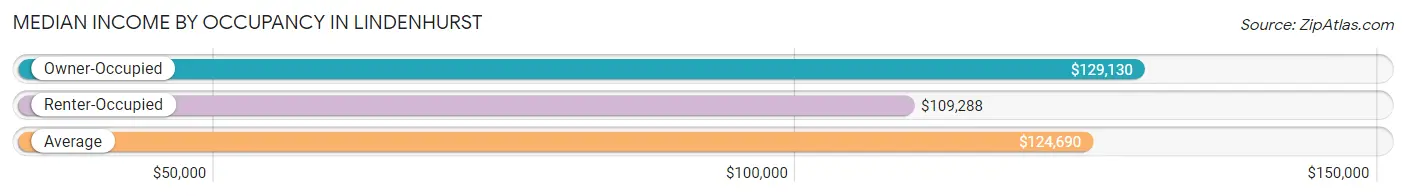
| Occupancy Type | # Households | Median Income |
| Owner-Occupied | 4,164 (82.1%) | $129,130 |
| Renter-Occupied | 907 (17.9%) | $109,288 |
| Average | 5,071 (100.0%) | $124,690 |
Occupancy by Householder Income Bracket in Lindenhurst
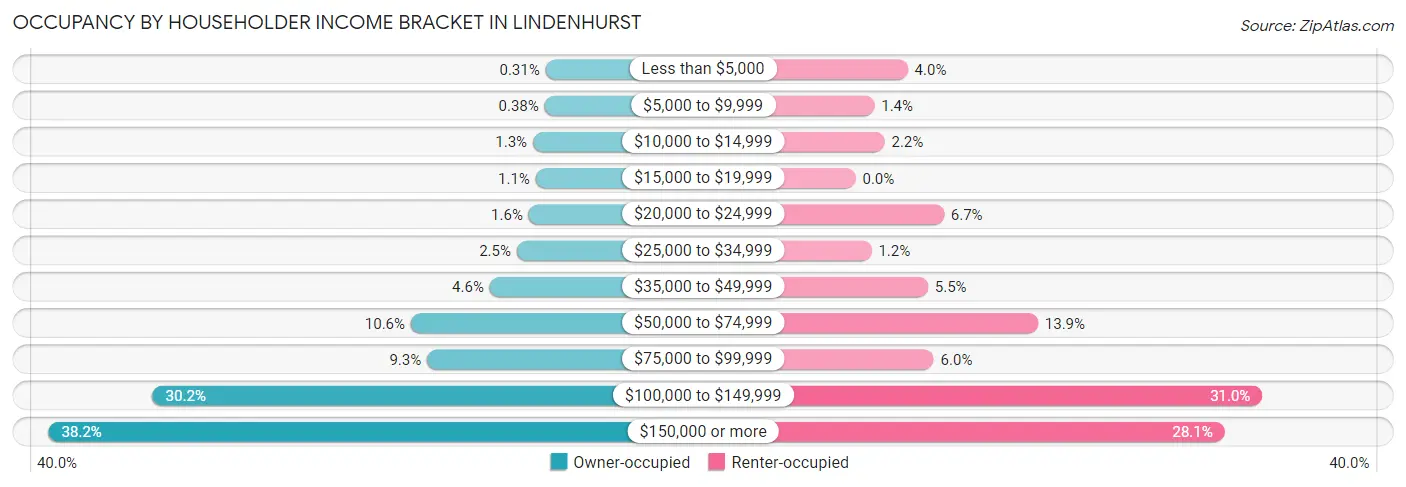
| Income Bracket | Owner-occupied | Renter-occupied |
| Less than $5,000 | 13 (0.3%) | 36 (4.0%) |
| $5,000 to $9,999 | 16 (0.4%) | 13 (1.4%) |
| $10,000 to $14,999 | 53 (1.3%) | 20 (2.2%) |
| $15,000 to $19,999 | 44 (1.1%) | 0 (0.0%) |
| $20,000 to $24,999 | 66 (1.6%) | 61 (6.7%) |
| $25,000 to $34,999 | 104 (2.5%) | 11 (1.2%) |
| $35,000 to $49,999 | 190 (4.6%) | 50 (5.5%) |
| $50,000 to $74,999 | 440 (10.6%) | 126 (13.9%) |
| $75,000 to $99,999 | 389 (9.3%) | 54 (5.9%) |
| $100,000 to $149,999 | 1,259 (30.2%) | 281 (31.0%) |
| $150,000 or more | 1,590 (38.2%) | 255 (28.1%) |
| Total | 4,164 (100.0%) | 907 (100.0%) |
Monthly Housing Cost Tiers in Lindenhurst
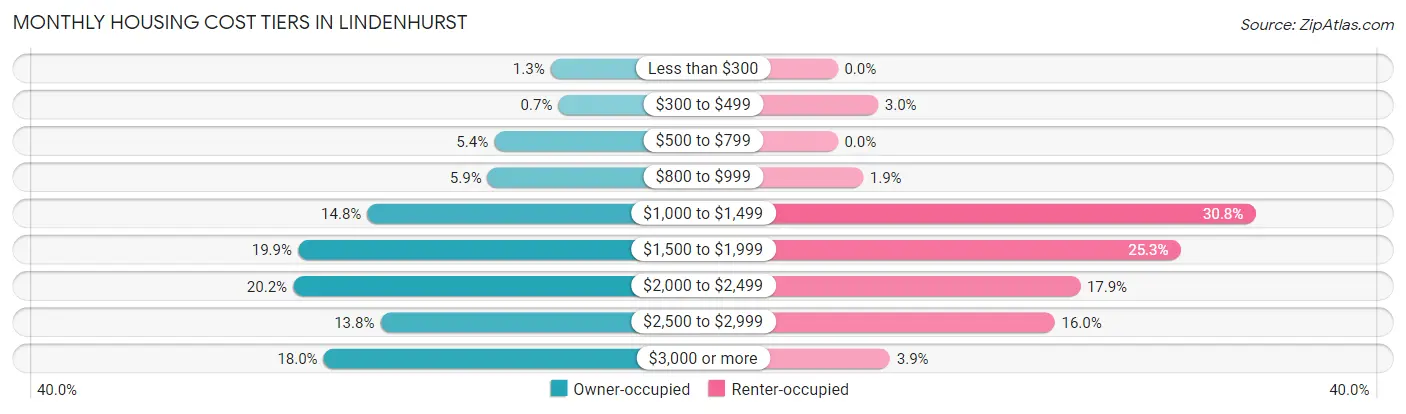
| Monthly Cost | Owner-occupied | Renter-occupied |
| Less than $300 | 53 (1.3%) | 0 (0.0%) |
| $300 to $499 | 29 (0.7%) | 27 (3.0%) |
| $500 to $799 | 226 (5.4%) | 0 (0.0%) |
| $800 to $999 | 246 (5.9%) | 17 (1.9%) |
| $1,000 to $1,499 | 615 (14.8%) | 279 (30.8%) |
| $1,500 to $1,999 | 828 (19.9%) | 229 (25.3%) |
| $2,000 to $2,499 | 843 (20.2%) | 162 (17.9%) |
| $2,500 to $2,999 | 575 (13.8%) | 145 (16.0%) |
| $3,000 or more | 749 (18.0%) | 35 (3.9%) |
| Total | 4,164 (100.0%) | 907 (100.0%) |
Physical Housing Characteristics in Lindenhurst
Housing Structures in Lindenhurst
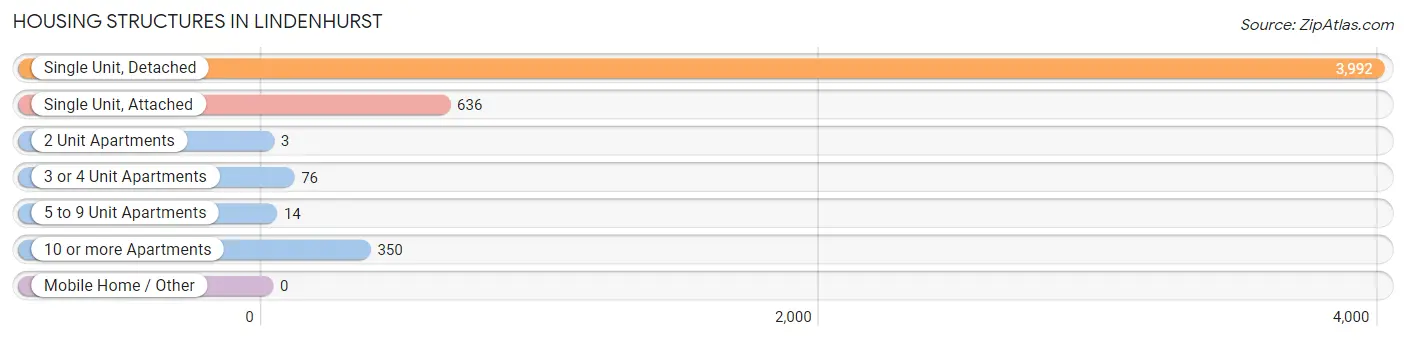
| Structure Type | # Housing Units | % Housing Units |
| Single Unit, Detached | 3,992 | 78.7% |
| Single Unit, Attached | 636 | 12.5% |
| 2 Unit Apartments | 3 | 0.1% |
| 3 or 4 Unit Apartments | 76 | 1.5% |
| 5 to 9 Unit Apartments | 14 | 0.3% |
| 10 or more Apartments | 350 | 6.9% |
| Mobile Home / Other | 0 | 0.0% |
| Total | 5,071 | 100.0% |
Housing Structures by Occupancy in Lindenhurst
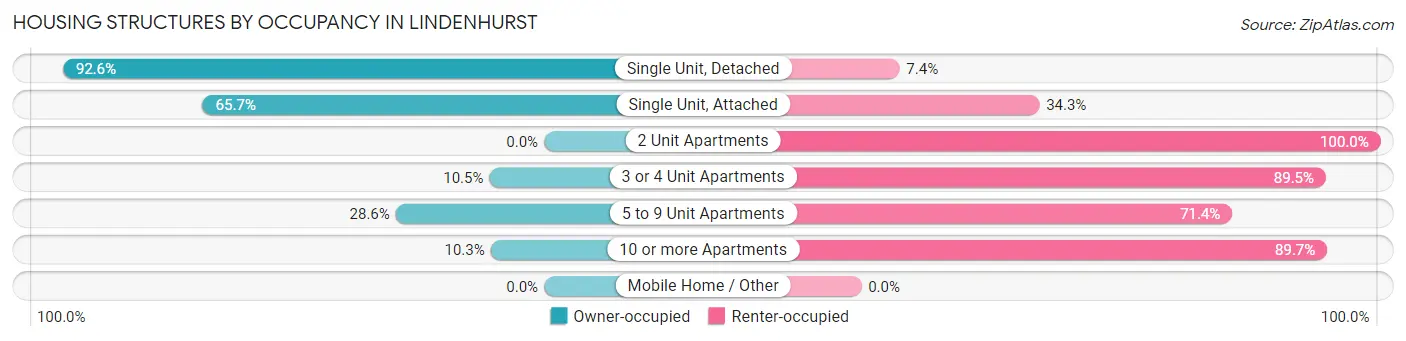
| Structure Type | Owner-occupied | Renter-occupied |
| Single Unit, Detached | 3,698 (92.6%) | 294 (7.4%) |
| Single Unit, Attached | 418 (65.7%) | 218 (34.3%) |
| 2 Unit Apartments | 0 (0.0%) | 3 (100.0%) |
| 3 or 4 Unit Apartments | 8 (10.5%) | 68 (89.5%) |
| 5 to 9 Unit Apartments | 4 (28.6%) | 10 (71.4%) |
| 10 or more Apartments | 36 (10.3%) | 314 (89.7%) |
| Mobile Home / Other | 0 (0.0%) | 0 (0.0%) |
| Total | 4,164 (82.1%) | 907 (17.9%) |
Housing Structures by Number of Rooms in Lindenhurst
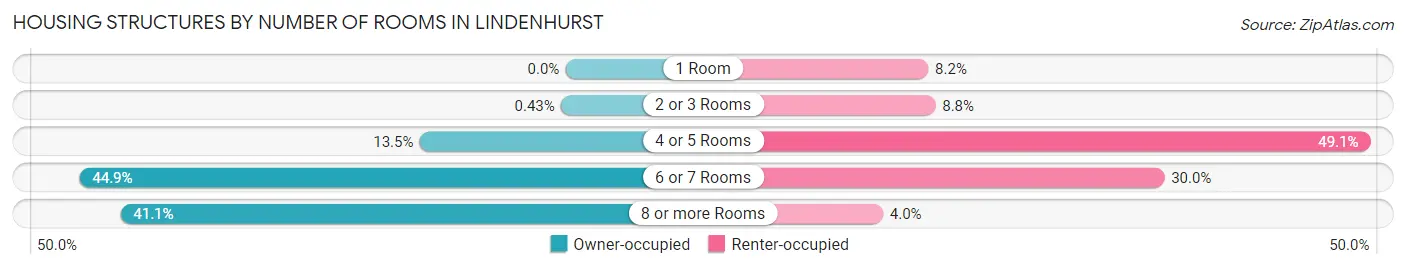
| Number of Rooms | Owner-occupied | Renter-occupied |
| 1 Room | 0 (0.0%) | 74 (8.2%) |
| 2 or 3 Rooms | 18 (0.4%) | 80 (8.8%) |
| 4 or 5 Rooms | 562 (13.5%) | 445 (49.1%) |
| 6 or 7 Rooms | 1,871 (44.9%) | 272 (30.0%) |
| 8 or more Rooms | 1,713 (41.1%) | 36 (4.0%) |
| Total | 4,164 (100.0%) | 907 (100.0%) |
Housing Structure by Heating Type in Lindenhurst
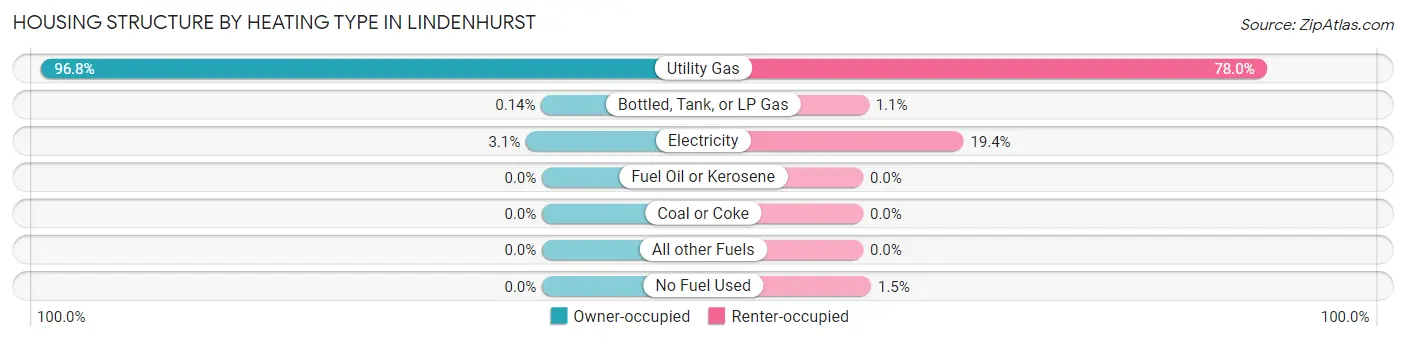
| Heating Type | Owner-occupied | Renter-occupied |
| Utility Gas | 4,029 (96.8%) | 707 (77.9%) |
| Bottled, Tank, or LP Gas | 6 (0.1%) | 10 (1.1%) |
| Electricity | 129 (3.1%) | 176 (19.4%) |
| Fuel Oil or Kerosene | 0 (0.0%) | 0 (0.0%) |
| Coal or Coke | 0 (0.0%) | 0 (0.0%) |
| All other Fuels | 0 (0.0%) | 0 (0.0%) |
| No Fuel Used | 0 (0.0%) | 14 (1.5%) |
| Total | 4,164 (100.0%) | 907 (100.0%) |
Household Vehicle Usage in Lindenhurst
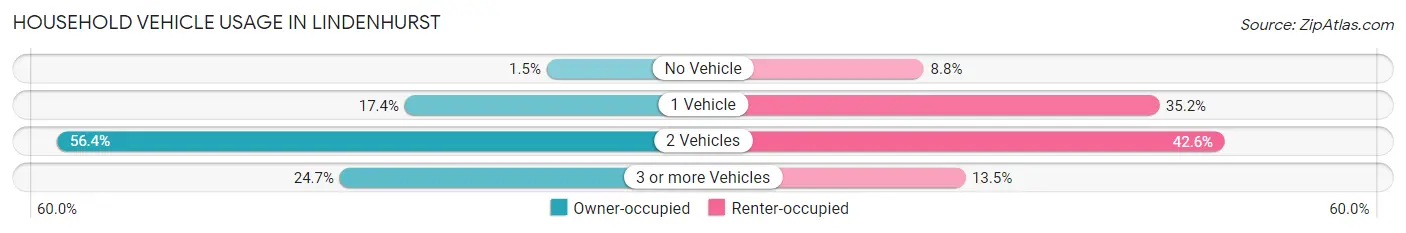
| Vehicles per Household | Owner-occupied | Renter-occupied |
| No Vehicle | 63 (1.5%) | 80 (8.8%) |
| 1 Vehicle | 725 (17.4%) | 319 (35.2%) |
| 2 Vehicles | 2,348 (56.4%) | 386 (42.6%) |
| 3 or more Vehicles | 1,028 (24.7%) | 122 (13.5%) |
| Total | 4,164 (100.0%) | 907 (100.0%) |
Real Estate & Mortgages in Lindenhurst
Real Estate and Mortgage Overview in Lindenhurst
| Characteristic | Without Mortgage | With Mortgage |
| Housing Units | 929 | 3,235 |
| Median Property Value | $235,600 | $258,600 |
| Median Household Income | $85,139 | $1,423 |
| Monthly Housing Costs | $936 | $749 |
| Real Estate Taxes | $7,699 | $35 |
Property Value by Mortgage Status in Lindenhurst
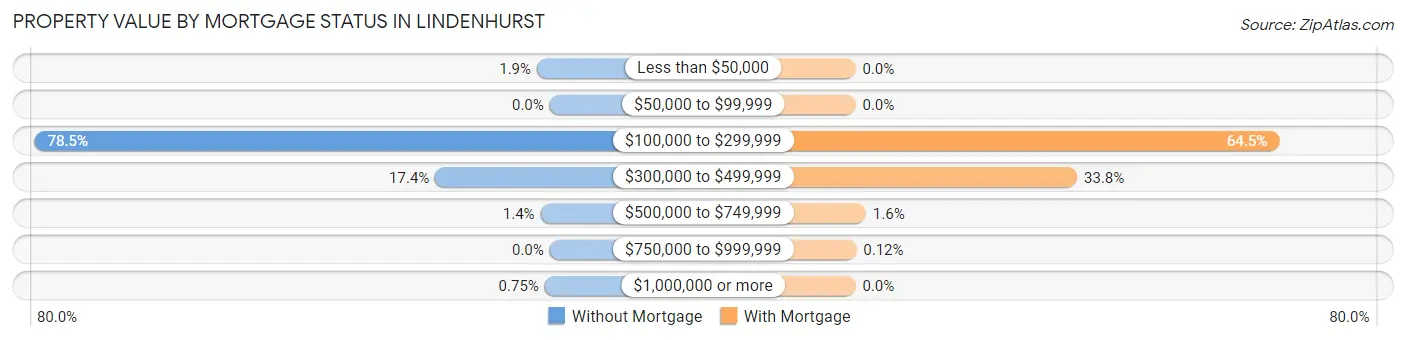
| Property Value | Without Mortgage | With Mortgage |
| Less than $50,000 | 18 (1.9%) | 0 (0.0%) |
| $50,000 to $99,999 | 0 (0.0%) | 0 (0.0%) |
| $100,000 to $299,999 | 729 (78.5%) | 2,088 (64.5%) |
| $300,000 to $499,999 | 162 (17.4%) | 1,092 (33.8%) |
| $500,000 to $749,999 | 13 (1.4%) | 51 (1.6%) |
| $750,000 to $999,999 | 0 (0.0%) | 4 (0.1%) |
| $1,000,000 or more | 7 (0.7%) | 0 (0.0%) |
| Total | 929 (100.0%) | 3,235 (100.0%) |
Household Income by Mortgage Status in Lindenhurst
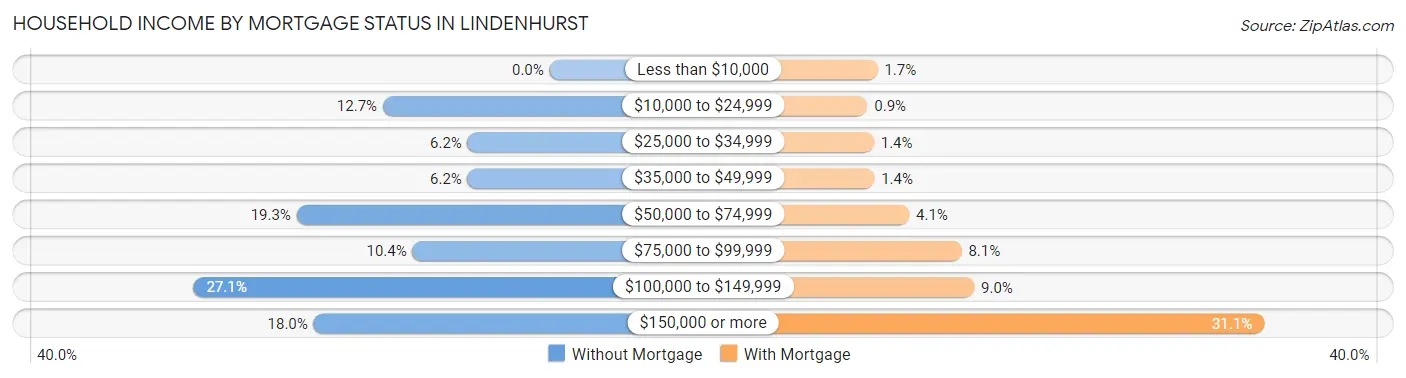
| Household Income | Without Mortgage | With Mortgage |
| Less than $10,000 | 0 (0.0%) | 54 (1.7%) |
| $10,000 to $24,999 | 118 (12.7%) | 29 (0.9%) |
| $25,000 to $34,999 | 58 (6.2%) | 45 (1.4%) |
| $35,000 to $49,999 | 58 (6.2%) | 46 (1.4%) |
| $50,000 to $74,999 | 179 (19.3%) | 132 (4.1%) |
| $75,000 to $99,999 | 97 (10.4%) | 261 (8.1%) |
| $100,000 to $149,999 | 252 (27.1%) | 292 (9.0%) |
| $150,000 or more | 167 (18.0%) | 1,007 (31.1%) |
| Total | 929 (100.0%) | 3,235 (100.0%) |
Property Value to Household Income Ratio in Lindenhurst
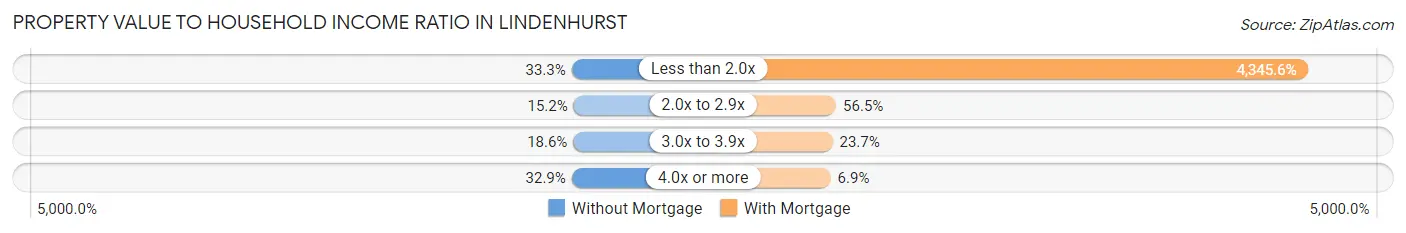
| Value-to-Income Ratio | Without Mortgage | With Mortgage |
| Less than 2.0x | 309 (33.3%) | 140,581 (4,345.6%) |
| 2.0x to 2.9x | 141 (15.2%) | 1,826 (56.5%) |
| 3.0x to 3.9x | 173 (18.6%) | 765 (23.6%) |
| 4.0x or more | 306 (32.9%) | 222 (6.9%) |
| Total | 929 (100.0%) | 3,235 (100.0%) |
Real Estate Taxes by Mortgage Status in Lindenhurst
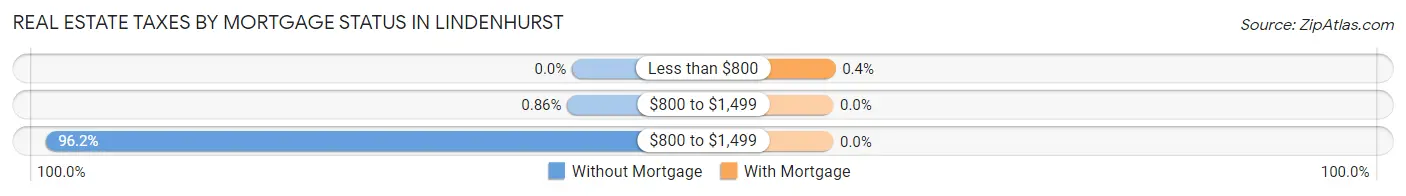
| Property Taxes | Without Mortgage | With Mortgage |
| Less than $800 | 0 (0.0%) | 13 (0.4%) |
| $800 to $1,499 | 8 (0.9%) | 0 (0.0%) |
| $800 to $1,499 | 894 (96.2%) | 0 (0.0%) |
| Total | 929 (100.0%) | 3,235 (100.0%) |
Health & Disability in Lindenhurst
Health Insurance Coverage by Age in Lindenhurst
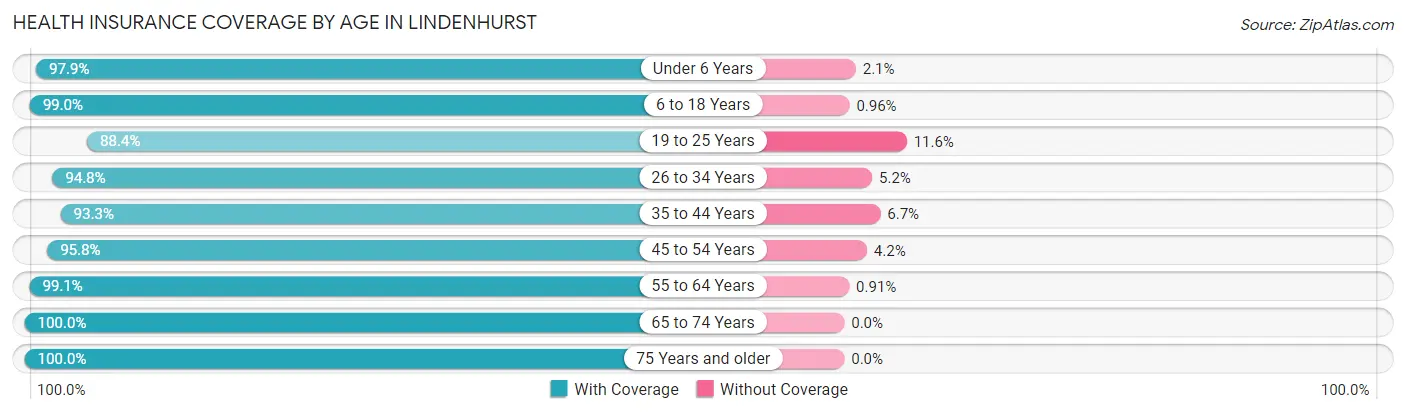
| Age Bracket | With Coverage | Without Coverage |
| Under 6 Years | 1,236 (97.9%) | 27 (2.1%) |
| 6 to 18 Years | 2,369 (99.0%) | 23 (1.0%) |
| 19 to 25 Years | 1,055 (88.4%) | 139 (11.6%) |
| 26 to 34 Years | 1,649 (94.8%) | 90 (5.2%) |
| 35 to 44 Years | 1,763 (93.3%) | 127 (6.7%) |
| 45 to 54 Years | 2,131 (95.8%) | 94 (4.2%) |
| 55 to 64 Years | 1,745 (99.1%) | 16 (0.9%) |
| 65 to 74 Years | 1,158 (100.0%) | 0 (0.0%) |
| 75 Years and older | 604 (100.0%) | 0 (0.0%) |
| Total | 13,710 (96.4%) | 516 (3.6%) |
Health Insurance Coverage by Citizenship Status in Lindenhurst
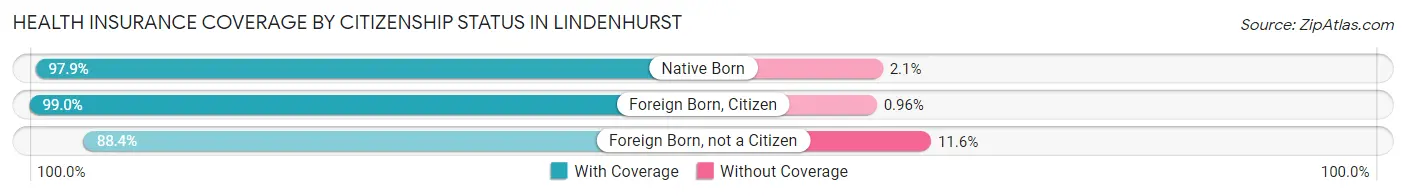
| Citizenship Status | With Coverage | Without Coverage |
| Native Born | 1,236 (97.9%) | 27 (2.1%) |
| Foreign Born, Citizen | 2,369 (99.0%) | 23 (1.0%) |
| Foreign Born, not a Citizen | 1,055 (88.4%) | 139 (11.6%) |
Health Insurance Coverage by Household Income in Lindenhurst
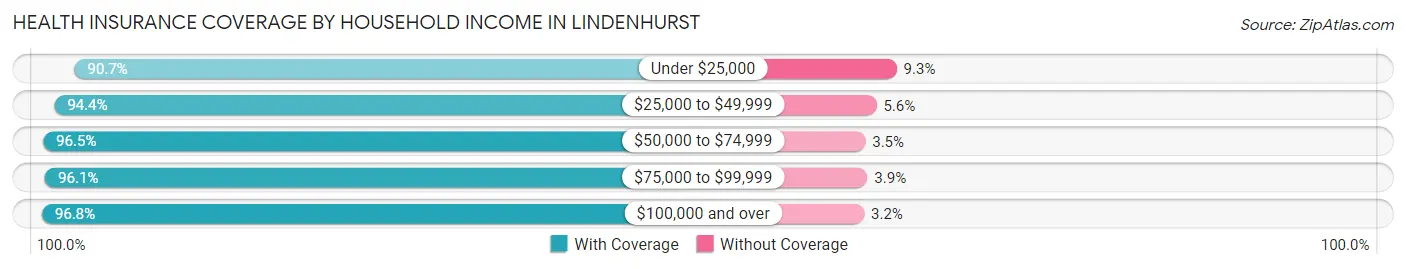
| Household Income | With Coverage | Without Coverage |
| Under $25,000 | 437 (90.7%) | 45 (9.3%) |
| $25,000 to $49,999 | 696 (94.4%) | 41 (5.6%) |
| $50,000 to $74,999 | 1,254 (96.5%) | 45 (3.5%) |
| $75,000 to $99,999 | 1,145 (96.1%) | 46 (3.9%) |
| $100,000 and over | 10,124 (96.8%) | 339 (3.2%) |
Public vs Private Health Insurance Coverage by Age in Lindenhurst
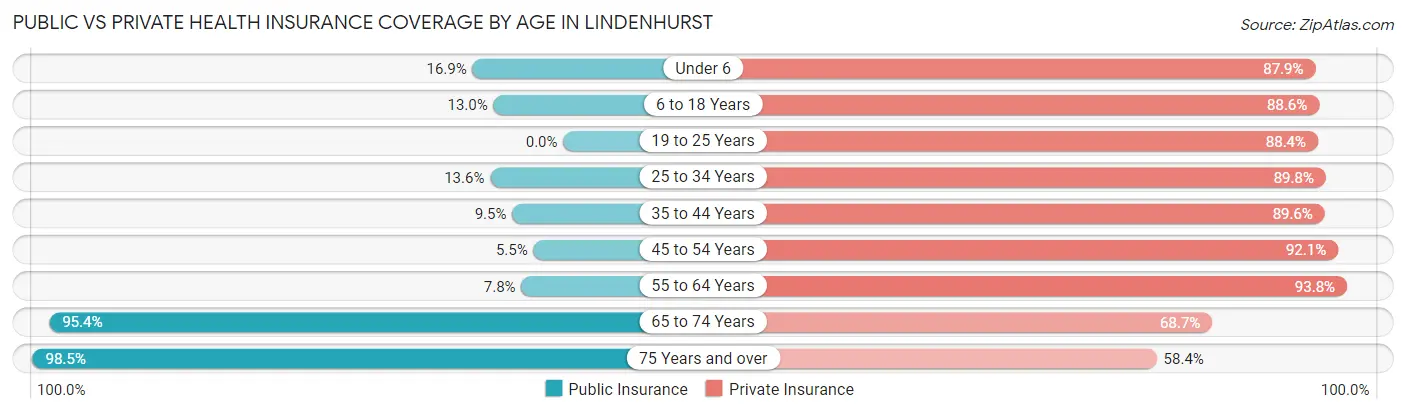
| Age Bracket | Public Insurance | Private Insurance |
| Under 6 | 213 (16.9%) | 1,110 (87.9%) |
| 6 to 18 Years | 310 (13.0%) | 2,119 (88.6%) |
| 19 to 25 Years | 0 (0.0%) | 1,055 (88.4%) |
| 25 to 34 Years | 236 (13.6%) | 1,562 (89.8%) |
| 35 to 44 Years | 179 (9.5%) | 1,694 (89.6%) |
| 45 to 54 Years | 123 (5.5%) | 2,049 (92.1%) |
| 55 to 64 Years | 137 (7.8%) | 1,651 (93.8%) |
| 65 to 74 Years | 1,105 (95.4%) | 796 (68.7%) |
| 75 Years and over | 595 (98.5%) | 353 (58.4%) |
| Total | 2,898 (20.4%) | 12,389 (87.1%) |
Disability Status by Sex by Age in Lindenhurst
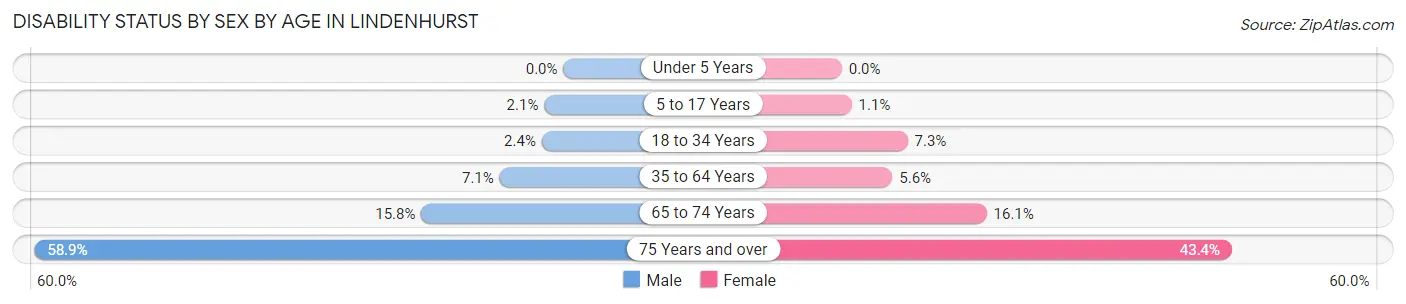
| Age Bracket | Male | Female |
| Under 5 Years | 0 (0.0%) | 0 (0.0%) |
| 5 to 17 Years | 25 (2.1%) | 14 (1.1%) |
| 18 to 34 Years | 38 (2.4%) | 108 (7.3%) |
| 35 to 64 Years | 213 (7.1%) | 162 (5.6%) |
| 65 to 74 Years | 90 (15.8%) | 95 (16.1%) |
| 75 Years and over | 109 (58.9%) | 182 (43.4%) |
Disability Class by Sex by Age in Lindenhurst
Disability Class: Hearing Difficulty
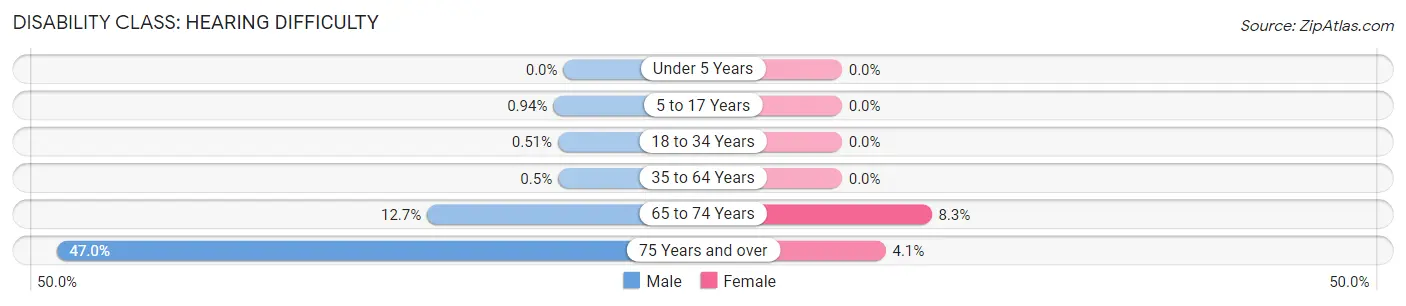
| Age Bracket | Male | Female |
| Under 5 Years | 0 (0.0%) | 0 (0.0%) |
| 5 to 17 Years | 11 (0.9%) | 0 (0.0%) |
| 18 to 34 Years | 8 (0.5%) | 0 (0.0%) |
| 35 to 64 Years | 15 (0.5%) | 0 (0.0%) |
| 65 to 74 Years | 72 (12.7%) | 49 (8.3%) |
| 75 Years and over | 87 (47.0%) | 17 (4.1%) |
Disability Class: Vision Difficulty
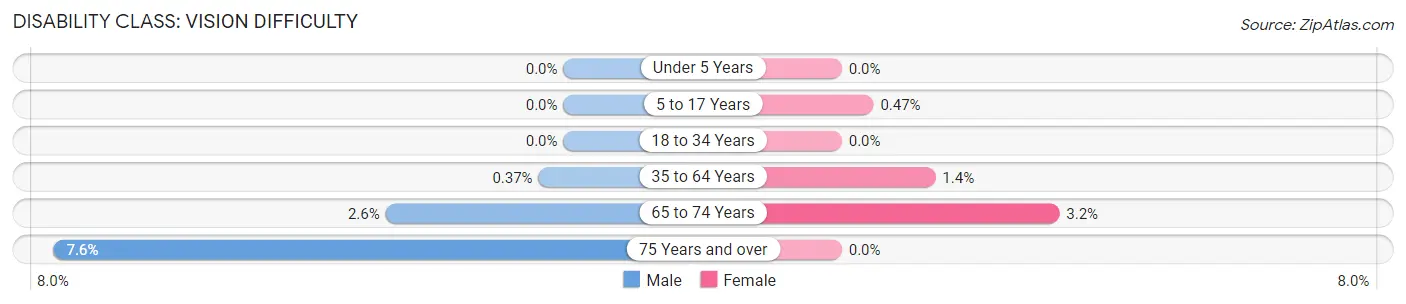
| Age Bracket | Male | Female |
| Under 5 Years | 0 (0.0%) | 0 (0.0%) |
| 5 to 17 Years | 0 (0.0%) | 6 (0.5%) |
| 18 to 34 Years | 0 (0.0%) | 0 (0.0%) |
| 35 to 64 Years | 11 (0.4%) | 40 (1.4%) |
| 65 to 74 Years | 15 (2.6%) | 19 (3.2%) |
| 75 Years and over | 14 (7.6%) | 0 (0.0%) |
Disability Class: Cognitive Difficulty
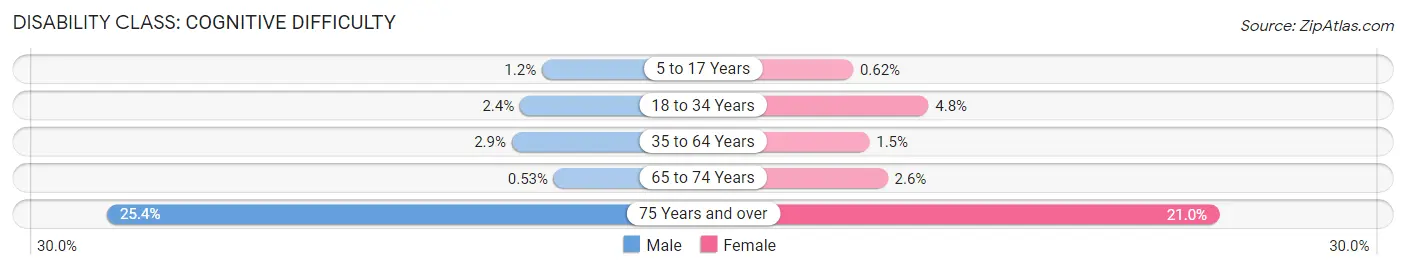
| Age Bracket | Male | Female |
| 5 to 17 Years | 14 (1.2%) | 8 (0.6%) |
| 18 to 34 Years | 38 (2.4%) | 71 (4.8%) |
| 35 to 64 Years | 86 (2.9%) | 44 (1.5%) |
| 65 to 74 Years | 3 (0.5%) | 15 (2.5%) |
| 75 Years and over | 47 (25.4%) | 88 (21.0%) |
Disability Class: Ambulatory Difficulty
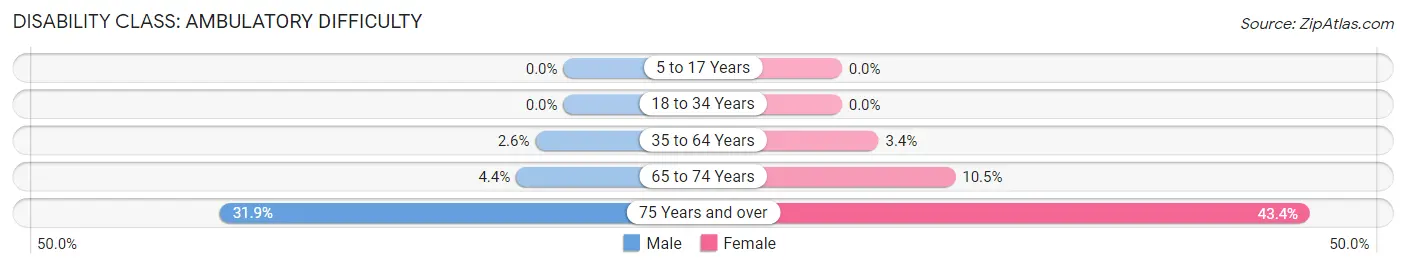
| Age Bracket | Male | Female |
| 5 to 17 Years | 0 (0.0%) | 0 (0.0%) |
| 18 to 34 Years | 0 (0.0%) | 0 (0.0%) |
| 35 to 64 Years | 78 (2.6%) | 98 (3.4%) |
| 65 to 74 Years | 25 (4.4%) | 62 (10.5%) |
| 75 Years and over | 59 (31.9%) | 182 (43.4%) |
Disability Class: Self-Care Difficulty
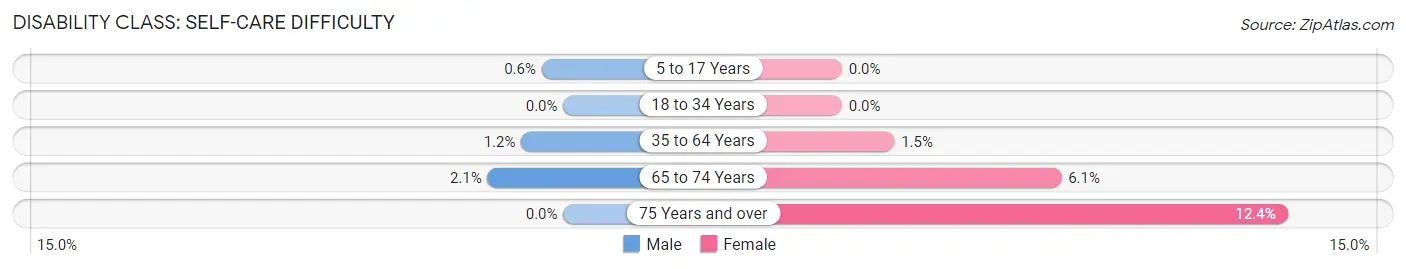
| Age Bracket | Male | Female |
| 5 to 17 Years | 7 (0.6%) | 0 (0.0%) |
| 18 to 34 Years | 0 (0.0%) | 0 (0.0%) |
| 35 to 64 Years | 35 (1.2%) | 42 (1.5%) |
| 65 to 74 Years | 12 (2.1%) | 36 (6.1%) |
| 75 Years and over | 0 (0.0%) | 52 (12.4%) |
Technology Access in Lindenhurst
Computing Device Access in Lindenhurst
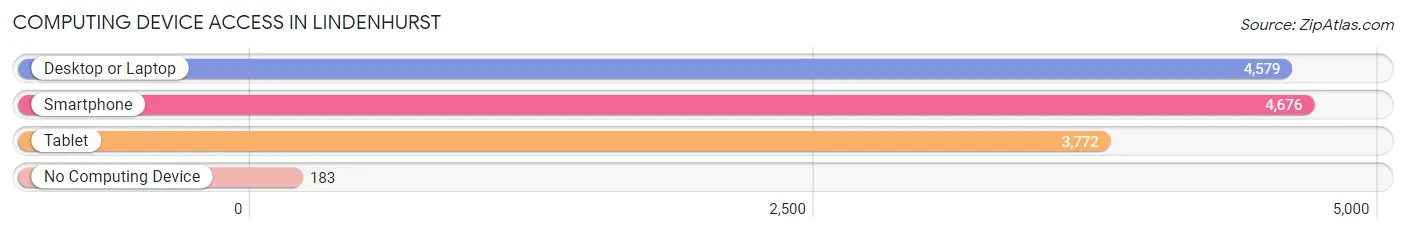
| Device Type | # Households | % Households |
| Desktop or Laptop | 4,579 | 90.3% |
| Smartphone | 4,676 | 92.2% |
| Tablet | 3,772 | 74.4% |
| No Computing Device | 183 | 3.6% |
| Total | 5,071 | 100.0% |
Internet Access in Lindenhurst
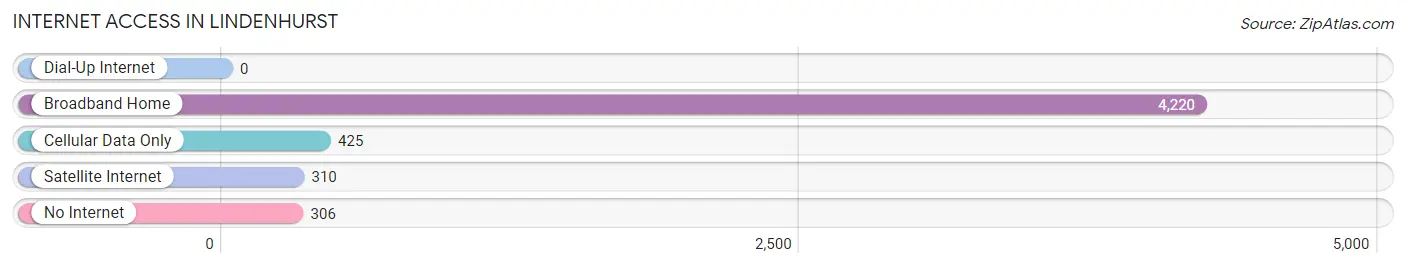
| Internet Type | # Households | % Households |
| Dial-Up Internet | 0 | 0.0% |
| Broadband Home | 4,220 | 83.2% |
| Cellular Data Only | 425 | 8.4% |
| Satellite Internet | 310 | 6.1% |
| No Internet | 306 | 6.0% |
| Total | 5,071 | 100.0% |
Lindenhurst Summary
Lindenhurst, Illinois is a village located in Lake County, Illinois, United States. The village is located approximately 40 miles north of Chicago and is part of the Chicago metropolitan area. As of the 2010 census, the village had a population of 13,562.
History
The area that is now Lindenhurst was first settled in the early 1800s by German immigrants. The village was originally known as “Hoffman’s Grove” and was named after the first settler, John Hoffman. In 1845, the village was renamed “Lindenhurst” after the many linden trees that grew in the area.
In the late 1800s, the village began to grow and develop. The first post office was established in 1872 and the first school was built in 1875. The village was officially incorporated in 1909.
Geography
Lindenhurst is located at 42°20′N 88°2′W (42.33, -88.03). According to the United States Census Bureau, the village has a total area of 5.2 square miles, all of which is land.
The village is located in the northern part of Lake County, Illinois. It is bordered by the villages of Lake Villa to the north, Round Lake Beach to the east, Lake Zurich to the south, and Grayslake to the west.
Economy
The economy of Lindenhurst is largely based on retail and services. The village is home to several large retail stores, including Walmart, Target, and Kohl’s. There are also several restaurants, banks, and other businesses located in the village.
The village is also home to several industrial and manufacturing businesses. These businesses include a plastics manufacturer, a metal fabrication company, and a printing company.
Demographics
As of the 2010 census, there were 13,562 people, 5,093 households, and 3,619 families residing in the village. The population density was 2,611.2 people per square mile. The racial makeup of the village was 87.2% White, 4.2% African American, 0.3% Native American, 2.3% Asian, 0.1% Pacific Islander, 4.2% from other races, and 1.7% from two or more races. Hispanic or Latino of any race were 10.2% of the population.
The median income for a household in the village was $63,945, and the median income for a family was $76,945. The per capita income for the village was $27,945. About 4.2% of families and 5.7% of the population were below the poverty line, including 7.2% of those under age 18 and 4.2% of those age 65 or over.
Lindenhurst is served by several school districts, including the Lake Villa Community Consolidated School District 41, the Grayslake Community Consolidated School District 46, and the Round Lake Area Schools Community Unit School District 116. The village is also home to several private schools, including St. Paul Lutheran School and St. Joseph Catholic School.
Common Questions
What is Per Capita Income in Lindenhurst?
Per Capita income in Lindenhurst is $48,582.
What is the Median Family Income in Lindenhurst?
Median Family Income in Lindenhurst is $135,553.
What is the Median Household income in Lindenhurst?
Median Household Income in Lindenhurst is $124,690.
What is Income or Wage Gap in Lindenhurst?
Income or Wage Gap in Lindenhurst is 37.3%.
Women in Lindenhurst earn 62.7 cents for every dollar earned by a man.
What is Inequality or Gini Index in Lindenhurst?
Inequality or Gini Index in Lindenhurst is 0.33.
What is the Total Population of Lindenhurst?
Total Population of Lindenhurst is 14,403.
What is the Total Male Population of Lindenhurst?
Total Male Population of Lindenhurst is 7,322.
What is the Total Female Population of Lindenhurst?
Total Female Population of Lindenhurst is 7,081.
What is the Ratio of Males per 100 Females in Lindenhurst?
There are 103.40 Males per 100 Females in Lindenhurst.
What is the Ratio of Females per 100 Males in Lindenhurst?
There are 96.71 Females per 100 Males in Lindenhurst.
What is the Median Population Age in Lindenhurst?
Median Population Age in Lindenhurst is 37.8 Years.
What is the Average Family Size in Lindenhurst
Average Family Size in Lindenhurst is 3.2 People.
What is the Average Household Size in Lindenhurst
Average Household Size in Lindenhurst is 2.8 People.
How Large is the Labor Force in Lindenhurst?
There are 8,584 People in the Labor Forcein in Lindenhurst.
What is the Percentage of People in the Labor Force in Lindenhurst?
75.8% of People are in the Labor Force in Lindenhurst.
What is the Unemployment Rate in Lindenhurst?
Unemployment Rate in Lindenhurst is 6.7%.