Calumet City, IL Map & Demographics
Calumet City Map
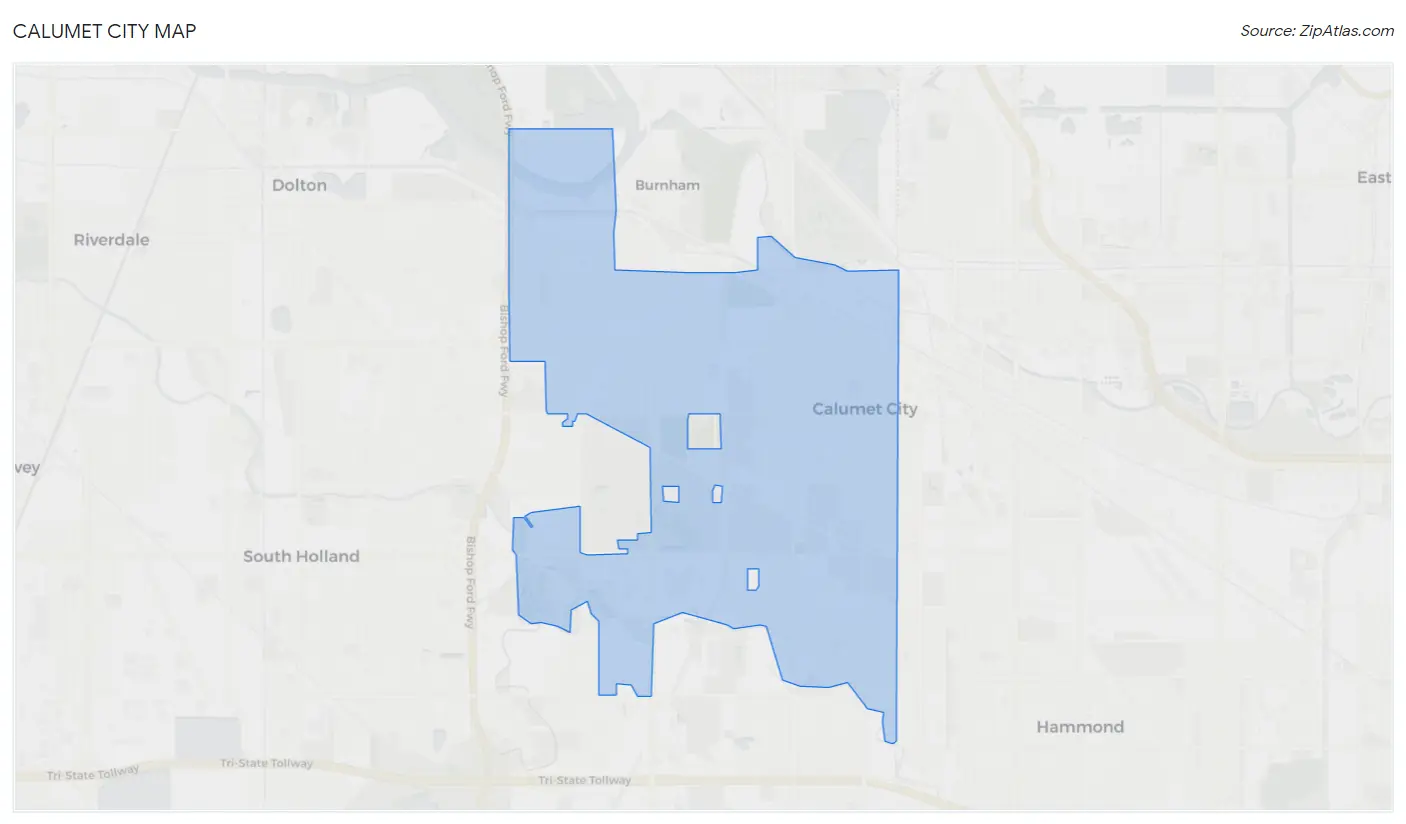
Calumet City Overview
$28,423
PER CAPITA INCOME
$66,003
AVG FAMILY INCOME
$56,727
AVG HOUSEHOLD INCOME
3.7%
WAGE / INCOME GAP [ % ]
96.3¢/ $1
WAGE / INCOME GAP [ $ ]
$11,170
FAMILY INCOME DEFICIT
0.44
INEQUALITY / GINI INDEX
35,708
TOTAL POPULATION
16,926
MALE POPULATION
18,782
FEMALE POPULATION
90.12
MALES / 100 FEMALES
110.97
FEMALES / 100 MALES
37.6
MEDIAN AGE
3.3
AVG FAMILY SIZE
2.5
AVG HOUSEHOLD SIZE
17,957
LABOR FORCE [ PEOPLE ]
64.2%
PERCENT IN LABOR FORCE
9.1%
UNEMPLOYMENT RATE
Calumet City Zip Codes
Income in Calumet City
Income Overview in Calumet City
Per Capita Income in Calumet City is $28,423, while median incomes of families and households are $66,003 and $56,727 respectively.
| Characteristic | Number | Measure |
| Per Capita Income | 35,708 | $28,423 |
| Median Family Income | 8,444 | $66,003 |
| Mean Family Income | 8,444 | $77,671 |
| Median Household Income | 14,412 | $56,727 |
| Mean Household Income | 14,412 | $67,653 |
| Income Deficit | 8,444 | $11,170 |
| Wage / Income Gap (%) | 35,708 | 3.73% |
| Wage / Income Gap ($) | 35,708 | 96.27¢ per $1 |
| Gini / Inequality Index | 35,708 | 0.44 |
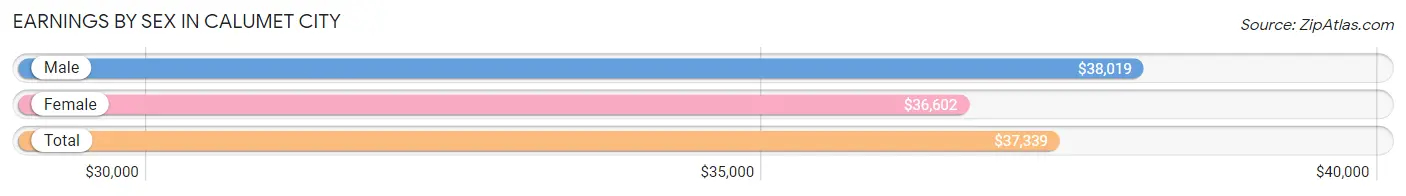
Earnings by Sex in Calumet City
Average Earnings in Calumet City are $37,339, $38,019 for men and $36,602 for women, a difference of 3.7%.
| Sex | Number | Average Earnings |
| Male | 8,612 (47.9%) | $38,019 |
| Female | 9,359 (52.1%) | $36,602 |
| Total | 17,971 (100.0%) | $37,339 |
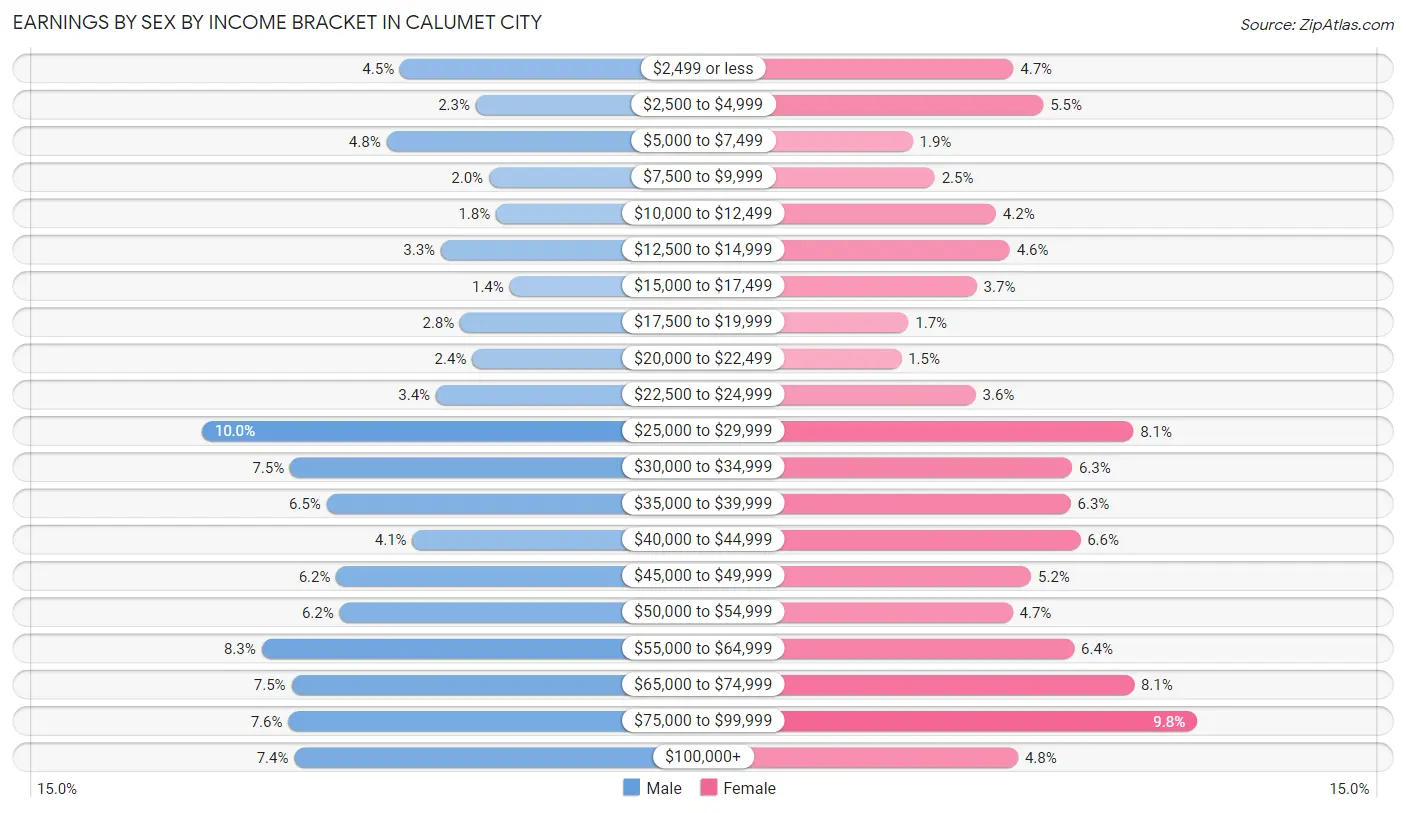
Earnings by Sex by Income Bracket in Calumet City
The most common earnings brackets in Calumet City are $25,000 to $29,999 for men (863 | 10.0%) and $75,000 to $99,999 for women (921 | 9.8%).
| Income | Male | Female |
| $2,499 or less | 383 (4.4%) | 438 (4.7%) |
| $2,500 to $4,999 | 200 (2.3%) | 517 (5.5%) |
| $5,000 to $7,499 | 416 (4.8%) | 173 (1.8%) |
| $7,500 to $9,999 | 168 (1.9%) | 231 (2.5%) |
| $10,000 to $12,499 | 151 (1.8%) | 392 (4.2%) |
| $12,500 to $14,999 | 284 (3.3%) | 429 (4.6%) |
| $15,000 to $17,499 | 118 (1.4%) | 342 (3.6%) |
| $17,500 to $19,999 | 238 (2.8%) | 162 (1.7%) |
| $20,000 to $22,499 | 208 (2.4%) | 143 (1.5%) |
| $22,500 to $24,999 | 296 (3.4%) | 339 (3.6%) |
| $25,000 to $29,999 | 863 (10.0%) | 753 (8.1%) |
| $30,000 to $34,999 | 649 (7.5%) | 592 (6.3%) |
| $35,000 to $39,999 | 561 (6.5%) | 589 (6.3%) |
| $40,000 to $44,999 | 353 (4.1%) | 614 (6.6%) |
| $45,000 to $49,999 | 537 (6.2%) | 485 (5.2%) |
| $50,000 to $54,999 | 530 (6.1%) | 436 (4.7%) |
| $55,000 to $64,999 | 718 (8.3%) | 598 (6.4%) |
| $65,000 to $74,999 | 646 (7.5%) | 755 (8.1%) |
| $75,000 to $99,999 | 654 (7.6%) | 921 (9.8%) |
| $100,000+ | 639 (7.4%) | 450 (4.8%) |
| Total | 8,612 (100.0%) | 9,359 (100.0%) |
Earnings by Sex by Educational Attainment in Calumet City
Average earnings in Calumet City are $45,325 for men and $39,927 for women, a difference of 11.9%. Men with an educational attainment of graduate degree enjoy the highest average annual earnings of $72,821, while those with less than high school education earn the least with $29,896. Women with an educational attainment of bachelor's degree earn the most with the average annual earnings of $64,950, while those with high school diploma education have the smallest earnings of $24,880.

| Educational Attainment | Male Income | Female Income |
| Less than High School | $29,896 | $27,087 |
| High School Diploma | $41,821 | $24,880 |
| College or Associate's Degree | $50,878 | $38,657 |
| Bachelor's Degree | $38,310 | $64,950 |
| Graduate Degree | $72,821 | $64,167 |
| Total | $45,325 | $39,927 |
Family Income in Calumet City
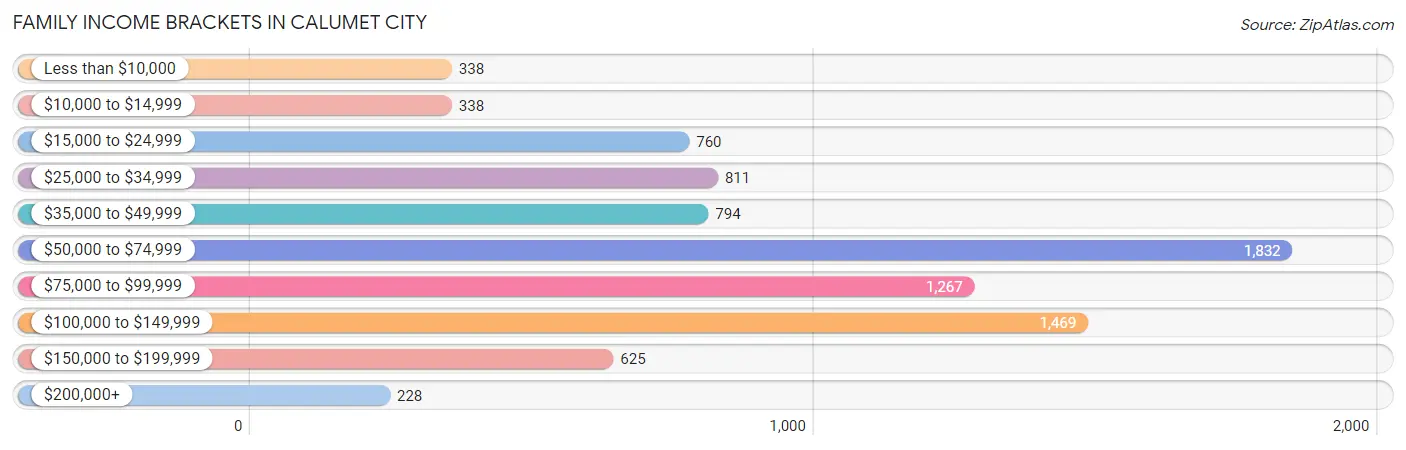
Family Income Brackets in Calumet City
According to the Calumet City family income data, there are 1,832 families falling into the $50,000 to $74,999 income range, which is the most common income bracket and makes up 21.7% of all families. Conversely, the $200,000+ income bracket is the least frequent group with only 228 families (2.7%) belonging to this category.
| Income Bracket | # Families | % Families |
| Less than $10,000 | 338 | 4.0% |
| $10,000 to $14,999 | 338 | 4.0% |
| $15,000 to $24,999 | 760 | 9.0% |
| $25,000 to $34,999 | 811 | 9.6% |
| $35,000 to $49,999 | 794 | 9.4% |
| $50,000 to $74,999 | 1,832 | 21.7% |
| $75,000 to $99,999 | 1,267 | 15.0% |
| $100,000 to $149,999 | 1,469 | 17.4% |
| $150,000 to $199,999 | 625 | 7.4% |
| $200,000+ | 228 | 2.7% |
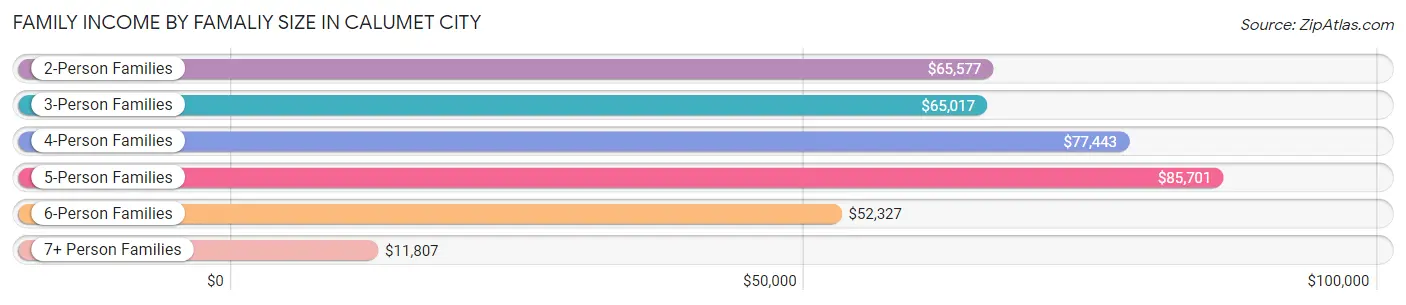
Family Income by Famaliy Size in Calumet City
5-person families (1,053 | 12.5%) account for the highest median family income in Calumet City with $85,701 per family, while 2-person families (3,756 | 44.5%) have the highest median income of $32,788 per family member.
| Income Bracket | # Families | Median Income |
| 2-Person Families | 3,756 (44.5%) | $65,577 |
| 3-Person Families | 2,037 (24.1%) | $65,017 |
| 4-Person Families | 1,292 (15.3%) | $77,443 |
| 5-Person Families | 1,053 (12.5%) | $85,701 |
| 6-Person Families | 147 (1.7%) | $52,327 |
| 7+ Person Families | 159 (1.9%) | $11,807 |
| Total | 8,444 (100.0%) | $66,003 |
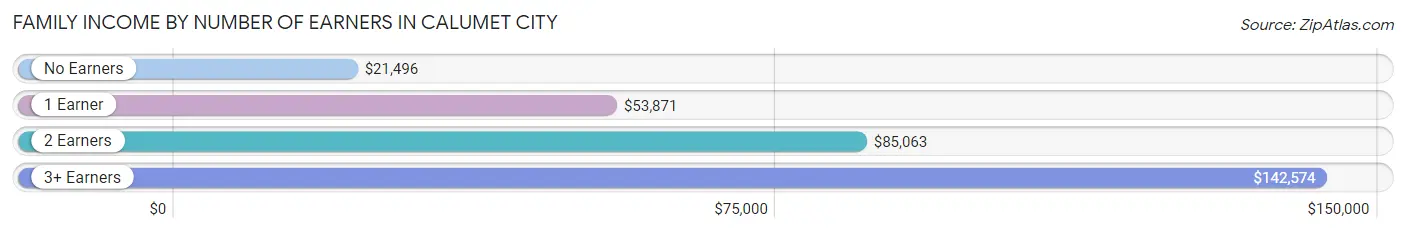
Family Income by Number of Earners in Calumet City
The median family income in Calumet City is $66,003, with families comprising 3+ earners (1,017) having the highest median family income of $142,574, while families with no earners (1,189) have the lowest median family income of $21,496, accounting for 12.0% and 14.1% of families, respectively.
| Number of Earners | # Families | Median Income |
| No Earners | 1,189 (14.1%) | $21,496 |
| 1 Earner | 3,184 (37.7%) | $53,871 |
| 2 Earners | 3,054 (36.2%) | $85,063 |
| 3+ Earners | 1,017 (12.0%) | $142,574 |
| Total | 8,444 (100.0%) | $66,003 |
Household Income in Calumet City
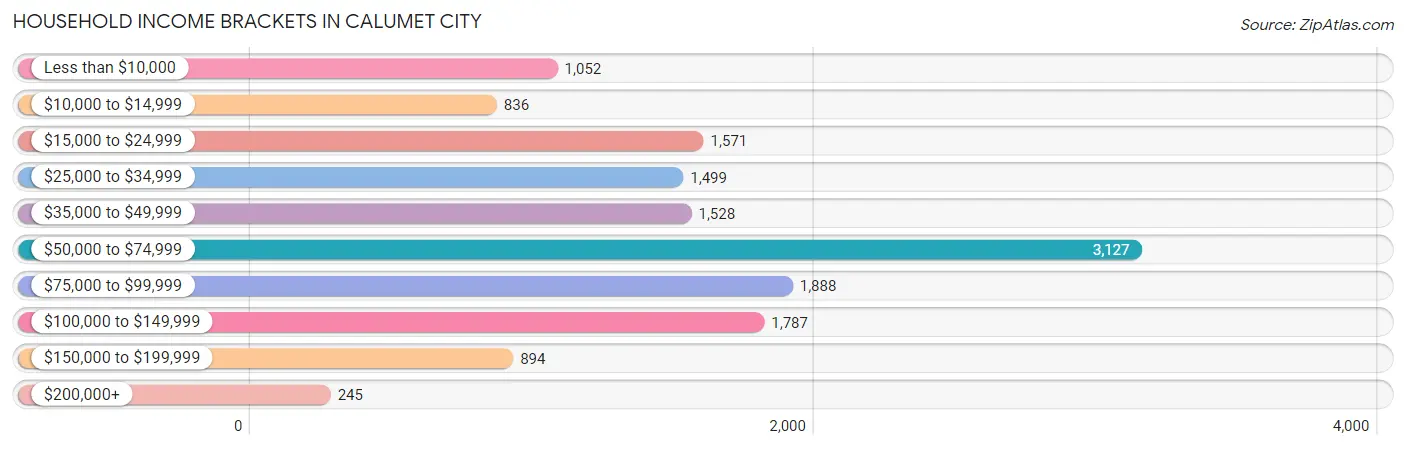
Household Income Brackets in Calumet City
With 3,127 households falling in the category, the $50,000 to $74,999 income range is the most frequent in Calumet City, accounting for 21.7% of all households. In contrast, only 245 households (1.7%) fall into the $200,000+ income bracket, making it the least populous group.
| Income Bracket | # Households | % Households |
| Less than $10,000 | 1,052 | 7.3% |
| $10,000 to $14,999 | 836 | 5.8% |
| $15,000 to $24,999 | 1,571 | 10.9% |
| $25,000 to $34,999 | 1,499 | 10.4% |
| $35,000 to $49,999 | 1,528 | 10.6% |
| $50,000 to $74,999 | 3,127 | 21.7% |
| $75,000 to $99,999 | 1,888 | 13.1% |
| $100,000 to $149,999 | 1,787 | 12.4% |
| $150,000 to $199,999 | 894 | 6.2% |
| $200,000+ | 245 | 1.7% |
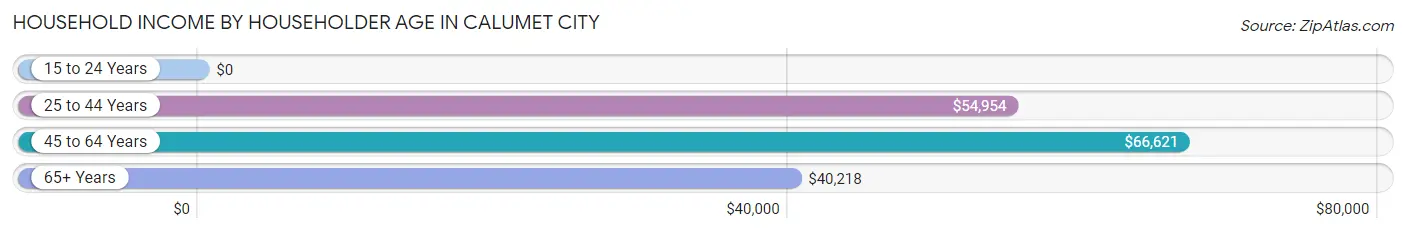
Household Income by Householder Age in Calumet City
The median household income in Calumet City is $56,727, with the highest median household income of $66,621 found in the 45 to 64 years age bracket for the primary householder. A total of 6,185 households (42.9%) fall into this category. Meanwhile, the 15 to 24 years age bracket for the primary householder has the lowest median household income of $0, with 153 households (1.1%) in this group.
| Income Bracket | # Households | Median Income |
| 15 to 24 Years | 153 (1.1%) | $0 |
| 25 to 44 Years | 4,209 (29.2%) | $54,954 |
| 45 to 64 Years | 6,185 (42.9%) | $66,621 |
| 65+ Years | 3,865 (26.8%) | $40,218 |
| Total | 14,412 (100.0%) | $56,727 |
Poverty in Calumet City
Income Below Poverty by Sex and Age in Calumet City
With 20.7% poverty level for males and 21.9% for females among the residents of Calumet City, 12 to 14 year old males and 15 year old females are the most vulnerable to poverty, with 439 males (50.2%) and 175 females (56.1%) in their respective age groups living below the poverty level.
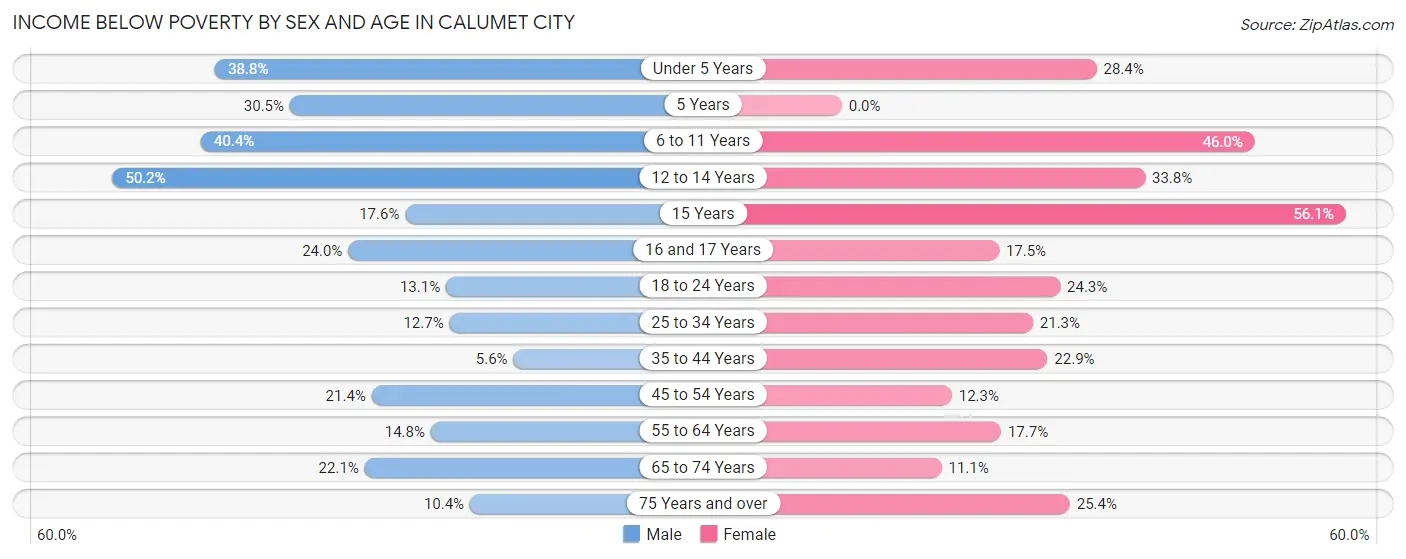
| Age Bracket | Male | Female |
| Under 5 Years | 455 (38.8%) | 238 (28.4%) |
| 5 Years | 127 (30.5%) | 0 (0.0%) |
| 6 to 11 Years | 555 (40.4%) | 624 (46.0%) |
| 12 to 14 Years | 439 (50.2%) | 204 (33.8%) |
| 15 Years | 75 (17.6%) | 175 (56.1%) |
| 16 and 17 Years | 109 (24.0%) | 84 (17.5%) |
| 18 to 24 Years | 234 (13.1%) | 289 (24.3%) |
| 25 to 34 Years | 342 (12.7%) | 506 (21.3%) |
| 35 to 44 Years | 109 (5.6%) | 586 (22.9%) |
| 45 to 54 Years | 426 (21.3%) | 336 (12.2%) |
| 55 to 64 Years | 309 (14.8%) | 482 (17.7%) |
| 65 to 74 Years | 276 (22.1%) | 198 (11.1%) |
| 75 Years and over | 44 (10.4%) | 371 (25.4%) |
| Total | 3,500 (20.7%) | 4,093 (21.9%) |
Income Above Poverty by Sex and Age in Calumet City
According to the poverty statistics in Calumet City, males aged 35 to 44 years and females aged 5 years are the age groups that are most secure financially, with 94.4% of males and 100.0% of females in these age groups living above the poverty line.
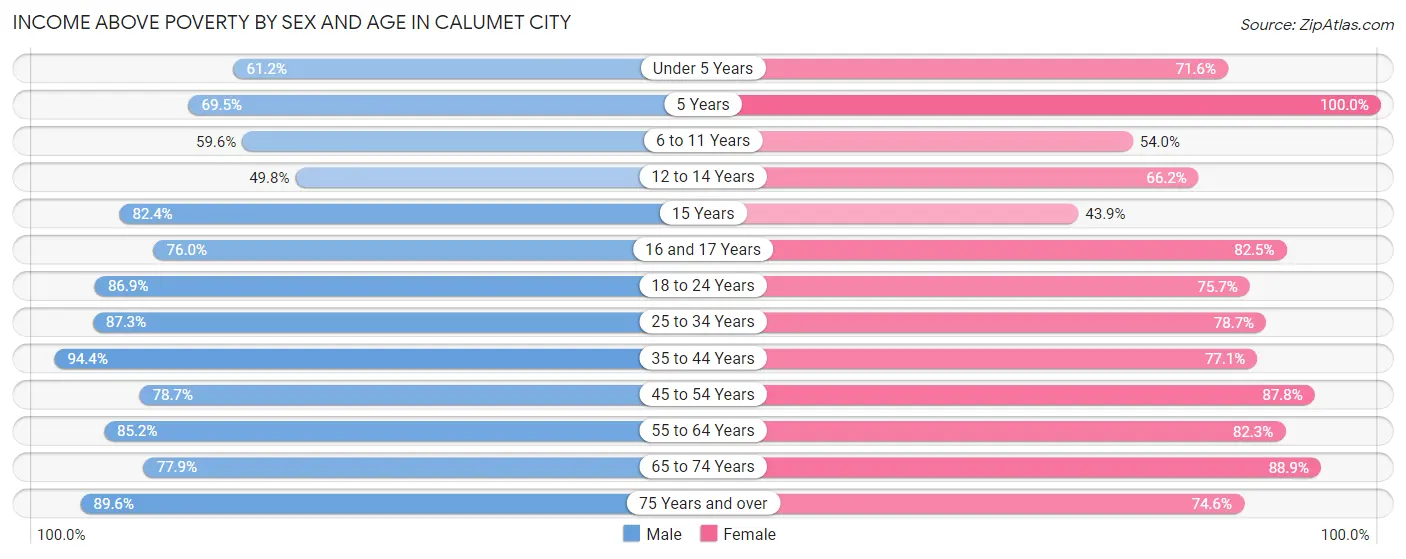
| Age Bracket | Male | Female |
| Under 5 Years | 718 (61.2%) | 601 (71.6%) |
| 5 Years | 290 (69.5%) | 231 (100.0%) |
| 6 to 11 Years | 820 (59.6%) | 733 (54.0%) |
| 12 to 14 Years | 435 (49.8%) | 400 (66.2%) |
| 15 Years | 351 (82.4%) | 137 (43.9%) |
| 16 and 17 Years | 346 (76.0%) | 396 (82.5%) |
| 18 to 24 Years | 1,557 (86.9%) | 900 (75.7%) |
| 25 to 34 Years | 2,355 (87.3%) | 1,872 (78.7%) |
| 35 to 44 Years | 1,850 (94.4%) | 1,973 (77.1%) |
| 45 to 54 Years | 1,569 (78.6%) | 2,406 (87.7%) |
| 55 to 64 Years | 1,785 (85.2%) | 2,236 (82.3%) |
| 65 to 74 Years | 971 (77.9%) | 1,584 (88.9%) |
| 75 Years and over | 379 (89.6%) | 1,090 (74.6%) |
| Total | 13,426 (79.3%) | 14,559 (78.1%) |
Income Below Poverty Among Married-Couple Families in Calumet City
The poverty statistics for married-couple families in Calumet City show that 9.8% or 387 of the total 3,960 families live below the poverty line. Families with 5 or more children have the highest poverty rate of 80.8%, comprising of 63 families. On the other hand, families with 1 or 2 children have the lowest poverty rate of 5.6%, which includes 66 families.
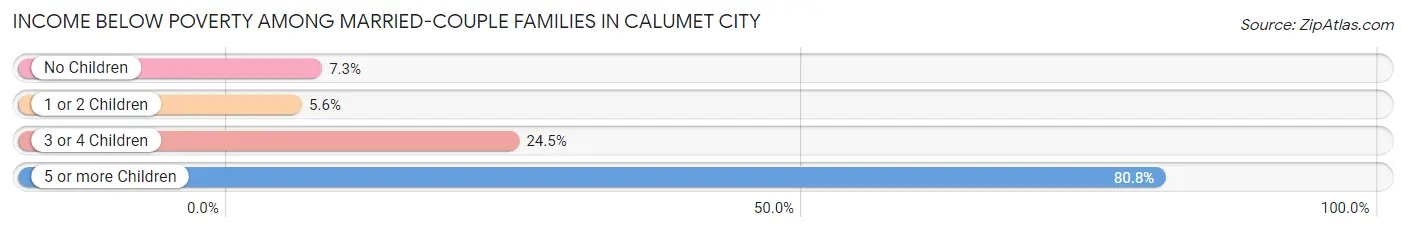
| Children | Above Poverty | Below Poverty |
| No Children | 2,176 (92.7%) | 172 (7.3%) |
| 1 or 2 Children | 1,117 (94.4%) | 66 (5.6%) |
| 3 or 4 Children | 265 (75.5%) | 86 (24.5%) |
| 5 or more Children | 15 (19.2%) | 63 (80.8%) |
| Total | 3,573 (90.2%) | 387 (9.8%) |
Income Below Poverty Among Single-Parent Households in Calumet City
According to the poverty data in Calumet City, 16.8% or 180 single-father households and 26.1% or 889 single-mother households are living below the poverty line. Among single-father households, those with 3 or 4 children have the highest poverty rate, with 40 households (100.0%) experiencing poverty. Likewise, among single-mother households, those with 5 or more children have the highest poverty rate, with 94 households (100.0%) falling below the poverty line.
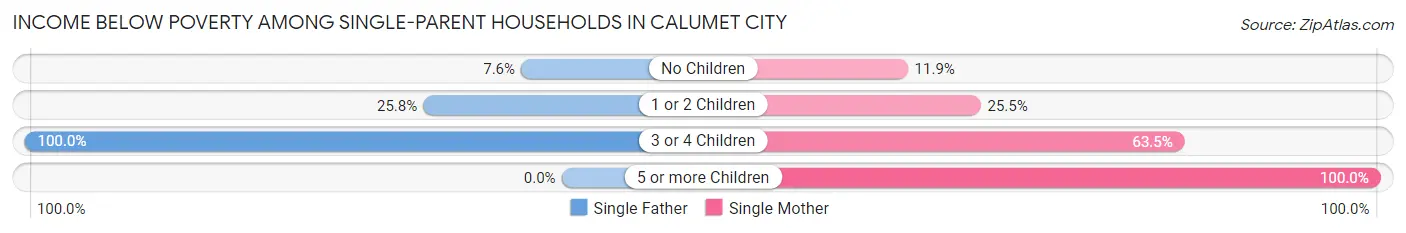
| Children | Single Father | Single Mother |
| No Children | 50 (7.6%) | 163 (11.9%) |
| 1 or 2 Children | 90 (25.8%) | 406 (25.5%) |
| 3 or 4 Children | 40 (100.0%) | 226 (63.5%) |
| 5 or more Children | 0 (0.0%) | 94 (100.0%) |
| Total | 180 (16.8%) | 889 (26.1%) |
Income Below Poverty Among Married-Couple vs Single-Parent Households in Calumet City
The poverty data for Calumet City shows that 387 of the married-couple family households (9.8%) and 1,069 of the single-parent households (23.8%) are living below the poverty level. Within the married-couple family households, those with 5 or more children have the highest poverty rate, with 63 households (80.8%) falling below the poverty line. Among the single-parent households, those with 5 or more children have the highest poverty rate, with 94 household (80.3%) living below poverty.
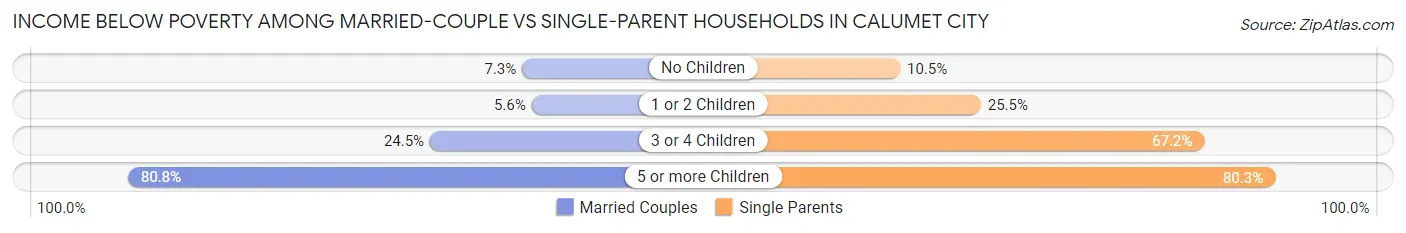
| Children | Married-Couple Families | Single-Parent Households |
| No Children | 172 (7.3%) | 213 (10.5%) |
| 1 or 2 Children | 66 (5.6%) | 496 (25.5%) |
| 3 or 4 Children | 86 (24.5%) | 266 (67.2%) |
| 5 or more Children | 63 (80.8%) | 94 (80.3%) |
| Total | 387 (9.8%) | 1,069 (23.8%) |
Race in Calumet City
The most populous races in Calumet City are Black / African American (25,517 | 71.5%), Hispanic or Latino (6,113 | 17.1%), and White / Caucasian (5,918 | 16.6%).
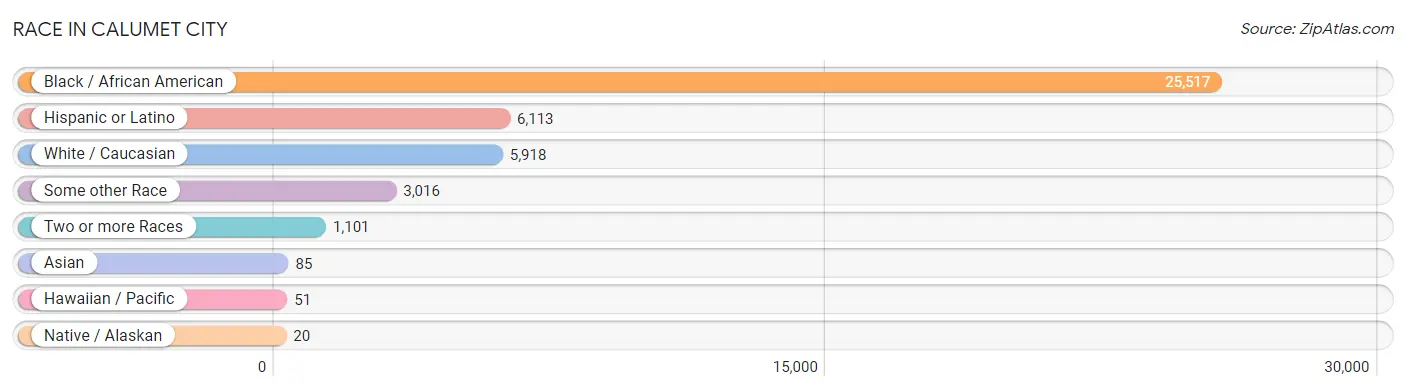
| Race | # Population | % Population |
| Asian | 85 | 0.2% |
| Black / African American | 25,517 | 71.5% |
| Hawaiian / Pacific | 51 | 0.1% |
| Hispanic or Latino | 6,113 | 17.1% |
| Native / Alaskan | 20 | 0.1% |
| White / Caucasian | 5,918 | 16.6% |
| Two or more Races | 1,101 | 3.1% |
| Some other Race | 3,016 | 8.5% |
| Total | 35,708 | 100.0% |
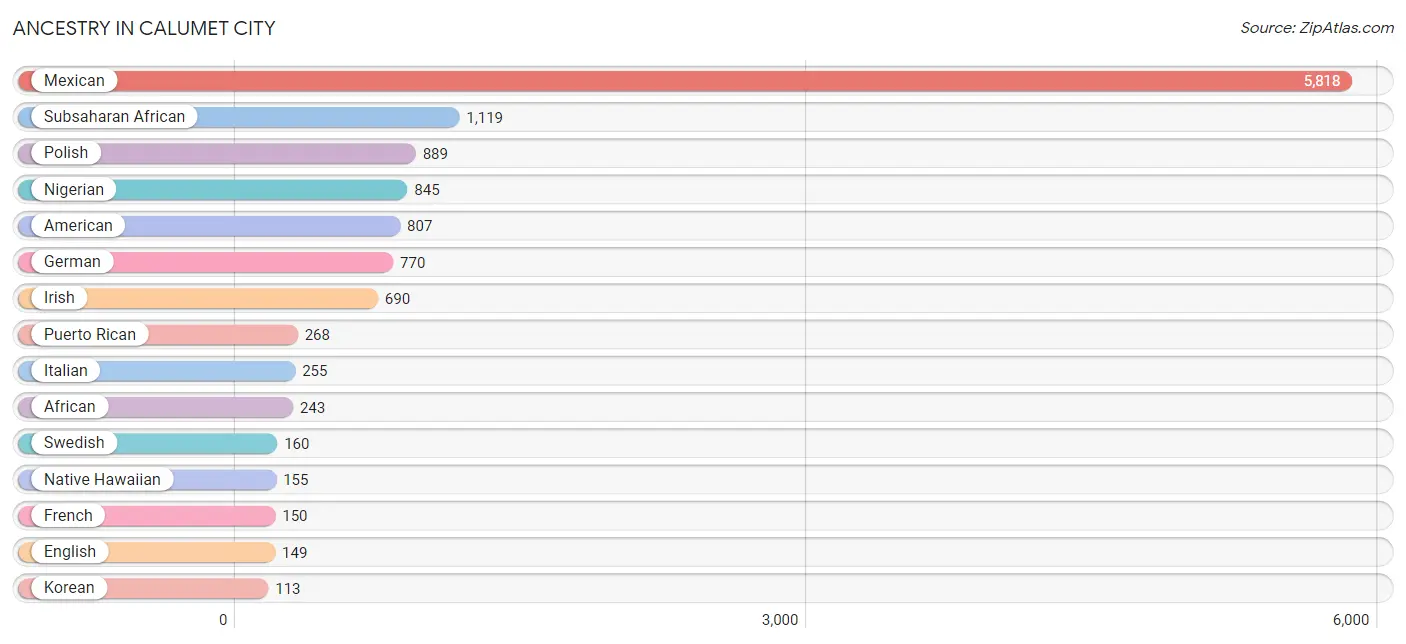
Ancestry in Calumet City
The most populous ancestries reported in Calumet City are Mexican (5,818 | 16.3%), Subsaharan African (1,119 | 3.1%), Polish (889 | 2.5%), Nigerian (845 | 2.4%), and American (807 | 2.3%), together accounting for 26.5% of all Calumet City residents.
| Ancestry | # Population | % Population |
| African | 243 | 0.7% |
| American | 807 | 2.3% |
| Belizean | 12 | 0.0% |
| Blackfeet | 9 | 0.0% |
| British | 9 | 0.0% |
| Canadian | 13 | 0.0% |
| Chickasaw | 2 | 0.0% |
| Choctaw | 2 | 0.0% |
| Croatian | 60 | 0.2% |
| Czech | 42 | 0.1% |
| Danish | 8 | 0.0% |
| Dutch | 18 | 0.1% |
| Dutch West Indian | 8 | 0.0% |
| Ecuadorian | 12 | 0.0% |
| English | 149 | 0.4% |
| Ethiopian | 23 | 0.1% |
| European | 65 | 0.2% |
| French | 150 | 0.4% |
| German | 770 | 2.2% |
| Greek | 93 | 0.3% |
| Haitian | 19 | 0.1% |
| Hungarian | 96 | 0.3% |
| Indian (Asian) | 23 | 0.1% |
| Indonesian | 21 | 0.1% |
| Irish | 690 | 1.9% |
| Israeli | 14 | 0.0% |
| Italian | 255 | 0.7% |
| Jamaican | 51 | 0.1% |
| Korean | 113 | 0.3% |
| Mexican | 5,818 | 16.3% |
| Native Hawaiian | 155 | 0.4% |
| Navajo | 20 | 0.1% |
| Nigerian | 845 | 2.4% |
| Norwegian | 71 | 0.2% |
| Paiute | 31 | 0.1% |
| Pakistani | 41 | 0.1% |
| Polish | 889 | 2.5% |
| Puerto Rican | 268 | 0.7% |
| Russian | 24 | 0.1% |
| Scotch-Irish | 40 | 0.1% |
| Scottish | 32 | 0.1% |
| Senegalese | 8 | 0.0% |
| Slovak | 48 | 0.1% |
| South American | 12 | 0.0% |
| Spaniard | 15 | 0.0% |
| Subsaharan African | 1,119 | 3.1% |
| Swedish | 160 | 0.4% |
| Thai | 2 | 0.0% |
| Trinidadian and Tobagonian | 42 | 0.1% |
| Ukrainian | 9 | 0.0% |
| Welsh | 9 | 0.0% | View All 51 Rows |
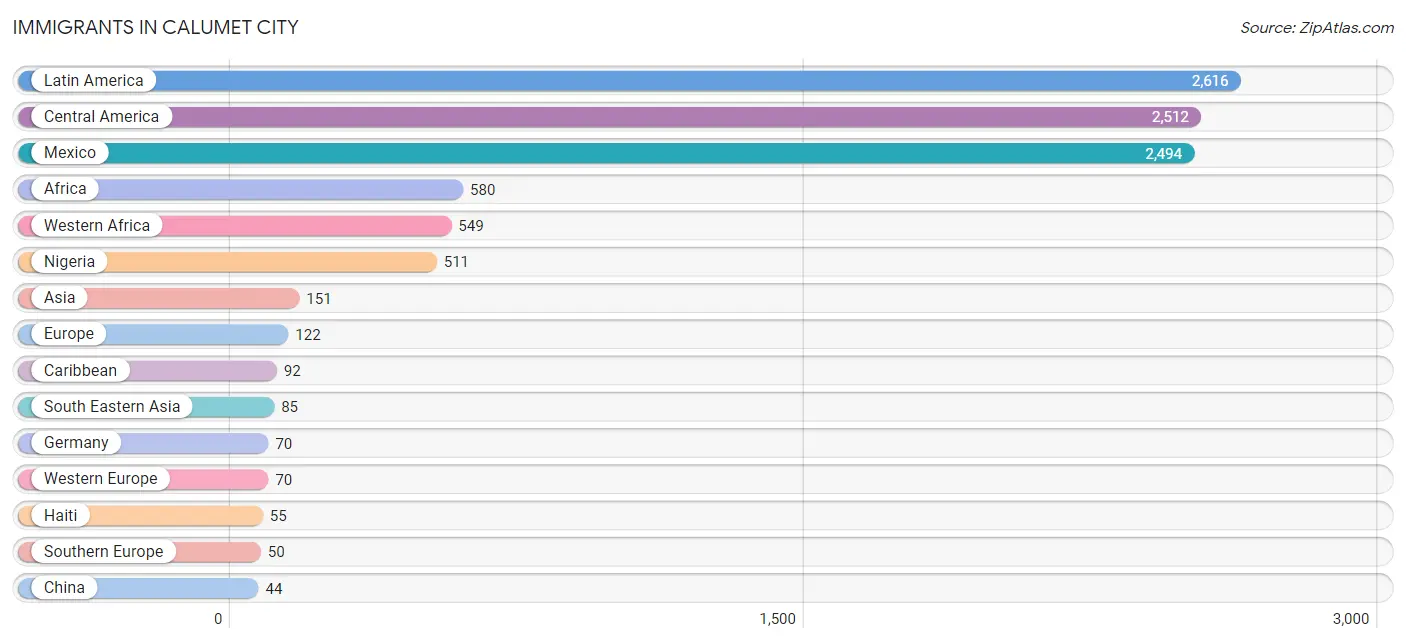
Immigrants in Calumet City
The most numerous immigrant groups reported in Calumet City came from Latin America (2,616 | 7.3%), Central America (2,512 | 7.0%), Mexico (2,494 | 7.0%), Africa (580 | 1.6%), and Western Africa (549 | 1.5%), together accounting for 24.5% of all Calumet City residents.
| Immigration Origin | # Population | % Population |
| Africa | 580 | 1.6% |
| Asia | 151 | 0.4% |
| Caribbean | 92 | 0.3% |
| Central America | 2,512 | 7.0% |
| China | 44 | 0.1% |
| Eastern Africa | 23 | 0.1% |
| Eastern Asia | 44 | 0.1% |
| Eastern Europe | 1 | 0.0% |
| Ecuador | 12 | 0.0% |
| Ethiopia | 23 | 0.1% |
| Europe | 122 | 0.3% |
| Germany | 70 | 0.2% |
| Ghana | 1 | 0.0% |
| Greece | 30 | 0.1% |
| Haiti | 55 | 0.2% |
| Honduras | 18 | 0.1% |
| Italy | 20 | 0.1% |
| Jamaica | 19 | 0.1% |
| Jordan | 12 | 0.0% |
| Latin America | 2,616 | 7.3% |
| Mexico | 2,494 | 7.0% |
| Nigeria | 511 | 1.4% |
| Northern Europe | 1 | 0.0% |
| Poland | 1 | 0.0% |
| South America | 12 | 0.0% |
| South Eastern Asia | 85 | 0.2% |
| Southern Europe | 50 | 0.1% |
| Thailand | 41 | 0.1% |
| Trinidad and Tobago | 18 | 0.1% |
| Western Africa | 549 | 1.5% |
| Western Asia | 22 | 0.1% |
| Western Europe | 70 | 0.2% | View All 32 Rows |
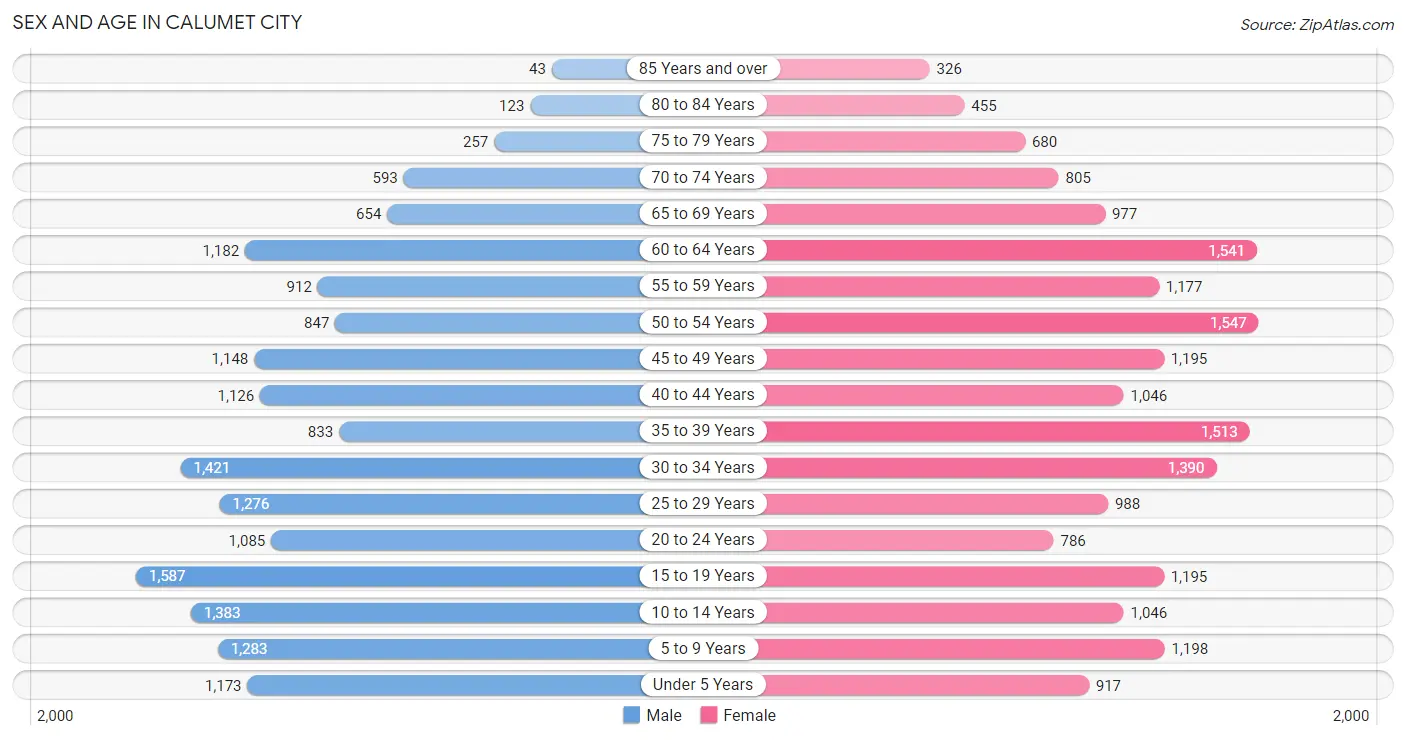
Sex and Age in Calumet City
Sex and Age in Calumet City
The most populous age groups in Calumet City are 15 to 19 Years (1,587 | 9.4%) for men and 50 to 54 Years (1,547 | 8.2%) for women.
| Age Bracket | Male | Female |
| Under 5 Years | 1,173 (6.9%) | 917 (4.9%) |
| 5 to 9 Years | 1,283 (7.6%) | 1,198 (6.4%) |
| 10 to 14 Years | 1,383 (8.2%) | 1,046 (5.6%) |
| 15 to 19 Years | 1,587 (9.4%) | 1,195 (6.4%) |
| 20 to 24 Years | 1,085 (6.4%) | 786 (4.2%) |
| 25 to 29 Years | 1,276 (7.5%) | 988 (5.3%) |
| 30 to 34 Years | 1,421 (8.4%) | 1,390 (7.4%) |
| 35 to 39 Years | 833 (4.9%) | 1,513 (8.1%) |
| 40 to 44 Years | 1,126 (6.7%) | 1,046 (5.6%) |
| 45 to 49 Years | 1,148 (6.8%) | 1,195 (6.4%) |
| 50 to 54 Years | 847 (5.0%) | 1,547 (8.2%) |
| 55 to 59 Years | 912 (5.4%) | 1,177 (6.3%) |
| 60 to 64 Years | 1,182 (7.0%) | 1,541 (8.2%) |
| 65 to 69 Years | 654 (3.9%) | 977 (5.2%) |
| 70 to 74 Years | 593 (3.5%) | 805 (4.3%) |
| 75 to 79 Years | 257 (1.5%) | 680 (3.6%) |
| 80 to 84 Years | 123 (0.7%) | 455 (2.4%) |
| 85 Years and over | 43 (0.3%) | 326 (1.7%) |
| Total | 16,926 (100.0%) | 18,782 (100.0%) |
Families and Households in Calumet City
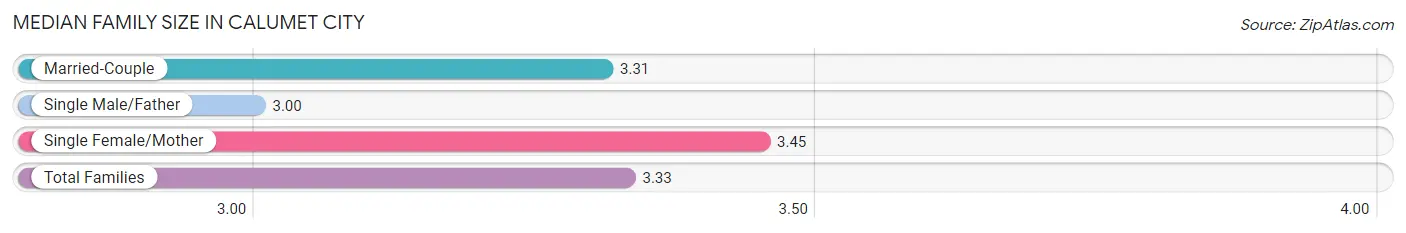
Median Family Size in Calumet City
The median family size in Calumet City is 3.33 persons per family, with single female/mother families (3,411 | 40.4%) accounting for the largest median family size of 3.45 persons per family. On the other hand, single male/father families (1,073 | 12.7%) represent the smallest median family size with 3.00 persons per family.
| Family Type | # Families | Family Size |
| Married-Couple | 3,960 (46.9%) | 3.31 |
| Single Male/Father | 1,073 (12.7%) | 3.00 |
| Single Female/Mother | 3,411 (40.4%) | 3.45 |
| Total Families | 8,444 (100.0%) | 3.33 |
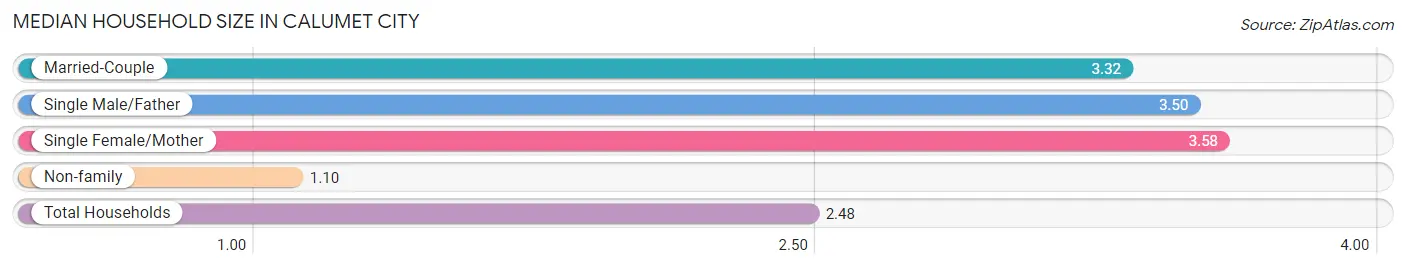
Median Household Size in Calumet City
The median household size in Calumet City is 2.48 persons per household, with single female/mother households (3,411 | 23.7%) accounting for the largest median household size of 3.58 persons per household. non-family households (5,968 | 41.4%) represent the smallest median household size with 1.10 persons per household.
| Household Type | # Households | Household Size |
| Married-Couple | 3,960 (27.5%) | 3.32 |
| Single Male/Father | 1,073 (7.4%) | 3.50 |
| Single Female/Mother | 3,411 (23.7%) | 3.58 |
| Non-family | 5,968 (41.4%) | 1.10 |
| Total Households | 14,412 (100.0%) | 2.48 |
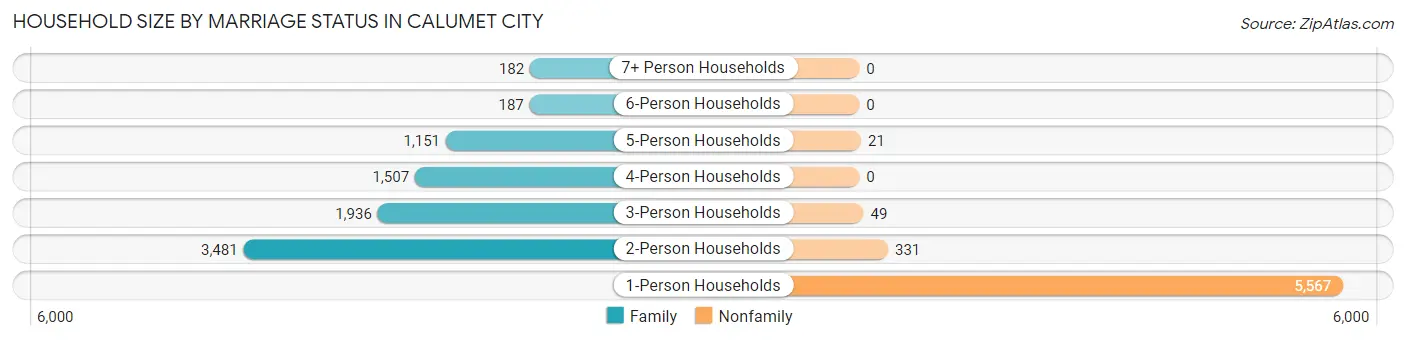
Household Size by Marriage Status in Calumet City
Out of a total of 14,412 households in Calumet City, 8,444 (58.6%) are family households, while 5,968 (41.4%) are nonfamily households. The most numerous type of family households are 2-person households, comprising 3,481, and the most common type of nonfamily households are 1-person households, comprising 5,567.
| Household Size | Family Households | Nonfamily Households |
| 1-Person Households | - | 5,567 (38.6%) |
| 2-Person Households | 3,481 (24.1%) | 331 (2.3%) |
| 3-Person Households | 1,936 (13.4%) | 49 (0.3%) |
| 4-Person Households | 1,507 (10.5%) | 0 (0.0%) |
| 5-Person Households | 1,151 (8.0%) | 21 (0.2%) |
| 6-Person Households | 187 (1.3%) | 0 (0.0%) |
| 7+ Person Households | 182 (1.3%) | 0 (0.0%) |
| Total | 8,444 (58.6%) | 5,968 (41.4%) |
Female Fertility in Calumet City
Fertility by Age in Calumet City
Average fertility rate in Calumet City is 65.0 births per 1,000 women. Women in the age bracket of 20 to 34 years have the highest fertility rate with 115.0 births per 1,000 women. Women in the age bracket of 20 to 34 years acount for 65.8% of all women with births.
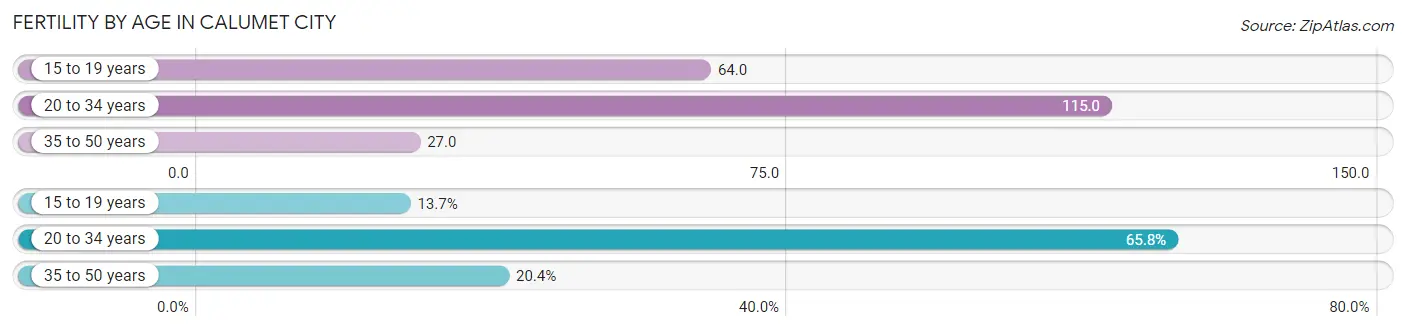
| Age Bracket | Women with Births | Births / 1,000 Women |
| 15 to 19 years | 76 (13.7%) | 64.0 |
| 20 to 34 years | 364 (65.8%) | 115.0 |
| 35 to 50 years | 113 (20.4%) | 27.0 |
| Total | 553 (100.0%) | 65.0 |
Fertility by Age by Marriage Status in Calumet City
18.8% of women with births (553) in Calumet City are married. The highest percentage of unmarried women with births falls into 15 to 19 years age bracket with 100.0% of them unmarried at the time of birth, while the lowest percentage of unmarried women with births belong to 35 to 50 years age bracket with 19.5% of them unmarried.
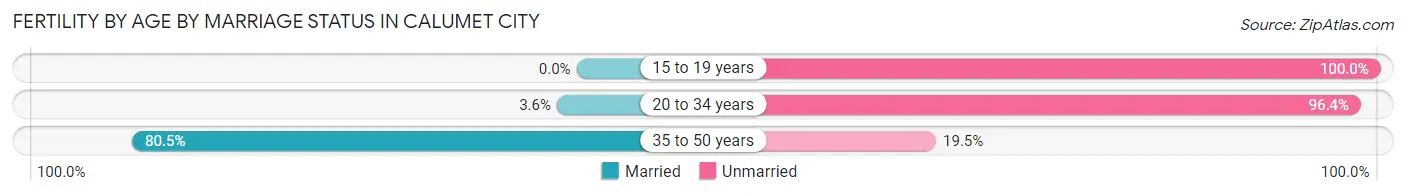
| Age Bracket | Married | Unmarried |
| 15 to 19 years | 0 (0.0%) | 76 (100.0%) |
| 20 to 34 years | 13 (3.6%) | 351 (96.4%) |
| 35 to 50 years | 91 (80.5%) | 22 (19.5%) |
| Total | 104 (18.8%) | 449 (81.2%) |
Fertility by Education in Calumet City
Average fertility rate in Calumet City is 65.0 births per 1,000 women. Women with the education attainment of bachelor's degree have the highest fertility rate of 130.0 births per 1,000 women, while women with the education attainment of graduate degree have the lowest fertility at 31.0 births per 1,000 women. Women with the education attainment of college or associate's degree represent 31.5% of all women with births.
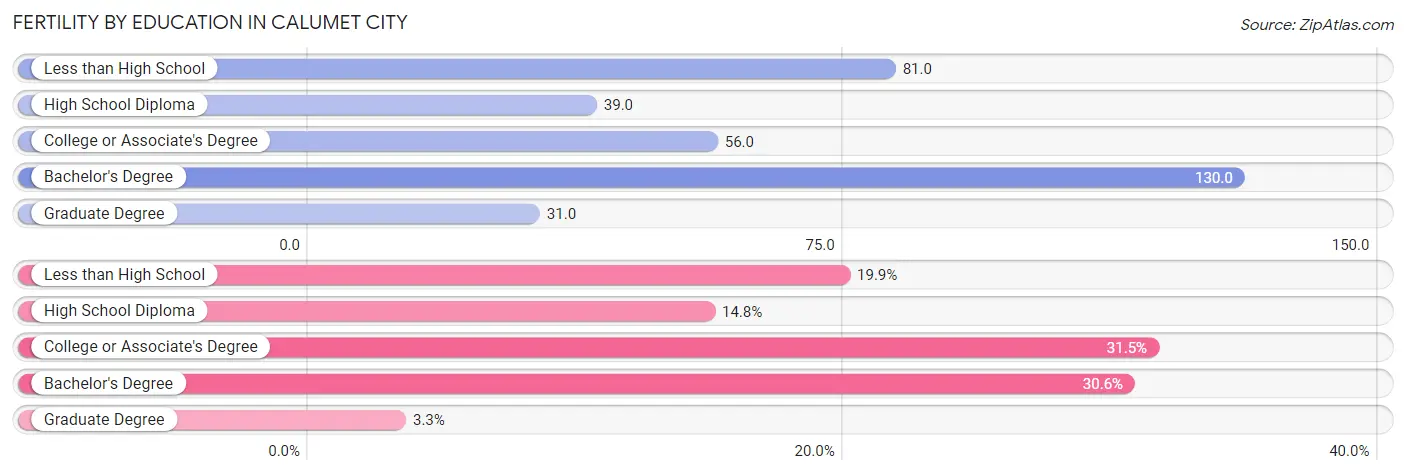
| Educational Attainment | Women with Births | Births / 1,000 Women |
| Less than High School | 110 (19.9%) | 81.0 |
| High School Diploma | 82 (14.8%) | 39.0 |
| College or Associate's Degree | 174 (31.5%) | 56.0 |
| Bachelor's Degree | 169 (30.6%) | 130.0 |
| Graduate Degree | 18 (3.3%) | 31.0 |
| Total | 553 (100.0%) | 65.0 |
Fertility by Education by Marriage Status in Calumet City
81.2% of women with births in Calumet City are unmarried. Women with the educational attainment of graduate degree are most likely to be married with 100.0% of them married at childbirth, while women with the educational attainment of bachelor's degree are least likely to be married with 100.0% of them unmarried at childbirth.
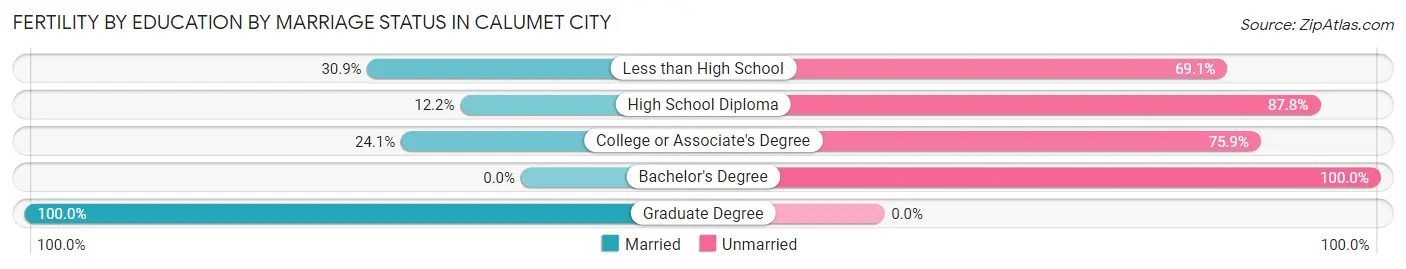
| Educational Attainment | Married | Unmarried |
| Less than High School | 34 (30.9%) | 76 (69.1%) |
| High School Diploma | 10 (12.2%) | 72 (87.8%) |
| College or Associate's Degree | 42 (24.1%) | 132 (75.9%) |
| Bachelor's Degree | 0 (0.0%) | 169 (100.0%) |
| Graduate Degree | 18 (100.0%) | 0 (0.0%) |
| Total | 104 (18.8%) | 449 (81.2%) |
Employment Characteristics in Calumet City
Employment by Class of Employer in Calumet City
Among the 16,137 employed individuals in Calumet City, private company employees (10,622 | 65.8%), not-for-profit organizations (1,910 | 11.8%), and local government employees (1,050 | 6.5%) make up the most common classes of employment.
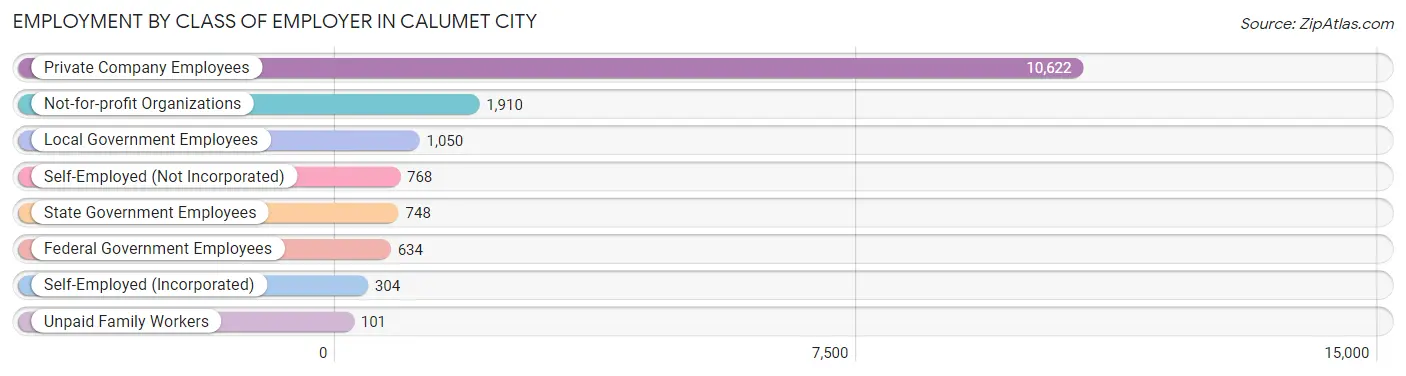
| Employer Class | # Employees | % Employees |
| Private Company Employees | 10,622 | 65.8% |
| Self-Employed (Incorporated) | 304 | 1.9% |
| Self-Employed (Not Incorporated) | 768 | 4.8% |
| Not-for-profit Organizations | 1,910 | 11.8% |
| Local Government Employees | 1,050 | 6.5% |
| State Government Employees | 748 | 4.6% |
| Federal Government Employees | 634 | 3.9% |
| Unpaid Family Workers | 101 | 0.6% |
| Total | 16,137 | 100.0% |
Employment Status by Age in Calumet City
According to the labor force statistics for Calumet City, out of the total population over 16 years of age (27,970), 64.2% or 17,957 individuals are in the labor force, with 9.1% or 1,634 of them unemployed. The age group with the highest labor force participation rate is 20 to 24 years, with 89.8% or 1,680 individuals in the labor force. Within the labor force, the 25 to 29 years age range has the highest percentage of unemployed individuals, with 25.4% or 449 of them being unemployed.
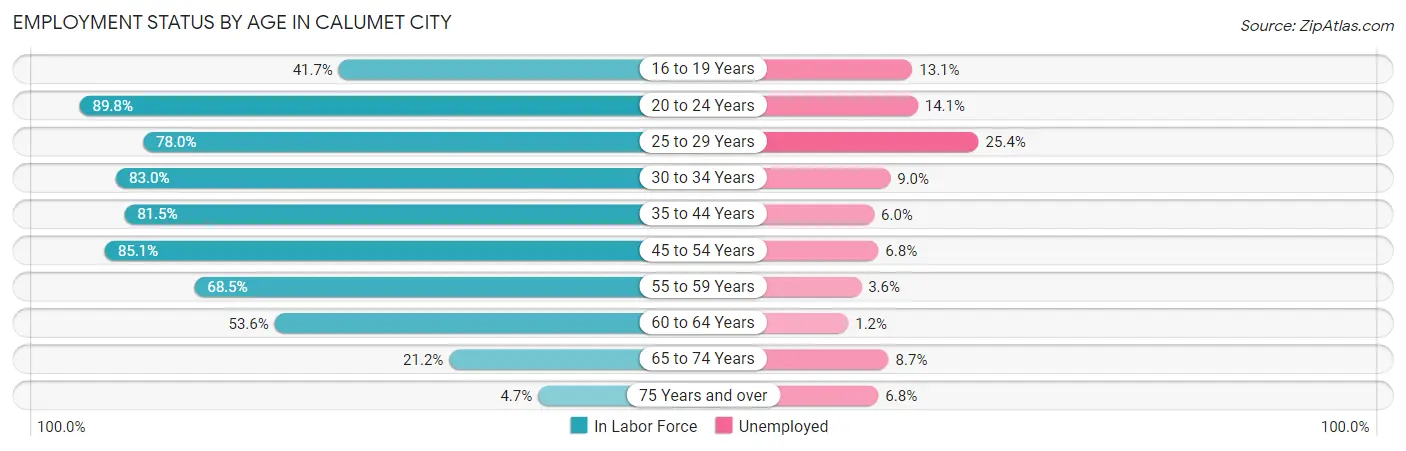
| Age Bracket | In Labor Force | Unemployed |
| 16 to 19 Years | 852 (41.7%) | 112 (13.1%) |
| 20 to 24 Years | 1,680 (89.8%) | 237 (14.1%) |
| 25 to 29 Years | 1,766 (78.0%) | 449 (25.4%) |
| 30 to 34 Years | 2,333 (83.0%) | 210 (9.0%) |
| 35 to 44 Years | 3,682 (81.5%) | 221 (6.0%) |
| 45 to 54 Years | 4,031 (85.1%) | 274 (6.8%) |
| 55 to 59 Years | 1,431 (68.5%) | 52 (3.6%) |
| 60 to 64 Years | 1,460 (53.6%) | 18 (1.2%) |
| 65 to 74 Years | 642 (21.2%) | 56 (8.7%) |
| 75 Years and over | 89 (4.7%) | 6 (6.8%) |
| Total | 17,957 (64.2%) | 1,634 (9.1%) |
Employment Status by Educational Attainment in Calumet City
According to labor force statistics for Calumet City, 76.8% of individuals (14,701) out of the total population between 25 and 64 years of age (19,142) are in the labor force, with 8.3% or 1,220 of them being unemployed. The group with the highest labor force participation rate are those with the educational attainment of bachelor's degree or higher, with 89.6% or 3,476 individuals in the labor force. Within the labor force, individuals with high school diploma education have the highest percentage of unemployment, with 9.4% or 356 of them being unemployed.
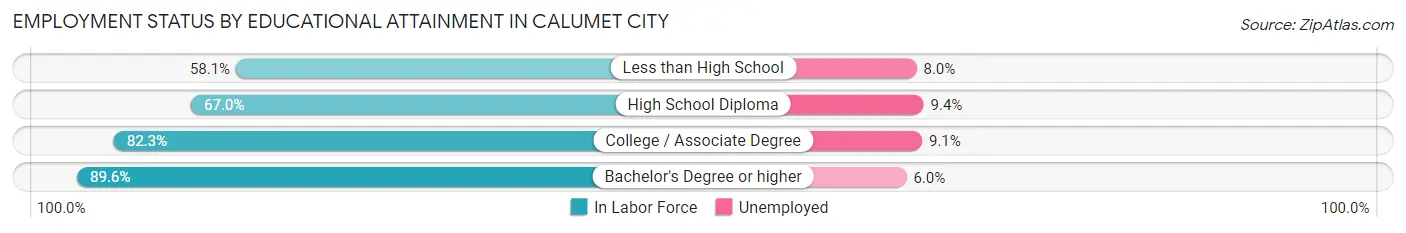
| Educational Attainment | In Labor Force | Unemployed |
| Less than High School | 1,128 (58.1%) | 155 (8.0%) |
| High School Diploma | 3,785 (67.0%) | 531 (9.4%) |
| College / Associate Degree | 6,314 (82.3%) | 698 (9.1%) |
| Bachelor's Degree or higher | 3,476 (89.6%) | 233 (6.0%) |
| Total | 14,701 (76.8%) | 1,589 (8.3%) |
Employment Occupations by Sex in Calumet City
Management, Business, Science and Arts Occupations
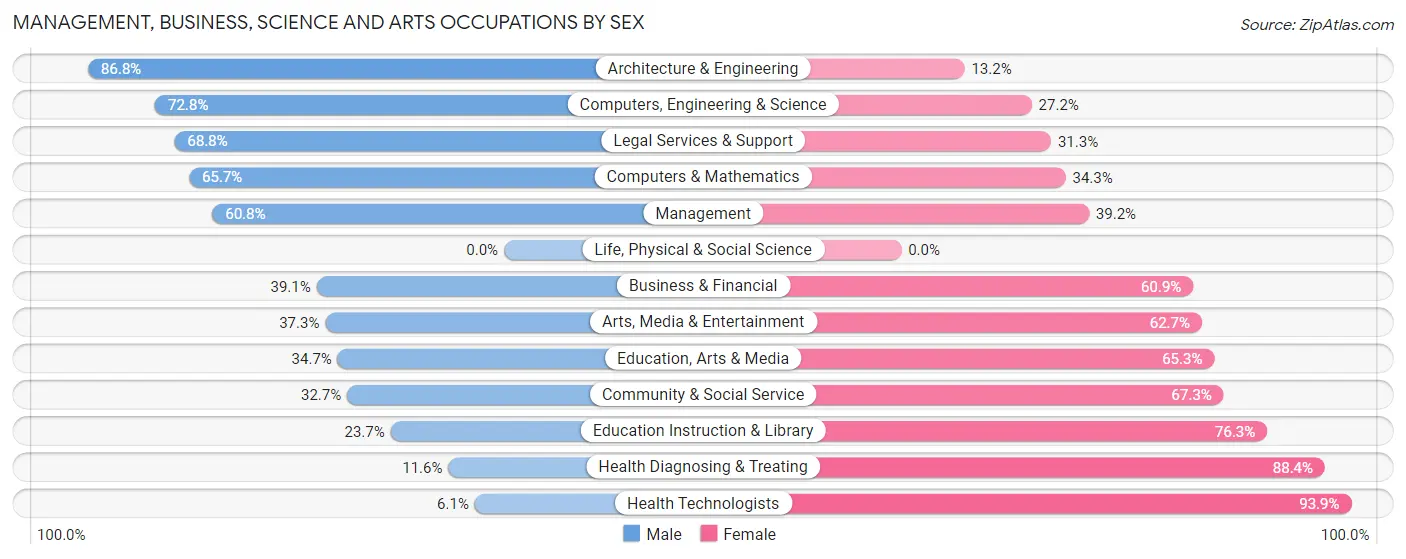
The most common Management, Business, Science and Arts occupations in Calumet City are Community & Social Service (1,537 | 9.4%), Management (978 | 6.0%), Health Diagnosing & Treating (904 | 5.5%), Education Instruction & Library (811 | 5.0%), and Business & Financial (578 | 3.5%).
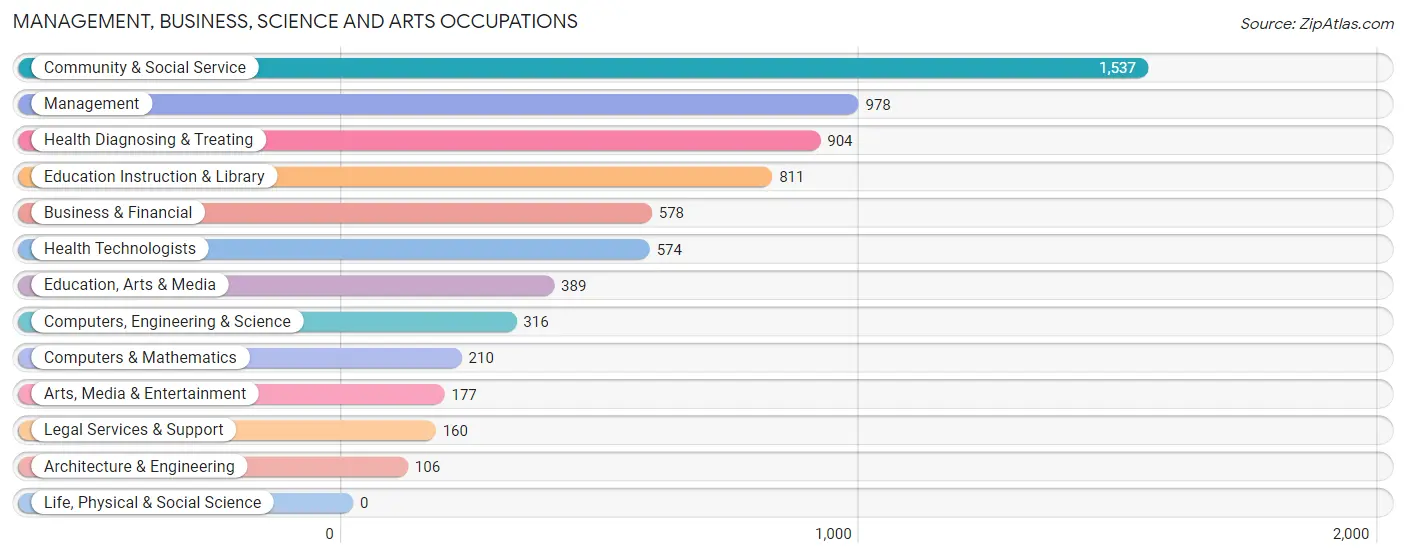
Management, Business, Science and Arts Occupations by Sex
Within the Management, Business, Science and Arts occupations in Calumet City, the most male-oriented occupations are Architecture & Engineering (86.8%), Computers, Engineering & Science (72.8%), and Legal Services & Support (68.8%), while the most female-oriented occupations are Health Technologists (93.9%), Health Diagnosing & Treating (88.4%), and Education Instruction & Library (76.3%).
| Occupation | Male | Female |
| Management | 595 (60.8%) | 383 (39.2%) |
| Business & Financial | 226 (39.1%) | 352 (60.9%) |
| Computers, Engineering & Science | 230 (72.8%) | 86 (27.2%) |
| Computers & Mathematics | 138 (65.7%) | 72 (34.3%) |
| Architecture & Engineering | 92 (86.8%) | 14 (13.2%) |
| Life, Physical & Social Science | 0 (0.0%) | 0 (0.0%) |
| Community & Social Service | 503 (32.7%) | 1,034 (67.3%) |
| Education, Arts & Media | 135 (34.7%) | 254 (65.3%) |
| Legal Services & Support | 110 (68.8%) | 50 (31.2%) |
| Education Instruction & Library | 192 (23.7%) | 619 (76.3%) |
| Arts, Media & Entertainment | 66 (37.3%) | 111 (62.7%) |
| Health Diagnosing & Treating | 105 (11.6%) | 799 (88.4%) |
| Health Technologists | 35 (6.1%) | 539 (93.9%) |
| Total (Category) | 1,659 (38.5%) | 2,654 (61.5%) |
| Total (Overall) | 7,769 (47.6%) | 8,565 (52.4%) |
Services Occupations
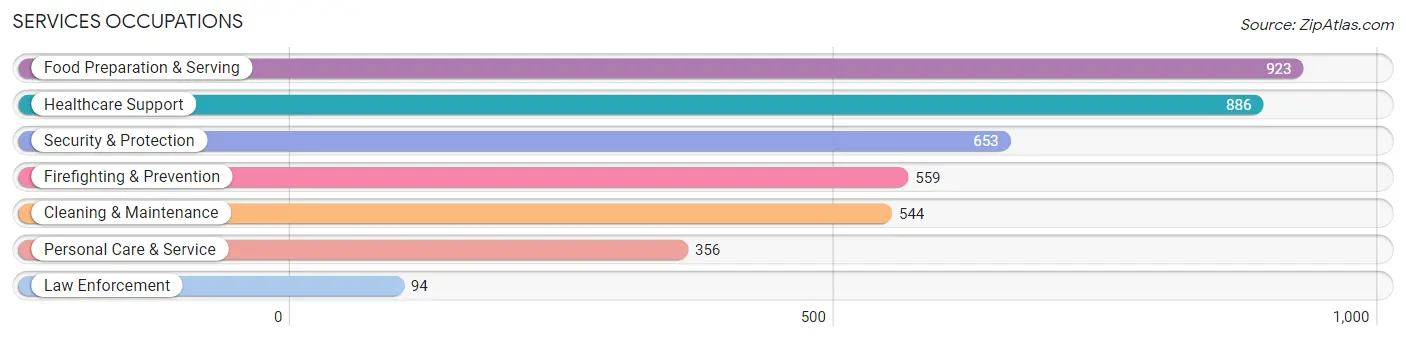
The most common Services occupations in Calumet City are Food Preparation & Serving (923 | 5.7%), Healthcare Support (886 | 5.4%), Security & Protection (653 | 4.0%), Firefighting & Prevention (559 | 3.4%), and Cleaning & Maintenance (544 | 3.3%).
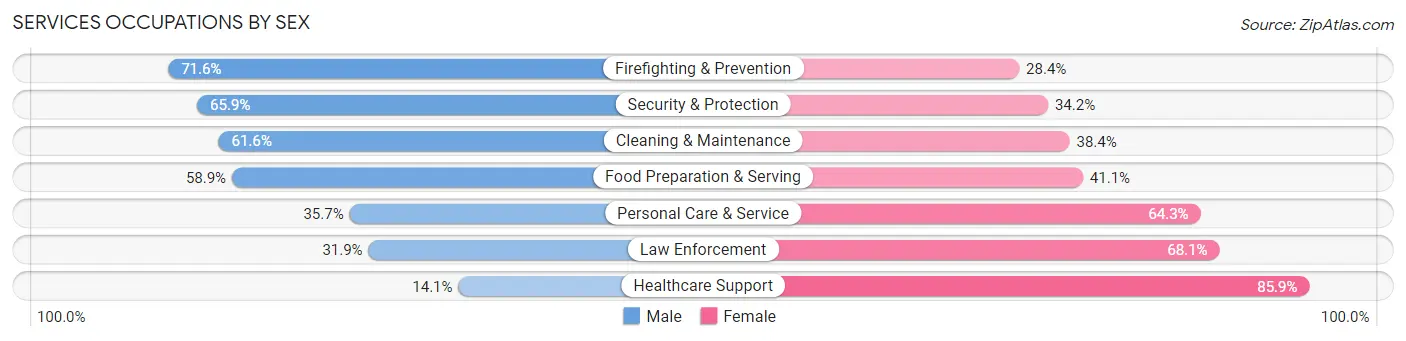
Services Occupations by Sex
Within the Services occupations in Calumet City, the most male-oriented occupations are Firefighting & Prevention (71.6%), Security & Protection (65.8%), and Cleaning & Maintenance (61.6%), while the most female-oriented occupations are Healthcare Support (85.9%), Law Enforcement (68.1%), and Personal Care & Service (64.3%).
| Occupation | Male | Female |
| Healthcare Support | 125 (14.1%) | 761 (85.9%) |
| Security & Protection | 430 (65.8%) | 223 (34.2%) |
| Firefighting & Prevention | 400 (71.6%) | 159 (28.4%) |
| Law Enforcement | 30 (31.9%) | 64 (68.1%) |
| Food Preparation & Serving | 544 (58.9%) | 379 (41.1%) |
| Cleaning & Maintenance | 335 (61.6%) | 209 (38.4%) |
| Personal Care & Service | 127 (35.7%) | 229 (64.3%) |
| Total (Category) | 1,561 (46.4%) | 1,801 (53.6%) |
| Total (Overall) | 7,769 (47.6%) | 8,565 (52.4%) |
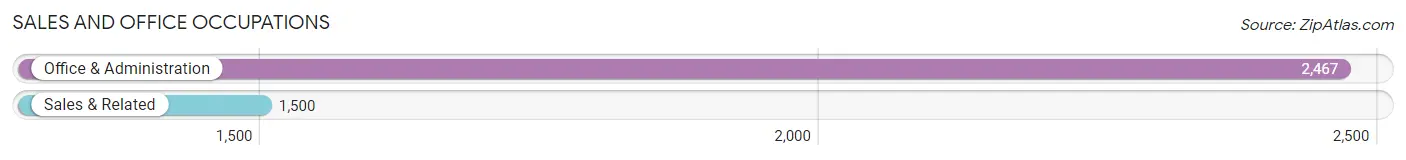
Sales and Office Occupations
The most common Sales and Office occupations in Calumet City are Office & Administration (2,467 | 15.1%), and Sales & Related (1,500 | 9.2%).
Sales and Office Occupations by Sex

| Occupation | Male | Female |
| Sales & Related | 715 (47.7%) | 785 (52.3%) |
| Office & Administration | 441 (17.9%) | 2,026 (82.1%) |
| Total (Category) | 1,156 (29.1%) | 2,811 (70.9%) |
| Total (Overall) | 7,769 (47.6%) | 8,565 (52.4%) |
Natural Resources, Construction and Maintenance Occupations
The most common Natural Resources, Construction and Maintenance occupations in Calumet City are Construction & Extraction (543 | 3.3%), Installation, Maintenance & Repair (311 | 1.9%), and Farming, Fishing & Forestry (14 | 0.1%).
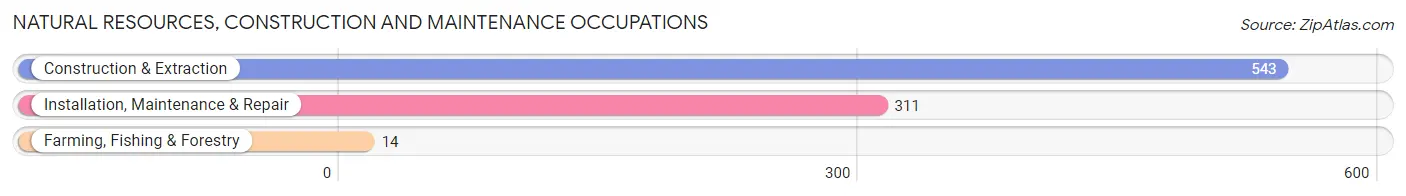
Natural Resources, Construction and Maintenance Occupations by Sex
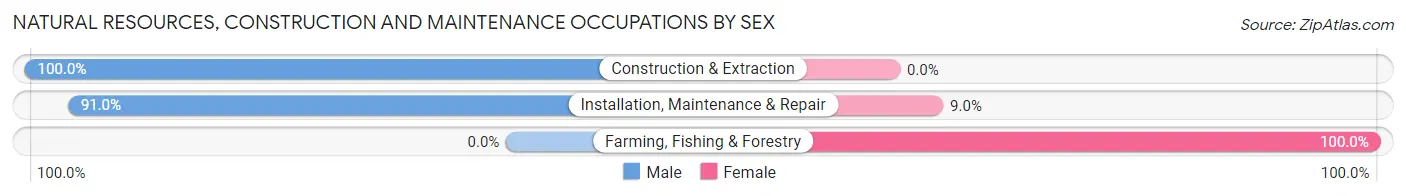
| Occupation | Male | Female |
| Farming, Fishing & Forestry | 0 (0.0%) | 14 (100.0%) |
| Construction & Extraction | 543 (100.0%) | 0 (0.0%) |
| Installation, Maintenance & Repair | 283 (91.0%) | 28 (9.0%) |
| Total (Category) | 826 (95.2%) | 42 (4.8%) |
| Total (Overall) | 7,769 (47.6%) | 8,565 (52.4%) |
Production, Transportation and Moving Occupations
The most common Production, Transportation and Moving occupations in Calumet City are Transportation (1,546 | 9.5%), Production (1,140 | 7.0%), and Material Moving (1,138 | 7.0%).
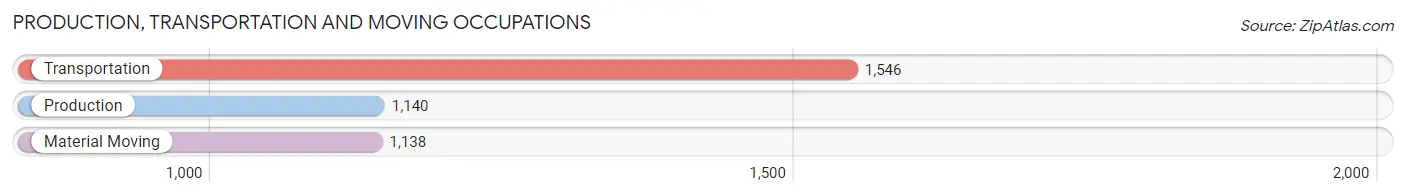
Production, Transportation and Moving Occupations by Sex
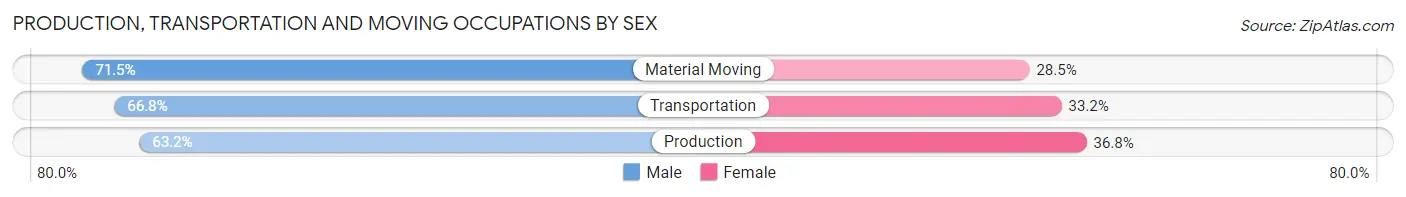
| Occupation | Male | Female |
| Production | 720 (63.2%) | 420 (36.8%) |
| Transportation | 1,033 (66.8%) | 513 (33.2%) |
| Material Moving | 814 (71.5%) | 324 (28.5%) |
| Total (Category) | 2,567 (67.1%) | 1,257 (32.9%) |
| Total (Overall) | 7,769 (47.6%) | 8,565 (52.4%) |
Employment Industries by Sex in Calumet City
Employment Industries in Calumet City
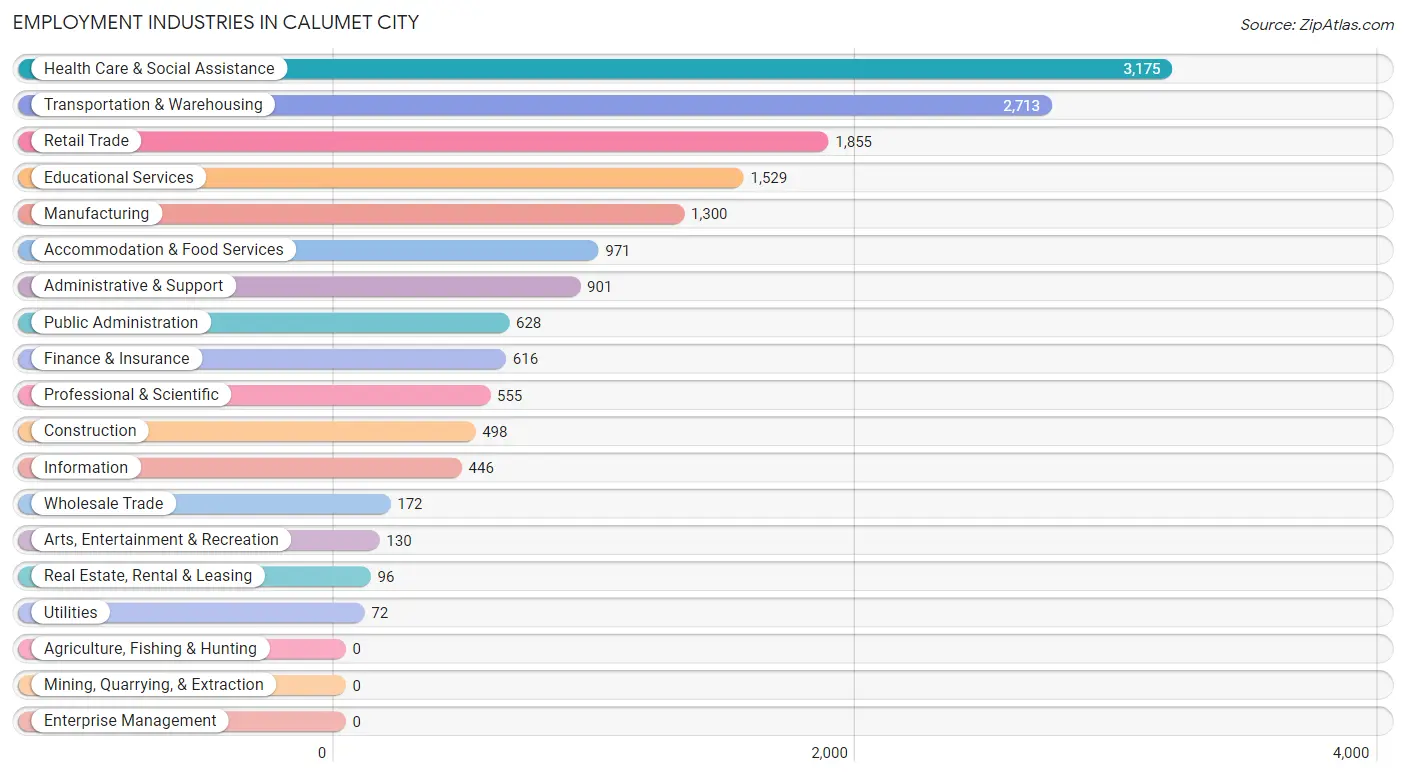
The major employment industries in Calumet City include Health Care & Social Assistance (3,175 | 19.4%), Transportation & Warehousing (2,713 | 16.6%), Retail Trade (1,855 | 11.4%), Educational Services (1,529 | 9.4%), and Manufacturing (1,300 | 8.0%).
Employment Industries by Sex in Calumet City
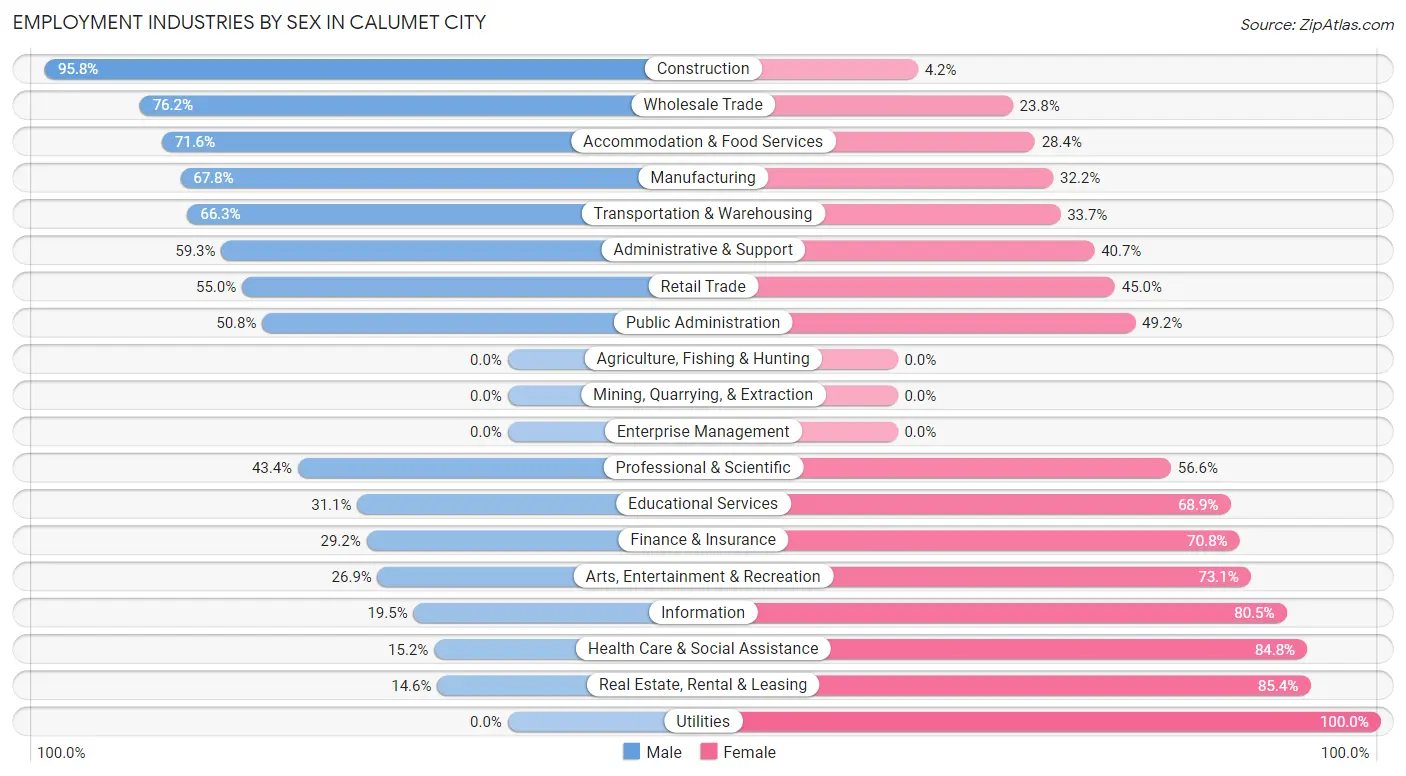
The Calumet City industries that see more men than women are Construction (95.8%), Wholesale Trade (76.2%), and Accommodation & Food Services (71.6%), whereas the industries that tend to have a higher number of women are Utilities (100.0%), Real Estate, Rental & Leasing (85.4%), and Health Care & Social Assistance (84.8%).
| Industry | Male | Female |
| Agriculture, Fishing & Hunting | 0 (0.0%) | 0 (0.0%) |
| Mining, Quarrying, & Extraction | 0 (0.0%) | 0 (0.0%) |
| Construction | 477 (95.8%) | 21 (4.2%) |
| Manufacturing | 881 (67.8%) | 419 (32.2%) |
| Wholesale Trade | 131 (76.2%) | 41 (23.8%) |
| Retail Trade | 1,020 (55.0%) | 835 (45.0%) |
| Transportation & Warehousing | 1,799 (66.3%) | 914 (33.7%) |
| Utilities | 0 (0.0%) | 72 (100.0%) |
| Information | 87 (19.5%) | 359 (80.5%) |
| Finance & Insurance | 180 (29.2%) | 436 (70.8%) |
| Real Estate, Rental & Leasing | 14 (14.6%) | 82 (85.4%) |
| Professional & Scientific | 241 (43.4%) | 314 (56.6%) |
| Enterprise Management | 0 (0.0%) | 0 (0.0%) |
| Administrative & Support | 534 (59.3%) | 367 (40.7%) |
| Educational Services | 476 (31.1%) | 1,053 (68.9%) |
| Health Care & Social Assistance | 484 (15.2%) | 2,691 (84.8%) |
| Arts, Entertainment & Recreation | 35 (26.9%) | 95 (73.1%) |
| Accommodation & Food Services | 695 (71.6%) | 276 (28.4%) |
| Public Administration | 319 (50.8%) | 309 (49.2%) |
| Total | 7,769 (47.6%) | 8,565 (52.4%) |
Education in Calumet City
School Enrollment in Calumet City
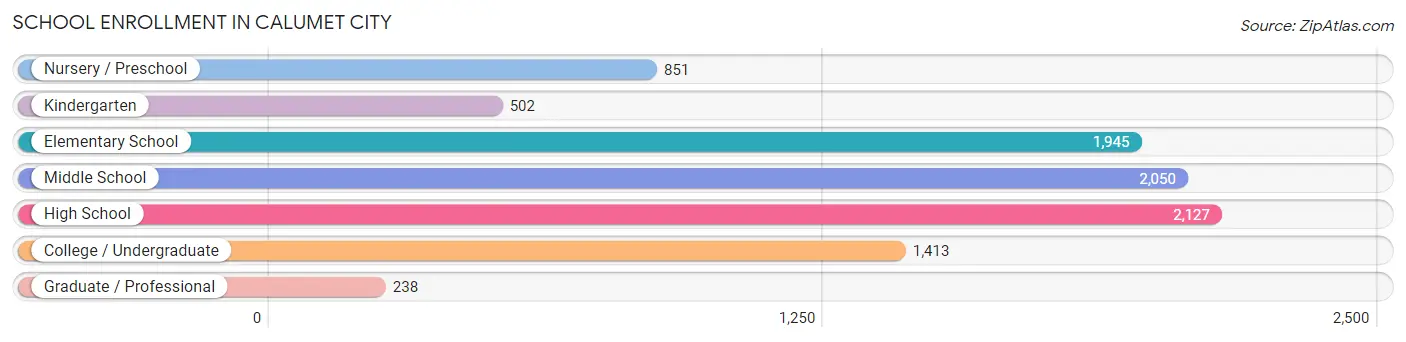
The most common levels of schooling among the 9,126 students in Calumet City are high school (2,127 | 23.3%), middle school (2,050 | 22.5%), and elementary school (1,945 | 21.3%).
| School Level | # Students | % Students |
| Nursery / Preschool | 851 | 9.3% |
| Kindergarten | 502 | 5.5% |
| Elementary School | 1,945 | 21.3% |
| Middle School | 2,050 | 22.5% |
| High School | 2,127 | 23.3% |
| College / Undergraduate | 1,413 | 15.5% |
| Graduate / Professional | 238 | 2.6% |
| Total | 9,126 | 100.0% |
School Enrollment by Age by Funding Source in Calumet City
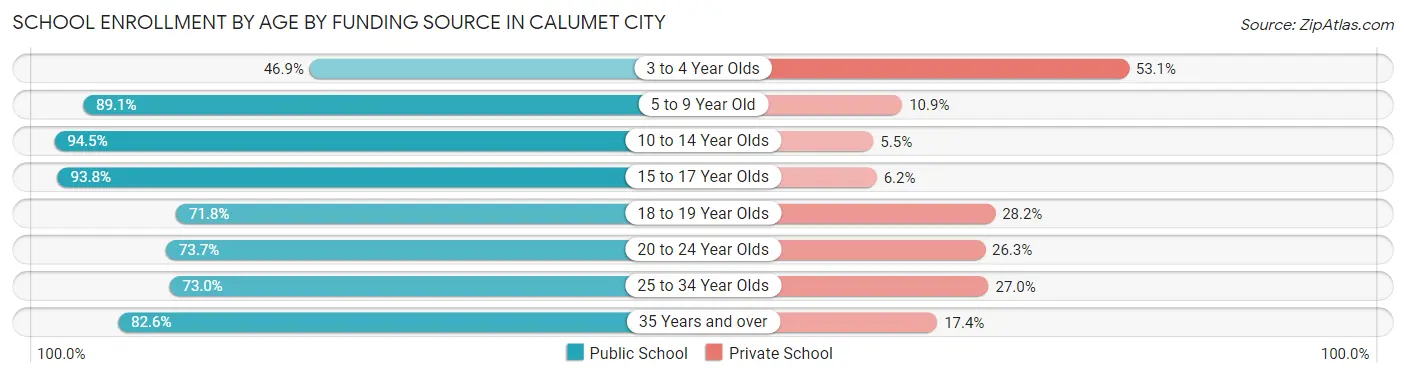
Out of a total of 9,126 students who are enrolled in schools in Calumet City, 1,342 (14.7%) attend a private institution, while the remaining 7,784 (85.3%) are enrolled in public schools. The age group of 3 to 4 year olds has the highest likelihood of being enrolled in private schools, with 350 (53.1% in the age bracket) enrolled. Conversely, the age group of 10 to 14 year olds has the lowest likelihood of being enrolled in a private school, with 2,250 (94.5% in the age bracket) attending a public institution.
| Age Bracket | Public School | Private School |
| 3 to 4 Year Olds | 309 (46.9%) | 350 (53.1%) |
| 5 to 9 Year Old | 2,197 (89.1%) | 269 (10.9%) |
| 10 to 14 Year Olds | 2,250 (94.5%) | 132 (5.5%) |
| 15 to 17 Year Olds | 1,570 (93.8%) | 103 (6.2%) |
| 18 to 19 Year Olds | 501 (71.8%) | 197 (28.2%) |
| 20 to 24 Year Olds | 235 (73.7%) | 84 (26.3%) |
| 25 to 34 Year Olds | 322 (73.0%) | 119 (27.0%) |
| 35 Years and over | 403 (82.6%) | 85 (17.4%) |
| Total | 7,784 (85.3%) | 1,342 (14.7%) |
Educational Attainment by Field of Study in Calumet City
Business (1,264 | 26.0%), science & technology (723 | 14.8%), education (698 | 14.3%), arts & humanities (458 | 9.4%), and social sciences (334 | 6.9%) are the most common fields of study among 4,868 individuals in Calumet City who have obtained a bachelor's degree or higher.
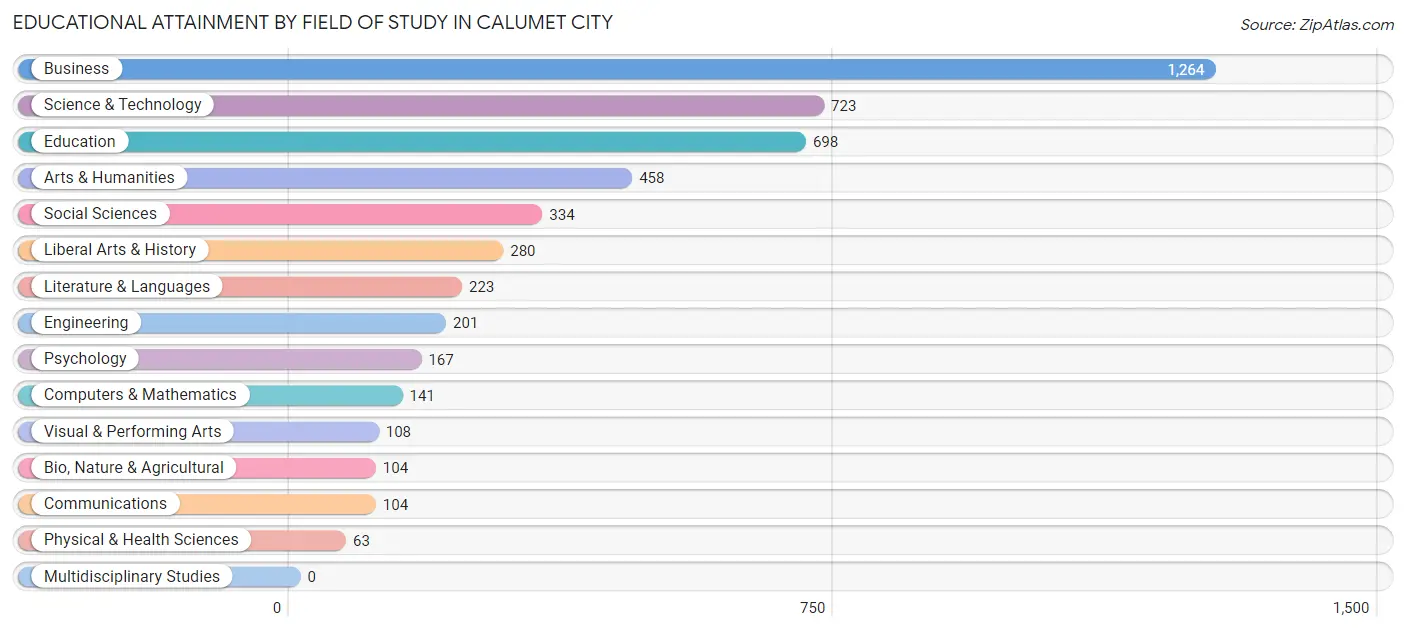
| Field of Study | # Graduates | % Graduates |
| Computers & Mathematics | 141 | 2.9% |
| Bio, Nature & Agricultural | 104 | 2.1% |
| Physical & Health Sciences | 63 | 1.3% |
| Psychology | 167 | 3.4% |
| Social Sciences | 334 | 6.9% |
| Engineering | 201 | 4.1% |
| Multidisciplinary Studies | 0 | 0.0% |
| Science & Technology | 723 | 14.8% |
| Business | 1,264 | 26.0% |
| Education | 698 | 14.3% |
| Literature & Languages | 223 | 4.6% |
| Liberal Arts & History | 280 | 5.8% |
| Visual & Performing Arts | 108 | 2.2% |
| Communications | 104 | 2.1% |
| Arts & Humanities | 458 | 9.4% |
| Total | 4,868 | 100.0% |
Transportation & Commute in Calumet City
Vehicle Availability by Sex in Calumet City
The most prevalent vehicle ownership categories in Calumet City are males with 2 vehicles (2,777, accounting for 36.2%) and females with 2 vehicles (2,336, making up 32.8%).
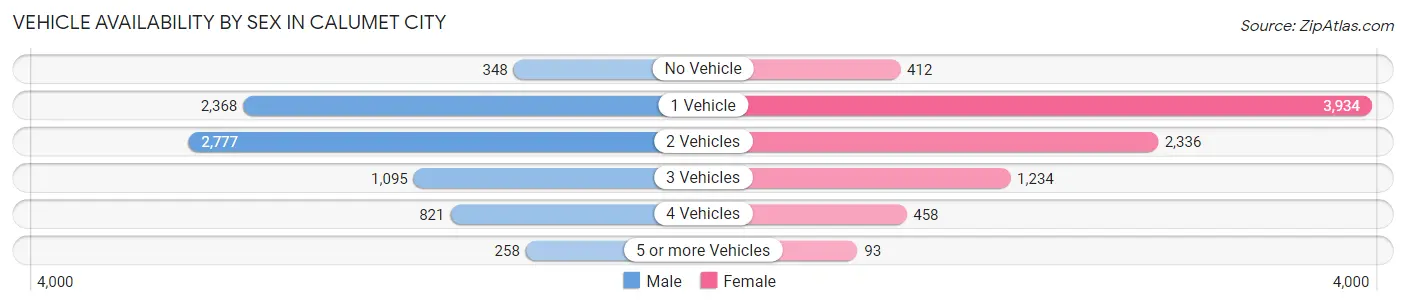
| Vehicles Available | Male | Female |
| No Vehicle | 348 (4.5%) | 412 (4.9%) |
| 1 Vehicle | 2,368 (30.9%) | 3,934 (46.5%) |
| 2 Vehicles | 2,777 (36.2%) | 2,336 (27.6%) |
| 3 Vehicles | 1,095 (14.3%) | 1,234 (14.6%) |
| 4 Vehicles | 821 (10.7%) | 458 (5.4%) |
| 5 or more Vehicles | 258 (3.4%) | 93 (1.1%) |
| Total | 7,667 (100.0%) | 8,467 (100.0%) |
Commute Time in Calumet City
The most frequently occuring commute durations in Calumet City are 30 to 34 minutes (2,581 commuters, 17.3%), 20 to 24 minutes (1,911 commuters, 12.8%), and 60 to 89 minutes (1,694 commuters, 11.4%).
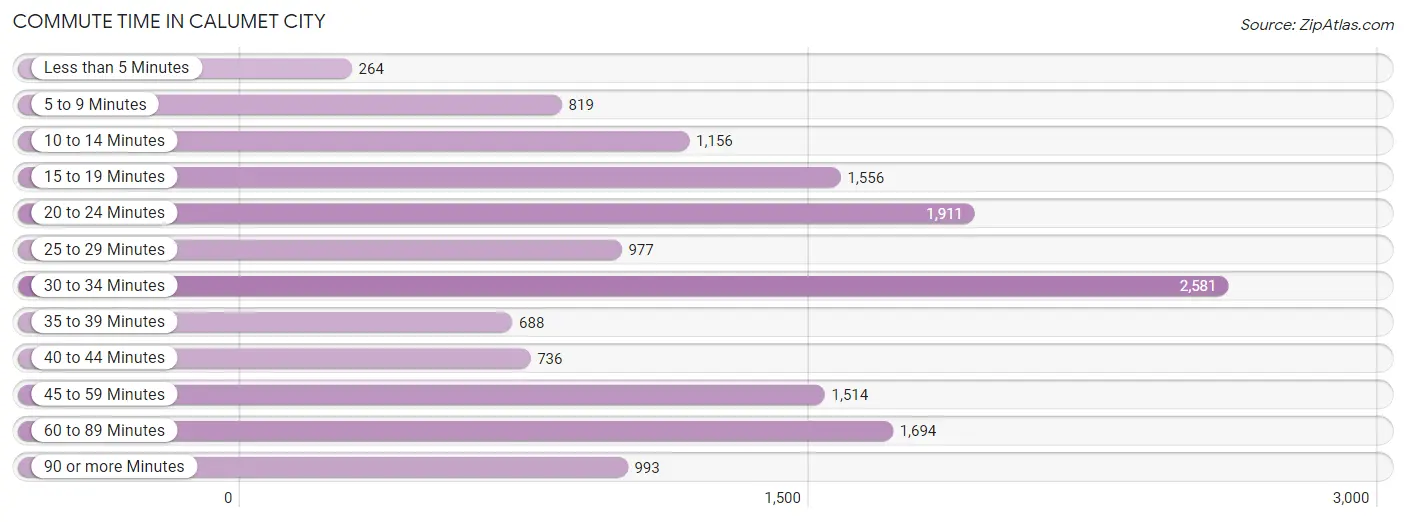
| Commute Time | # Commuters | % Commuters |
| Less than 5 Minutes | 264 | 1.8% |
| 5 to 9 Minutes | 819 | 5.5% |
| 10 to 14 Minutes | 1,156 | 7.8% |
| 15 to 19 Minutes | 1,556 | 10.4% |
| 20 to 24 Minutes | 1,911 | 12.8% |
| 25 to 29 Minutes | 977 | 6.6% |
| 30 to 34 Minutes | 2,581 | 17.3% |
| 35 to 39 Minutes | 688 | 4.6% |
| 40 to 44 Minutes | 736 | 4.9% |
| 45 to 59 Minutes | 1,514 | 10.2% |
| 60 to 89 Minutes | 1,694 | 11.4% |
| 90 or more Minutes | 993 | 6.7% |
Commute Time by Sex in Calumet City
The most common commute times in Calumet City are 30 to 34 minutes (1,301 commuters, 18.5%) for males and 30 to 34 minutes (1,280 commuters, 16.3%) for females.
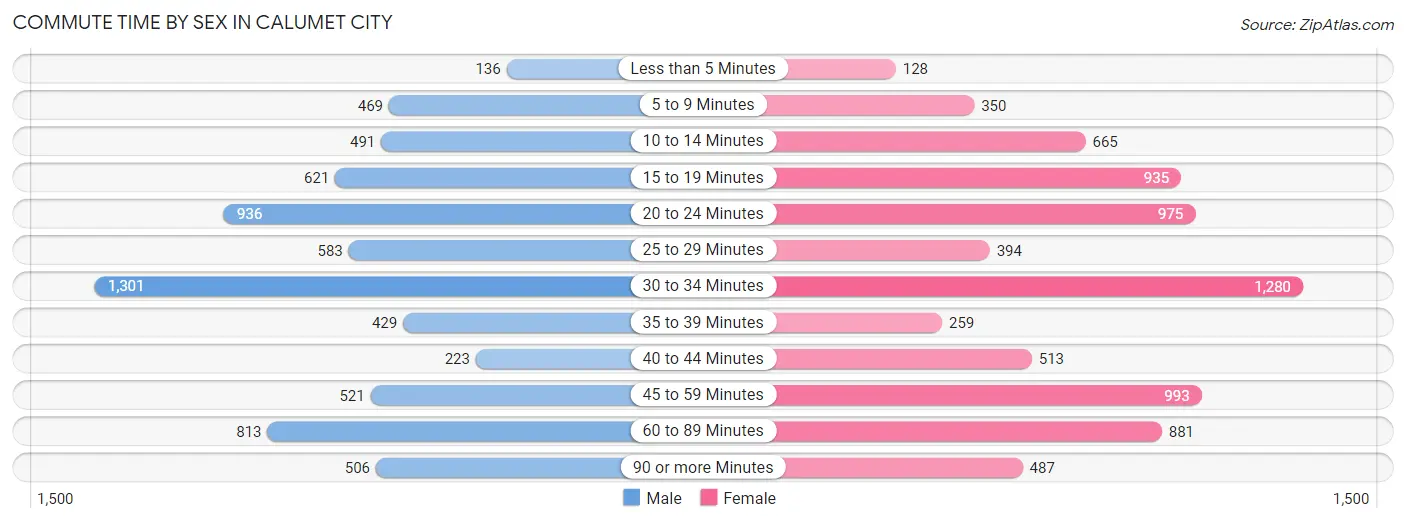
| Commute Time | Male | Female |
| Less than 5 Minutes | 136 (1.9%) | 128 (1.6%) |
| 5 to 9 Minutes | 469 (6.7%) | 350 (4.4%) |
| 10 to 14 Minutes | 491 (7.0%) | 665 (8.5%) |
| 15 to 19 Minutes | 621 (8.8%) | 935 (11.9%) |
| 20 to 24 Minutes | 936 (13.3%) | 975 (12.4%) |
| 25 to 29 Minutes | 583 (8.3%) | 394 (5.0%) |
| 30 to 34 Minutes | 1,301 (18.5%) | 1,280 (16.3%) |
| 35 to 39 Minutes | 429 (6.1%) | 259 (3.3%) |
| 40 to 44 Minutes | 223 (3.2%) | 513 (6.5%) |
| 45 to 59 Minutes | 521 (7.4%) | 993 (12.6%) |
| 60 to 89 Minutes | 813 (11.6%) | 881 (11.2%) |
| 90 or more Minutes | 506 (7.2%) | 487 (6.2%) |
Time of Departure to Work by Sex in Calumet City
The most frequent times of departure to work in Calumet City are 12:00 PM to 3:59 PM (901, 12.8%) for males and 7:00 AM to 7:29 AM (1,124, 14.3%) for females.
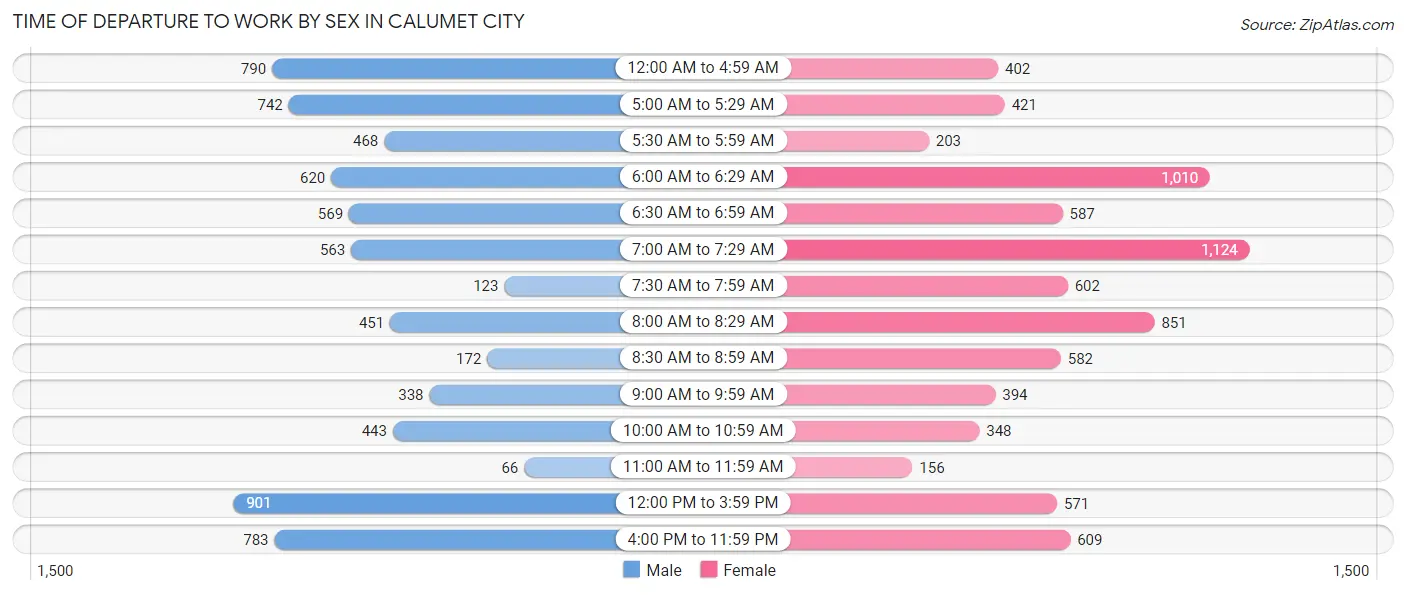
| Time of Departure | Male | Female |
| 12:00 AM to 4:59 AM | 790 (11.2%) | 402 (5.1%) |
| 5:00 AM to 5:29 AM | 742 (10.6%) | 421 (5.4%) |
| 5:30 AM to 5:59 AM | 468 (6.7%) | 203 (2.6%) |
| 6:00 AM to 6:29 AM | 620 (8.8%) | 1,010 (12.9%) |
| 6:30 AM to 6:59 AM | 569 (8.1%) | 587 (7.5%) |
| 7:00 AM to 7:29 AM | 563 (8.0%) | 1,124 (14.3%) |
| 7:30 AM to 7:59 AM | 123 (1.8%) | 602 (7.7%) |
| 8:00 AM to 8:29 AM | 451 (6.4%) | 851 (10.8%) |
| 8:30 AM to 8:59 AM | 172 (2.5%) | 582 (7.4%) |
| 9:00 AM to 9:59 AM | 338 (4.8%) | 394 (5.0%) |
| 10:00 AM to 10:59 AM | 443 (6.3%) | 348 (4.4%) |
| 11:00 AM to 11:59 AM | 66 (0.9%) | 156 (2.0%) |
| 12:00 PM to 3:59 PM | 901 (12.8%) | 571 (7.3%) |
| 4:00 PM to 11:59 PM | 783 (11.1%) | 609 (7.7%) |
| Total | 7,029 (100.0%) | 7,860 (100.0%) |
Housing Occupancy in Calumet City
Occupancy by Ownership in Calumet City
Of the total 14,412 dwellings in Calumet City, owner-occupied units account for 8,520 (59.1%), while renter-occupied units make up 5,892 (40.9%).
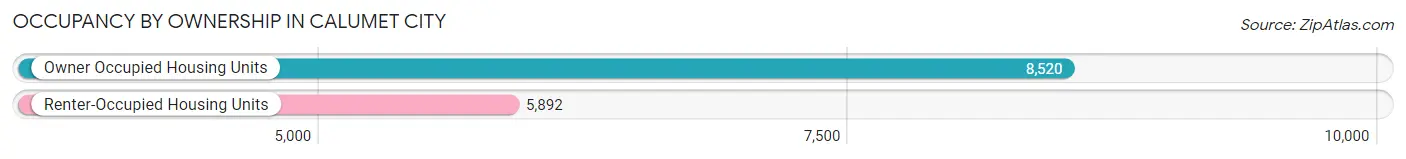
| Occupancy | # Housing Units | % Housing Units |
| Owner Occupied Housing Units | 8,520 | 59.1% |
| Renter-Occupied Housing Units | 5,892 | 40.9% |
| Total Occupied Housing Units | 14,412 | 100.0% |
Occupancy by Household Size in Calumet City
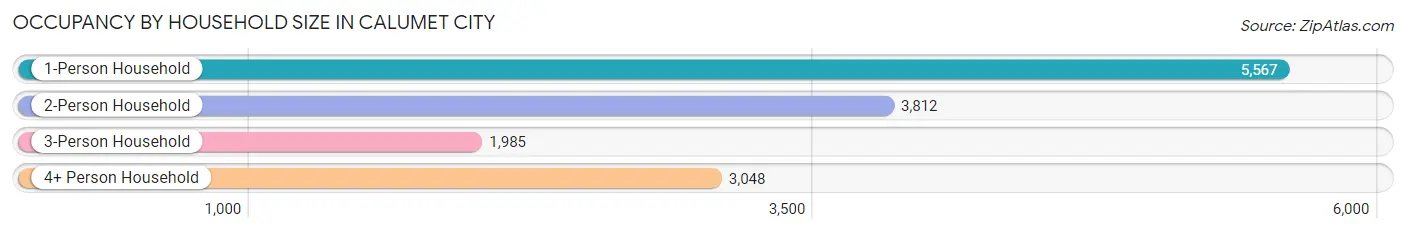
| Household Size | # Housing Units | % Housing Units |
| 1-Person Household | 5,567 | 38.6% |
| 2-Person Household | 3,812 | 26.5% |
| 3-Person Household | 1,985 | 13.8% |
| 4+ Person Household | 3,048 | 21.1% |
| Total Housing Units | 14,412 | 100.0% |
Occupancy by Ownership by Household Size in Calumet City
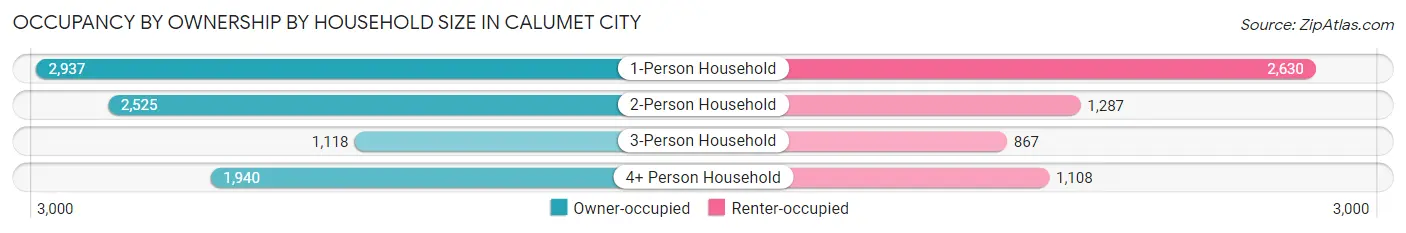
| Household Size | Owner-occupied | Renter-occupied |
| 1-Person Household | 2,937 (52.8%) | 2,630 (47.2%) |
| 2-Person Household | 2,525 (66.2%) | 1,287 (33.8%) |
| 3-Person Household | 1,118 (56.3%) | 867 (43.7%) |
| 4+ Person Household | 1,940 (63.6%) | 1,108 (36.3%) |
| Total Housing Units | 8,520 (59.1%) | 5,892 (40.9%) |
Occupancy by Educational Attainment in Calumet City
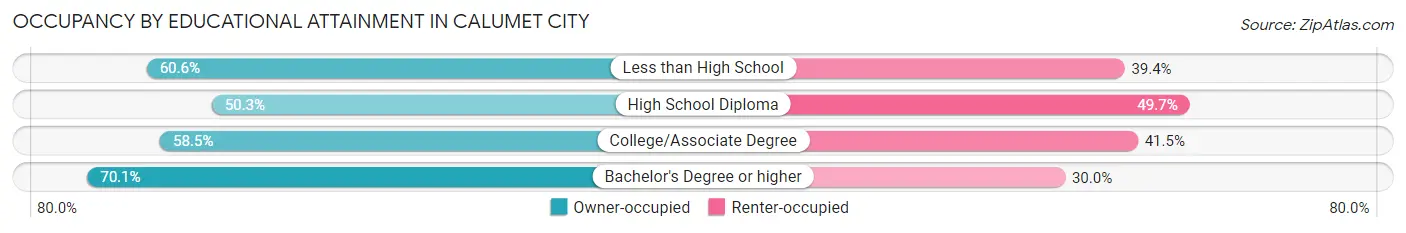
| Household Size | Owner-occupied | Renter-occupied |
| Less than High School | 836 (60.6%) | 543 (39.4%) |
| High School Diploma | 1,971 (50.3%) | 1,947 (49.7%) |
| College/Associate Degree | 3,407 (58.5%) | 2,416 (41.5%) |
| Bachelor's Degree or higher | 2,306 (70.1%) | 986 (29.9%) |
Occupancy by Age of Householder in Calumet City
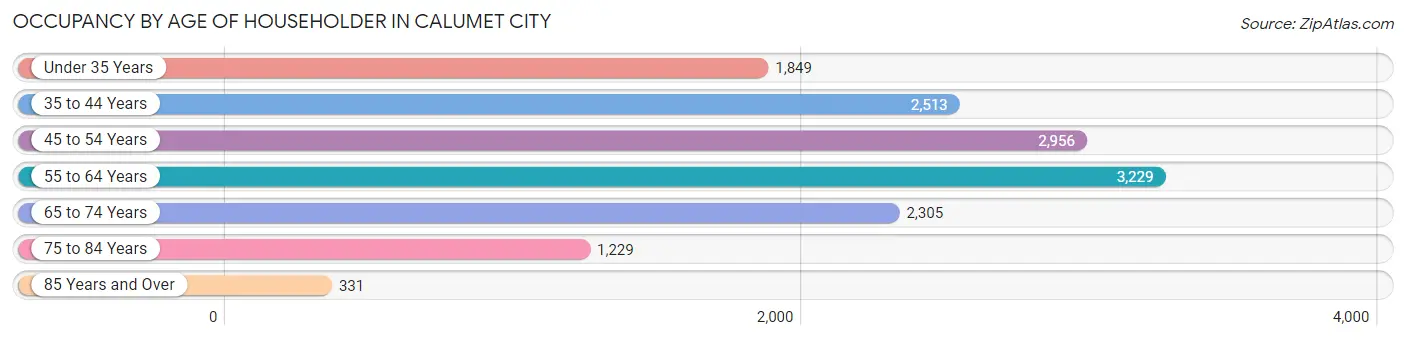
| Age Bracket | # Households | % Households |
| Under 35 Years | 1,849 | 12.8% |
| 35 to 44 Years | 2,513 | 17.4% |
| 45 to 54 Years | 2,956 | 20.5% |
| 55 to 64 Years | 3,229 | 22.4% |
| 65 to 74 Years | 2,305 | 16.0% |
| 75 to 84 Years | 1,229 | 8.5% |
| 85 Years and Over | 331 | 2.3% |
| Total | 14,412 | 100.0% |
Housing Finances in Calumet City
Median Income by Occupancy in Calumet City
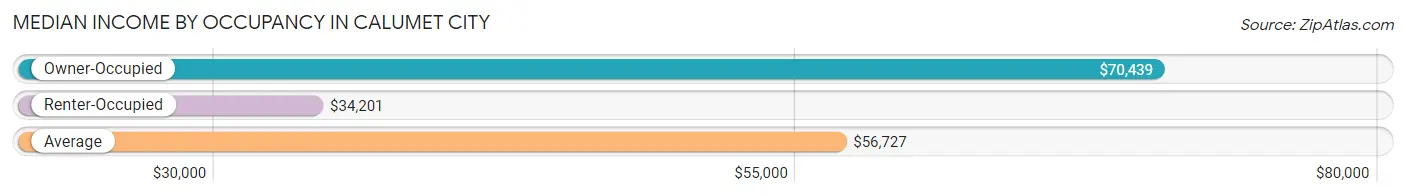
| Occupancy Type | # Households | Median Income |
| Owner-Occupied | 8,520 (59.1%) | $70,439 |
| Renter-Occupied | 5,892 (40.9%) | $34,201 |
| Average | 14,412 (100.0%) | $56,727 |
Occupancy by Householder Income Bracket in Calumet City
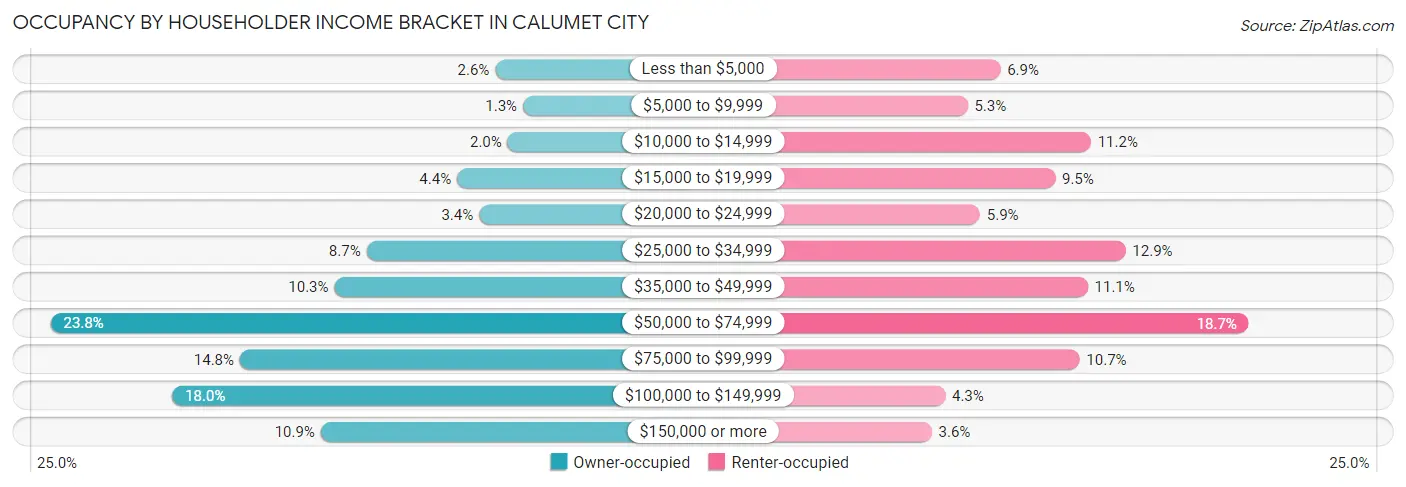
| Income Bracket | Owner-occupied | Renter-occupied |
| Less than $5,000 | 221 (2.6%) | 406 (6.9%) |
| $5,000 to $9,999 | 108 (1.3%) | 314 (5.3%) |
| $10,000 to $14,999 | 170 (2.0%) | 660 (11.2%) |
| $15,000 to $19,999 | 376 (4.4%) | 560 (9.5%) |
| $20,000 to $24,999 | 286 (3.4%) | 349 (5.9%) |
| $25,000 to $34,999 | 743 (8.7%) | 757 (12.9%) |
| $35,000 to $49,999 | 873 (10.2%) | 651 (11.1%) |
| $50,000 to $74,999 | 2,025 (23.8%) | 1,103 (18.7%) |
| $75,000 to $99,999 | 1,257 (14.7%) | 628 (10.7%) |
| $100,000 to $149,999 | 1,532 (18.0%) | 251 (4.3%) |
| $150,000 or more | 929 (10.9%) | 213 (3.6%) |
| Total | 8,520 (100.0%) | 5,892 (100.0%) |
Monthly Housing Cost Tiers in Calumet City
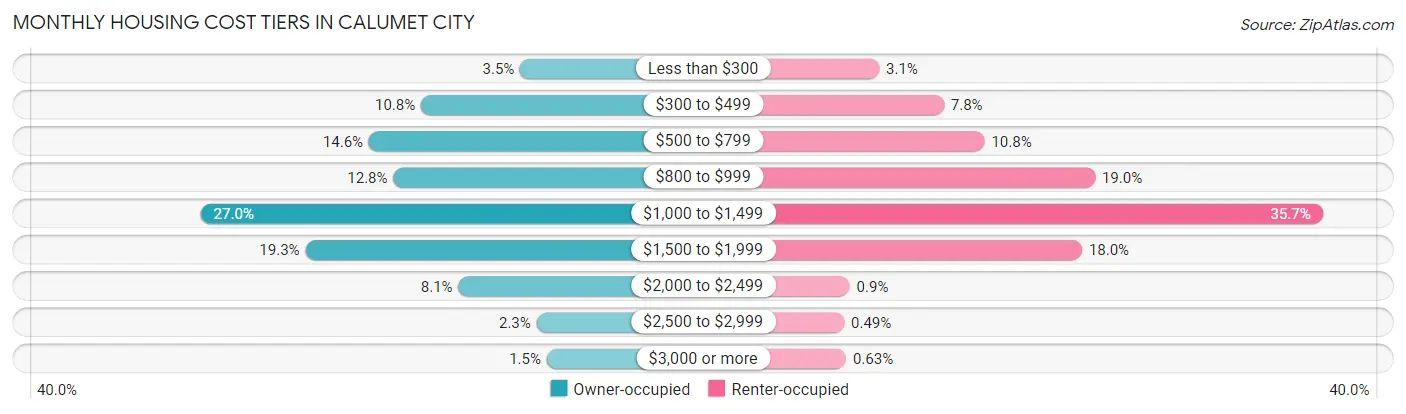
| Monthly Cost | Owner-occupied | Renter-occupied |
| Less than $300 | 298 (3.5%) | 181 (3.1%) |
| $300 to $499 | 920 (10.8%) | 462 (7.8%) |
| $500 to $799 | 1,247 (14.6%) | 638 (10.8%) |
| $800 to $999 | 1,094 (12.8%) | 1,118 (19.0%) |
| $1,000 to $1,499 | 2,303 (27.0%) | 2,105 (35.7%) |
| $1,500 to $1,999 | 1,646 (19.3%) | 1,061 (18.0%) |
| $2,000 to $2,499 | 686 (8.1%) | 53 (0.9%) |
| $2,500 to $2,999 | 195 (2.3%) | 29 (0.5%) |
| $3,000 or more | 131 (1.5%) | 37 (0.6%) |
| Total | 8,520 (100.0%) | 5,892 (100.0%) |
Physical Housing Characteristics in Calumet City
Housing Structures in Calumet City
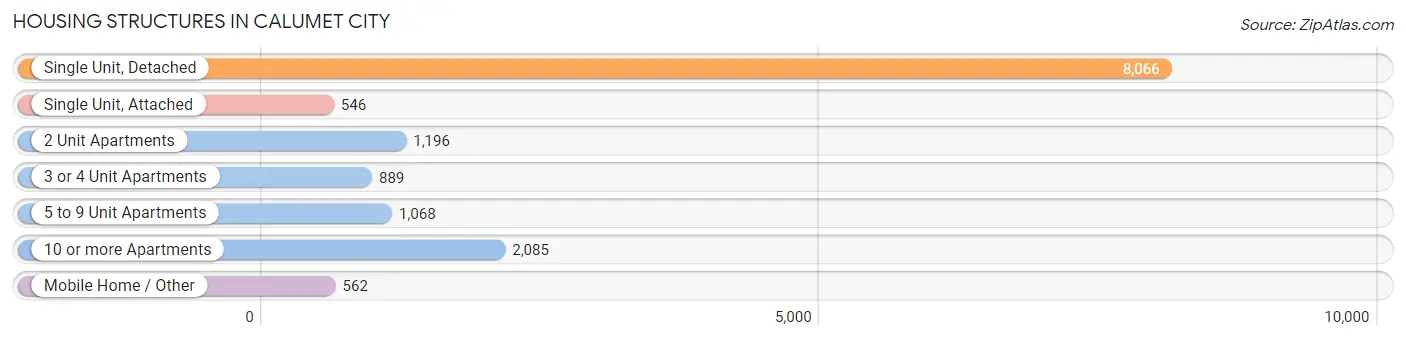
| Structure Type | # Housing Units | % Housing Units |
| Single Unit, Detached | 8,066 | 56.0% |
| Single Unit, Attached | 546 | 3.8% |
| 2 Unit Apartments | 1,196 | 8.3% |
| 3 or 4 Unit Apartments | 889 | 6.2% |
| 5 to 9 Unit Apartments | 1,068 | 7.4% |
| 10 or more Apartments | 2,085 | 14.5% |
| Mobile Home / Other | 562 | 3.9% |
| Total | 14,412 | 100.0% |
Housing Structures by Occupancy in Calumet City
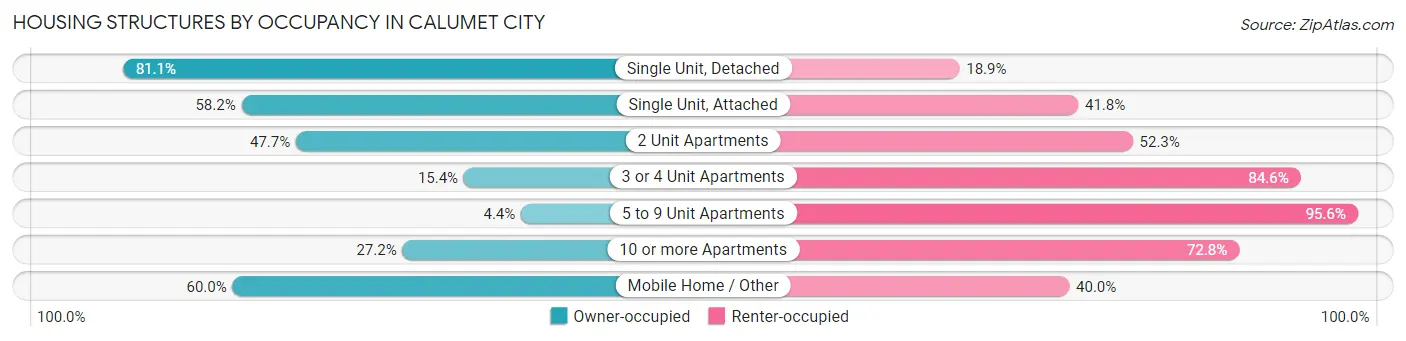
| Structure Type | Owner-occupied | Renter-occupied |
| Single Unit, Detached | 6,542 (81.1%) | 1,524 (18.9%) |
| Single Unit, Attached | 318 (58.2%) | 228 (41.8%) |
| 2 Unit Apartments | 571 (47.7%) | 625 (52.3%) |
| 3 or 4 Unit Apartments | 137 (15.4%) | 752 (84.6%) |
| 5 to 9 Unit Apartments | 47 (4.4%) | 1,021 (95.6%) |
| 10 or more Apartments | 568 (27.2%) | 1,517 (72.8%) |
| Mobile Home / Other | 337 (60.0%) | 225 (40.0%) |
| Total | 8,520 (59.1%) | 5,892 (40.9%) |
Housing Structures by Number of Rooms in Calumet City
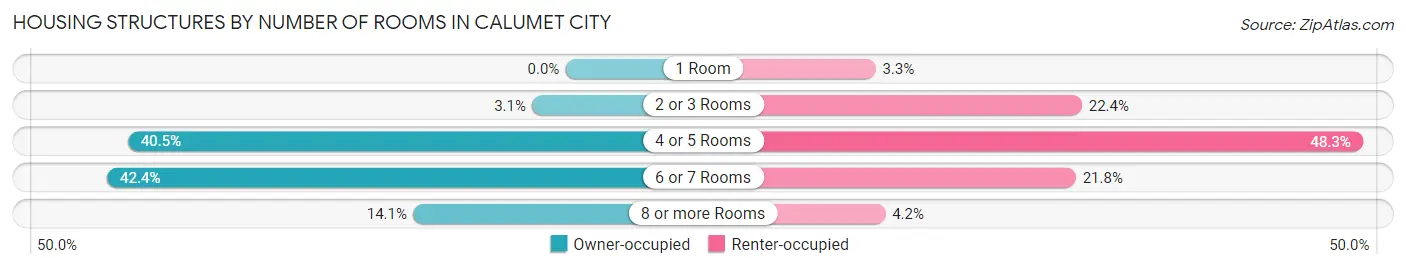
| Number of Rooms | Owner-occupied | Renter-occupied |
| 1 Room | 0 (0.0%) | 194 (3.3%) |
| 2 or 3 Rooms | 263 (3.1%) | 1,318 (22.4%) |
| 4 or 5 Rooms | 3,447 (40.5%) | 2,848 (48.3%) |
| 6 or 7 Rooms | 3,609 (42.4%) | 1,285 (21.8%) |
| 8 or more Rooms | 1,201 (14.1%) | 247 (4.2%) |
| Total | 8,520 (100.0%) | 5,892 (100.0%) |
Housing Structure by Heating Type in Calumet City
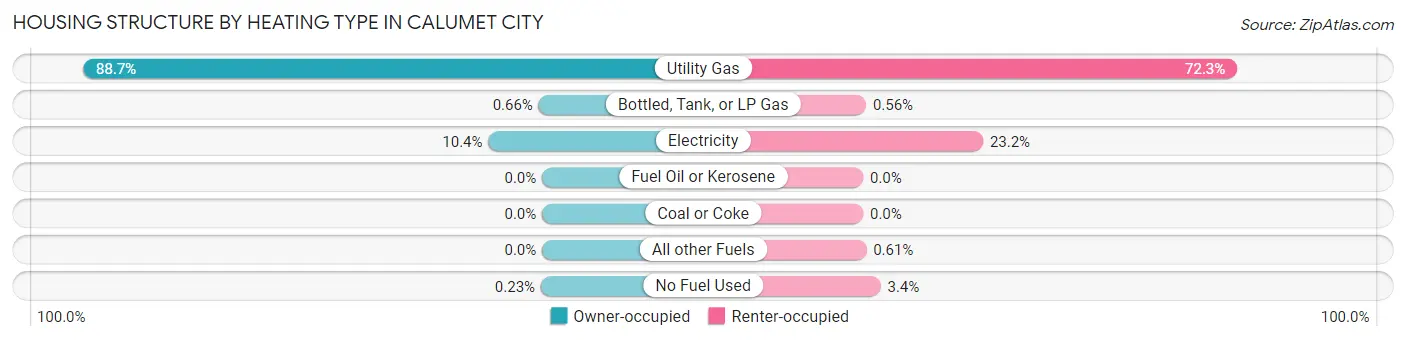
| Heating Type | Owner-occupied | Renter-occupied |
| Utility Gas | 7,560 (88.7%) | 4,259 (72.3%) |
| Bottled, Tank, or LP Gas | 56 (0.7%) | 33 (0.6%) |
| Electricity | 884 (10.4%) | 1,365 (23.2%) |
| Fuel Oil or Kerosene | 0 (0.0%) | 0 (0.0%) |
| Coal or Coke | 0 (0.0%) | 0 (0.0%) |
| All other Fuels | 0 (0.0%) | 36 (0.6%) |
| No Fuel Used | 20 (0.2%) | 199 (3.4%) |
| Total | 8,520 (100.0%) | 5,892 (100.0%) |
Household Vehicle Usage in Calumet City
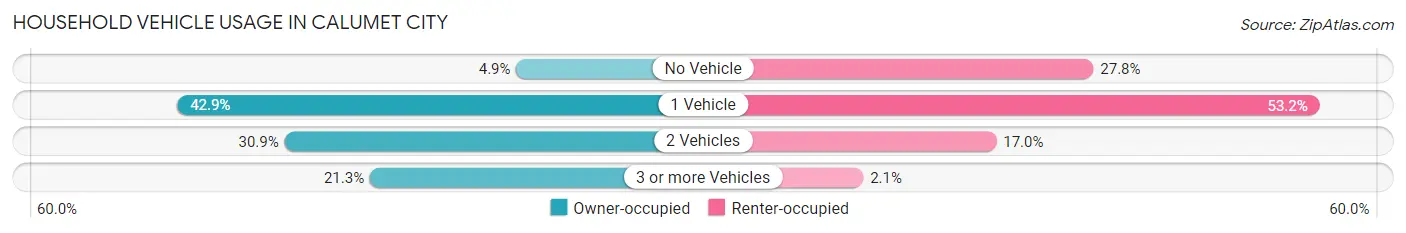
| Vehicles per Household | Owner-occupied | Renter-occupied |
| No Vehicle | 418 (4.9%) | 1,640 (27.8%) |
| 1 Vehicle | 3,655 (42.9%) | 3,132 (53.2%) |
| 2 Vehicles | 2,631 (30.9%) | 999 (17.0%) |
| 3 or more Vehicles | 1,816 (21.3%) | 121 (2.1%) |
| Total | 8,520 (100.0%) | 5,892 (100.0%) |
Real Estate & Mortgages in Calumet City
Real Estate and Mortgage Overview in Calumet City
| Characteristic | Without Mortgage | With Mortgage |
| Housing Units | 3,459 | 5,061 |
| Median Property Value | $110,700 | $136,000 |
| Median Household Income | $59,580 | $614 |
| Monthly Housing Costs | $640 | $122 |
| Real Estate Taxes | $3,641 | $375 |
Property Value by Mortgage Status in Calumet City
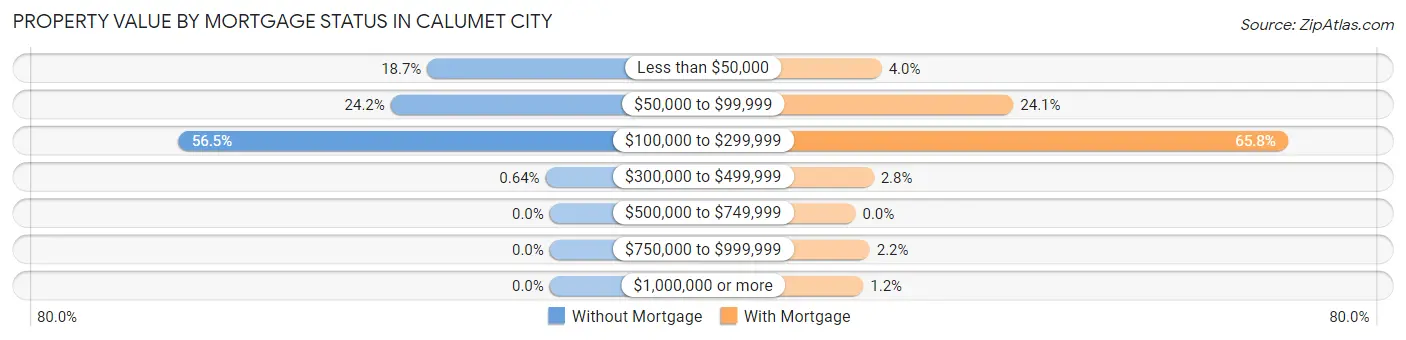
| Property Value | Without Mortgage | With Mortgage |
| Less than $50,000 | 645 (18.6%) | 202 (4.0%) |
| $50,000 to $99,999 | 838 (24.2%) | 1,217 (24.0%) |
| $100,000 to $299,999 | 1,954 (56.5%) | 3,332 (65.8%) |
| $300,000 to $499,999 | 22 (0.6%) | 140 (2.8%) |
| $500,000 to $749,999 | 0 (0.0%) | 0 (0.0%) |
| $750,000 to $999,999 | 0 (0.0%) | 110 (2.2%) |
| $1,000,000 or more | 0 (0.0%) | 60 (1.2%) |
| Total | 3,459 (100.0%) | 5,061 (100.0%) |
Household Income by Mortgage Status in Calumet City
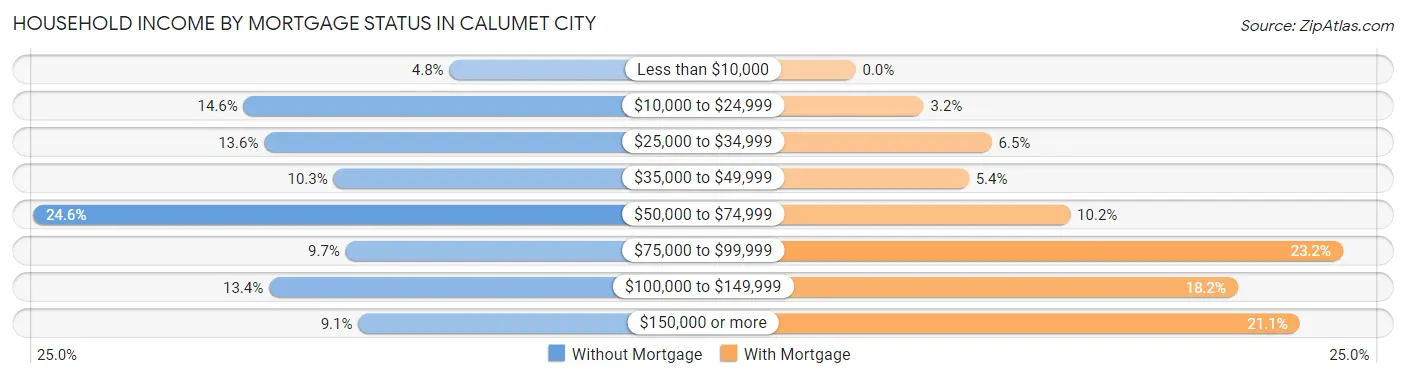
| Household Income | Without Mortgage | With Mortgage |
| Less than $10,000 | 165 (4.8%) | 0 (0.0%) |
| $10,000 to $24,999 | 504 (14.6%) | 164 (3.2%) |
| $25,000 to $34,999 | 470 (13.6%) | 328 (6.5%) |
| $35,000 to $49,999 | 356 (10.3%) | 273 (5.4%) |
| $50,000 to $74,999 | 851 (24.6%) | 517 (10.2%) |
| $75,000 to $99,999 | 336 (9.7%) | 1,174 (23.2%) |
| $100,000 to $149,999 | 462 (13.4%) | 921 (18.2%) |
| $150,000 or more | 315 (9.1%) | 1,070 (21.1%) |
| Total | 3,459 (100.0%) | 5,061 (100.0%) |
Property Value to Household Income Ratio in Calumet City
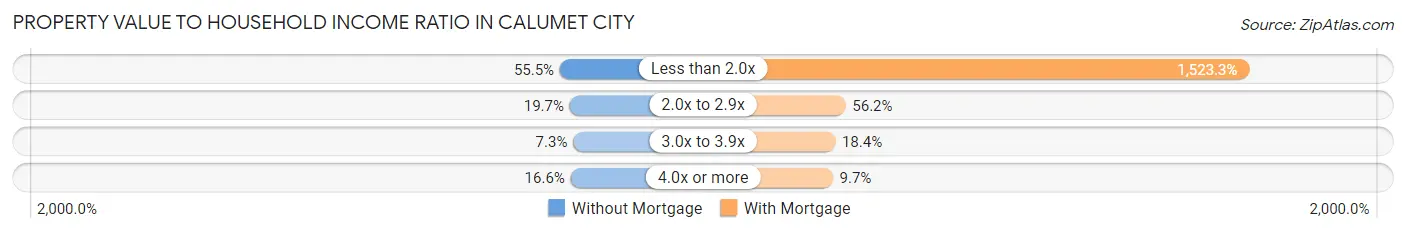
| Value-to-Income Ratio | Without Mortgage | With Mortgage |
| Less than 2.0x | 1,918 (55.4%) | 77,093 (1,523.3%) |
| 2.0x to 2.9x | 681 (19.7%) | 2,842 (56.1%) |
| 3.0x to 3.9x | 251 (7.3%) | 932 (18.4%) |
| 4.0x or more | 575 (16.6%) | 492 (9.7%) |
| Total | 3,459 (100.0%) | 5,061 (100.0%) |
Real Estate Taxes by Mortgage Status in Calumet City
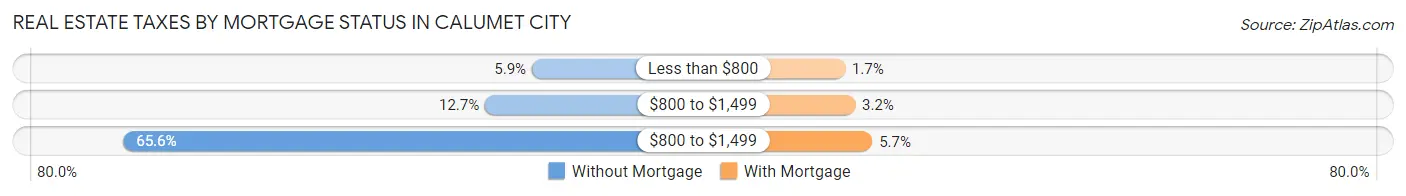
| Property Taxes | Without Mortgage | With Mortgage |
| Less than $800 | 203 (5.9%) | 88 (1.7%) |
| $800 to $1,499 | 440 (12.7%) | 163 (3.2%) |
| $800 to $1,499 | 2,268 (65.6%) | 290 (5.7%) |
| Total | 3,459 (100.0%) | 5,061 (100.0%) |
Health & Disability in Calumet City
Health Insurance Coverage by Age in Calumet City
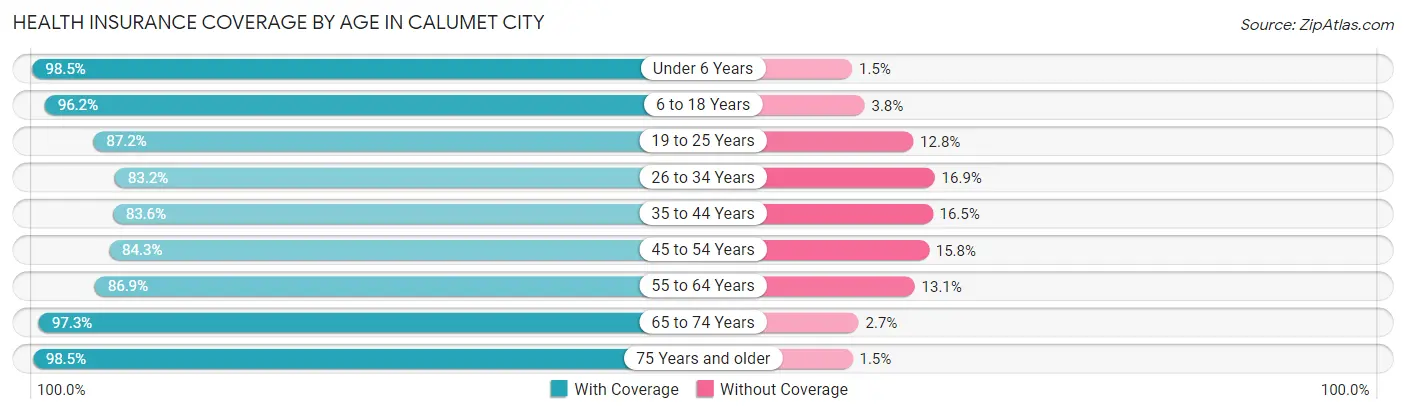
| Age Bracket | With Coverage | Without Coverage |
| Under 6 Years | 2,698 (98.5%) | 40 (1.5%) |
| 6 to 18 Years | 6,246 (96.2%) | 245 (3.8%) |
| 19 to 25 Years | 2,336 (87.2%) | 344 (12.8%) |
| 26 to 34 Years | 4,007 (83.2%) | 812 (16.9%) |
| 35 to 44 Years | 3,775 (83.6%) | 743 (16.5%) |
| 45 to 54 Years | 3,991 (84.3%) | 746 (15.8%) |
| 55 to 64 Years | 4,181 (86.9%) | 631 (13.1%) |
| 65 to 74 Years | 2,948 (97.3%) | 81 (2.7%) |
| 75 Years and older | 1,855 (98.5%) | 29 (1.5%) |
| Total | 32,037 (89.7%) | 3,671 (10.3%) |
Health Insurance Coverage by Citizenship Status in Calumet City
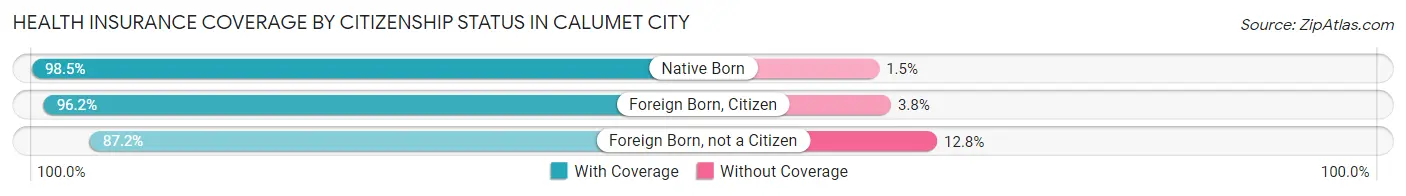
| Citizenship Status | With Coverage | Without Coverage |
| Native Born | 2,698 (98.5%) | 40 (1.5%) |
| Foreign Born, Citizen | 6,246 (96.2%) | 245 (3.8%) |
| Foreign Born, not a Citizen | 2,336 (87.2%) | 344 (12.8%) |
Health Insurance Coverage by Household Income in Calumet City
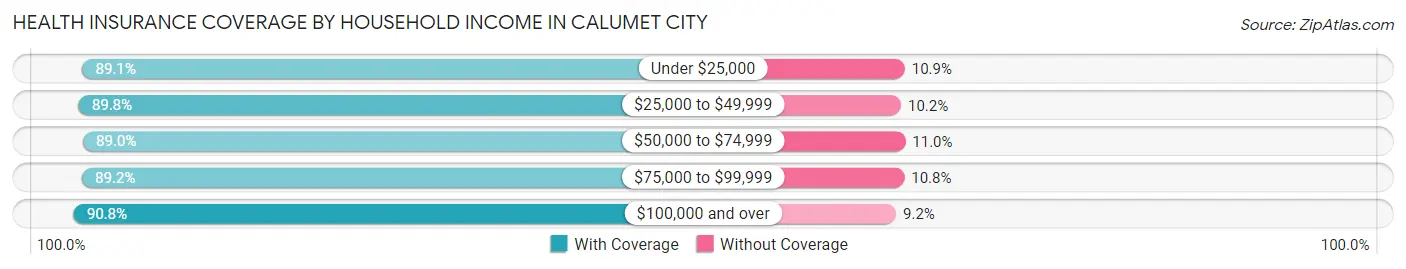
| Household Income | With Coverage | Without Coverage |
| Under $25,000 | 6,573 (89.1%) | 802 (10.9%) |
| $25,000 to $49,999 | 6,085 (89.8%) | 689 (10.2%) |
| $50,000 to $74,999 | 5,688 (89.0%) | 701 (11.0%) |
| $75,000 to $99,999 | 4,607 (89.2%) | 556 (10.8%) |
| $100,000 and over | 9,055 (90.8%) | 921 (9.2%) |
Public vs Private Health Insurance Coverage by Age in Calumet City
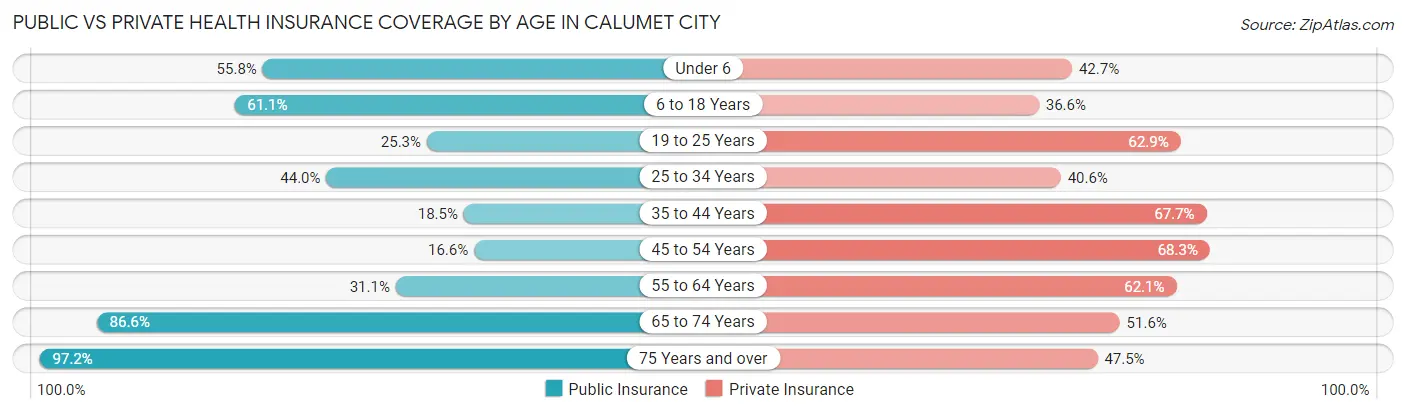
| Age Bracket | Public Insurance | Private Insurance |
| Under 6 | 1,528 (55.8%) | 1,170 (42.7%) |
| 6 to 18 Years | 3,964 (61.1%) | 2,373 (36.6%) |
| 19 to 25 Years | 679 (25.3%) | 1,685 (62.9%) |
| 25 to 34 Years | 2,120 (44.0%) | 1,958 (40.6%) |
| 35 to 44 Years | 835 (18.5%) | 3,058 (67.7%) |
| 45 to 54 Years | 785 (16.6%) | 3,235 (68.3%) |
| 55 to 64 Years | 1,497 (31.1%) | 2,988 (62.1%) |
| 65 to 74 Years | 2,624 (86.6%) | 1,562 (51.6%) |
| 75 Years and over | 1,832 (97.2%) | 894 (47.4%) |
| Total | 15,864 (44.4%) | 18,923 (53.0%) |
Disability Status by Sex by Age in Calumet City
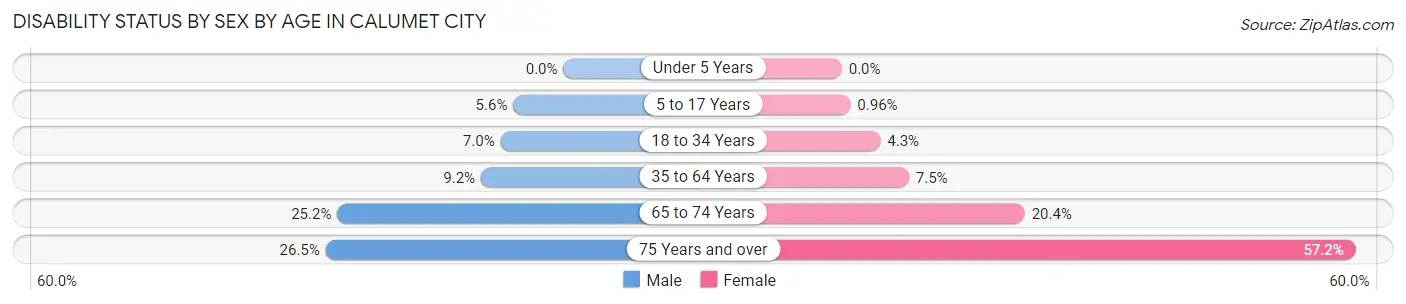
| Age Bracket | Male | Female |
| Under 5 Years | 0 (0.0%) | 0 (0.0%) |
| 5 to 17 Years | 198 (5.6%) | 29 (1.0%) |
| 18 to 34 Years | 314 (7.0%) | 153 (4.3%) |
| 35 to 64 Years | 555 (9.2%) | 599 (7.5%) |
| 65 to 74 Years | 314 (25.2%) | 363 (20.4%) |
| 75 Years and over | 112 (26.5%) | 836 (57.2%) |
Disability Class by Sex by Age in Calumet City
Disability Class: Hearing Difficulty
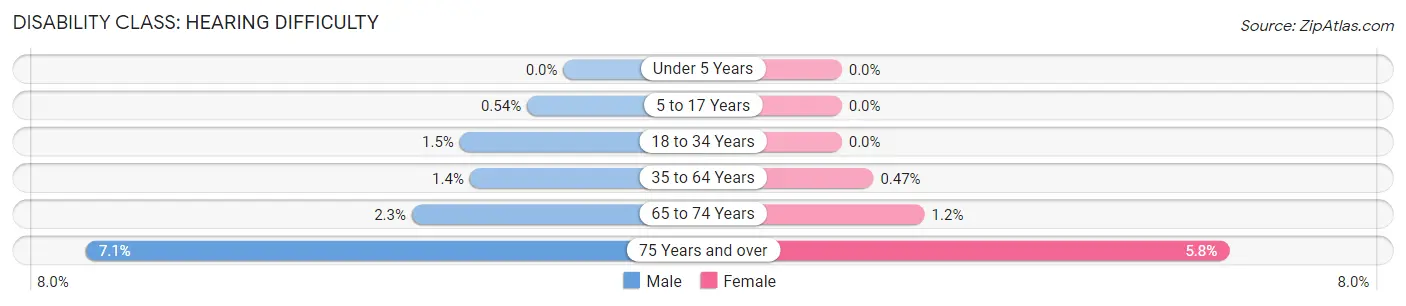
| Age Bracket | Male | Female |
| Under 5 Years | 0 (0.0%) | 0 (0.0%) |
| 5 to 17 Years | 19 (0.5%) | 0 (0.0%) |
| 18 to 34 Years | 69 (1.5%) | 0 (0.0%) |
| 35 to 64 Years | 84 (1.4%) | 38 (0.5%) |
| 65 to 74 Years | 28 (2.2%) | 22 (1.2%) |
| 75 Years and over | 30 (7.1%) | 84 (5.8%) |
Disability Class: Vision Difficulty
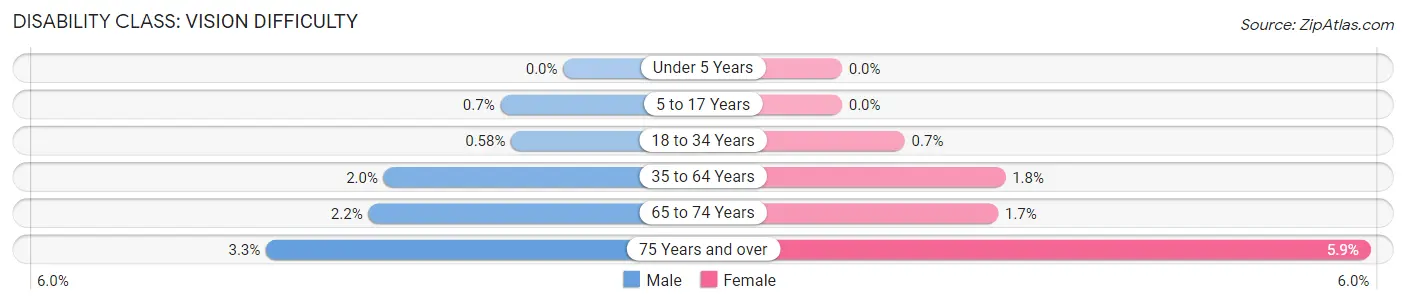
| Age Bracket | Male | Female |
| Under 5 Years | 0 (0.0%) | 0 (0.0%) |
| 5 to 17 Years | 25 (0.7%) | 0 (0.0%) |
| 18 to 34 Years | 26 (0.6%) | 25 (0.7%) |
| 35 to 64 Years | 121 (2.0%) | 146 (1.8%) |
| 65 to 74 Years | 27 (2.2%) | 31 (1.7%) |
| 75 Years and over | 14 (3.3%) | 86 (5.9%) |
Disability Class: Cognitive Difficulty
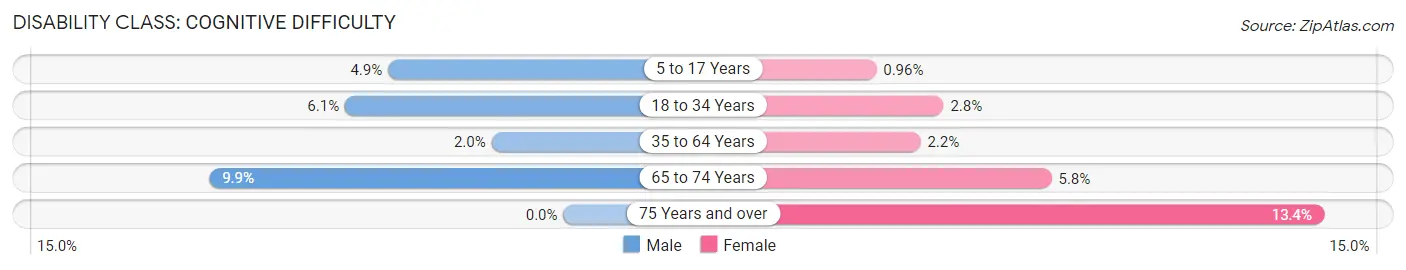
| Age Bracket | Male | Female |
| 5 to 17 Years | 173 (4.9%) | 29 (1.0%) |
| 18 to 34 Years | 273 (6.1%) | 101 (2.8%) |
| 35 to 64 Years | 121 (2.0%) | 176 (2.2%) |
| 65 to 74 Years | 123 (9.9%) | 104 (5.8%) |
| 75 Years and over | 0 (0.0%) | 196 (13.4%) |
Disability Class: Ambulatory Difficulty
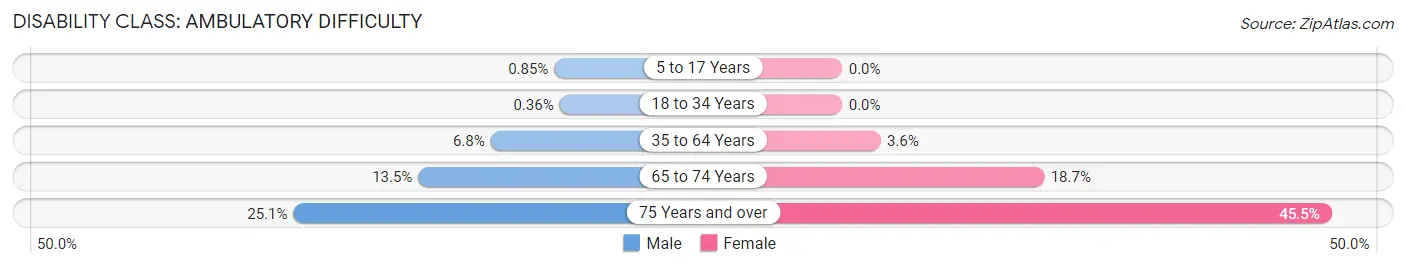
| Age Bracket | Male | Female |
| 5 to 17 Years | 30 (0.9%) | 0 (0.0%) |
| 18 to 34 Years | 16 (0.4%) | 0 (0.0%) |
| 35 to 64 Years | 408 (6.8%) | 285 (3.5%) |
| 65 to 74 Years | 168 (13.5%) | 334 (18.7%) |
| 75 Years and over | 106 (25.1%) | 664 (45.5%) |
Disability Class: Self-Care Difficulty
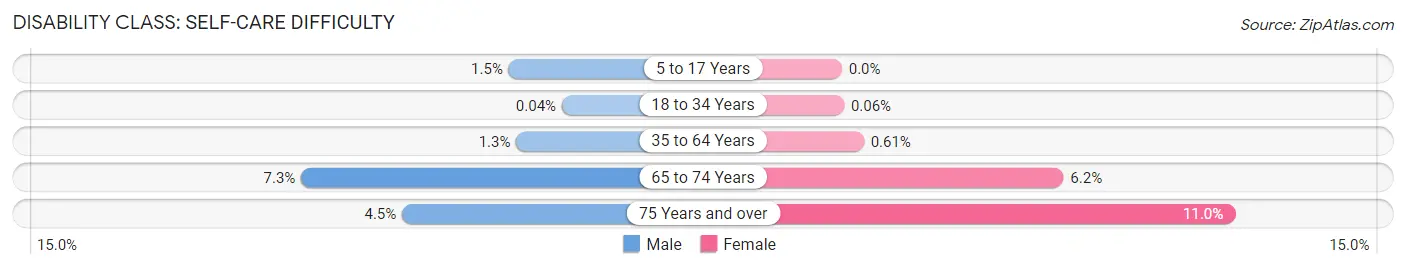
| Age Bracket | Male | Female |
| 5 to 17 Years | 54 (1.5%) | 0 (0.0%) |
| 18 to 34 Years | 2 (0.0%) | 2 (0.1%) |
| 35 to 64 Years | 79 (1.3%) | 49 (0.6%) |
| 65 to 74 Years | 91 (7.3%) | 110 (6.2%) |
| 75 Years and over | 19 (4.5%) | 160 (11.0%) |
Technology Access in Calumet City
Computing Device Access in Calumet City
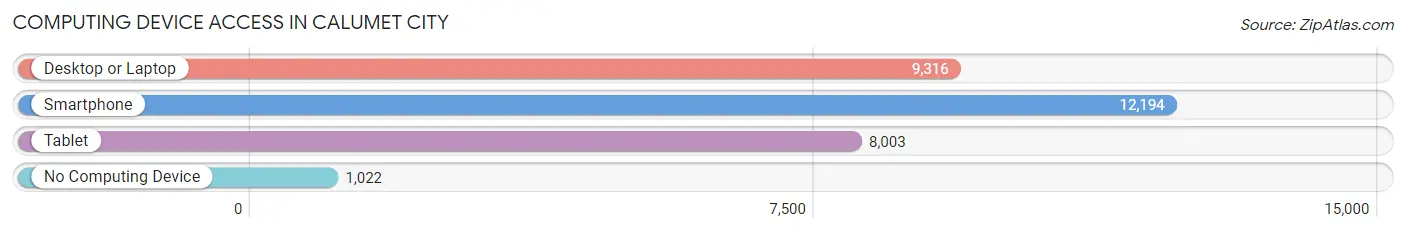
| Device Type | # Households | % Households |
| Desktop or Laptop | 9,316 | 64.6% |
| Smartphone | 12,194 | 84.6% |
| Tablet | 8,003 | 55.5% |
| No Computing Device | 1,022 | 7.1% |
| Total | 14,412 | 100.0% |
Internet Access in Calumet City
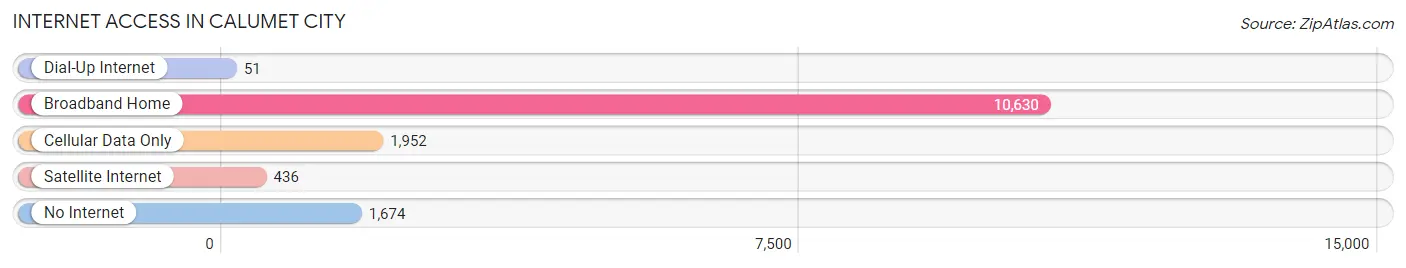
| Internet Type | # Households | % Households |
| Dial-Up Internet | 51 | 0.4% |
| Broadband Home | 10,630 | 73.8% |
| Cellular Data Only | 1,952 | 13.5% |
| Satellite Internet | 436 | 3.0% |
| No Internet | 1,674 | 11.6% |
| Total | 14,412 | 100.0% |
Calumet City Summary
Calumet City, Illinois is a city located in Cook County, Illinois, United States. It is a suburb of Chicago, located on the southern edge of the city. The population was 37,042 at the 2010 census, a decline from the 2000 census population of 37,546.
History
Calumet City was originally known as West Hammond, and was incorporated as a village in 1893. The name was changed to Calumet City in 1924. The city was named after the nearby Calumet River, which was named by French explorers in the 17th century. The river was named for the Native American word for “peaceful home”.
The city was home to a large steel mill, the U.S. Steel South Works, which opened in 1882 and closed in 1992. The mill was the largest employer in the city for many years, and was a major contributor to the city’s economy.
Geography
Calumet City is located at 41°36′45″N 87°32′30″W (41.612500, -87.541667). According to the 2010 census, Calumet City has a total area of 5.9 square miles (15.3 km2), of which 5.8 square miles (15.1 km2) is land and 0.1 square miles (0.2 km2) is water.
The city is located on the southern edge of Chicago, and is bordered by the cities of Hammond, Indiana to the east, Lansing, Illinois to the south, and Burnham, Illinois to the west.
Economy
Calumet City’s economy is largely based on manufacturing and retail. The city is home to several large manufacturing plants, including the U.S. Steel South Works, which closed in 1992. The city is also home to several large retail stores, including Walmart, Target, and Kohl’s.
The city also has a large service sector, with many restaurants, hotels, and other businesses. The city is also home to several large medical centers, including the University of Chicago Medical Center and the Advocate South Suburban Hospital.
Demographics
As of the 2010 census, there were 37,042 people, 14,845 households, and 9,717 families residing in the city. The population density was 6,346.2 people per square mile (2,450.2/km2). There were 15,845 housing units at an average density of 2,717.3 per square mile (1,051.2/km2). The racial makeup of the city was 57.2% White, 28.2% African American, 0.4% Native American, 0.7% Asian, 0.1% Pacific Islander, 10.2% from other races, and 3.2% from two or more races. Hispanic or Latino of any race were 24.2% of the population.
There were 14,845 households, out of which 32.2% had children under the age of 18 living with them, 39.2% were married couples living together, 19.2% had a female householder with no husband present, and 34.2% were non-families. 28.3% of all households were made up of individuals, and 10.2% had someone living alone who was 65 years of age or older. The average household size was 2.50 and the average family size was 3.09.
In the city, the population was spread out, with 25.7% under the age of 18, 9.2% from 18 to 24, 30.2% from 25 to 44, 21.7% from 45 to 64, and 13.2% who were 65 years of age or older. The median age was 35 years. For every 100 females, there were 93.2 males. For every 100 females age 18 and over, there were 89.3 males.
The median income for a household in the city was $41,945, and the median income for a family was $50,945. Males had a median income of $37,945 versus $30,945 for females. The per capita income for the city was $20,945. About 9.2% of families and 11.7% of the population were below the poverty line, including 16.2% of those under age 18 and 8.2% of those age 65 or over.
Common Questions
What is Per Capita Income in Calumet City?
Per Capita income in Calumet City is $28,423.
What is the Median Family Income in Calumet City?
Median Family Income in Calumet City is $66,003.
What is the Median Household income in Calumet City?
Median Household Income in Calumet City is $56,727.
What is Income or Wage Gap in Calumet City?
Income or Wage Gap in Calumet City is 3.7%.
Women in Calumet City earn 96.3 cents for every dollar earned by a man.
What is Family Income Deficit in Calumet City?
Family Income Deficit in Calumet City is $11,170.
Families that are below poverty line in Calumet City earn $11,170 less on average than the poverty threshold level.
What is Inequality or Gini Index in Calumet City?
Inequality or Gini Index in Calumet City is 0.44.
What is the Total Population of Calumet City?
Total Population of Calumet City is 35,708.
What is the Total Male Population of Calumet City?
Total Male Population of Calumet City is 16,926.
What is the Total Female Population of Calumet City?
Total Female Population of Calumet City is 18,782.
What is the Ratio of Males per 100 Females in Calumet City?
There are 90.12 Males per 100 Females in Calumet City.
What is the Ratio of Females per 100 Males in Calumet City?
There are 110.97 Females per 100 Males in Calumet City.
What is the Median Population Age in Calumet City?
Median Population Age in Calumet City is 37.6 Years.
What is the Average Family Size in Calumet City
Average Family Size in Calumet City is 3.3 People.
What is the Average Household Size in Calumet City
Average Household Size in Calumet City is 2.5 People.
How Large is the Labor Force in Calumet City?
There are 17,957 People in the Labor Forcein in Calumet City.
What is the Percentage of People in the Labor Force in Calumet City?
64.2% of People are in the Labor Force in Calumet City.
What is the Unemployment Rate in Calumet City?
Unemployment Rate in Calumet City is 9.1%.