Cities with the Lowest Female Poverty Level in Illinois
RELATED REPORTS & OPTIONS
Lowest Poverty | Female
Illinois
Compare Cities
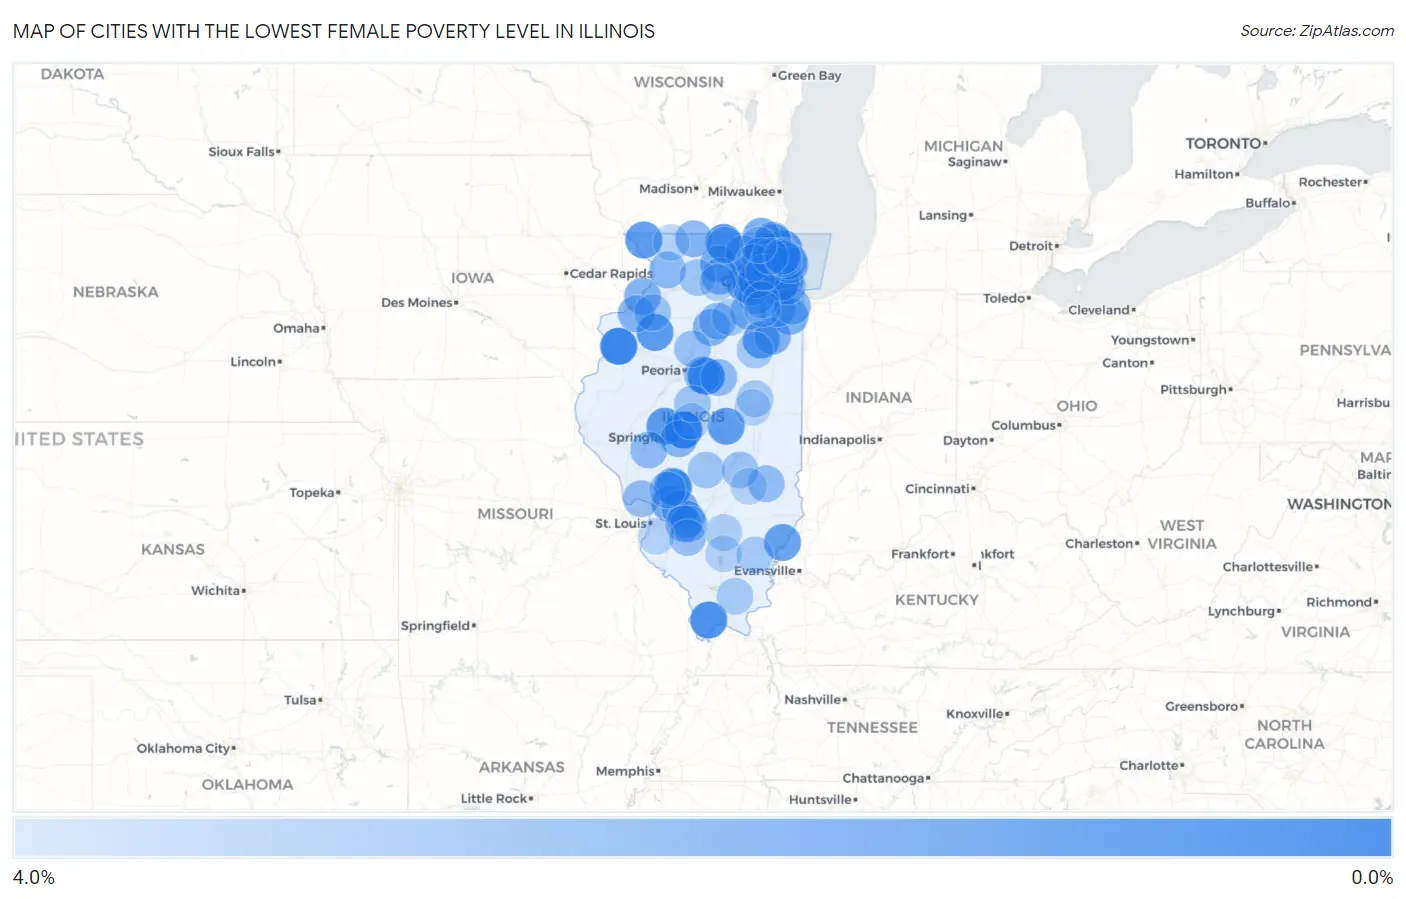
Map of Cities with the Lowest Female Poverty Level in Illinois
4.0%
0.0%
Cities with the Lowest Female Poverty Level in Illinois
| City | Female Poverty | vs State | vs National | |
| 1. | Sherman | 0.42% | 12.9%(-12.5)#1 | 13.7%(-13.3)#53 |
| 2. | Little York | 0.50% | 12.9%(-12.4)#2 | 13.7%(-13.2)#72 |
| 3. | Congerville | 0.62% | 12.9%(-12.3)#3 | 13.7%(-13.1)#111 |
| 4. | Ullin | 0.90% | 12.9%(-12.0)#4 | 13.7%(-12.8)#208 |
| 5. | Caledonia | 1.1% | 12.9%(-11.8)#5 | 13.7%(-12.6)#285 |
| 6. | Kaneville | 1.1% | 12.9%(-11.8)#6 | 13.7%(-12.6)#298 |
| 7. | Wayne | 1.1% | 12.9%(-11.8)#7 | 13.7%(-12.6)#322 |
| 8. | Tallula | 1.1% | 12.9%(-11.8)#8 | 13.7%(-12.5)#323 |
| 9. | Bishop Hill | 1.2% | 12.9%(-11.7)#9 | 13.7%(-12.5)#333 |
| 10. | Reddick | 1.3% | 12.9%(-11.7)#10 | 13.7%(-12.4)#376 |
| 11. | Oreana | 1.3% | 12.9%(-11.7)#11 | 13.7%(-12.4)#378 |
| 12. | The Galena Territory | 1.3% | 12.9%(-11.6)#12 | 13.7%(-12.4)#384 |
| 13. | Arbury Hills | 1.3% | 12.9%(-11.6)#13 | 13.7%(-12.4)#399 |
| 14. | Lake Bluff | 1.3% | 12.9%(-11.6)#14 | 13.7%(-12.4)#408 |
| 15. | East Gillespie | 1.3% | 12.9%(-11.6)#15 | 13.7%(-12.4)#423 |
| 16. | River Forest | 1.5% | 12.9%(-11.4)#16 | 13.7%(-12.2)#493 |
| 17. | Keensburg | 1.5% | 12.9%(-11.4)#17 | 13.7%(-12.2)#497 |
| 18. | Lily Lake | 1.5% | 12.9%(-11.4)#18 | 13.7%(-12.2)#506 |
| 19. | Port Barrington | 1.6% | 12.9%(-11.3)#19 | 13.7%(-12.1)#594 |
| 20. | Third Lake | 1.7% | 12.9%(-11.2)#20 | 13.7%(-12.0)#626 |
| 21. | Hawthorn Woods | 1.7% | 12.9%(-11.2)#21 | 13.7%(-12.0)#670 |
| 22. | Winfield | 1.7% | 12.9%(-11.2)#22 | 13.7%(-12.0)#672 |
| 23. | Hinsdale | 1.8% | 12.9%(-11.1)#23 | 13.7%(-11.9)#696 |
| 24. | Monroe Center | 1.8% | 12.9%(-11.1)#24 | 13.7%(-11.9)#700 |
| 25. | Spring Grove | 1.8% | 12.9%(-11.1)#25 | 13.7%(-11.9)#734 |
| 26. | Fox River Grove | 1.9% | 12.9%(-11.1)#26 | 13.7%(-11.8)#739 |
| 27. | Hamel | 1.9% | 12.9%(-11.0)#27 | 13.7%(-11.8)#778 |
| 28. | Grantfork | 1.9% | 12.9%(-11.0)#28 | 13.7%(-11.8)#781 |
| 29. | Monee | 1.9% | 12.9%(-11.0)#29 | 13.7%(-11.8)#782 |
| 30. | St Rose | 1.9% | 12.9%(-11.0)#30 | 13.7%(-11.8)#795 |
| 31. | Cordova | 1.9% | 12.9%(-11.0)#31 | 13.7%(-11.8)#813 |
| 32. | Eagarville | 2.0% | 12.9%(-10.9)#32 | 13.7%(-11.7)#840 |
| 33. | Union | 2.0% | 12.9%(-10.9)#33 | 13.7%(-11.7)#853 |
| 34. | Creston | 2.0% | 12.9%(-10.9)#34 | 13.7%(-11.7)#870 |
| 35. | South Barrington | 2.0% | 12.9%(-10.9)#35 | 13.7%(-11.7)#894 |
| 36. | Bonfield | 2.1% | 12.9%(-10.8)#36 | 13.7%(-11.6)#916 |
| 37. | Cedar Point | 2.1% | 12.9%(-10.8)#37 | 13.7%(-11.6)#930 |
| 38. | Coal Valley | 2.1% | 12.9%(-10.8)#38 | 13.7%(-11.6)#954 |
| 39. | Deer Park | 2.1% | 12.9%(-10.8)#39 | 13.7%(-11.6)#962 |
| 40. | Kildeer | 2.1% | 12.9%(-10.8)#40 | 13.7%(-11.6)#983 |
| 41. | Breese | 2.1% | 12.9%(-10.8)#41 | 13.7%(-11.6)#994 |
| 42. | Davis | 2.2% | 12.9%(-10.7)#42 | 13.7%(-11.5)#1,011 |
| 43. | New Lenox | 2.2% | 12.9%(-10.7)#43 | 13.7%(-11.5)#1,013 |
| 44. | Leland Grove | 2.2% | 12.9%(-10.7)#44 | 13.7%(-11.5)#1,017 |
| 45. | Lisbon | 2.2% | 12.9%(-10.7)#45 | 13.7%(-11.5)#1,037 |
| 46. | Flossmoor | 2.2% | 12.9%(-10.7)#46 | 13.7%(-11.5)#1,039 |
| 47. | Chadwick | 2.3% | 12.9%(-10.6)#47 | 13.7%(-11.4)#1,113 |
| 48. | Long Grove | 2.3% | 12.9%(-10.6)#48 | 13.7%(-11.4)#1,119 |
| 49. | Goodfield | 2.3% | 12.9%(-10.6)#49 | 13.7%(-11.4)#1,143 |
| 50. | Oswego | 2.4% | 12.9%(-10.5)#50 | 13.7%(-11.3)#1,187 |
| 51. | Woodson | 2.4% | 12.9%(-10.5)#51 | 13.7%(-11.3)#1,190 |
| 52. | Elsah | 2.4% | 12.9%(-10.5)#52 | 13.7%(-11.3)#1,197 |
| 53. | Aviston | 2.4% | 12.9%(-10.5)#53 | 13.7%(-11.3)#1,216 |
| 54. | Prestbury | 2.4% | 12.9%(-10.5)#54 | 13.7%(-11.3)#1,226 |
| 55. | North Utica | 2.4% | 12.9%(-10.5)#55 | 13.7%(-11.3)#1,240 |
| 56. | Hidalgo | 2.4% | 12.9%(-10.5)#56 | 13.7%(-11.3)#1,261 |
| 57. | Hudson | 2.5% | 12.9%(-10.5)#57 | 13.7%(-11.2)#1,273 |
| 58. | Winnetka | 2.5% | 12.9%(-10.4)#58 | 13.7%(-11.2)#1,316 |
| 59. | Forest View | 2.5% | 12.9%(-10.4)#59 | 13.7%(-11.2)#1,363 |
| 60. | Venetian Village | 2.6% | 12.9%(-10.3)#60 | 13.7%(-11.1)#1,376 |
| 61. | Okawville | 2.6% | 12.9%(-10.3)#61 | 13.7%(-11.1)#1,389 |
| 62. | Trout Valley | 2.6% | 12.9%(-10.3)#62 | 13.7%(-11.1)#1,398 |
| 63. | Timberlane | 2.6% | 12.9%(-10.3)#63 | 13.7%(-11.1)#1,419 |
| 64. | Inverness | 2.6% | 12.9%(-10.3)#64 | 13.7%(-11.1)#1,422 |
| 65. | Hopewell | 2.6% | 12.9%(-10.3)#65 | 13.7%(-11.1)#1,441 |
| 66. | Geneseo | 2.7% | 12.9%(-10.2)#66 | 13.7%(-11.0)#1,471 |
| 67. | Westchester | 2.7% | 12.9%(-10.2)#67 | 13.7%(-11.0)#1,472 |
| 68. | Geneva | 2.7% | 12.9%(-10.2)#68 | 13.7%(-11.0)#1,485 |
| 69. | Plum Valley | 2.7% | 12.9%(-10.2)#69 | 13.7%(-11.0)#1,500 |
| 70. | Dorchester | 2.7% | 12.9%(-10.2)#70 | 13.7%(-11.0)#1,503 |
| 71. | Ohlman | 2.7% | 12.9%(-10.2)#71 | 13.7%(-11.0)#1,508 |
| 72. | Plainfield | 2.7% | 12.9%(-10.2)#72 | 13.7%(-11.0)#1,514 |
| 73. | Gilberts | 2.7% | 12.9%(-10.2)#73 | 13.7%(-11.0)#1,517 |
| 74. | Riverwoods | 2.7% | 12.9%(-10.2)#74 | 13.7%(-11.0)#1,520 |
| 75. | Hartsburg | 2.7% | 12.9%(-10.2)#75 | 13.7%(-11.0)#1,521 |
| 76. | Strasburg | 2.7% | 12.9%(-10.2)#76 | 13.7%(-11.0)#1,528 |
| 77. | Lost Nation | 2.8% | 12.9%(-10.1)#77 | 13.7%(-10.9)#1,572 |
| 78. | Trivoli | 2.8% | 12.9%(-10.1)#78 | 13.7%(-10.9)#1,575 |
| 79. | Wilmette | 2.8% | 12.9%(-10.1)#79 | 13.7%(-10.9)#1,596 |
| 80. | Glencoe | 2.8% | 12.9%(-10.1)#80 | 13.7%(-10.9)#1,605 |
| 81. | Springerton | 2.9% | 12.9%(-10.1)#81 | 13.7%(-10.8)#1,665 |
| 82. | Emington | 2.9% | 12.9%(-10.1)#82 | 13.7%(-10.8)#1,666 |
| 83. | Dayton | 2.9% | 12.9%(-10.0)#83 | 13.7%(-10.8)#1,701 |
| 84. | Fisher | 2.9% | 12.9%(-9.99)#84 | 13.7%(-10.8)#1,726 |
| 85. | Westlake | 2.9% | 12.9%(-9.97)#85 | 13.7%(-10.8)#1,747 |
| 86. | Stonefort | 3.0% | 12.9%(-9.96)#86 | 13.7%(-10.7)#1,762 |
| 87. | Bartlett | 3.0% | 12.9%(-9.94)#87 | 13.7%(-10.7)#1,774 |
| 88. | Deerfield | 3.0% | 12.9%(-9.90)#88 | 13.7%(-10.7)#1,818 |
| 89. | Steward | 3.0% | 12.9%(-9.88)#89 | 13.7%(-10.7)#1,837 |
| 90. | Kell | 3.0% | 12.9%(-9.88)#90 | 13.7%(-10.7)#1,840 |
| 91. | Elkhart | 3.1% | 12.9%(-9.82)#91 | 13.7%(-10.6)#1,889 |
| 92. | Bannockburn | 3.1% | 12.9%(-9.81)#92 | 13.7%(-10.6)#1,897 |
| 93. | Bonnie | 3.1% | 12.9%(-9.78)#93 | 13.7%(-10.6)#1,918 |
| 94. | Millstadt | 3.2% | 12.9%(-9.74)#94 | 13.7%(-10.5)#1,968 |
| 95. | Teutopolis | 3.2% | 12.9%(-9.73)#95 | 13.7%(-10.5)#1,978 |
| 96. | Shorewood | 3.2% | 12.9%(-9.72)#96 | 13.7%(-10.5)#1,987 |
| 97. | Lena | 3.2% | 12.9%(-9.71)#97 | 13.7%(-10.5)#1,999 |
| 98. | Lake Zurich | 3.2% | 12.9%(-9.71)#98 | 13.7%(-10.5)#2,005 |
| 99. | Mchenry | 3.2% | 12.9%(-9.69)#99 | 13.7%(-10.5)#2,015 |
| 100. | Mahomet | 3.2% | 12.9%(-9.68)#100 | 13.7%(-10.5)#2,033 |
Common Questions
What are the Top 10 Cities with the Lowest Female Poverty Level in Illinois?
Top 10 Cities with the Lowest Female Poverty Level in Illinois are:
#1
0.42%
#2
0.50%
#3
0.62%
#4
0.90%
#5
1.1%
#6
1.1%
#7
1.1%
#8
1.1%
#9
1.2%
#10
1.3%
What city has the Lowest Female Poverty Level in Illinois?
Sherman has the Lowest Female Poverty Level in Illinois with 0.42%.
What is the Poverty Level Among Females in the State of Illinois?
Poverty Level Among Females in Illinois is 12.9%.
What is the Poverty Level Among Females in the United States?
Poverty Level Among Females in the United States is 13.7%.