Breese, IL Map & Demographics
Breese Map
Breese Overview
$56,830
PER CAPITA INCOME
$111,641
AVG FAMILY INCOME
$63,224
AVG HOUSEHOLD INCOME
27.3%
WAGE / INCOME GAP [ % ]
72.7¢/ $1
WAGE / INCOME GAP [ $ ]
0.57
INEQUALITY / GINI INDEX
4,376
TOTAL POPULATION
2,102
MALE POPULATION
2,274
FEMALE POPULATION
92.44
MALES / 100 FEMALES
108.18
FEMALES / 100 MALES
43.2
MEDIAN AGE
2.9
AVG FAMILY SIZE
2.2
AVG HOUSEHOLD SIZE
2,395
LABOR FORCE [ PEOPLE ]
65.7%
PERCENT IN LABOR FORCE
3.7%
UNEMPLOYMENT RATE
Breese Zip Codes
Breese Area Codes
Income in Breese
Income Overview in Breese
Per Capita Income in Breese is $56,830, while median incomes of families and households are $111,641 and $63,224 respectively.
| Characteristic | Number | Measure |
| Per Capita Income | 4,376 | $56,830 |
| Median Family Income | 1,135 | $111,641 |
| Mean Family Income | 1,135 | $147,863 |
| Median Household Income | 1,941 | $63,224 |
| Mean Household Income | 1,941 | $126,618 |
| Income Deficit | 1,135 | $0 |
| Wage / Income Gap (%) | 4,376 | 27.32% |
| Wage / Income Gap ($) | 4,376 | 72.68¢ per $1 |
| Gini / Inequality Index | 4,376 | 0.57 |
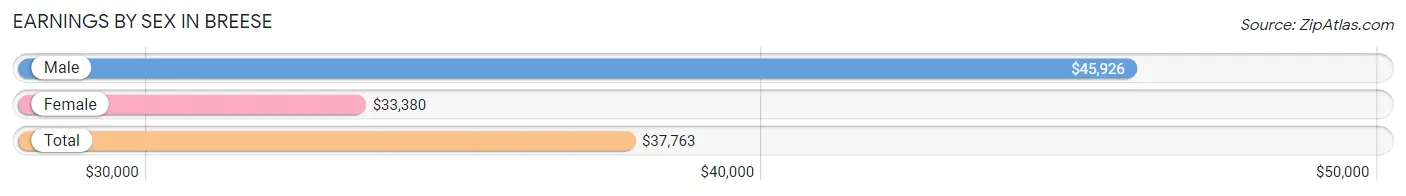
Earnings by Sex in Breese
Average Earnings in Breese are $37,763, $45,926 for men and $33,380 for women, a difference of 27.3%.
| Sex | Number | Average Earnings |
| Male | 1,236 (49.5%) | $45,926 |
| Female | 1,260 (50.5%) | $33,380 |
| Total | 2,496 (100.0%) | $37,763 |
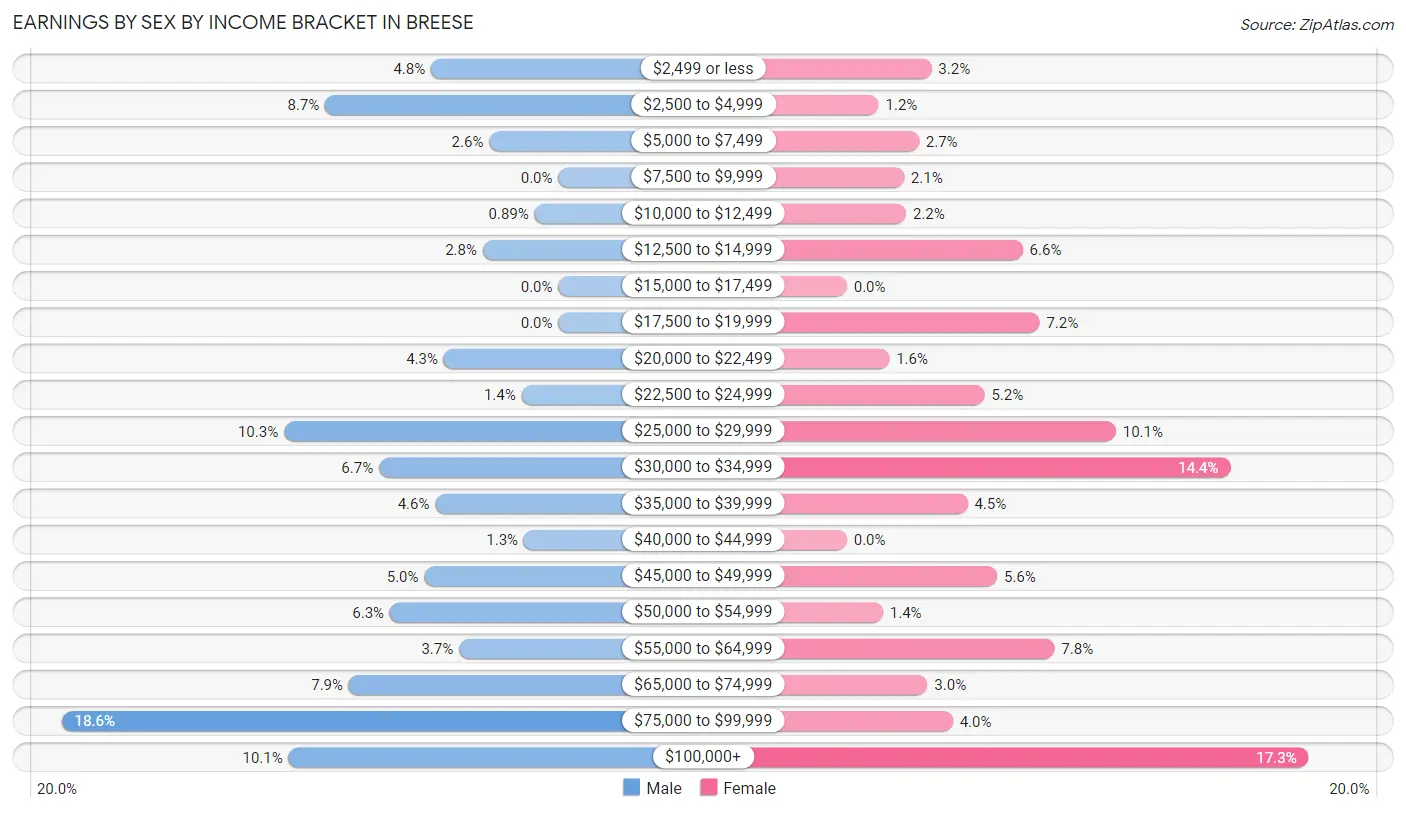
Earnings by Sex by Income Bracket in Breese
The most common earnings brackets in Breese are $75,000 to $99,999 for men (230 | 18.6%) and $100,000+ for women (218 | 17.3%).
| Income | Male | Female |
| $2,499 or less | 59 (4.8%) | 40 (3.2%) |
| $2,500 to $4,999 | 108 (8.7%) | 15 (1.2%) |
| $5,000 to $7,499 | 32 (2.6%) | 34 (2.7%) |
| $7,500 to $9,999 | 0 (0.0%) | 27 (2.1%) |
| $10,000 to $12,499 | 11 (0.9%) | 28 (2.2%) |
| $12,500 to $14,999 | 35 (2.8%) | 83 (6.6%) |
| $15,000 to $17,499 | 0 (0.0%) | 0 (0.0%) |
| $17,500 to $19,999 | 0 (0.0%) | 91 (7.2%) |
| $20,000 to $22,499 | 53 (4.3%) | 20 (1.6%) |
| $22,500 to $24,999 | 17 (1.4%) | 65 (5.2%) |
| $25,000 to $29,999 | 127 (10.3%) | 127 (10.1%) |
| $30,000 to $34,999 | 83 (6.7%) | 181 (14.4%) |
| $35,000 to $39,999 | 57 (4.6%) | 57 (4.5%) |
| $40,000 to $44,999 | 16 (1.3%) | 0 (0.0%) |
| $45,000 to $49,999 | 62 (5.0%) | 71 (5.6%) |
| $50,000 to $54,999 | 78 (6.3%) | 17 (1.3%) |
| $55,000 to $64,999 | 46 (3.7%) | 98 (7.8%) |
| $65,000 to $74,999 | 97 (7.9%) | 38 (3.0%) |
| $75,000 to $99,999 | 230 (18.6%) | 50 (4.0%) |
| $100,000+ | 125 (10.1%) | 218 (17.3%) |
| Total | 1,236 (100.0%) | 1,260 (100.0%) |
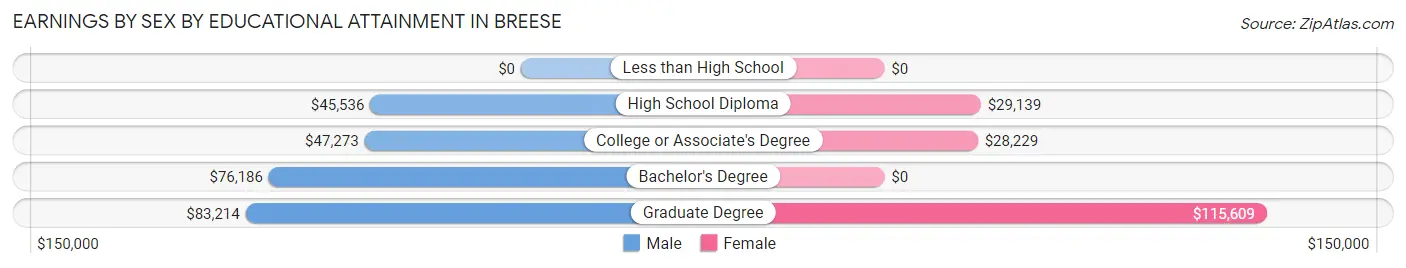
Earnings by Sex by Educational Attainment in Breese
Average earnings in Breese are $51,939 for men and $34,504 for women, a difference of 33.6%. Men with an educational attainment of graduate degree enjoy the highest average annual earnings of $83,214, while those with high school diploma education earn the least with $45,536. Women with an educational attainment of graduate degree earn the most with the average annual earnings of $115,609, while those with college or associate's degree education have the smallest earnings of $28,229.
| Educational Attainment | Male Income | Female Income |
| Less than High School | - | - |
| High School Diploma | $45,536 | $29,139 |
| College or Associate's Degree | $47,273 | $28,229 |
| Bachelor's Degree | $76,186 | $0 |
| Graduate Degree | $83,214 | $115,609 |
| Total | $51,939 | $34,504 |
Family Income in Breese
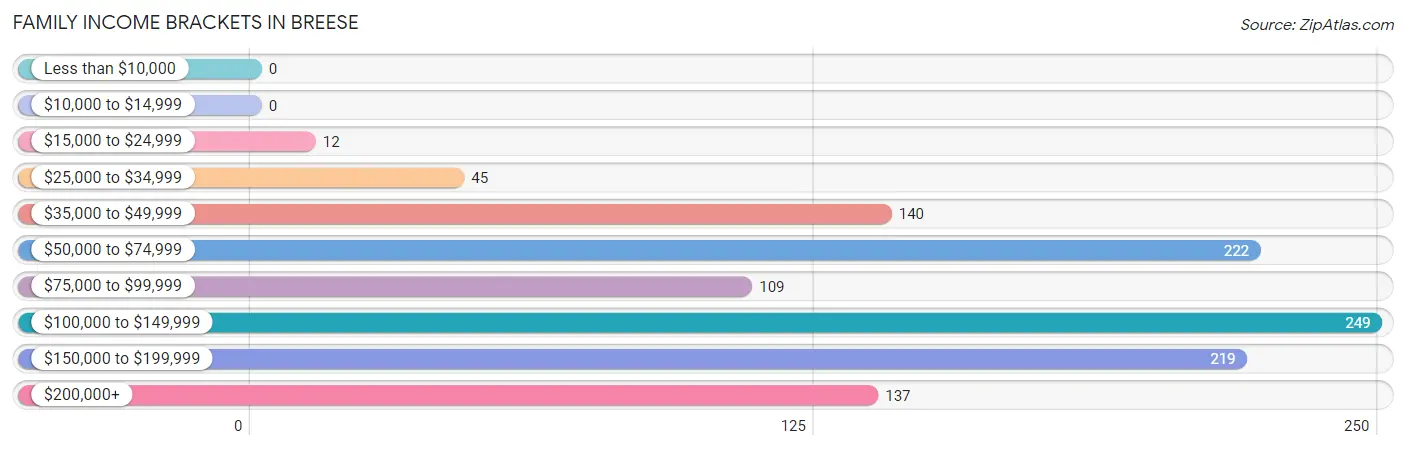
Family Income Brackets in Breese
According to the Breese family income data, there are 249 families falling into the $100,000 to $149,999 income range, which is the most common income bracket and makes up 21.9% of all families.
| Income Bracket | # Families | % Families |
| Less than $10,000 | 0 | 0.0% |
| $10,000 to $14,999 | 0 | 0.0% |
| $15,000 to $24,999 | 12 | 1.1% |
| $25,000 to $34,999 | 45 | 4.0% |
| $35,000 to $49,999 | 140 | 12.3% |
| $50,000 to $74,999 | 222 | 19.6% |
| $75,000 to $99,999 | 109 | 9.6% |
| $100,000 to $149,999 | 249 | 21.9% |
| $150,000 to $199,999 | 219 | 19.3% |
| $200,000+ | 137 | 12.1% |
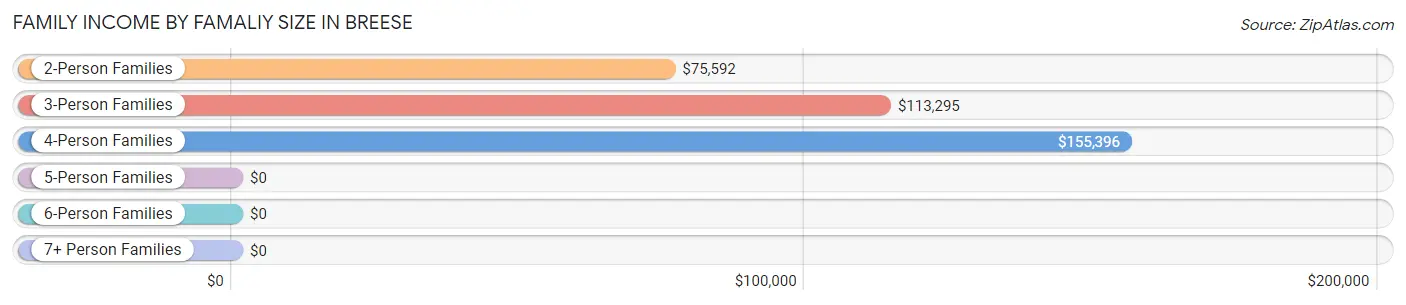
Family Income by Famaliy Size in Breese
4-person families (121 | 10.7%) account for the highest median family income in Breese with $155,396 per family, while 4-person families (121 | 10.7%) have the highest median income of $38,849 per family member.
| Income Bracket | # Families | Median Income |
| 2-Person Families | 683 (60.2%) | $75,592 |
| 3-Person Families | 173 (15.2%) | $113,295 |
| 4-Person Families | 121 (10.7%) | $155,396 |
| 5-Person Families | 129 (11.4%) | $0 |
| 6-Person Families | 17 (1.5%) | $0 |
| 7+ Person Families | 12 (1.1%) | $0 |
| Total | 1,135 (100.0%) | $111,641 |
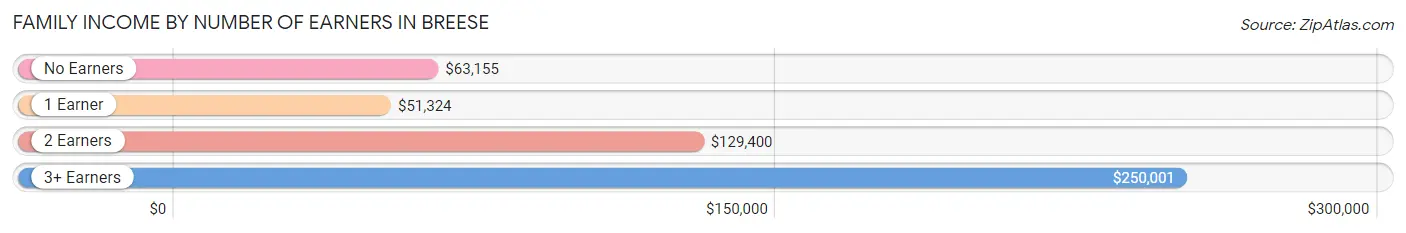
Family Income by Number of Earners in Breese
The median family income in Breese is $111,641, with families comprising 3+ earners (128) having the highest median family income of $250,001, while families with 1 earner (338) have the lowest median family income of $51,324, accounting for 11.3% and 29.8% of families, respectively.
| Number of Earners | # Families | Median Income |
| No Earners | 105 (9.2%) | $63,155 |
| 1 Earner | 338 (29.8%) | $51,324 |
| 2 Earners | 564 (49.7%) | $129,400 |
| 3+ Earners | 128 (11.3%) | $250,001 |
| Total | 1,135 (100.0%) | $111,641 |
Household Income in Breese
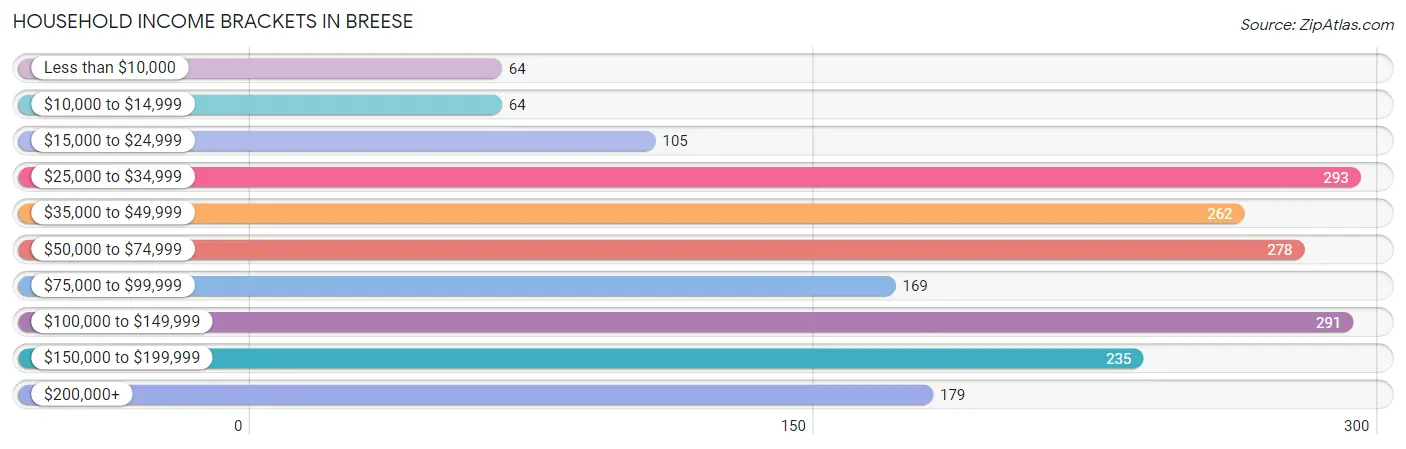
Household Income Brackets in Breese
With 293 households falling in the category, the $25,000 to $34,999 income range is the most frequent in Breese, accounting for 15.1% of all households. In contrast, only 64 households (3.3%) fall into the less than $10,000 income bracket, making it the least populous group.
| Income Bracket | # Households | % Households |
| Less than $10,000 | 64 | 3.3% |
| $10,000 to $14,999 | 64 | 3.3% |
| $15,000 to $24,999 | 105 | 5.4% |
| $25,000 to $34,999 | 293 | 15.1% |
| $35,000 to $49,999 | 262 | 13.5% |
| $50,000 to $74,999 | 278 | 14.3% |
| $75,000 to $99,999 | 169 | 8.7% |
| $100,000 to $149,999 | 291 | 15.0% |
| $150,000 to $199,999 | 235 | 12.1% |
| $200,000+ | 179 | 9.2% |
Household Income by Householder Age in Breese
The median household income in Breese is $63,224, with the highest median household income of $114,091 found in the 25 to 44 years age bracket for the primary householder. A total of 468 households (24.1%) fall into this category. Meanwhile, the 65+ years age bracket for the primary householder has the lowest median household income of $40,852, with 713 households (36.7%) in this group.
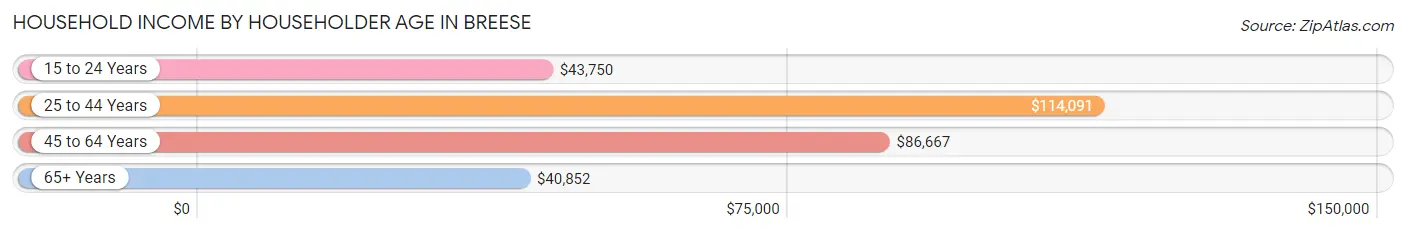
| Income Bracket | # Households | Median Income |
| 15 to 24 Years | 92 (4.7%) | $43,750 |
| 25 to 44 Years | 468 (24.1%) | $114,091 |
| 45 to 64 Years | 668 (34.4%) | $86,667 |
| 65+ Years | 713 (36.7%) | $40,852 |
| Total | 1,941 (100.0%) | $63,224 |
Poverty in Breese
Income Below Poverty by Sex and Age in Breese
With 6.9% poverty level for males and 2.1% for females among the residents of Breese, 18 to 24 year old males and 18 to 24 year old females are the most vulnerable to poverty, with 50 males (21.2%) and 19 females (9.3%) in their respective age groups living below the poverty level.
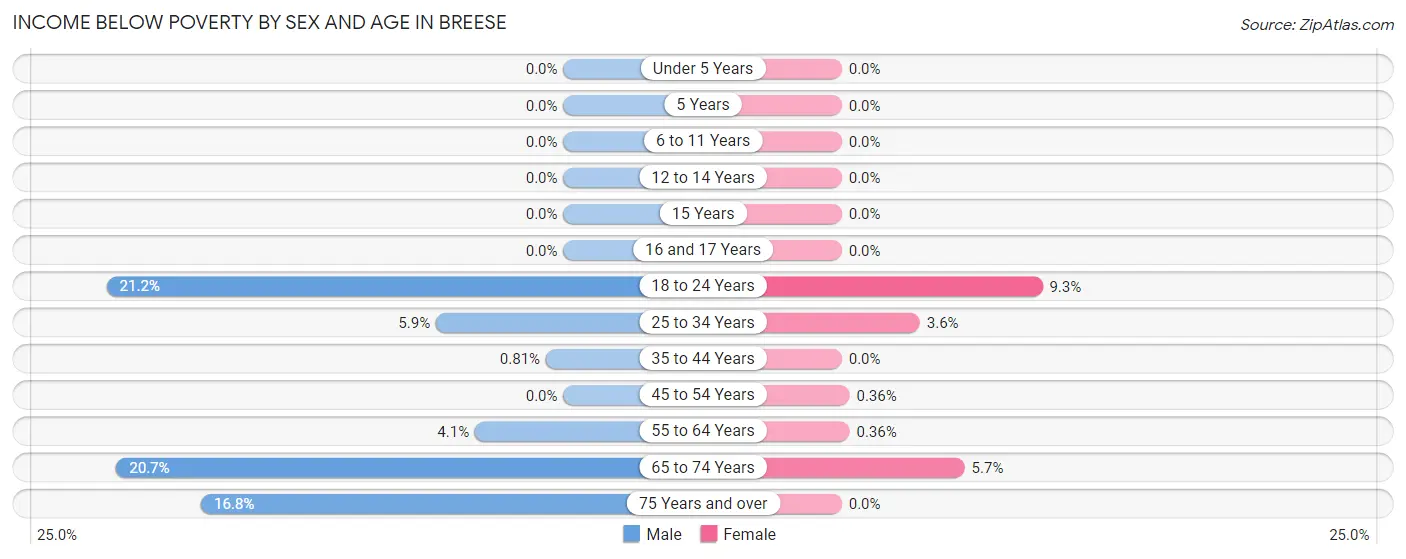
| Age Bracket | Male | Female |
| Under 5 Years | 0 (0.0%) | 0 (0.0%) |
| 5 Years | 0 (0.0%) | 0 (0.0%) |
| 6 to 11 Years | 0 (0.0%) | 0 (0.0%) |
| 12 to 14 Years | 0 (0.0%) | 0 (0.0%) |
| 15 Years | 0 (0.0%) | 0 (0.0%) |
| 16 and 17 Years | 0 (0.0%) | 0 (0.0%) |
| 18 to 24 Years | 50 (21.2%) | 19 (9.3%) |
| 25 to 34 Years | 12 (5.9%) | 11 (3.6%) |
| 35 to 44 Years | 2 (0.8%) | 0 (0.0%) |
| 45 to 54 Years | 0 (0.0%) | 1 (0.4%) |
| 55 to 64 Years | 12 (4.1%) | 1 (0.4%) |
| 65 to 74 Years | 45 (20.7%) | 15 (5.7%) |
| 75 Years and over | 20 (16.8%) | 0 (0.0%) |
| Total | 141 (6.9%) | 47 (2.1%) |
Income Above Poverty by Sex and Age in Breese
According to the poverty statistics in Breese, males aged under 5 years and females aged under 5 years are the age groups that are most secure financially, with 100.0% of males and 100.0% of females in these age groups living above the poverty line.
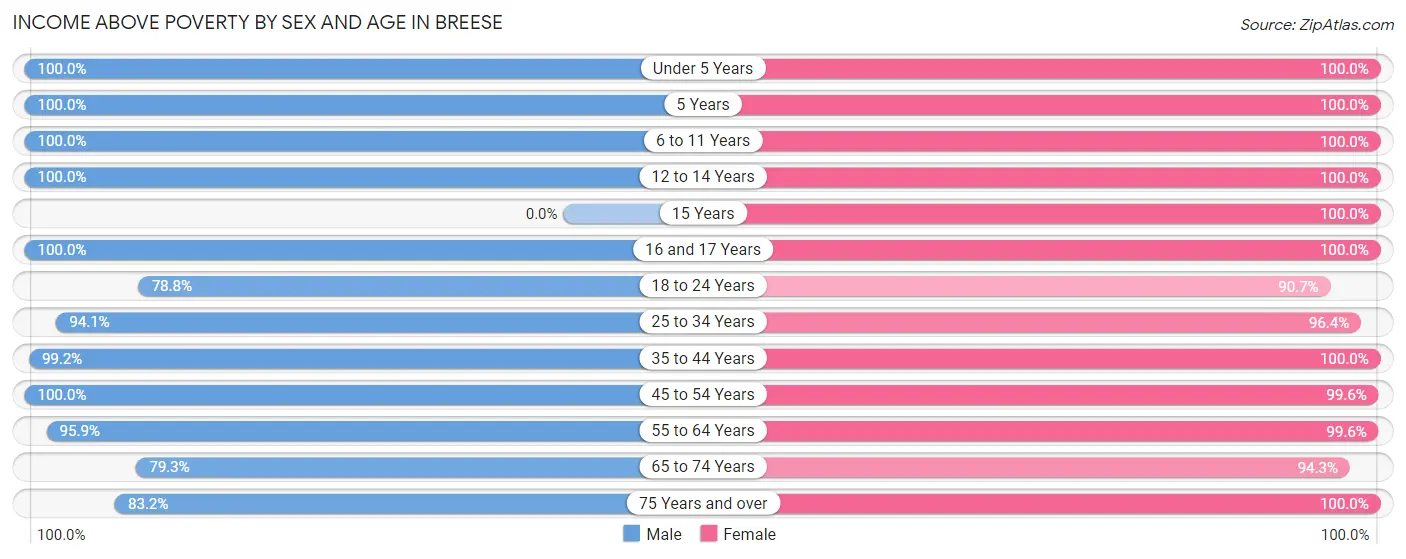
| Age Bracket | Male | Female |
| Under 5 Years | 192 (100.0%) | 135 (100.0%) |
| 5 Years | 37 (100.0%) | 8 (100.0%) |
| 6 to 11 Years | 104 (100.0%) | 89 (100.0%) |
| 12 to 14 Years | 55 (100.0%) | 13 (100.0%) |
| 15 Years | 0 (0.0%) | 16 (100.0%) |
| 16 and 17 Years | 82 (100.0%) | 19 (100.0%) |
| 18 to 24 Years | 186 (78.8%) | 185 (90.7%) |
| 25 to 34 Years | 191 (94.1%) | 293 (96.4%) |
| 35 to 44 Years | 246 (99.2%) | 283 (100.0%) |
| 45 to 54 Years | 264 (100.0%) | 275 (99.6%) |
| 55 to 64 Years | 281 (95.9%) | 279 (99.6%) |
| 65 to 74 Years | 172 (79.3%) | 248 (94.3%) |
| 75 Years and over | 99 (83.2%) | 301 (100.0%) |
| Total | 1,909 (93.1%) | 2,144 (97.9%) |
Income Below Poverty Among Married-Couple Families in Breese
The poverty statistics for married-couple families in Breese show that 1.4% or 13 of the total 915 families live below the poverty line. Families with no children have the highest poverty rate of 2.1%, comprising of 13 families. On the other hand, families with 1 or 2 children have the lowest poverty rate of 0.0%, which includes 0 families.
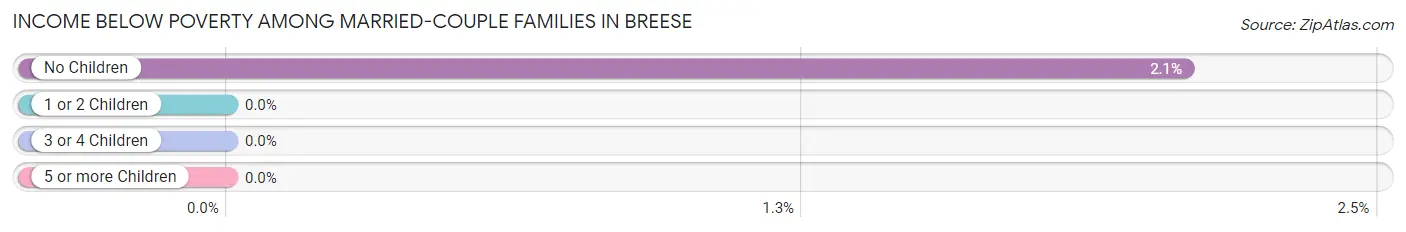
| Children | Above Poverty | Below Poverty |
| No Children | 612 (97.9%) | 13 (2.1%) |
| 1 or 2 Children | 193 (100.0%) | 0 (0.0%) |
| 3 or 4 Children | 85 (100.0%) | 0 (0.0%) |
| 5 or more Children | 12 (100.0%) | 0 (0.0%) |
| Total | 902 (98.6%) | 13 (1.4%) |
Income Below Poverty Among Single-Parent Households in Breese
| Children | Single Father | Single Mother |
| No Children | 0 (0.0%) | 0 (0.0%) |
| 1 or 2 Children | 0 (0.0%) | 0 (0.0%) |
| 3 or 4 Children | 0 (0.0%) | 0 (0.0%) |
| 5 or more Children | 0 (0.0%) | 0 (0.0%) |
| Total | 0 (0.0%) | 0 (0.0%) |
Income Below Poverty Among Married-Couple vs Single-Parent Households in Breese
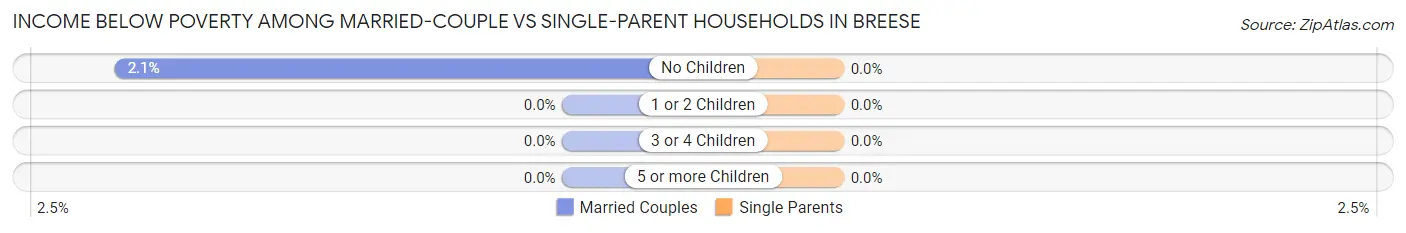
| Children | Married-Couple Families | Single-Parent Households |
| No Children | 13 (2.1%) | 0 (0.0%) |
| 1 or 2 Children | 0 (0.0%) | 0 (0.0%) |
| 3 or 4 Children | 0 (0.0%) | 0 (0.0%) |
| 5 or more Children | 0 (0.0%) | 0 (0.0%) |
| Total | 13 (1.4%) | 0 (0.0%) |
Race in Breese
The most populous races in Breese are White / Caucasian (4,152 | 94.9%), Hispanic or Latino (182 | 4.2%), and Some other Race (119 | 2.7%).
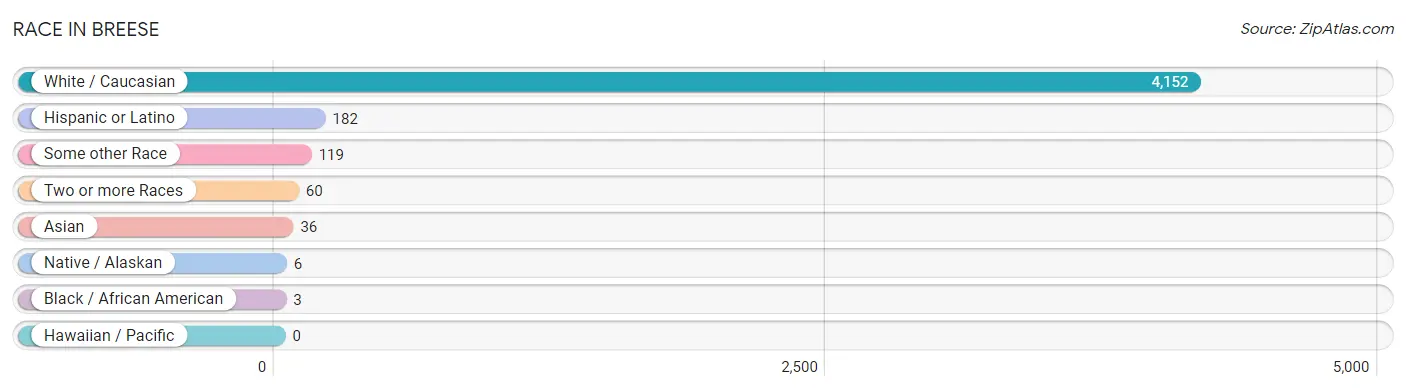
| Race | # Population | % Population |
| Asian | 36 | 0.8% |
| Black / African American | 3 | 0.1% |
| Hawaiian / Pacific | 0 | 0.0% |
| Hispanic or Latino | 182 | 4.2% |
| Native / Alaskan | 6 | 0.1% |
| White / Caucasian | 4,152 | 94.9% |
| Two or more Races | 60 | 1.4% |
| Some other Race | 119 | 2.7% |
| Total | 4,376 | 100.0% |
Ancestry in Breese
The most populous ancestries reported in Breese are German (2,654 | 60.7%), Irish (296 | 6.8%), American (274 | 6.3%), Dutch (236 | 5.4%), and English (175 | 4.0%), together accounting for 83.1% of all Breese residents.
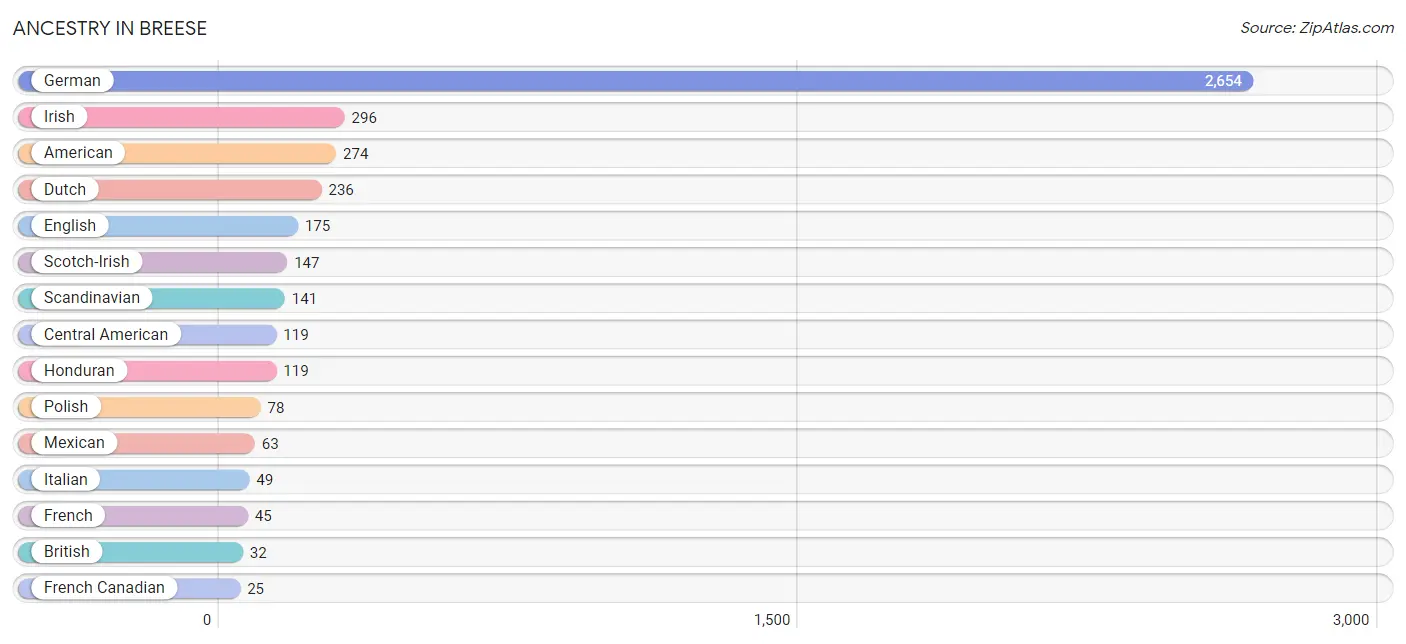
| Ancestry | # Population | % Population |
| American | 274 | 6.3% |
| Belgian | 16 | 0.4% |
| Bhutanese | 8 | 0.2% |
| British | 32 | 0.7% |
| Central American | 119 | 2.7% |
| Cherokee | 14 | 0.3% |
| Dutch | 236 | 5.4% |
| English | 175 | 4.0% |
| European | 18 | 0.4% |
| French | 45 | 1.0% |
| French Canadian | 25 | 0.6% |
| German | 2,654 | 60.7% |
| Honduran | 119 | 2.7% |
| Hungarian | 24 | 0.5% |
| Irish | 296 | 6.8% |
| Italian | 49 | 1.1% |
| Korean | 19 | 0.4% |
| Mexican | 63 | 1.4% |
| Pakistani | 24 | 0.5% |
| Polish | 78 | 1.8% |
| Scandinavian | 141 | 3.2% |
| Scotch-Irish | 147 | 3.4% |
| Scottish | 21 | 0.5% |
| Swedish | 16 | 0.4% |
| Ukrainian | 1 | 0.0% | View All 25 Rows |
Immigrants in Breese
The most numerous immigrant groups reported in Breese came from Central America (119 | 2.7%), Honduras (119 | 2.7%), Latin America (119 | 2.7%), Europe (37 | 0.9%), and Asia (36 | 0.8%), together accounting for 9.8% of all Breese residents.
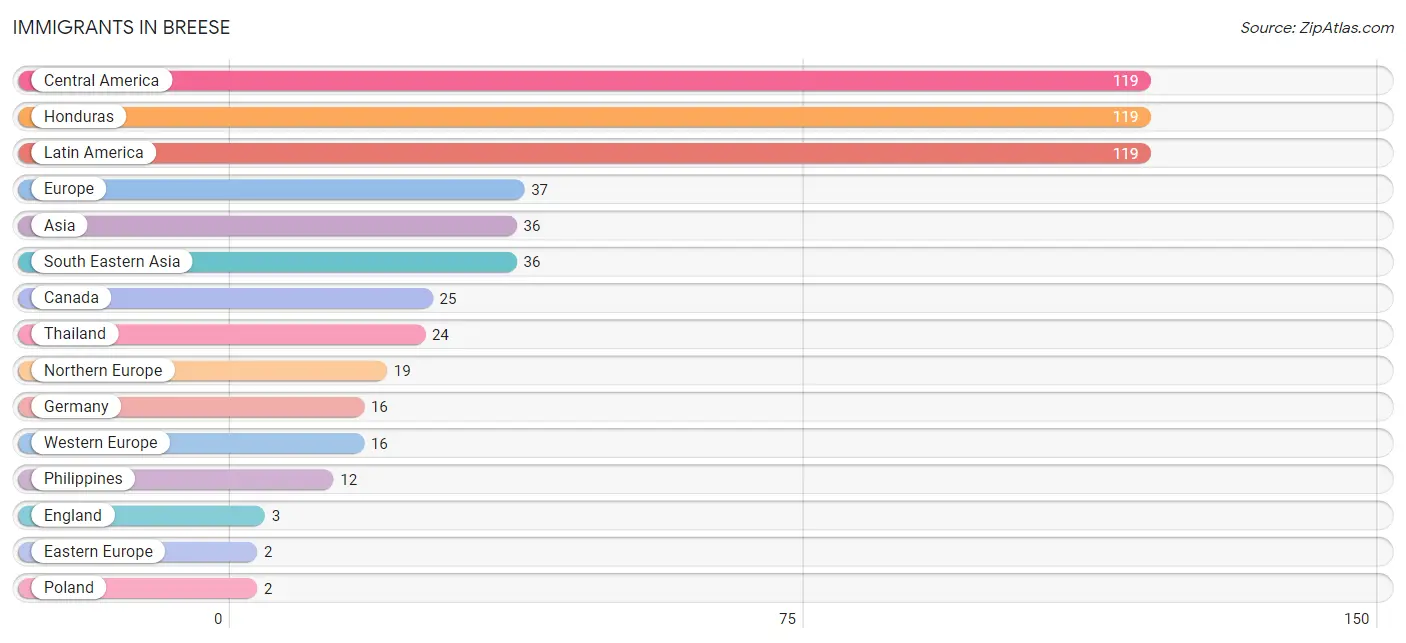
| Immigration Origin | # Population | % Population |
| Africa | 1 | 0.0% |
| Asia | 36 | 0.8% |
| Canada | 25 | 0.6% |
| Central America | 119 | 2.7% |
| Eastern Europe | 2 | 0.1% |
| England | 3 | 0.1% |
| Europe | 37 | 0.9% |
| Germany | 16 | 0.4% |
| Honduras | 119 | 2.7% |
| Latin America | 119 | 2.7% |
| Nigeria | 1 | 0.0% |
| Northern Europe | 19 | 0.4% |
| Philippines | 12 | 0.3% |
| Poland | 2 | 0.1% |
| South Eastern Asia | 36 | 0.8% |
| Thailand | 24 | 0.5% |
| Western Africa | 1 | 0.0% |
| Western Europe | 16 | 0.4% | View All 18 Rows |
Sex and Age in Breese
Sex and Age in Breese
The most populous age groups in Breese are 35 to 39 Years (220 | 10.5%) for men and 30 to 34 Years (195 | 8.6%) for women.
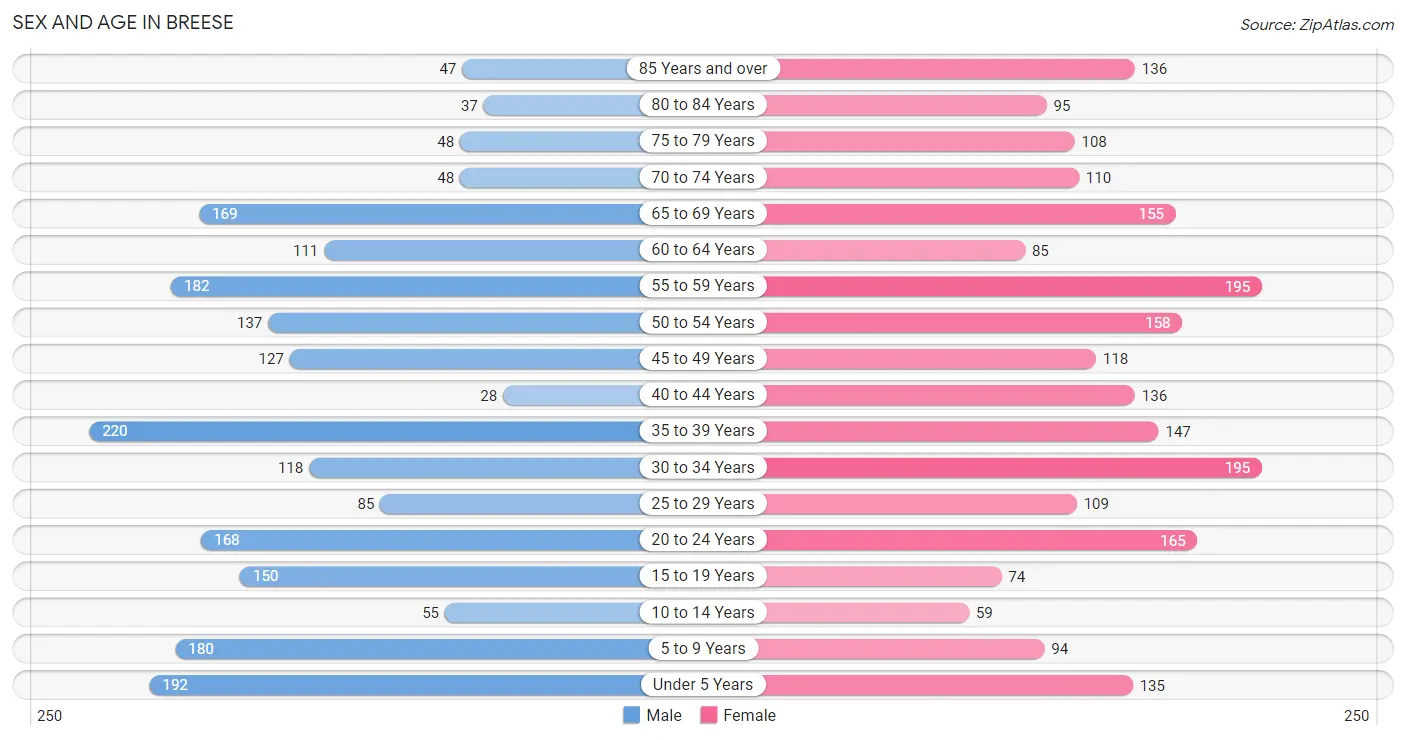
| Age Bracket | Male | Female |
| Under 5 Years | 192 (9.1%) | 135 (5.9%) |
| 5 to 9 Years | 180 (8.6%) | 94 (4.1%) |
| 10 to 14 Years | 55 (2.6%) | 59 (2.6%) |
| 15 to 19 Years | 150 (7.1%) | 74 (3.3%) |
| 20 to 24 Years | 168 (8.0%) | 165 (7.3%) |
| 25 to 29 Years | 85 (4.0%) | 109 (4.8%) |
| 30 to 34 Years | 118 (5.6%) | 195 (8.6%) |
| 35 to 39 Years | 220 (10.5%) | 147 (6.5%) |
| 40 to 44 Years | 28 (1.3%) | 136 (6.0%) |
| 45 to 49 Years | 127 (6.0%) | 118 (5.2%) |
| 50 to 54 Years | 137 (6.5%) | 158 (7.0%) |
| 55 to 59 Years | 182 (8.7%) | 195 (8.6%) |
| 60 to 64 Years | 111 (5.3%) | 85 (3.7%) |
| 65 to 69 Years | 169 (8.0%) | 155 (6.8%) |
| 70 to 74 Years | 48 (2.3%) | 110 (4.8%) |
| 75 to 79 Years | 48 (2.3%) | 108 (4.8%) |
| 80 to 84 Years | 37 (1.8%) | 95 (4.2%) |
| 85 Years and over | 47 (2.2%) | 136 (6.0%) |
| Total | 2,102 (100.0%) | 2,274 (100.0%) |
Families and Households in Breese
Median Family Size in Breese
The median family size in Breese is 2.86 persons per family, with single female/mother families (167 | 14.7%) accounting for the largest median family size of 2.95 persons per family. On the other hand, single male/father families (53 | 4.7%) represent the smallest median family size with 2.06 persons per family.
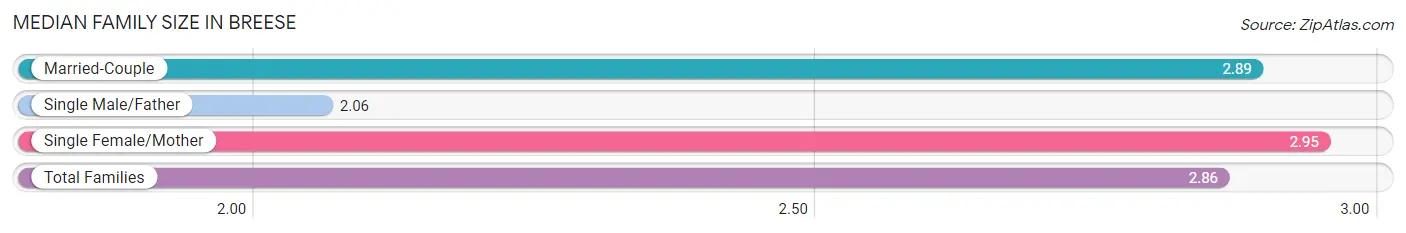
| Family Type | # Families | Family Size |
| Married-Couple | 915 (80.6%) | 2.89 |
| Single Male/Father | 53 (4.7%) | 2.06 |
| Single Female/Mother | 167 (14.7%) | 2.95 |
| Total Families | 1,135 (100.0%) | 2.86 |
Median Household Size in Breese
The median household size in Breese is 2.22 persons per household, with single female/mother households (167 | 8.6%) accounting for the largest median household size of 3.16 persons per household. non-family households (806 | 41.5%) represent the smallest median household size with 1.18 persons per household.
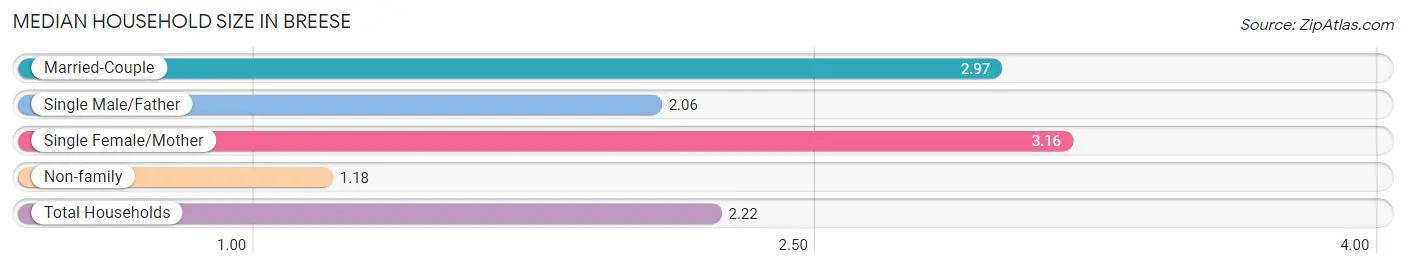
| Household Type | # Households | Household Size |
| Married-Couple | 915 (47.1%) | 2.97 |
| Single Male/Father | 53 (2.7%) | 2.06 |
| Single Female/Mother | 167 (8.6%) | 3.16 |
| Non-family | 806 (41.5%) | 1.18 |
| Total Households | 1,941 (100.0%) | 2.22 |
Household Size by Marriage Status in Breese
Out of a total of 1,941 households in Breese, 1,135 (58.5%) are family households, while 806 (41.5%) are nonfamily households. The most numerous type of family households are 2-person households, comprising 675, and the most common type of nonfamily households are 1-person households, comprising 700.
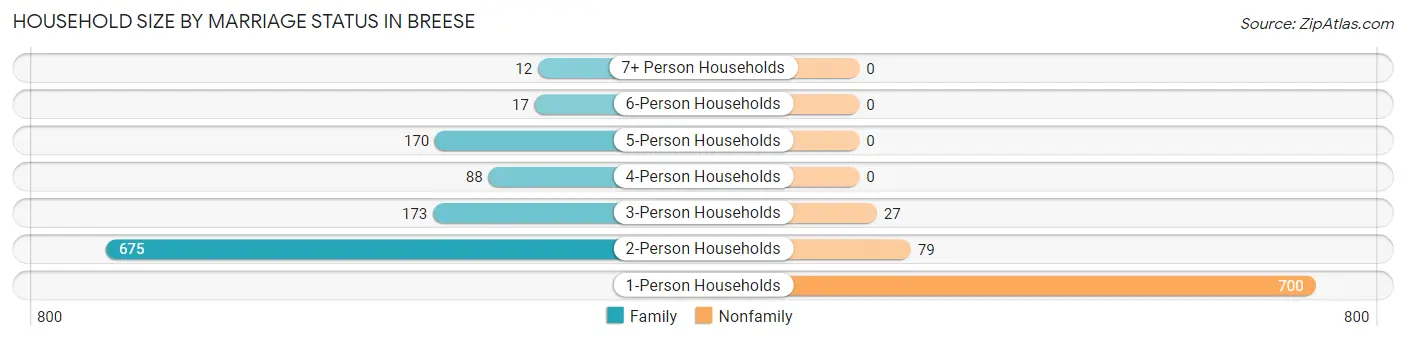
| Household Size | Family Households | Nonfamily Households |
| 1-Person Households | - | 700 (36.1%) |
| 2-Person Households | 675 (34.8%) | 79 (4.1%) |
| 3-Person Households | 173 (8.9%) | 27 (1.4%) |
| 4-Person Households | 88 (4.5%) | 0 (0.0%) |
| 5-Person Households | 170 (8.8%) | 0 (0.0%) |
| 6-Person Households | 17 (0.9%) | 0 (0.0%) |
| 7+ Person Households | 12 (0.6%) | 0 (0.0%) |
| Total | 1,135 (58.5%) | 806 (41.5%) |
Female Fertility in Breese
Fertility by Age in Breese
Average fertility rate in Breese is 76.0 births per 1,000 women. Women in the age bracket of 20 to 34 years have the highest fertility rate with 98.0 births per 1,000 women. Women in the age bracket of 20 to 34 years acount for 61.3% of all women with births.
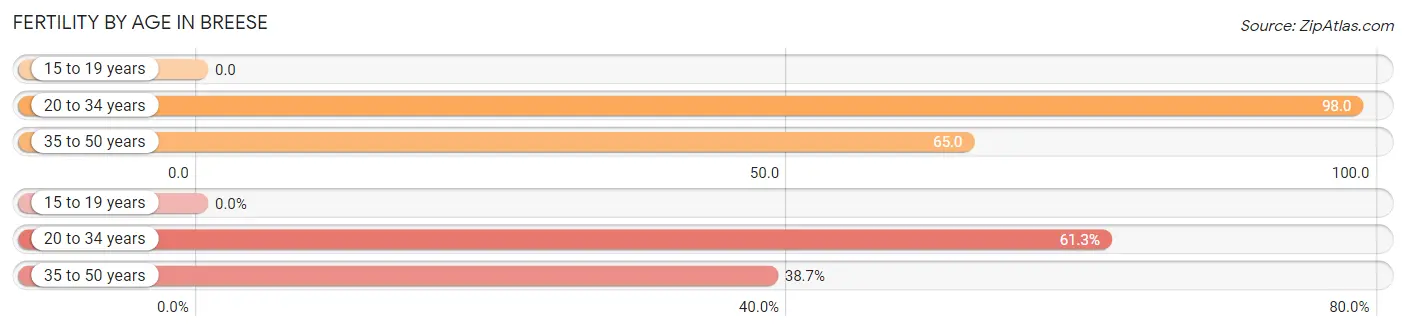
| Age Bracket | Women with Births | Births / 1,000 Women |
| 15 to 19 years | 0 (0.0%) | 0.0 |
| 20 to 34 years | 46 (61.3%) | 98.0 |
| 35 to 50 years | 29 (38.7%) | 65.0 |
| Total | 75 (100.0%) | 76.0 |
Fertility by Age by Marriage Status in Breese
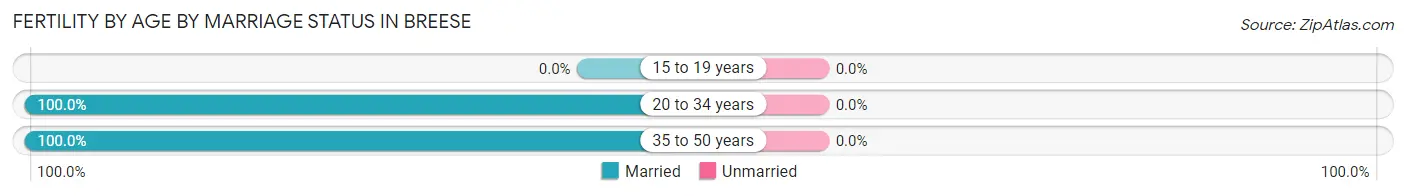
| Age Bracket | Married | Unmarried |
| 15 to 19 years | 0 (0.0%) | 0 (0.0%) |
| 20 to 34 years | 46 (100.0%) | 0 (0.0%) |
| 35 to 50 years | 29 (100.0%) | 0 (0.0%) |
| Total | 75 (100.0%) | 0 (0.0%) |
Fertility by Education in Breese
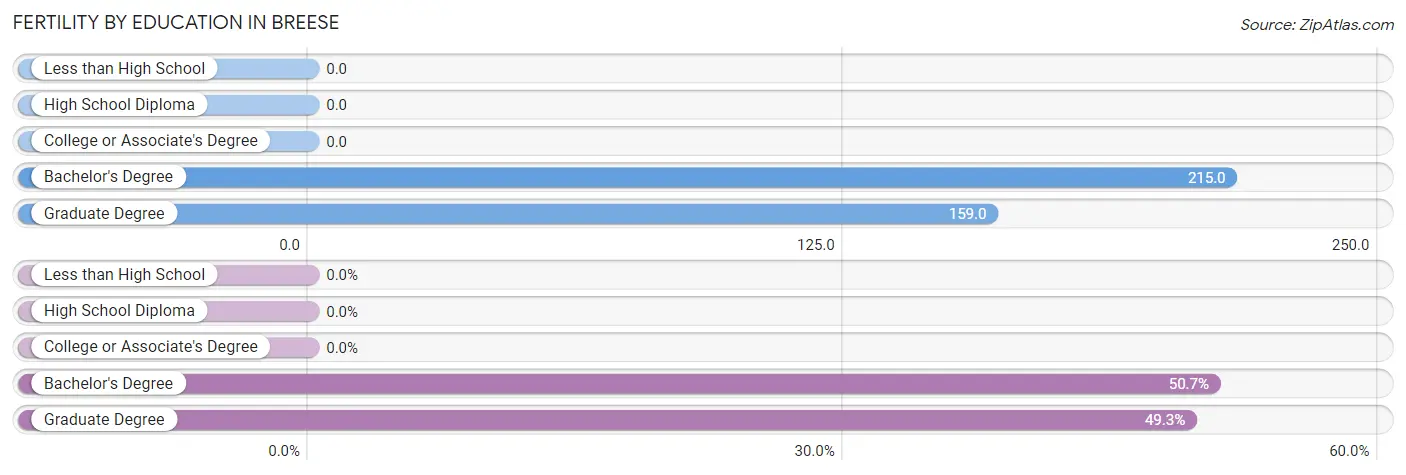
| Educational Attainment | Women with Births | Births / 1,000 Women |
| Less than High School | 0 (0.0%) | 0.0 |
| High School Diploma | 0 (0.0%) | 0.0 |
| College or Associate's Degree | 0 (0.0%) | 0.0 |
| Bachelor's Degree | 38 (50.7%) | 215.0 |
| Graduate Degree | 37 (49.3%) | 159.0 |
| Total | 75 (100.0%) | 76.0 |
Fertility by Education by Marriage Status in Breese
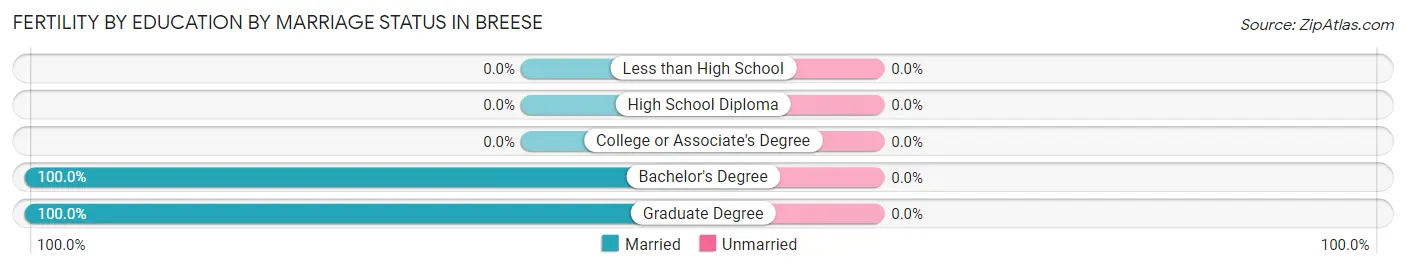
| Educational Attainment | Married | Unmarried |
| Less than High School | 0 (0.0%) | 0 (0.0%) |
| High School Diploma | 0 (0.0%) | 0 (0.0%) |
| College or Associate's Degree | 0 (0.0%) | 0 (0.0%) |
| Bachelor's Degree | 38 (100.0%) | 0 (0.0%) |
| Graduate Degree | 37 (100.0%) | 0 (0.0%) |
| Total | 75 (100.0%) | 0 (0.0%) |
Employment Characteristics in Breese
Employment by Class of Employer in Breese
Among the 2,290 employed individuals in Breese, private company employees (1,528 | 66.7%), not-for-profit organizations (227 | 9.9%), and local government employees (153 | 6.7%) make up the most common classes of employment.
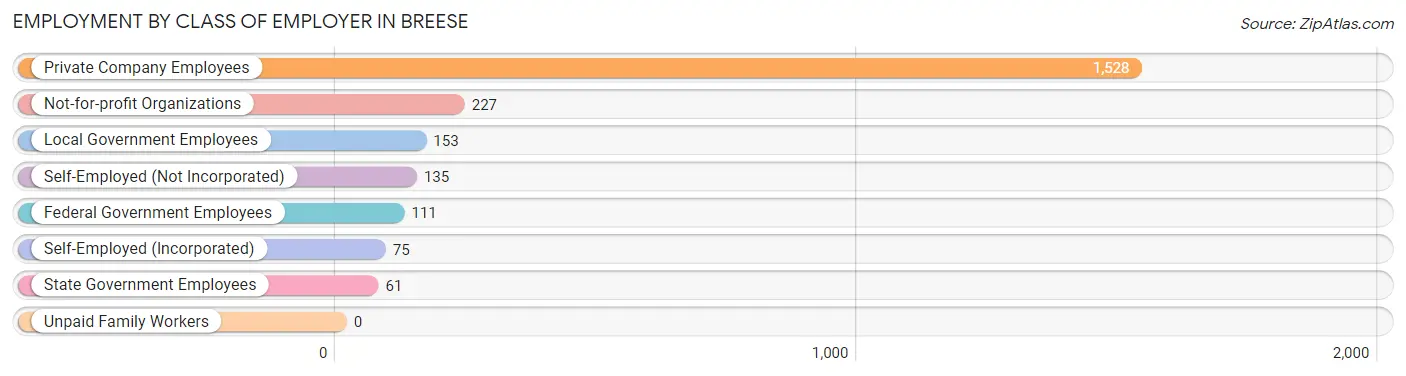
| Employer Class | # Employees | % Employees |
| Private Company Employees | 1,528 | 66.7% |
| Self-Employed (Incorporated) | 75 | 3.3% |
| Self-Employed (Not Incorporated) | 135 | 5.9% |
| Not-for-profit Organizations | 227 | 9.9% |
| Local Government Employees | 153 | 6.7% |
| State Government Employees | 61 | 2.7% |
| Federal Government Employees | 111 | 4.9% |
| Unpaid Family Workers | 0 | 0.0% |
| Total | 2,290 | 100.0% |
Employment Status by Age in Breese
According to the labor force statistics for Breese, out of the total population over 16 years of age (3,645), 65.7% or 2,395 individuals are in the labor force, with 3.7% or 89 of them unemployed. The age group with the highest labor force participation rate is 30 to 34 years, with 99.7% or 312 individuals in the labor force. Within the labor force, the 16 to 19 years age range has the highest percentage of unemployed individuals, with 15.9% or 11 of them being unemployed.
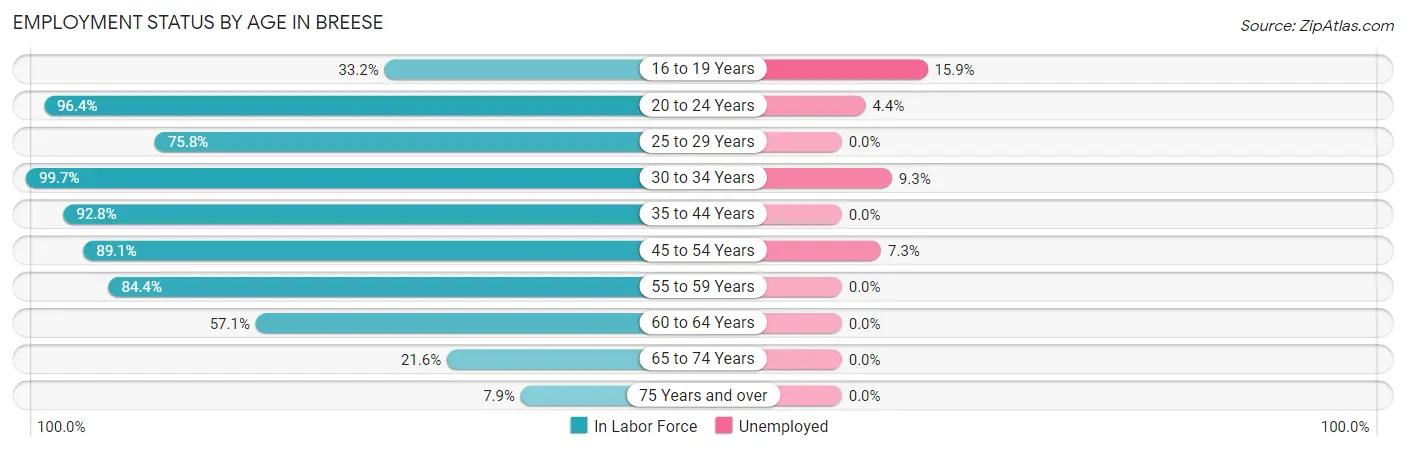
| Age Bracket | In Labor Force | Unemployed |
| 16 to 19 Years | 69 (33.2%) | 11 (15.9%) |
| 20 to 24 Years | 321 (96.4%) | 14 (4.4%) |
| 25 to 29 Years | 147 (75.8%) | 0 (0.0%) |
| 30 to 34 Years | 312 (99.7%) | 29 (9.3%) |
| 35 to 44 Years | 493 (92.8%) | 0 (0.0%) |
| 45 to 54 Years | 481 (89.1%) | 35 (7.3%) |
| 55 to 59 Years | 318 (84.4%) | 0 (0.0%) |
| 60 to 64 Years | 112 (57.1%) | 0 (0.0%) |
| 65 to 74 Years | 104 (21.6%) | 0 (0.0%) |
| 75 Years and over | 37 (7.9%) | 0 (0.0%) |
| Total | 2,395 (65.7%) | 89 (3.7%) |
Employment Status by Educational Attainment in Breese
According to labor force statistics for Breese, 86.6% of individuals (1,863) out of the total population between 25 and 64 years of age (2,151) are in the labor force, with 3.4% or 63 of them being unemployed. The group with the highest labor force participation rate are those with the educational attainment of bachelor's degree or higher, with 98.1% or 673 individuals in the labor force. Within the labor force, individuals with less than high school education have the highest percentage of unemployment, with 53.8% or 28 of them being unemployed.
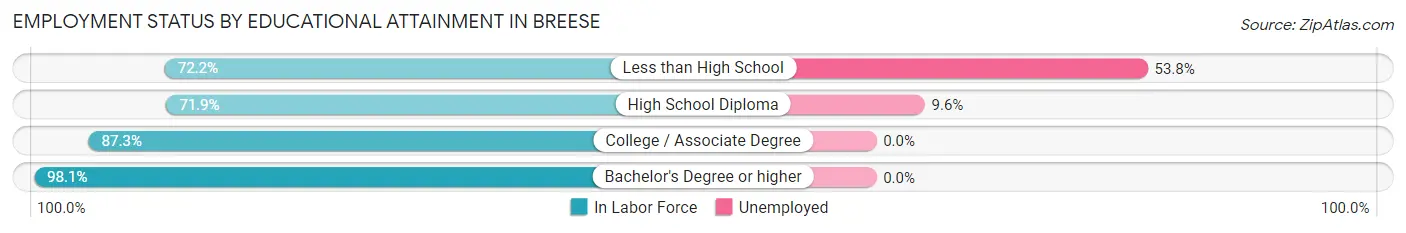
| Educational Attainment | In Labor Force | Unemployed |
| Less than High School | 52 (72.2%) | 39 (53.8%) |
| High School Diploma | 365 (71.9%) | 49 (9.6%) |
| College / Associate Degree | 773 (87.3%) | 0 (0.0%) |
| Bachelor's Degree or higher | 673 (98.1%) | 0 (0.0%) |
| Total | 1,863 (86.6%) | 73 (3.4%) |
Employment Occupations by Sex in Breese
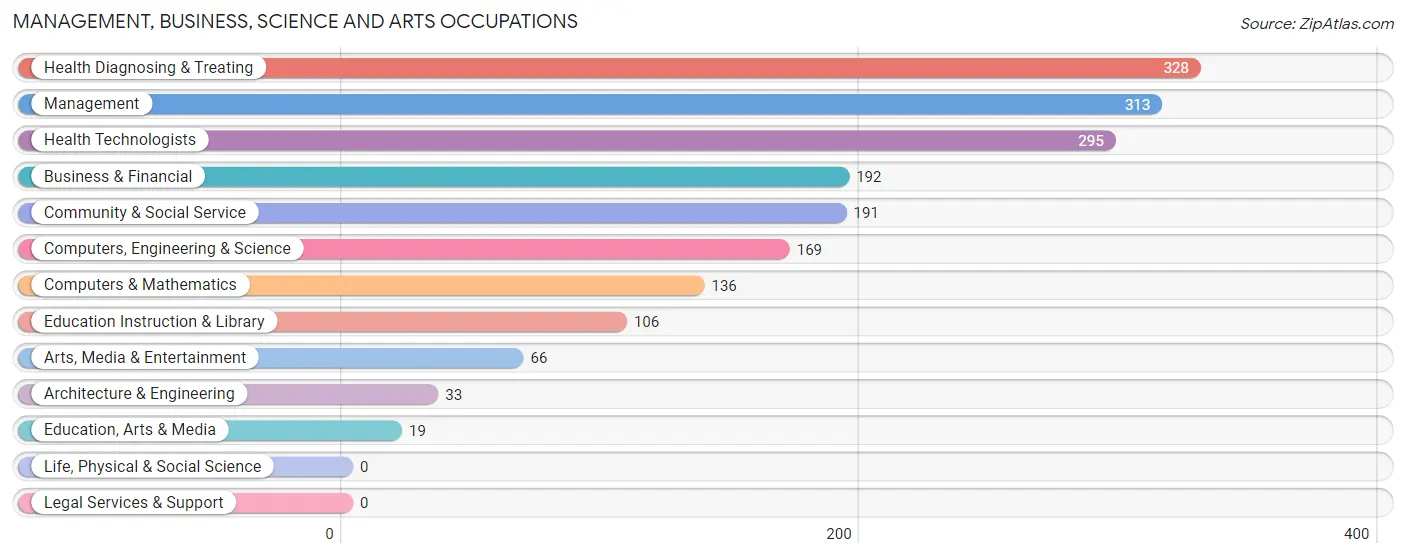
Management, Business, Science and Arts Occupations
The most common Management, Business, Science and Arts occupations in Breese are Health Diagnosing & Treating (328 | 14.3%), Management (313 | 13.6%), Health Technologists (295 | 12.9%), Business & Financial (192 | 8.4%), and Community & Social Service (191 | 8.3%).
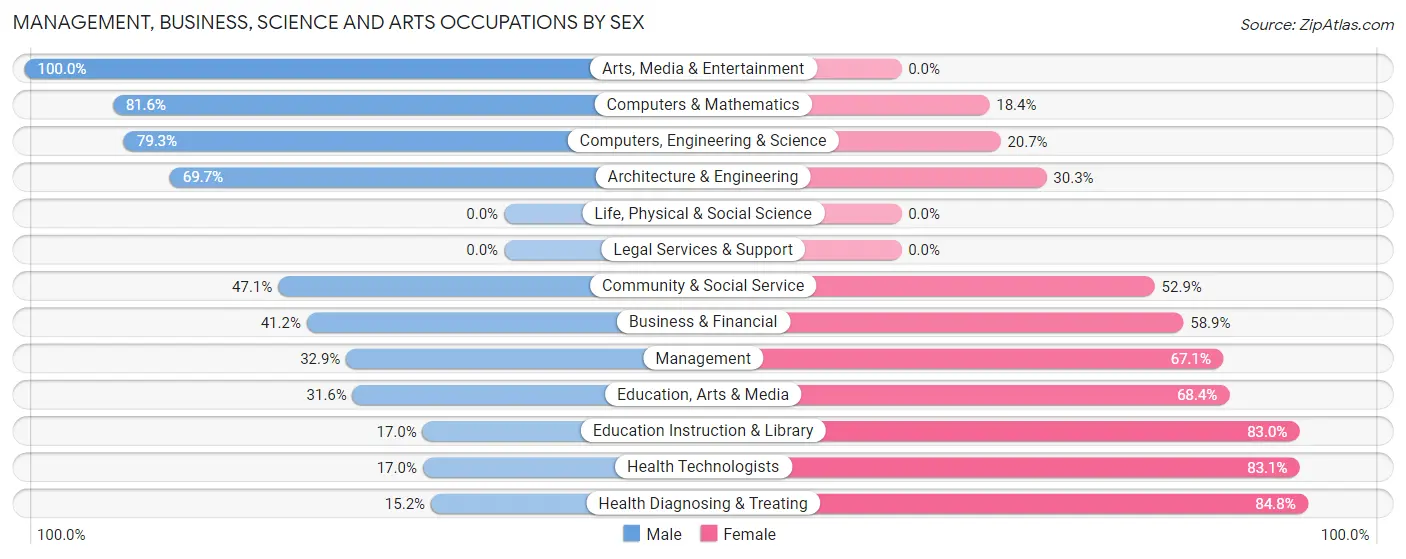
Management, Business, Science and Arts Occupations by Sex
Within the Management, Business, Science and Arts occupations in Breese, the most male-oriented occupations are Arts, Media & Entertainment (100.0%), Computers & Mathematics (81.6%), and Computers, Engineering & Science (79.3%), while the most female-oriented occupations are Health Diagnosing & Treating (84.8%), Health Technologists (83.1%), and Education Instruction & Library (83.0%).
| Occupation | Male | Female |
| Management | 103 (32.9%) | 210 (67.1%) |
| Business & Financial | 79 (41.1%) | 113 (58.9%) |
| Computers, Engineering & Science | 134 (79.3%) | 35 (20.7%) |
| Computers & Mathematics | 111 (81.6%) | 25 (18.4%) |
| Architecture & Engineering | 23 (69.7%) | 10 (30.3%) |
| Life, Physical & Social Science | 0 (0.0%) | 0 (0.0%) |
| Community & Social Service | 90 (47.1%) | 101 (52.9%) |
| Education, Arts & Media | 6 (31.6%) | 13 (68.4%) |
| Legal Services & Support | 0 (0.0%) | 0 (0.0%) |
| Education Instruction & Library | 18 (17.0%) | 88 (83.0%) |
| Arts, Media & Entertainment | 66 (100.0%) | 0 (0.0%) |
| Health Diagnosing & Treating | 50 (15.2%) | 278 (84.8%) |
| Health Technologists | 50 (17.0%) | 245 (83.1%) |
| Total (Category) | 456 (38.2%) | 737 (61.8%) |
| Total (Overall) | 1,106 (48.2%) | 1,188 (51.8%) |
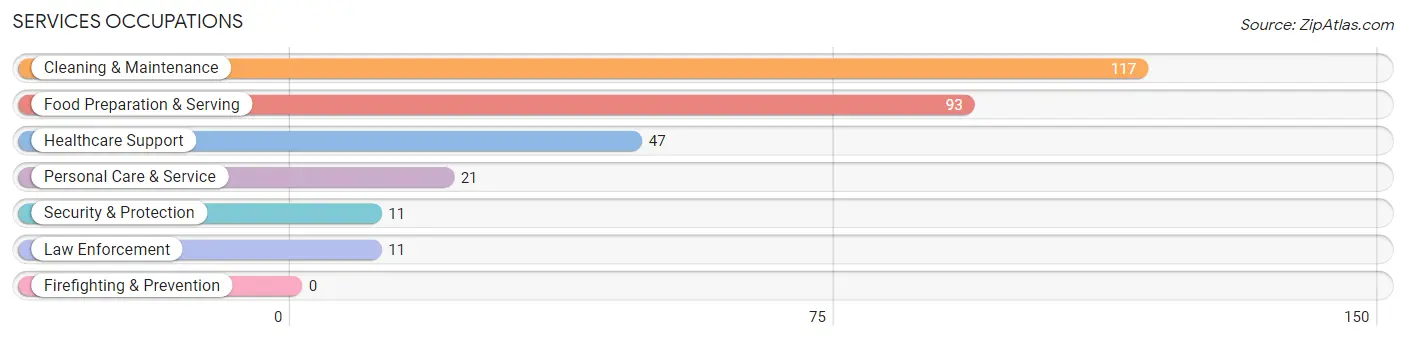
Services Occupations
The most common Services occupations in Breese are Cleaning & Maintenance (117 | 5.1%), Food Preparation & Serving (93 | 4.1%), Healthcare Support (47 | 2.1%), Personal Care & Service (21 | 0.9%), and Security & Protection (11 | 0.5%).
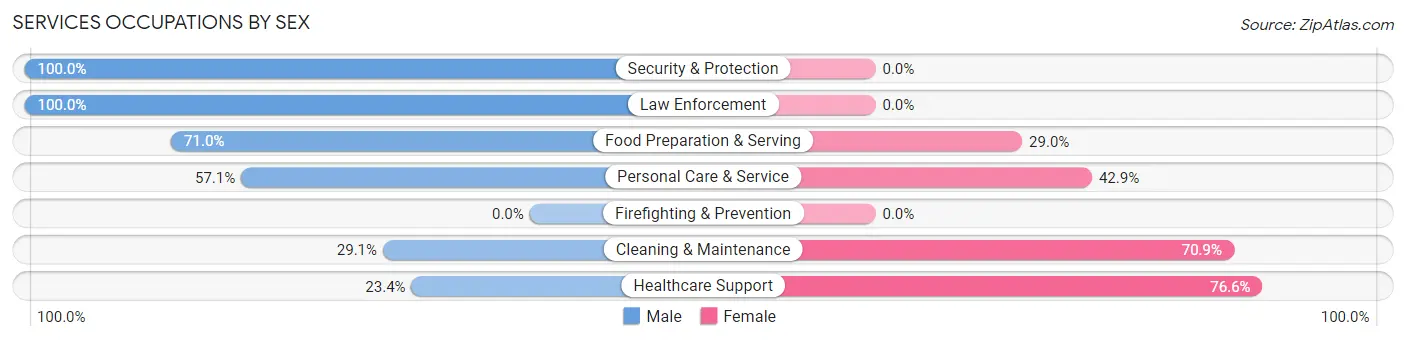
Services Occupations by Sex
Within the Services occupations in Breese, the most male-oriented occupations are Security & Protection (100.0%), Law Enforcement (100.0%), and Food Preparation & Serving (71.0%), while the most female-oriented occupations are Healthcare Support (76.6%), Cleaning & Maintenance (70.9%), and Personal Care & Service (42.9%).
| Occupation | Male | Female |
| Healthcare Support | 11 (23.4%) | 36 (76.6%) |
| Security & Protection | 11 (100.0%) | 0 (0.0%) |
| Firefighting & Prevention | 0 (0.0%) | 0 (0.0%) |
| Law Enforcement | 11 (100.0%) | 0 (0.0%) |
| Food Preparation & Serving | 66 (71.0%) | 27 (29.0%) |
| Cleaning & Maintenance | 34 (29.1%) | 83 (70.9%) |
| Personal Care & Service | 12 (57.1%) | 9 (42.9%) |
| Total (Category) | 134 (46.4%) | 155 (53.6%) |
| Total (Overall) | 1,106 (48.2%) | 1,188 (51.8%) |
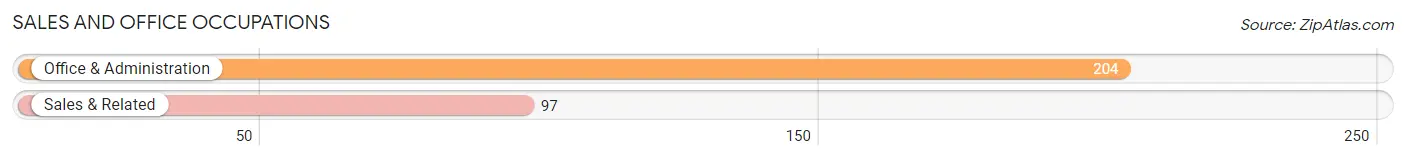
Sales and Office Occupations
The most common Sales and Office occupations in Breese are Office & Administration (204 | 8.9%), and Sales & Related (97 | 4.2%).
Sales and Office Occupations by Sex
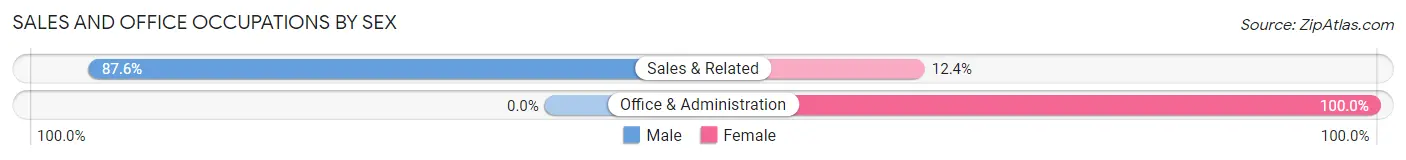
| Occupation | Male | Female |
| Sales & Related | 85 (87.6%) | 12 (12.4%) |
| Office & Administration | 0 (0.0%) | 204 (100.0%) |
| Total (Category) | 85 (28.2%) | 216 (71.8%) |
| Total (Overall) | 1,106 (48.2%) | 1,188 (51.8%) |
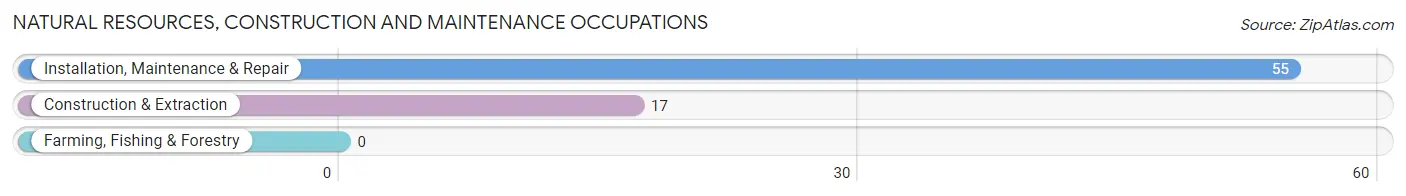
Natural Resources, Construction and Maintenance Occupations
The most common Natural Resources, Construction and Maintenance occupations in Breese are Installation, Maintenance & Repair (55 | 2.4%), and Construction & Extraction (17 | 0.7%).
Natural Resources, Construction and Maintenance Occupations by Sex
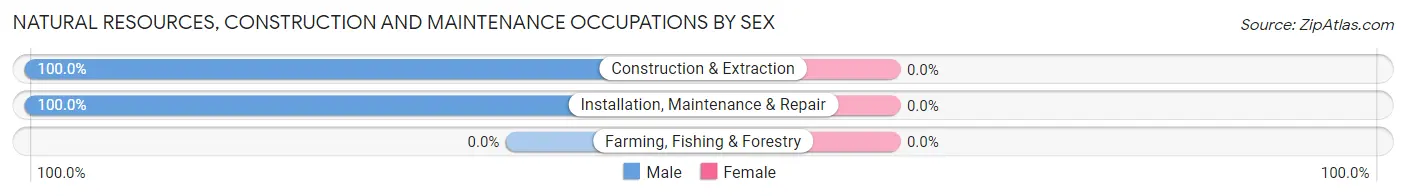
| Occupation | Male | Female |
| Farming, Fishing & Forestry | 0 (0.0%) | 0 (0.0%) |
| Construction & Extraction | 17 (100.0%) | 0 (0.0%) |
| Installation, Maintenance & Repair | 55 (100.0%) | 0 (0.0%) |
| Total (Category) | 72 (100.0%) | 0 (0.0%) |
| Total (Overall) | 1,106 (48.2%) | 1,188 (51.8%) |
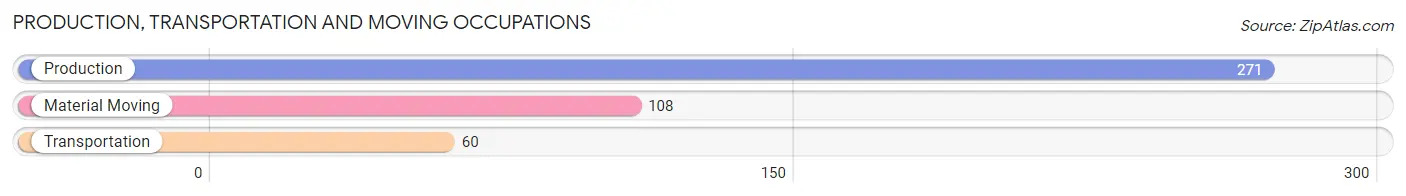
Production, Transportation and Moving Occupations
The most common Production, Transportation and Moving occupations in Breese are Production (271 | 11.8%), Material Moving (108 | 4.7%), and Transportation (60 | 2.6%).
Production, Transportation and Moving Occupations by Sex
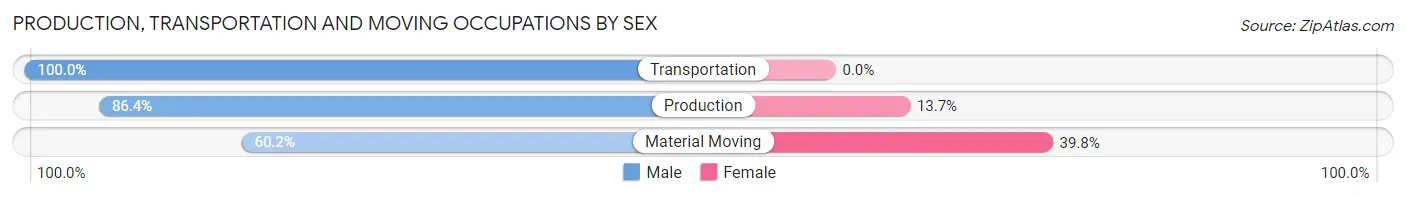
| Occupation | Male | Female |
| Production | 234 (86.4%) | 37 (13.7%) |
| Transportation | 60 (100.0%) | 0 (0.0%) |
| Material Moving | 65 (60.2%) | 43 (39.8%) |
| Total (Category) | 359 (81.8%) | 80 (18.2%) |
| Total (Overall) | 1,106 (48.2%) | 1,188 (51.8%) |
Employment Industries by Sex in Breese
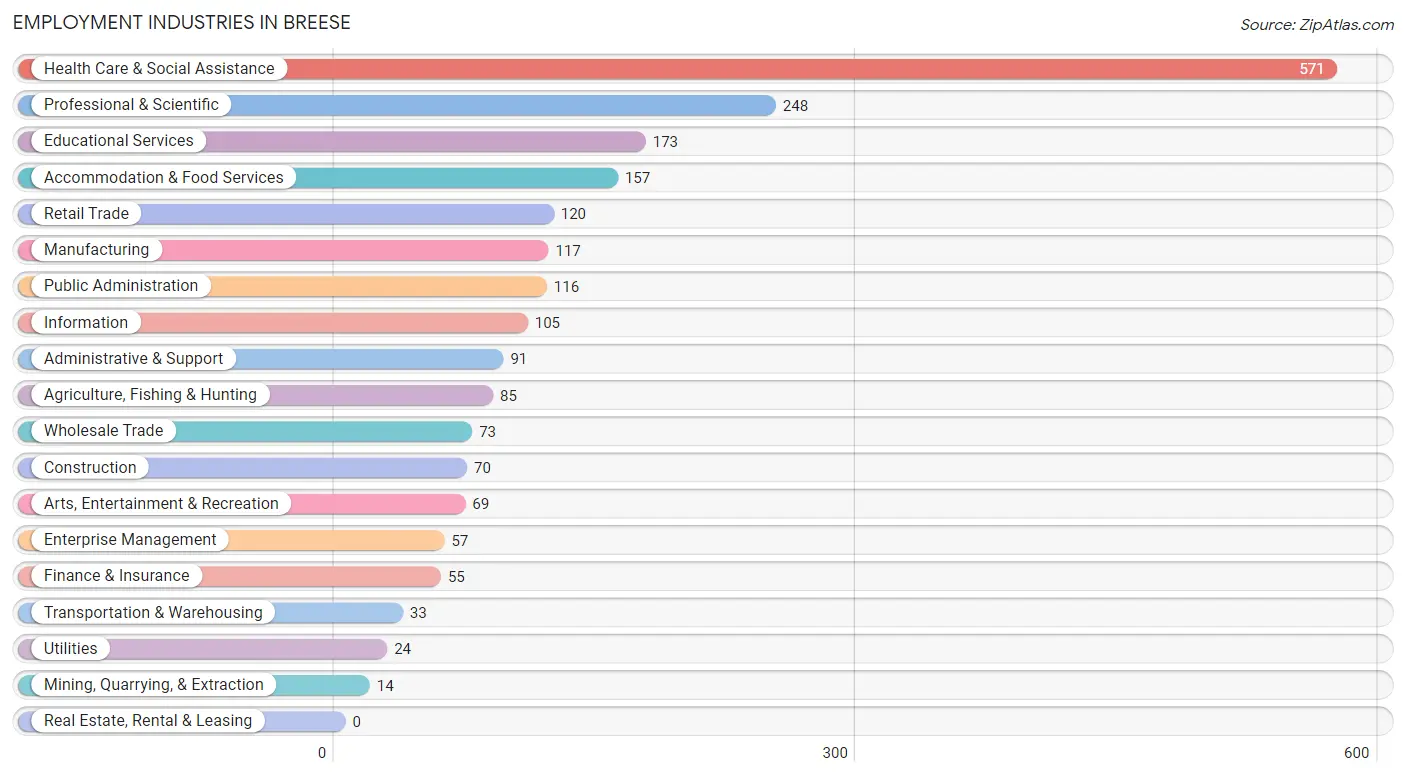
Employment Industries in Breese
The major employment industries in Breese include Health Care & Social Assistance (571 | 24.9%), Professional & Scientific (248 | 10.8%), Educational Services (173 | 7.5%), Accommodation & Food Services (157 | 6.8%), and Retail Trade (120 | 5.2%).
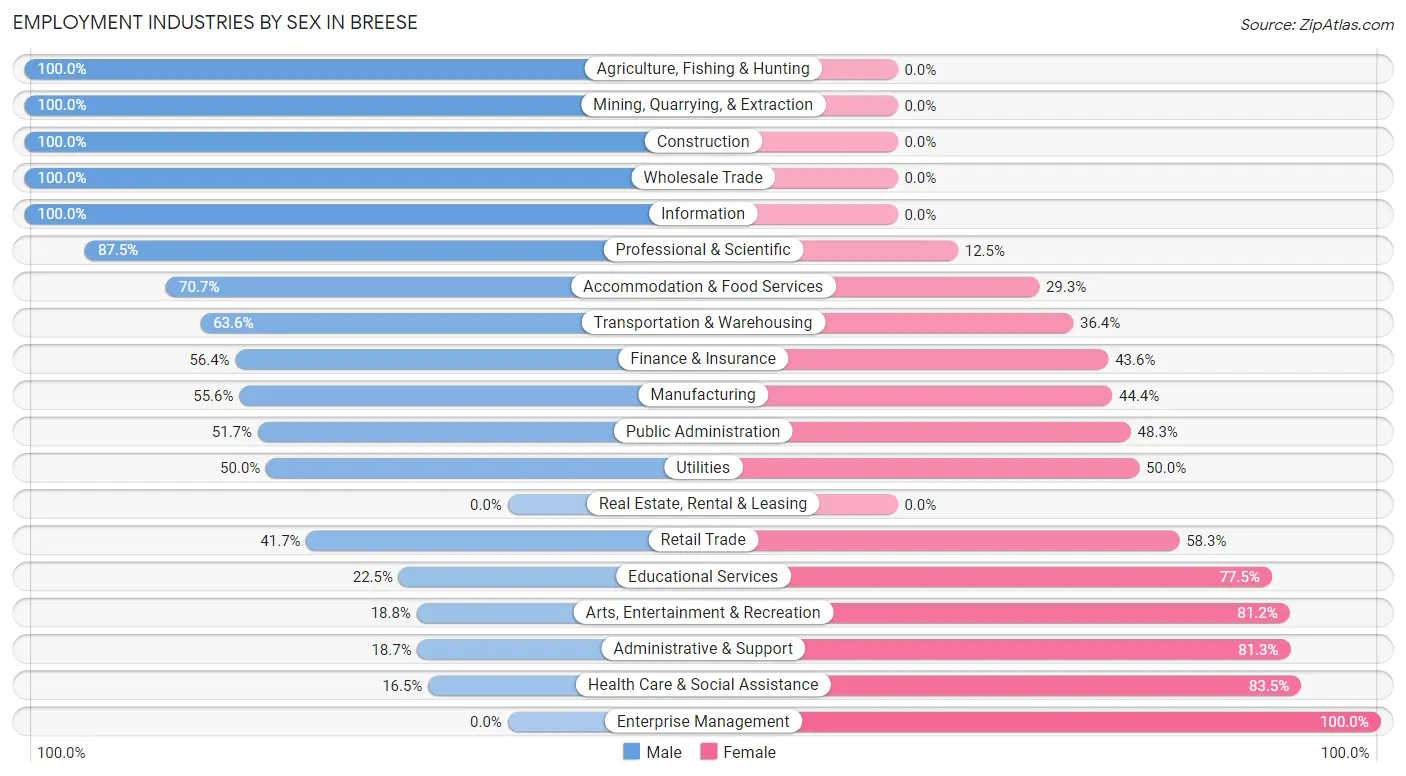
Employment Industries by Sex in Breese
The Breese industries that see more men than women are Agriculture, Fishing & Hunting (100.0%), Mining, Quarrying, & Extraction (100.0%), and Construction (100.0%), whereas the industries that tend to have a higher number of women are Enterprise Management (100.0%), Health Care & Social Assistance (83.5%), and Administrative & Support (81.3%).
| Industry | Male | Female |
| Agriculture, Fishing & Hunting | 85 (100.0%) | 0 (0.0%) |
| Mining, Quarrying, & Extraction | 14 (100.0%) | 0 (0.0%) |
| Construction | 70 (100.0%) | 0 (0.0%) |
| Manufacturing | 65 (55.6%) | 52 (44.4%) |
| Wholesale Trade | 73 (100.0%) | 0 (0.0%) |
| Retail Trade | 50 (41.7%) | 70 (58.3%) |
| Transportation & Warehousing | 21 (63.6%) | 12 (36.4%) |
| Utilities | 12 (50.0%) | 12 (50.0%) |
| Information | 105 (100.0%) | 0 (0.0%) |
| Finance & Insurance | 31 (56.4%) | 24 (43.6%) |
| Real Estate, Rental & Leasing | 0 (0.0%) | 0 (0.0%) |
| Professional & Scientific | 217 (87.5%) | 31 (12.5%) |
| Enterprise Management | 0 (0.0%) | 57 (100.0%) |
| Administrative & Support | 17 (18.7%) | 74 (81.3%) |
| Educational Services | 39 (22.5%) | 134 (77.5%) |
| Health Care & Social Assistance | 94 (16.5%) | 477 (83.5%) |
| Arts, Entertainment & Recreation | 13 (18.8%) | 56 (81.2%) |
| Accommodation & Food Services | 111 (70.7%) | 46 (29.3%) |
| Public Administration | 60 (51.7%) | 56 (48.3%) |
| Total | 1,106 (48.2%) | 1,188 (51.8%) |
Education in Breese
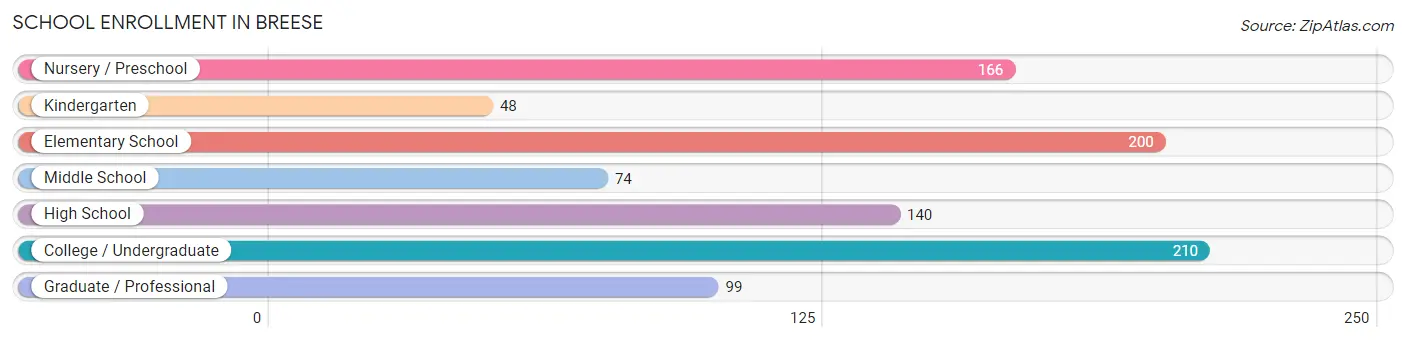
School Enrollment in Breese
The most common levels of schooling among the 937 students in Breese are college / undergraduate (210 | 22.4%), elementary school (200 | 21.3%), and nursery / preschool (166 | 17.7%).
| School Level | # Students | % Students |
| Nursery / Preschool | 166 | 17.7% |
| Kindergarten | 48 | 5.1% |
| Elementary School | 200 | 21.3% |
| Middle School | 74 | 7.9% |
| High School | 140 | 14.9% |
| College / Undergraduate | 210 | 22.4% |
| Graduate / Professional | 99 | 10.6% |
| Total | 937 | 100.0% |
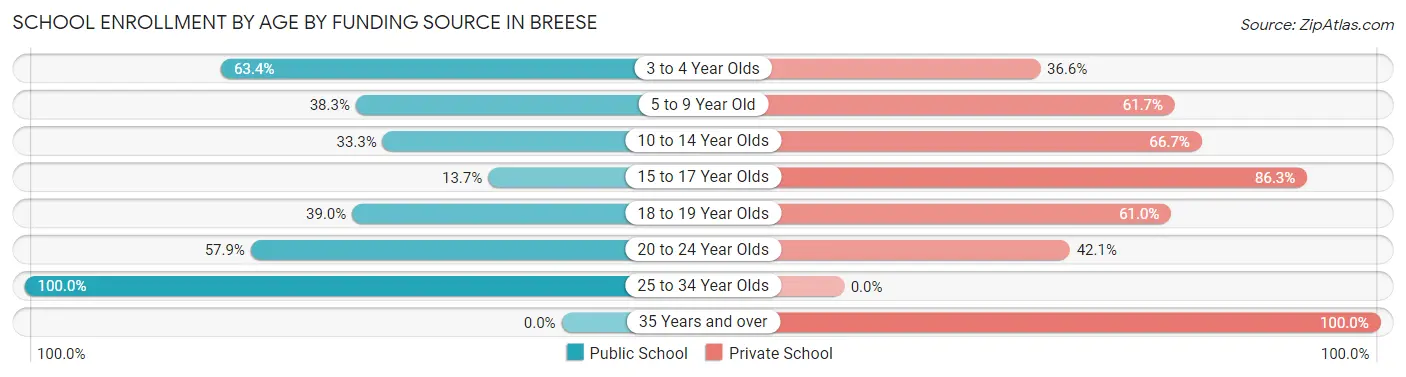
School Enrollment by Age by Funding Source in Breese
Out of a total of 937 students who are enrolled in schools in Breese, 558 (59.6%) attend a private institution, while the remaining 379 (40.4%) are enrolled in public schools. The age group of 35 years and over has the highest likelihood of being enrolled in private schools, with 58 (100.0% in the age bracket) enrolled. Conversely, the age group of 25 to 34 year olds has the lowest likelihood of being enrolled in a private school, with 37 (100.0% in the age bracket) attending a public institution.
| Age Bracket | Public School | Private School |
| 3 to 4 Year Olds | 78 (63.4%) | 45 (36.6%) |
| 5 to 9 Year Old | 105 (38.3%) | 169 (61.7%) |
| 10 to 14 Year Olds | 38 (33.3%) | 76 (66.7%) |
| 15 to 17 Year Olds | 16 (13.7%) | 101 (86.3%) |
| 18 to 19 Year Olds | 39 (39.0%) | 61 (61.0%) |
| 20 to 24 Year Olds | 66 (57.9%) | 48 (42.1%) |
| 25 to 34 Year Olds | 37 (100.0%) | 0 (0.0%) |
| 35 Years and over | 0 (0.0%) | 58 (100.0%) |
| Total | 379 (40.4%) | 558 (59.6%) |
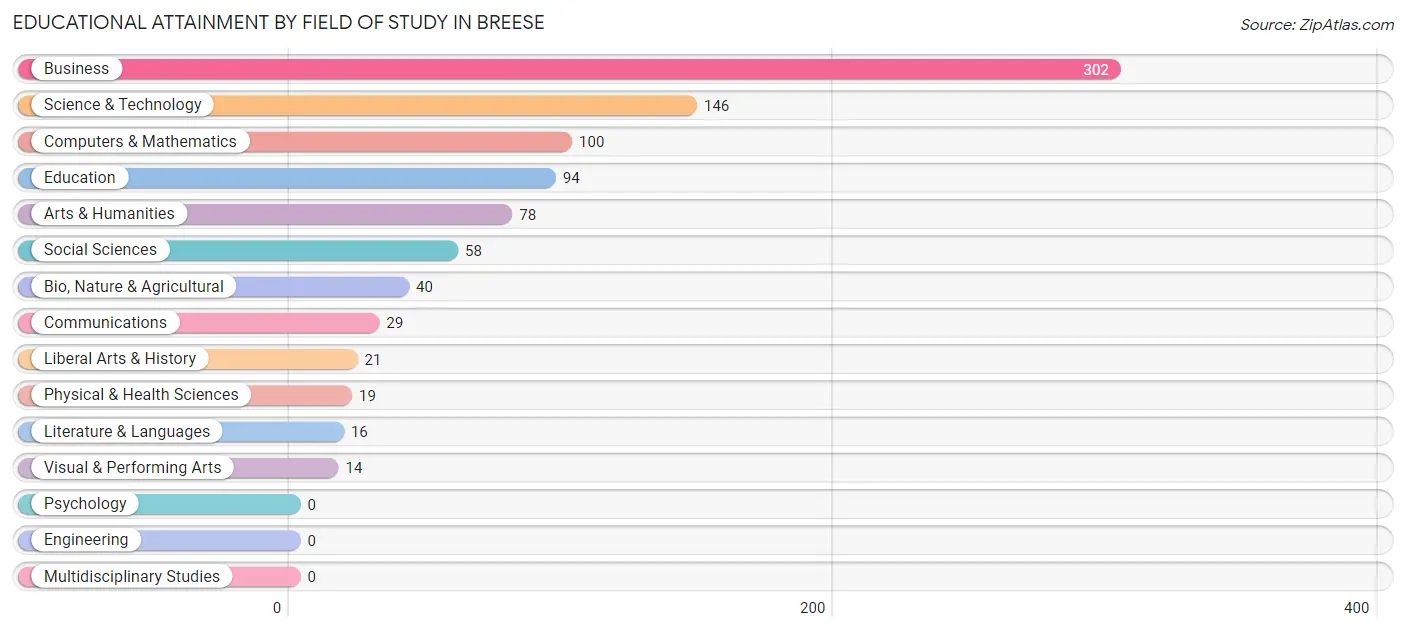
Educational Attainment by Field of Study in Breese
Business (302 | 32.9%), science & technology (146 | 15.9%), computers & mathematics (100 | 10.9%), education (94 | 10.2%), and arts & humanities (78 | 8.5%) are the most common fields of study among 917 individuals in Breese who have obtained a bachelor's degree or higher.
| Field of Study | # Graduates | % Graduates |
| Computers & Mathematics | 100 | 10.9% |
| Bio, Nature & Agricultural | 40 | 4.4% |
| Physical & Health Sciences | 19 | 2.1% |
| Psychology | 0 | 0.0% |
| Social Sciences | 58 | 6.3% |
| Engineering | 0 | 0.0% |
| Multidisciplinary Studies | 0 | 0.0% |
| Science & Technology | 146 | 15.9% |
| Business | 302 | 32.9% |
| Education | 94 | 10.2% |
| Literature & Languages | 16 | 1.7% |
| Liberal Arts & History | 21 | 2.3% |
| Visual & Performing Arts | 14 | 1.5% |
| Communications | 29 | 3.2% |
| Arts & Humanities | 78 | 8.5% |
| Total | 917 | 100.0% |
Transportation & Commute in Breese
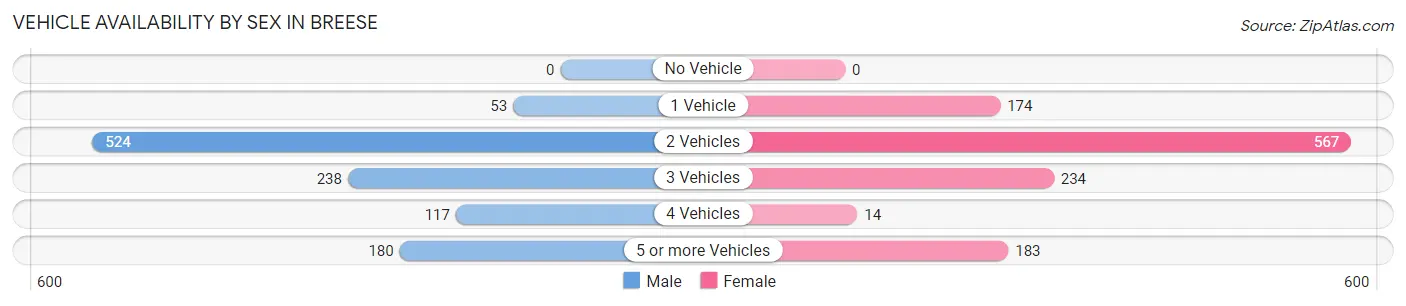
Vehicle Availability by Sex in Breese
The most prevalent vehicle ownership categories in Breese are males with 2 vehicles (524, accounting for 47.1%) and females with 2 vehicles (567, making up 44.7%).
| Vehicles Available | Male | Female |
| No Vehicle | 0 (0.0%) | 0 (0.0%) |
| 1 Vehicle | 53 (4.8%) | 174 (14.8%) |
| 2 Vehicles | 524 (47.1%) | 567 (48.4%) |
| 3 Vehicles | 238 (21.4%) | 234 (20.0%) |
| 4 Vehicles | 117 (10.5%) | 14 (1.2%) |
| 5 or more Vehicles | 180 (16.2%) | 183 (15.6%) |
| Total | 1,112 (100.0%) | 1,172 (100.0%) |
Commute Time in Breese
The most frequently occuring commute durations in Breese are 5 to 9 minutes (324 commuters, 16.2%), 45 to 59 minutes (285 commuters, 14.3%), and 10 to 14 minutes (269 commuters, 13.5%).
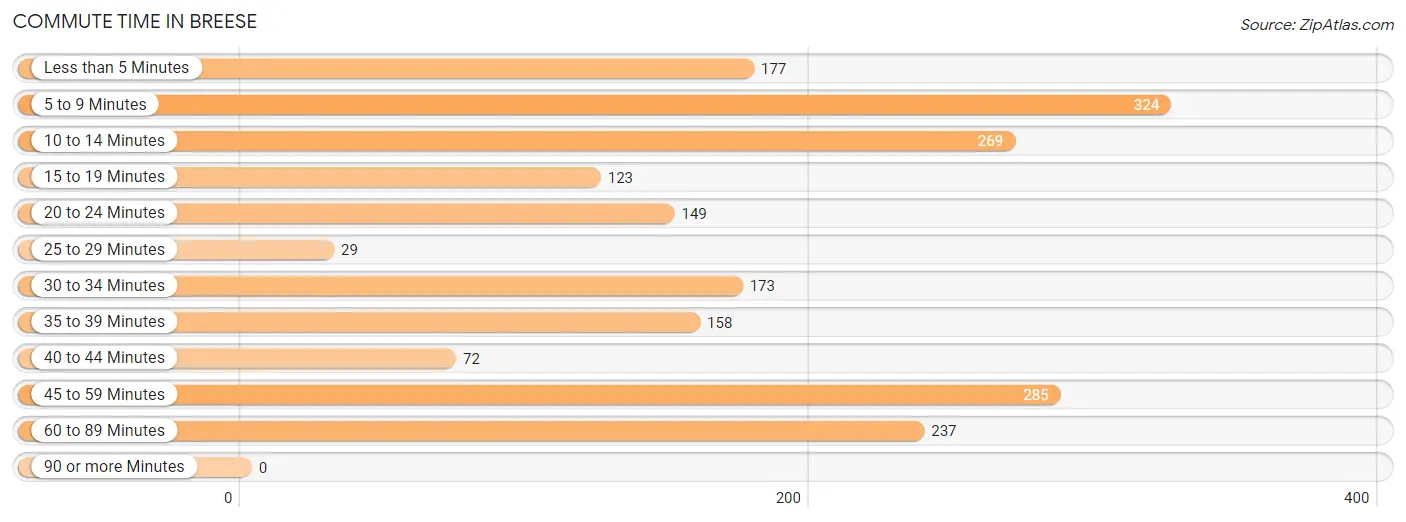
| Commute Time | # Commuters | % Commuters |
| Less than 5 Minutes | 177 | 8.9% |
| 5 to 9 Minutes | 324 | 16.2% |
| 10 to 14 Minutes | 269 | 13.5% |
| 15 to 19 Minutes | 123 | 6.2% |
| 20 to 24 Minutes | 149 | 7.5% |
| 25 to 29 Minutes | 29 | 1.5% |
| 30 to 34 Minutes | 173 | 8.7% |
| 35 to 39 Minutes | 158 | 7.9% |
| 40 to 44 Minutes | 72 | 3.6% |
| 45 to 59 Minutes | 285 | 14.3% |
| 60 to 89 Minutes | 237 | 11.9% |
| 90 or more Minutes | 0 | 0.0% |
Commute Time by Sex in Breese
The most common commute times in Breese are 5 to 9 minutes (245 commuters, 27.5%) for males and 60 to 89 minutes (189 commuters, 17.1%) for females.
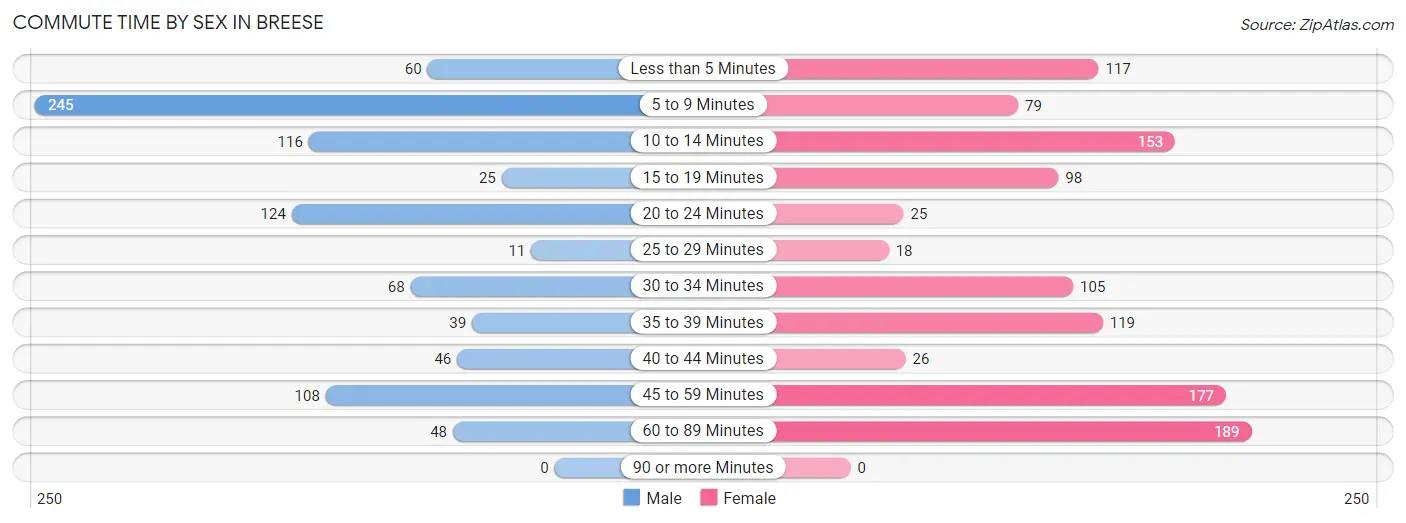
| Commute Time | Male | Female |
| Less than 5 Minutes | 60 (6.7%) | 117 (10.6%) |
| 5 to 9 Minutes | 245 (27.5%) | 79 (7.1%) |
| 10 to 14 Minutes | 116 (13.0%) | 153 (13.8%) |
| 15 to 19 Minutes | 25 (2.8%) | 98 (8.9%) |
| 20 to 24 Minutes | 124 (13.9%) | 25 (2.3%) |
| 25 to 29 Minutes | 11 (1.2%) | 18 (1.6%) |
| 30 to 34 Minutes | 68 (7.6%) | 105 (9.5%) |
| 35 to 39 Minutes | 39 (4.4%) | 119 (10.8%) |
| 40 to 44 Minutes | 46 (5.2%) | 26 (2.4%) |
| 45 to 59 Minutes | 108 (12.1%) | 177 (16.0%) |
| 60 to 89 Minutes | 48 (5.4%) | 189 (17.1%) |
| 90 or more Minutes | 0 (0.0%) | 0 (0.0%) |
Time of Departure to Work by Sex in Breese
The most frequent times of departure to work in Breese are 12:00 AM to 4:59 AM (152, 17.1%) for males and 7:30 AM to 7:59 AM (212, 19.2%) for females.
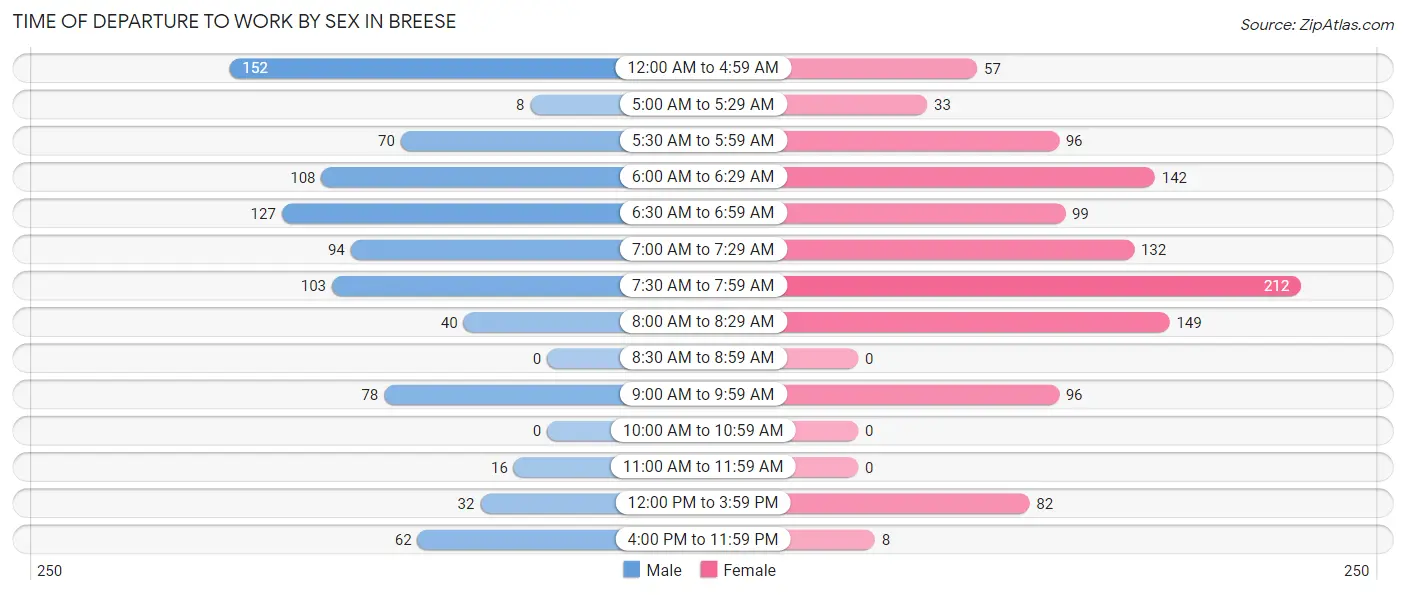
| Time of Departure | Male | Female |
| 12:00 AM to 4:59 AM | 152 (17.1%) | 57 (5.1%) |
| 5:00 AM to 5:29 AM | 8 (0.9%) | 33 (3.0%) |
| 5:30 AM to 5:59 AM | 70 (7.9%) | 96 (8.7%) |
| 6:00 AM to 6:29 AM | 108 (12.1%) | 142 (12.8%) |
| 6:30 AM to 6:59 AM | 127 (14.3%) | 99 (8.9%) |
| 7:00 AM to 7:29 AM | 94 (10.6%) | 132 (11.9%) |
| 7:30 AM to 7:59 AM | 103 (11.6%) | 212 (19.2%) |
| 8:00 AM to 8:29 AM | 40 (4.5%) | 149 (13.5%) |
| 8:30 AM to 8:59 AM | 0 (0.0%) | 0 (0.0%) |
| 9:00 AM to 9:59 AM | 78 (8.8%) | 96 (8.7%) |
| 10:00 AM to 10:59 AM | 0 (0.0%) | 0 (0.0%) |
| 11:00 AM to 11:59 AM | 16 (1.8%) | 0 (0.0%) |
| 12:00 PM to 3:59 PM | 32 (3.6%) | 82 (7.4%) |
| 4:00 PM to 11:59 PM | 62 (7.0%) | 8 (0.7%) |
| Total | 890 (100.0%) | 1,106 (100.0%) |
Housing Occupancy in Breese
Occupancy by Ownership in Breese
Of the total 1,941 dwellings in Breese, owner-occupied units account for 1,465 (75.5%), while renter-occupied units make up 476 (24.5%).
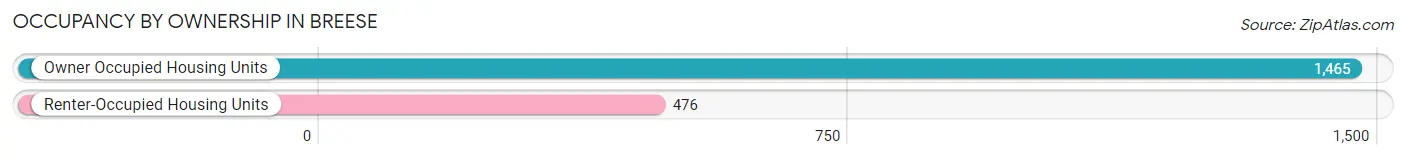
| Occupancy | # Housing Units | % Housing Units |
| Owner Occupied Housing Units | 1,465 | 75.5% |
| Renter-Occupied Housing Units | 476 | 24.5% |
| Total Occupied Housing Units | 1,941 | 100.0% |
Occupancy by Household Size in Breese
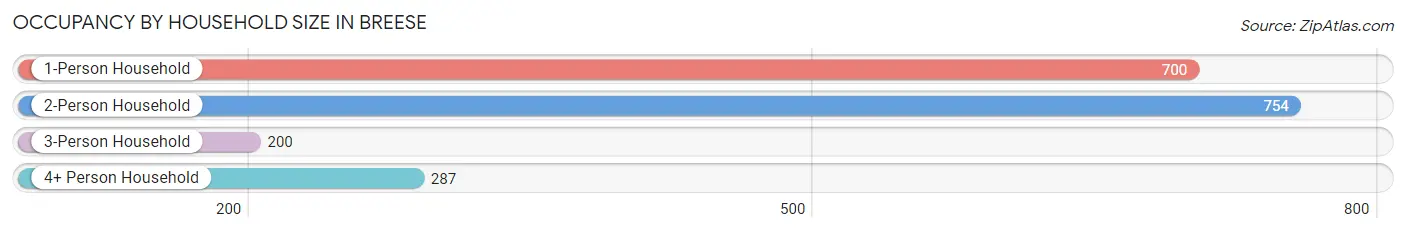
| Household Size | # Housing Units | % Housing Units |
| 1-Person Household | 700 | 36.1% |
| 2-Person Household | 754 | 38.9% |
| 3-Person Household | 200 | 10.3% |
| 4+ Person Household | 287 | 14.8% |
| Total Housing Units | 1,941 | 100.0% |
Occupancy by Ownership by Household Size in Breese
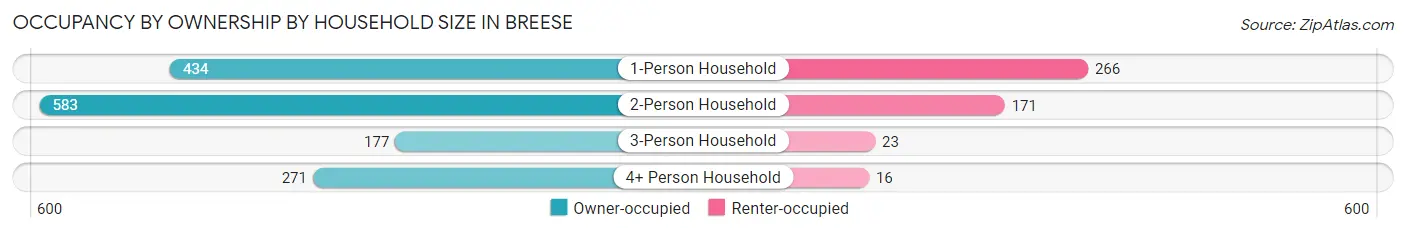
| Household Size | Owner-occupied | Renter-occupied |
| 1-Person Household | 434 (62.0%) | 266 (38.0%) |
| 2-Person Household | 583 (77.3%) | 171 (22.7%) |
| 3-Person Household | 177 (88.5%) | 23 (11.5%) |
| 4+ Person Household | 271 (94.4%) | 16 (5.6%) |
| Total Housing Units | 1,465 (75.5%) | 476 (24.5%) |
Occupancy by Educational Attainment in Breese
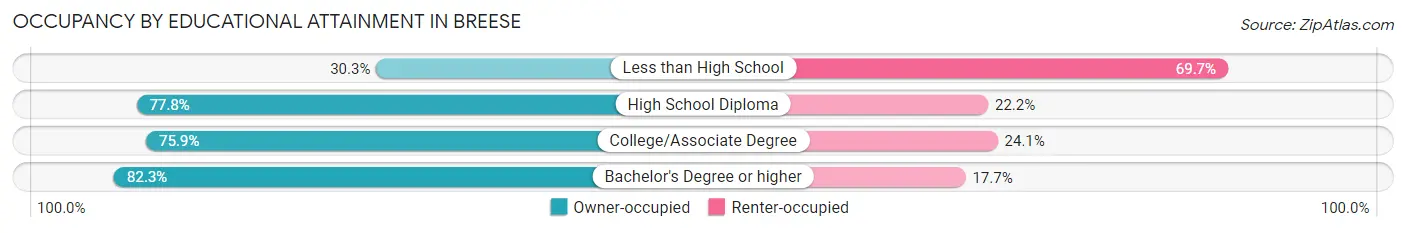
| Household Size | Owner-occupied | Renter-occupied |
| Less than High School | 33 (30.3%) | 76 (69.7%) |
| High School Diploma | 386 (77.8%) | 110 (22.2%) |
| College/Associate Degree | 637 (75.9%) | 202 (24.1%) |
| Bachelor's Degree or higher | 409 (82.3%) | 88 (17.7%) |
Occupancy by Age of Householder in Breese
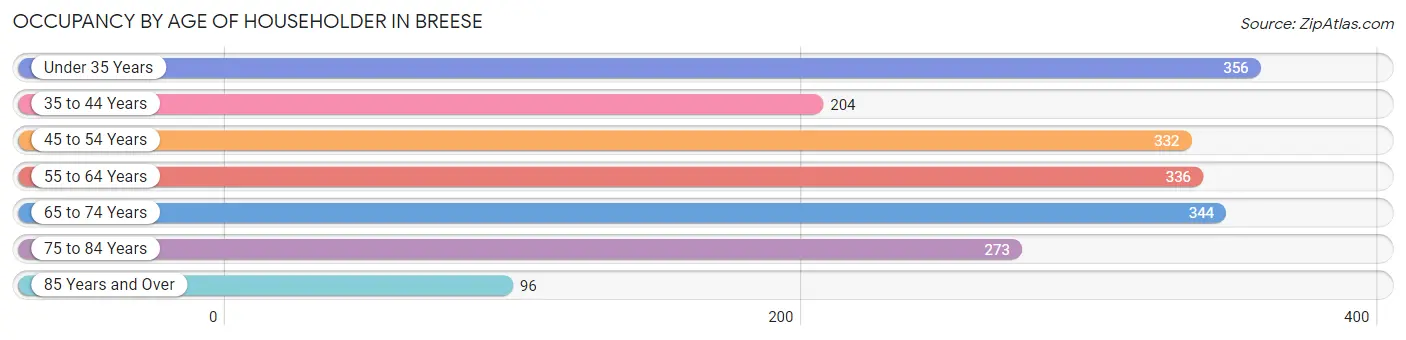
| Age Bracket | # Households | % Households |
| Under 35 Years | 356 | 18.3% |
| 35 to 44 Years | 204 | 10.5% |
| 45 to 54 Years | 332 | 17.1% |
| 55 to 64 Years | 336 | 17.3% |
| 65 to 74 Years | 344 | 17.7% |
| 75 to 84 Years | 273 | 14.1% |
| 85 Years and Over | 96 | 5.0% |
| Total | 1,941 | 100.0% |
Housing Finances in Breese
Median Income by Occupancy in Breese
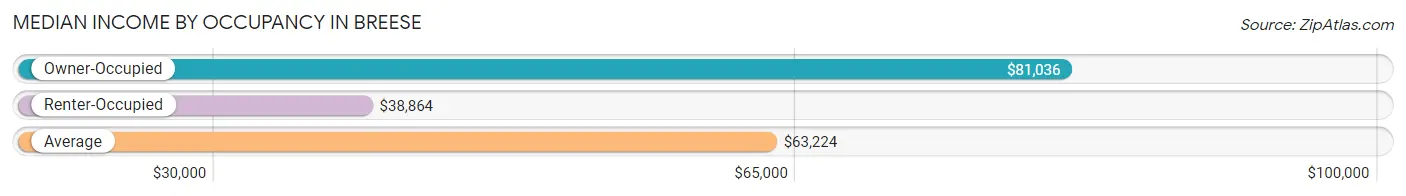
| Occupancy Type | # Households | Median Income |
| Owner-Occupied | 1,465 (75.5%) | $81,036 |
| Renter-Occupied | 476 (24.5%) | $38,864 |
| Average | 1,941 (100.0%) | $63,224 |
Occupancy by Householder Income Bracket in Breese
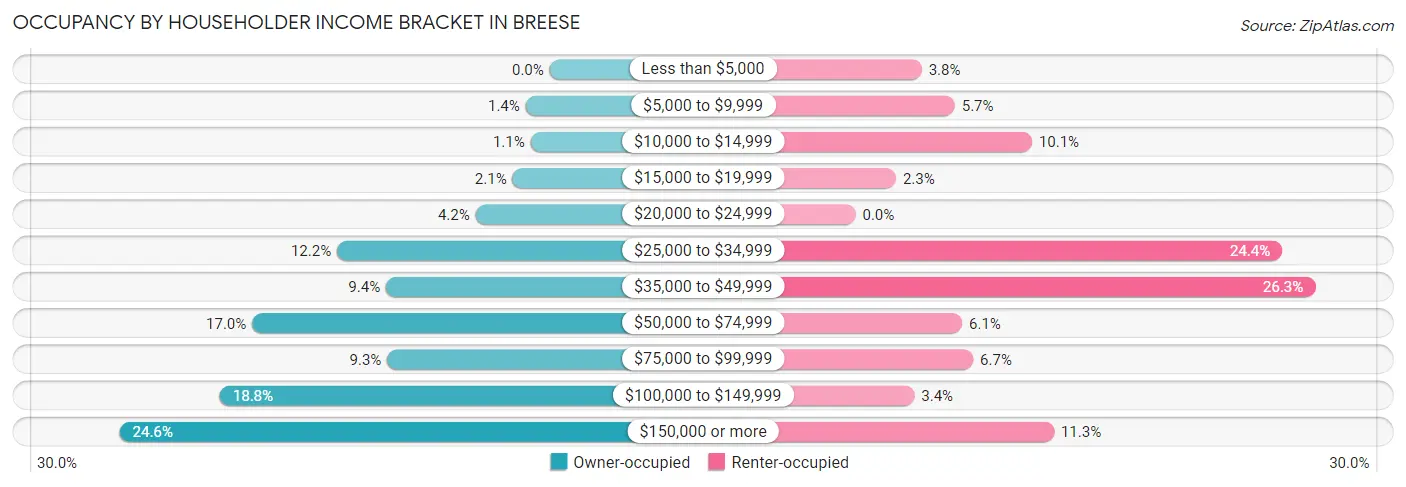
| Income Bracket | Owner-occupied | Renter-occupied |
| Less than $5,000 | 0 (0.0%) | 18 (3.8%) |
| $5,000 to $9,999 | 20 (1.4%) | 27 (5.7%) |
| $10,000 to $14,999 | 16 (1.1%) | 48 (10.1%) |
| $15,000 to $19,999 | 31 (2.1%) | 11 (2.3%) |
| $20,000 to $24,999 | 62 (4.2%) | 0 (0.0%) |
| $25,000 to $34,999 | 178 (12.1%) | 116 (24.4%) |
| $35,000 to $49,999 | 137 (9.3%) | 125 (26.3%) |
| $50,000 to $74,999 | 249 (17.0%) | 29 (6.1%) |
| $75,000 to $99,999 | 136 (9.3%) | 32 (6.7%) |
| $100,000 to $149,999 | 276 (18.8%) | 16 (3.4%) |
| $150,000 or more | 360 (24.6%) | 54 (11.3%) |
| Total | 1,465 (100.0%) | 476 (100.0%) |
Monthly Housing Cost Tiers in Breese
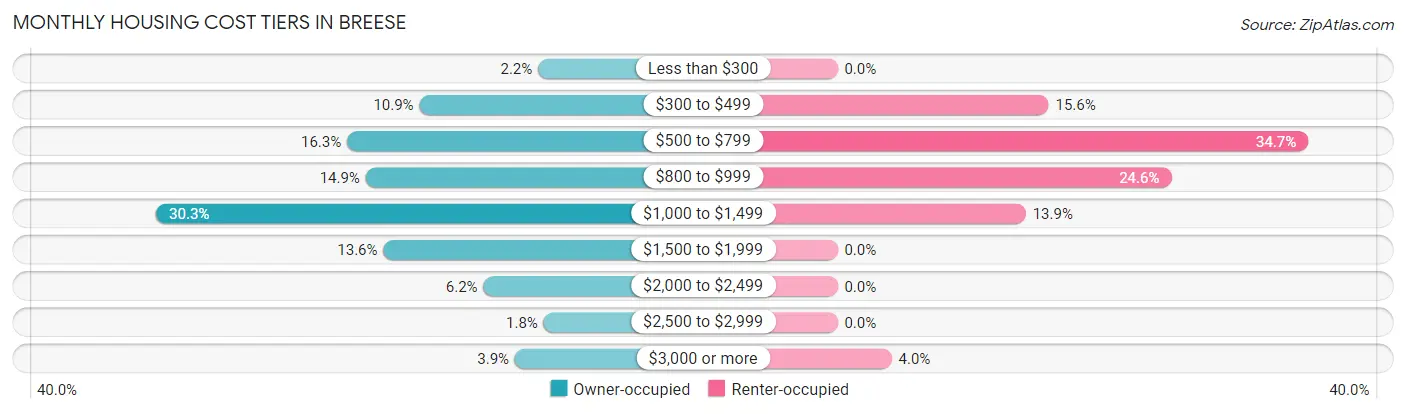
| Monthly Cost | Owner-occupied | Renter-occupied |
| Less than $300 | 32 (2.2%) | 0 (0.0%) |
| $300 to $499 | 160 (10.9%) | 74 (15.5%) |
| $500 to $799 | 238 (16.3%) | 165 (34.7%) |
| $800 to $999 | 218 (14.9%) | 117 (24.6%) |
| $1,000 to $1,499 | 444 (30.3%) | 66 (13.9%) |
| $1,500 to $1,999 | 199 (13.6%) | 0 (0.0%) |
| $2,000 to $2,499 | 91 (6.2%) | 0 (0.0%) |
| $2,500 to $2,999 | 26 (1.8%) | 0 (0.0%) |
| $3,000 or more | 57 (3.9%) | 19 (4.0%) |
| Total | 1,465 (100.0%) | 476 (100.0%) |
Physical Housing Characteristics in Breese
Housing Structures in Breese
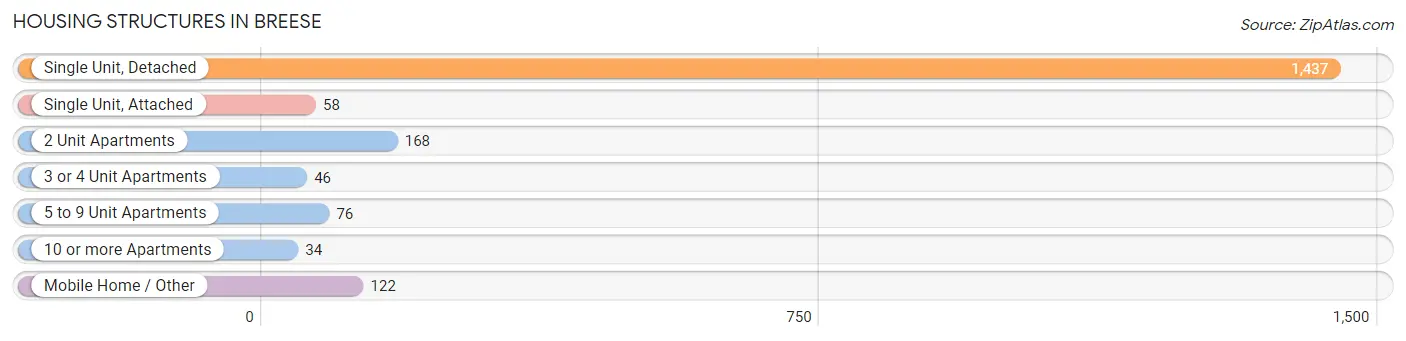
| Structure Type | # Housing Units | % Housing Units |
| Single Unit, Detached | 1,437 | 74.0% |
| Single Unit, Attached | 58 | 3.0% |
| 2 Unit Apartments | 168 | 8.7% |
| 3 or 4 Unit Apartments | 46 | 2.4% |
| 5 to 9 Unit Apartments | 76 | 3.9% |
| 10 or more Apartments | 34 | 1.8% |
| Mobile Home / Other | 122 | 6.3% |
| Total | 1,941 | 100.0% |
Housing Structures by Occupancy in Breese
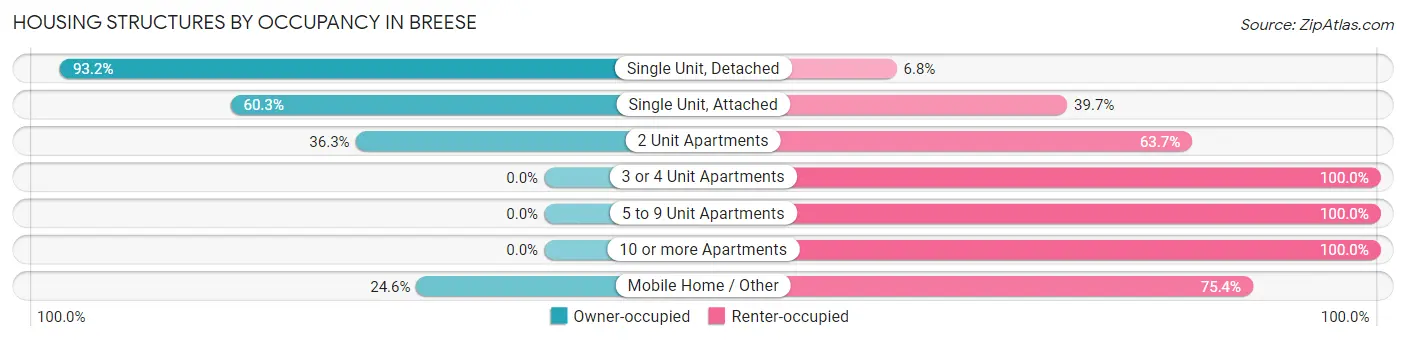
| Structure Type | Owner-occupied | Renter-occupied |
| Single Unit, Detached | 1,339 (93.2%) | 98 (6.8%) |
| Single Unit, Attached | 35 (60.3%) | 23 (39.7%) |
| 2 Unit Apartments | 61 (36.3%) | 107 (63.7%) |
| 3 or 4 Unit Apartments | 0 (0.0%) | 46 (100.0%) |
| 5 to 9 Unit Apartments | 0 (0.0%) | 76 (100.0%) |
| 10 or more Apartments | 0 (0.0%) | 34 (100.0%) |
| Mobile Home / Other | 30 (24.6%) | 92 (75.4%) |
| Total | 1,465 (75.5%) | 476 (24.5%) |
Housing Structures by Number of Rooms in Breese
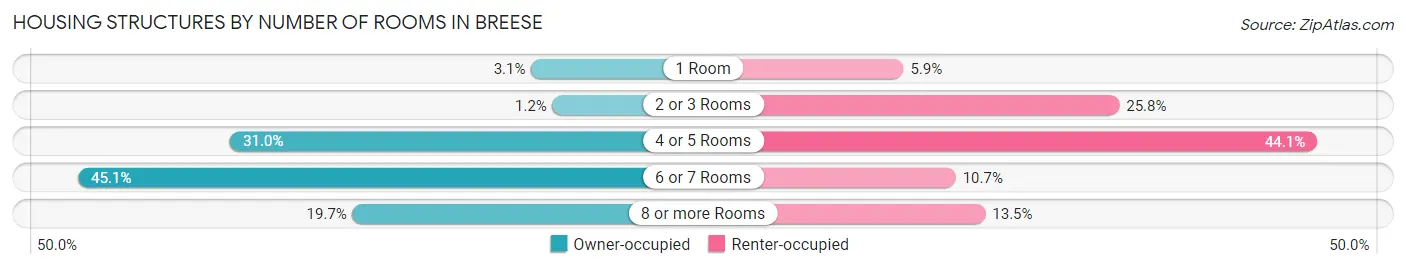
| Number of Rooms | Owner-occupied | Renter-occupied |
| 1 Room | 46 (3.1%) | 28 (5.9%) |
| 2 or 3 Rooms | 17 (1.2%) | 123 (25.8%) |
| 4 or 5 Rooms | 454 (31.0%) | 210 (44.1%) |
| 6 or 7 Rooms | 660 (45.1%) | 51 (10.7%) |
| 8 or more Rooms | 288 (19.7%) | 64 (13.5%) |
| Total | 1,465 (100.0%) | 476 (100.0%) |
Housing Structure by Heating Type in Breese
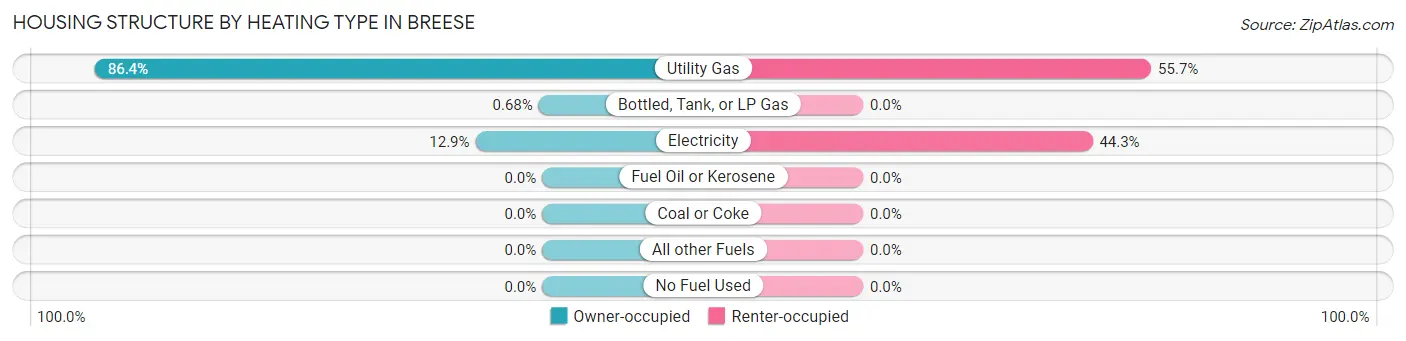
| Heating Type | Owner-occupied | Renter-occupied |
| Utility Gas | 1,266 (86.4%) | 265 (55.7%) |
| Bottled, Tank, or LP Gas | 10 (0.7%) | 0 (0.0%) |
| Electricity | 189 (12.9%) | 211 (44.3%) |
| Fuel Oil or Kerosene | 0 (0.0%) | 0 (0.0%) |
| Coal or Coke | 0 (0.0%) | 0 (0.0%) |
| All other Fuels | 0 (0.0%) | 0 (0.0%) |
| No Fuel Used | 0 (0.0%) | 0 (0.0%) |
| Total | 1,465 (100.0%) | 476 (100.0%) |
Household Vehicle Usage in Breese
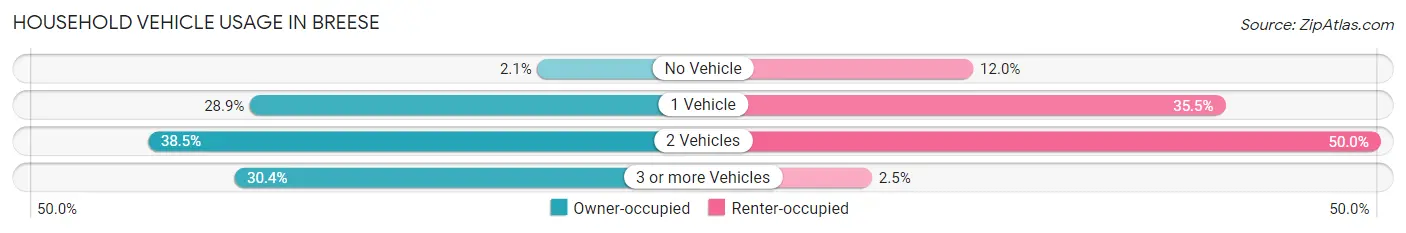
| Vehicles per Household | Owner-occupied | Renter-occupied |
| No Vehicle | 31 (2.1%) | 57 (12.0%) |
| 1 Vehicle | 424 (28.9%) | 169 (35.5%) |
| 2 Vehicles | 564 (38.5%) | 238 (50.0%) |
| 3 or more Vehicles | 446 (30.4%) | 12 (2.5%) |
| Total | 1,465 (100.0%) | 476 (100.0%) |
Real Estate & Mortgages in Breese
Real Estate and Mortgage Overview in Breese
| Characteristic | Without Mortgage | With Mortgage |
| Housing Units | 507 | 958 |
| Median Property Value | $178,900 | $179,700 |
| Median Household Income | $50,813 | $328 |
| Monthly Housing Costs | $581 | $57 |
| Real Estate Taxes | $3,401 | $34 |
Property Value by Mortgage Status in Breese
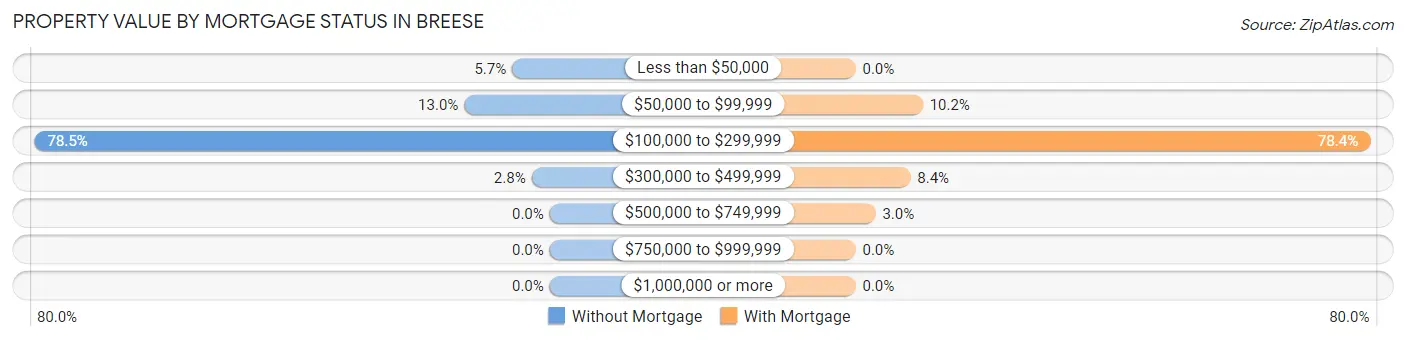
| Property Value | Without Mortgage | With Mortgage |
| Less than $50,000 | 29 (5.7%) | 0 (0.0%) |
| $50,000 to $99,999 | 66 (13.0%) | 98 (10.2%) |
| $100,000 to $299,999 | 398 (78.5%) | 751 (78.4%) |
| $300,000 to $499,999 | 14 (2.8%) | 80 (8.4%) |
| $500,000 to $749,999 | 0 (0.0%) | 29 (3.0%) |
| $750,000 to $999,999 | 0 (0.0%) | 0 (0.0%) |
| $1,000,000 or more | 0 (0.0%) | 0 (0.0%) |
| Total | 507 (100.0%) | 958 (100.0%) |
Household Income by Mortgage Status in Breese
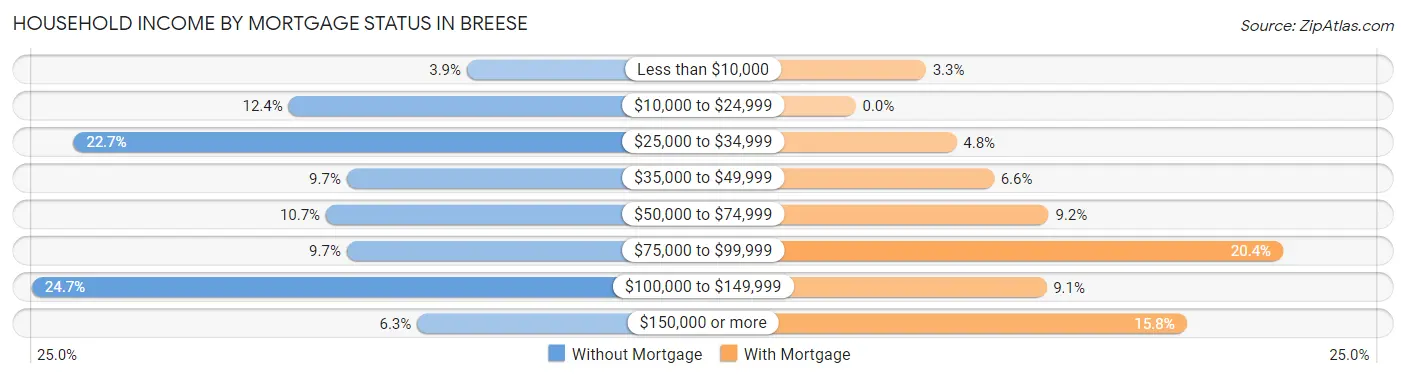
| Household Income | Without Mortgage | With Mortgage |
| Less than $10,000 | 20 (3.9%) | 32 (3.3%) |
| $10,000 to $24,999 | 63 (12.4%) | 0 (0.0%) |
| $25,000 to $34,999 | 115 (22.7%) | 46 (4.8%) |
| $35,000 to $49,999 | 49 (9.7%) | 63 (6.6%) |
| $50,000 to $74,999 | 54 (10.6%) | 88 (9.2%) |
| $75,000 to $99,999 | 49 (9.7%) | 195 (20.3%) |
| $100,000 to $149,999 | 125 (24.6%) | 87 (9.1%) |
| $150,000 or more | 32 (6.3%) | 151 (15.8%) |
| Total | 507 (100.0%) | 958 (100.0%) |
Property Value to Household Income Ratio in Breese
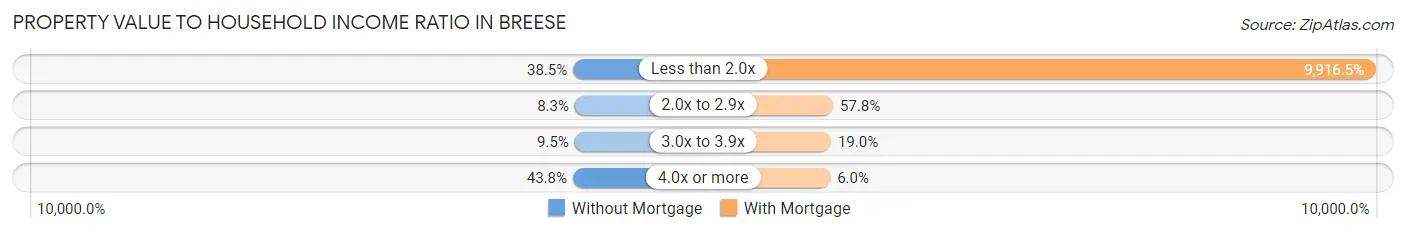
| Value-to-Income Ratio | Without Mortgage | With Mortgage |
| Less than 2.0x | 195 (38.5%) | 95,000 (9,916.5%) |
| 2.0x to 2.9x | 42 (8.3%) | 554 (57.8%) |
| 3.0x to 3.9x | 48 (9.5%) | 182 (19.0%) |
| 4.0x or more | 222 (43.8%) | 57 (5.9%) |
| Total | 507 (100.0%) | 958 (100.0%) |
Real Estate Taxes by Mortgage Status in Breese
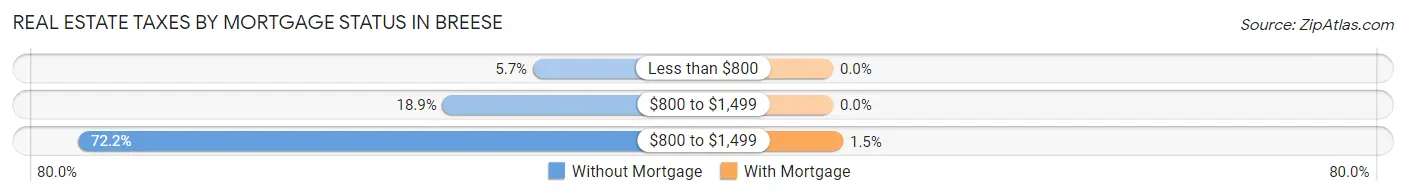
| Property Taxes | Without Mortgage | With Mortgage |
| Less than $800 | 29 (5.7%) | 0 (0.0%) |
| $800 to $1,499 | 96 (18.9%) | 0 (0.0%) |
| $800 to $1,499 | 366 (72.2%) | 14 (1.5%) |
| Total | 507 (100.0%) | 958 (100.0%) |
Health & Disability in Breese
Health Insurance Coverage by Age in Breese
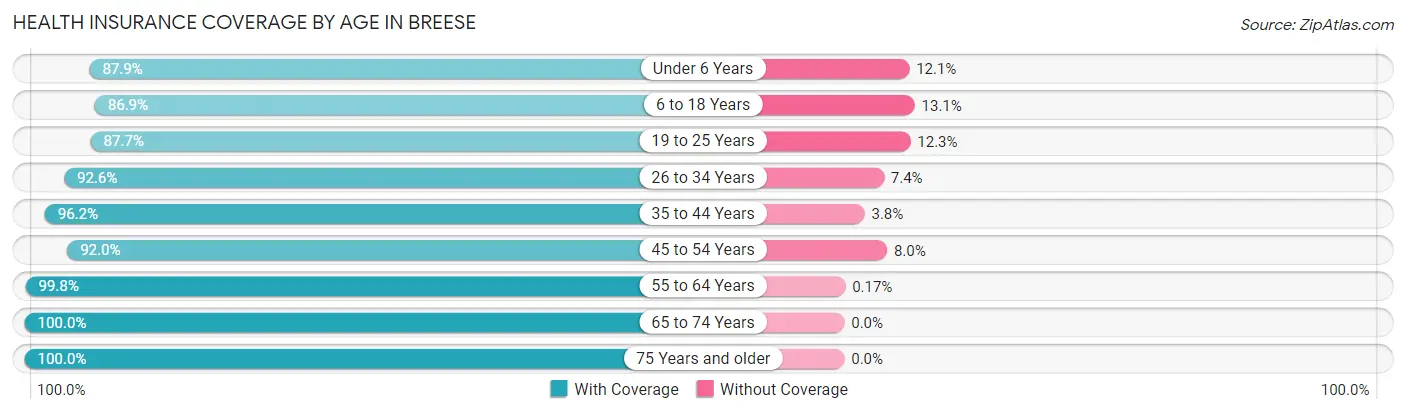
| Age Bracket | With Coverage | Without Coverage |
| Under 6 Years | 356 (87.9%) | 49 (12.1%) |
| 6 to 18 Years | 371 (86.9%) | 56 (13.1%) |
| 19 to 25 Years | 427 (87.7%) | 60 (12.3%) |
| 26 to 34 Years | 415 (92.6%) | 33 (7.4%) |
| 35 to 44 Years | 511 (96.2%) | 20 (3.8%) |
| 45 to 54 Years | 497 (92.0%) | 43 (8.0%) |
| 55 to 64 Years | 572 (99.8%) | 1 (0.2%) |
| 65 to 74 Years | 480 (100.0%) | 0 (0.0%) |
| 75 Years and older | 420 (100.0%) | 0 (0.0%) |
| Total | 4,049 (93.9%) | 262 (6.1%) |
Health Insurance Coverage by Citizenship Status in Breese
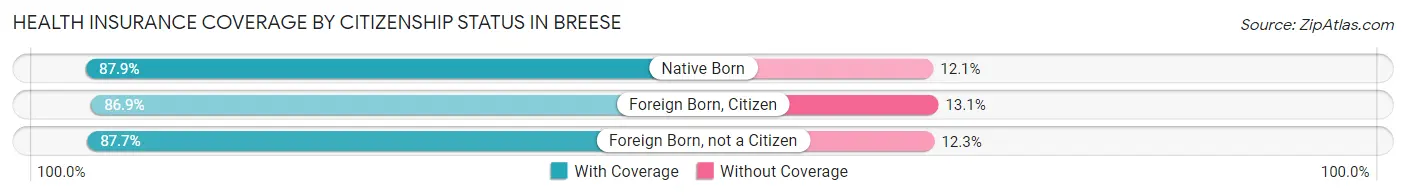
| Citizenship Status | With Coverage | Without Coverage |
| Native Born | 356 (87.9%) | 49 (12.1%) |
| Foreign Born, Citizen | 371 (86.9%) | 56 (13.1%) |
| Foreign Born, not a Citizen | 427 (87.7%) | 60 (12.3%) |
Health Insurance Coverage by Household Income in Breese
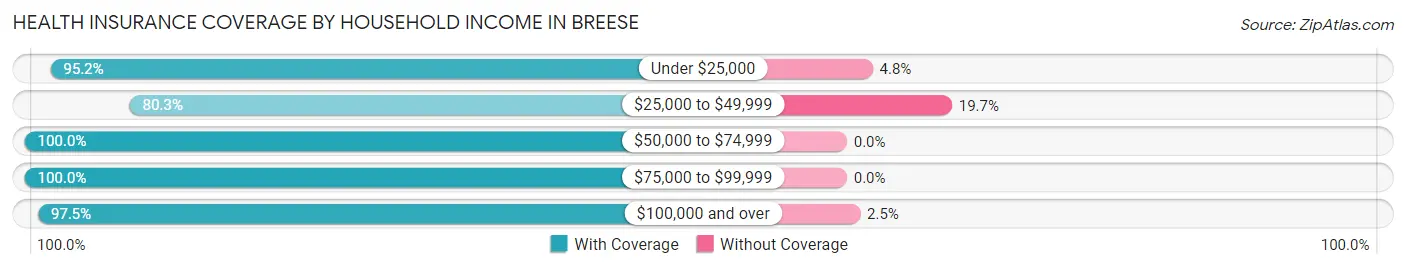
| Household Income | With Coverage | Without Coverage |
| Under $25,000 | 256 (95.2%) | 13 (4.8%) |
| $25,000 to $49,999 | 788 (80.3%) | 193 (19.7%) |
| $50,000 to $74,999 | 532 (100.0%) | 0 (0.0%) |
| $75,000 to $99,999 | 298 (100.0%) | 0 (0.0%) |
| $100,000 and over | 2,158 (97.5%) | 55 (2.5%) |
Public vs Private Health Insurance Coverage by Age in Breese
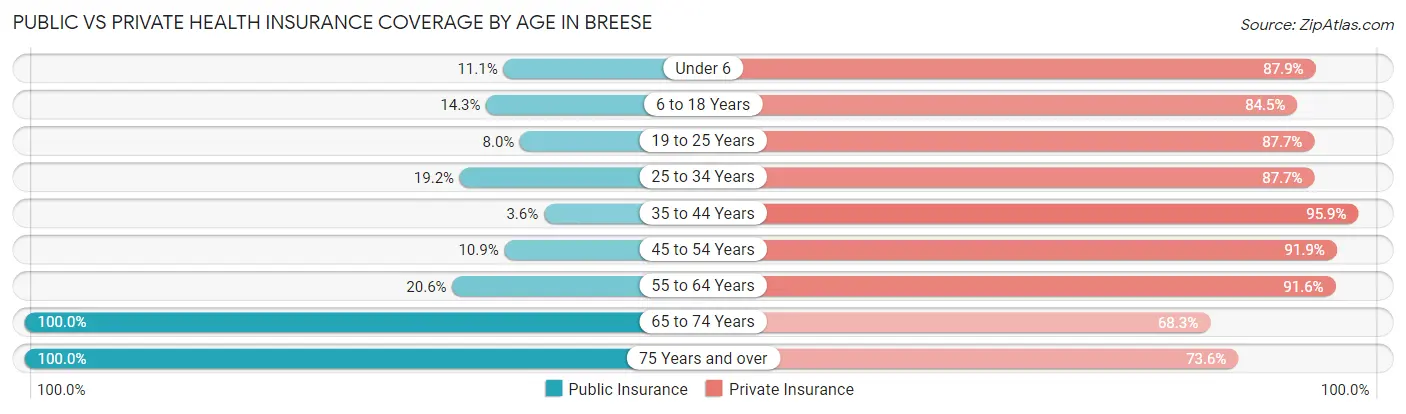
| Age Bracket | Public Insurance | Private Insurance |
| Under 6 | 45 (11.1%) | 356 (87.9%) |
| 6 to 18 Years | 61 (14.3%) | 361 (84.5%) |
| 19 to 25 Years | 39 (8.0%) | 427 (87.7%) |
| 25 to 34 Years | 86 (19.2%) | 393 (87.7%) |
| 35 to 44 Years | 19 (3.6%) | 509 (95.9%) |
| 45 to 54 Years | 59 (10.9%) | 496 (91.8%) |
| 55 to 64 Years | 118 (20.6%) | 525 (91.6%) |
| 65 to 74 Years | 480 (100.0%) | 328 (68.3%) |
| 75 Years and over | 420 (100.0%) | 309 (73.6%) |
| Total | 1,327 (30.8%) | 3,704 (85.9%) |
Disability Status by Sex by Age in Breese
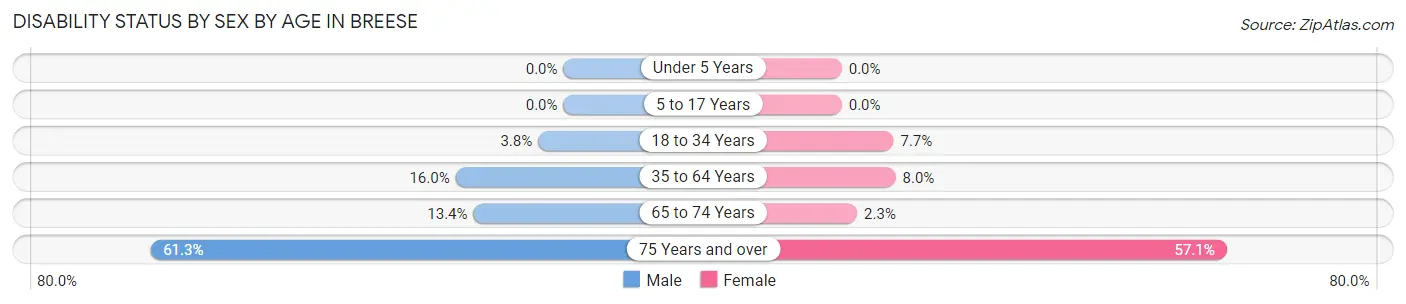
| Age Bracket | Male | Female |
| Under 5 Years | 0 (0.0%) | 0 (0.0%) |
| 5 to 17 Years | 0 (0.0%) | 0 (0.0%) |
| 18 to 34 Years | 16 (3.7%) | 39 (7.7%) |
| 35 to 64 Years | 129 (16.0%) | 67 (8.0%) |
| 65 to 74 Years | 29 (13.4%) | 6 (2.3%) |
| 75 Years and over | 73 (61.3%) | 172 (57.1%) |
Disability Class by Sex by Age in Breese
Disability Class: Hearing Difficulty
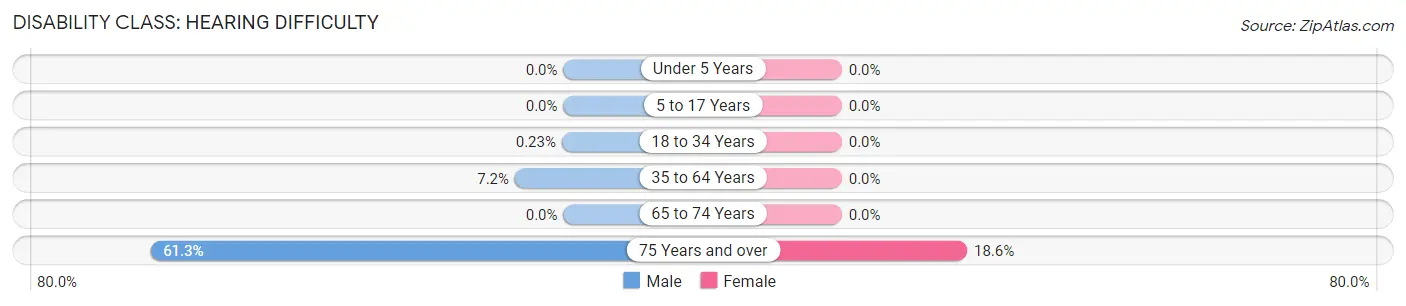
| Age Bracket | Male | Female |
| Under 5 Years | 0 (0.0%) | 0 (0.0%) |
| 5 to 17 Years | 0 (0.0%) | 0 (0.0%) |
| 18 to 34 Years | 1 (0.2%) | 0 (0.0%) |
| 35 to 64 Years | 58 (7.2%) | 0 (0.0%) |
| 65 to 74 Years | 0 (0.0%) | 0 (0.0%) |
| 75 Years and over | 73 (61.3%) | 56 (18.6%) |
Disability Class: Vision Difficulty
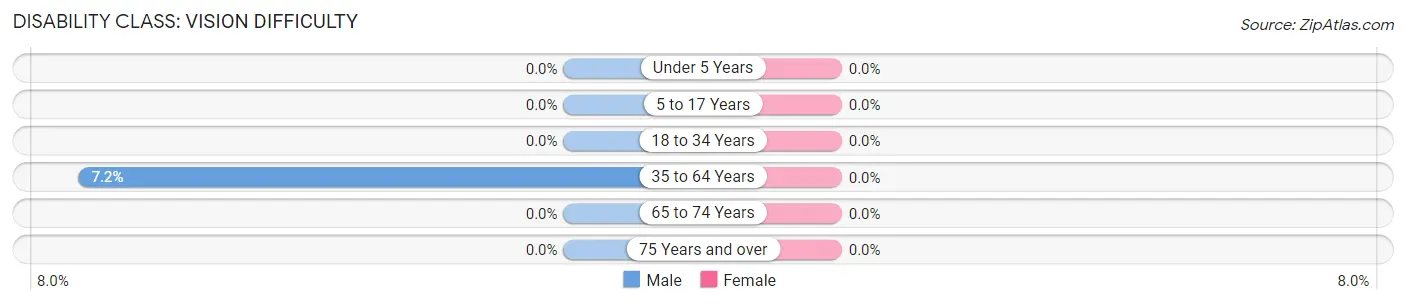
| Age Bracket | Male | Female |
| Under 5 Years | 0 (0.0%) | 0 (0.0%) |
| 5 to 17 Years | 0 (0.0%) | 0 (0.0%) |
| 18 to 34 Years | 0 (0.0%) | 0 (0.0%) |
| 35 to 64 Years | 58 (7.2%) | 0 (0.0%) |
| 65 to 74 Years | 0 (0.0%) | 0 (0.0%) |
| 75 Years and over | 0 (0.0%) | 0 (0.0%) |
Disability Class: Cognitive Difficulty
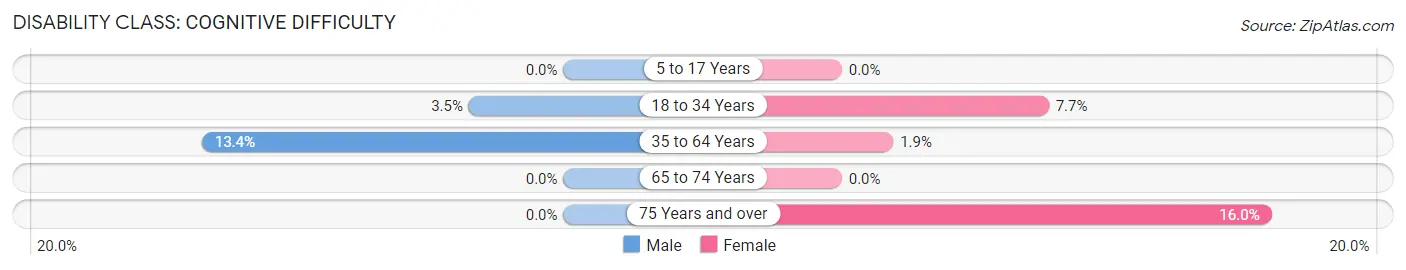
| Age Bracket | Male | Female |
| 5 to 17 Years | 0 (0.0%) | 0 (0.0%) |
| 18 to 34 Years | 15 (3.5%) | 39 (7.7%) |
| 35 to 64 Years | 108 (13.4%) | 16 (1.9%) |
| 65 to 74 Years | 0 (0.0%) | 0 (0.0%) |
| 75 Years and over | 0 (0.0%) | 48 (16.0%) |
Disability Class: Ambulatory Difficulty
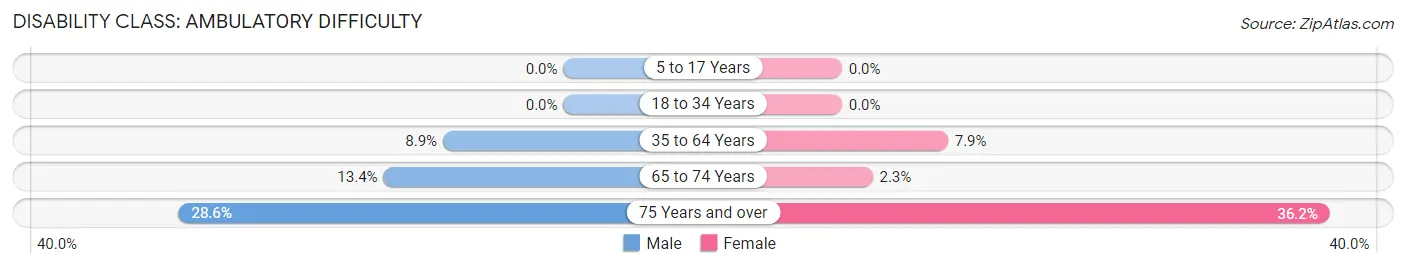
| Age Bracket | Male | Female |
| 5 to 17 Years | 0 (0.0%) | 0 (0.0%) |
| 18 to 34 Years | 0 (0.0%) | 0 (0.0%) |
| 35 to 64 Years | 72 (8.9%) | 66 (7.9%) |
| 65 to 74 Years | 29 (13.4%) | 6 (2.3%) |
| 75 Years and over | 34 (28.6%) | 109 (36.2%) |
Disability Class: Self-Care Difficulty
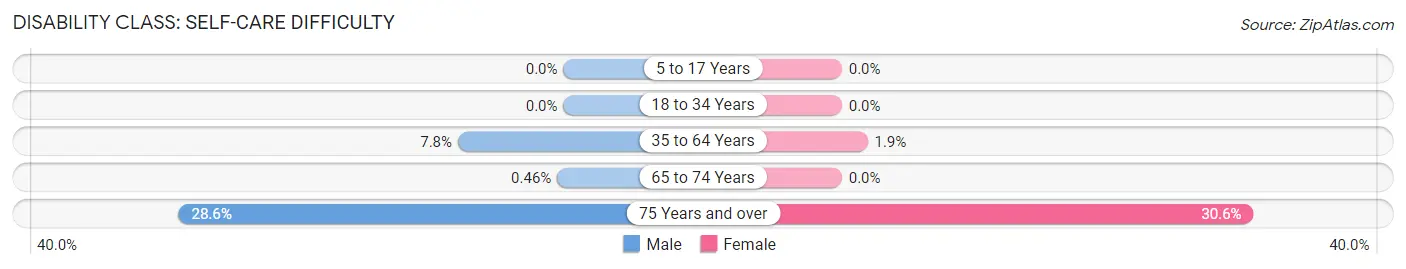
| Age Bracket | Male | Female |
| 5 to 17 Years | 0 (0.0%) | 0 (0.0%) |
| 18 to 34 Years | 0 (0.0%) | 0 (0.0%) |
| 35 to 64 Years | 63 (7.8%) | 16 (1.9%) |
| 65 to 74 Years | 1 (0.5%) | 0 (0.0%) |
| 75 Years and over | 34 (28.6%) | 92 (30.6%) |
Technology Access in Breese
Computing Device Access in Breese
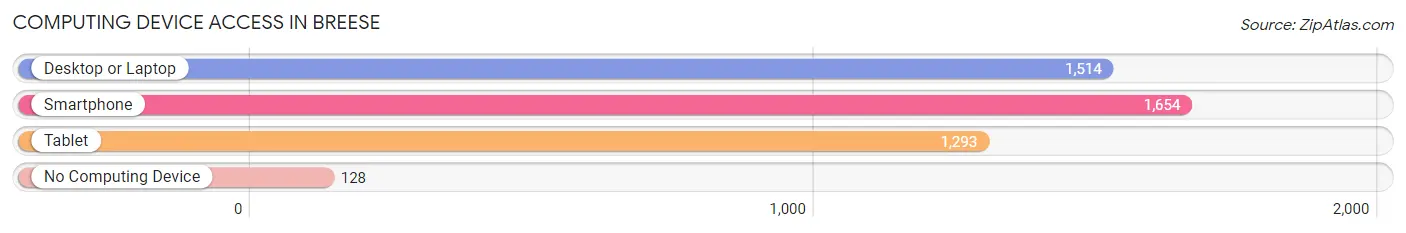
| Device Type | # Households | % Households |
| Desktop or Laptop | 1,514 | 78.0% |
| Smartphone | 1,654 | 85.2% |
| Tablet | 1,293 | 66.6% |
| No Computing Device | 128 | 6.6% |
| Total | 1,941 | 100.0% |
Internet Access in Breese
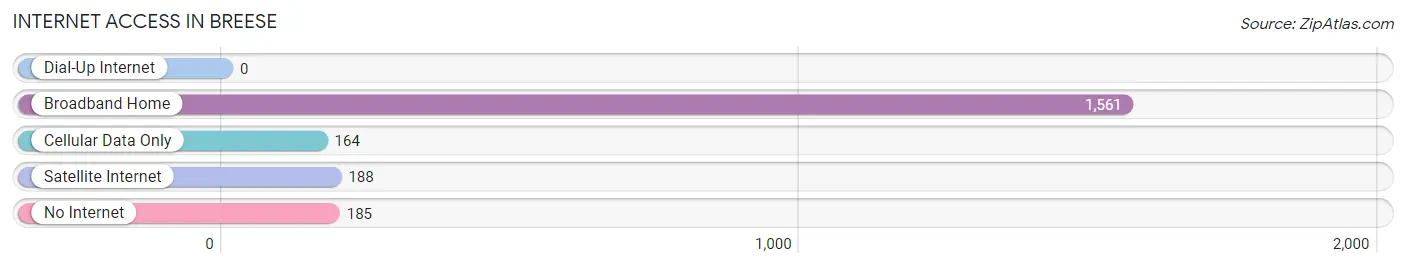
| Internet Type | # Households | % Households |
| Dial-Up Internet | 0 | 0.0% |
| Broadband Home | 1,561 | 80.4% |
| Cellular Data Only | 164 | 8.5% |
| Satellite Internet | 188 | 9.7% |
| No Internet | 185 | 9.5% |
| Total | 1,941 | 100.0% |
Breese Summary
History
Breese, Illinois is a small city located in Clinton County, Illinois. It is situated about 40 miles east of St. Louis, Missouri and is part of the Metro East region. The city was founded in 1855 by German immigrants who were looking for a place to settle and start a new life. The city was named after John Breese, a prominent local businessman and politician.
The city of Breese has a rich history that dates back to the early 1800s. The first settlers in the area were Native Americans, who were followed by French and German immigrants. The first permanent settlers in the area were German immigrants who arrived in 1855. They established a small village and named it after John Breese.
The city of Breese was officially incorporated in 1867. During the late 1800s and early 1900s, the city experienced a period of growth and prosperity. The city was home to several businesses, including a brewery, a flour mill, a brickyard, and a furniture factory. The city also had a thriving agricultural industry, with many farmers growing corn, wheat, and other crops.
In the early 1900s, the city of Breese experienced a period of decline. The Great Depression and World War II caused many businesses to close and the population to decrease. However, the city was able to recover and experienced a period of growth in the 1950s and 1960s. During this time, the city was home to several new businesses, including a canning factory, a furniture factory, and a plastics factory.
Geography
Breese is located in the Metro East region of Illinois, about 40 miles east of St. Louis, Missouri. The city is situated in the northern part of Clinton County, near the Kaskaskia River. The city has a total area of 2.2 square miles, all of which is land.
The city of Breese is located in a flat, open area of the Midwest. The terrain is mostly flat, with some rolling hills in the area. The climate in Breese is humid continental, with hot, humid summers and cold, snowy winters.
Economy
The economy of Breese is largely based on agriculture and manufacturing. The city is home to several large agricultural operations, including a dairy farm, a hog farm, and a grain elevator. The city also has several manufacturing businesses, including a plastics factory, a furniture factory, and a canning factory.
The city of Breese also has a thriving retail sector. The city is home to several small businesses, including restaurants, shops, and other services. The city also has a large number of antique stores, which attract visitors from all over the region.
Demographics
As of the 2010 census, the city of Breese had a population of 4,077. The racial makeup of the city was 97.2% White, 0.7% African American, 0.2% Native American, 0.3% Asian, 0.1% Pacific Islander, 0.7% from other races, and 0.9% from two or more races. Hispanic or Latino of any race were 1.7% of the population.
The median income for a household in Breese was $45,938, and the median income for a family was $54,844. The per capita income for the city was $20,945. About 8.2% of families and 10.2% of the population were below the poverty line, including 14.2% of those under age 18 and 6.2% of those age 65 or over.
Common Questions
What is Per Capita Income in Breese?
Per Capita income in Breese is $56,830.
What is the Median Family Income in Breese?
Median Family Income in Breese is $111,641.
What is the Median Household income in Breese?
Median Household Income in Breese is $63,224.
What is Income or Wage Gap in Breese?
Income or Wage Gap in Breese is 27.3%.
Women in Breese earn 72.7 cents for every dollar earned by a man.
What is Inequality or Gini Index in Breese?
Inequality or Gini Index in Breese is 0.57.
What is the Total Population of Breese?
Total Population of Breese is 4,376.
What is the Total Male Population of Breese?
Total Male Population of Breese is 2,102.
What is the Total Female Population of Breese?
Total Female Population of Breese is 2,274.
What is the Ratio of Males per 100 Females in Breese?
There are 92.44 Males per 100 Females in Breese.
What is the Ratio of Females per 100 Males in Breese?
There are 108.18 Females per 100 Males in Breese.
What is the Median Population Age in Breese?
Median Population Age in Breese is 43.2 Years.
What is the Average Family Size in Breese
Average Family Size in Breese is 2.9 People.
What is the Average Household Size in Breese
Average Household Size in Breese is 2.2 People.
How Large is the Labor Force in Breese?
There are 2,395 People in the Labor Forcein in Breese.
What is the Percentage of People in the Labor Force in Breese?
65.7% of People are in the Labor Force in Breese.
What is the Unemployment Rate in Breese?
Unemployment Rate in Breese is 3.7%.