Cities with the Highest Percentage of Korean Population in Illinois
RELATED REPORTS & OPTIONS
Korean
Illinois
Compare Cities
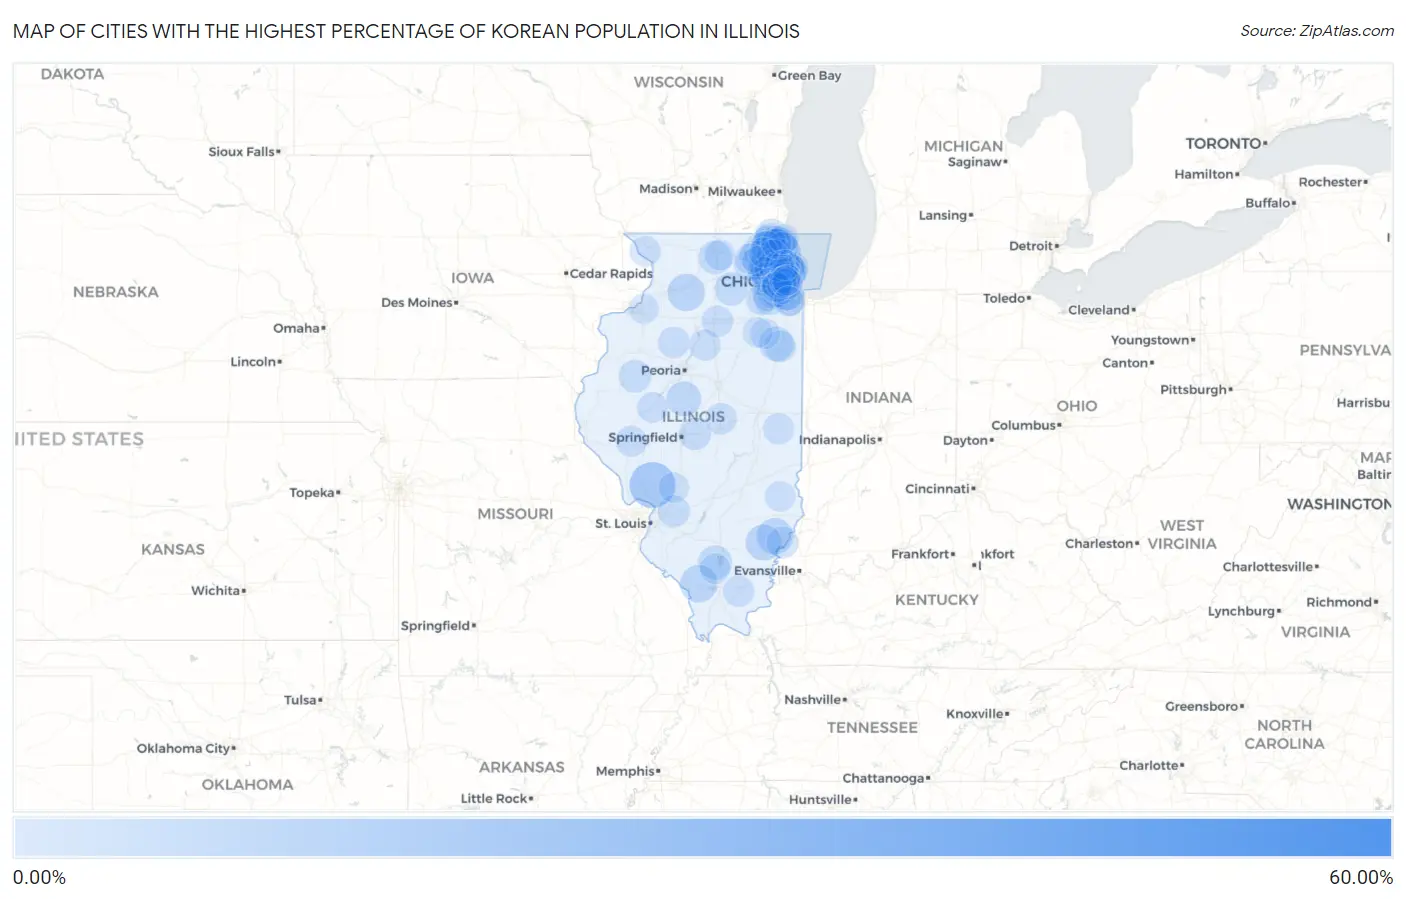
Map of Cities with the Highest Percentage of Korean Population in Illinois
0.00%
60.00%
Cities with the Highest Percentage of Korean Population in Illinois
| City | Korean | vs State | vs National | |
| 1. | Marley | 60.00% | 1.33%(+58.7)#1 | 1.31%(+58.7)#12 |
| 2. | Indian Creek | 20.63% | 1.33%(+19.3)#2 | 1.31%(+19.3)#123 |
| 3. | Fidelity | 17.33% | 1.33%(+16.0)#3 | 1.31%(+16.0)#145 |
| 4. | Harwood Heights | 9.34% | 1.33%(+8.01)#4 | 1.31%(+8.03)#292 |
| 5. | Harrison | 9.03% | 1.33%(+7.71)#5 | 1.31%(+7.72)#304 |
| 6. | Harmon | 8.97% | 1.33%(+7.65)#6 | 1.31%(+7.66)#306 |
| 7. | Niles | 8.36% | 1.33%(+7.03)#7 | 1.31%(+7.05)#336 |
| 8. | Skokie | 8.34% | 1.33%(+7.01)#8 | 1.31%(+7.03)#338 |
| 9. | Morton Grove | 8.11% | 1.33%(+6.78)#9 | 1.31%(+6.80)#353 |
| 10. | Bone Gap | 8.08% | 1.33%(+6.75)#10 | 1.31%(+6.77)#357 |
| 11. | Golden Gate | 7.78% | 1.33%(+6.45)#11 | 1.31%(+6.47)#384 |
| 12. | San Jose | 6.68% | 1.33%(+5.35)#12 | 1.31%(+5.37)#460 |
| 13. | Irwin | 6.38% | 1.33%(+5.05)#13 | 1.31%(+5.07)#489 |
| 14. | Glendale Heights | 5.99% | 1.33%(+4.66)#14 | 1.31%(+4.68)#535 |
| 15. | Sesser | 5.97% | 1.33%(+4.64)#15 | 1.31%(+4.66)#539 |
| 16. | Lincolnwood | 5.69% | 1.33%(+4.36)#16 | 1.31%(+4.38)#579 |
| 17. | Prairie Grove | 5.54% | 1.33%(+4.21)#17 | 1.31%(+4.23)#605 |
| 18. | New Milford | 5.50% | 1.33%(+4.17)#18 | 1.31%(+4.19)#615 |
| 19. | Itasca | 5.44% | 1.33%(+4.11)#19 | 1.31%(+4.13)#624 |
| 20. | Waterman | 5.43% | 1.33%(+4.10)#20 | 1.31%(+4.12)#625 |
| 21. | Round Lake | 5.39% | 1.33%(+4.06)#21 | 1.31%(+4.08)#631 |
| 22. | Norridge | 5.23% | 1.33%(+3.90)#22 | 1.31%(+3.92)#654 |
| 23. | Riverside | 5.00% | 1.33%(+3.67)#23 | 1.31%(+3.69)#700 |
| 24. | South Barrington | 4.86% | 1.33%(+3.53)#24 | 1.31%(+3.55)#726 |
| 25. | Romeoville | 4.83% | 1.33%(+3.50)#25 | 1.31%(+3.52)#731 |
| 26. | Prairie City | 4.58% | 1.33%(+3.26)#26 | 1.31%(+3.27)#780 |
| 27. | Streamwood | 4.58% | 1.33%(+3.25)#27 | 1.31%(+3.27)#781 |
| 28. | Franklin Park | 4.43% | 1.33%(+3.10)#28 | 1.31%(+3.12)#809 |
| 29. | Hoffman Estates | 4.39% | 1.33%(+3.07)#29 | 1.31%(+3.08)#815 |
| 30. | Antioch | 4.39% | 1.33%(+3.06)#30 | 1.31%(+3.08)#817 |
| 31. | Chicago Ridge | 4.32% | 1.33%(+2.99)#31 | 1.31%(+3.01)#832 |
| 32. | Buffalo | 4.28% | 1.33%(+2.95)#32 | 1.31%(+2.97)#842 |
| 33. | Des Plaines | 4.26% | 1.33%(+2.93)#33 | 1.31%(+2.95)#850 |
| 34. | Gurnee | 4.03% | 1.33%(+2.70)#34 | 1.31%(+2.72)#911 |
| 35. | Bolingbrook | 4.01% | 1.33%(+2.68)#35 | 1.31%(+2.70)#917 |
| 36. | Woodridge | 4.00% | 1.33%(+2.67)#36 | 1.31%(+2.69)#929 |
| 37. | Keensburg | 3.97% | 1.33%(+2.64)#37 | 1.31%(+2.66)#936 |
| 38. | Marine | 3.96% | 1.33%(+2.63)#38 | 1.31%(+2.65)#945 |
| 39. | Pingree Grove | 3.93% | 1.33%(+2.60)#39 | 1.31%(+2.62)#951 |
| 40. | Darien | 3.85% | 1.33%(+2.52)#40 | 1.31%(+2.54)#973 |
| 41. | Schiller Park | 3.85% | 1.33%(+2.52)#41 | 1.31%(+2.54)#974 |
| 42. | Chebanse | 3.82% | 1.33%(+2.50)#42 | 1.31%(+2.51)#982 |
| 43. | Round Lake Heights | 3.80% | 1.33%(+2.47)#43 | 1.31%(+2.49)#993 |
| 44. | Waukegan | 3.63% | 1.33%(+2.30)#44 | 1.31%(+2.32)#1,049 |
| 45. | Hainesville | 3.55% | 1.33%(+2.22)#45 | 1.31%(+2.24)#1,083 |
| 46. | Wyoming | 3.54% | 1.33%(+2.21)#46 | 1.31%(+2.23)#1,088 |
| 47. | North Utica | 3.52% | 1.33%(+2.19)#47 | 1.31%(+2.21)#1,098 |
| 48. | Bartlett | 3.47% | 1.33%(+2.14)#48 | 1.31%(+2.16)#1,118 |
| 49. | Lake In The Hills | 3.41% | 1.33%(+2.08)#49 | 1.31%(+2.10)#1,138 |
| 50. | Wheeling | 3.37% | 1.33%(+2.04)#50 | 1.31%(+2.06)#1,160 |
| 51. | Maroa | 3.31% | 1.33%(+1.98)#51 | 1.31%(+2.00)#1,183 |
| 52. | West Chicago | 3.31% | 1.33%(+1.98)#52 | 1.31%(+2.00)#1,189 |
| 53. | Hanover Park | 3.31% | 1.33%(+1.98)#53 | 1.31%(+2.00)#1,192 |
| 54. | Allerton | 3.28% | 1.33%(+1.95)#54 | 1.31%(+1.97)#1,204 |
| 55. | Elk Grove Village | 3.28% | 1.33%(+1.95)#55 | 1.31%(+1.97)#1,206 |
| 56. | Park Ridge | 3.23% | 1.33%(+1.90)#56 | 1.31%(+1.92)#1,221 |
| 57. | Carol Stream | 3.23% | 1.33%(+1.90)#57 | 1.31%(+1.92)#1,224 |
| 58. | Varna | 3.20% | 1.33%(+1.87)#58 | 1.31%(+1.89)#1,234 |
| 59. | Lake Villa | 3.18% | 1.33%(+1.85)#59 | 1.31%(+1.87)#1,239 |
| 60. | Rolling Meadows | 3.18% | 1.33%(+1.85)#60 | 1.31%(+1.87)#1,241 |
| 61. | Carrier Mills | 3.13% | 1.33%(+1.80)#61 | 1.31%(+1.82)#1,260 |
| 62. | Bluffs | 3.12% | 1.33%(+1.80)#62 | 1.31%(+1.82)#1,263 |
| 63. | Hanover | 3.06% | 1.33%(+1.73)#63 | 1.31%(+1.75)#1,300 |
| 64. | North Chicago | 3.03% | 1.33%(+1.70)#64 | 1.31%(+1.72)#1,317 |
| 65. | Midlothian | 3.01% | 1.33%(+1.69)#65 | 1.31%(+1.70)#1,321 |
| 66. | Schaumburg | 2.99% | 1.33%(+1.66)#66 | 1.31%(+1.68)#1,335 |
| 67. | Oak Brook | 2.99% | 1.33%(+1.66)#67 | 1.31%(+1.68)#1,336 |
| 68. | Grandwood Park | 2.88% | 1.33%(+1.55)#68 | 1.31%(+1.57)#1,415 |
| 69. | Cherry Valley | 2.81% | 1.33%(+1.48)#69 | 1.31%(+1.50)#1,449 |
| 70. | Vernon Hills | 2.80% | 1.33%(+1.47)#70 | 1.31%(+1.49)#1,455 |
| 71. | Worth | 2.78% | 1.33%(+1.45)#71 | 1.31%(+1.47)#1,467 |
| 72. | Bath | 2.78% | 1.33%(+1.45)#72 | 1.31%(+1.47)#1,472 |
| 73. | Oakbrook Terrace | 2.75% | 1.33%(+1.42)#73 | 1.31%(+1.44)#1,491 |
| 74. | Elmwood Park | 2.73% | 1.33%(+1.41)#74 | 1.31%(+1.42)#1,497 |
| 75. | Countryside | 2.66% | 1.33%(+1.33)#75 | 1.31%(+1.35)#1,543 |
| 76. | Volo | 2.64% | 1.33%(+1.31)#76 | 1.31%(+1.33)#1,562 |
| 77. | Plainfield | 2.61% | 1.33%(+1.29)#77 | 1.31%(+1.30)#1,576 |
| 78. | Forest Lake | 2.60% | 1.33%(+1.28)#78 | 1.31%(+1.29)#1,586 |
| 79. | Oblong | 2.60% | 1.33%(+1.27)#79 | 1.31%(+1.29)#1,587 |
| 80. | Rosemont | 2.59% | 1.33%(+1.26)#80 | 1.31%(+1.28)#1,595 |
| 81. | North City | 2.58% | 1.33%(+1.25)#81 | 1.31%(+1.27)#1,600 |
| 82. | Huntley | 2.55% | 1.33%(+1.22)#82 | 1.31%(+1.24)#1,618 |
| 83. | Carpentersville | 2.52% | 1.33%(+1.19)#83 | 1.31%(+1.21)#1,638 |
| 84. | Berwyn | 2.46% | 1.33%(+1.13)#84 | 1.31%(+1.15)#1,674 |
| 85. | Eagarville | 2.45% | 1.33%(+1.12)#85 | 1.31%(+1.14)#1,679 |
| 86. | Clarendon Hills | 2.43% | 1.33%(+1.10)#86 | 1.31%(+1.12)#1,696 |
| 87. | Mount Prospect | 2.41% | 1.33%(+1.08)#87 | 1.31%(+1.10)#1,704 |
| 88. | Gages Lake | 2.39% | 1.33%(+1.06)#88 | 1.31%(+1.08)#1,724 |
| 89. | Cleveland | 2.35% | 1.33%(+1.02)#89 | 1.31%(+1.04)#1,748 |
| 90. | Westchester | 2.34% | 1.33%(+1.01)#90 | 1.31%(+1.03)#1,758 |
| 91. | Westmont | 2.34% | 1.33%(+1.01)#91 | 1.31%(+1.03)#1,761 |
| 92. | Glenview | 2.30% | 1.33%(+0.976)#92 | 1.31%(+0.995)#1,788 |
| 93. | Essex | 2.30% | 1.33%(+0.975)#93 | 1.31%(+0.994)#1,790 |
| 94. | Gardner | 2.30% | 1.33%(+0.973)#94 | 1.31%(+0.992)#1,793 |
| 95. | Oak Park | 2.30% | 1.33%(+0.973)#95 | 1.31%(+0.992)#1,794 |
| 96. | Port Barrington | 2.25% | 1.33%(+0.919)#96 | 1.31%(+0.938)#1,841 |
| 97. | Arbury Hills | 2.23% | 1.33%(+0.901)#97 | 1.31%(+0.920)#1,862 |
| 98. | Forest Park | 2.22% | 1.33%(+0.895)#98 | 1.31%(+0.914)#1,873 |
| 99. | Oak Forest | 2.21% | 1.33%(+0.885)#99 | 1.31%(+0.903)#1,883 |
| 100. | Beach Park | 2.20% | 1.33%(+0.872)#100 | 1.31%(+0.891)#1,891 |
Common Questions
What are the Top 10 Cities with the Highest Percentage of Korean Population in Illinois?
Top 10 Cities with the Highest Percentage of Korean Population in Illinois are:
#1
20.63%
#2
17.33%
#3
9.34%
#4
9.03%
#5
8.97%
#6
8.36%
#7
8.34%
#8
8.11%
#9
8.08%
#10
7.78%
What city has the Highest Percentage of Korean Population in Illinois?
Indian Creek has the Highest Percentage of Korean Population in Illinois with 20.63%.
What is the Percentage of Korean Population in the State of Illinois?
Percentage of Korean Population in Illinois is 1.33%.
What is the Percentage of Korean Population in the United States?
Percentage of Korean Population in the United States is 1.31%.