Roscoe, IL Map & Demographics
Roscoe Map
Roscoe Overview
$42,283
PER CAPITA INCOME
$112,628
AVG FAMILY INCOME
$98,750
AVG HOUSEHOLD INCOME
38.2%
WAGE / INCOME GAP [ % ]
61.8¢/ $1
WAGE / INCOME GAP [ $ ]
0.40
INEQUALITY / GINI INDEX
11,134
TOTAL POPULATION
5,296
MALE POPULATION
5,838
FEMALE POPULATION
90.72
MALES / 100 FEMALES
110.23
FEMALES / 100 MALES
35.5
MEDIAN AGE
3.2
AVG FAMILY SIZE
2.8
AVG HOUSEHOLD SIZE
5,757
LABOR FORCE [ PEOPLE ]
71.1%
PERCENT IN LABOR FORCE
2.7%
UNEMPLOYMENT RATE
Roscoe Zip Codes
Roscoe Area Codes
Income in Roscoe
Income Overview in Roscoe
Per Capita Income in Roscoe is $42,283, while median incomes of families and households are $112,628 and $98,750 respectively.
| Characteristic | Number | Measure |
| Per Capita Income | 11,134 | $42,283 |
| Median Family Income | 3,157 | $112,628 |
| Mean Family Income | 3,157 | $127,956 |
| Median Household Income | 4,023 | $98,750 |
| Mean Household Income | 4,023 | $116,395 |
| Income Deficit | 3,157 | $0 |
| Wage / Income Gap (%) | 11,134 | 38.21% |
| Wage / Income Gap ($) | 11,134 | 61.79¢ per $1 |
| Gini / Inequality Index | 11,134 | 0.40 |
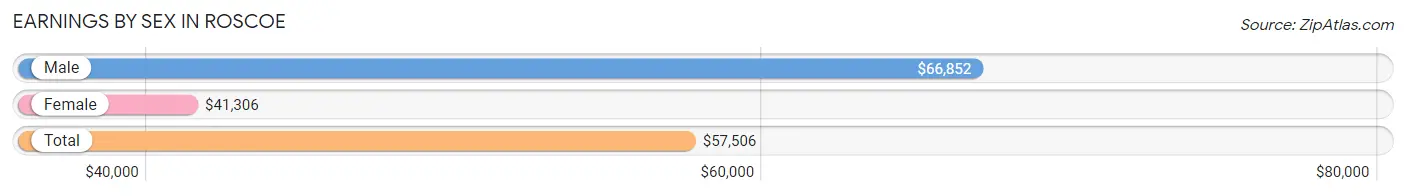
Earnings by Sex in Roscoe
Average Earnings in Roscoe are $57,506, $66,852 for men and $41,306 for women, a difference of 38.2%.
| Sex | Number | Average Earnings |
| Male | 3,286 (55.2%) | $66,852 |
| Female | 2,665 (44.8%) | $41,306 |
| Total | 5,951 (100.0%) | $57,506 |
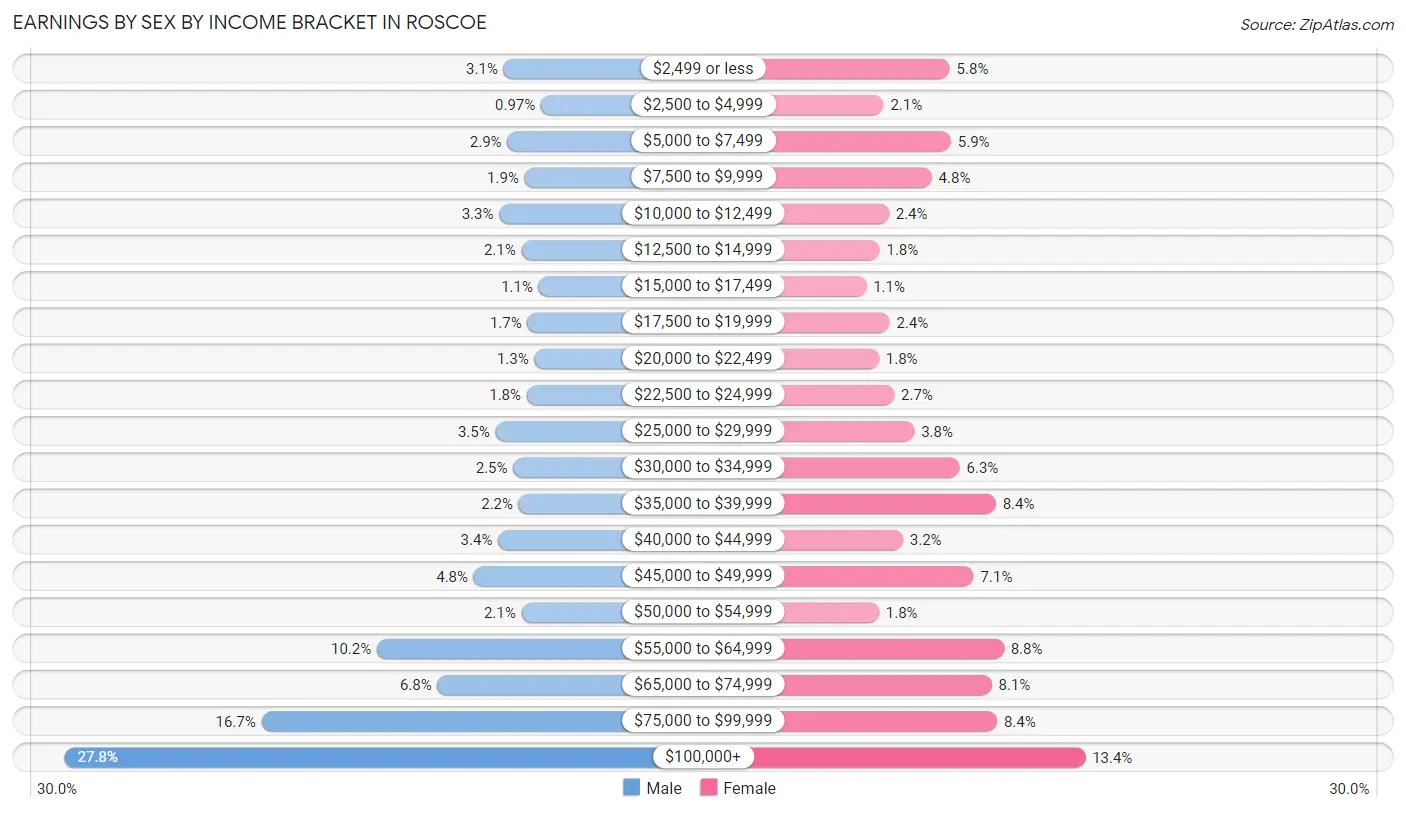
Earnings by Sex by Income Bracket in Roscoe
The most common earnings brackets in Roscoe are $100,000+ for men (912 | 27.8%) and $100,000+ for women (357 | 13.4%).
| Income | Male | Female |
| $2,499 or less | 101 (3.1%) | 154 (5.8%) |
| $2,500 to $4,999 | 32 (1.0%) | 55 (2.1%) |
| $5,000 to $7,499 | 94 (2.9%) | 156 (5.9%) |
| $7,500 to $9,999 | 62 (1.9%) | 127 (4.8%) |
| $10,000 to $12,499 | 109 (3.3%) | 63 (2.4%) |
| $12,500 to $14,999 | 68 (2.1%) | 49 (1.8%) |
| $15,000 to $17,499 | 36 (1.1%) | 29 (1.1%) |
| $17,500 to $19,999 | 57 (1.7%) | 64 (2.4%) |
| $20,000 to $22,499 | 44 (1.3%) | 48 (1.8%) |
| $22,500 to $24,999 | 58 (1.8%) | 71 (2.7%) |
| $25,000 to $29,999 | 116 (3.5%) | 101 (3.8%) |
| $30,000 to $34,999 | 83 (2.5%) | 169 (6.3%) |
| $35,000 to $39,999 | 73 (2.2%) | 223 (8.4%) |
| $40,000 to $44,999 | 111 (3.4%) | 84 (3.2%) |
| $45,000 to $49,999 | 156 (4.8%) | 190 (7.1%) |
| $50,000 to $54,999 | 68 (2.1%) | 48 (1.8%) |
| $55,000 to $64,999 | 335 (10.2%) | 235 (8.8%) |
| $65,000 to $74,999 | 223 (6.8%) | 217 (8.1%) |
| $75,000 to $99,999 | 548 (16.7%) | 225 (8.4%) |
| $100,000+ | 912 (27.8%) | 357 (13.4%) |
| Total | 3,286 (100.0%) | 2,665 (100.0%) |
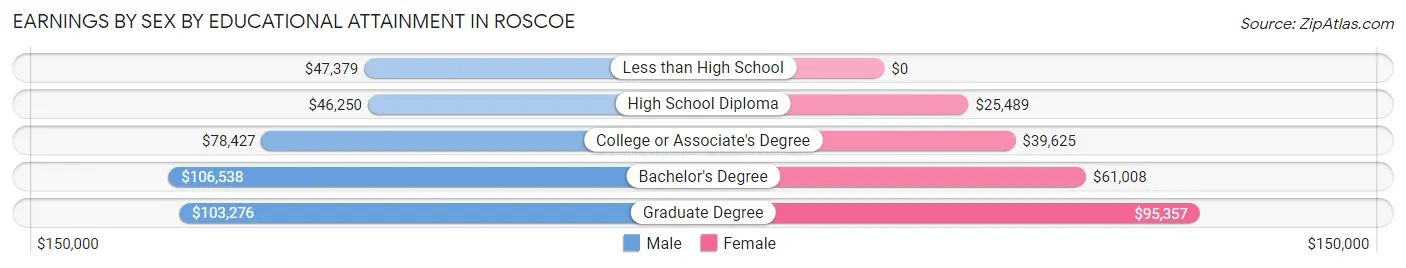
Earnings by Sex by Educational Attainment in Roscoe
Average earnings in Roscoe are $80,176 for men and $48,500 for women, a difference of 39.5%. Men with an educational attainment of bachelor's degree enjoy the highest average annual earnings of $106,538, while those with high school diploma education earn the least with $46,250. Women with an educational attainment of graduate degree earn the most with the average annual earnings of $95,357, while those with high school diploma education have the smallest earnings of $25,489.
| Educational Attainment | Male Income | Female Income |
| Less than High School | $47,379 | $0 |
| High School Diploma | $46,250 | $25,489 |
| College or Associate's Degree | $78,427 | $39,625 |
| Bachelor's Degree | $106,538 | $61,008 |
| Graduate Degree | $103,276 | $95,357 |
| Total | $80,176 | $48,500 |
Family Income in Roscoe
Family Income Brackets in Roscoe
According to the Roscoe family income data, there are 796 families falling into the $100,000 to $149,999 income range, which is the most common income bracket and makes up 25.2% of all families. Conversely, the $10,000 to $14,999 income bracket is the least frequent group with only 9 families (0.3%) belonging to this category.
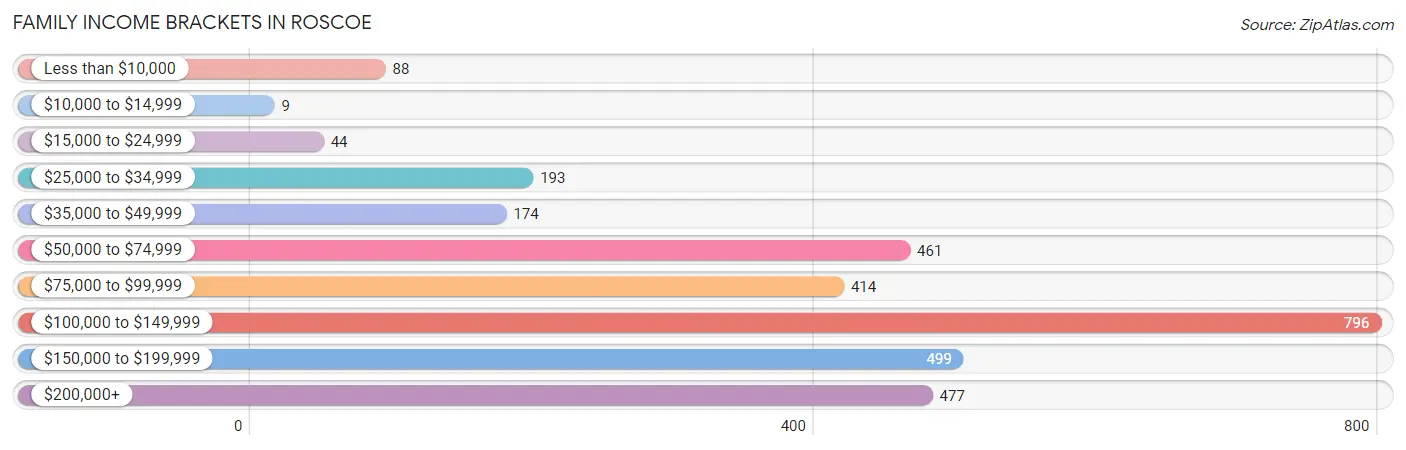
| Income Bracket | # Families | % Families |
| Less than $10,000 | 88 | 2.8% |
| $10,000 to $14,999 | 9 | 0.3% |
| $15,000 to $24,999 | 44 | 1.4% |
| $25,000 to $34,999 | 193 | 6.1% |
| $35,000 to $49,999 | 174 | 5.5% |
| $50,000 to $74,999 | 461 | 14.6% |
| $75,000 to $99,999 | 414 | 13.1% |
| $100,000 to $149,999 | 796 | 25.2% |
| $150,000 to $199,999 | 499 | 15.8% |
| $200,000+ | 477 | 15.1% |
Family Income by Famaliy Size in Roscoe
4-person families (708 | 22.4%) account for the highest median family income in Roscoe with $138,125 per family, while 2-person families (1,306 | 41.4%) have the highest median income of $39,270 per family member.
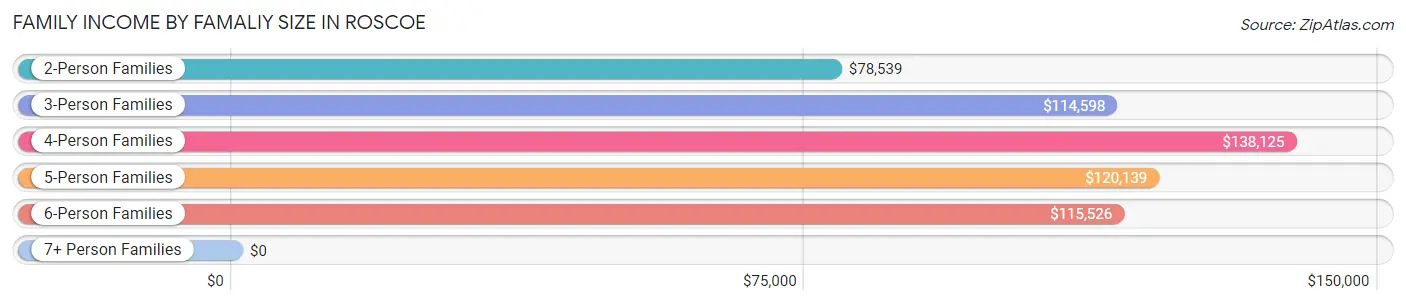
| Income Bracket | # Families | Median Income |
| 2-Person Families | 1,306 (41.4%) | $78,539 |
| 3-Person Families | 738 (23.4%) | $114,598 |
| 4-Person Families | 708 (22.4%) | $138,125 |
| 5-Person Families | 289 (9.1%) | $120,139 |
| 6-Person Families | 102 (3.2%) | $115,526 |
| 7+ Person Families | 14 (0.4%) | $0 |
| Total | 3,157 (100.0%) | $112,628 |
Family Income by Number of Earners in Roscoe
The median family income in Roscoe is $112,628, with families comprising 3+ earners (386) having the highest median family income of $159,167, while families with no earners (369) have the lowest median family income of $42,250, accounting for 12.2% and 11.7% of families, respectively.
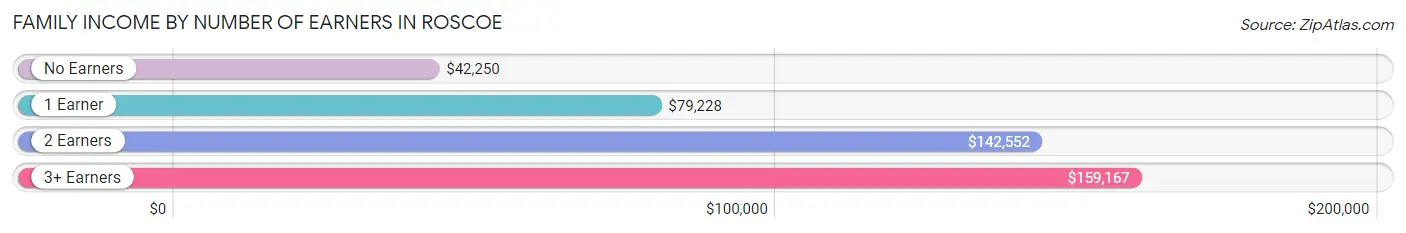
| Number of Earners | # Families | Median Income |
| No Earners | 369 (11.7%) | $42,250 |
| 1 Earner | 1,048 (33.2%) | $79,228 |
| 2 Earners | 1,354 (42.9%) | $142,552 |
| 3+ Earners | 386 (12.2%) | $159,167 |
| Total | 3,157 (100.0%) | $112,628 |
Household Income in Roscoe
Household Income Brackets in Roscoe
With 889 households falling in the category, the $100,000 to $149,999 income range is the most frequent in Roscoe, accounting for 22.1% of all households. In contrast, only 32 households (0.8%) fall into the $10,000 to $14,999 income bracket, making it the least populous group.
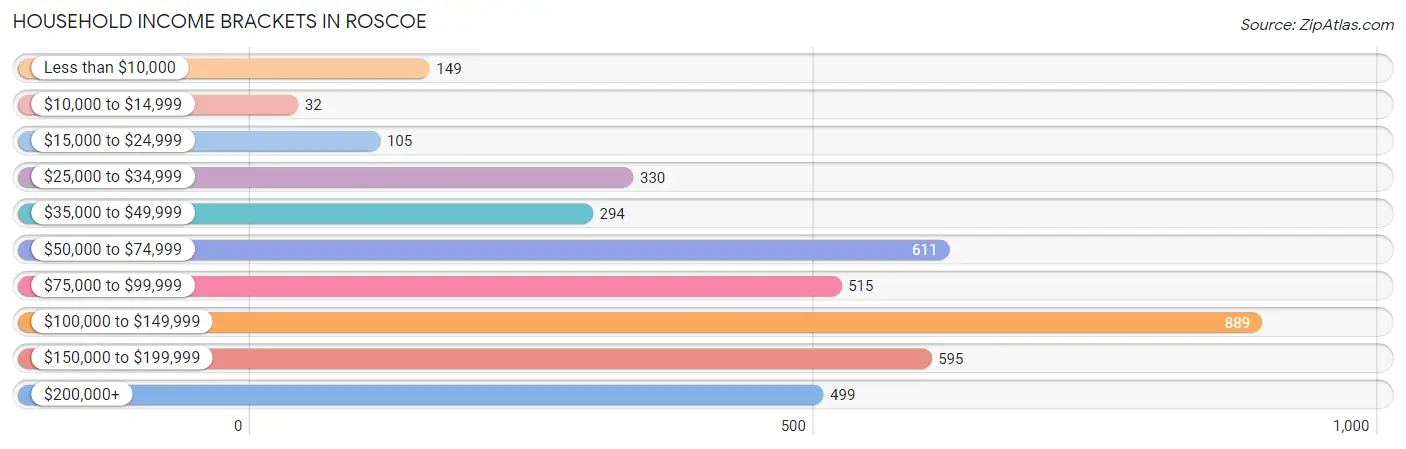
| Income Bracket | # Households | % Households |
| Less than $10,000 | 149 | 3.7% |
| $10,000 to $14,999 | 32 | 0.8% |
| $15,000 to $24,999 | 105 | 2.6% |
| $25,000 to $34,999 | 330 | 8.2% |
| $35,000 to $49,999 | 294 | 7.3% |
| $50,000 to $74,999 | 611 | 15.2% |
| $75,000 to $99,999 | 515 | 12.8% |
| $100,000 to $149,999 | 889 | 22.1% |
| $150,000 to $199,999 | 595 | 14.8% |
| $200,000+ | 499 | 12.4% |
Household Income by Householder Age in Roscoe
The median household income in Roscoe is $98,750, with the highest median household income of $126,818 found in the 45 to 64 years age bracket for the primary householder. A total of 1,490 households (37.0%) fall into this category. Meanwhile, the 65+ years age bracket for the primary householder has the lowest median household income of $54,969, with 875 households (21.7%) in this group.
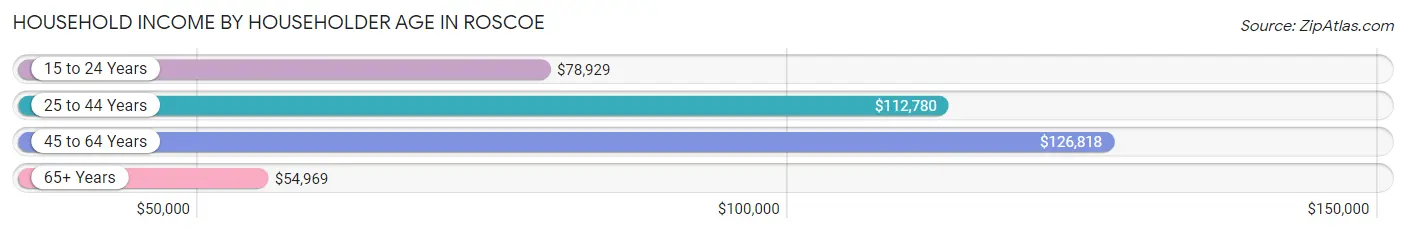
| Income Bracket | # Households | Median Income |
| 15 to 24 Years | 96 (2.4%) | $78,929 |
| 25 to 44 Years | 1,562 (38.8%) | $112,780 |
| 45 to 64 Years | 1,490 (37.0%) | $126,818 |
| 65+ Years | 875 (21.7%) | $54,969 |
| Total | 4,023 (100.0%) | $98,750 |
Poverty in Roscoe
Income Below Poverty by Sex and Age in Roscoe
With 4.2% poverty level for males and 5.3% for females among the residents of Roscoe, 65 to 74 year old males and 65 to 74 year old females are the most vulnerable to poverty, with 57 males (13.9%) and 49 females (10.6%) in their respective age groups living below the poverty level.
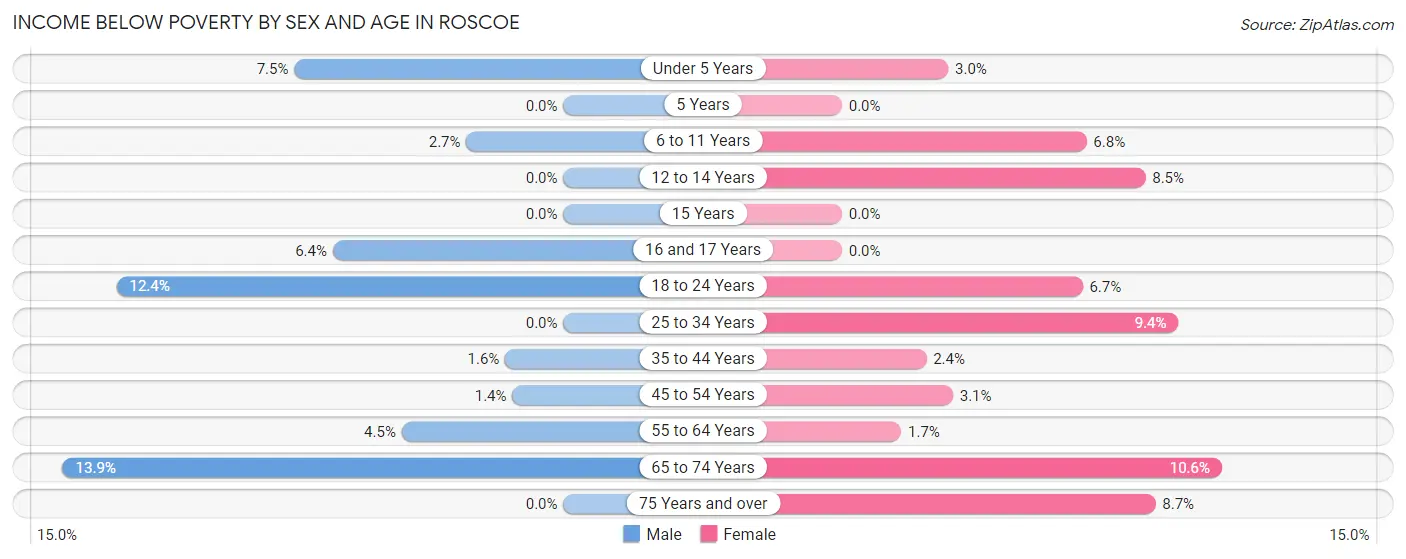
| Age Bracket | Male | Female |
| Under 5 Years | 39 (7.5%) | 17 (3.0%) |
| 5 Years | 0 (0.0%) | 0 (0.0%) |
| 6 to 11 Years | 14 (2.7%) | 50 (6.8%) |
| 12 to 14 Years | 0 (0.0%) | 18 (8.5%) |
| 15 Years | 0 (0.0%) | 0 (0.0%) |
| 16 and 17 Years | 7 (6.4%) | 0 (0.0%) |
| 18 to 24 Years | 56 (12.4%) | 25 (6.7%) |
| 25 to 34 Years | 0 (0.0%) | 67 (9.4%) |
| 35 to 44 Years | 13 (1.6%) | 20 (2.4%) |
| 45 to 54 Years | 12 (1.4%) | 22 (3.1%) |
| 55 to 64 Years | 25 (4.5%) | 9 (1.7%) |
| 65 to 74 Years | 57 (13.9%) | 49 (10.6%) |
| 75 Years and over | 0 (0.0%) | 31 (8.7%) |
| Total | 223 (4.2%) | 308 (5.3%) |
Income Above Poverty by Sex and Age in Roscoe
According to the poverty statistics in Roscoe, males aged 12 to 14 years and females aged 5 years are the age groups that are most secure financially, with 100.0% of males and 100.0% of females in these age groups living above the poverty line.
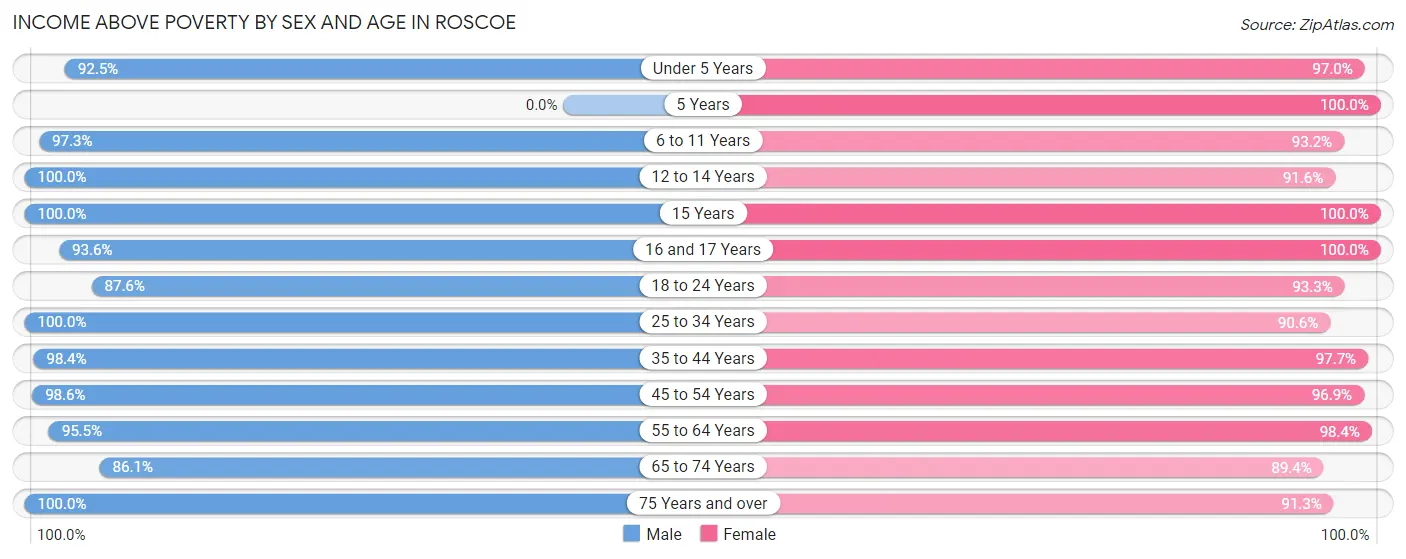
| Age Bracket | Male | Female |
| Under 5 Years | 482 (92.5%) | 557 (97.0%) |
| 5 Years | 0 (0.0%) | 139 (100.0%) |
| 6 to 11 Years | 505 (97.3%) | 684 (93.2%) |
| 12 to 14 Years | 207 (100.0%) | 195 (91.5%) |
| 15 Years | 91 (100.0%) | 35 (100.0%) |
| 16 and 17 Years | 102 (93.6%) | 127 (100.0%) |
| 18 to 24 Years | 394 (87.6%) | 348 (93.3%) |
| 25 to 34 Years | 602 (100.0%) | 648 (90.6%) |
| 35 to 44 Years | 789 (98.4%) | 830 (97.7%) |
| 45 to 54 Years | 834 (98.6%) | 691 (96.9%) |
| 55 to 64 Years | 531 (95.5%) | 538 (98.4%) |
| 65 to 74 Years | 352 (86.1%) | 414 (89.4%) |
| 75 Years and over | 172 (100.0%) | 324 (91.3%) |
| Total | 5,061 (95.8%) | 5,530 (94.7%) |
Income Below Poverty Among Married-Couple Families in Roscoe
The poverty statistics for married-couple families in Roscoe show that 3.2% or 78 of the total 2,435 families live below the poverty line. Families with no children have the highest poverty rate of 5.7%, comprising of 66 families. On the other hand, families with 1 or 2 children have the lowest poverty rate of 0.0%, which includes 0 families.
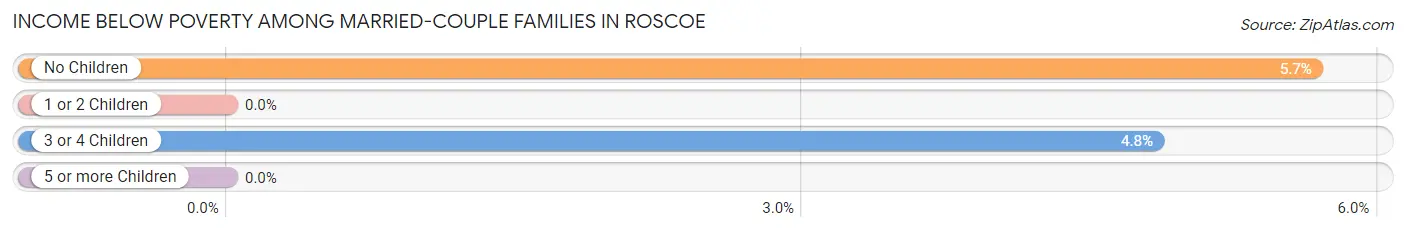
| Children | Above Poverty | Below Poverty |
| No Children | 1,098 (94.3%) | 66 (5.7%) |
| 1 or 2 Children | 1,009 (100.0%) | 0 (0.0%) |
| 3 or 4 Children | 236 (95.2%) | 12 (4.8%) |
| 5 or more Children | 14 (100.0%) | 0 (0.0%) |
| Total | 2,357 (96.8%) | 78 (3.2%) |
Income Below Poverty Among Single-Parent Households in Roscoe
According to the poverty data in Roscoe, 5.0% or 15 single-father households and 10.2% or 43 single-mother households are living below the poverty line. Among single-father households, those with 1 or 2 children have the highest poverty rate, with 15 households (5.8%) experiencing poverty. Likewise, among single-mother households, those with 3 or 4 children have the highest poverty rate, with 14 households (100.0%) falling below the poverty line.
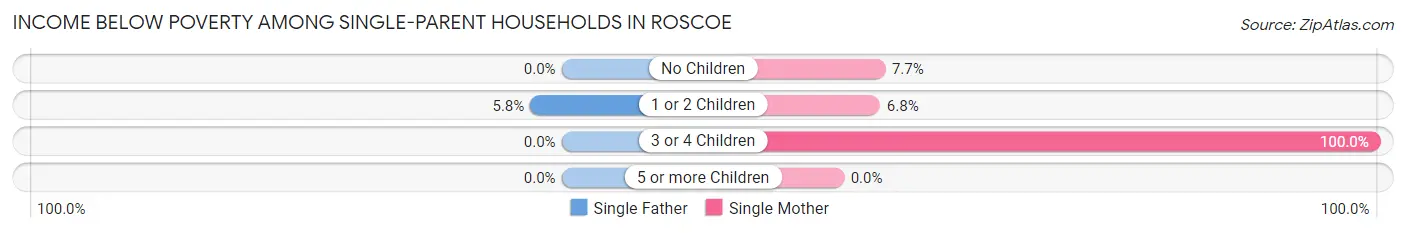
| Children | Single Father | Single Mother |
| No Children | 0 (0.0%) | 13 (7.7%) |
| 1 or 2 Children | 15 (5.8%) | 16 (6.8%) |
| 3 or 4 Children | 0 (0.0%) | 14 (100.0%) |
| 5 or more Children | 0 (0.0%) | 0 (0.0%) |
| Total | 15 (5.0%) | 43 (10.2%) |
Income Below Poverty Among Married-Couple vs Single-Parent Households in Roscoe
The poverty data for Roscoe shows that 78 of the married-couple family households (3.2%) and 58 of the single-parent households (8.0%) are living below the poverty level. Within the married-couple family households, those with no children have the highest poverty rate, with 66 households (5.7%) falling below the poverty line. Among the single-parent households, those with 3 or 4 children have the highest poverty rate, with 14 household (63.6%) living below poverty.
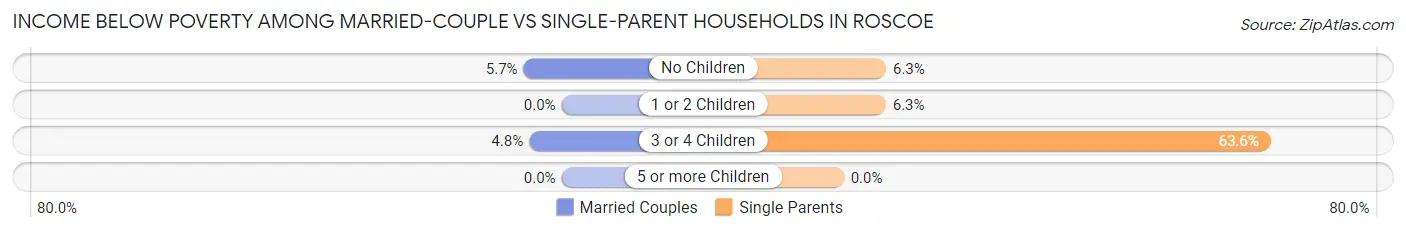
| Children | Married-Couple Families | Single-Parent Households |
| No Children | 66 (5.7%) | 13 (6.3%) |
| 1 or 2 Children | 0 (0.0%) | 31 (6.3%) |
| 3 or 4 Children | 12 (4.8%) | 14 (63.6%) |
| 5 or more Children | 0 (0.0%) | 0 (0.0%) |
| Total | 78 (3.2%) | 58 (8.0%) |
Race in Roscoe
The most populous races in Roscoe are White / Caucasian (9,444 | 84.8%), Hispanic or Latino (874 | 7.9%), and Two or more Races (725 | 6.5%).
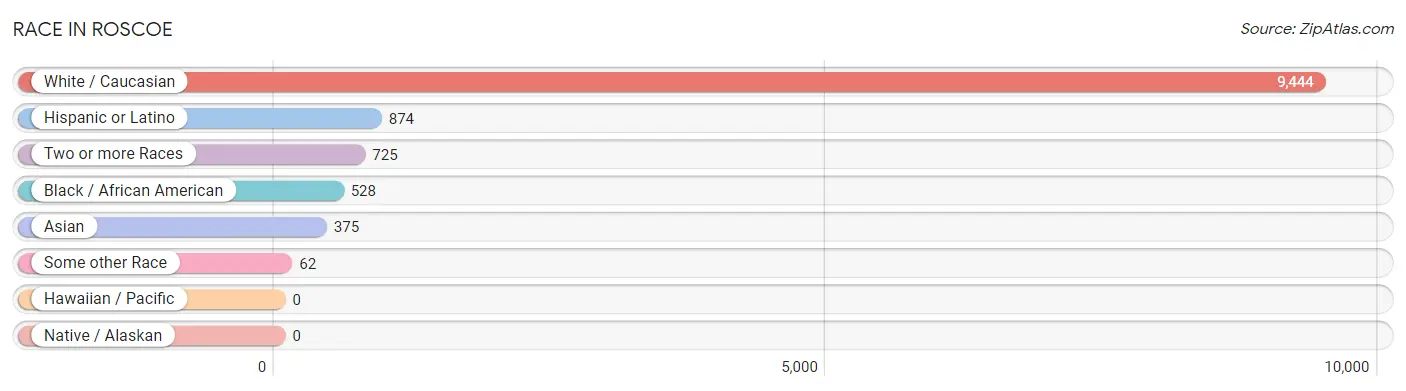
| Race | # Population | % Population |
| Asian | 375 | 3.4% |
| Black / African American | 528 | 4.7% |
| Hawaiian / Pacific | 0 | 0.0% |
| Hispanic or Latino | 874 | 7.9% |
| Native / Alaskan | 0 | 0.0% |
| White / Caucasian | 9,444 | 84.8% |
| Two or more Races | 725 | 6.5% |
| Some other Race | 62 | 0.6% |
| Total | 11,134 | 100.0% |
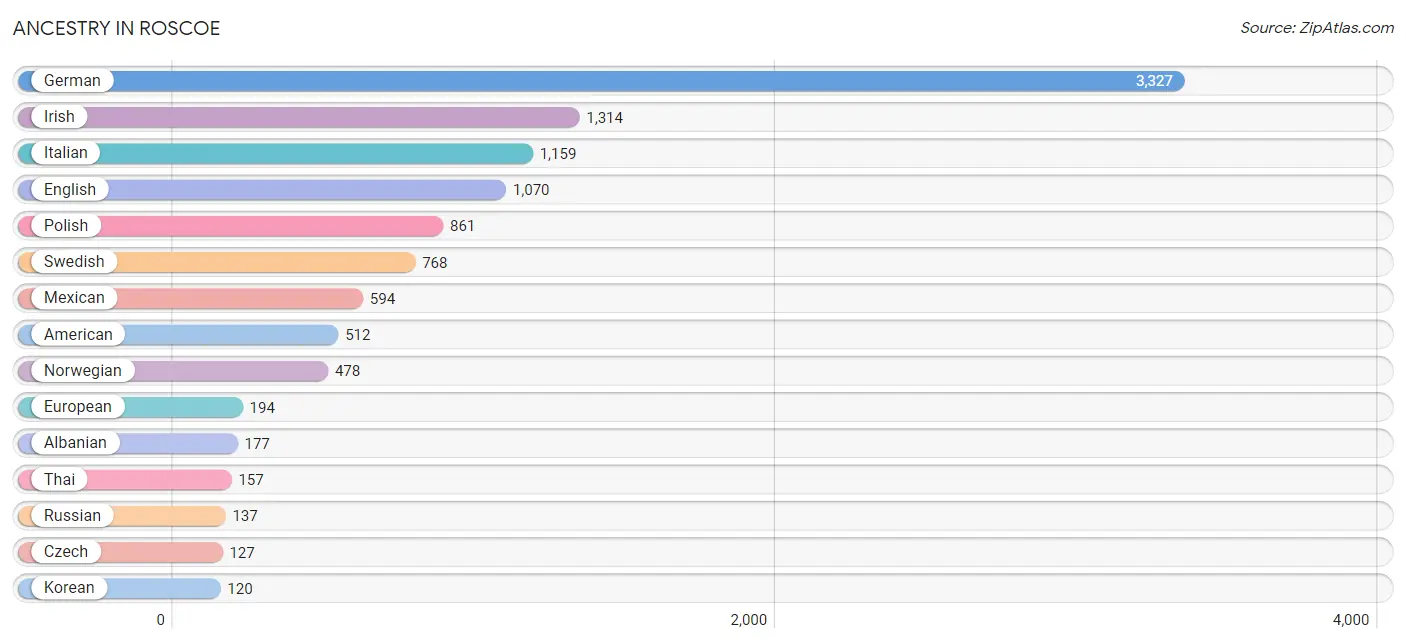
Ancestry in Roscoe
The most populous ancestries reported in Roscoe are German (3,327 | 29.9%), Irish (1,314 | 11.8%), Italian (1,159 | 10.4%), English (1,070 | 9.6%), and Polish (861 | 7.7%), together accounting for 69.4% of all Roscoe residents.
| Ancestry | # Population | % Population |
| Albanian | 177 | 1.6% |
| American | 512 | 4.6% |
| Argentinean | 37 | 0.3% |
| Armenian | 18 | 0.2% |
| Austrian | 5 | 0.0% |
| Belgian | 68 | 0.6% |
| British | 21 | 0.2% |
| Cambodian | 25 | 0.2% |
| Central American | 75 | 0.7% |
| Cuban | 35 | 0.3% |
| Czech | 127 | 1.1% |
| Czechoslovakian | 18 | 0.2% |
| Danish | 59 | 0.5% |
| Dominican | 32 | 0.3% |
| Eastern European | 16 | 0.1% |
| English | 1,070 | 9.6% |
| European | 194 | 1.7% |
| Finnish | 33 | 0.3% |
| French | 118 | 1.1% |
| French Canadian | 11 | 0.1% |
| German | 3,327 | 29.9% |
| German Russian | 7 | 0.1% |
| Guatemalan | 13 | 0.1% |
| Haitian | 76 | 0.7% |
| Honduran | 62 | 0.6% |
| Hungarian | 20 | 0.2% |
| Indian (Asian) | 79 | 0.7% |
| Irish | 1,314 | 11.8% |
| Italian | 1,159 | 10.4% |
| Korean | 120 | 1.1% |
| Lithuanian | 44 | 0.4% |
| Malaysian | 20 | 0.2% |
| Mexican | 594 | 5.3% |
| Nigerian | 78 | 0.7% |
| Northern European | 5 | 0.0% |
| Norwegian | 478 | 4.3% |
| Polish | 861 | 7.7% |
| Puerto Rican | 50 | 0.4% |
| Russian | 137 | 1.2% |
| Scandinavian | 50 | 0.4% |
| Scotch-Irish | 53 | 0.5% |
| Scottish | 117 | 1.1% |
| Serbian | 76 | 0.7% |
| Sioux | 21 | 0.2% |
| Slavic | 10 | 0.1% |
| Slovak | 12 | 0.1% |
| South American | 57 | 0.5% |
| Spaniard | 31 | 0.3% |
| Spanish American Indian | 12 | 0.1% |
| Subsaharan African | 78 | 0.7% |
| Swedish | 768 | 6.9% |
| Swiss | 5 | 0.0% |
| Thai | 157 | 1.4% |
| Venezuelan | 20 | 0.2% |
| Welsh | 64 | 0.6% |
| Yugoslavian | 30 | 0.3% | View All 56 Rows |
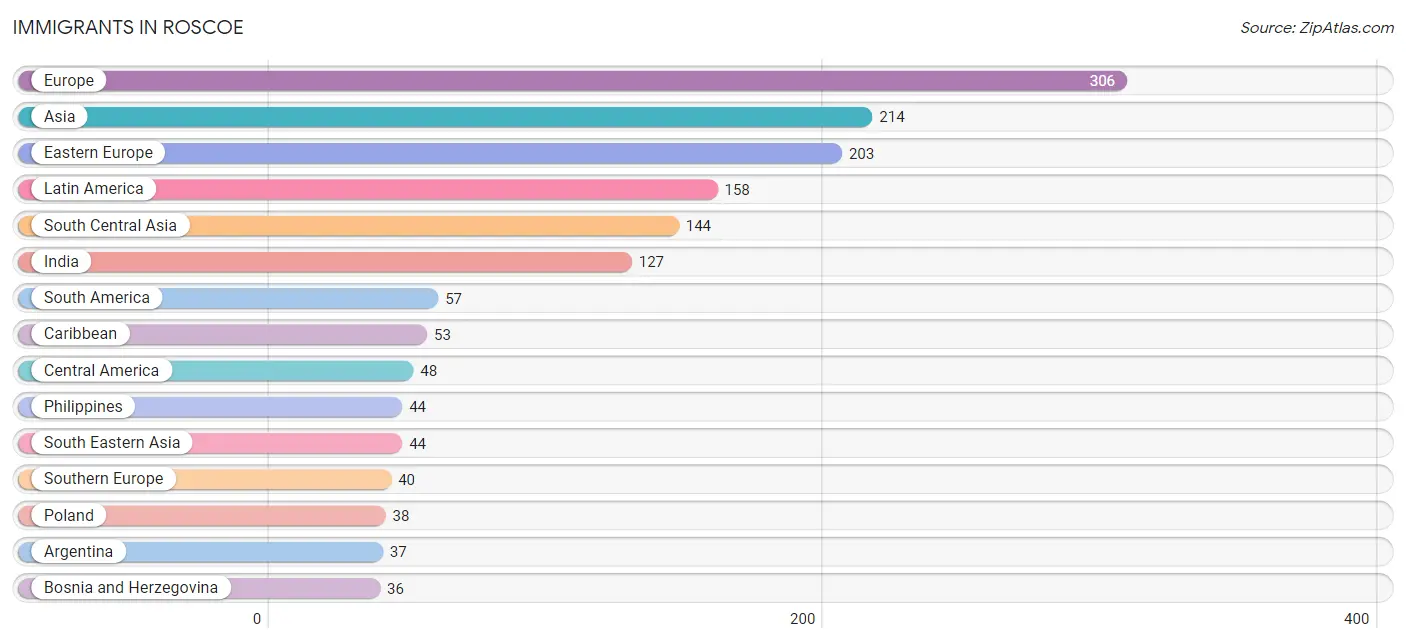
Immigrants in Roscoe
The most numerous immigrant groups reported in Roscoe came from Europe (306 | 2.8%), Asia (214 | 1.9%), Eastern Europe (203 | 1.8%), Latin America (158 | 1.4%), and South Central Asia (144 | 1.3%), together accounting for 9.2% of all Roscoe residents.
| Immigration Origin | # Population | % Population |
| Africa | 32 | 0.3% |
| Argentina | 37 | 0.3% |
| Asia | 214 | 1.9% |
| Belarus | 27 | 0.2% |
| Bosnia and Herzegovina | 36 | 0.3% |
| Canada | 13 | 0.1% |
| Caribbean | 53 | 0.5% |
| Central America | 48 | 0.4% |
| Cuba | 8 | 0.1% |
| Dominican Republic | 10 | 0.1% |
| Eastern Asia | 9 | 0.1% |
| Eastern Europe | 203 | 1.8% |
| Europe | 306 | 2.8% |
| Germany | 31 | 0.3% |
| Guatemala | 13 | 0.1% |
| Haiti | 35 | 0.3% |
| Honduras | 15 | 0.1% |
| India | 127 | 1.1% |
| Israel | 9 | 0.1% |
| Italy | 9 | 0.1% |
| Latin America | 158 | 1.4% |
| Mexico | 20 | 0.2% |
| Nigeria | 32 | 0.3% |
| Northern Europe | 32 | 0.3% |
| Oceania | 31 | 0.3% |
| Pakistan | 17 | 0.2% |
| Philippines | 44 | 0.4% |
| Poland | 38 | 0.3% |
| Russia | 10 | 0.1% |
| Serbia | 23 | 0.2% |
| South America | 57 | 0.5% |
| South Central Asia | 144 | 1.3% |
| South Eastern Asia | 44 | 0.4% |
| Southern Europe | 40 | 0.4% |
| Spain | 31 | 0.3% |
| Sweden | 11 | 0.1% |
| Venezuela | 20 | 0.2% |
| Western Africa | 32 | 0.3% |
| Western Asia | 17 | 0.2% |
| Western Europe | 31 | 0.3% | View All 40 Rows |
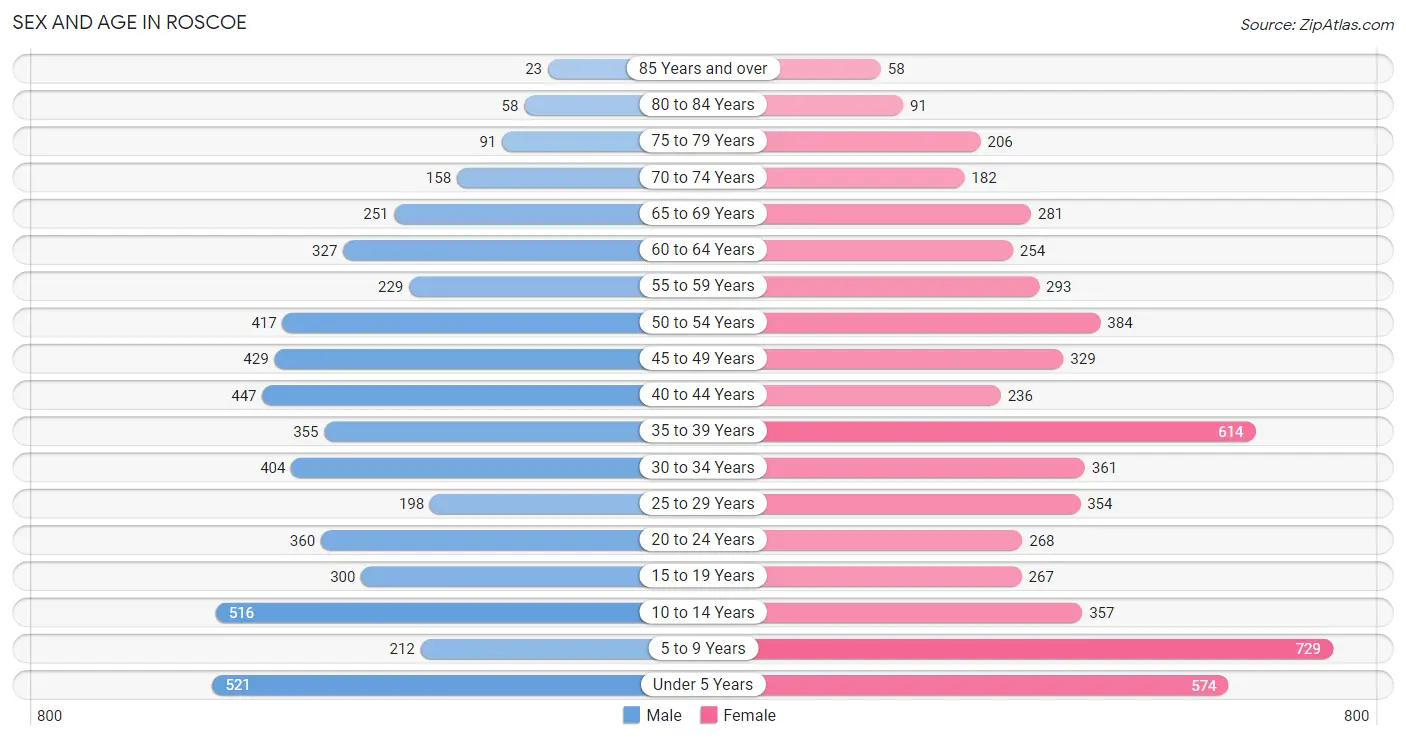
Sex and Age in Roscoe
Sex and Age in Roscoe
The most populous age groups in Roscoe are Under 5 Years (521 | 9.8%) for men and 5 to 9 Years (729 | 12.5%) for women.
| Age Bracket | Male | Female |
| Under 5 Years | 521 (9.8%) | 574 (9.8%) |
| 5 to 9 Years | 212 (4.0%) | 729 (12.5%) |
| 10 to 14 Years | 516 (9.7%) | 357 (6.1%) |
| 15 to 19 Years | 300 (5.7%) | 267 (4.6%) |
| 20 to 24 Years | 360 (6.8%) | 268 (4.6%) |
| 25 to 29 Years | 198 (3.7%) | 354 (6.1%) |
| 30 to 34 Years | 404 (7.6%) | 361 (6.2%) |
| 35 to 39 Years | 355 (6.7%) | 614 (10.5%) |
| 40 to 44 Years | 447 (8.4%) | 236 (4.0%) |
| 45 to 49 Years | 429 (8.1%) | 329 (5.6%) |
| 50 to 54 Years | 417 (7.9%) | 384 (6.6%) |
| 55 to 59 Years | 229 (4.3%) | 293 (5.0%) |
| 60 to 64 Years | 327 (6.2%) | 254 (4.3%) |
| 65 to 69 Years | 251 (4.7%) | 281 (4.8%) |
| 70 to 74 Years | 158 (3.0%) | 182 (3.1%) |
| 75 to 79 Years | 91 (1.7%) | 206 (3.5%) |
| 80 to 84 Years | 58 (1.1%) | 91 (1.6%) |
| 85 Years and over | 23 (0.4%) | 58 (1.0%) |
| Total | 5,296 (100.0%) | 5,838 (100.0%) |
Families and Households in Roscoe
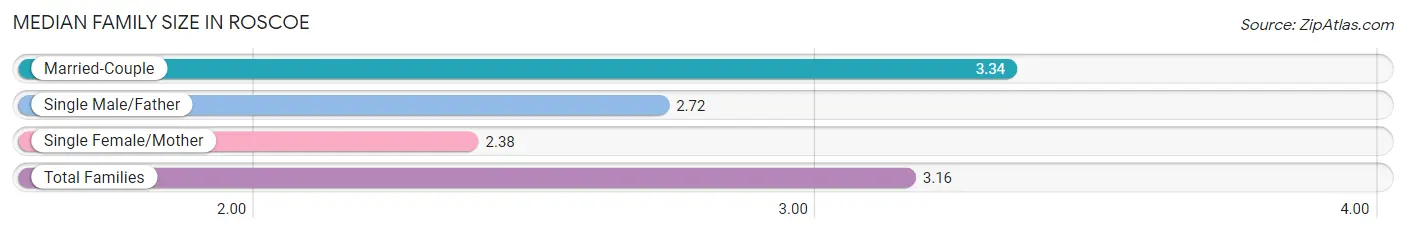
Median Family Size in Roscoe
The median family size in Roscoe is 3.16 persons per family, with married-couple families (2,435 | 77.1%) accounting for the largest median family size of 3.34 persons per family. On the other hand, single female/mother families (420 | 13.3%) represent the smallest median family size with 2.38 persons per family.
| Family Type | # Families | Family Size |
| Married-Couple | 2,435 (77.1%) | 3.34 |
| Single Male/Father | 302 (9.6%) | 2.72 |
| Single Female/Mother | 420 (13.3%) | 2.38 |
| Total Families | 3,157 (100.0%) | 3.16 |
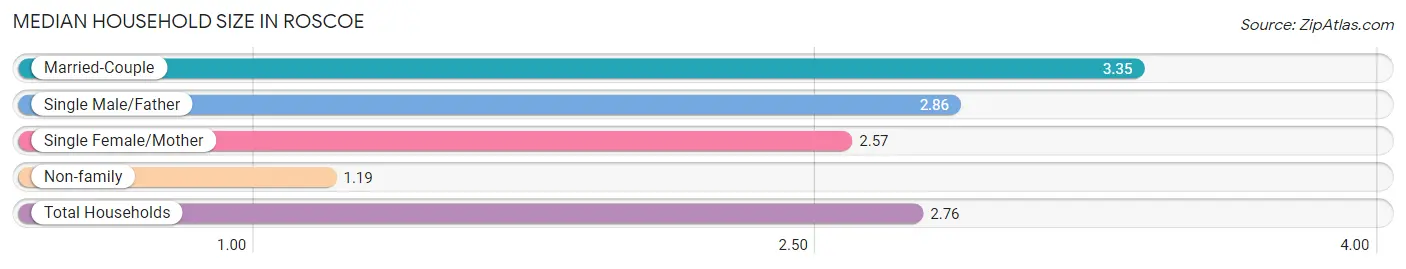
Median Household Size in Roscoe
The median household size in Roscoe is 2.76 persons per household, with married-couple households (2,435 | 60.5%) accounting for the largest median household size of 3.35 persons per household. non-family households (866 | 21.5%) represent the smallest median household size with 1.19 persons per household.
| Household Type | # Households | Household Size |
| Married-Couple | 2,435 (60.5%) | 3.35 |
| Single Male/Father | 302 (7.5%) | 2.86 |
| Single Female/Mother | 420 (10.4%) | 2.57 |
| Non-family | 866 (21.5%) | 1.19 |
| Total Households | 4,023 (100.0%) | 2.76 |
Household Size by Marriage Status in Roscoe
Out of a total of 4,023 households in Roscoe, 3,157 (78.5%) are family households, while 866 (21.5%) are nonfamily households. The most numerous type of family households are 2-person households, comprising 1,248, and the most common type of nonfamily households are 1-person households, comprising 728.
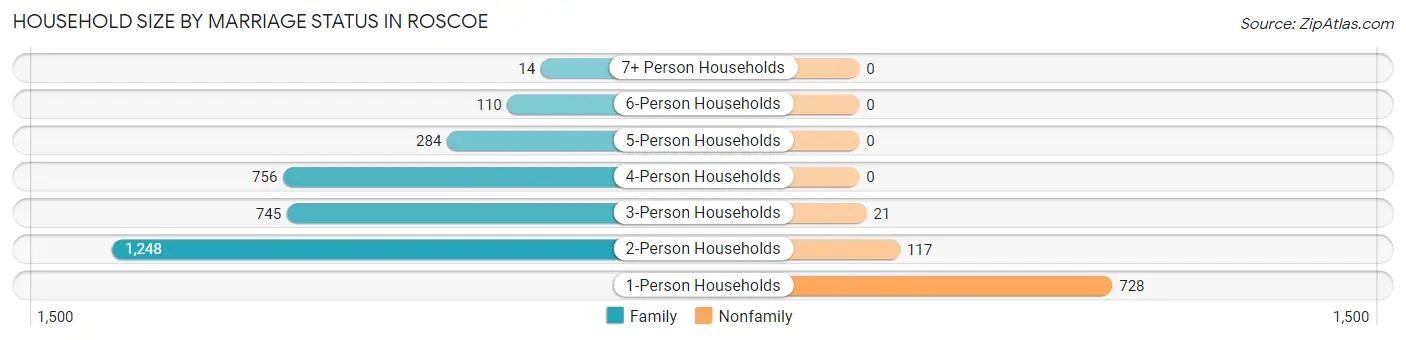
| Household Size | Family Households | Nonfamily Households |
| 1-Person Households | - | 728 (18.1%) |
| 2-Person Households | 1,248 (31.0%) | 117 (2.9%) |
| 3-Person Households | 745 (18.5%) | 21 (0.5%) |
| 4-Person Households | 756 (18.8%) | 0 (0.0%) |
| 5-Person Households | 284 (7.1%) | 0 (0.0%) |
| 6-Person Households | 110 (2.7%) | 0 (0.0%) |
| 7+ Person Households | 14 (0.4%) | 0 (0.0%) |
| Total | 3,157 (78.5%) | 866 (21.5%) |
Female Fertility in Roscoe
Fertility by Age in Roscoe
Average fertility rate in Roscoe is 78.0 births per 1,000 women. Women in the age bracket of 20 to 34 years have the highest fertility rate with 95.0 births per 1,000 women. Women in the age bracket of 35 to 50 years acount for 54.0% of all women with births.
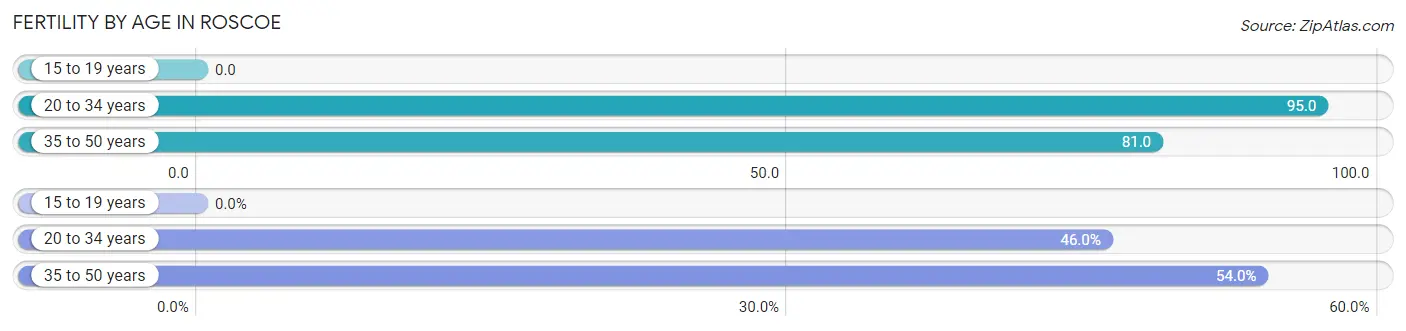
| Age Bracket | Women with Births | Births / 1,000 Women |
| 15 to 19 years | 0 (0.0%) | 0.0 |
| 20 to 34 years | 93 (46.0%) | 95.0 |
| 35 to 50 years | 109 (54.0%) | 81.0 |
| Total | 202 (100.0%) | 78.0 |
Fertility by Age by Marriage Status in Roscoe
88.6% of women with births (202) in Roscoe are married. The highest percentage of unmarried women with births falls into 20 to 34 years age bracket with 24.7% of them unmarried at the time of birth, while the lowest percentage of unmarried women with births belong to 35 to 50 years age bracket with 0.0% of them unmarried.
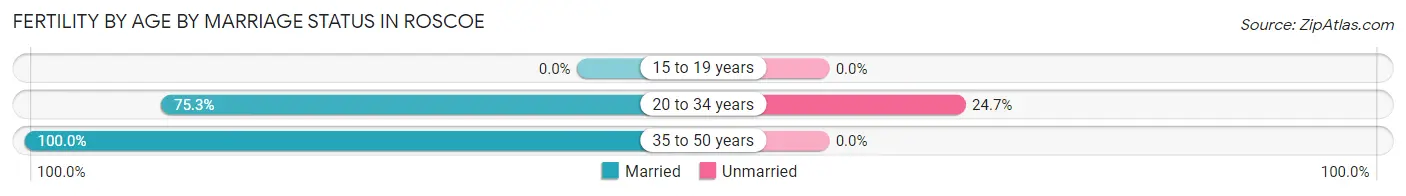
| Age Bracket | Married | Unmarried |
| 15 to 19 years | 0 (0.0%) | 0 (0.0%) |
| 20 to 34 years | 70 (75.3%) | 23 (24.7%) |
| 35 to 50 years | 109 (100.0%) | 0 (0.0%) |
| Total | 179 (88.6%) | 23 (11.4%) |
Fertility by Education in Roscoe
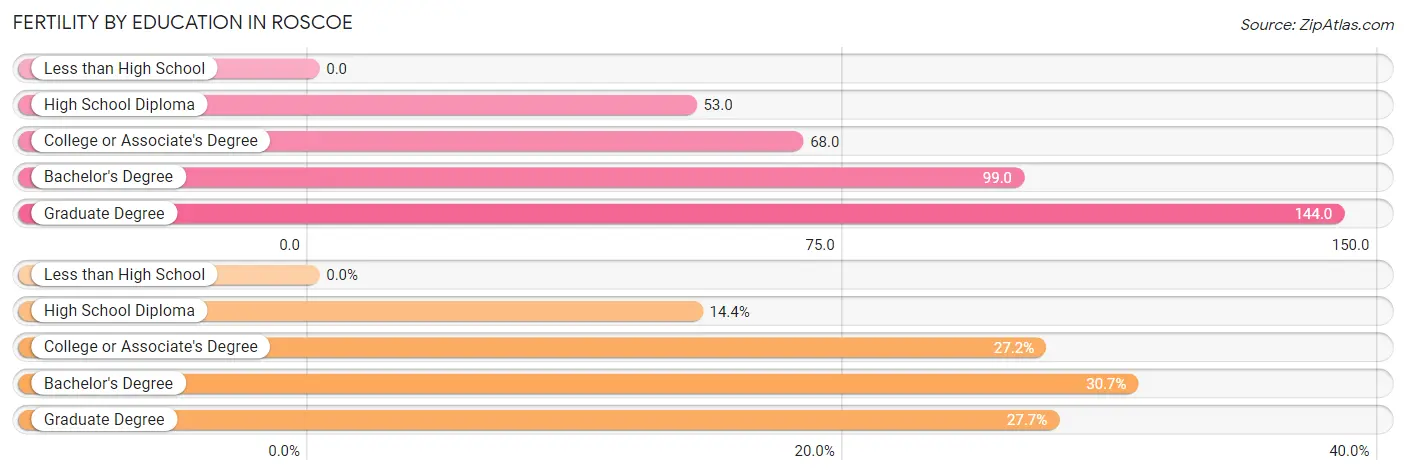
| Educational Attainment | Women with Births | Births / 1,000 Women |
| Less than High School | 0 (0.0%) | 0.0 |
| High School Diploma | 29 (14.4%) | 53.0 |
| College or Associate's Degree | 55 (27.2%) | 68.0 |
| Bachelor's Degree | 62 (30.7%) | 99.0 |
| Graduate Degree | 56 (27.7%) | 144.0 |
| Total | 202 (100.0%) | 78.0 |
Fertility by Education by Marriage Status in Roscoe
11.4% of women with births in Roscoe are unmarried. Women with the educational attainment of bachelor's degree are most likely to be married with 100.0% of them married at childbirth, while women with the educational attainment of high school diploma are least likely to be married with 27.6% of them unmarried at childbirth.
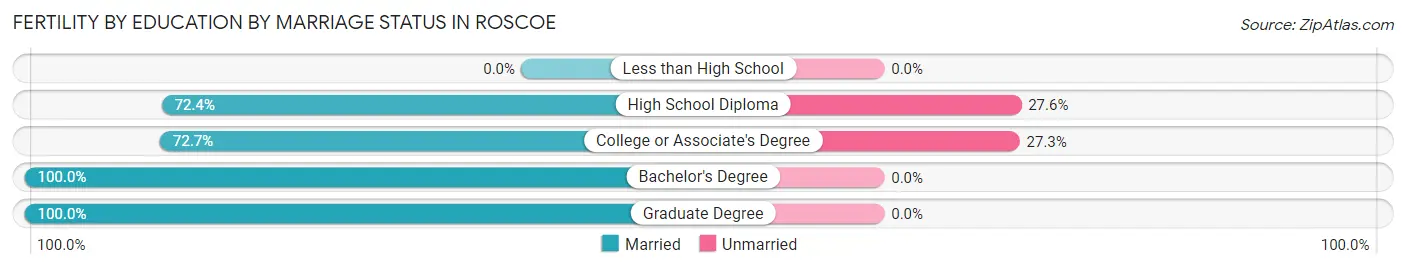
| Educational Attainment | Married | Unmarried |
| Less than High School | 0 (0.0%) | 0 (0.0%) |
| High School Diploma | 21 (72.4%) | 8 (27.6%) |
| College or Associate's Degree | 40 (72.7%) | 15 (27.3%) |
| Bachelor's Degree | 62 (100.0%) | 0 (0.0%) |
| Graduate Degree | 56 (100.0%) | 0 (0.0%) |
| Total | 179 (88.6%) | 23 (11.4%) |
Employment Characteristics in Roscoe
Employment by Class of Employer in Roscoe
Among the 5,544 employed individuals in Roscoe, private company employees (3,791 | 68.4%), not-for-profit organizations (455 | 8.2%), and local government employees (453 | 8.2%) make up the most common classes of employment.
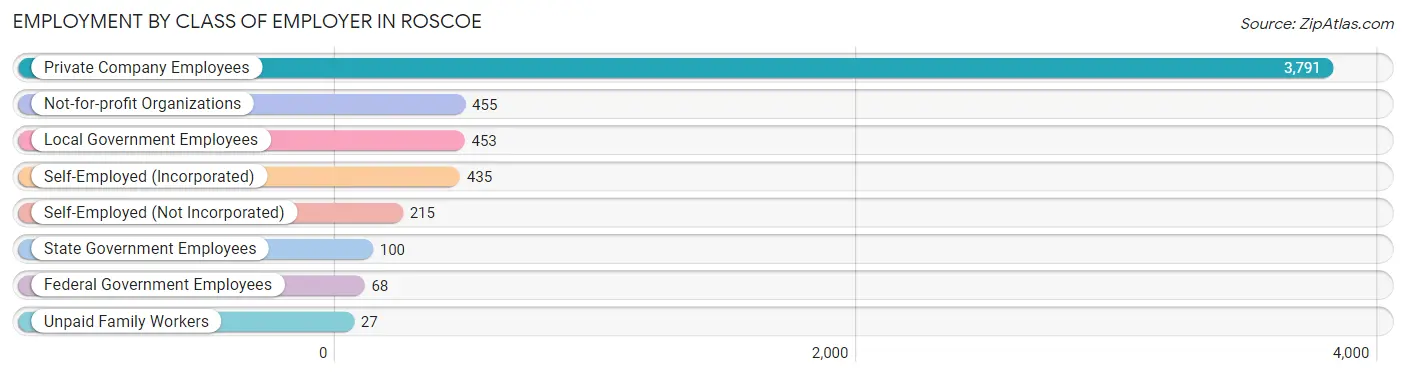
| Employer Class | # Employees | % Employees |
| Private Company Employees | 3,791 | 68.4% |
| Self-Employed (Incorporated) | 435 | 7.9% |
| Self-Employed (Not Incorporated) | 215 | 3.9% |
| Not-for-profit Organizations | 455 | 8.2% |
| Local Government Employees | 453 | 8.2% |
| State Government Employees | 100 | 1.8% |
| Federal Government Employees | 68 | 1.2% |
| Unpaid Family Workers | 27 | 0.5% |
| Total | 5,544 | 100.0% |
Employment Status by Age in Roscoe
According to the labor force statistics for Roscoe, out of the total population over 16 years of age (8,097), 71.1% or 5,757 individuals are in the labor force, with 2.7% or 155 of them unemployed. The age group with the highest labor force participation rate is 30 to 34 years, with 92.3% or 706 individuals in the labor force. Within the labor force, the 60 to 64 years age range has the highest percentage of unemployed individuals, with 14.1% or 53 of them being unemployed.
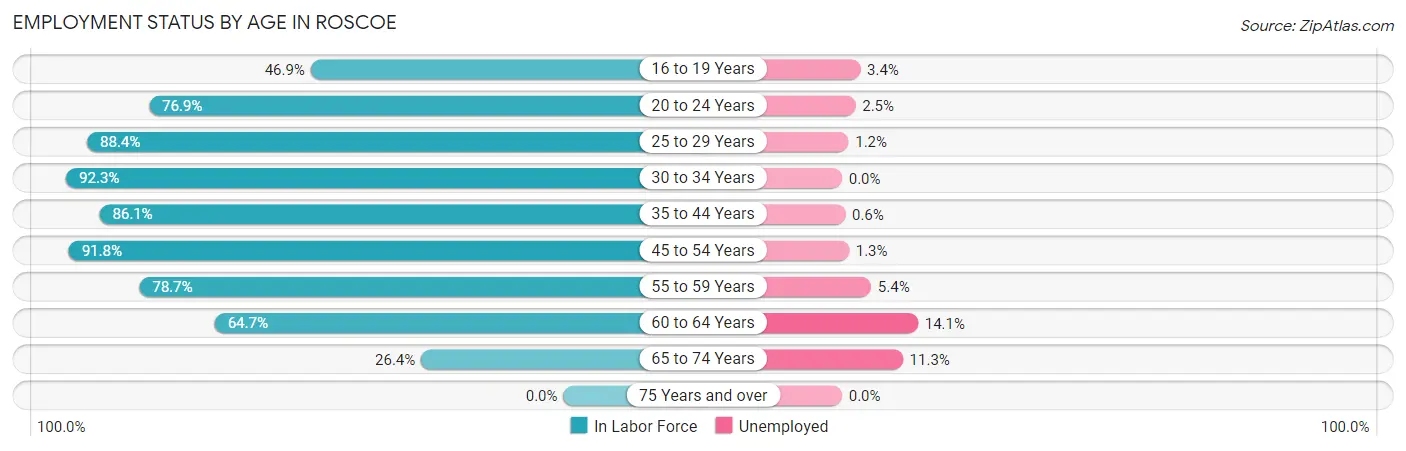
| Age Bracket | In Labor Force | Unemployed |
| 16 to 19 Years | 206 (46.9%) | 7 (3.4%) |
| 20 to 24 Years | 483 (76.9%) | 12 (2.5%) |
| 25 to 29 Years | 488 (88.4%) | 6 (1.2%) |
| 30 to 34 Years | 706 (92.3%) | 0 (0.0%) |
| 35 to 44 Years | 1,422 (86.1%) | 9 (0.6%) |
| 45 to 54 Years | 1,431 (91.8%) | 19 (1.3%) |
| 55 to 59 Years | 411 (78.7%) | 22 (5.4%) |
| 60 to 64 Years | 376 (64.7%) | 53 (14.1%) |
| 65 to 74 Years | 230 (26.4%) | 26 (11.3%) |
| 75 Years and over | 0 (0.0%) | 0 (0.0%) |
| Total | 5,757 (71.1%) | 155 (2.7%) |
Employment Status by Educational Attainment in Roscoe
According to labor force statistics for Roscoe, 85.9% of individuals (4,837) out of the total population between 25 and 64 years of age (5,631) are in the labor force, with 2.2% or 106 of them being unemployed. The group with the highest labor force participation rate are those with the educational attainment of bachelor's degree or higher, with 96.7% or 2,054 individuals in the labor force. Within the labor force, individuals with high school diploma education have the highest percentage of unemployment, with 5.7% or 56 of them being unemployed.
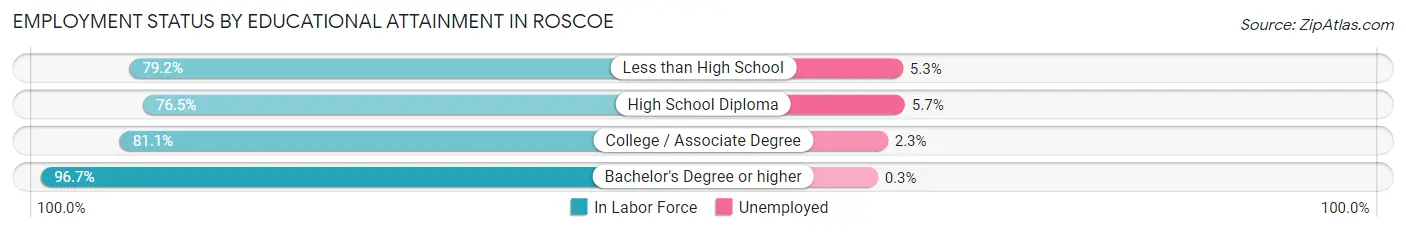
| Educational Attainment | In Labor Force | Unemployed |
| Less than High School | 171 (79.2%) | 11 (5.3%) |
| High School Diploma | 981 (76.5%) | 73 (5.7%) |
| College / Associate Degree | 1,628 (81.1%) | 46 (2.3%) |
| Bachelor's Degree or higher | 2,054 (96.7%) | 6 (0.3%) |
| Total | 4,837 (85.9%) | 124 (2.2%) |
Employment Occupations by Sex in Roscoe
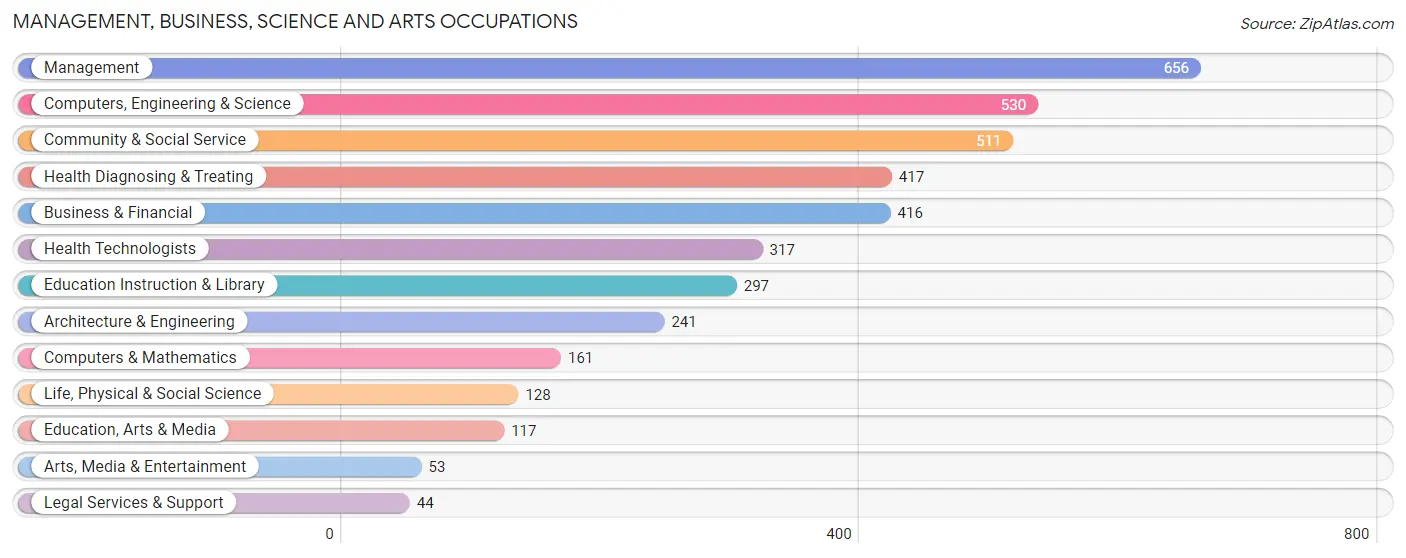
Management, Business, Science and Arts Occupations
The most common Management, Business, Science and Arts occupations in Roscoe are Management (656 | 11.7%), Computers, Engineering & Science (530 | 9.5%), Community & Social Service (511 | 9.1%), Health Diagnosing & Treating (417 | 7.4%), and Business & Financial (416 | 7.4%).
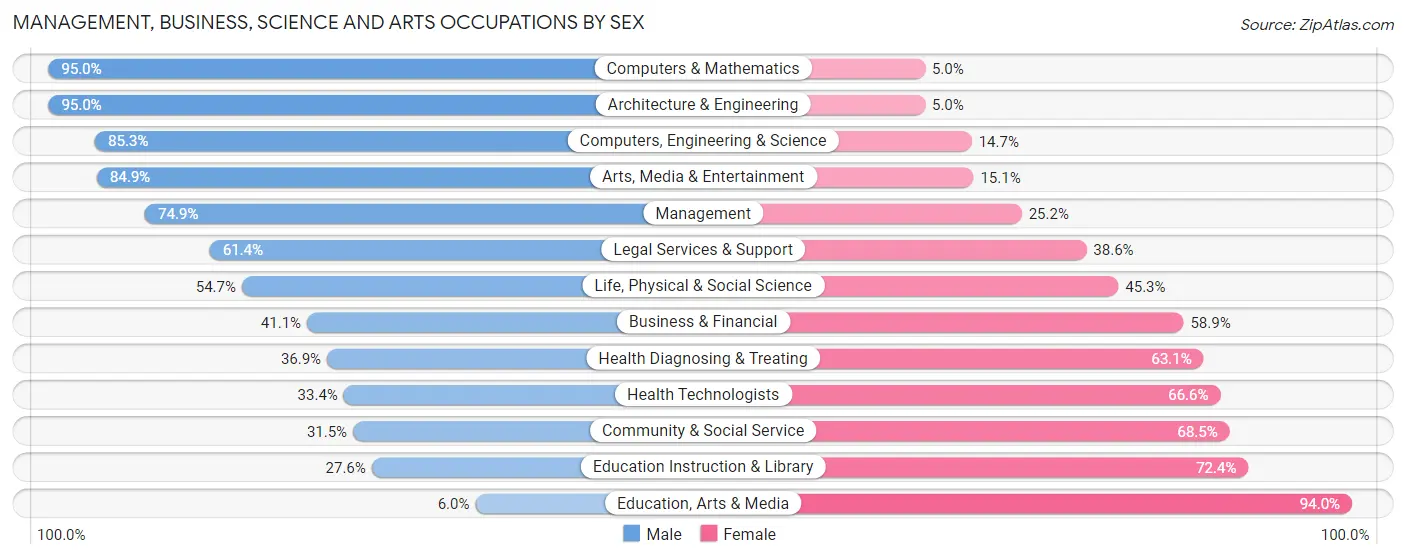
Management, Business, Science and Arts Occupations by Sex
Within the Management, Business, Science and Arts occupations in Roscoe, the most male-oriented occupations are Computers & Mathematics (95.0%), Architecture & Engineering (95.0%), and Computers, Engineering & Science (85.3%), while the most female-oriented occupations are Education, Arts & Media (94.0%), Education Instruction & Library (72.4%), and Community & Social Service (68.5%).
| Occupation | Male | Female |
| Management | 491 (74.9%) | 165 (25.2%) |
| Business & Financial | 171 (41.1%) | 245 (58.9%) |
| Computers, Engineering & Science | 452 (85.3%) | 78 (14.7%) |
| Computers & Mathematics | 153 (95.0%) | 8 (5.0%) |
| Architecture & Engineering | 229 (95.0%) | 12 (5.0%) |
| Life, Physical & Social Science | 70 (54.7%) | 58 (45.3%) |
| Community & Social Service | 161 (31.5%) | 350 (68.5%) |
| Education, Arts & Media | 7 (6.0%) | 110 (94.0%) |
| Legal Services & Support | 27 (61.4%) | 17 (38.6%) |
| Education Instruction & Library | 82 (27.6%) | 215 (72.4%) |
| Arts, Media & Entertainment | 45 (84.9%) | 8 (15.1%) |
| Health Diagnosing & Treating | 154 (36.9%) | 263 (63.1%) |
| Health Technologists | 106 (33.4%) | 211 (66.6%) |
| Total (Category) | 1,429 (56.5%) | 1,101 (43.5%) |
| Total (Overall) | 3,042 (54.3%) | 2,559 (45.7%) |
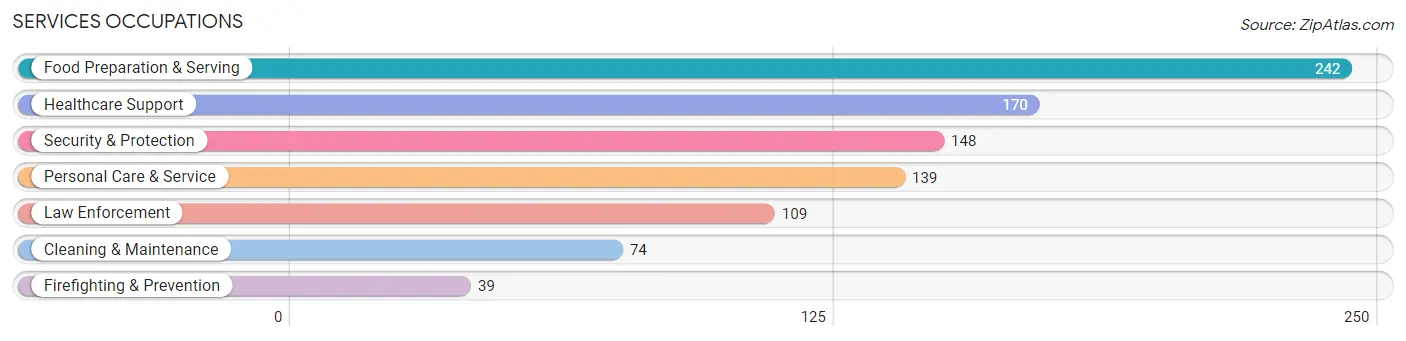
Services Occupations
The most common Services occupations in Roscoe are Food Preparation & Serving (242 | 4.3%), Healthcare Support (170 | 3.0%), Security & Protection (148 | 2.6%), Personal Care & Service (139 | 2.5%), and Law Enforcement (109 | 1.9%).
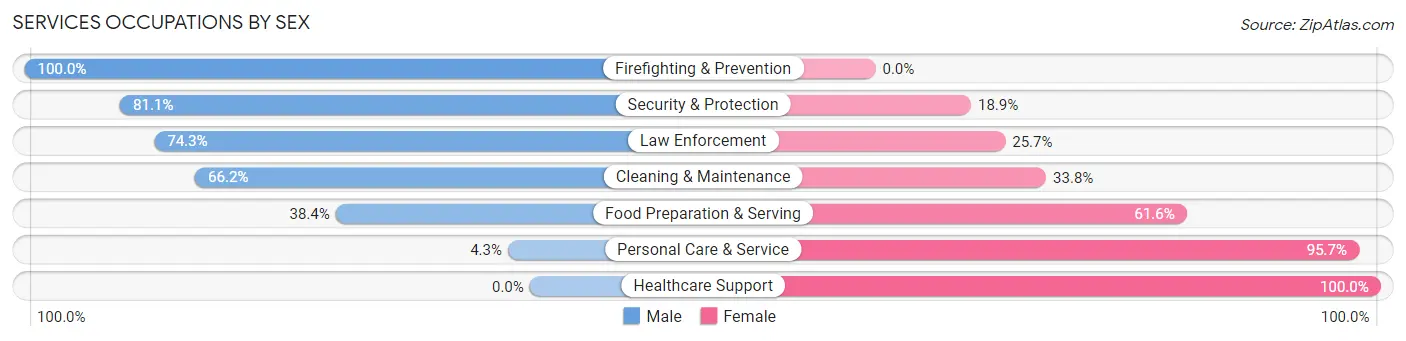
Services Occupations by Sex
Within the Services occupations in Roscoe, the most male-oriented occupations are Firefighting & Prevention (100.0%), Security & Protection (81.1%), and Law Enforcement (74.3%), while the most female-oriented occupations are Healthcare Support (100.0%), Personal Care & Service (95.7%), and Food Preparation & Serving (61.6%).
| Occupation | Male | Female |
| Healthcare Support | 0 (0.0%) | 170 (100.0%) |
| Security & Protection | 120 (81.1%) | 28 (18.9%) |
| Firefighting & Prevention | 39 (100.0%) | 0 (0.0%) |
| Law Enforcement | 81 (74.3%) | 28 (25.7%) |
| Food Preparation & Serving | 93 (38.4%) | 149 (61.6%) |
| Cleaning & Maintenance | 49 (66.2%) | 25 (33.8%) |
| Personal Care & Service | 6 (4.3%) | 133 (95.7%) |
| Total (Category) | 268 (34.7%) | 505 (65.3%) |
| Total (Overall) | 3,042 (54.3%) | 2,559 (45.7%) |
Sales and Office Occupations
The most common Sales and Office occupations in Roscoe are Sales & Related (611 | 10.9%), and Office & Administration (500 | 8.9%).
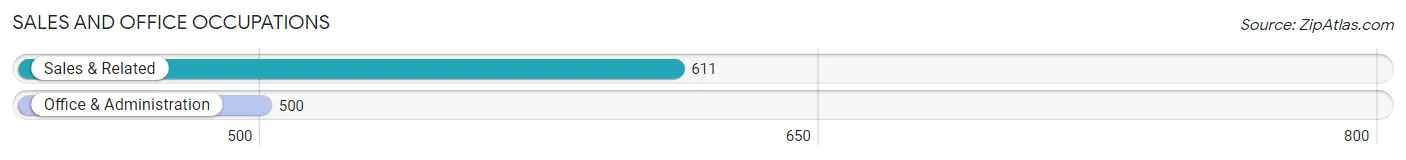
Sales and Office Occupations by Sex
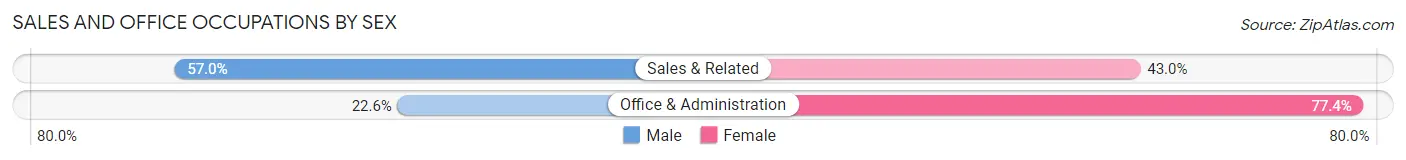
| Occupation | Male | Female |
| Sales & Related | 348 (57.0%) | 263 (43.0%) |
| Office & Administration | 113 (22.6%) | 387 (77.4%) |
| Total (Category) | 461 (41.5%) | 650 (58.5%) |
| Total (Overall) | 3,042 (54.3%) | 2,559 (45.7%) |
Natural Resources, Construction and Maintenance Occupations
The most common Natural Resources, Construction and Maintenance occupations in Roscoe are Construction & Extraction (220 | 3.9%), and Installation, Maintenance & Repair (172 | 3.1%).
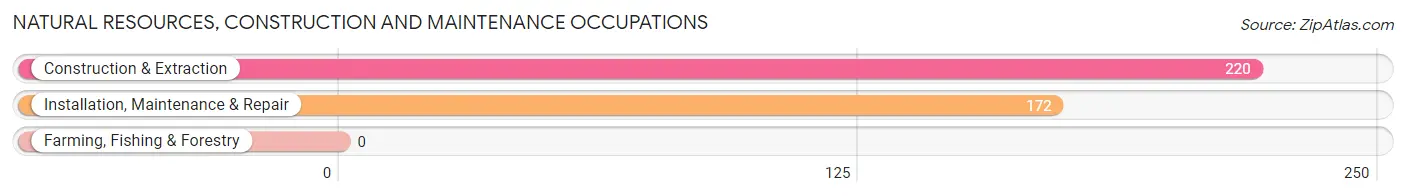
Natural Resources, Construction and Maintenance Occupations by Sex
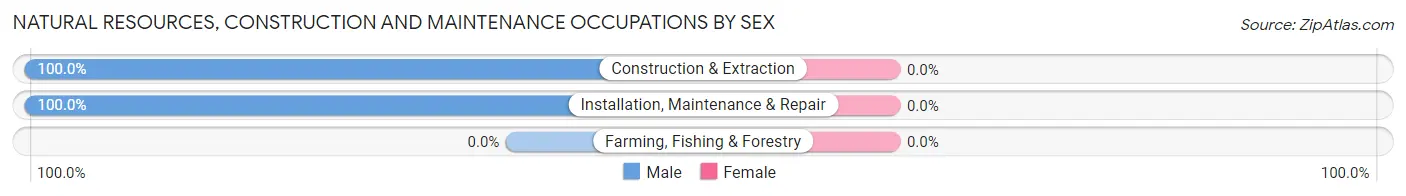
| Occupation | Male | Female |
| Farming, Fishing & Forestry | 0 (0.0%) | 0 (0.0%) |
| Construction & Extraction | 220 (100.0%) | 0 (0.0%) |
| Installation, Maintenance & Repair | 172 (100.0%) | 0 (0.0%) |
| Total (Category) | 392 (100.0%) | 0 (0.0%) |
| Total (Overall) | 3,042 (54.3%) | 2,559 (45.7%) |
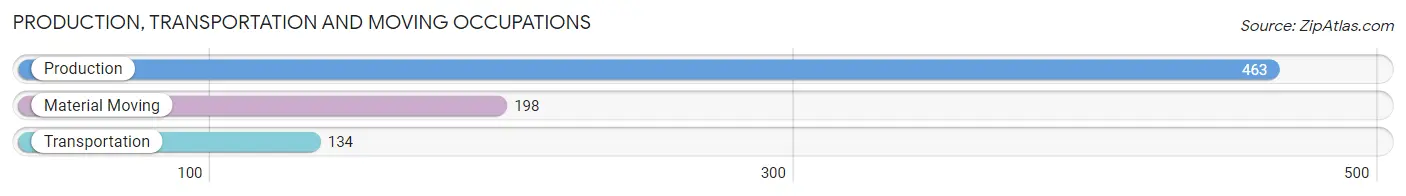
Production, Transportation and Moving Occupations
The most common Production, Transportation and Moving occupations in Roscoe are Production (463 | 8.3%), Material Moving (198 | 3.5%), and Transportation (134 | 2.4%).
Production, Transportation and Moving Occupations by Sex
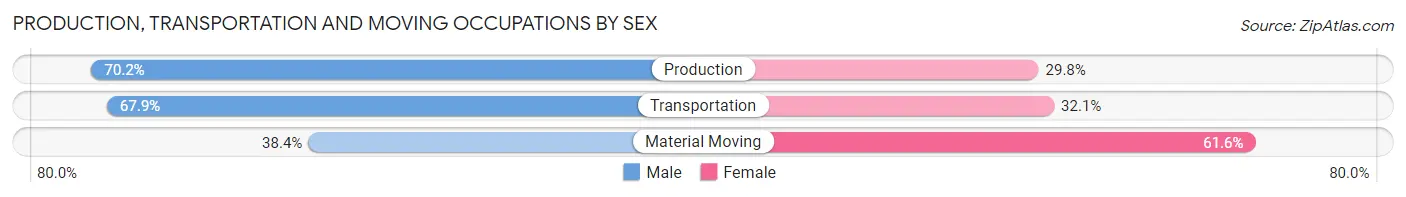
| Occupation | Male | Female |
| Production | 325 (70.2%) | 138 (29.8%) |
| Transportation | 91 (67.9%) | 43 (32.1%) |
| Material Moving | 76 (38.4%) | 122 (61.6%) |
| Total (Category) | 492 (61.9%) | 303 (38.1%) |
| Total (Overall) | 3,042 (54.3%) | 2,559 (45.7%) |
Employment Industries by Sex in Roscoe
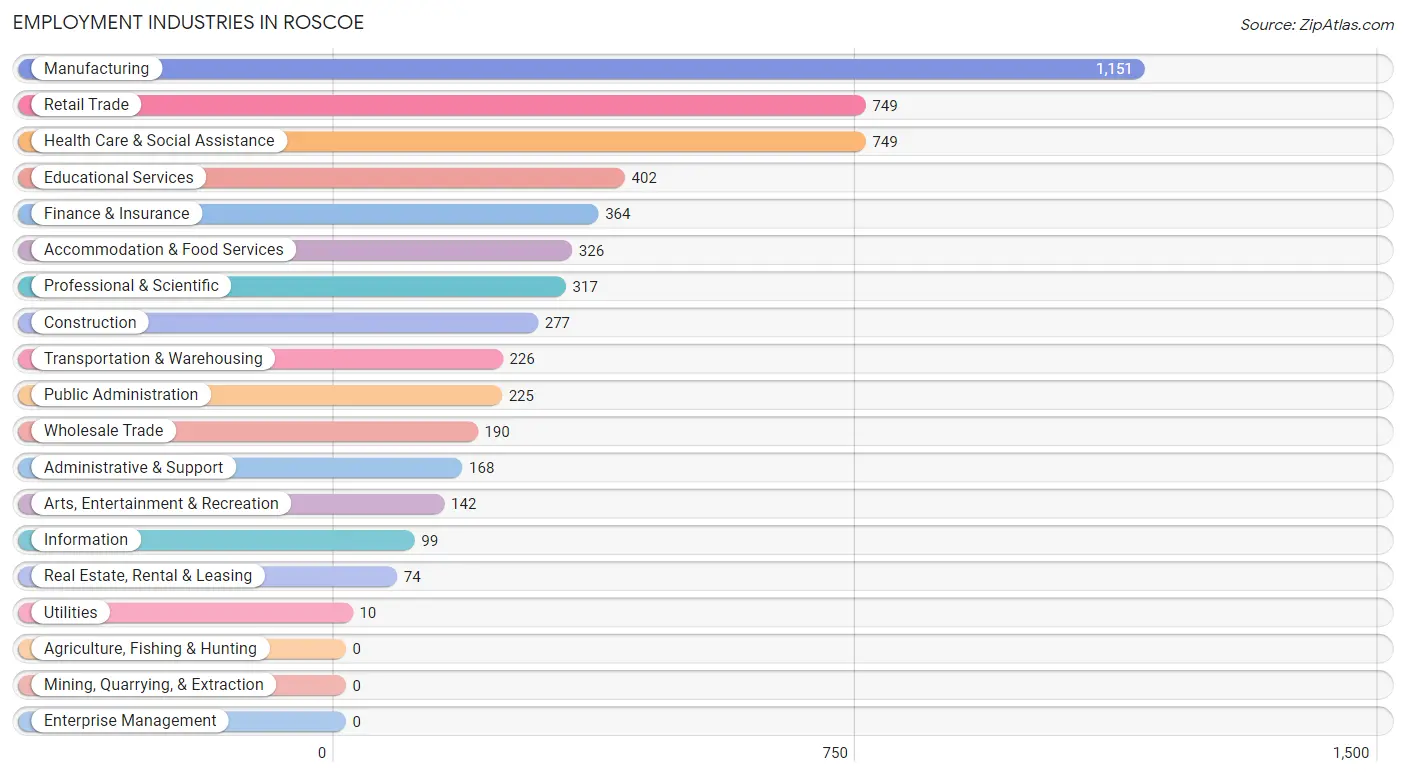
Employment Industries in Roscoe
The major employment industries in Roscoe include Manufacturing (1,151 | 20.5%), Retail Trade (749 | 13.4%), Health Care & Social Assistance (749 | 13.4%), Educational Services (402 | 7.2%), and Finance & Insurance (364 | 6.5%).
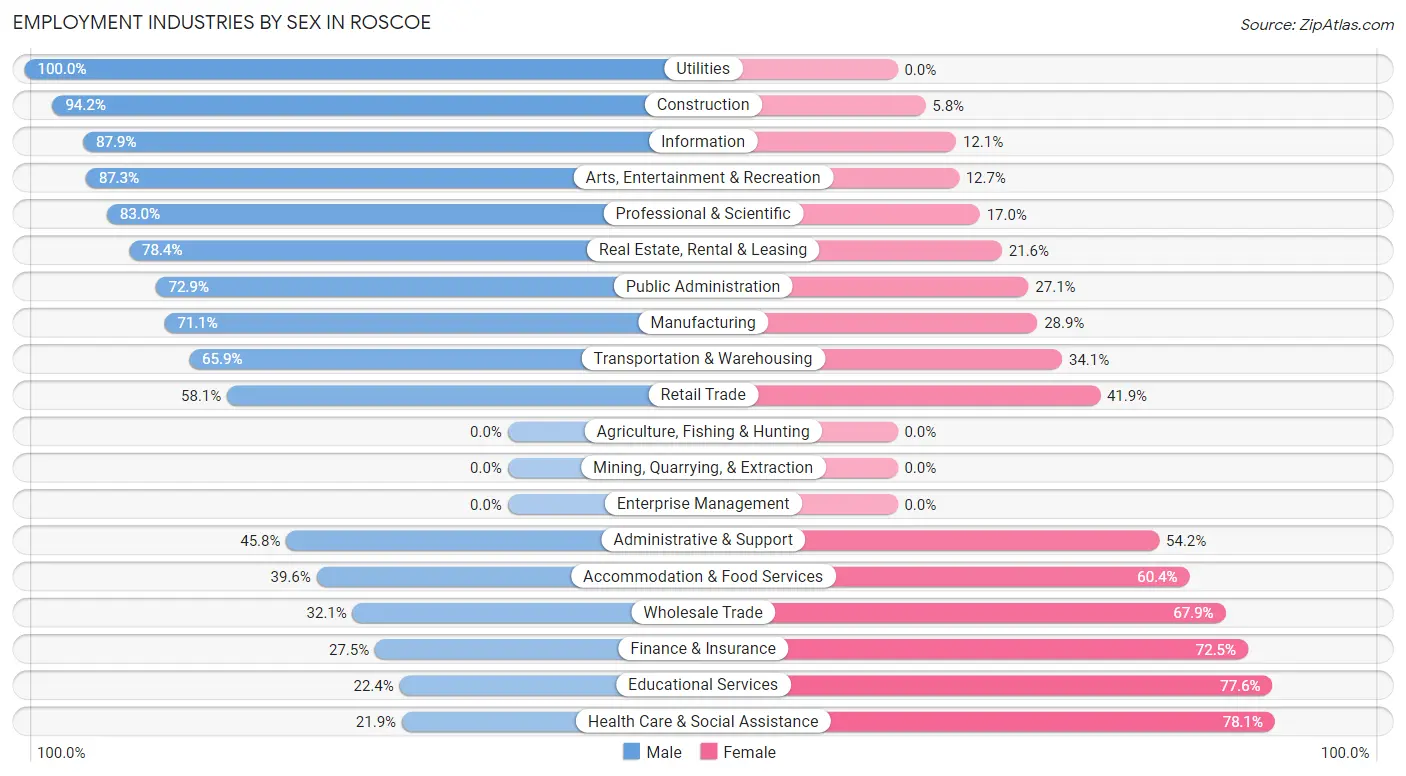
Employment Industries by Sex in Roscoe
The Roscoe industries that see more men than women are Utilities (100.0%), Construction (94.2%), and Information (87.9%), whereas the industries that tend to have a higher number of women are Health Care & Social Assistance (78.1%), Educational Services (77.6%), and Finance & Insurance (72.5%).
| Industry | Male | Female |
| Agriculture, Fishing & Hunting | 0 (0.0%) | 0 (0.0%) |
| Mining, Quarrying, & Extraction | 0 (0.0%) | 0 (0.0%) |
| Construction | 261 (94.2%) | 16 (5.8%) |
| Manufacturing | 818 (71.1%) | 333 (28.9%) |
| Wholesale Trade | 61 (32.1%) | 129 (67.9%) |
| Retail Trade | 435 (58.1%) | 314 (41.9%) |
| Transportation & Warehousing | 149 (65.9%) | 77 (34.1%) |
| Utilities | 10 (100.0%) | 0 (0.0%) |
| Information | 87 (87.9%) | 12 (12.1%) |
| Finance & Insurance | 100 (27.5%) | 264 (72.5%) |
| Real Estate, Rental & Leasing | 58 (78.4%) | 16 (21.6%) |
| Professional & Scientific | 263 (83.0%) | 54 (17.0%) |
| Enterprise Management | 0 (0.0%) | 0 (0.0%) |
| Administrative & Support | 77 (45.8%) | 91 (54.2%) |
| Educational Services | 90 (22.4%) | 312 (77.6%) |
| Health Care & Social Assistance | 164 (21.9%) | 585 (78.1%) |
| Arts, Entertainment & Recreation | 124 (87.3%) | 18 (12.7%) |
| Accommodation & Food Services | 129 (39.6%) | 197 (60.4%) |
| Public Administration | 164 (72.9%) | 61 (27.1%) |
| Total | 3,042 (54.3%) | 2,559 (45.7%) |
Education in Roscoe
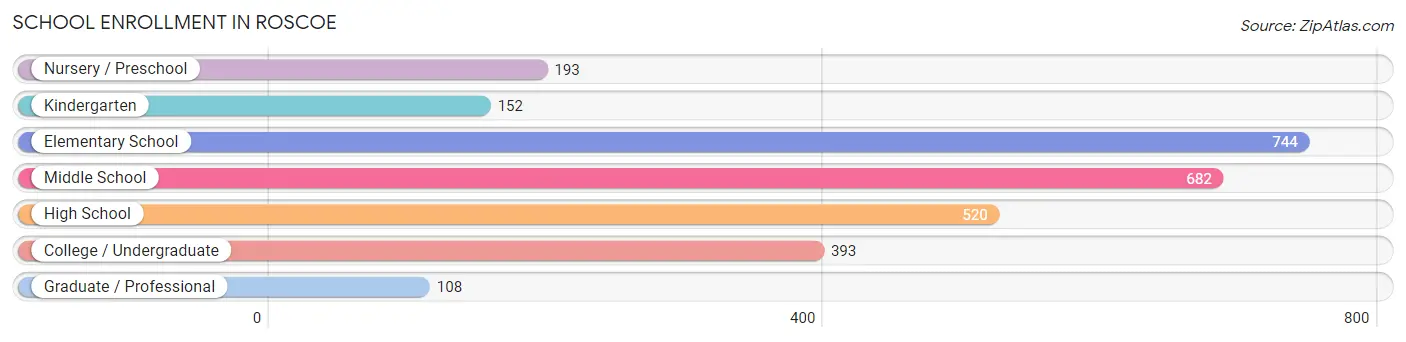
School Enrollment in Roscoe
The most common levels of schooling among the 2,792 students in Roscoe are elementary school (744 | 26.7%), middle school (682 | 24.4%), and high school (520 | 18.6%).
| School Level | # Students | % Students |
| Nursery / Preschool | 193 | 6.9% |
| Kindergarten | 152 | 5.4% |
| Elementary School | 744 | 26.7% |
| Middle School | 682 | 24.4% |
| High School | 520 | 18.6% |
| College / Undergraduate | 393 | 14.1% |
| Graduate / Professional | 108 | 3.9% |
| Total | 2,792 | 100.0% |
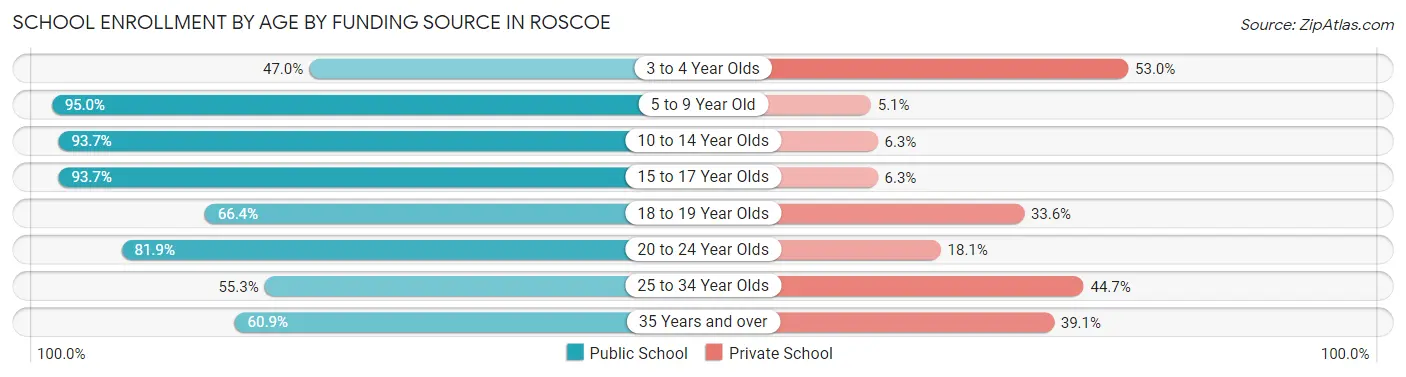
School Enrollment by Age by Funding Source in Roscoe
Out of a total of 2,792 students who are enrolled in schools in Roscoe, 371 (13.3%) attend a private institution, while the remaining 2,421 (86.7%) are enrolled in public schools. The age group of 3 to 4 year olds has the highest likelihood of being enrolled in private schools, with 89 (53.0% in the age bracket) enrolled. Conversely, the age group of 5 to 9 year old has the lowest likelihood of being enrolled in a private school, with 828 (95.0% in the age bracket) attending a public institution.
| Age Bracket | Public School | Private School |
| 3 to 4 Year Olds | 79 (47.0%) | 89 (53.0%) |
| 5 to 9 Year Old | 828 (95.0%) | 44 (5.1%) |
| 10 to 14 Year Olds | 743 (93.7%) | 50 (6.3%) |
| 15 to 17 Year Olds | 341 (93.7%) | 23 (6.3%) |
| 18 to 19 Year Olds | 89 (66.4%) | 45 (33.6%) |
| 20 to 24 Year Olds | 245 (81.9%) | 54 (18.1%) |
| 25 to 34 Year Olds | 26 (55.3%) | 21 (44.7%) |
| 35 Years and over | 70 (60.9%) | 45 (39.1%) |
| Total | 2,421 (86.7%) | 371 (13.3%) |
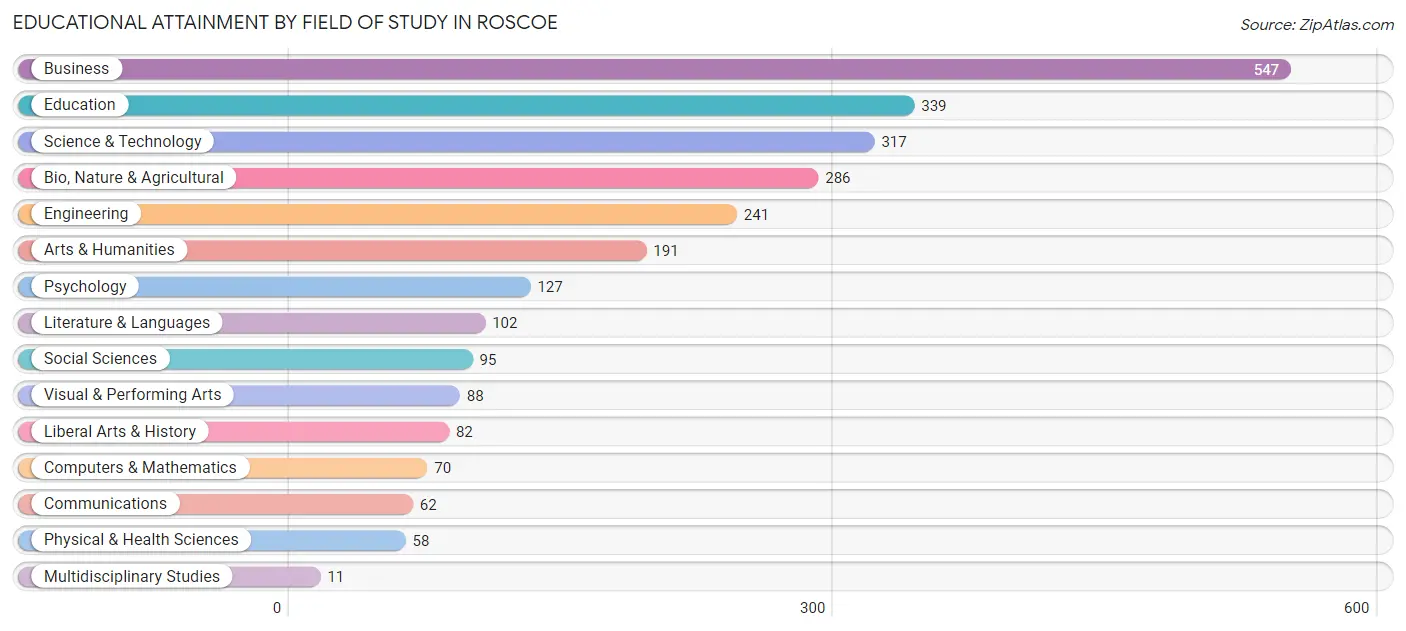
Educational Attainment by Field of Study in Roscoe
Business (547 | 20.9%), education (339 | 13.0%), science & technology (317 | 12.1%), bio, nature & agricultural (286 | 10.9%), and engineering (241 | 9.2%) are the most common fields of study among 2,616 individuals in Roscoe who have obtained a bachelor's degree or higher.
| Field of Study | # Graduates | % Graduates |
| Computers & Mathematics | 70 | 2.7% |
| Bio, Nature & Agricultural | 286 | 10.9% |
| Physical & Health Sciences | 58 | 2.2% |
| Psychology | 127 | 4.9% |
| Social Sciences | 95 | 3.6% |
| Engineering | 241 | 9.2% |
| Multidisciplinary Studies | 11 | 0.4% |
| Science & Technology | 317 | 12.1% |
| Business | 547 | 20.9% |
| Education | 339 | 13.0% |
| Literature & Languages | 102 | 3.9% |
| Liberal Arts & History | 82 | 3.1% |
| Visual & Performing Arts | 88 | 3.4% |
| Communications | 62 | 2.4% |
| Arts & Humanities | 191 | 7.3% |
| Total | 2,616 | 100.0% |
Transportation & Commute in Roscoe
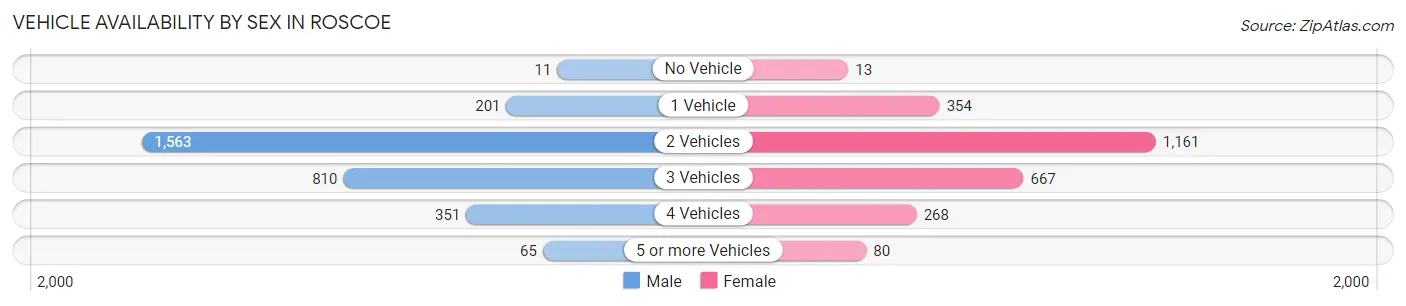
Vehicle Availability by Sex in Roscoe
The most prevalent vehicle ownership categories in Roscoe are males with 2 vehicles (1,563, accounting for 52.1%) and females with 2 vehicles (1,161, making up 61.5%).
| Vehicles Available | Male | Female |
| No Vehicle | 11 (0.4%) | 13 (0.5%) |
| 1 Vehicle | 201 (6.7%) | 354 (13.9%) |
| 2 Vehicles | 1,563 (52.1%) | 1,161 (45.7%) |
| 3 Vehicles | 810 (27.0%) | 667 (26.2%) |
| 4 Vehicles | 351 (11.7%) | 268 (10.5%) |
| 5 or more Vehicles | 65 (2.2%) | 80 (3.2%) |
| Total | 3,001 (100.0%) | 2,543 (100.0%) |
Commute Time in Roscoe
The most frequently occuring commute durations in Roscoe are 20 to 24 minutes (1,119 commuters, 22.9%), 15 to 19 minutes (830 commuters, 17.0%), and 30 to 34 minutes (707 commuters, 14.4%).
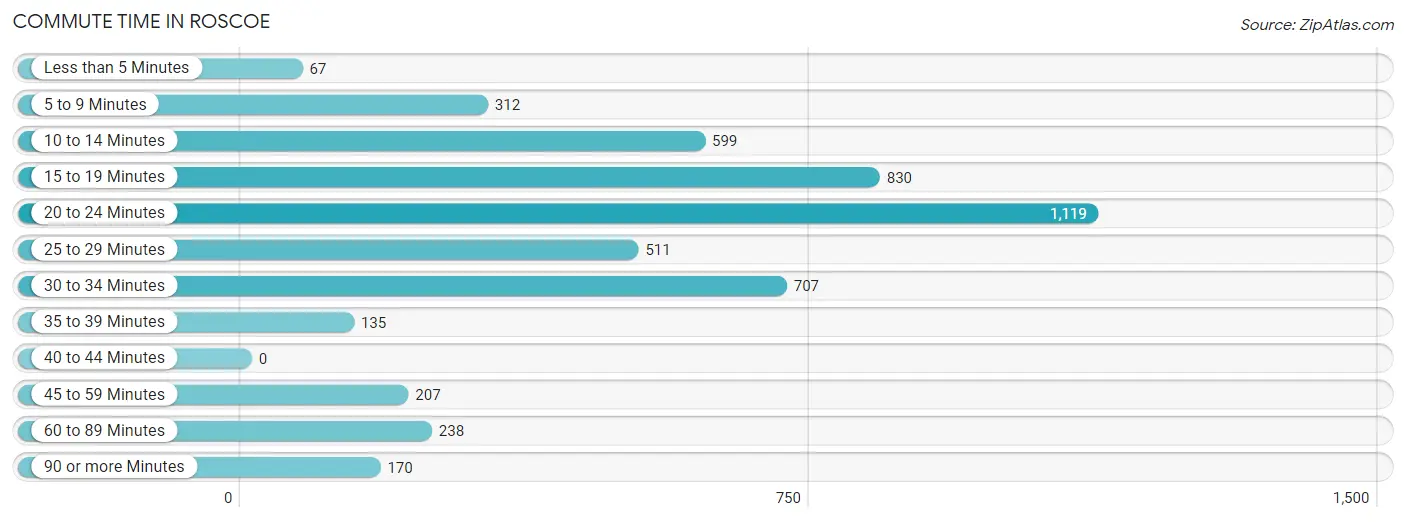
| Commute Time | # Commuters | % Commuters |
| Less than 5 Minutes | 67 | 1.4% |
| 5 to 9 Minutes | 312 | 6.4% |
| 10 to 14 Minutes | 599 | 12.2% |
| 15 to 19 Minutes | 830 | 17.0% |
| 20 to 24 Minutes | 1,119 | 22.9% |
| 25 to 29 Minutes | 511 | 10.4% |
| 30 to 34 Minutes | 707 | 14.4% |
| 35 to 39 Minutes | 135 | 2.8% |
| 40 to 44 Minutes | 0 | 0.0% |
| 45 to 59 Minutes | 207 | 4.2% |
| 60 to 89 Minutes | 238 | 4.9% |
| 90 or more Minutes | 170 | 3.5% |
Commute Time by Sex in Roscoe
The most common commute times in Roscoe are 20 to 24 minutes (680 commuters, 25.7%) for males and 15 to 19 minutes (476 commuters, 21.2%) for females.
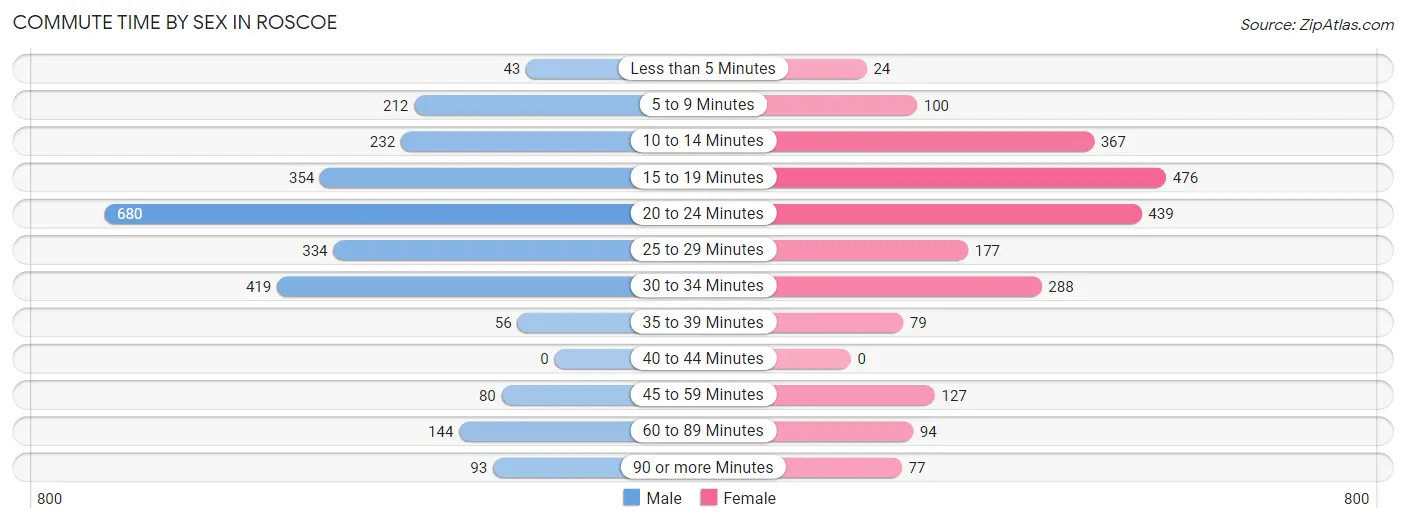
| Commute Time | Male | Female |
| Less than 5 Minutes | 43 (1.6%) | 24 (1.1%) |
| 5 to 9 Minutes | 212 (8.0%) | 100 (4.4%) |
| 10 to 14 Minutes | 232 (8.8%) | 367 (16.3%) |
| 15 to 19 Minutes | 354 (13.4%) | 476 (21.2%) |
| 20 to 24 Minutes | 680 (25.7%) | 439 (19.5%) |
| 25 to 29 Minutes | 334 (12.6%) | 177 (7.9%) |
| 30 to 34 Minutes | 419 (15.8%) | 288 (12.8%) |
| 35 to 39 Minutes | 56 (2.1%) | 79 (3.5%) |
| 40 to 44 Minutes | 0 (0.0%) | 0 (0.0%) |
| 45 to 59 Minutes | 80 (3.0%) | 127 (5.7%) |
| 60 to 89 Minutes | 144 (5.4%) | 94 (4.2%) |
| 90 or more Minutes | 93 (3.5%) | 77 (3.4%) |
Time of Departure to Work by Sex in Roscoe
The most frequent times of departure to work in Roscoe are 7:00 AM to 7:29 AM (406, 15.3%) for males and 7:30 AM to 7:59 AM (415, 18.5%) for females.
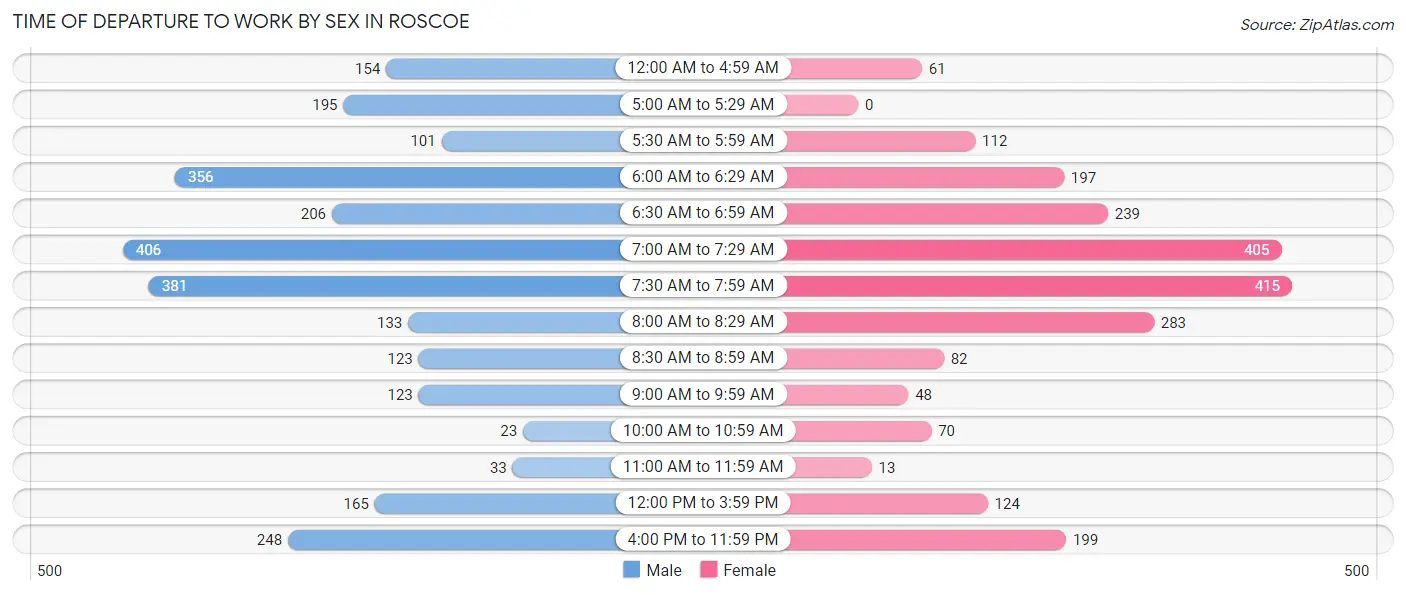
| Time of Departure | Male | Female |
| 12:00 AM to 4:59 AM | 154 (5.8%) | 61 (2.7%) |
| 5:00 AM to 5:29 AM | 195 (7.4%) | 0 (0.0%) |
| 5:30 AM to 5:59 AM | 101 (3.8%) | 112 (5.0%) |
| 6:00 AM to 6:29 AM | 356 (13.5%) | 197 (8.8%) |
| 6:30 AM to 6:59 AM | 206 (7.8%) | 239 (10.6%) |
| 7:00 AM to 7:29 AM | 406 (15.3%) | 405 (18.0%) |
| 7:30 AM to 7:59 AM | 381 (14.4%) | 415 (18.5%) |
| 8:00 AM to 8:29 AM | 133 (5.0%) | 283 (12.6%) |
| 8:30 AM to 8:59 AM | 123 (4.6%) | 82 (3.6%) |
| 9:00 AM to 9:59 AM | 123 (4.6%) | 48 (2.1%) |
| 10:00 AM to 10:59 AM | 23 (0.9%) | 70 (3.1%) |
| 11:00 AM to 11:59 AM | 33 (1.3%) | 13 (0.6%) |
| 12:00 PM to 3:59 PM | 165 (6.2%) | 124 (5.5%) |
| 4:00 PM to 11:59 PM | 248 (9.4%) | 199 (8.8%) |
| Total | 2,647 (100.0%) | 2,248 (100.0%) |
Housing Occupancy in Roscoe
Occupancy by Ownership in Roscoe
Of the total 4,023 dwellings in Roscoe, owner-occupied units account for 2,940 (73.1%), while renter-occupied units make up 1,083 (26.9%).
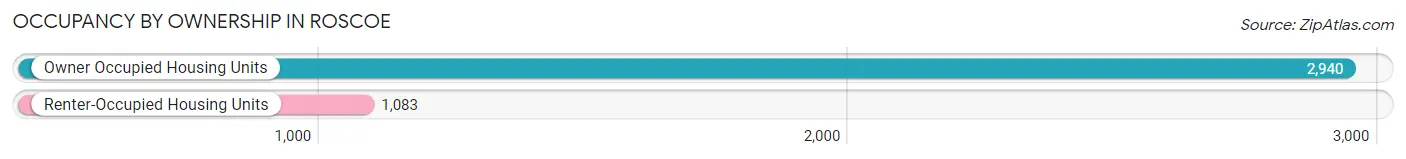
| Occupancy | # Housing Units | % Housing Units |
| Owner Occupied Housing Units | 2,940 | 73.1% |
| Renter-Occupied Housing Units | 1,083 | 26.9% |
| Total Occupied Housing Units | 4,023 | 100.0% |
Occupancy by Household Size in Roscoe
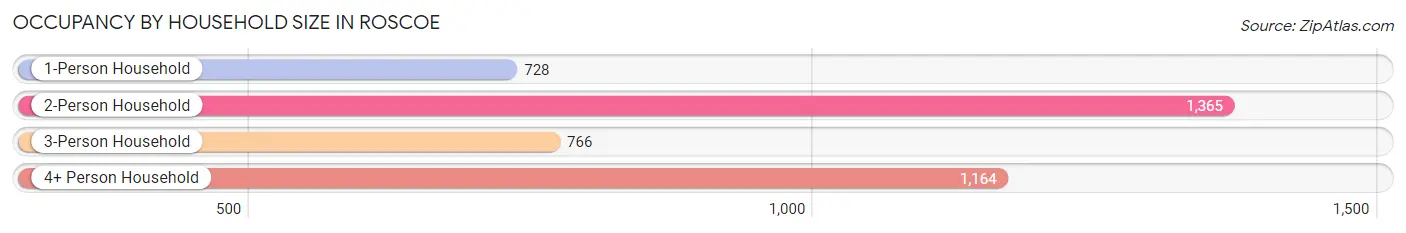
| Household Size | # Housing Units | % Housing Units |
| 1-Person Household | 728 | 18.1% |
| 2-Person Household | 1,365 | 33.9% |
| 3-Person Household | 766 | 19.0% |
| 4+ Person Household | 1,164 | 28.9% |
| Total Housing Units | 4,023 | 100.0% |
Occupancy by Ownership by Household Size in Roscoe
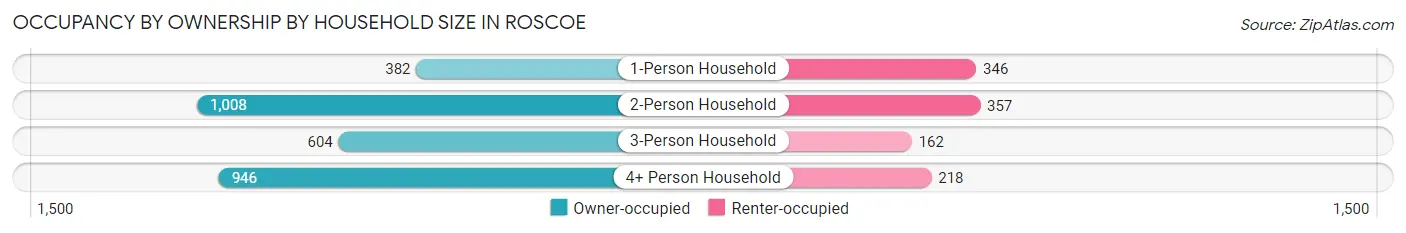
| Household Size | Owner-occupied | Renter-occupied |
| 1-Person Household | 382 (52.5%) | 346 (47.5%) |
| 2-Person Household | 1,008 (73.9%) | 357 (26.2%) |
| 3-Person Household | 604 (78.8%) | 162 (21.1%) |
| 4+ Person Household | 946 (81.3%) | 218 (18.7%) |
| Total Housing Units | 2,940 (73.1%) | 1,083 (26.9%) |
Occupancy by Educational Attainment in Roscoe
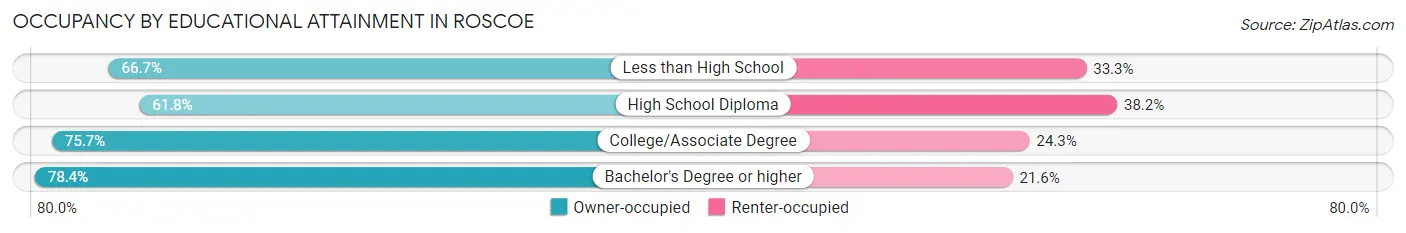
| Household Size | Owner-occupied | Renter-occupied |
| Less than High School | 58 (66.7%) | 29 (33.3%) |
| High School Diploma | 608 (61.8%) | 376 (38.2%) |
| College/Associate Degree | 1,104 (75.7%) | 355 (24.3%) |
| Bachelor's Degree or higher | 1,170 (78.4%) | 323 (21.6%) |
Occupancy by Age of Householder in Roscoe
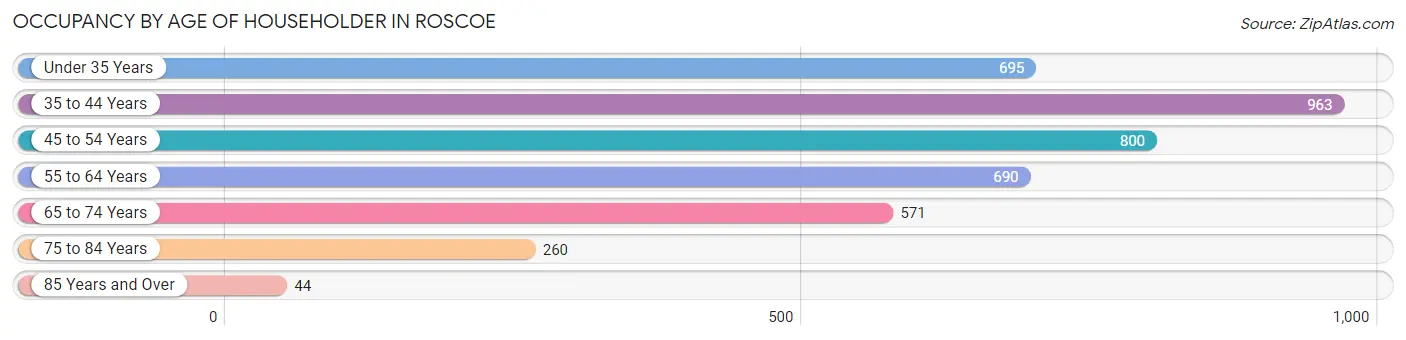
| Age Bracket | # Households | % Households |
| Under 35 Years | 695 | 17.3% |
| 35 to 44 Years | 963 | 23.9% |
| 45 to 54 Years | 800 | 19.9% |
| 55 to 64 Years | 690 | 17.2% |
| 65 to 74 Years | 571 | 14.2% |
| 75 to 84 Years | 260 | 6.5% |
| 85 Years and Over | 44 | 1.1% |
| Total | 4,023 | 100.0% |
Housing Finances in Roscoe
Median Income by Occupancy in Roscoe
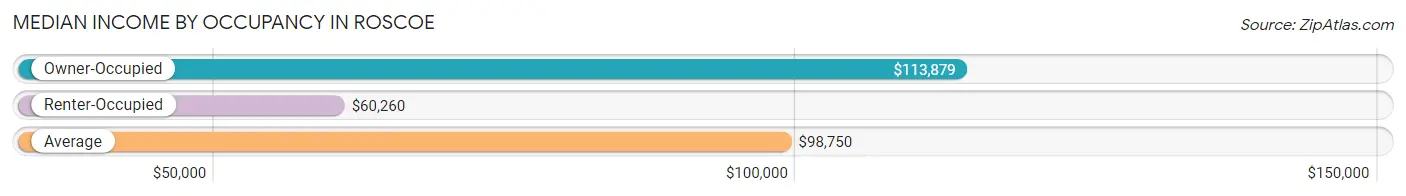
| Occupancy Type | # Households | Median Income |
| Owner-Occupied | 2,940 (73.1%) | $113,879 |
| Renter-Occupied | 1,083 (26.9%) | $60,260 |
| Average | 4,023 (100.0%) | $98,750 |
Occupancy by Householder Income Bracket in Roscoe
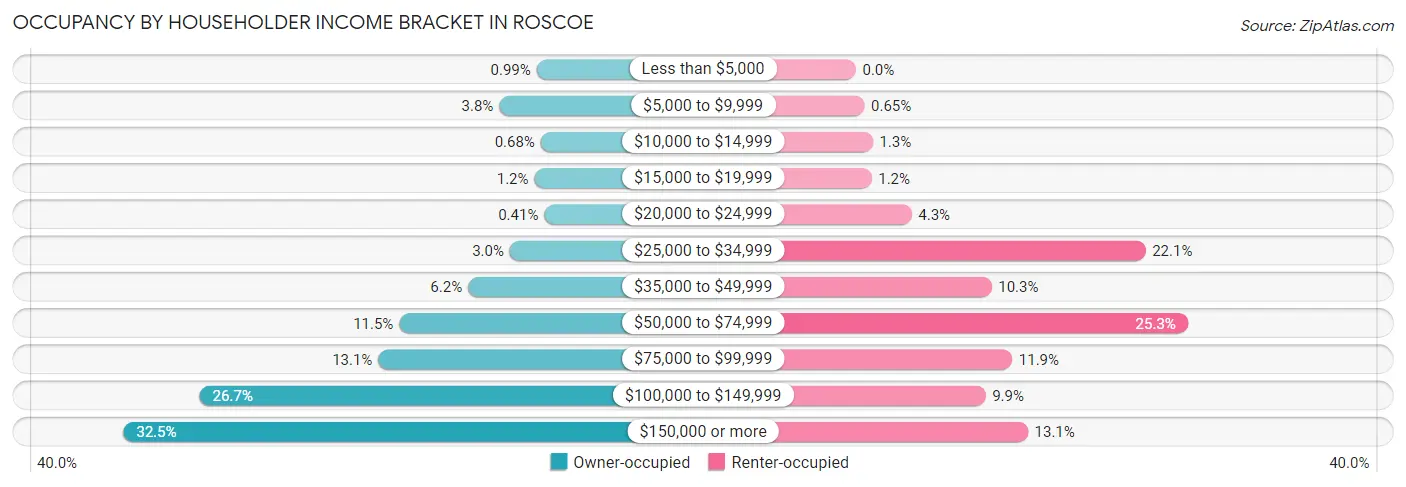
| Income Bracket | Owner-occupied | Renter-occupied |
| Less than $5,000 | 29 (1.0%) | 0 (0.0%) |
| $5,000 to $9,999 | 113 (3.8%) | 7 (0.6%) |
| $10,000 to $14,999 | 20 (0.7%) | 14 (1.3%) |
| $15,000 to $19,999 | 34 (1.2%) | 13 (1.2%) |
| $20,000 to $24,999 | 12 (0.4%) | 46 (4.3%) |
| $25,000 to $34,999 | 89 (3.0%) | 239 (22.1%) |
| $35,000 to $49,999 | 183 (6.2%) | 112 (10.3%) |
| $50,000 to $74,999 | 337 (11.5%) | 274 (25.3%) |
| $75,000 to $99,999 | 384 (13.1%) | 129 (11.9%) |
| $100,000 to $149,999 | 784 (26.7%) | 107 (9.9%) |
| $150,000 or more | 955 (32.5%) | 142 (13.1%) |
| Total | 2,940 (100.0%) | 1,083 (100.0%) |
Monthly Housing Cost Tiers in Roscoe
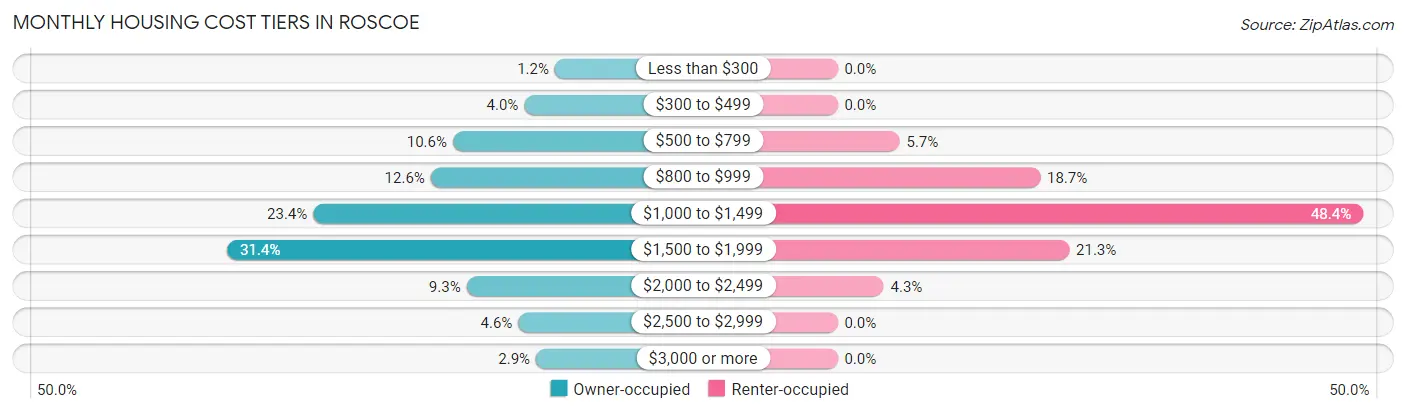
| Monthly Cost | Owner-occupied | Renter-occupied |
| Less than $300 | 35 (1.2%) | 0 (0.0%) |
| $300 to $499 | 118 (4.0%) | 0 (0.0%) |
| $500 to $799 | 311 (10.6%) | 62 (5.7%) |
| $800 to $999 | 371 (12.6%) | 202 (18.6%) |
| $1,000 to $1,499 | 689 (23.4%) | 524 (48.4%) |
| $1,500 to $1,999 | 922 (31.4%) | 231 (21.3%) |
| $2,000 to $2,499 | 274 (9.3%) | 46 (4.3%) |
| $2,500 to $2,999 | 134 (4.6%) | 0 (0.0%) |
| $3,000 or more | 86 (2.9%) | 0 (0.0%) |
| Total | 2,940 (100.0%) | 1,083 (100.0%) |
Physical Housing Characteristics in Roscoe
Housing Structures in Roscoe
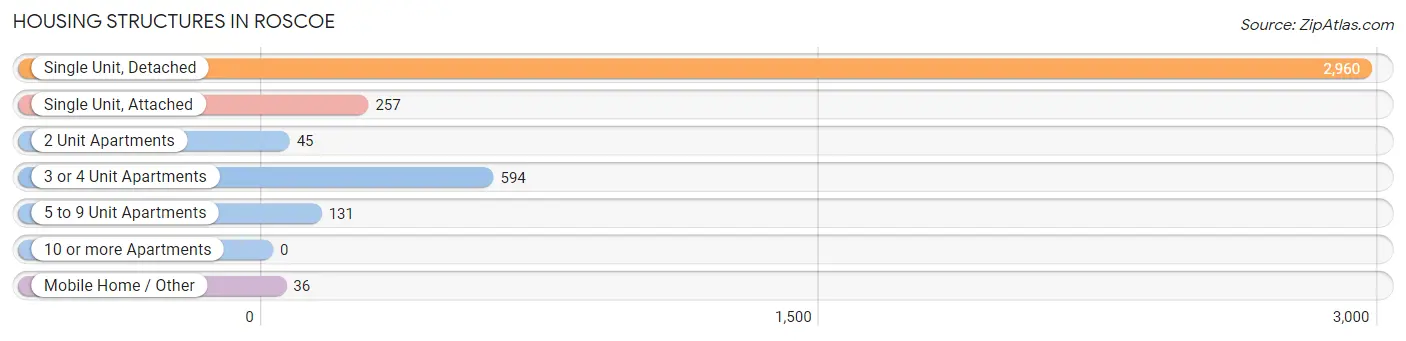
| Structure Type | # Housing Units | % Housing Units |
| Single Unit, Detached | 2,960 | 73.6% |
| Single Unit, Attached | 257 | 6.4% |
| 2 Unit Apartments | 45 | 1.1% |
| 3 or 4 Unit Apartments | 594 | 14.8% |
| 5 to 9 Unit Apartments | 131 | 3.3% |
| 10 or more Apartments | 0 | 0.0% |
| Mobile Home / Other | 36 | 0.9% |
| Total | 4,023 | 100.0% |
Housing Structures by Occupancy in Roscoe
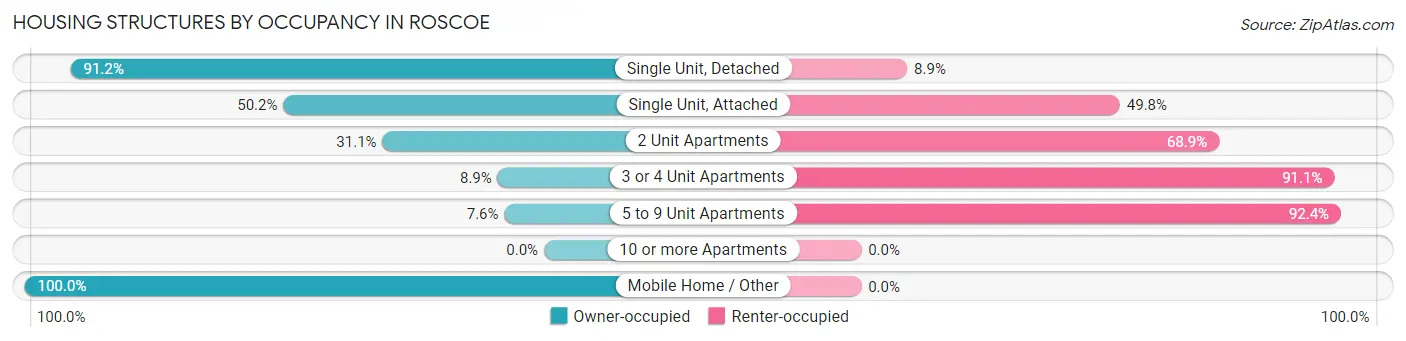
| Structure Type | Owner-occupied | Renter-occupied |
| Single Unit, Detached | 2,698 (91.1%) | 262 (8.8%) |
| Single Unit, Attached | 129 (50.2%) | 128 (49.8%) |
| 2 Unit Apartments | 14 (31.1%) | 31 (68.9%) |
| 3 or 4 Unit Apartments | 53 (8.9%) | 541 (91.1%) |
| 5 to 9 Unit Apartments | 10 (7.6%) | 121 (92.4%) |
| 10 or more Apartments | 0 (0.0%) | 0 (0.0%) |
| Mobile Home / Other | 36 (100.0%) | 0 (0.0%) |
| Total | 2,940 (73.1%) | 1,083 (26.9%) |
Housing Structures by Number of Rooms in Roscoe
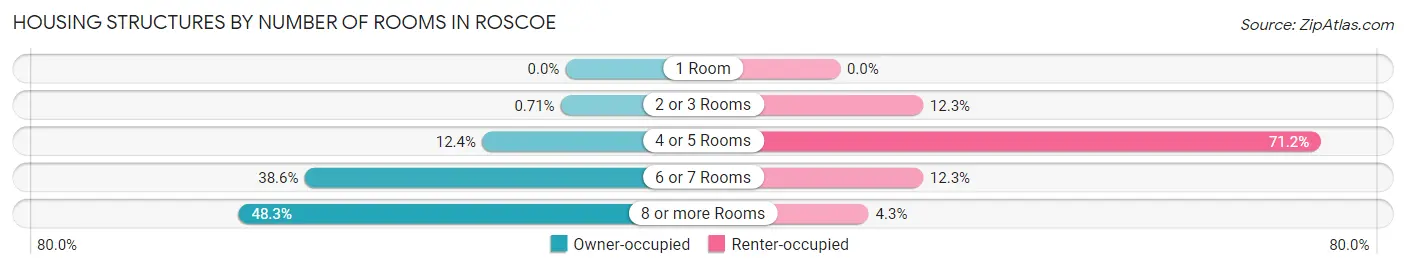
| Number of Rooms | Owner-occupied | Renter-occupied |
| 1 Room | 0 (0.0%) | 0 (0.0%) |
| 2 or 3 Rooms | 21 (0.7%) | 133 (12.3%) |
| 4 or 5 Rooms | 363 (12.3%) | 771 (71.2%) |
| 6 or 7 Rooms | 1,135 (38.6%) | 133 (12.3%) |
| 8 or more Rooms | 1,421 (48.3%) | 46 (4.3%) |
| Total | 2,940 (100.0%) | 1,083 (100.0%) |
Housing Structure by Heating Type in Roscoe
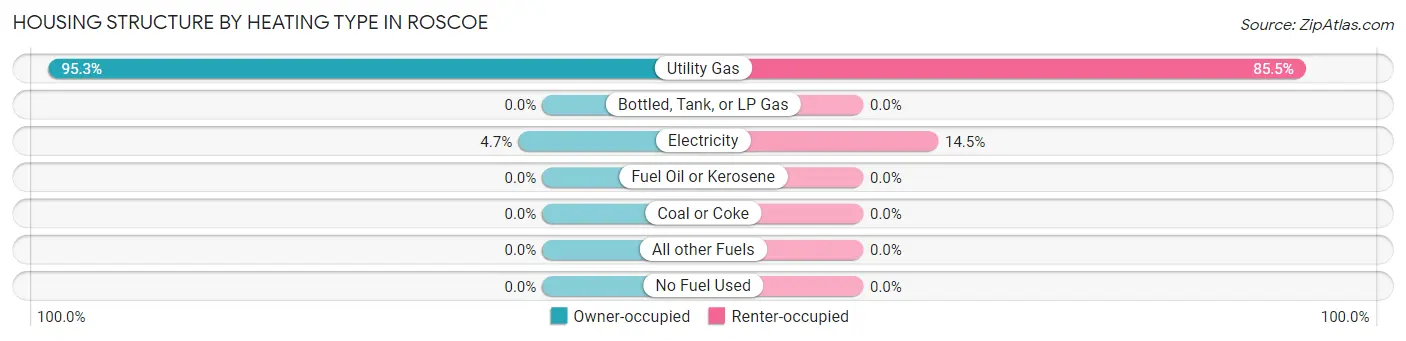
| Heating Type | Owner-occupied | Renter-occupied |
| Utility Gas | 2,803 (95.3%) | 926 (85.5%) |
| Bottled, Tank, or LP Gas | 0 (0.0%) | 0 (0.0%) |
| Electricity | 137 (4.7%) | 157 (14.5%) |
| Fuel Oil or Kerosene | 0 (0.0%) | 0 (0.0%) |
| Coal or Coke | 0 (0.0%) | 0 (0.0%) |
| All other Fuels | 0 (0.0%) | 0 (0.0%) |
| No Fuel Used | 0 (0.0%) | 0 (0.0%) |
| Total | 2,940 (100.0%) | 1,083 (100.0%) |
Household Vehicle Usage in Roscoe
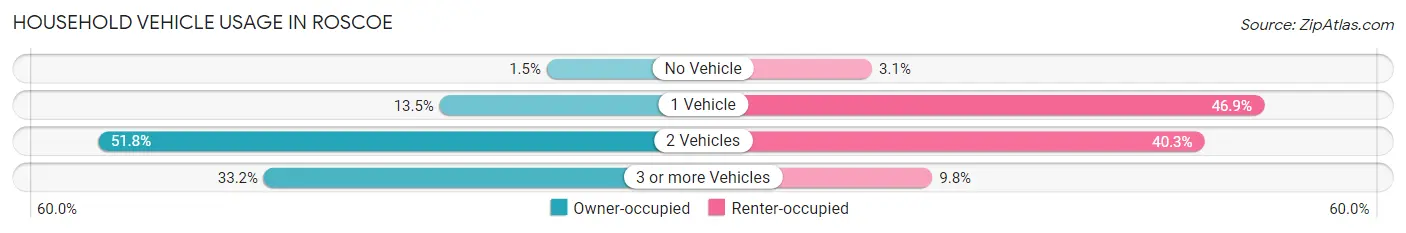
| Vehicles per Household | Owner-occupied | Renter-occupied |
| No Vehicle | 44 (1.5%) | 33 (3.0%) |
| 1 Vehicle | 397 (13.5%) | 508 (46.9%) |
| 2 Vehicles | 1,523 (51.8%) | 436 (40.3%) |
| 3 or more Vehicles | 976 (33.2%) | 106 (9.8%) |
| Total | 2,940 (100.0%) | 1,083 (100.0%) |
Real Estate & Mortgages in Roscoe
Real Estate and Mortgage Overview in Roscoe
| Characteristic | Without Mortgage | With Mortgage |
| Housing Units | 797 | 2,143 |
| Median Property Value | $230,800 | $209,300 |
| Median Household Income | $112,999 | $770 |
| Monthly Housing Costs | $856 | $74 |
| Real Estate Taxes | $6,589 | $54 |
Property Value by Mortgage Status in Roscoe
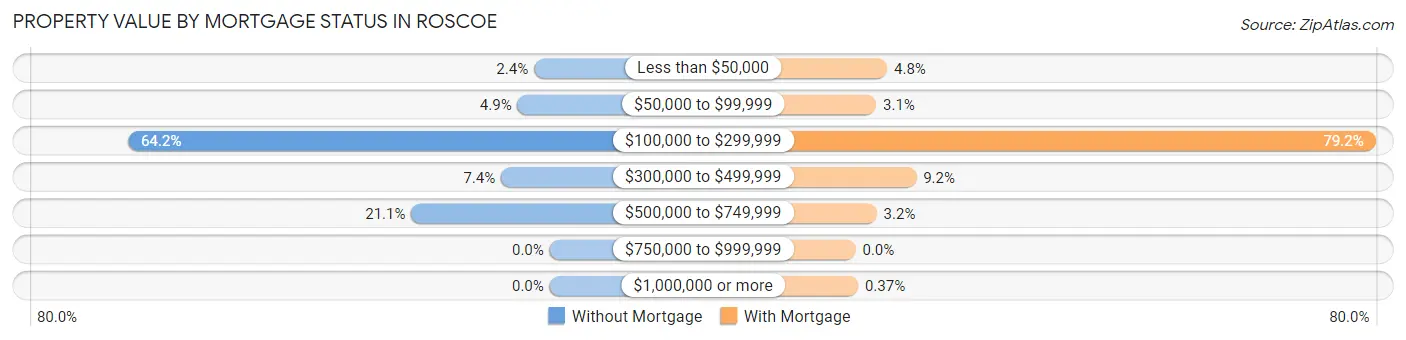
| Property Value | Without Mortgage | With Mortgage |
| Less than $50,000 | 19 (2.4%) | 103 (4.8%) |
| $50,000 to $99,999 | 39 (4.9%) | 67 (3.1%) |
| $100,000 to $299,999 | 512 (64.2%) | 1,698 (79.2%) |
| $300,000 to $499,999 | 59 (7.4%) | 198 (9.2%) |
| $500,000 to $749,999 | 168 (21.1%) | 69 (3.2%) |
| $750,000 to $999,999 | 0 (0.0%) | 0 (0.0%) |
| $1,000,000 or more | 0 (0.0%) | 8 (0.4%) |
| Total | 797 (100.0%) | 2,143 (100.0%) |
Household Income by Mortgage Status in Roscoe
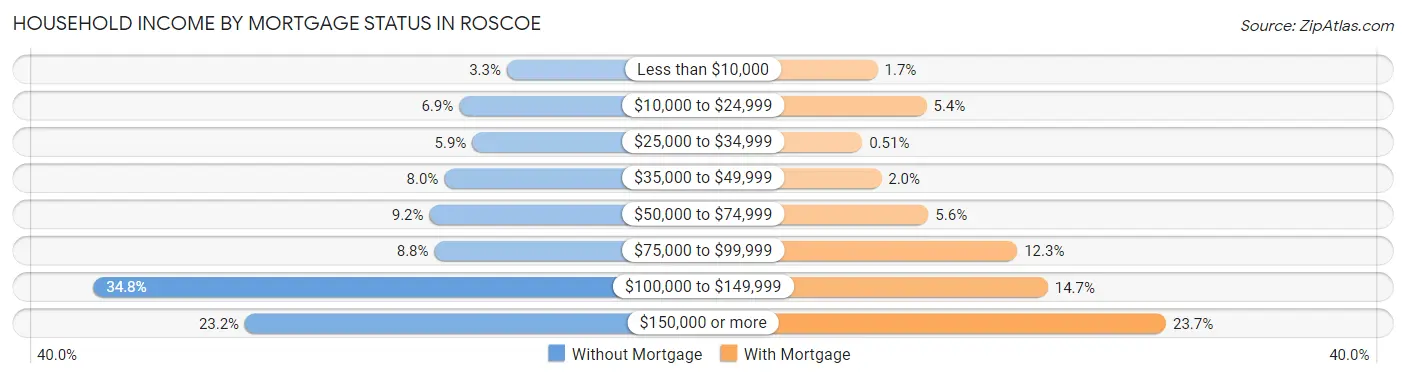
| Household Income | Without Mortgage | With Mortgage |
| Less than $10,000 | 26 (3.3%) | 36 (1.7%) |
| $10,000 to $24,999 | 55 (6.9%) | 116 (5.4%) |
| $25,000 to $34,999 | 47 (5.9%) | 11 (0.5%) |
| $35,000 to $49,999 | 64 (8.0%) | 42 (2.0%) |
| $50,000 to $74,999 | 73 (9.2%) | 119 (5.6%) |
| $75,000 to $99,999 | 70 (8.8%) | 264 (12.3%) |
| $100,000 to $149,999 | 277 (34.8%) | 314 (14.6%) |
| $150,000 or more | 185 (23.2%) | 507 (23.7%) |
| Total | 797 (100.0%) | 2,143 (100.0%) |
Property Value to Household Income Ratio in Roscoe
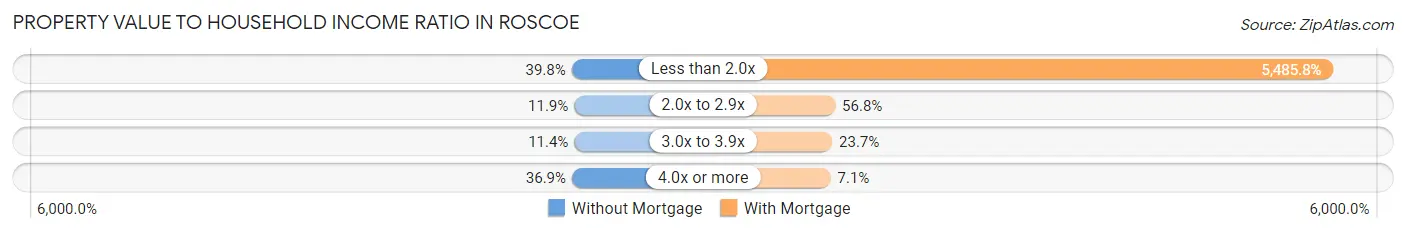
| Value-to-Income Ratio | Without Mortgage | With Mortgage |
| Less than 2.0x | 317 (39.8%) | 117,561 (5,485.8%) |
| 2.0x to 2.9x | 95 (11.9%) | 1,218 (56.8%) |
| 3.0x to 3.9x | 91 (11.4%) | 508 (23.7%) |
| 4.0x or more | 294 (36.9%) | 153 (7.1%) |
| Total | 797 (100.0%) | 2,143 (100.0%) |
Real Estate Taxes by Mortgage Status in Roscoe
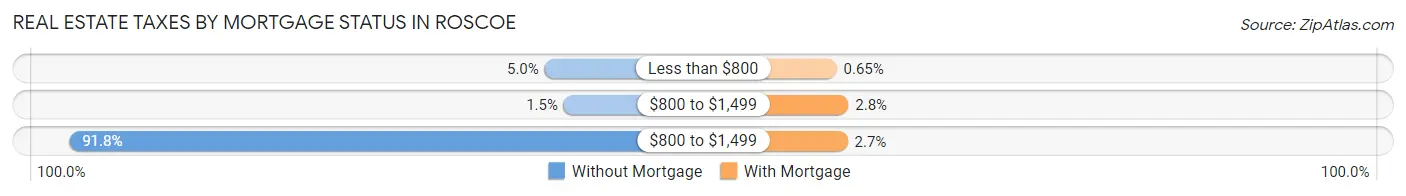
| Property Taxes | Without Mortgage | With Mortgage |
| Less than $800 | 40 (5.0%) | 14 (0.6%) |
| $800 to $1,499 | 12 (1.5%) | 60 (2.8%) |
| $800 to $1,499 | 732 (91.8%) | 57 (2.7%) |
| Total | 797 (100.0%) | 2,143 (100.0%) |
Health & Disability in Roscoe
Health Insurance Coverage by Age in Roscoe
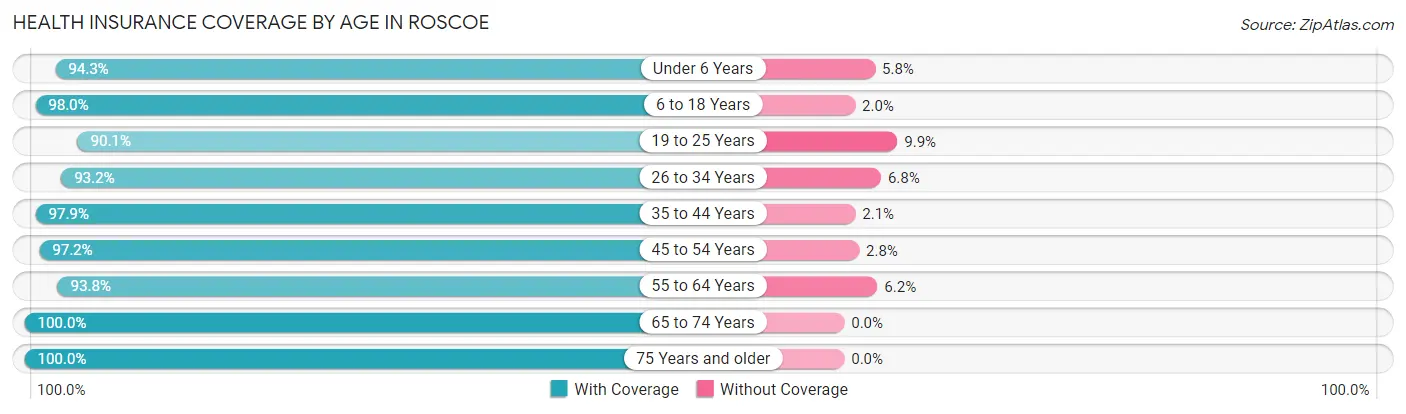
| Age Bracket | With Coverage | Without Coverage |
| Under 6 Years | 1,163 (94.3%) | 71 (5.8%) |
| 6 to 18 Years | 2,091 (98.0%) | 43 (2.0%) |
| 19 to 25 Years | 720 (90.1%) | 79 (9.9%) |
| 26 to 34 Years | 1,157 (93.2%) | 85 (6.8%) |
| 35 to 44 Years | 1,618 (97.9%) | 34 (2.1%) |
| 45 to 54 Years | 1,516 (97.2%) | 43 (2.8%) |
| 55 to 64 Years | 1,035 (93.8%) | 68 (6.2%) |
| 65 to 74 Years | 872 (100.0%) | 0 (0.0%) |
| 75 Years and older | 527 (100.0%) | 0 (0.0%) |
| Total | 10,699 (96.2%) | 423 (3.8%) |
Health Insurance Coverage by Citizenship Status in Roscoe
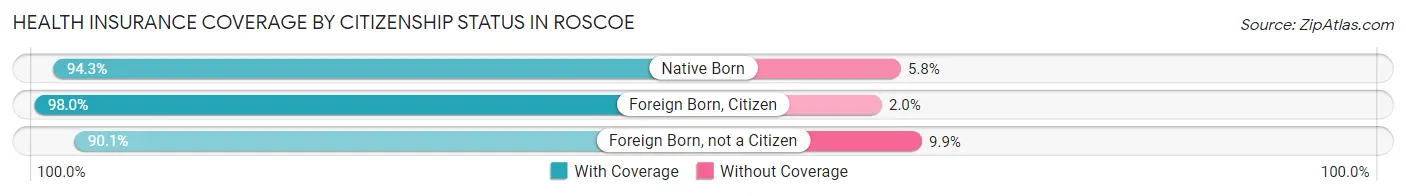
| Citizenship Status | With Coverage | Without Coverage |
| Native Born | 1,163 (94.3%) | 71 (5.8%) |
| Foreign Born, Citizen | 2,091 (98.0%) | 43 (2.0%) |
| Foreign Born, not a Citizen | 720 (90.1%) | 79 (9.9%) |
Health Insurance Coverage by Household Income in Roscoe
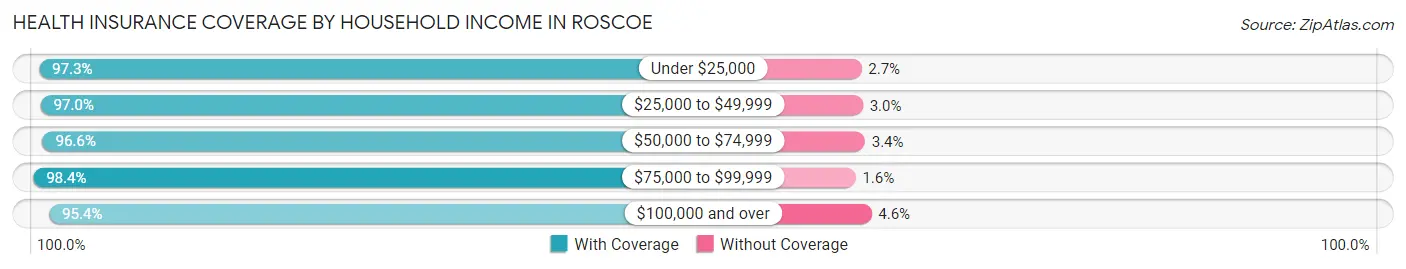
| Household Income | With Coverage | Without Coverage |
| Under $25,000 | 464 (97.3%) | 13 (2.7%) |
| $25,000 to $49,999 | 1,174 (97.0%) | 36 (3.0%) |
| $50,000 to $74,999 | 1,547 (96.6%) | 54 (3.4%) |
| $75,000 to $99,999 | 1,339 (98.4%) | 22 (1.6%) |
| $100,000 and over | 6,175 (95.4%) | 298 (4.6%) |
Public vs Private Health Insurance Coverage by Age in Roscoe
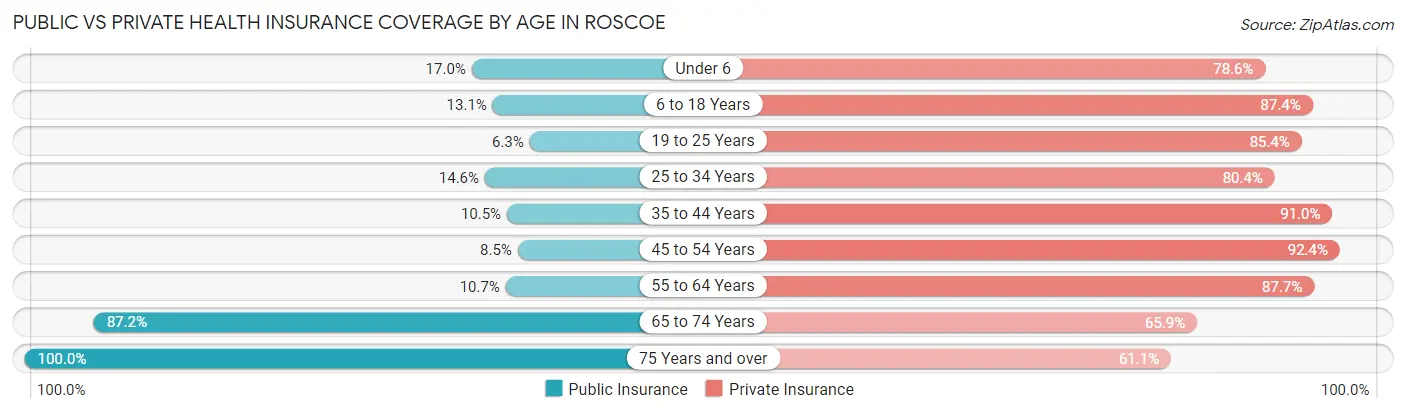
| Age Bracket | Public Insurance | Private Insurance |
| Under 6 | 210 (17.0%) | 970 (78.6%) |
| 6 to 18 Years | 280 (13.1%) | 1,865 (87.4%) |
| 19 to 25 Years | 50 (6.3%) | 682 (85.4%) |
| 25 to 34 Years | 181 (14.6%) | 998 (80.3%) |
| 35 to 44 Years | 173 (10.5%) | 1,504 (91.0%) |
| 45 to 54 Years | 132 (8.5%) | 1,441 (92.4%) |
| 55 to 64 Years | 118 (10.7%) | 967 (87.7%) |
| 65 to 74 Years | 760 (87.2%) | 575 (65.9%) |
| 75 Years and over | 527 (100.0%) | 322 (61.1%) |
| Total | 2,431 (21.9%) | 9,324 (83.8%) |
Disability Status by Sex by Age in Roscoe
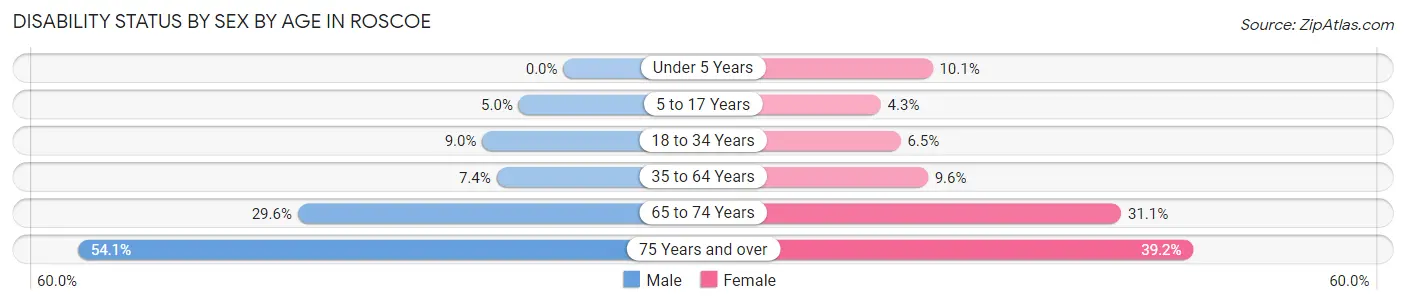
| Age Bracket | Male | Female |
| Under 5 Years | 0 (0.0%) | 58 (10.1%) |
| 5 to 17 Years | 46 (5.0%) | 54 (4.3%) |
| 18 to 34 Years | 95 (9.0%) | 71 (6.5%) |
| 35 to 64 Years | 164 (7.4%) | 202 (9.6%) |
| 65 to 74 Years | 121 (29.6%) | 144 (31.1%) |
| 75 Years and over | 93 (54.1%) | 139 (39.2%) |
Disability Class by Sex by Age in Roscoe
Disability Class: Hearing Difficulty
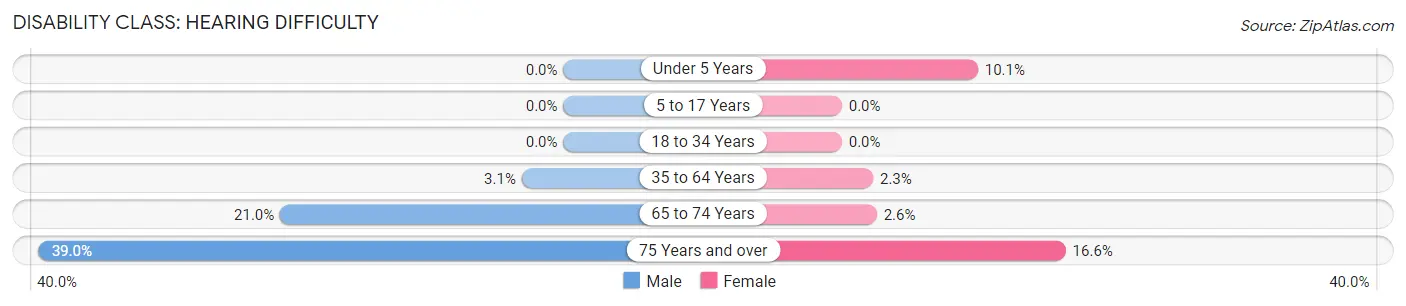
| Age Bracket | Male | Female |
| Under 5 Years | 0 (0.0%) | 58 (10.1%) |
| 5 to 17 Years | 0 (0.0%) | 0 (0.0%) |
| 18 to 34 Years | 0 (0.0%) | 0 (0.0%) |
| 35 to 64 Years | 68 (3.1%) | 49 (2.3%) |
| 65 to 74 Years | 86 (21.0%) | 12 (2.6%) |
| 75 Years and over | 67 (39.0%) | 59 (16.6%) |
Disability Class: Vision Difficulty
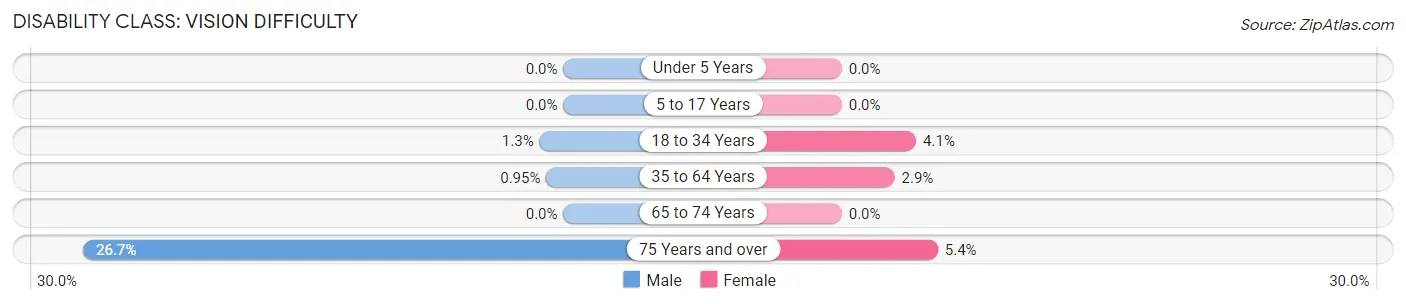
| Age Bracket | Male | Female |
| Under 5 Years | 0 (0.0%) | 0 (0.0%) |
| 5 to 17 Years | 0 (0.0%) | 0 (0.0%) |
| 18 to 34 Years | 14 (1.3%) | 45 (4.1%) |
| 35 to 64 Years | 21 (0.9%) | 62 (2.9%) |
| 65 to 74 Years | 0 (0.0%) | 0 (0.0%) |
| 75 Years and over | 46 (26.7%) | 19 (5.3%) |
Disability Class: Cognitive Difficulty
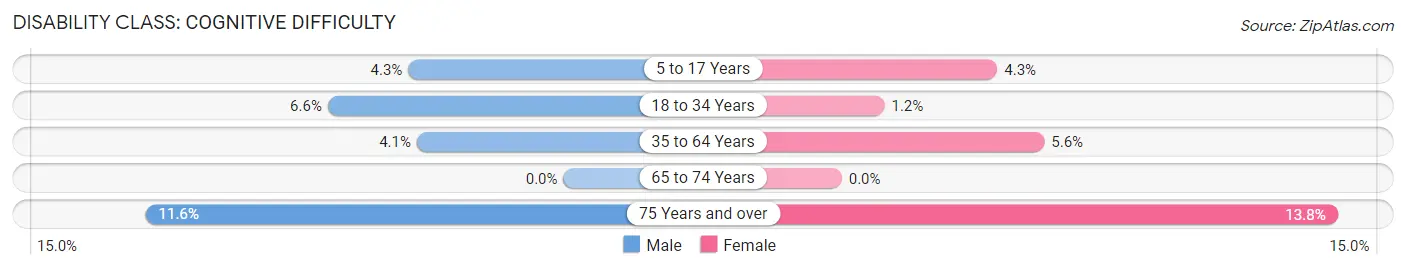
| Age Bracket | Male | Female |
| 5 to 17 Years | 40 (4.3%) | 54 (4.3%) |
| 18 to 34 Years | 69 (6.6%) | 13 (1.2%) |
| 35 to 64 Years | 90 (4.1%) | 119 (5.6%) |
| 65 to 74 Years | 0 (0.0%) | 0 (0.0%) |
| 75 Years and over | 20 (11.6%) | 49 (13.8%) |
Disability Class: Ambulatory Difficulty
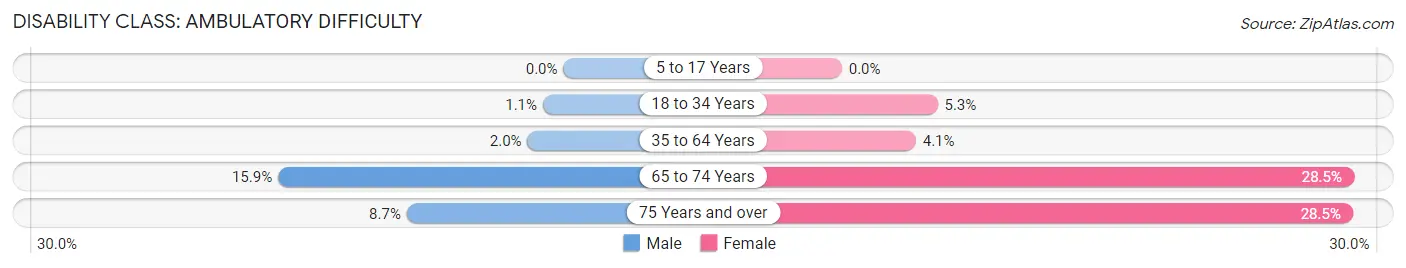
| Age Bracket | Male | Female |
| 5 to 17 Years | 0 (0.0%) | 0 (0.0%) |
| 18 to 34 Years | 12 (1.1%) | 58 (5.3%) |
| 35 to 64 Years | 44 (2.0%) | 87 (4.1%) |
| 65 to 74 Years | 65 (15.9%) | 132 (28.5%) |
| 75 Years and over | 15 (8.7%) | 101 (28.4%) |
Disability Class: Self-Care Difficulty
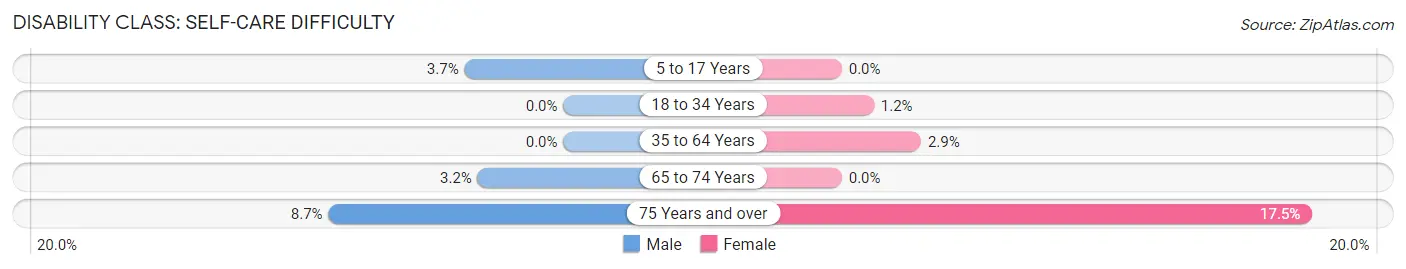
| Age Bracket | Male | Female |
| 5 to 17 Years | 34 (3.7%) | 0 (0.0%) |
| 18 to 34 Years | 0 (0.0%) | 13 (1.2%) |
| 35 to 64 Years | 0 (0.0%) | 62 (2.9%) |
| 65 to 74 Years | 13 (3.2%) | 0 (0.0%) |
| 75 Years and over | 15 (8.7%) | 62 (17.5%) |
Technology Access in Roscoe
Computing Device Access in Roscoe
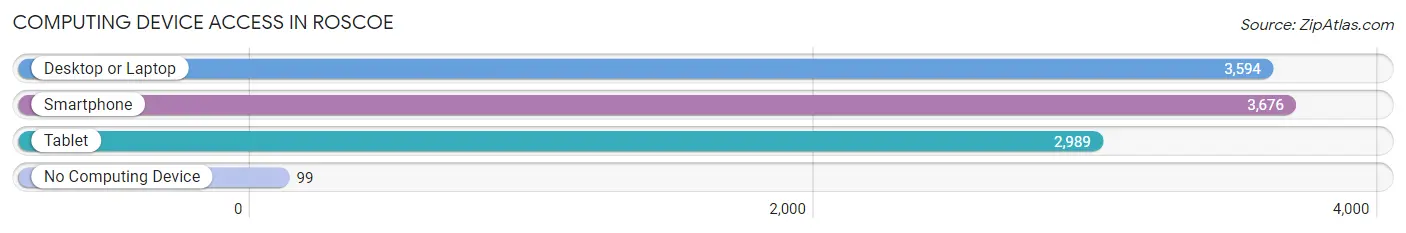
| Device Type | # Households | % Households |
| Desktop or Laptop | 3,594 | 89.3% |
| Smartphone | 3,676 | 91.4% |
| Tablet | 2,989 | 74.3% |
| No Computing Device | 99 | 2.5% |
| Total | 4,023 | 100.0% |
Internet Access in Roscoe
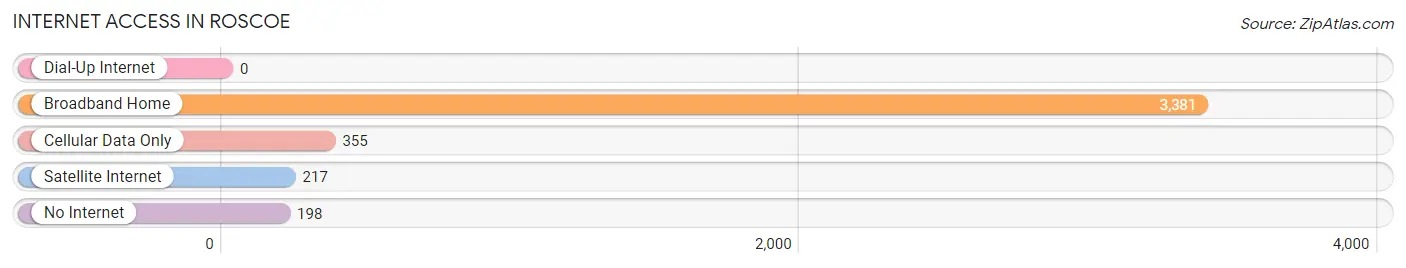
| Internet Type | # Households | % Households |
| Dial-Up Internet | 0 | 0.0% |
| Broadband Home | 3,381 | 84.0% |
| Cellular Data Only | 355 | 8.8% |
| Satellite Internet | 217 | 5.4% |
| No Internet | 198 | 4.9% |
| Total | 4,023 | 100.0% |
Roscoe Summary
Roscoe, Illinois is a small village located in Winnebago County, Illinois. It is situated on the banks of the Rock River, approximately 15 miles northwest of Rockford. The village has a population of approximately 5,000 people and covers an area of 2.2 square miles.
History
The area that is now Roscoe was first settled in 1835 by a group of settlers from New York. The village was originally known as “New Milford” and was later renamed “Roscoe” in 1837 after Roscoe Conkling, a prominent New York politician. The village was officially incorporated in 1854.
In the late 19th century, Roscoe was a thriving agricultural community. The village was home to several grain elevators, a flour mill, and a creamery. The village also had a number of small businesses, including a blacksmith shop, a general store, and a hotel.
In the early 20th century, Roscoe began to experience a period of growth and development. The village was home to several factories, including a furniture factory, a canning factory, and a brickyard. The village also had a number of small businesses, including a grocery store, a drug store, and a movie theater.
Geography
Roscoe is located in the northern part of Winnebago County, Illinois. The village is situated on the banks of the Rock River, approximately 15 miles northwest of Rockford. The village has a total area of 2.2 square miles, all of which is land.
The village is located in a predominantly rural area. The surrounding area is mostly flat, with some rolling hills. The village is located in the Rock River Valley, which is known for its fertile soil and abundant wildlife.
Economy
The economy of Roscoe is largely based on agriculture and manufacturing. The village is home to several factories, including a furniture factory, a canning factory, and a brickyard. The village also has a number of small businesses, including a grocery store, a drug store, and a movie theater.
The village is also home to several large employers, including the Rockford Register Star newspaper, the Rockford Memorial Hospital, and the Rockford Public Schools.
Demographics
As of the 2010 census, the population of Roscoe was 5,000. The racial makeup of the village was 95.3% White, 1.2% African American, 0.3% Native American, 0.7% Asian, 0.1% Pacific Islander, 0.7% from other races, and 1.9% from two or more races. Hispanic or Latino of any race were 2.3% of the population.
The median household income in Roscoe was $50,000, and the median family income was $54,000. The per capita income in the village was $21,000. About 8.3% of families and 10.2% of the population were below the poverty line, including 14.3% of those under age 18 and 5.2% of those age 65 or over.
Common Questions
What is Per Capita Income in Roscoe?
Per Capita income in Roscoe is $42,283.
What is the Median Family Income in Roscoe?
Median Family Income in Roscoe is $112,628.
What is the Median Household income in Roscoe?
Median Household Income in Roscoe is $98,750.
What is Income or Wage Gap in Roscoe?
Income or Wage Gap in Roscoe is 38.2%.
Women in Roscoe earn 61.8 cents for every dollar earned by a man.
What is Inequality or Gini Index in Roscoe?
Inequality or Gini Index in Roscoe is 0.40.
What is the Total Population of Roscoe?
Total Population of Roscoe is 11,134.
What is the Total Male Population of Roscoe?
Total Male Population of Roscoe is 5,296.
What is the Total Female Population of Roscoe?
Total Female Population of Roscoe is 5,838.
What is the Ratio of Males per 100 Females in Roscoe?
There are 90.72 Males per 100 Females in Roscoe.
What is the Ratio of Females per 100 Males in Roscoe?
There are 110.23 Females per 100 Males in Roscoe.
What is the Median Population Age in Roscoe?
Median Population Age in Roscoe is 35.5 Years.
What is the Average Family Size in Roscoe
Average Family Size in Roscoe is 3.2 People.
What is the Average Household Size in Roscoe
Average Household Size in Roscoe is 2.8 People.
How Large is the Labor Force in Roscoe?
There are 5,757 People in the Labor Forcein in Roscoe.
What is the Percentage of People in the Labor Force in Roscoe?
71.1% of People are in the Labor Force in Roscoe.
What is the Unemployment Rate in Roscoe?
Unemployment Rate in Roscoe is 2.7%.