Green Valley, IL Map & Demographics
Green Valley Map
Green Valley Overview
$30,058
PER CAPITA INCOME
$87,039
AVG FAMILY INCOME
$60,781
AVG HOUSEHOLD INCOME
34.5%
WAGE / INCOME GAP [ % ]
65.5¢/ $1
WAGE / INCOME GAP [ $ ]
0.40
INEQUALITY / GINI INDEX
772
TOTAL POPULATION
377
MALE POPULATION
395
FEMALE POPULATION
95.44
MALES / 100 FEMALES
104.77
FEMALES / 100 MALES
32.6
MEDIAN AGE
3.0
AVG FAMILY SIZE
2.5
AVG HOUSEHOLD SIZE
419
LABOR FORCE [ PEOPLE ]
71.0%
PERCENT IN LABOR FORCE
0.7%
UNEMPLOYMENT RATE
Green Valley Zip Codes
Green Valley Area Codes
Income in Green Valley
Income Overview in Green Valley
Per Capita Income in Green Valley is $30,058, while median incomes of families and households are $87,039 and $60,781 respectively.
| Characteristic | Number | Measure |
| Per Capita Income | 772 | $30,058 |
| Median Family Income | 197 | $87,039 |
| Mean Family Income | 197 | $87,507 |
| Median Household Income | 304 | $60,781 |
| Mean Household Income | 304 | $74,899 |
| Income Deficit | 197 | $0 |
| Wage / Income Gap (%) | 772 | 34.47% |
| Wage / Income Gap ($) | 772 | 65.53¢ per $1 |
| Gini / Inequality Index | 772 | 0.40 |
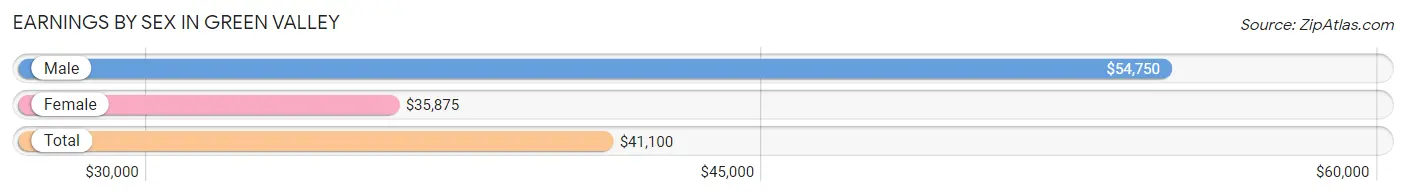
Earnings by Sex in Green Valley
Average Earnings in Green Valley are $41,100, $54,750 for men and $35,875 for women, a difference of 34.5%.
| Sex | Number | Average Earnings |
| Male | 203 (47.0%) | $54,750 |
| Female | 229 (53.0%) | $35,875 |
| Total | 432 (100.0%) | $41,100 |
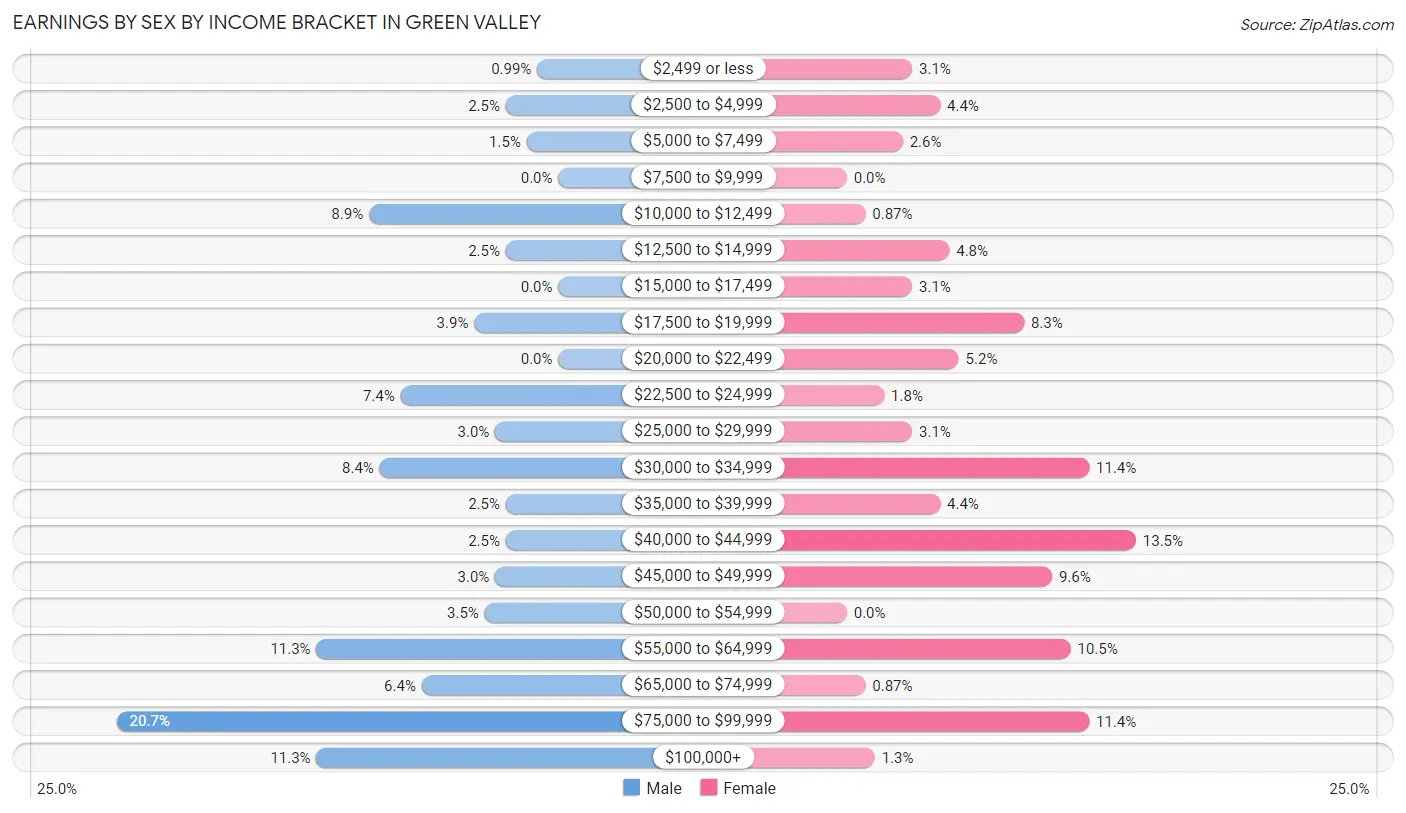
Earnings by Sex by Income Bracket in Green Valley
The most common earnings brackets in Green Valley are $75,000 to $99,999 for men (42 | 20.7%) and $40,000 to $44,999 for women (31 | 13.5%).
| Income | Male | Female |
| $2,499 or less | 2 (1.0%) | 7 (3.1%) |
| $2,500 to $4,999 | 5 (2.5%) | 10 (4.4%) |
| $5,000 to $7,499 | 3 (1.5%) | 6 (2.6%) |
| $7,500 to $9,999 | 0 (0.0%) | 0 (0.0%) |
| $10,000 to $12,499 | 18 (8.9%) | 2 (0.9%) |
| $12,500 to $14,999 | 5 (2.5%) | 11 (4.8%) |
| $15,000 to $17,499 | 0 (0.0%) | 7 (3.1%) |
| $17,500 to $19,999 | 8 (3.9%) | 19 (8.3%) |
| $20,000 to $22,499 | 0 (0.0%) | 12 (5.2%) |
| $22,500 to $24,999 | 15 (7.4%) | 4 (1.8%) |
| $25,000 to $29,999 | 6 (3.0%) | 7 (3.1%) |
| $30,000 to $34,999 | 17 (8.4%) | 26 (11.4%) |
| $35,000 to $39,999 | 5 (2.5%) | 10 (4.4%) |
| $40,000 to $44,999 | 5 (2.5%) | 31 (13.5%) |
| $45,000 to $49,999 | 6 (3.0%) | 22 (9.6%) |
| $50,000 to $54,999 | 7 (3.5%) | 0 (0.0%) |
| $55,000 to $64,999 | 23 (11.3%) | 24 (10.5%) |
| $65,000 to $74,999 | 13 (6.4%) | 2 (0.9%) |
| $75,000 to $99,999 | 42 (20.7%) | 26 (11.4%) |
| $100,000+ | 23 (11.3%) | 3 (1.3%) |
| Total | 203 (100.0%) | 229 (100.0%) |
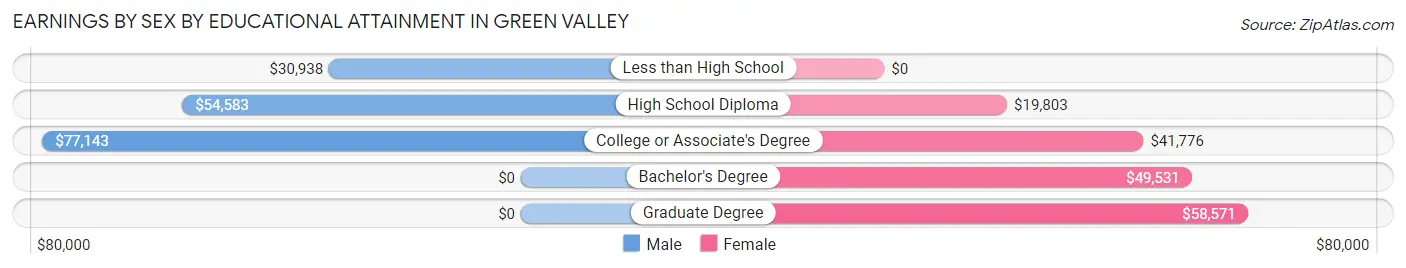
Earnings by Sex by Educational Attainment in Green Valley
Average earnings in Green Valley are $68,125 for men and $40,284 for women, a difference of 40.9%. Men with an educational attainment of college or associate's degree enjoy the highest average annual earnings of $77,143, while those with less than high school education earn the least with $30,938. Women with an educational attainment of graduate degree earn the most with the average annual earnings of $58,571, while those with high school diploma education have the smallest earnings of $19,803.
| Educational Attainment | Male Income | Female Income |
| Less than High School | $30,938 | $0 |
| High School Diploma | $54,583 | $19,803 |
| College or Associate's Degree | $77,143 | $41,776 |
| Bachelor's Degree | - | - |
| Graduate Degree | - | - |
| Total | $68,125 | $40,284 |
Family Income in Green Valley
Family Income Brackets in Green Valley
According to the Green Valley family income data, there are 47 families falling into the $75,000 to $99,999 income range, which is the most common income bracket and makes up 23.9% of all families.
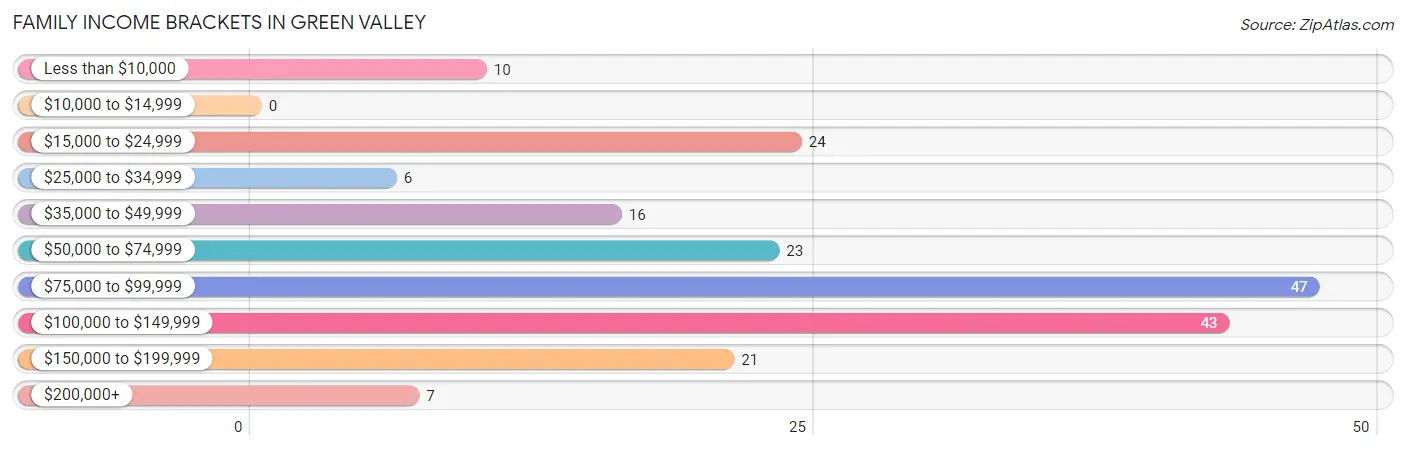
| Income Bracket | # Families | % Families |
| Less than $10,000 | 10 | 5.1% |
| $10,000 to $14,999 | 0 | 0.0% |
| $15,000 to $24,999 | 24 | 12.2% |
| $25,000 to $34,999 | 6 | 3.0% |
| $35,000 to $49,999 | 16 | 8.1% |
| $50,000 to $74,999 | 23 | 11.7% |
| $75,000 to $99,999 | 47 | 23.9% |
| $100,000 to $149,999 | 43 | 21.8% |
| $150,000 to $199,999 | 21 | 10.7% |
| $200,000+ | 7 | 3.6% |
Family Income by Famaliy Size in Green Valley
4-person families (21 | 10.7%) account for the highest median family income in Green Valley with $96,875 per family, while 2-person families (94 | 47.7%) have the highest median income of $43,421 per family member.
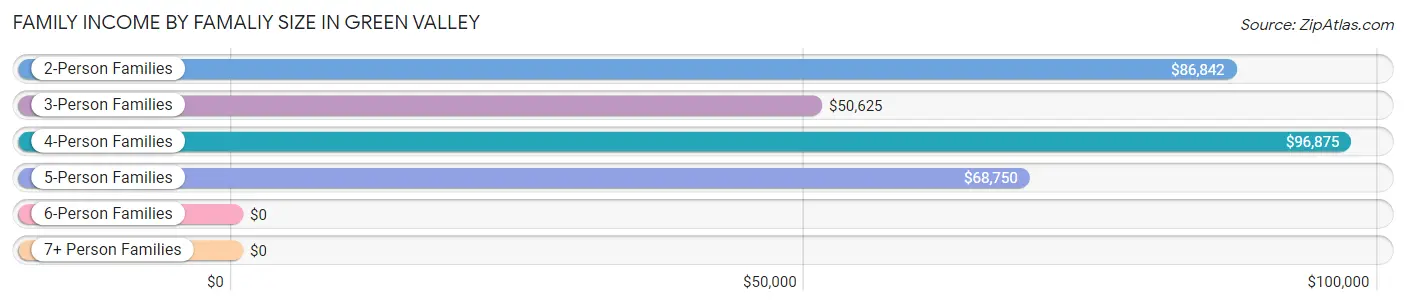
| Income Bracket | # Families | Median Income |
| 2-Person Families | 94 (47.7%) | $86,842 |
| 3-Person Families | 59 (29.9%) | $50,625 |
| 4-Person Families | 21 (10.7%) | $96,875 |
| 5-Person Families | 8 (4.1%) | $68,750 |
| 6-Person Families | 15 (7.6%) | $0 |
| 7+ Person Families | 0 (0.0%) | $0 |
| Total | 197 (100.0%) | $87,039 |
Family Income by Number of Earners in Green Valley
The median family income in Green Valley is $87,039, with families comprising 3+ earners (34) having the highest median family income of $114,500, while families with 1 earner (66) have the lowest median family income of $41,250, accounting for 17.3% and 33.5% of families, respectively.
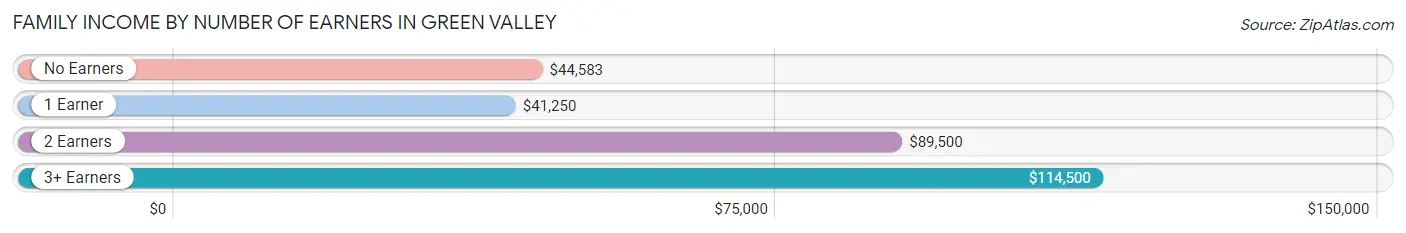
| Number of Earners | # Families | Median Income |
| No Earners | 27 (13.7%) | $44,583 |
| 1 Earner | 66 (33.5%) | $41,250 |
| 2 Earners | 70 (35.5%) | $89,500 |
| 3+ Earners | 34 (17.3%) | $114,500 |
| Total | 197 (100.0%) | $87,039 |
Household Income in Green Valley
Household Income Brackets in Green Valley
With 61 households falling in the category, the $35,000 to $49,999 income range is the most frequent in Green Valley, accounting for 20.1% of all households. In contrast, only 5 households (1.6%) fall into the $10,000 to $14,999 income bracket, making it the least populous group.
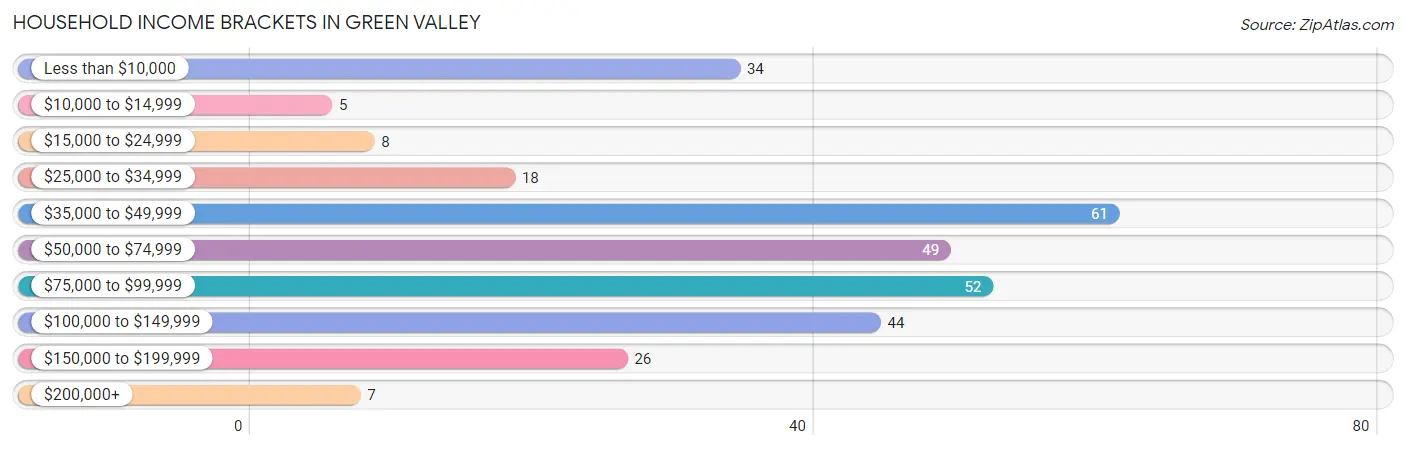
| Income Bracket | # Households | % Households |
| Less than $10,000 | 34 | 11.2% |
| $10,000 to $14,999 | 5 | 1.6% |
| $15,000 to $24,999 | 8 | 2.6% |
| $25,000 to $34,999 | 18 | 5.9% |
| $35,000 to $49,999 | 61 | 20.1% |
| $50,000 to $74,999 | 49 | 16.1% |
| $75,000 to $99,999 | 52 | 17.1% |
| $100,000 to $149,999 | 44 | 14.5% |
| $150,000 to $199,999 | 26 | 8.6% |
| $200,000+ | 7 | 2.3% |
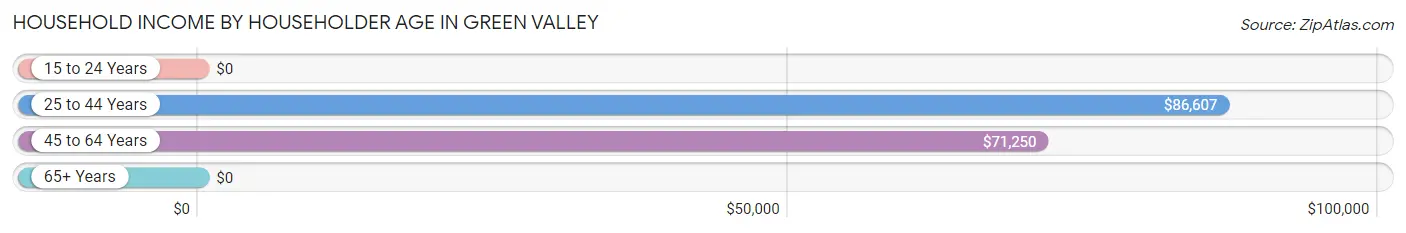
Household Income by Householder Age in Green Valley
The median household income in Green Valley is $60,781, with the highest median household income of $86,607 found in the 25 to 44 years age bracket for the primary householder. A total of 105 households (34.5%) fall into this category. Meanwhile, the 15 to 24 years age bracket for the primary householder has the lowest median household income of $0, with 7 households (2.3%) in this group.
| Income Bracket | # Households | Median Income |
| 15 to 24 Years | 7 (2.3%) | $0 |
| 25 to 44 Years | 105 (34.5%) | $86,607 |
| 45 to 64 Years | 128 (42.1%) | $71,250 |
| 65+ Years | 64 (21.0%) | $0 |
| Total | 304 (100.0%) | $60,781 |
Poverty in Green Valley
Income Below Poverty by Sex and Age in Green Valley
With 15.1% poverty level for males and 21.7% for females among the residents of Green Valley, 75 year old and over males and 15 year old females are the most vulnerable to poverty, with 22 males (95.7%) and 4 females (100.0%) in their respective age groups living below the poverty level.
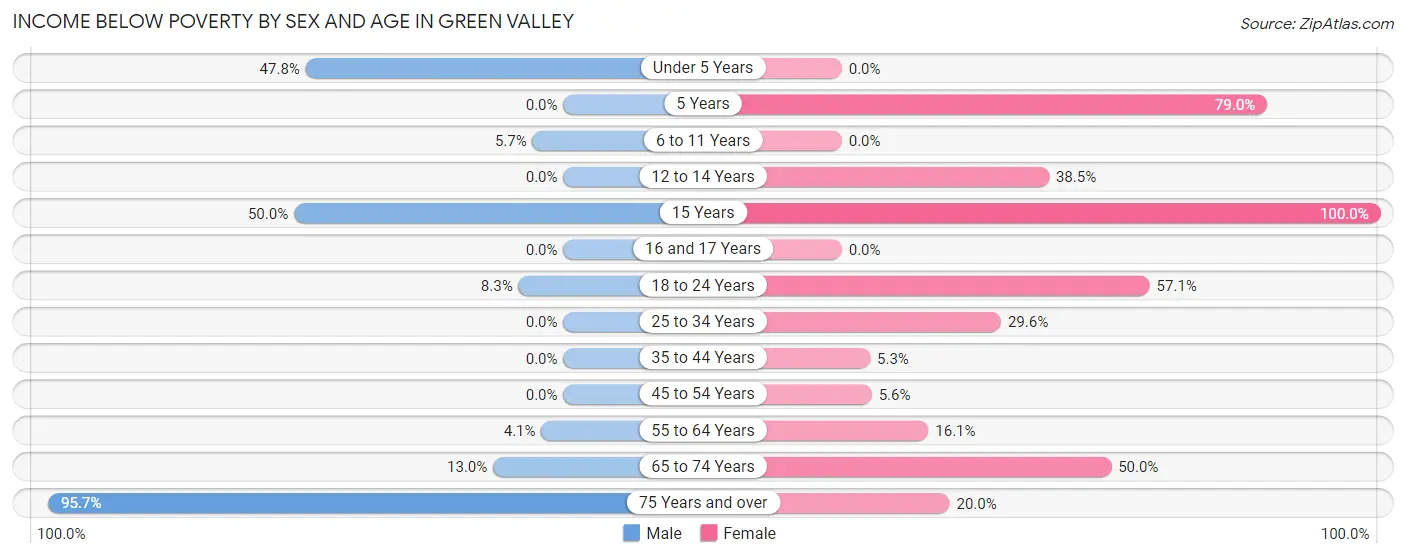
| Age Bracket | Male | Female |
| Under 5 Years | 22 (47.8%) | 0 (0.0%) |
| 5 Years | 0 (0.0%) | 15 (78.9%) |
| 6 to 11 Years | 2 (5.7%) | 0 (0.0%) |
| 12 to 14 Years | 0 (0.0%) | 10 (38.5%) |
| 15 Years | 3 (50.0%) | 4 (100.0%) |
| 16 and 17 Years | 0 (0.0%) | 0 (0.0%) |
| 18 to 24 Years | 3 (8.3%) | 4 (57.1%) |
| 25 to 34 Years | 0 (0.0%) | 26 (29.5%) |
| 35 to 44 Years | 0 (0.0%) | 2 (5.3%) |
| 45 to 54 Years | 0 (0.0%) | 4 (5.6%) |
| 55 to 64 Years | 2 (4.1%) | 9 (16.1%) |
| 65 to 74 Years | 3 (13.0%) | 9 (50.0%) |
| 75 Years and over | 22 (95.7%) | 2 (20.0%) |
| Total | 57 (15.1%) | 85 (21.7%) |
Income Above Poverty by Sex and Age in Green Valley
According to the poverty statistics in Green Valley, males aged 5 years and females aged under 5 years are the age groups that are most secure financially, with 100.0% of males and 100.0% of females in these age groups living above the poverty line.
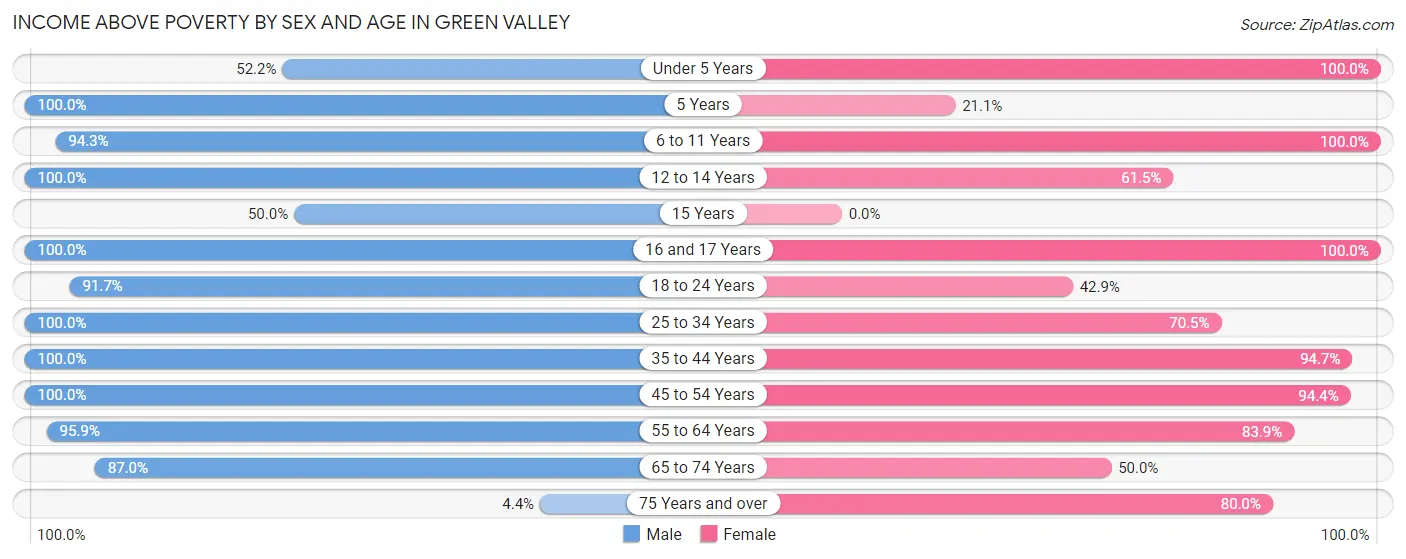
| Age Bracket | Male | Female |
| Under 5 Years | 24 (52.2%) | 11 (100.0%) |
| 5 Years | 7 (100.0%) | 4 (21.0%) |
| 6 to 11 Years | 33 (94.3%) | 15 (100.0%) |
| 12 to 14 Years | 10 (100.0%) | 16 (61.5%) |
| 15 Years | 3 (50.0%) | 0 (0.0%) |
| 16 and 17 Years | 18 (100.0%) | 28 (100.0%) |
| 18 to 24 Years | 33 (91.7%) | 3 (42.9%) |
| 25 to 34 Years | 45 (100.0%) | 62 (70.5%) |
| 35 to 44 Years | 49 (100.0%) | 36 (94.7%) |
| 45 to 54 Years | 30 (100.0%) | 68 (94.4%) |
| 55 to 64 Years | 47 (95.9%) | 47 (83.9%) |
| 65 to 74 Years | 20 (87.0%) | 9 (50.0%) |
| 75 Years and over | 1 (4.3%) | 8 (80.0%) |
| Total | 320 (84.9%) | 307 (78.3%) |
Income Below Poverty Among Married-Couple Families in Green Valley
The poverty statistics for married-couple families in Green Valley show that 2.4% or 3 of the total 123 families live below the poverty line. Families with no children have the highest poverty rate of 4.0%, comprising of 3 families. On the other hand, families with 1 or 2 children have the lowest poverty rate of 0.0%, which includes 0 families.
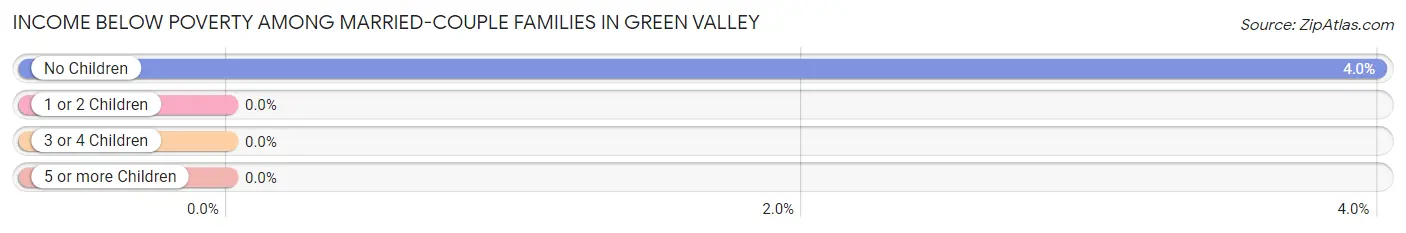
| Children | Above Poverty | Below Poverty |
| No Children | 72 (96.0%) | 3 (4.0%) |
| 1 or 2 Children | 40 (100.0%) | 0 (0.0%) |
| 3 or 4 Children | 8 (100.0%) | 0 (0.0%) |
| 5 or more Children | 0 (0.0%) | 0 (0.0%) |
| Total | 120 (97.6%) | 3 (2.4%) |
Income Below Poverty Among Single-Parent Households in Green Valley

| Children | Single Father | Single Mother |
| No Children | 0 (0.0%) | 0 (0.0%) |
| 1 or 2 Children | 0 (0.0%) | 29 (48.3%) |
| 3 or 4 Children | 0 (0.0%) | 0 (0.0%) |
| 5 or more Children | 0 (0.0%) | 0 (0.0%) |
| Total | 0 (0.0%) | 29 (46.8%) |
Income Below Poverty Among Married-Couple vs Single-Parent Households in Green Valley
The poverty data for Green Valley shows that 3 of the married-couple family households (2.4%) and 29 of the single-parent households (39.2%) are living below the poverty level. Within the married-couple family households, those with no children have the highest poverty rate, with 3 households (4.0%) falling below the poverty line. Among the single-parent households, those with 1 or 2 children have the highest poverty rate, with 29 household (46.8%) living below poverty.
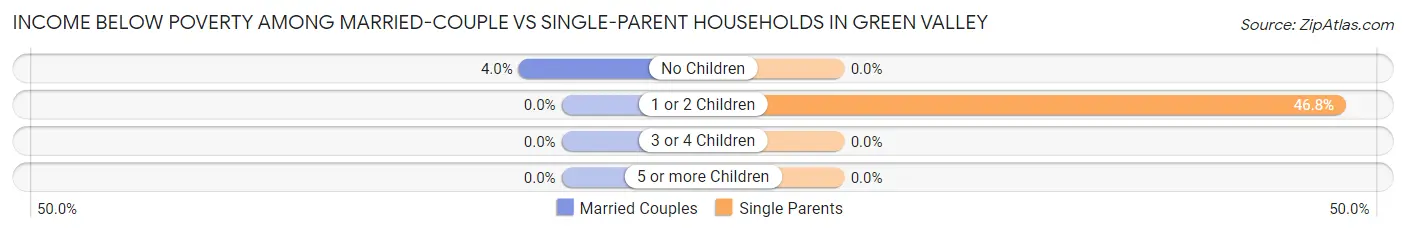
| Children | Married-Couple Families | Single-Parent Households |
| No Children | 3 (4.0%) | 0 (0.0%) |
| 1 or 2 Children | 0 (0.0%) | 29 (46.8%) |
| 3 or 4 Children | 0 (0.0%) | 0 (0.0%) |
| 5 or more Children | 0 (0.0%) | 0 (0.0%) |
| Total | 3 (2.4%) | 29 (39.2%) |
Race in Green Valley
The most populous races in Green Valley are White / Caucasian (757 | 98.1%), Hispanic or Latino (20 | 2.6%), and Two or more Races (12 | 1.5%).
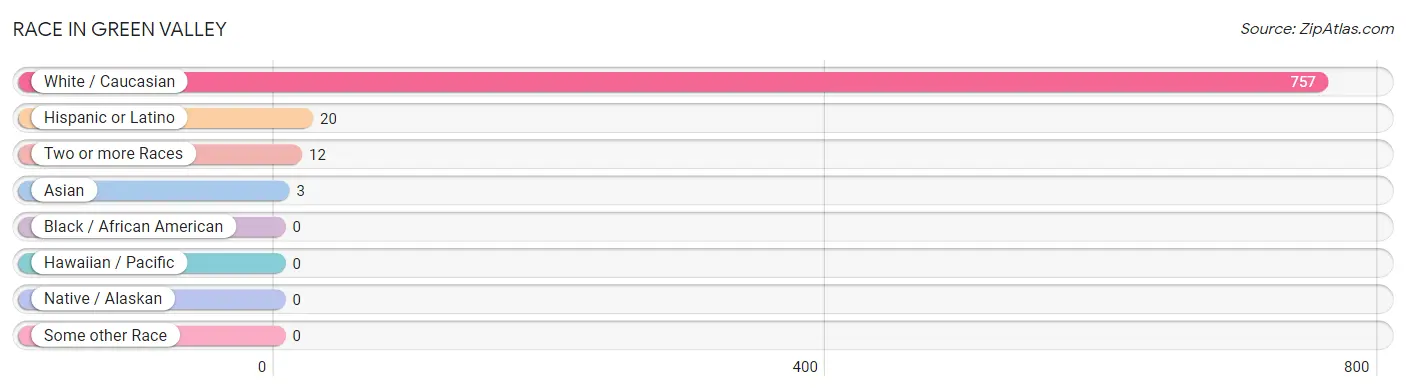
| Race | # Population | % Population |
| Asian | 3 | 0.4% |
| Black / African American | 0 | 0.0% |
| Hawaiian / Pacific | 0 | 0.0% |
| Hispanic or Latino | 20 | 2.6% |
| Native / Alaskan | 0 | 0.0% |
| White / Caucasian | 757 | 98.1% |
| Two or more Races | 12 | 1.5% |
| Some other Race | 0 | 0.0% |
| Total | 772 | 100.0% |
Ancestry in Green Valley
The most populous ancestries reported in Green Valley are German (180 | 23.3%), Irish (93 | 12.0%), European (73 | 9.5%), English (72 | 9.3%), and Scottish (66 | 8.6%), together accounting for 62.7% of all Green Valley residents.
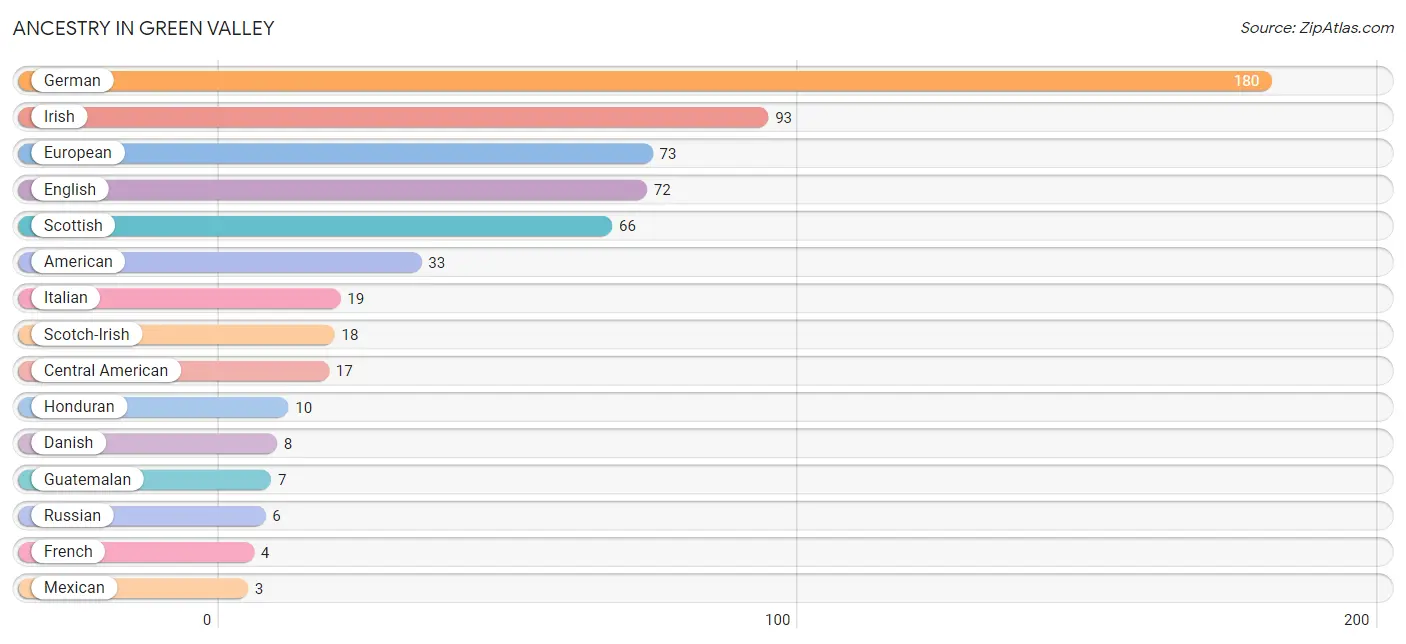
| Ancestry | # Population | % Population |
| American | 33 | 4.3% |
| Central American | 17 | 2.2% |
| Danish | 8 | 1.0% |
| Dutch | 2 | 0.3% |
| English | 72 | 9.3% |
| European | 73 | 9.5% |
| French | 4 | 0.5% |
| German | 180 | 23.3% |
| Guatemalan | 7 | 0.9% |
| Honduran | 10 | 1.3% |
| Irish | 93 | 12.0% |
| Italian | 19 | 2.5% |
| Korean | 1 | 0.1% |
| Mexican | 3 | 0.4% |
| Polish | 2 | 0.3% |
| Russian | 6 | 0.8% |
| Scandinavian | 3 | 0.4% |
| Scotch-Irish | 18 | 2.3% |
| Scottish | 66 | 8.6% |
| Slovak | 2 | 0.3% |
| Swedish | 2 | 0.3% |
| Thai | 3 | 0.4% |
| Welsh | 2 | 0.3% | View All 23 Rows |
Immigrants in Green Valley
The most numerous immigrant groups reported in Green Valley came from Central America (6 | 0.8%), Honduras (6 | 0.8%), Latin America (6 | 0.8%), Asia (3 | 0.4%), and India (2 | 0.3%), together accounting for 3.0% of all Green Valley residents.
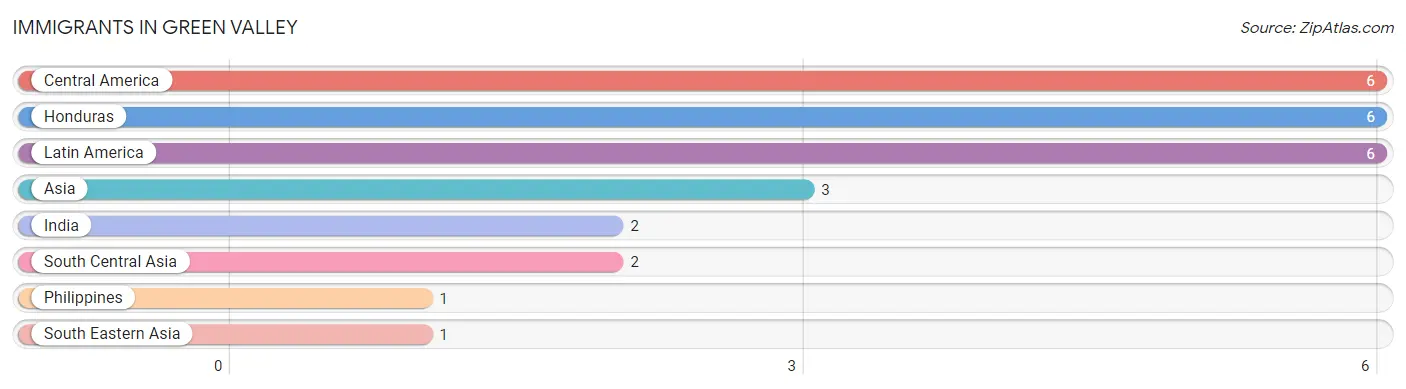
| Immigration Origin | # Population | % Population |
| Asia | 3 | 0.4% |
| Central America | 6 | 0.8% |
| Honduras | 6 | 0.8% |
| India | 2 | 0.3% |
| Latin America | 6 | 0.8% |
| Philippines | 1 | 0.1% |
| South Central Asia | 2 | 0.3% |
| South Eastern Asia | 1 | 0.1% | View All 8 Rows |
Sex and Age in Green Valley
Sex and Age in Green Valley
The most populous age groups in Green Valley are Under 5 Years (46 | 12.2%) for men and 25 to 29 Years (64 | 16.2%) for women.
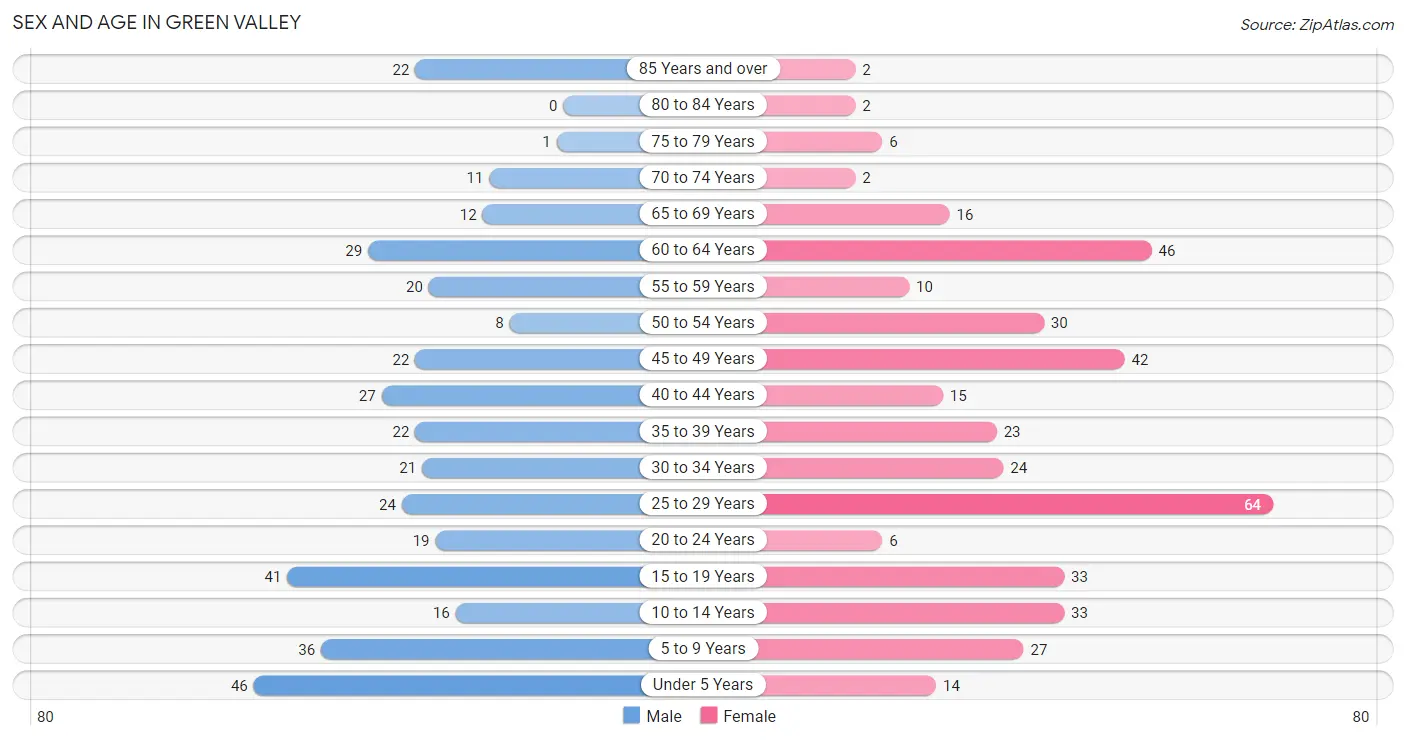
| Age Bracket | Male | Female |
| Under 5 Years | 46 (12.2%) | 14 (3.5%) |
| 5 to 9 Years | 36 (9.6%) | 27 (6.8%) |
| 10 to 14 Years | 16 (4.2%) | 33 (8.4%) |
| 15 to 19 Years | 41 (10.9%) | 33 (8.4%) |
| 20 to 24 Years | 19 (5.0%) | 6 (1.5%) |
| 25 to 29 Years | 24 (6.4%) | 64 (16.2%) |
| 30 to 34 Years | 21 (5.6%) | 24 (6.1%) |
| 35 to 39 Years | 22 (5.8%) | 23 (5.8%) |
| 40 to 44 Years | 27 (7.2%) | 15 (3.8%) |
| 45 to 49 Years | 22 (5.8%) | 42 (10.6%) |
| 50 to 54 Years | 8 (2.1%) | 30 (7.6%) |
| 55 to 59 Years | 20 (5.3%) | 10 (2.5%) |
| 60 to 64 Years | 29 (7.7%) | 46 (11.7%) |
| 65 to 69 Years | 12 (3.2%) | 16 (4.1%) |
| 70 to 74 Years | 11 (2.9%) | 2 (0.5%) |
| 75 to 79 Years | 1 (0.3%) | 6 (1.5%) |
| 80 to 84 Years | 0 (0.0%) | 2 (0.5%) |
| 85 Years and over | 22 (5.8%) | 2 (0.5%) |
| Total | 377 (100.0%) | 395 (100.0%) |
Families and Households in Green Valley
Median Family Size in Green Valley
The median family size in Green Valley is 3.05 persons per family, with single male/father families (12 | 6.1%) accounting for the largest median family size of 6.58 persons per family. On the other hand, married-couple families (123 | 62.4%) represent the smallest median family size with 2.82 persons per family.
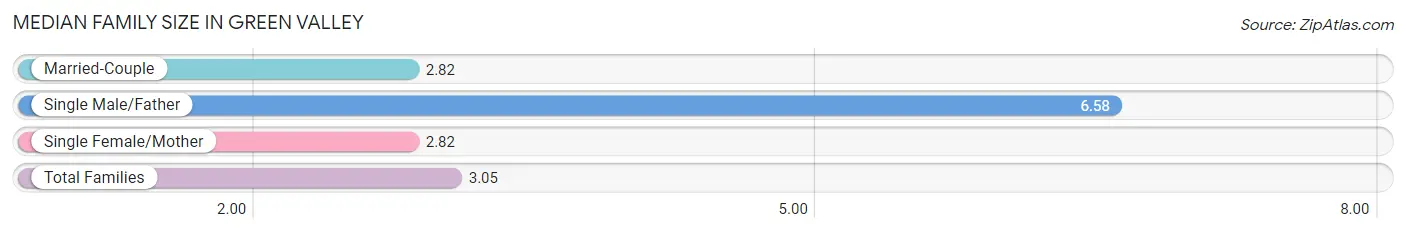
| Family Type | # Families | Family Size |
| Married-Couple | 123 (62.4%) | 2.82 |
| Single Male/Father | 12 (6.1%) | 6.58 |
| Single Female/Mother | 62 (31.5%) | 2.82 |
| Total Families | 197 (100.0%) | 3.05 |
Median Household Size in Green Valley
The median household size in Green Valley is 2.54 persons per household, with single male/father households (12 | 4.0%) accounting for the largest median household size of 7.17 persons per household. non-family households (107 | 35.2%) represent the smallest median household size with 1.21 persons per household.
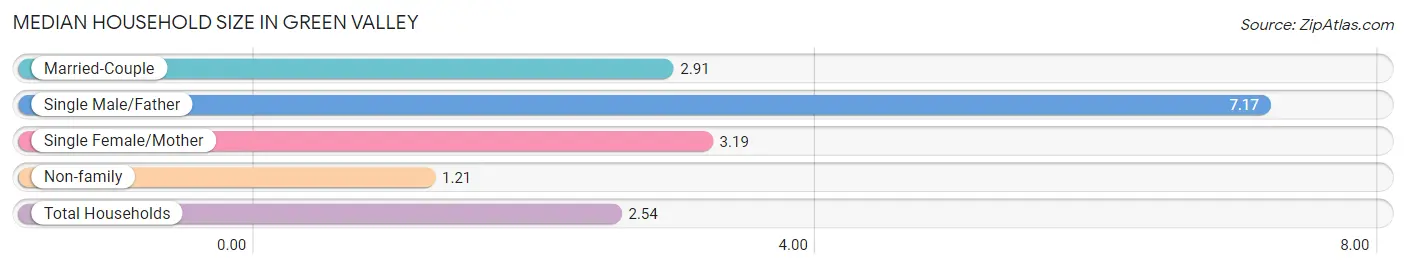
| Household Type | # Households | Household Size |
| Married-Couple | 123 (40.5%) | 2.91 |
| Single Male/Father | 12 (4.0%) | 7.17 |
| Single Female/Mother | 62 (20.4%) | 3.19 |
| Non-family | 107 (35.2%) | 1.21 |
| Total Households | 304 (100.0%) | 2.54 |
Household Size by Marriage Status in Green Valley
Out of a total of 304 households in Green Valley, 197 (64.8%) are family households, while 107 (35.2%) are nonfamily households. The most numerous type of family households are 2-person households, comprising 94, and the most common type of nonfamily households are 1-person households, comprising 90.
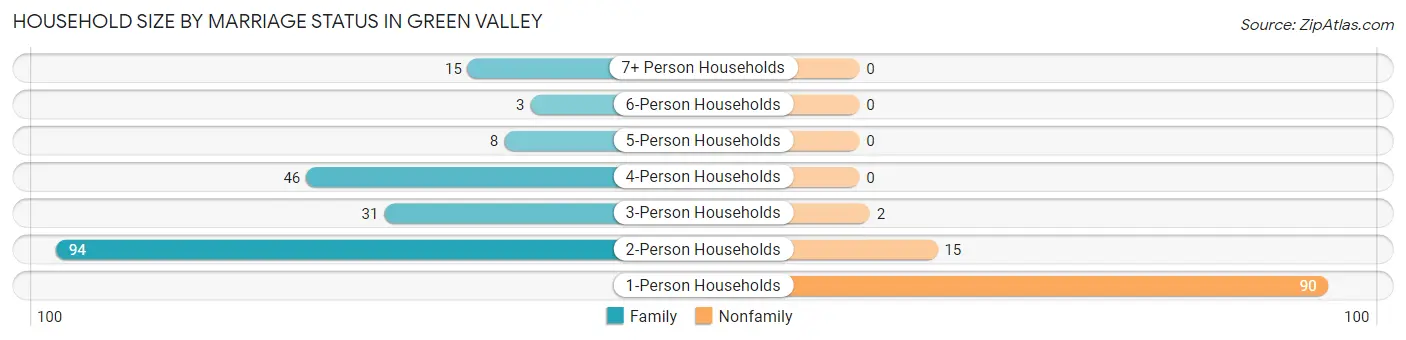
| Household Size | Family Households | Nonfamily Households |
| 1-Person Households | - | 90 (29.6%) |
| 2-Person Households | 94 (30.9%) | 15 (4.9%) |
| 3-Person Households | 31 (10.2%) | 2 (0.7%) |
| 4-Person Households | 46 (15.1%) | 0 (0.0%) |
| 5-Person Households | 8 (2.6%) | 0 (0.0%) |
| 6-Person Households | 3 (1.0%) | 0 (0.0%) |
| 7+ Person Households | 15 (4.9%) | 0 (0.0%) |
| Total | 197 (64.8%) | 107 (35.2%) |
Female Fertility in Green Valley
Fertility by Age in Green Valley
Average fertility rate in Green Valley is 71.0 births per 1,000 women. Women in the age bracket of 20 to 34 years have the highest fertility rate with 96.0 births per 1,000 women. Women in the age bracket of 20 to 34 years acount for 60.0% of all women with births.
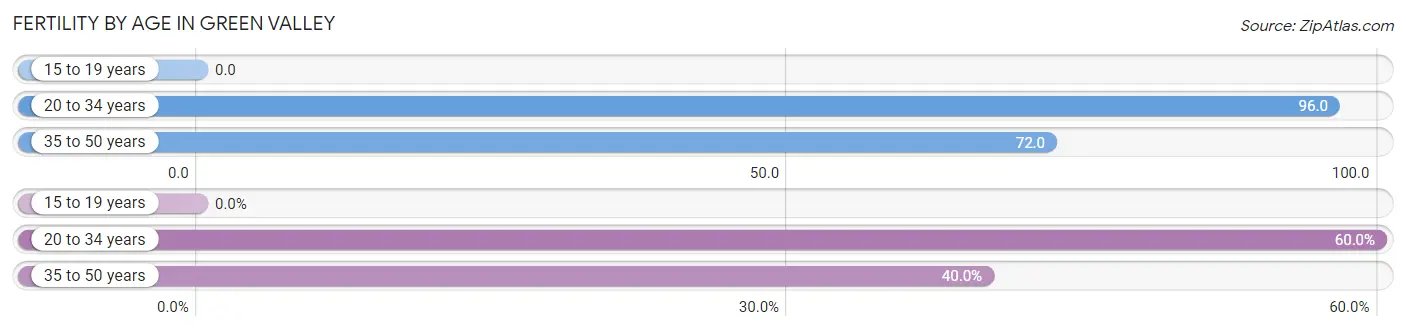
| Age Bracket | Women with Births | Births / 1,000 Women |
| 15 to 19 years | 0 (0.0%) | 0.0 |
| 20 to 34 years | 9 (60.0%) | 96.0 |
| 35 to 50 years | 6 (40.0%) | 72.0 |
| Total | 15 (100.0%) | 71.0 |
Fertility by Age by Marriage Status in Green Valley
73.3% of women with births (15) in Green Valley are married. The highest percentage of unmarried women with births falls into 20 to 34 years age bracket with 44.4% of them unmarried at the time of birth, while the lowest percentage of unmarried women with births belong to 35 to 50 years age bracket with 0.0% of them unmarried.
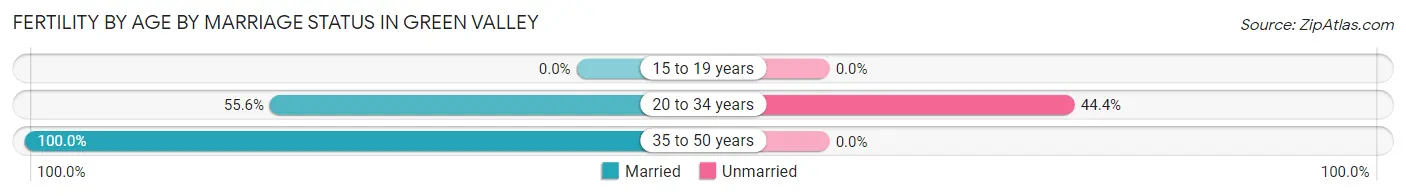
| Age Bracket | Married | Unmarried |
| 15 to 19 years | 0 (0.0%) | 0 (0.0%) |
| 20 to 34 years | 5 (55.6%) | 4 (44.4%) |
| 35 to 50 years | 6 (100.0%) | 0 (0.0%) |
| Total | 11 (73.3%) | 4 (26.7%) |
Fertility by Education in Green Valley
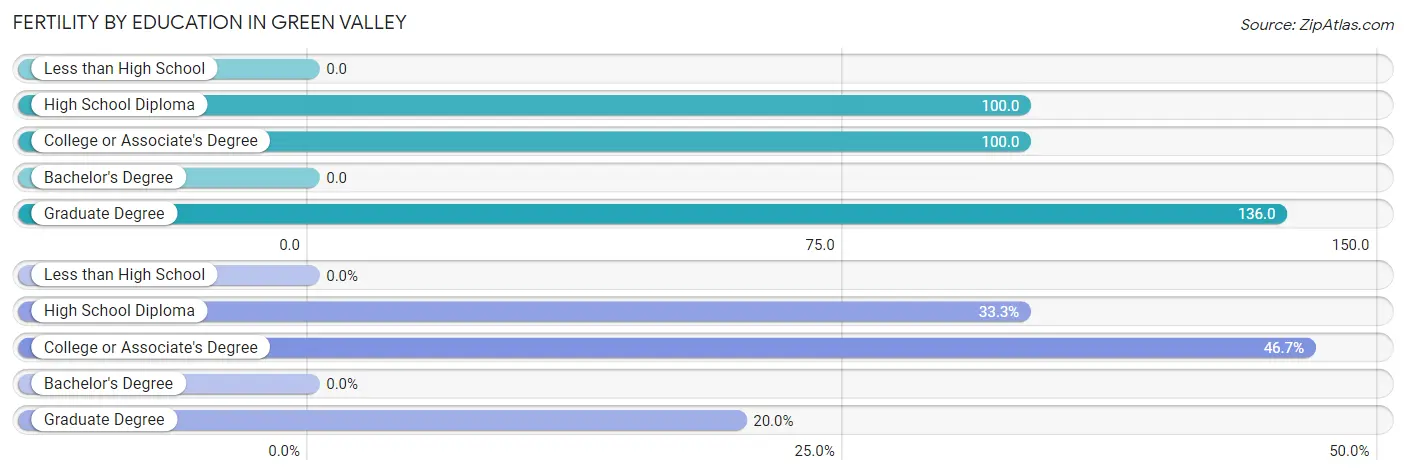
| Educational Attainment | Women with Births | Births / 1,000 Women |
| Less than High School | 0 (0.0%) | 0.0 |
| High School Diploma | 5 (33.3%) | 100.0 |
| College or Associate's Degree | 7 (46.7%) | 100.0 |
| Bachelor's Degree | 0 (0.0%) | 0.0 |
| Graduate Degree | 3 (20.0%) | 136.0 |
| Total | 15 (100.0%) | 71.0 |
Fertility by Education by Marriage Status in Green Valley
26.7% of women with births in Green Valley are unmarried. Women with the educational attainment of high school diploma are most likely to be married with 100.0% of them married at childbirth, while women with the educational attainment of college or associate's degree are least likely to be married with 57.1% of them unmarried at childbirth.
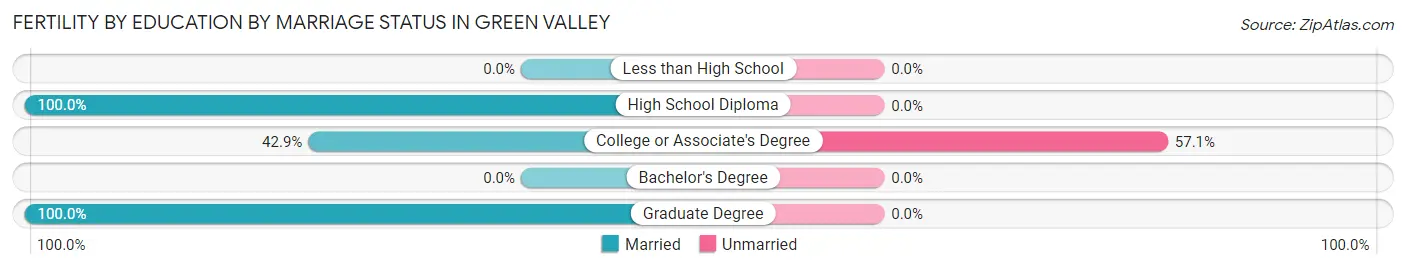
| Educational Attainment | Married | Unmarried |
| Less than High School | 0 (0.0%) | 0 (0.0%) |
| High School Diploma | 5 (100.0%) | 0 (0.0%) |
| College or Associate's Degree | 3 (42.9%) | 4 (57.1%) |
| Bachelor's Degree | 0 (0.0%) | 0 (0.0%) |
| Graduate Degree | 3 (100.0%) | 0 (0.0%) |
| Total | 11 (73.3%) | 4 (26.7%) |
Employment Characteristics in Green Valley
Employment by Class of Employer in Green Valley
Among the 416 employed individuals in Green Valley, private company employees (340 | 81.7%), local government employees (43 | 10.3%), and self-employed (not incorporated) (13 | 3.1%) make up the most common classes of employment.
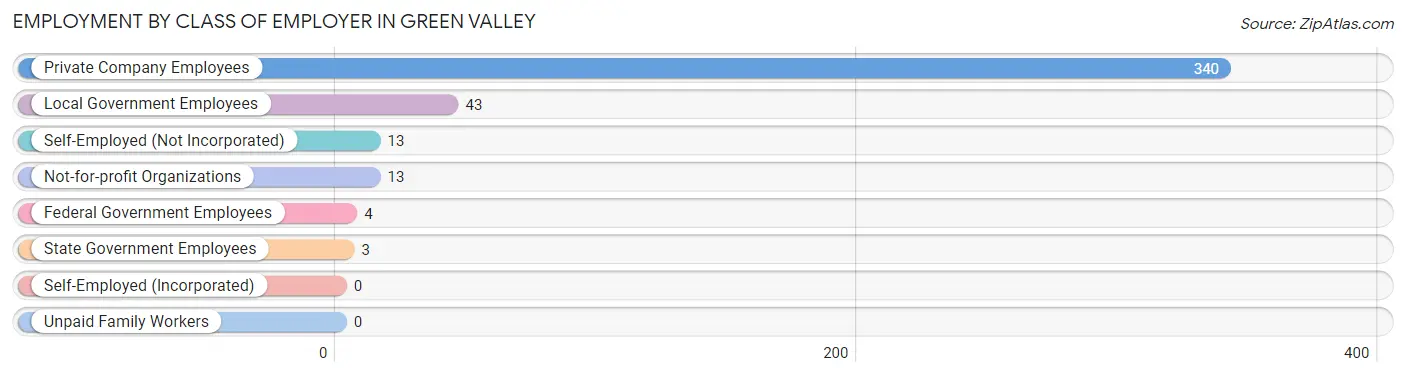
| Employer Class | # Employees | % Employees |
| Private Company Employees | 340 | 81.7% |
| Self-Employed (Incorporated) | 0 | 0.0% |
| Self-Employed (Not Incorporated) | 13 | 3.1% |
| Not-for-profit Organizations | 13 | 3.1% |
| Local Government Employees | 43 | 10.3% |
| State Government Employees | 3 | 0.7% |
| Federal Government Employees | 4 | 1.0% |
| Unpaid Family Workers | 0 | 0.0% |
| Total | 416 | 100.0% |
Employment Status by Age in Green Valley
According to the labor force statistics for Green Valley, out of the total population over 16 years of age (590), 71.0% or 419 individuals are in the labor force, with 0.7% or 3 of them unemployed. The age group with the highest labor force participation rate is 35 to 44 years, with 97.7% or 85 individuals in the labor force. Within the labor force, the 16 to 19 years age range has the highest percentage of unemployed individuals, with 2.2% or 1 of them being unemployed.
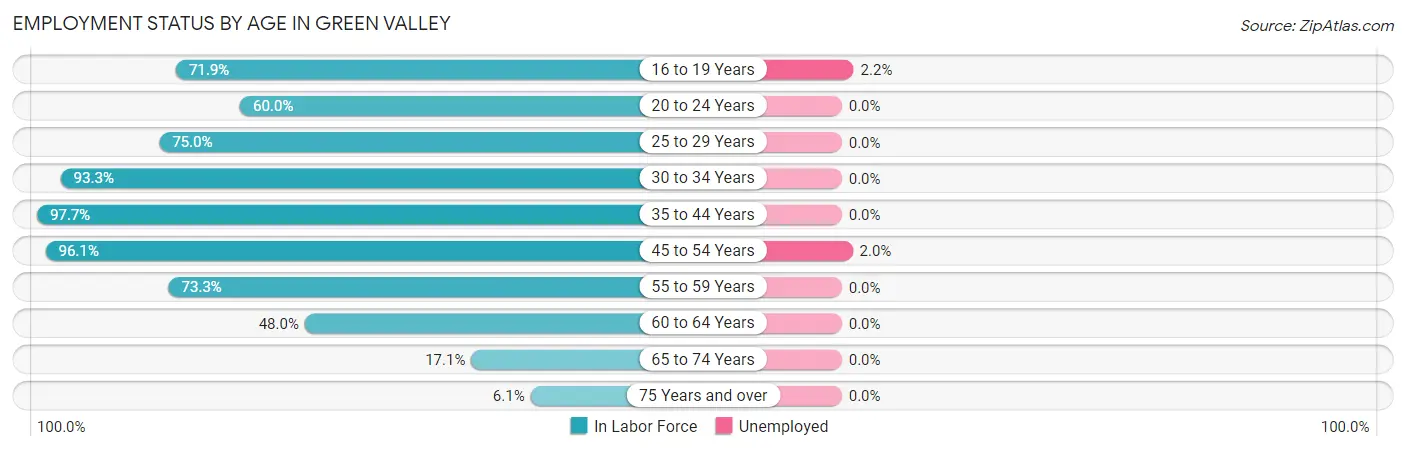
| Age Bracket | In Labor Force | Unemployed |
| 16 to 19 Years | 46 (71.9%) | 1 (2.2%) |
| 20 to 24 Years | 15 (60.0%) | 0 (0.0%) |
| 25 to 29 Years | 66 (75.0%) | 0 (0.0%) |
| 30 to 34 Years | 42 (93.3%) | 0 (0.0%) |
| 35 to 44 Years | 85 (97.7%) | 0 (0.0%) |
| 45 to 54 Years | 98 (96.1%) | 2 (2.0%) |
| 55 to 59 Years | 22 (73.3%) | 0 (0.0%) |
| 60 to 64 Years | 36 (48.0%) | 0 (0.0%) |
| 65 to 74 Years | 7 (17.1%) | 0 (0.0%) |
| 75 Years and over | 2 (6.1%) | 0 (0.0%) |
| Total | 419 (71.0%) | 3 (0.7%) |
Employment Status by Educational Attainment in Green Valley
According to labor force statistics for Green Valley, 81.7% of individuals (349) out of the total population between 25 and 64 years of age (427) are in the labor force, with 0.6% or 2 of them being unemployed. The group with the highest labor force participation rate are those with the educational attainment of college / associate degree, with 86.7% or 144 individuals in the labor force. Within the labor force, individuals with high school diploma education have the highest percentage of unemployment, with 1.5% or 2 of them being unemployed.
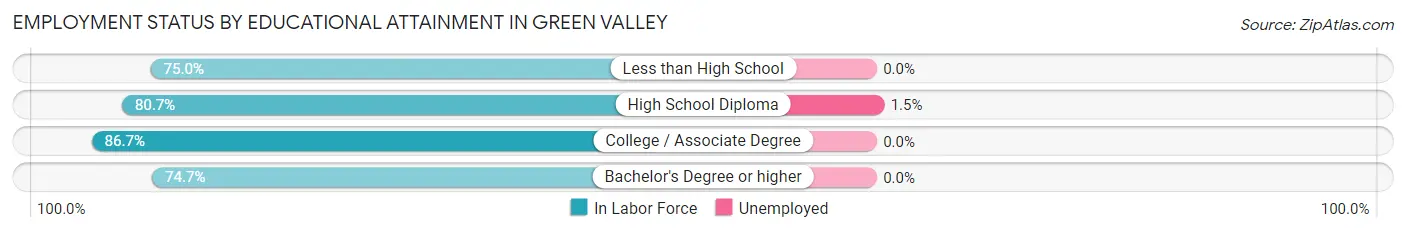
| Educational Attainment | In Labor Force | Unemployed |
| Less than High School | 15 (75.0%) | 0 (0.0%) |
| High School Diploma | 134 (80.7%) | 2 (1.5%) |
| College / Associate Degree | 144 (86.7%) | 0 (0.0%) |
| Bachelor's Degree or higher | 56 (74.7%) | 0 (0.0%) |
| Total | 349 (81.7%) | 3 (0.6%) |
Employment Occupations by Sex in Green Valley
Management, Business, Science and Arts Occupations
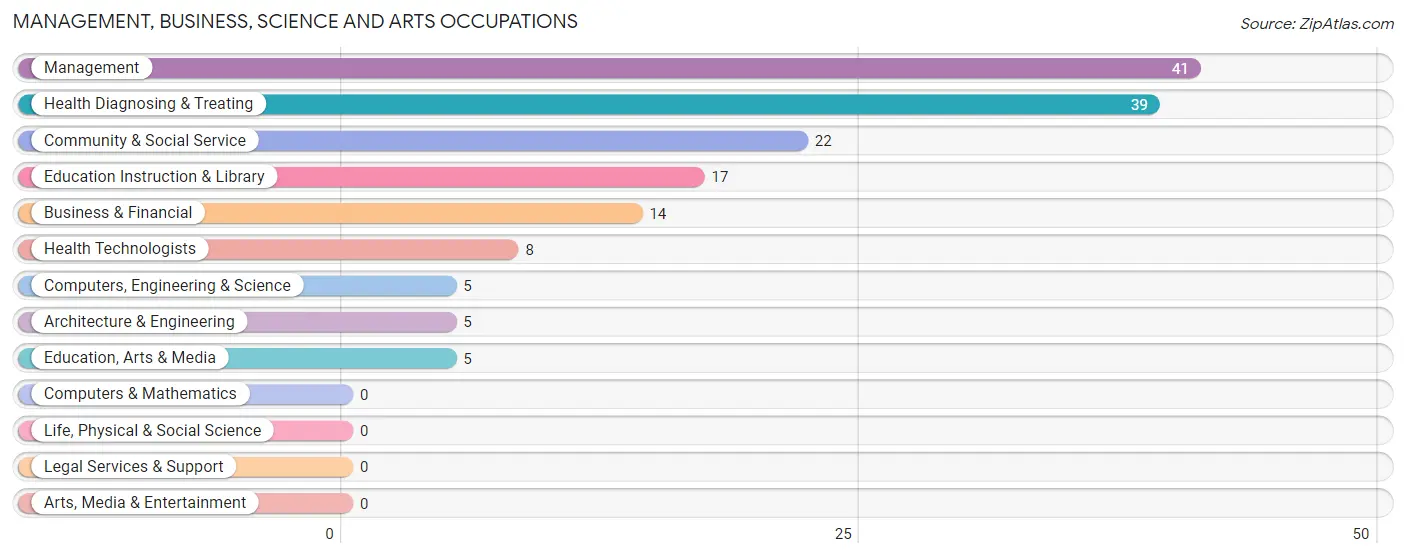
The most common Management, Business, Science and Arts occupations in Green Valley are Management (41 | 9.9%), Health Diagnosing & Treating (39 | 9.4%), Community & Social Service (22 | 5.3%), Education Instruction & Library (17 | 4.1%), and Business & Financial (14 | 3.4%).
Management, Business, Science and Arts Occupations by Sex
Within the Management, Business, Science and Arts occupations in Green Valley, the most male-oriented occupations are Computers, Engineering & Science (100.0%), Architecture & Engineering (100.0%), and Management (68.3%), while the most female-oriented occupations are Health Diagnosing & Treating (100.0%), Health Technologists (100.0%), and Education Instruction & Library (88.2%).
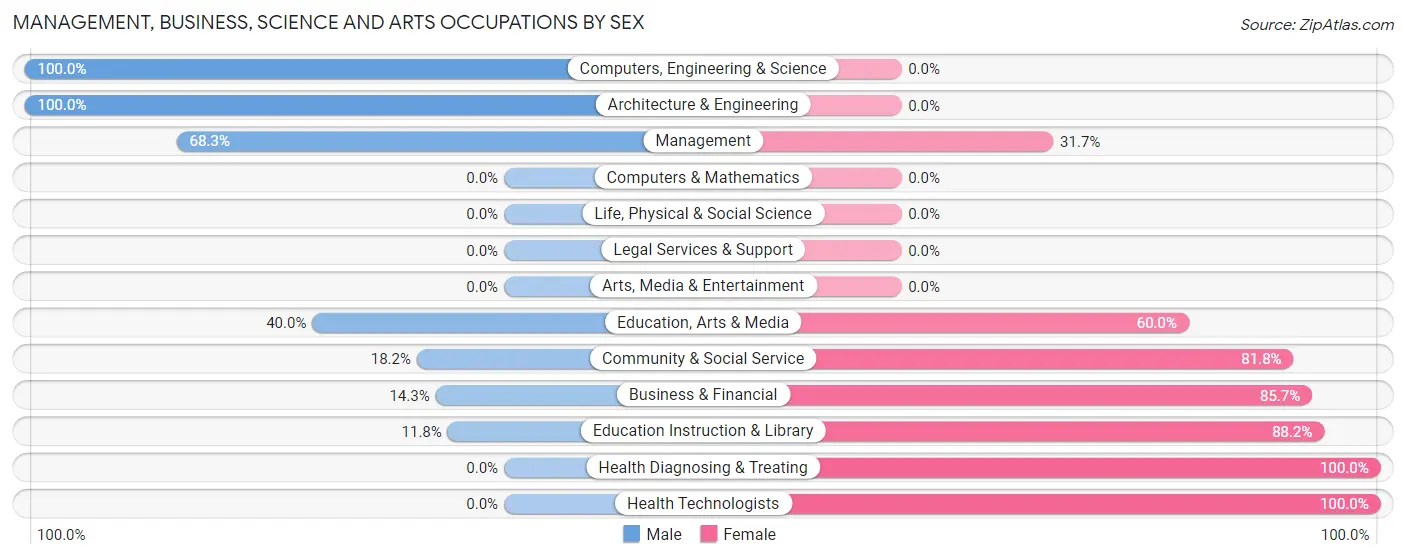
| Occupation | Male | Female |
| Management | 28 (68.3%) | 13 (31.7%) |
| Business & Financial | 2 (14.3%) | 12 (85.7%) |
| Computers, Engineering & Science | 5 (100.0%) | 0 (0.0%) |
| Computers & Mathematics | 0 (0.0%) | 0 (0.0%) |
| Architecture & Engineering | 5 (100.0%) | 0 (0.0%) |
| Life, Physical & Social Science | 0 (0.0%) | 0 (0.0%) |
| Community & Social Service | 4 (18.2%) | 18 (81.8%) |
| Education, Arts & Media | 2 (40.0%) | 3 (60.0%) |
| Legal Services & Support | 0 (0.0%) | 0 (0.0%) |
| Education Instruction & Library | 2 (11.8%) | 15 (88.2%) |
| Arts, Media & Entertainment | 0 (0.0%) | 0 (0.0%) |
| Health Diagnosing & Treating | 0 (0.0%) | 39 (100.0%) |
| Health Technologists | 0 (0.0%) | 8 (100.0%) |
| Total (Category) | 39 (32.2%) | 82 (67.8%) |
| Total (Overall) | 192 (46.2%) | 224 (53.8%) |
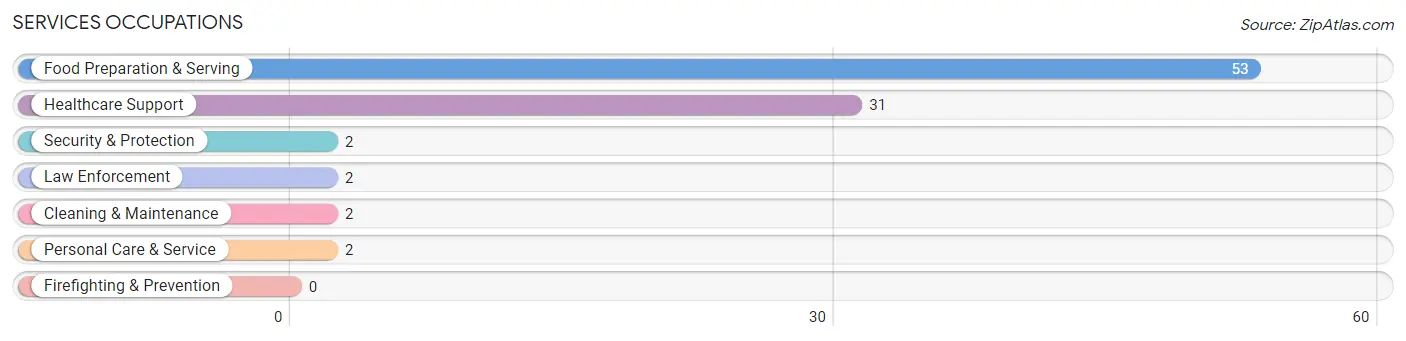
Services Occupations
The most common Services occupations in Green Valley are Food Preparation & Serving (53 | 12.7%), Healthcare Support (31 | 7.4%), Security & Protection (2 | 0.5%), Law Enforcement (2 | 0.5%), and Cleaning & Maintenance (2 | 0.5%).
Services Occupations by Sex
Within the Services occupations in Green Valley, the most male-oriented occupations are Security & Protection (100.0%), Law Enforcement (100.0%), and Cleaning & Maintenance (100.0%), while the most female-oriented occupations are Personal Care & Service (100.0%), Healthcare Support (83.9%), and Food Preparation & Serving (66.0%).
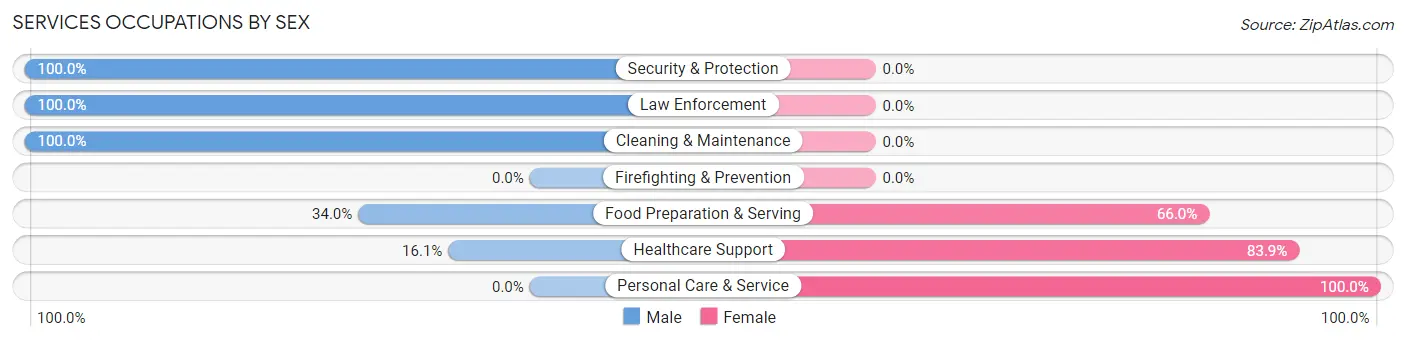
| Occupation | Male | Female |
| Healthcare Support | 5 (16.1%) | 26 (83.9%) |
| Security & Protection | 2 (100.0%) | 0 (0.0%) |
| Firefighting & Prevention | 0 (0.0%) | 0 (0.0%) |
| Law Enforcement | 2 (100.0%) | 0 (0.0%) |
| Food Preparation & Serving | 18 (34.0%) | 35 (66.0%) |
| Cleaning & Maintenance | 2 (100.0%) | 0 (0.0%) |
| Personal Care & Service | 0 (0.0%) | 2 (100.0%) |
| Total (Category) | 27 (30.0%) | 63 (70.0%) |
| Total (Overall) | 192 (46.2%) | 224 (53.8%) |
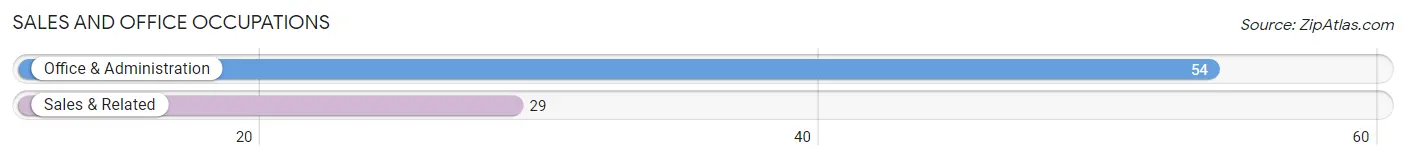
Sales and Office Occupations
The most common Sales and Office occupations in Green Valley are Office & Administration (54 | 13.0%), and Sales & Related (29 | 7.0%).
Sales and Office Occupations by Sex
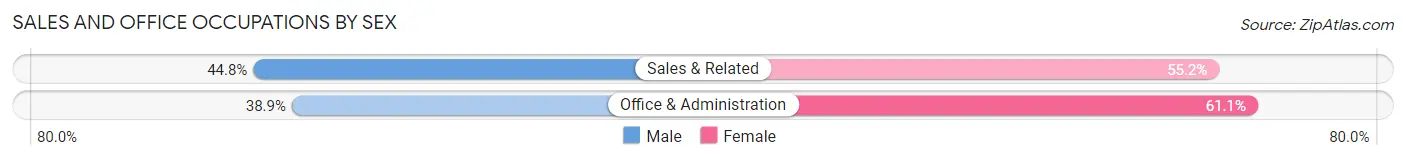
| Occupation | Male | Female |
| Sales & Related | 13 (44.8%) | 16 (55.2%) |
| Office & Administration | 21 (38.9%) | 33 (61.1%) |
| Total (Category) | 34 (41.0%) | 49 (59.0%) |
| Total (Overall) | 192 (46.2%) | 224 (53.8%) |
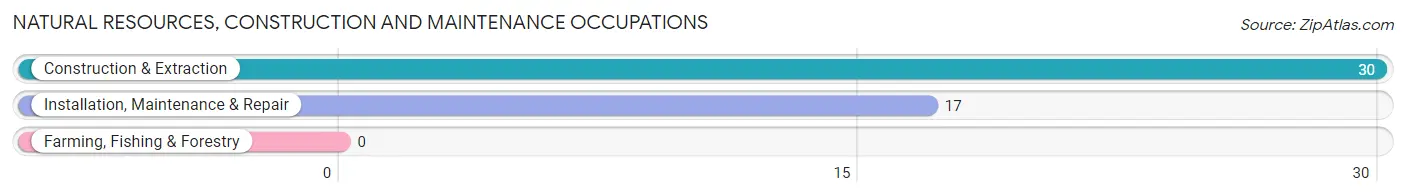
Natural Resources, Construction and Maintenance Occupations
The most common Natural Resources, Construction and Maintenance occupations in Green Valley are Construction & Extraction (30 | 7.2%), and Installation, Maintenance & Repair (17 | 4.1%).
Natural Resources, Construction and Maintenance Occupations by Sex
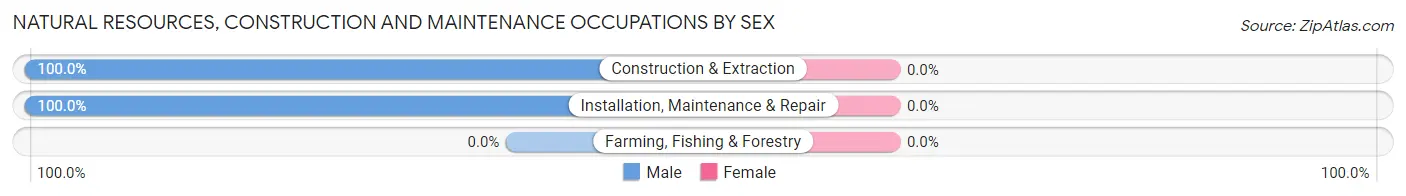
| Occupation | Male | Female |
| Farming, Fishing & Forestry | 0 (0.0%) | 0 (0.0%) |
| Construction & Extraction | 30 (100.0%) | 0 (0.0%) |
| Installation, Maintenance & Repair | 17 (100.0%) | 0 (0.0%) |
| Total (Category) | 47 (100.0%) | 0 (0.0%) |
| Total (Overall) | 192 (46.2%) | 224 (53.8%) |
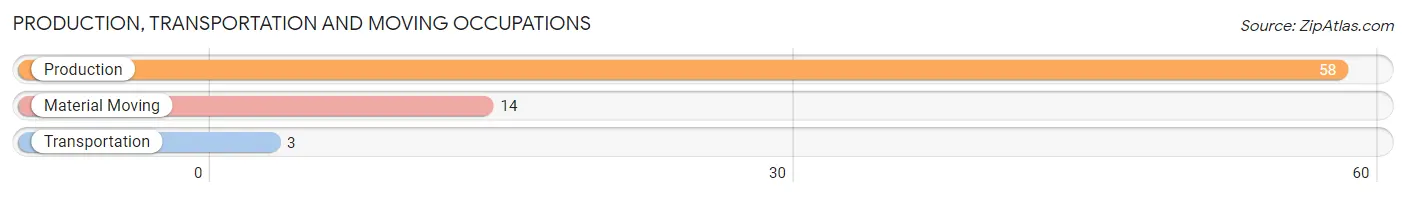
Production, Transportation and Moving Occupations
The most common Production, Transportation and Moving occupations in Green Valley are Production (58 | 13.9%), Material Moving (14 | 3.4%), and Transportation (3 | 0.7%).
Production, Transportation and Moving Occupations by Sex
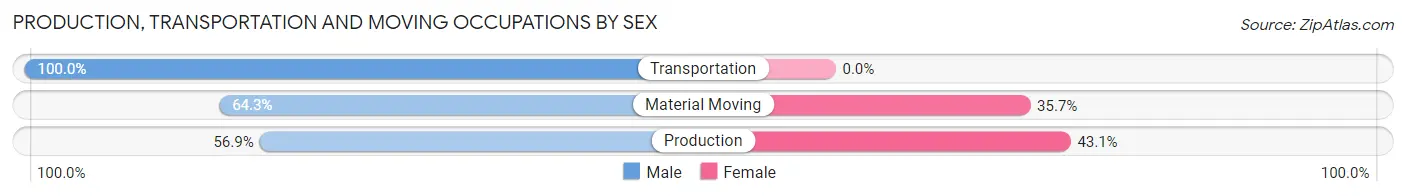
| Occupation | Male | Female |
| Production | 33 (56.9%) | 25 (43.1%) |
| Transportation | 3 (100.0%) | 0 (0.0%) |
| Material Moving | 9 (64.3%) | 5 (35.7%) |
| Total (Category) | 45 (60.0%) | 30 (40.0%) |
| Total (Overall) | 192 (46.2%) | 224 (53.8%) |
Employment Industries by Sex in Green Valley
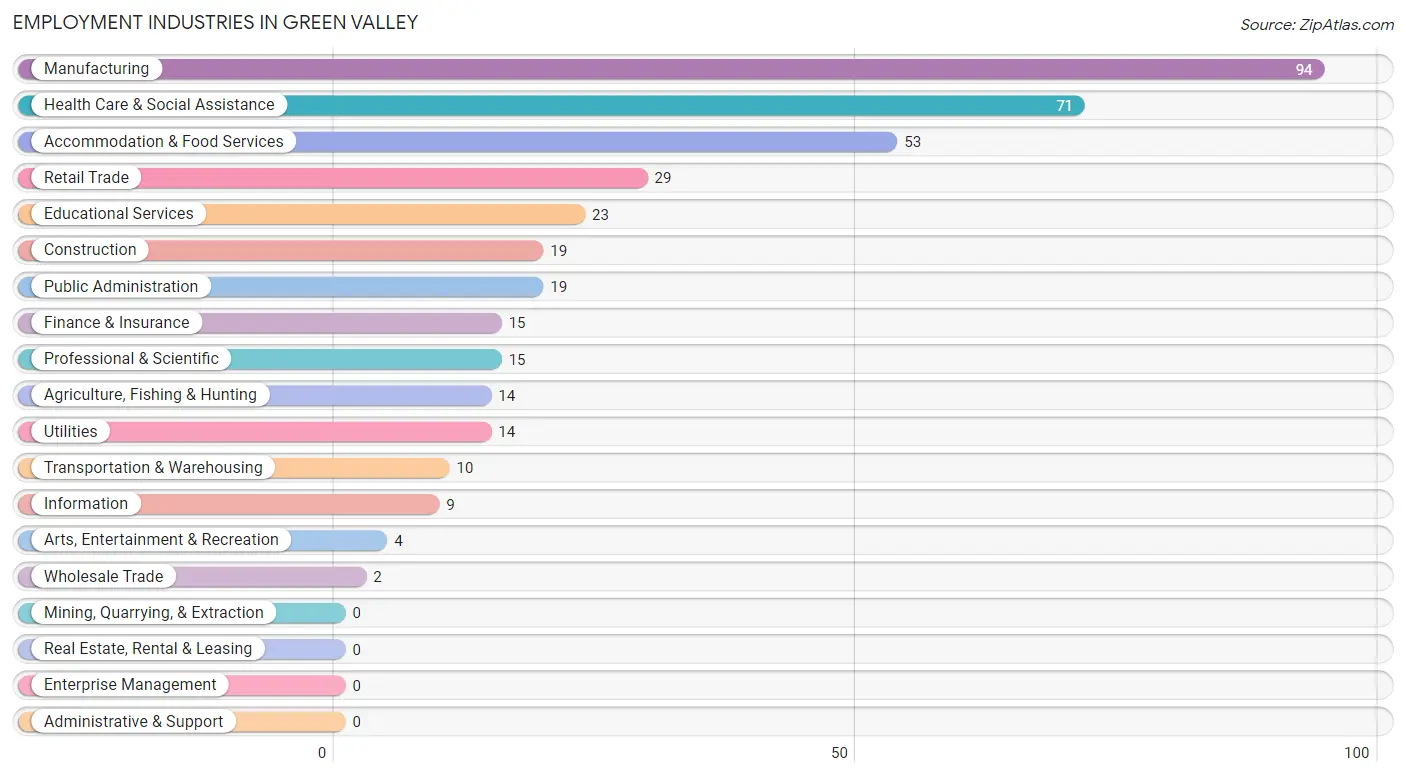
Employment Industries in Green Valley
The major employment industries in Green Valley include Manufacturing (94 | 22.6%), Health Care & Social Assistance (71 | 17.1%), Accommodation & Food Services (53 | 12.7%), Retail Trade (29 | 7.0%), and Educational Services (23 | 5.5%).
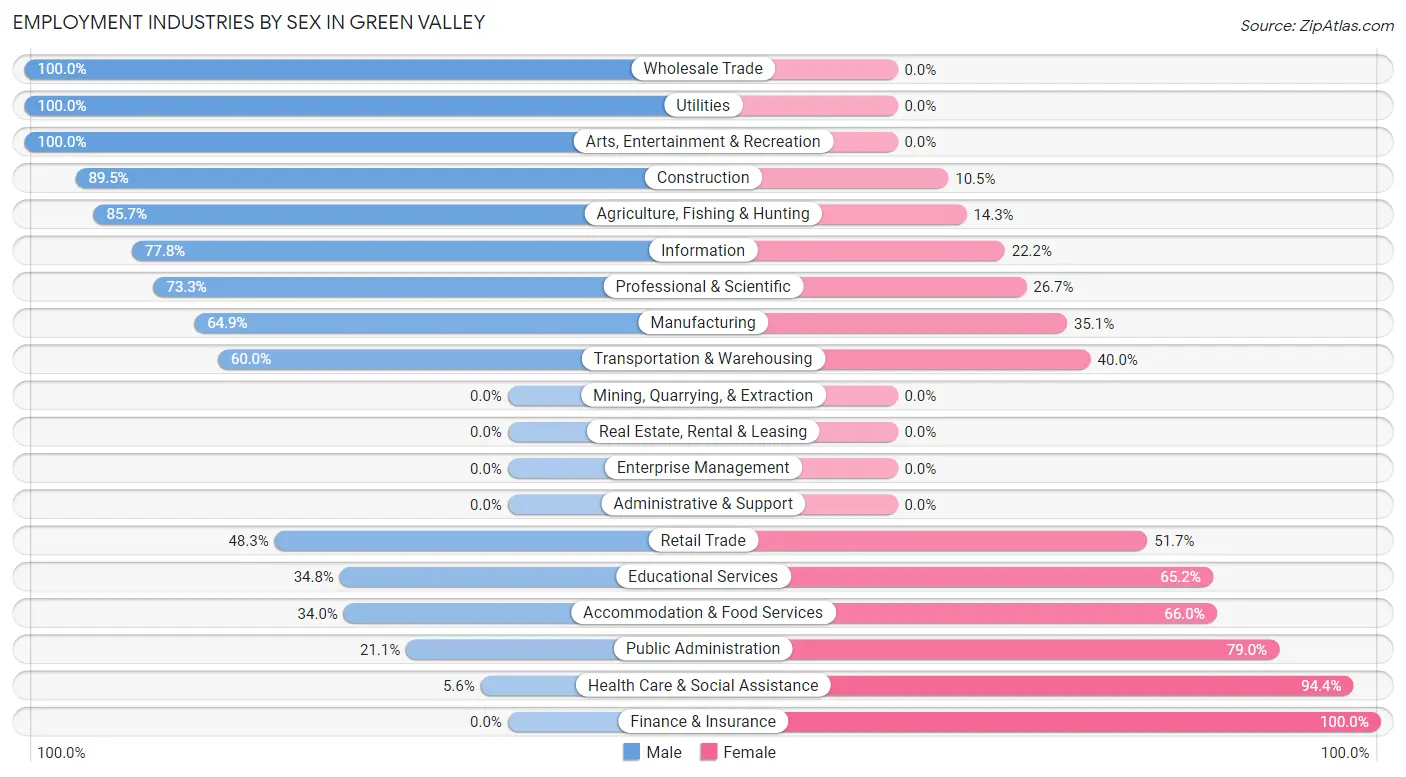
Employment Industries by Sex in Green Valley
The Green Valley industries that see more men than women are Wholesale Trade (100.0%), Utilities (100.0%), and Arts, Entertainment & Recreation (100.0%), whereas the industries that tend to have a higher number of women are Finance & Insurance (100.0%), Health Care & Social Assistance (94.4%), and Public Administration (78.9%).
| Industry | Male | Female |
| Agriculture, Fishing & Hunting | 12 (85.7%) | 2 (14.3%) |
| Mining, Quarrying, & Extraction | 0 (0.0%) | 0 (0.0%) |
| Construction | 17 (89.5%) | 2 (10.5%) |
| Manufacturing | 61 (64.9%) | 33 (35.1%) |
| Wholesale Trade | 2 (100.0%) | 0 (0.0%) |
| Retail Trade | 14 (48.3%) | 15 (51.7%) |
| Transportation & Warehousing | 6 (60.0%) | 4 (40.0%) |
| Utilities | 14 (100.0%) | 0 (0.0%) |
| Information | 7 (77.8%) | 2 (22.2%) |
| Finance & Insurance | 0 (0.0%) | 15 (100.0%) |
| Real Estate, Rental & Leasing | 0 (0.0%) | 0 (0.0%) |
| Professional & Scientific | 11 (73.3%) | 4 (26.7%) |
| Enterprise Management | 0 (0.0%) | 0 (0.0%) |
| Administrative & Support | 0 (0.0%) | 0 (0.0%) |
| Educational Services | 8 (34.8%) | 15 (65.2%) |
| Health Care & Social Assistance | 4 (5.6%) | 67 (94.4%) |
| Arts, Entertainment & Recreation | 4 (100.0%) | 0 (0.0%) |
| Accommodation & Food Services | 18 (34.0%) | 35 (66.0%) |
| Public Administration | 4 (21.0%) | 15 (78.9%) |
| Total | 192 (46.2%) | 224 (53.8%) |
Education in Green Valley
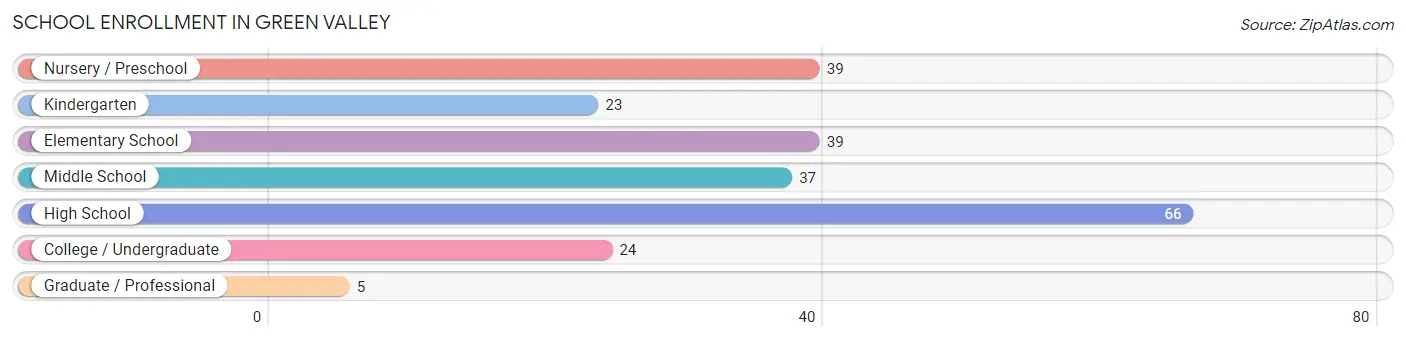
School Enrollment in Green Valley
The most common levels of schooling among the 233 students in Green Valley are high school (66 | 28.3%), nursery / preschool (39 | 16.7%), and elementary school (39 | 16.7%).
| School Level | # Students | % Students |
| Nursery / Preschool | 39 | 16.7% |
| Kindergarten | 23 | 9.9% |
| Elementary School | 39 | 16.7% |
| Middle School | 37 | 15.9% |
| High School | 66 | 28.3% |
| College / Undergraduate | 24 | 10.3% |
| Graduate / Professional | 5 | 2.1% |
| Total | 233 | 100.0% |
School Enrollment by Age by Funding Source in Green Valley
Out of a total of 233 students who are enrolled in schools in Green Valley, 1 (0.4%) attend a private institution, while the remaining 232 (99.6%) are enrolled in public schools. The age group of 5 to 9 year old has the highest likelihood of being enrolled in private schools, with 1 (1.6% in the age bracket) enrolled. Conversely, the age group of 3 to 4 year olds has the lowest likelihood of being enrolled in a private school, with 34 (100.0% in the age bracket) attending a public institution.
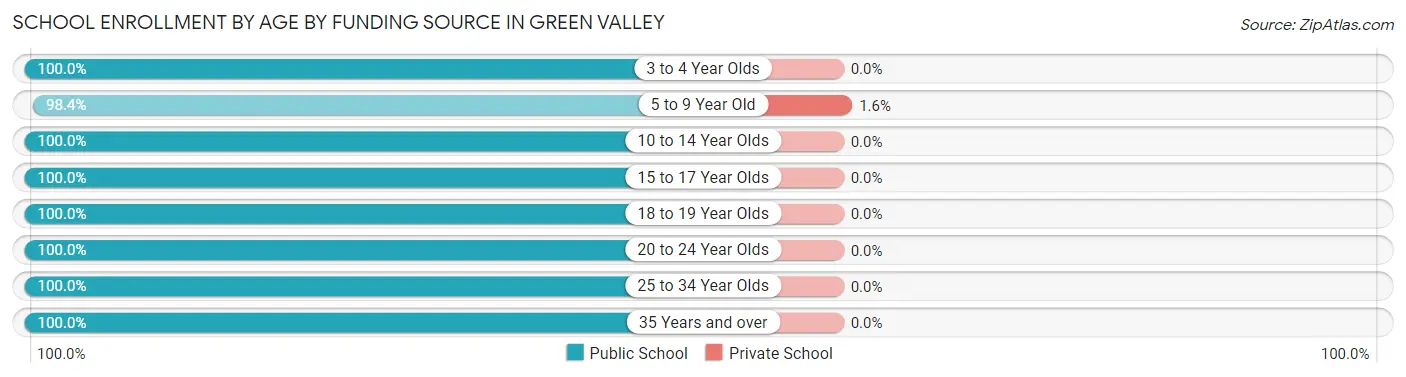
| Age Bracket | Public School | Private School |
| 3 to 4 Year Olds | 34 (100.0%) | 0 (0.0%) |
| 5 to 9 Year Old | 62 (98.4%) | 1 (1.6%) |
| 10 to 14 Year Olds | 49 (100.0%) | 0 (0.0%) |
| 15 to 17 Year Olds | 56 (100.0%) | 0 (0.0%) |
| 18 to 19 Year Olds | 13 (100.0%) | 0 (0.0%) |
| 20 to 24 Year Olds | 5 (100.0%) | 0 (0.0%) |
| 25 to 34 Year Olds | 6 (100.0%) | 0 (0.0%) |
| 35 Years and over | 7 (100.0%) | 0 (0.0%) |
| Total | 232 (99.6%) | 1 (0.4%) |
Educational Attainment by Field of Study in Green Valley
Education (38 | 43.7%), psychology (17 | 19.5%), science & technology (16 | 18.4%), social sciences (6 | 6.9%), and business (3 | 3.5%) are the most common fields of study among 87 individuals in Green Valley who have obtained a bachelor's degree or higher.
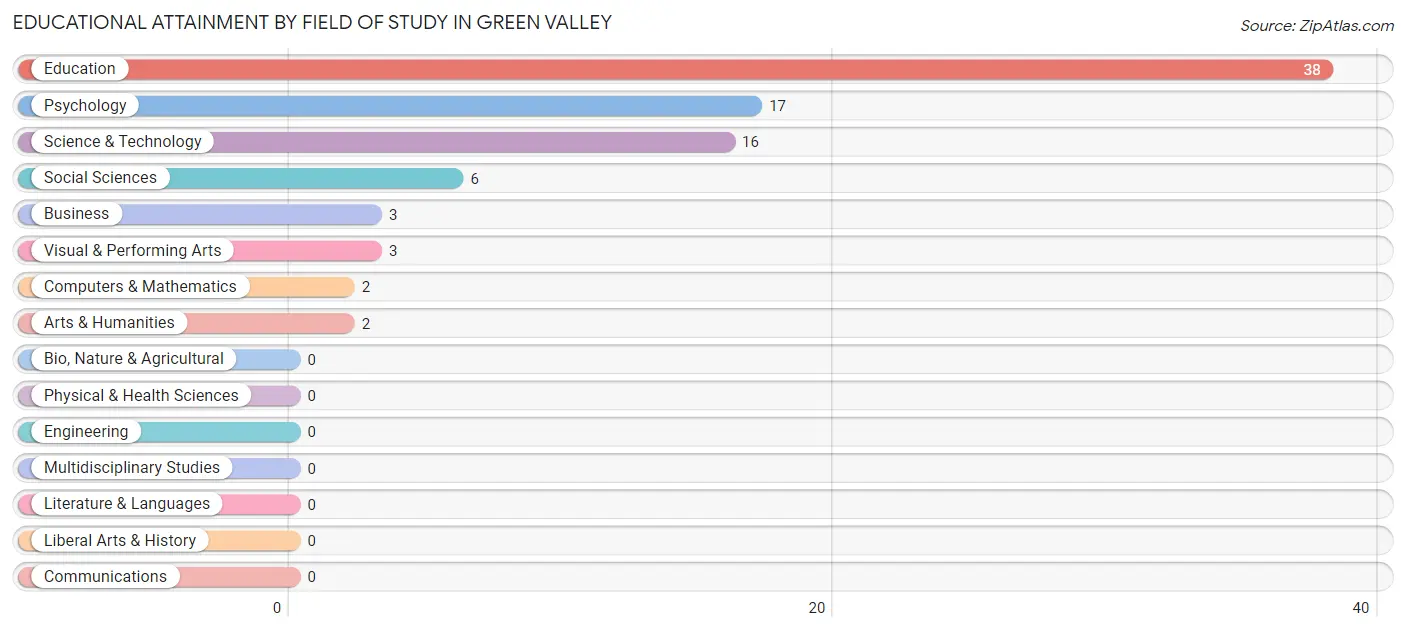
| Field of Study | # Graduates | % Graduates |
| Computers & Mathematics | 2 | 2.3% |
| Bio, Nature & Agricultural | 0 | 0.0% |
| Physical & Health Sciences | 0 | 0.0% |
| Psychology | 17 | 19.5% |
| Social Sciences | 6 | 6.9% |
| Engineering | 0 | 0.0% |
| Multidisciplinary Studies | 0 | 0.0% |
| Science & Technology | 16 | 18.4% |
| Business | 3 | 3.5% |
| Education | 38 | 43.7% |
| Literature & Languages | 0 | 0.0% |
| Liberal Arts & History | 0 | 0.0% |
| Visual & Performing Arts | 3 | 3.5% |
| Communications | 0 | 0.0% |
| Arts & Humanities | 2 | 2.3% |
| Total | 87 | 100.0% |
Transportation & Commute in Green Valley
Vehicle Availability by Sex in Green Valley
The most prevalent vehicle ownership categories in Green Valley are males with 2 vehicles (86, accounting for 44.8%) and females with 2 vehicles (113, making up 38.4%).
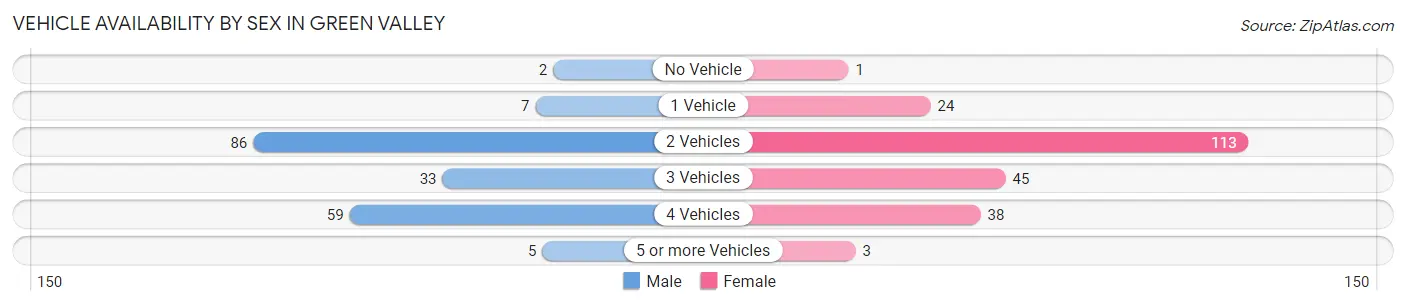
| Vehicles Available | Male | Female |
| No Vehicle | 2 (1.0%) | 1 (0.4%) |
| 1 Vehicle | 7 (3.6%) | 24 (10.7%) |
| 2 Vehicles | 86 (44.8%) | 113 (50.4%) |
| 3 Vehicles | 33 (17.2%) | 45 (20.1%) |
| 4 Vehicles | 59 (30.7%) | 38 (17.0%) |
| 5 or more Vehicles | 5 (2.6%) | 3 (1.3%) |
| Total | 192 (100.0%) | 224 (100.0%) |
Commute Time in Green Valley
The most frequently occuring commute durations in Green Valley are 20 to 24 minutes (73 commuters, 18.0%), 30 to 34 minutes (67 commuters, 16.5%), and 15 to 19 minutes (62 commuters, 15.3%).
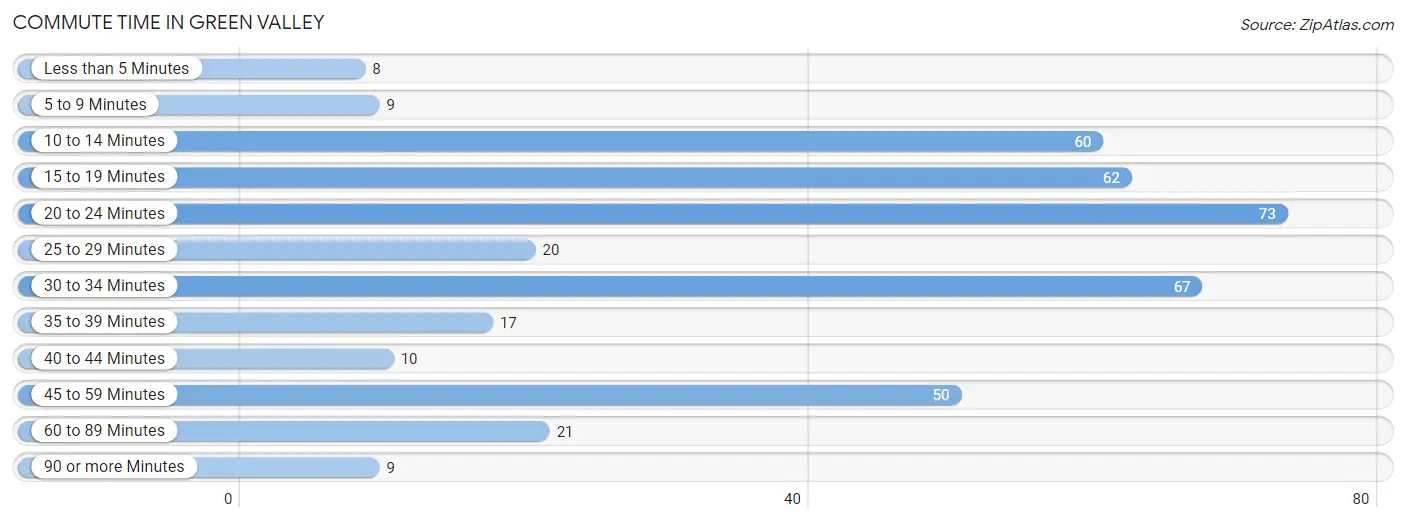
| Commute Time | # Commuters | % Commuters |
| Less than 5 Minutes | 8 | 2.0% |
| 5 to 9 Minutes | 9 | 2.2% |
| 10 to 14 Minutes | 60 | 14.8% |
| 15 to 19 Minutes | 62 | 15.3% |
| 20 to 24 Minutes | 73 | 18.0% |
| 25 to 29 Minutes | 20 | 4.9% |
| 30 to 34 Minutes | 67 | 16.5% |
| 35 to 39 Minutes | 17 | 4.2% |
| 40 to 44 Minutes | 10 | 2.5% |
| 45 to 59 Minutes | 50 | 12.3% |
| 60 to 89 Minutes | 21 | 5.2% |
| 90 or more Minutes | 9 | 2.2% |
Commute Time by Sex in Green Valley
The most common commute times in Green Valley are 30 to 34 minutes (34 commuters, 17.9%) for males and 20 to 24 minutes (43 commuters, 19.9%) for females.
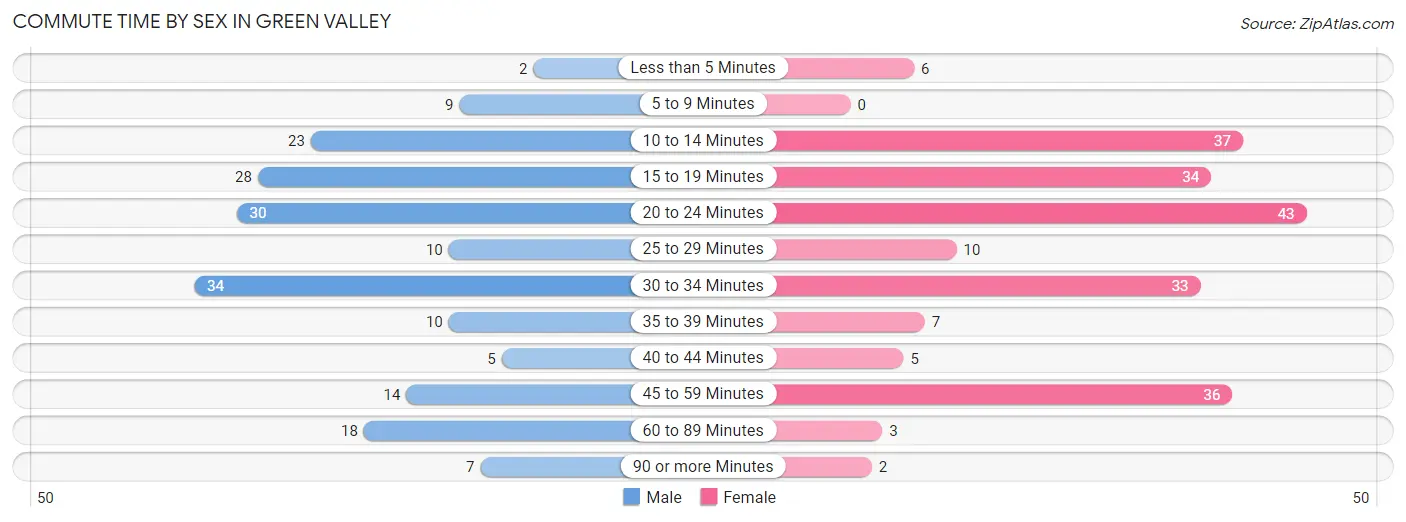
| Commute Time | Male | Female |
| Less than 5 Minutes | 2 (1.1%) | 6 (2.8%) |
| 5 to 9 Minutes | 9 (4.7%) | 0 (0.0%) |
| 10 to 14 Minutes | 23 (12.1%) | 37 (17.1%) |
| 15 to 19 Minutes | 28 (14.7%) | 34 (15.7%) |
| 20 to 24 Minutes | 30 (15.8%) | 43 (19.9%) |
| 25 to 29 Minutes | 10 (5.3%) | 10 (4.6%) |
| 30 to 34 Minutes | 34 (17.9%) | 33 (15.3%) |
| 35 to 39 Minutes | 10 (5.3%) | 7 (3.2%) |
| 40 to 44 Minutes | 5 (2.6%) | 5 (2.3%) |
| 45 to 59 Minutes | 14 (7.4%) | 36 (16.7%) |
| 60 to 89 Minutes | 18 (9.5%) | 3 (1.4%) |
| 90 or more Minutes | 7 (3.7%) | 2 (0.9%) |
Time of Departure to Work by Sex in Green Valley
The most frequent times of departure to work in Green Valley are 6:00 AM to 6:29 AM (42, 22.1%) for males and 7:00 AM to 7:29 AM (42, 19.4%) for females.
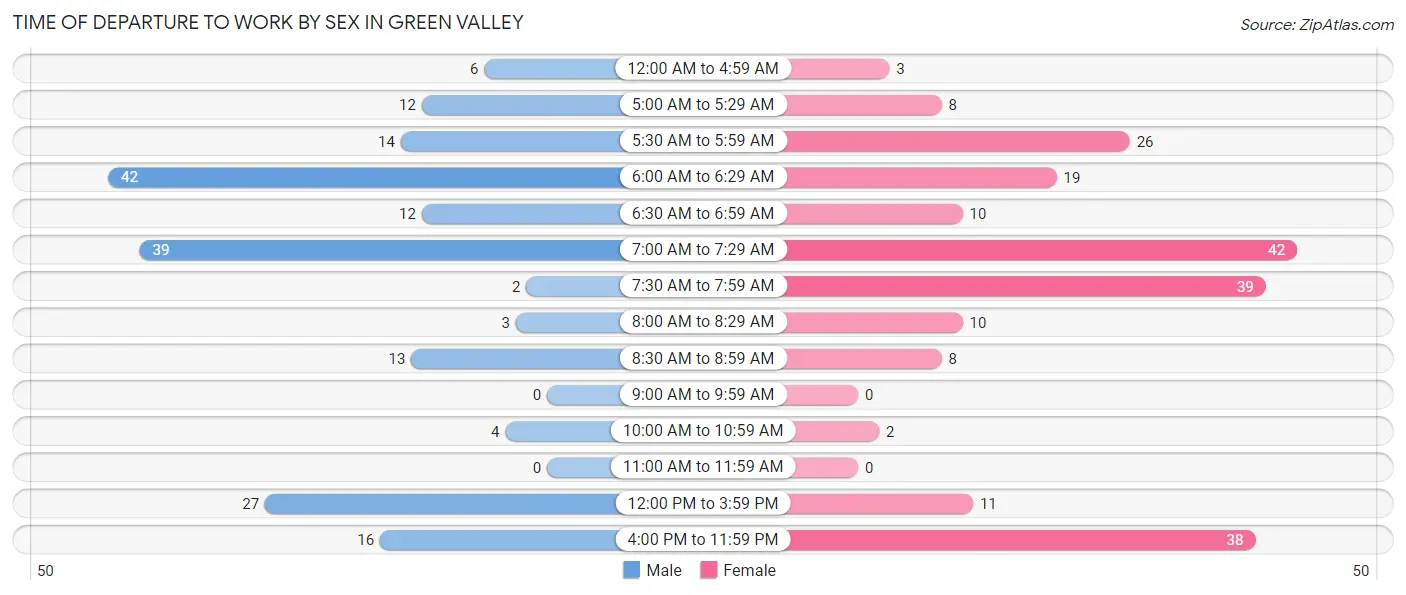
| Time of Departure | Male | Female |
| 12:00 AM to 4:59 AM | 6 (3.2%) | 3 (1.4%) |
| 5:00 AM to 5:29 AM | 12 (6.3%) | 8 (3.7%) |
| 5:30 AM to 5:59 AM | 14 (7.4%) | 26 (12.0%) |
| 6:00 AM to 6:29 AM | 42 (22.1%) | 19 (8.8%) |
| 6:30 AM to 6:59 AM | 12 (6.3%) | 10 (4.6%) |
| 7:00 AM to 7:29 AM | 39 (20.5%) | 42 (19.4%) |
| 7:30 AM to 7:59 AM | 2 (1.1%) | 39 (18.1%) |
| 8:00 AM to 8:29 AM | 3 (1.6%) | 10 (4.6%) |
| 8:30 AM to 8:59 AM | 13 (6.8%) | 8 (3.7%) |
| 9:00 AM to 9:59 AM | 0 (0.0%) | 0 (0.0%) |
| 10:00 AM to 10:59 AM | 4 (2.1%) | 2 (0.9%) |
| 11:00 AM to 11:59 AM | 0 (0.0%) | 0 (0.0%) |
| 12:00 PM to 3:59 PM | 27 (14.2%) | 11 (5.1%) |
| 4:00 PM to 11:59 PM | 16 (8.4%) | 38 (17.6%) |
| Total | 190 (100.0%) | 216 (100.0%) |
Housing Occupancy in Green Valley
Occupancy by Ownership in Green Valley
Of the total 304 dwellings in Green Valley, owner-occupied units account for 208 (68.4%), while renter-occupied units make up 96 (31.6%).
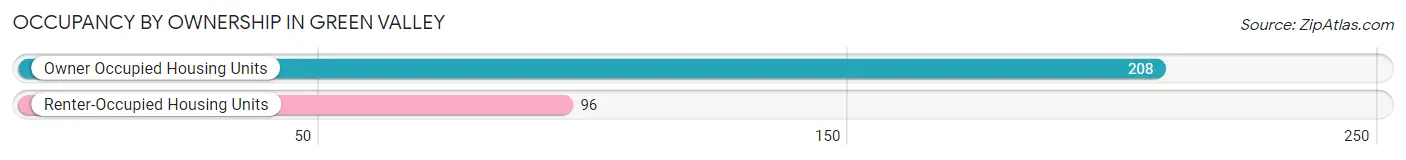
| Occupancy | # Housing Units | % Housing Units |
| Owner Occupied Housing Units | 208 | 68.4% |
| Renter-Occupied Housing Units | 96 | 31.6% |
| Total Occupied Housing Units | 304 | 100.0% |
Occupancy by Household Size in Green Valley
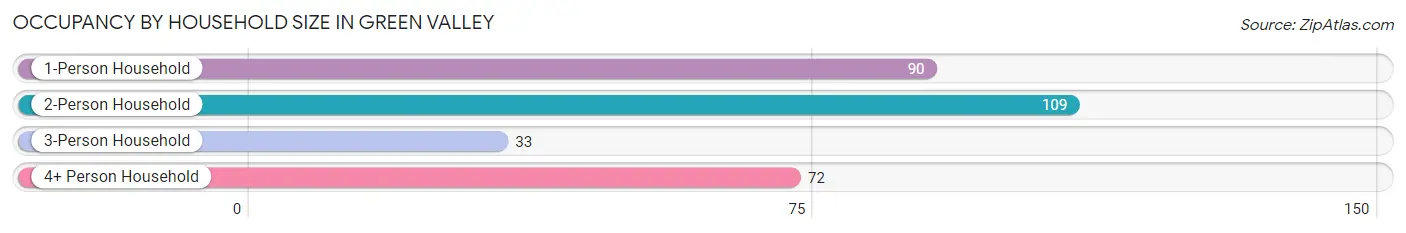
| Household Size | # Housing Units | % Housing Units |
| 1-Person Household | 90 | 29.6% |
| 2-Person Household | 109 | 35.9% |
| 3-Person Household | 33 | 10.9% |
| 4+ Person Household | 72 | 23.7% |
| Total Housing Units | 304 | 100.0% |
Occupancy by Ownership by Household Size in Green Valley
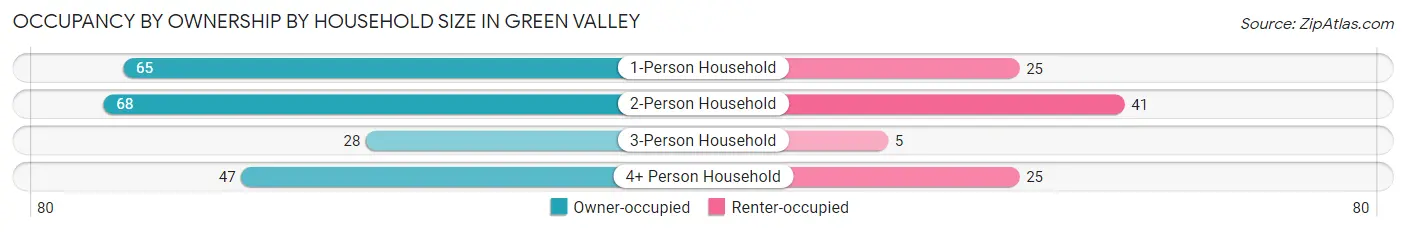
| Household Size | Owner-occupied | Renter-occupied |
| 1-Person Household | 65 (72.2%) | 25 (27.8%) |
| 2-Person Household | 68 (62.4%) | 41 (37.6%) |
| 3-Person Household | 28 (84.9%) | 5 (15.1%) |
| 4+ Person Household | 47 (65.3%) | 25 (34.7%) |
| Total Housing Units | 208 (68.4%) | 96 (31.6%) |
Occupancy by Educational Attainment in Green Valley
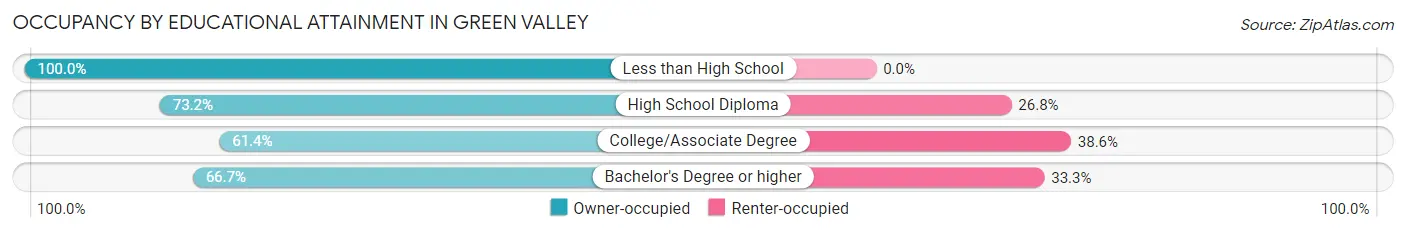
| Household Size | Owner-occupied | Renter-occupied |
| Less than High School | 7 (100.0%) | 0 (0.0%) |
| High School Diploma | 101 (73.2%) | 37 (26.8%) |
| College/Associate Degree | 70 (61.4%) | 44 (38.6%) |
| Bachelor's Degree or higher | 30 (66.7%) | 15 (33.3%) |
Occupancy by Age of Householder in Green Valley
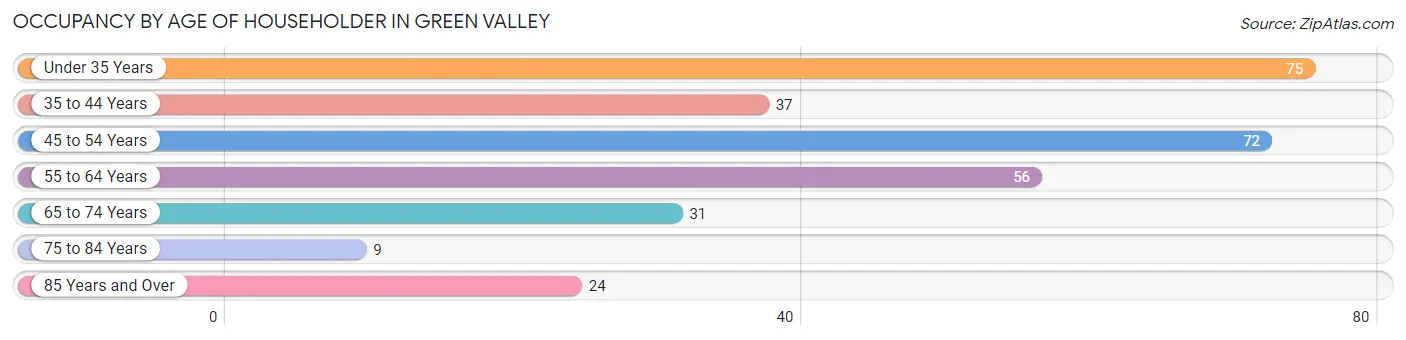
| Age Bracket | # Households | % Households |
| Under 35 Years | 75 | 24.7% |
| 35 to 44 Years | 37 | 12.2% |
| 45 to 54 Years | 72 | 23.7% |
| 55 to 64 Years | 56 | 18.4% |
| 65 to 74 Years | 31 | 10.2% |
| 75 to 84 Years | 9 | 3.0% |
| 85 Years and Over | 24 | 7.9% |
| Total | 304 | 100.0% |
Housing Finances in Green Valley
Median Income by Occupancy in Green Valley
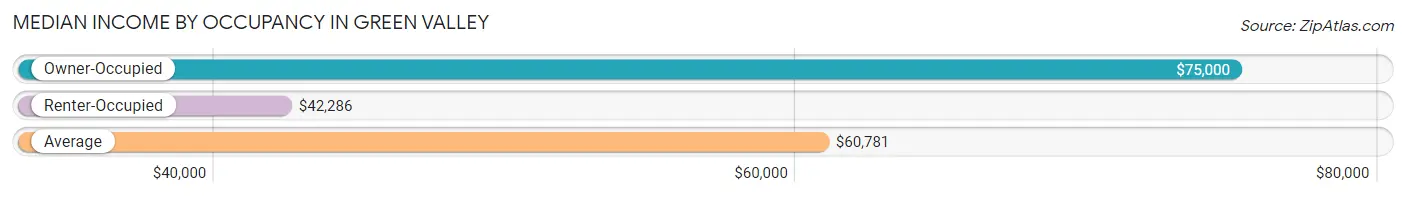
| Occupancy Type | # Households | Median Income |
| Owner-Occupied | 208 (68.4%) | $75,000 |
| Renter-Occupied | 96 (31.6%) | $42,286 |
| Average | 304 (100.0%) | $60,781 |
Occupancy by Householder Income Bracket in Green Valley
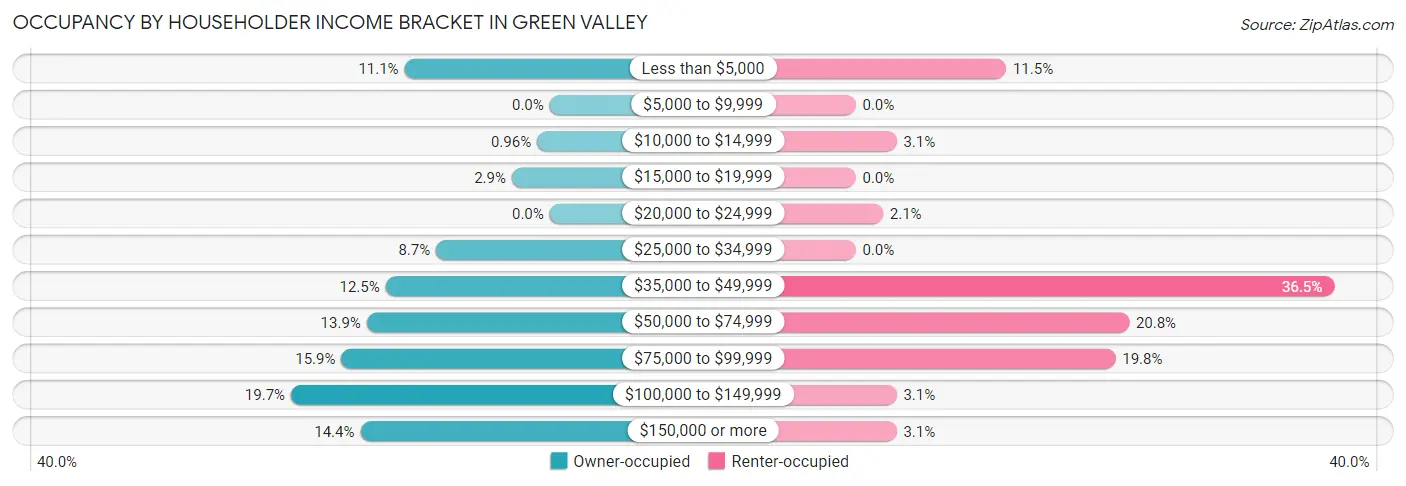
| Income Bracket | Owner-occupied | Renter-occupied |
| Less than $5,000 | 23 (11.1%) | 11 (11.5%) |
| $5,000 to $9,999 | 0 (0.0%) | 0 (0.0%) |
| $10,000 to $14,999 | 2 (1.0%) | 3 (3.1%) |
| $15,000 to $19,999 | 6 (2.9%) | 0 (0.0%) |
| $20,000 to $24,999 | 0 (0.0%) | 2 (2.1%) |
| $25,000 to $34,999 | 18 (8.6%) | 0 (0.0%) |
| $35,000 to $49,999 | 26 (12.5%) | 35 (36.5%) |
| $50,000 to $74,999 | 29 (13.9%) | 20 (20.8%) |
| $75,000 to $99,999 | 33 (15.9%) | 19 (19.8%) |
| $100,000 to $149,999 | 41 (19.7%) | 3 (3.1%) |
| $150,000 or more | 30 (14.4%) | 3 (3.1%) |
| Total | 208 (100.0%) | 96 (100.0%) |
Monthly Housing Cost Tiers in Green Valley
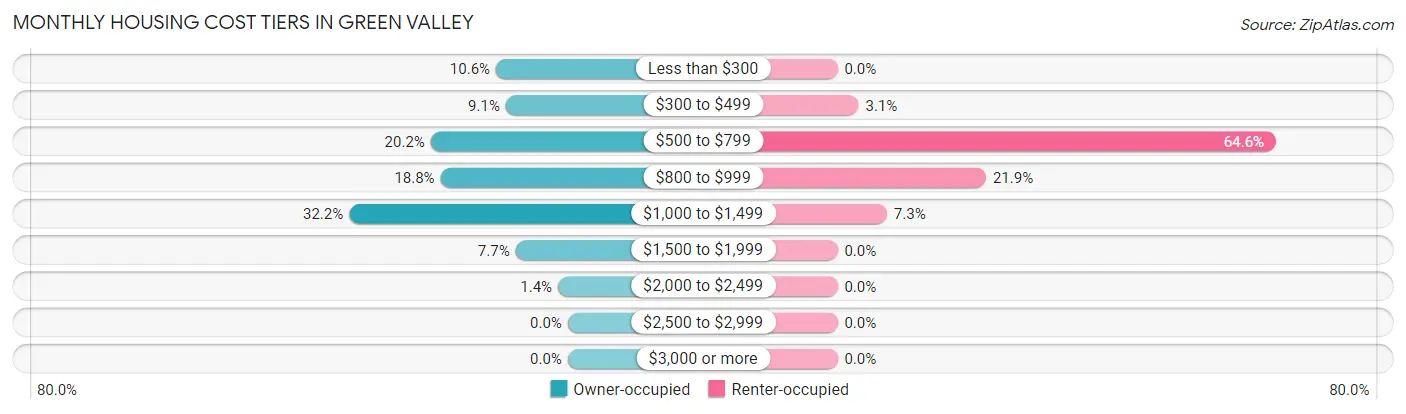
| Monthly Cost | Owner-occupied | Renter-occupied |
| Less than $300 | 22 (10.6%) | 0 (0.0%) |
| $300 to $499 | 19 (9.1%) | 3 (3.1%) |
| $500 to $799 | 42 (20.2%) | 62 (64.6%) |
| $800 to $999 | 39 (18.8%) | 21 (21.9%) |
| $1,000 to $1,499 | 67 (32.2%) | 7 (7.3%) |
| $1,500 to $1,999 | 16 (7.7%) | 0 (0.0%) |
| $2,000 to $2,499 | 3 (1.4%) | 0 (0.0%) |
| $2,500 to $2,999 | 0 (0.0%) | 0 (0.0%) |
| $3,000 or more | 0 (0.0%) | 0 (0.0%) |
| Total | 208 (100.0%) | 96 (100.0%) |
Physical Housing Characteristics in Green Valley
Housing Structures in Green Valley
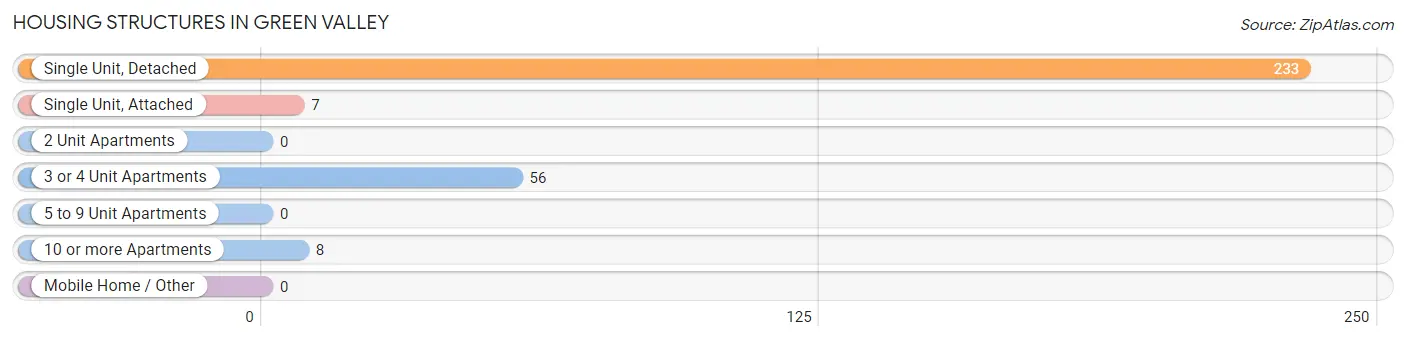
| Structure Type | # Housing Units | % Housing Units |
| Single Unit, Detached | 233 | 76.6% |
| Single Unit, Attached | 7 | 2.3% |
| 2 Unit Apartments | 0 | 0.0% |
| 3 or 4 Unit Apartments | 56 | 18.4% |
| 5 to 9 Unit Apartments | 0 | 0.0% |
| 10 or more Apartments | 8 | 2.6% |
| Mobile Home / Other | 0 | 0.0% |
| Total | 304 | 100.0% |
Housing Structures by Occupancy in Green Valley
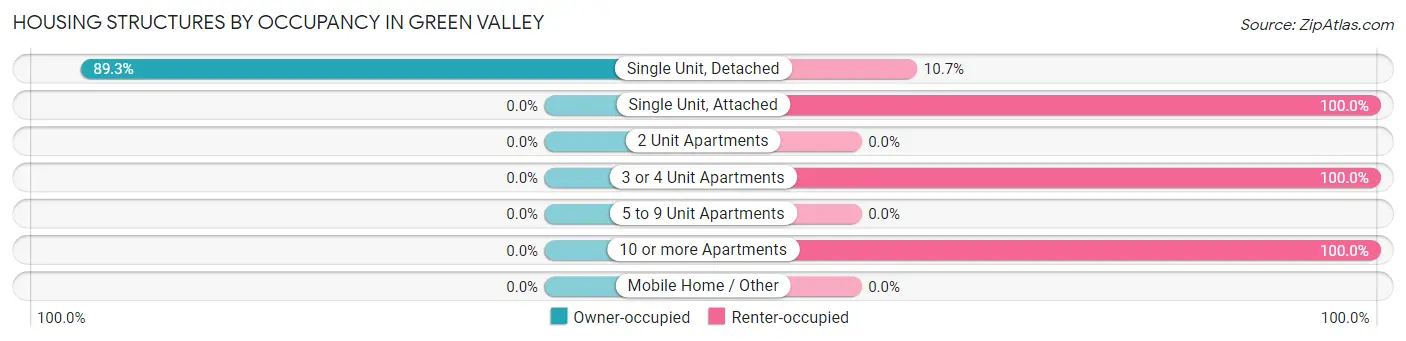
| Structure Type | Owner-occupied | Renter-occupied |
| Single Unit, Detached | 208 (89.3%) | 25 (10.7%) |
| Single Unit, Attached | 0 (0.0%) | 7 (100.0%) |
| 2 Unit Apartments | 0 (0.0%) | 0 (0.0%) |
| 3 or 4 Unit Apartments | 0 (0.0%) | 56 (100.0%) |
| 5 to 9 Unit Apartments | 0 (0.0%) | 0 (0.0%) |
| 10 or more Apartments | 0 (0.0%) | 8 (100.0%) |
| Mobile Home / Other | 0 (0.0%) | 0 (0.0%) |
| Total | 208 (68.4%) | 96 (31.6%) |
Housing Structures by Number of Rooms in Green Valley
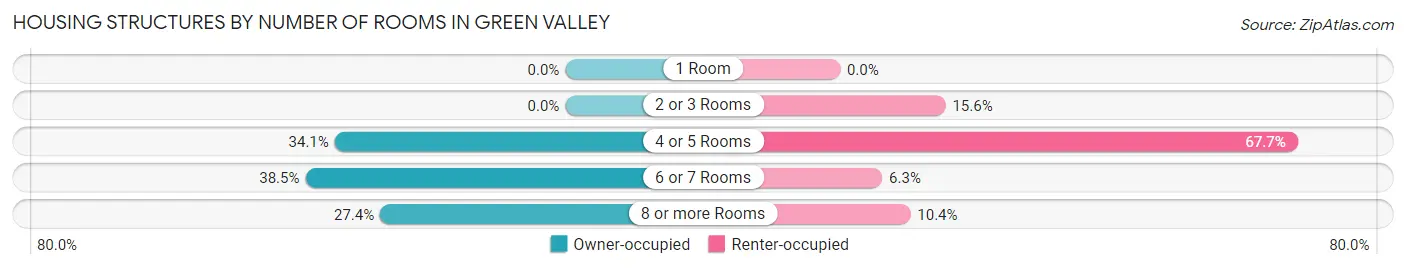
| Number of Rooms | Owner-occupied | Renter-occupied |
| 1 Room | 0 (0.0%) | 0 (0.0%) |
| 2 or 3 Rooms | 0 (0.0%) | 15 (15.6%) |
| 4 or 5 Rooms | 71 (34.1%) | 65 (67.7%) |
| 6 or 7 Rooms | 80 (38.5%) | 6 (6.2%) |
| 8 or more Rooms | 57 (27.4%) | 10 (10.4%) |
| Total | 208 (100.0%) | 96 (100.0%) |
Housing Structure by Heating Type in Green Valley
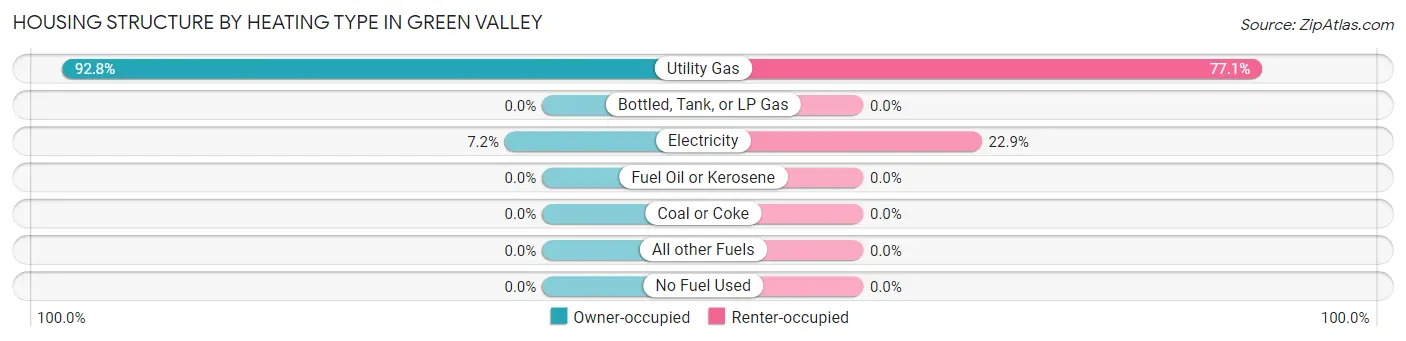
| Heating Type | Owner-occupied | Renter-occupied |
| Utility Gas | 193 (92.8%) | 74 (77.1%) |
| Bottled, Tank, or LP Gas | 0 (0.0%) | 0 (0.0%) |
| Electricity | 15 (7.2%) | 22 (22.9%) |
| Fuel Oil or Kerosene | 0 (0.0%) | 0 (0.0%) |
| Coal or Coke | 0 (0.0%) | 0 (0.0%) |
| All other Fuels | 0 (0.0%) | 0 (0.0%) |
| No Fuel Used | 0 (0.0%) | 0 (0.0%) |
| Total | 208 (100.0%) | 96 (100.0%) |
Household Vehicle Usage in Green Valley
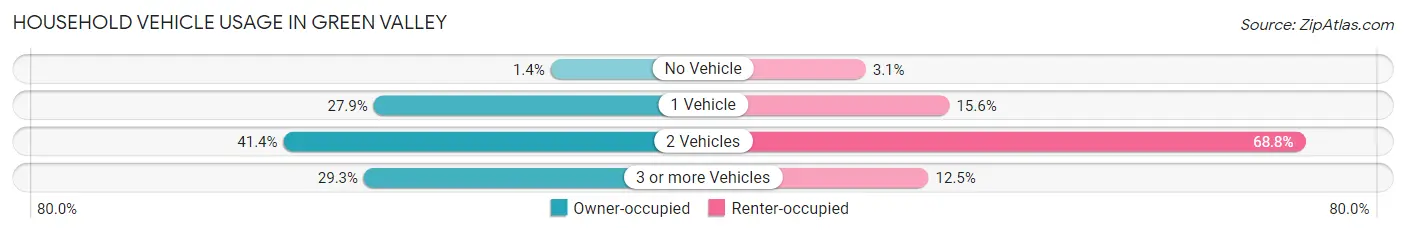
| Vehicles per Household | Owner-occupied | Renter-occupied |
| No Vehicle | 3 (1.4%) | 3 (3.1%) |
| 1 Vehicle | 58 (27.9%) | 15 (15.6%) |
| 2 Vehicles | 86 (41.3%) | 66 (68.8%) |
| 3 or more Vehicles | 61 (29.3%) | 12 (12.5%) |
| Total | 208 (100.0%) | 96 (100.0%) |
Real Estate & Mortgages in Green Valley
Real Estate and Mortgage Overview in Green Valley
| Characteristic | Without Mortgage | With Mortgage |
| Housing Units | 74 | 134 |
| Median Property Value | $94,100 | $126,700 |
| Median Household Income | $70,625 | $20 |
| Monthly Housing Costs | $443 | $0 |
| Real Estate Taxes | $1,278 | $6 |
Property Value by Mortgage Status in Green Valley

| Property Value | Without Mortgage | With Mortgage |
| Less than $50,000 | 6 (8.1%) | 5 (3.7%) |
| $50,000 to $99,999 | 48 (64.9%) | 36 (26.9%) |
| $100,000 to $299,999 | 20 (27.0%) | 93 (69.4%) |
| $300,000 to $499,999 | 0 (0.0%) | 0 (0.0%) |
| $500,000 to $749,999 | 0 (0.0%) | 0 (0.0%) |
| $750,000 to $999,999 | 0 (0.0%) | 0 (0.0%) |
| $1,000,000 or more | 0 (0.0%) | 0 (0.0%) |
| Total | 74 (100.0%) | 134 (100.0%) |
Household Income by Mortgage Status in Green Valley

| Household Income | Without Mortgage | With Mortgage |
| Less than $10,000 | 22 (29.7%) | 0 (0.0%) |
| $10,000 to $24,999 | 0 (0.0%) | 1 (0.7%) |
| $25,000 to $34,999 | 3 (4.1%) | 8 (6.0%) |
| $35,000 to $49,999 | 0 (0.0%) | 15 (11.2%) |
| $50,000 to $74,999 | 15 (20.3%) | 26 (19.4%) |
| $75,000 to $99,999 | 14 (18.9%) | 14 (10.4%) |
| $100,000 to $149,999 | 10 (13.5%) | 19 (14.2%) |
| $150,000 or more | 10 (13.5%) | 31 (23.1%) |
| Total | 74 (100.0%) | 134 (100.0%) |
Property Value to Household Income Ratio in Green Valley
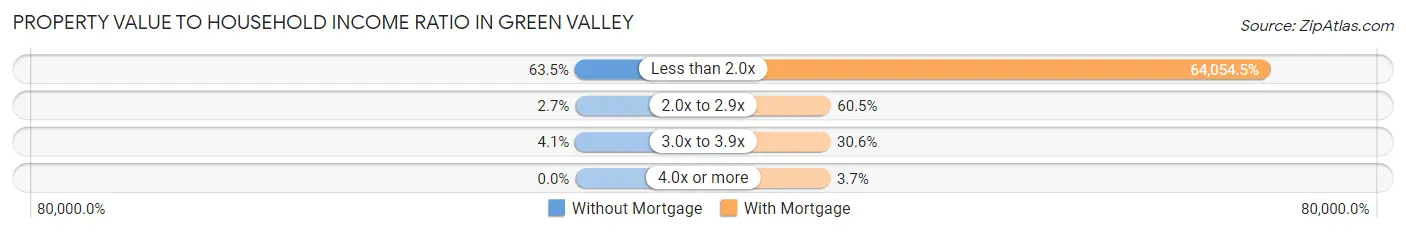
| Value-to-Income Ratio | Without Mortgage | With Mortgage |
| Less than 2.0x | 47 (63.5%) | 85,833 (64,054.5%) |
| 2.0x to 2.9x | 2 (2.7%) | 81 (60.5%) |
| 3.0x to 3.9x | 3 (4.1%) | 41 (30.6%) |
| 4.0x or more | 0 (0.0%) | 5 (3.7%) |
| Total | 74 (100.0%) | 134 (100.0%) |
Real Estate Taxes by Mortgage Status in Green Valley
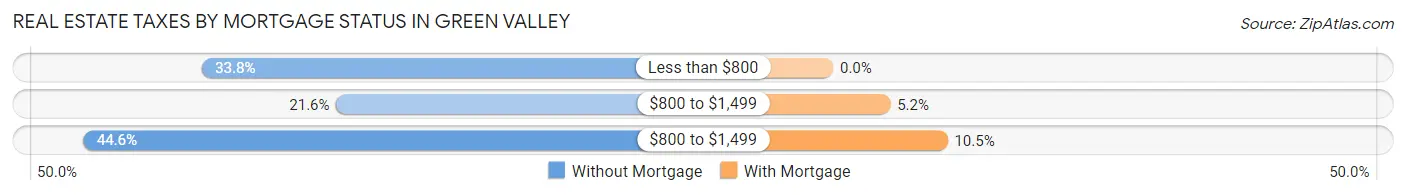
| Property Taxes | Without Mortgage | With Mortgage |
| Less than $800 | 25 (33.8%) | 0 (0.0%) |
| $800 to $1,499 | 16 (21.6%) | 7 (5.2%) |
| $800 to $1,499 | 33 (44.6%) | 14 (10.4%) |
| Total | 74 (100.0%) | 134 (100.0%) |
Health & Disability in Green Valley
Health Insurance Coverage by Age in Green Valley
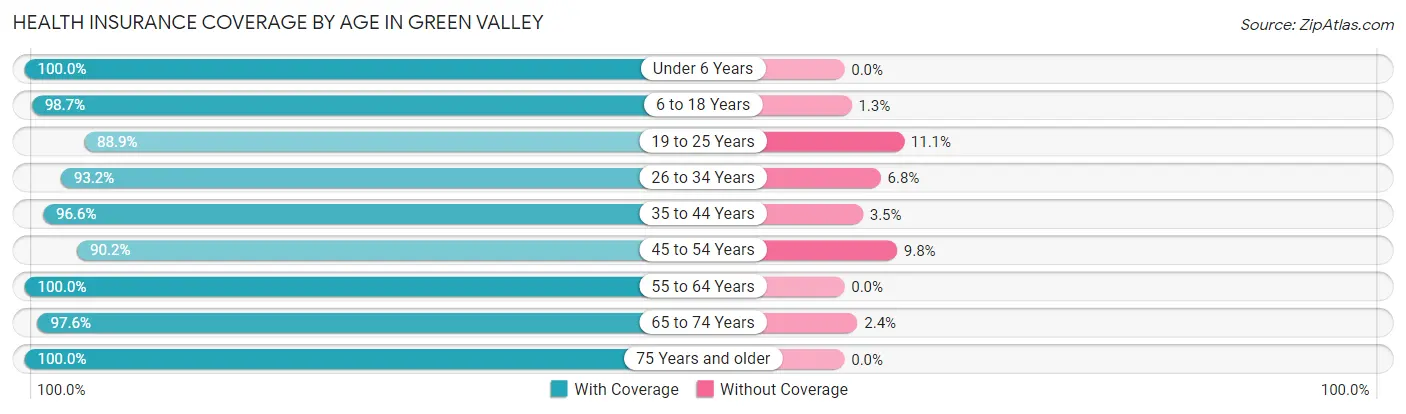
| Age Bracket | With Coverage | Without Coverage |
| Under 6 Years | 86 (100.0%) | 0 (0.0%) |
| 6 to 18 Years | 147 (98.7%) | 2 (1.3%) |
| 19 to 25 Years | 32 (88.9%) | 4 (11.1%) |
| 26 to 34 Years | 124 (93.2%) | 9 (6.8%) |
| 35 to 44 Years | 84 (96.6%) | 3 (3.5%) |
| 45 to 54 Years | 92 (90.2%) | 10 (9.8%) |
| 55 to 64 Years | 105 (100.0%) | 0 (0.0%) |
| 65 to 74 Years | 40 (97.6%) | 1 (2.4%) |
| 75 Years and older | 33 (100.0%) | 0 (0.0%) |
| Total | 743 (96.2%) | 29 (3.8%) |
Health Insurance Coverage by Citizenship Status in Green Valley
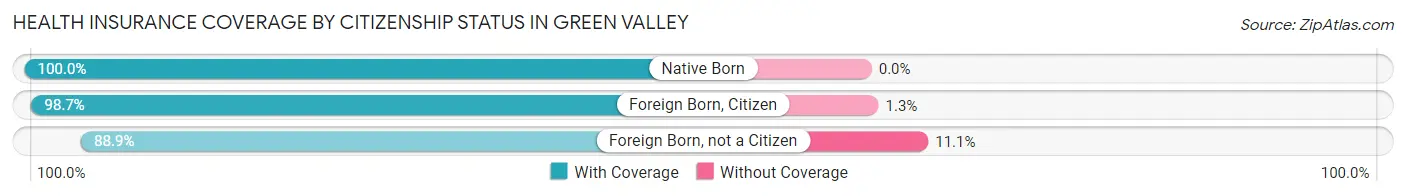
| Citizenship Status | With Coverage | Without Coverage |
| Native Born | 86 (100.0%) | 0 (0.0%) |
| Foreign Born, Citizen | 147 (98.7%) | 2 (1.3%) |
| Foreign Born, not a Citizen | 32 (88.9%) | 4 (11.1%) |
Health Insurance Coverage by Household Income in Green Valley

| Household Income | With Coverage | Without Coverage |
| Under $25,000 | 66 (95.7%) | 3 (4.3%) |
| $25,000 to $49,999 | 143 (94.7%) | 8 (5.3%) |
| $50,000 to $74,999 | 127 (94.8%) | 7 (5.2%) |
| $75,000 to $99,999 | 116 (91.3%) | 11 (8.7%) |
| $100,000 and over | 291 (100.0%) | 0 (0.0%) |
Public vs Private Health Insurance Coverage by Age in Green Valley
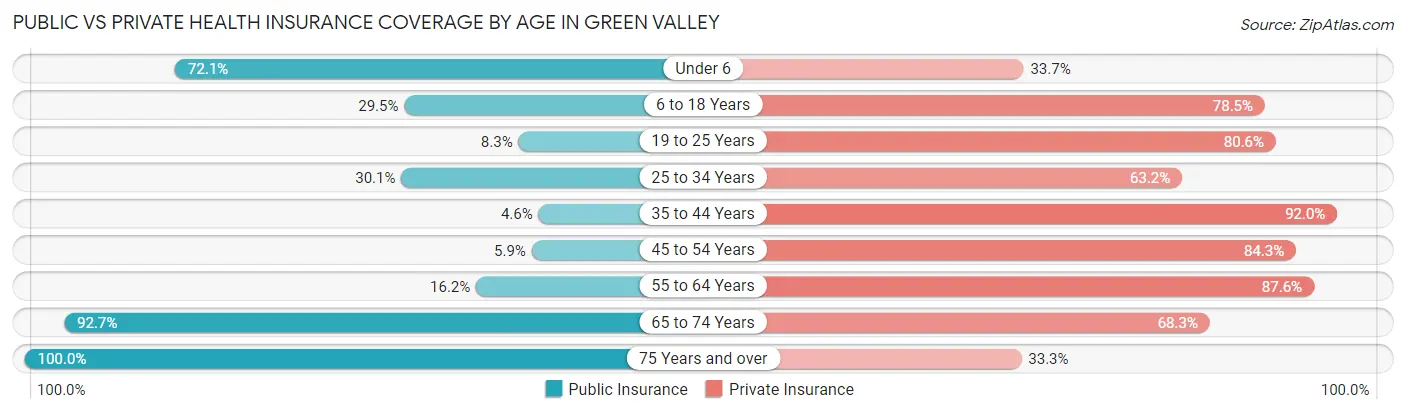
| Age Bracket | Public Insurance | Private Insurance |
| Under 6 | 62 (72.1%) | 29 (33.7%) |
| 6 to 18 Years | 44 (29.5%) | 117 (78.5%) |
| 19 to 25 Years | 3 (8.3%) | 29 (80.6%) |
| 25 to 34 Years | 40 (30.1%) | 84 (63.2%) |
| 35 to 44 Years | 4 (4.6%) | 80 (91.9%) |
| 45 to 54 Years | 6 (5.9%) | 86 (84.3%) |
| 55 to 64 Years | 17 (16.2%) | 92 (87.6%) |
| 65 to 74 Years | 38 (92.7%) | 28 (68.3%) |
| 75 Years and over | 33 (100.0%) | 11 (33.3%) |
| Total | 247 (32.0%) | 556 (72.0%) |
Disability Status by Sex by Age in Green Valley
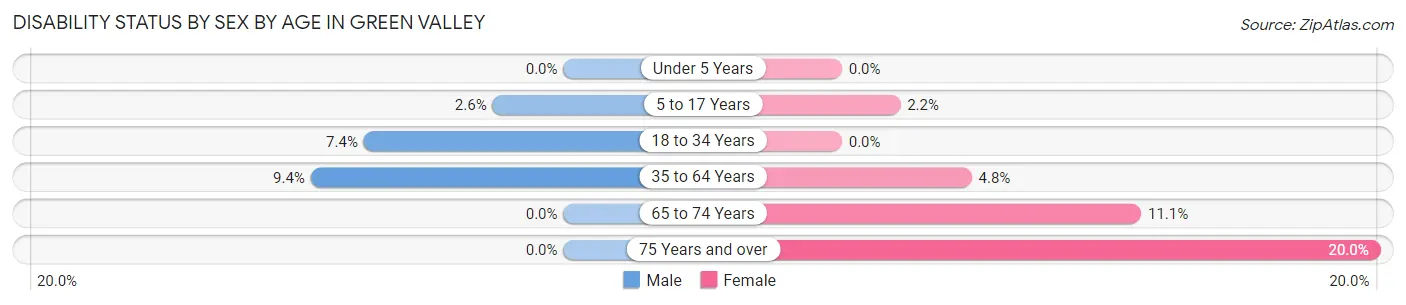
| Age Bracket | Male | Female |
| Under 5 Years | 0 (0.0%) | 0 (0.0%) |
| 5 to 17 Years | 2 (2.6%) | 2 (2.2%) |
| 18 to 34 Years | 6 (7.4%) | 0 (0.0%) |
| 35 to 64 Years | 12 (9.4%) | 8 (4.8%) |
| 65 to 74 Years | 0 (0.0%) | 2 (11.1%) |
| 75 Years and over | 0 (0.0%) | 2 (20.0%) |
Disability Class by Sex by Age in Green Valley
Disability Class: Hearing Difficulty
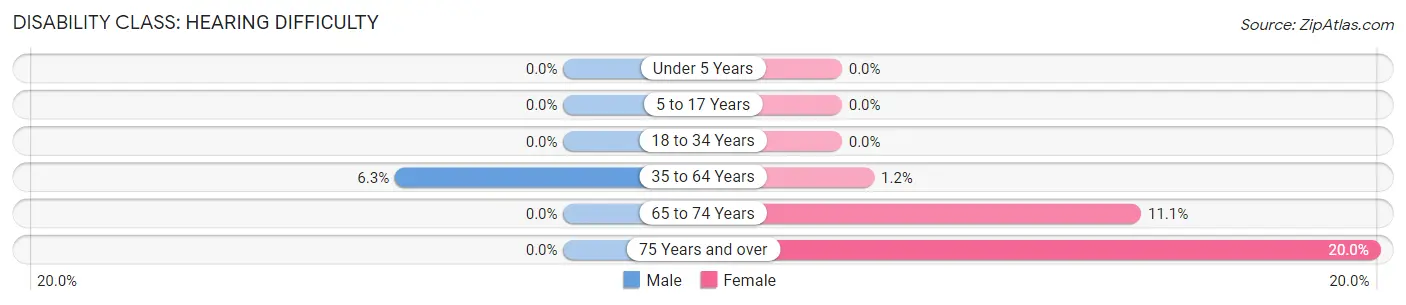
| Age Bracket | Male | Female |
| Under 5 Years | 0 (0.0%) | 0 (0.0%) |
| 5 to 17 Years | 0 (0.0%) | 0 (0.0%) |
| 18 to 34 Years | 0 (0.0%) | 0 (0.0%) |
| 35 to 64 Years | 8 (6.2%) | 2 (1.2%) |
| 65 to 74 Years | 0 (0.0%) | 2 (11.1%) |
| 75 Years and over | 0 (0.0%) | 2 (20.0%) |
Disability Class: Vision Difficulty
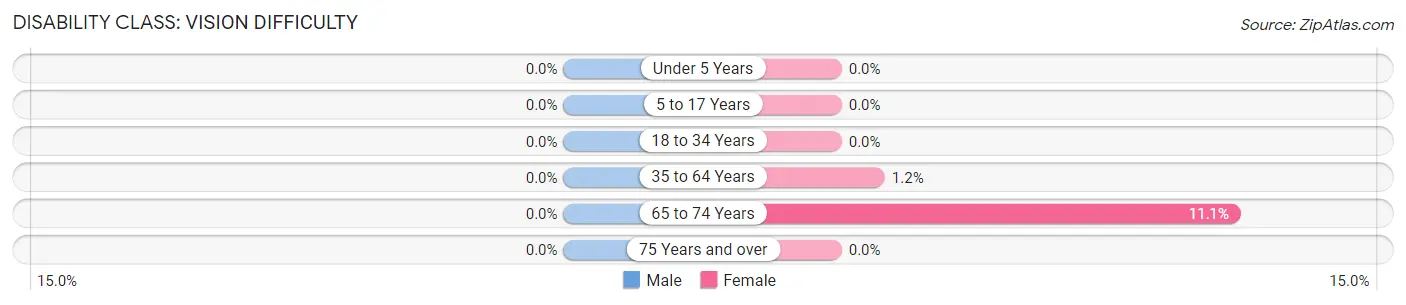
| Age Bracket | Male | Female |
| Under 5 Years | 0 (0.0%) | 0 (0.0%) |
| 5 to 17 Years | 0 (0.0%) | 0 (0.0%) |
| 18 to 34 Years | 0 (0.0%) | 0 (0.0%) |
| 35 to 64 Years | 0 (0.0%) | 2 (1.2%) |
| 65 to 74 Years | 0 (0.0%) | 2 (11.1%) |
| 75 Years and over | 0 (0.0%) | 0 (0.0%) |
Disability Class: Cognitive Difficulty
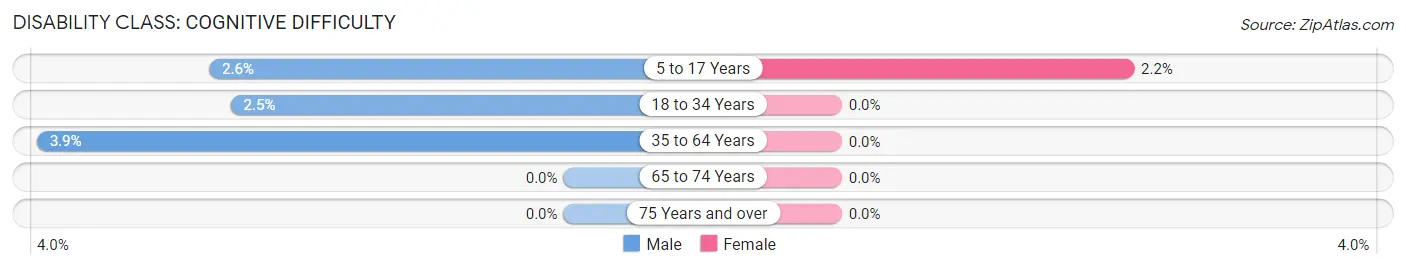
| Age Bracket | Male | Female |
| 5 to 17 Years | 2 (2.6%) | 2 (2.2%) |
| 18 to 34 Years | 2 (2.5%) | 0 (0.0%) |
| 35 to 64 Years | 5 (3.9%) | 0 (0.0%) |
| 65 to 74 Years | 0 (0.0%) | 0 (0.0%) |
| 75 Years and over | 0 (0.0%) | 0 (0.0%) |
Disability Class: Ambulatory Difficulty
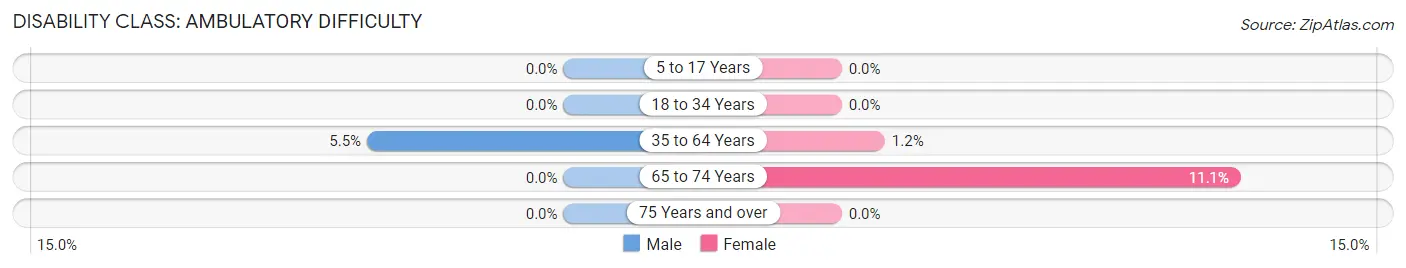
| Age Bracket | Male | Female |
| 5 to 17 Years | 0 (0.0%) | 0 (0.0%) |
| 18 to 34 Years | 0 (0.0%) | 0 (0.0%) |
| 35 to 64 Years | 7 (5.5%) | 2 (1.2%) |
| 65 to 74 Years | 0 (0.0%) | 2 (11.1%) |
| 75 Years and over | 0 (0.0%) | 0 (0.0%) |
Disability Class: Self-Care Difficulty
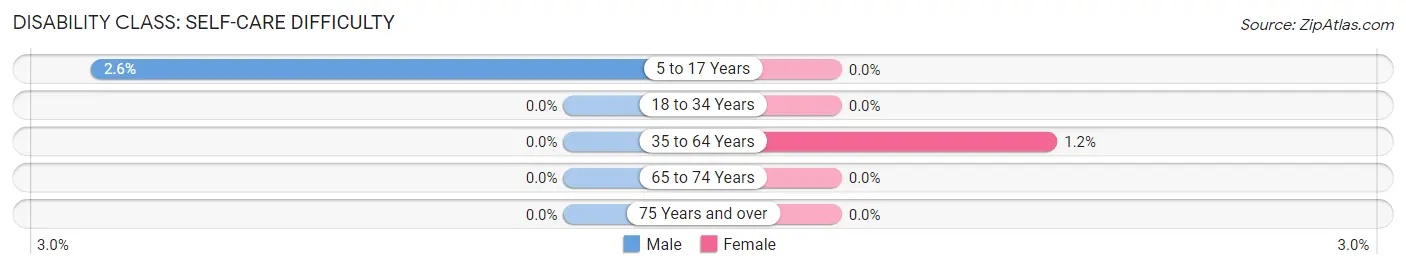
| Age Bracket | Male | Female |
| 5 to 17 Years | 2 (2.6%) | 0 (0.0%) |
| 18 to 34 Years | 0 (0.0%) | 0 (0.0%) |
| 35 to 64 Years | 0 (0.0%) | 2 (1.2%) |
| 65 to 74 Years | 0 (0.0%) | 0 (0.0%) |
| 75 Years and over | 0 (0.0%) | 0 (0.0%) |
Technology Access in Green Valley
Computing Device Access in Green Valley
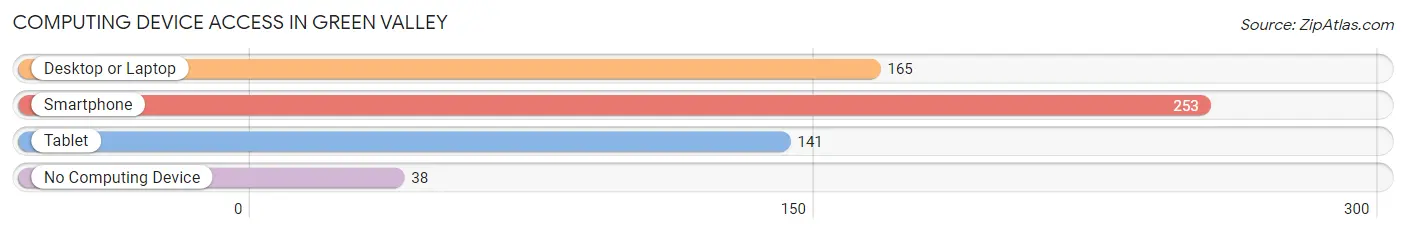
| Device Type | # Households | % Households |
| Desktop or Laptop | 165 | 54.3% |
| Smartphone | 253 | 83.2% |
| Tablet | 141 | 46.4% |
| No Computing Device | 38 | 12.5% |
| Total | 304 | 100.0% |
Internet Access in Green Valley
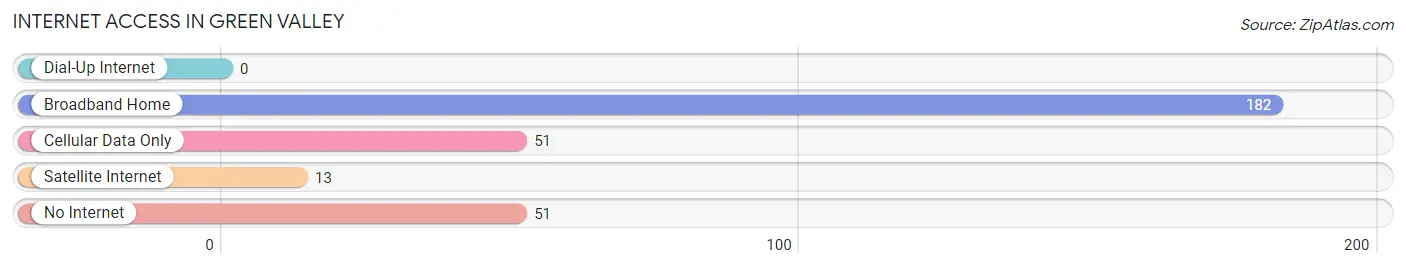
| Internet Type | # Households | % Households |
| Dial-Up Internet | 0 | 0.0% |
| Broadband Home | 182 | 59.9% |
| Cellular Data Only | 51 | 16.8% |
| Satellite Internet | 13 | 4.3% |
| No Internet | 51 | 16.8% |
| Total | 304 | 100.0% |
Green Valley Summary
History
The history of Green Valley, Illinois dates back to the early 1800s when the area was first settled by European immigrants. The first settlers were mostly of German and Irish descent, and the area was known as “Green Valley” due to its lush green landscape. The area was originally part of the Northwest Territory, and was later annexed by the state of Illinois in 1818.
The first settlers in Green Valley were mostly farmers, and the area quickly became known for its fertile soil and abundant natural resources. The area was also home to a number of small businesses, including a sawmill, a gristmill, and a blacksmith shop.
In the late 1800s, the area began to experience a period of growth and development. The railroad arrived in 1871, and the town was officially incorporated in 1872. The population of Green Valley grew steadily throughout the late 19th and early 20th centuries, and the town was home to a variety of businesses, including a bank, a hotel, a general store, and a post office.
Geography
Green Valley is located in the northern part of Illinois, in the county of Bureau. It is situated on the banks of the Illinois River, and is surrounded by rolling hills and lush green valleys. The town is located approximately 30 miles south of the city of Chicago, and is part of the Chicago metropolitan area.
The climate in Green Valley is typical of the Midwest, with hot summers and cold winters. The average temperature in the summer is around 75 degrees Fahrenheit, and the average temperature in the winter is around 25 degrees Fahrenheit.
Economy
The economy of Green Valley is largely based on agriculture and tourism. The area is home to a number of farms, and the town is known for its production of corn, soybeans, and other crops. The town is also home to a number of small businesses, including restaurants, shops, and other services.
Tourism is an important part of the economy of Green Valley. The town is home to a number of attractions, including the Green Valley State Park, which offers camping, fishing, and other outdoor activities. The town is also home to a number of historic sites, including the Green Valley Historical Museum and the Green Valley Cemetery.
Demographics
As of the 2010 census, the population of Green Valley was 1,845. The population is largely white (94.3%), with small percentages of African American (2.2%), Hispanic (1.7%), and Asian (1.2%) residents. The median household income in Green Valley is $50,945, and the median age is 43.7 years. The town is home to a number of churches, and the largest religious denomination is Catholic (44.3%).
Common Questions
What is Per Capita Income in Green Valley?
Per Capita income in Green Valley is $30,058.
What is the Median Family Income in Green Valley?
Median Family Income in Green Valley is $87,039.
What is the Median Household income in Green Valley?
Median Household Income in Green Valley is $60,781.
What is Income or Wage Gap in Green Valley?
Income or Wage Gap in Green Valley is 34.5%.
Women in Green Valley earn 65.5 cents for every dollar earned by a man.
What is Inequality or Gini Index in Green Valley?
Inequality or Gini Index in Green Valley is 0.40.
What is the Total Population of Green Valley?
Total Population of Green Valley is 772.
What is the Total Male Population of Green Valley?
Total Male Population of Green Valley is 377.
What is the Total Female Population of Green Valley?
Total Female Population of Green Valley is 395.
What is the Ratio of Males per 100 Females in Green Valley?
There are 95.44 Males per 100 Females in Green Valley.
What is the Ratio of Females per 100 Males in Green Valley?
There are 104.77 Females per 100 Males in Green Valley.
What is the Median Population Age in Green Valley?
Median Population Age in Green Valley is 32.6 Years.
What is the Average Family Size in Green Valley
Average Family Size in Green Valley is 3.0 People.
What is the Average Household Size in Green Valley
Average Household Size in Green Valley is 2.5 People.
How Large is the Labor Force in Green Valley?
There are 419 People in the Labor Forcein in Green Valley.
What is the Percentage of People in the Labor Force in Green Valley?
71.0% of People are in the Labor Force in Green Valley.
What is the Unemployment Rate in Green Valley?
Unemployment Rate in Green Valley is 0.7%.