Cities with the Most Immigrants from Burma / Myanmar in Illinois
RELATED REPORTS & OPTIONS
Burma / Myanmar
Illinois
Compare Cities
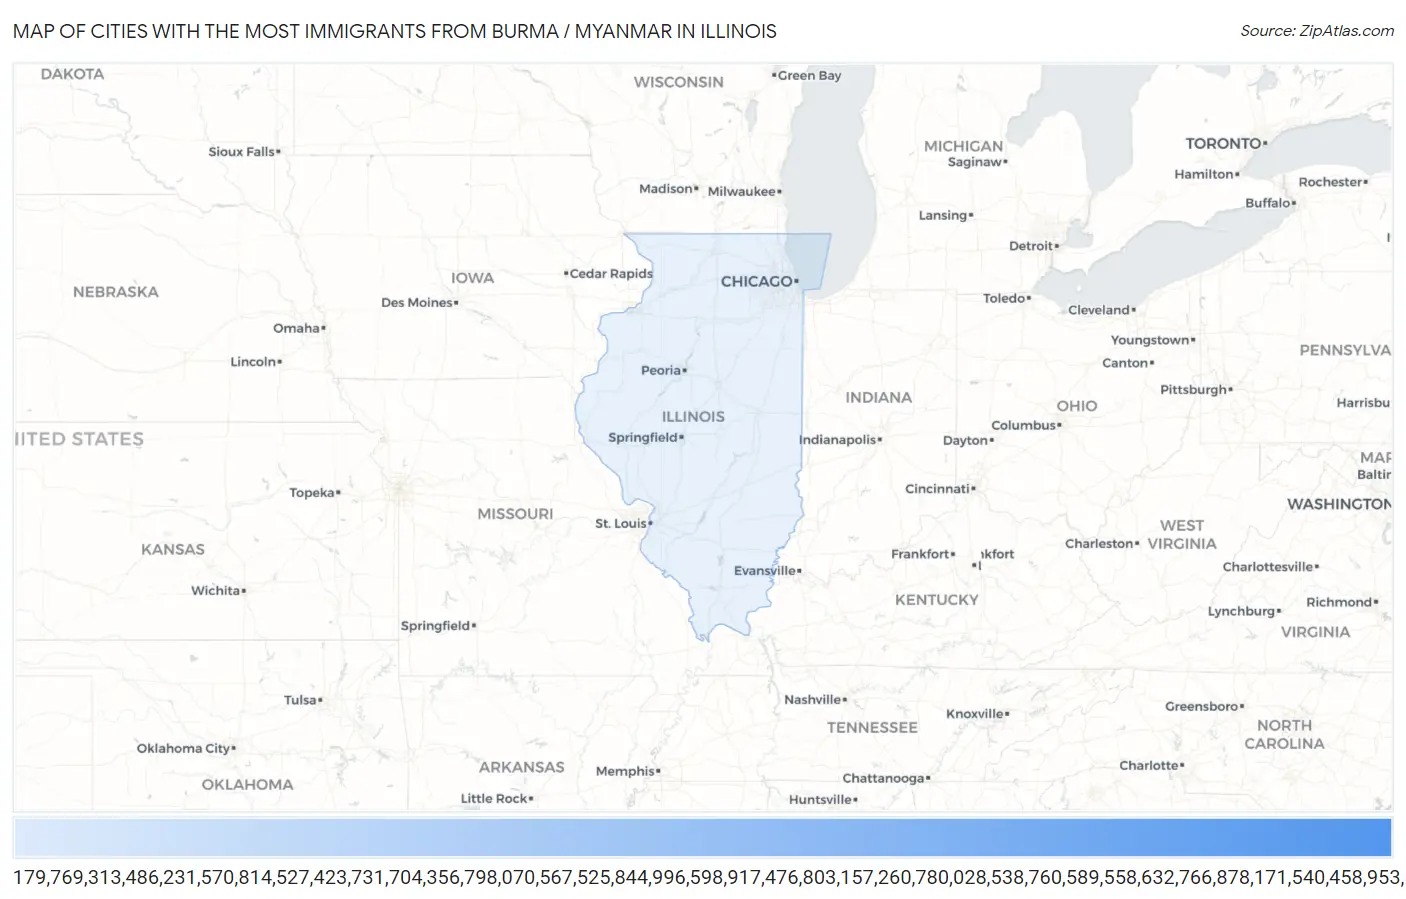
Map of Cities with the Most Immigrants from Burma / Myanmar in Illinois
0
1,000
Cities with the Most Immigrants from Burma / Myanmar in Illinois
| City | Burma / Myanmar | vs State | vs National | |
| 1. | Chicago | 810 | 4,552(17.79%)#-1 | 157,000(0.52%)#0 |
| 2. | Wheaton | 644 | 4,552(14.15%)#0 | 157,000(0.41%)#1 |
| 3. | Rock Island | 350 | 4,552(7.69%)#1 | 157,000(0.22%)#2 |
| 4. | East Moline | 307 | 4,552(6.74%)#2 | 157,000(0.20%)#3 |
| 5. | Rockford | 255 | 4,552(5.60%)#3 | 157,000(0.16%)#4 |
| 6. | Glen Ellyn | 239 | 4,552(5.25%)#4 | 157,000(0.15%)#5 |
| 7. | Naperville | 226 | 4,552(4.96%)#5 | 157,000(0.14%)#6 |
| 8. | Bloomington | 192 | 4,552(4.22%)#6 | 157,000(0.12%)#7 |
| 9. | Glendale Heights | 187 | 4,552(4.11%)#7 | 157,000(0.12%)#8 |
| 10. | Aurora | 168 | 4,552(3.69%)#8 | 157,000(0.11%)#9 |
| 11. | Carol Stream | 131 | 4,552(2.88%)#9 | 157,000(0.08%)#10 |
| 12. | Mount Prospect | 102 | 4,552(2.24%)#10 | 157,000(0.06%)#11 |
| 13. | Cicero | 90 | 4,552(1.98%)#11 | 157,000(0.06%)#12 |
| 14. | Moline | 73 | 4,552(1.60%)#12 | 157,000(0.05%)#13 |
| 15. | Monmouth | 66 | 4,552(1.45%)#13 | 157,000(0.04%)#14 |
| 16. | Lake In The Hills | 54 | 4,552(1.19%)#14 | 157,000(0.03%)#15 |
| 17. | Calumet City | 44 | 4,552(0.97%)#15 | 157,000(0.03%)#16 |
| 18. | Swansea | 41 | 4,552(0.90%)#16 | 157,000(0.03%)#17 |
| 19. | Beardstown | 41 | 4,552(0.90%)#17 | 157,000(0.03%)#18 |
| 20. | Springfield | 34 | 4,552(0.75%)#18 | 157,000(0.02%)#19 |
| 21. | Elgin | 30 | 4,552(0.66%)#19 | 157,000(0.02%)#20 |
| 22. | Glenview | 26 | 4,552(0.57%)#20 | 157,000(0.02%)#21 |
| 23. | Morton Grove | 26 | 4,552(0.57%)#21 | 157,000(0.02%)#22 |
| 24. | Dekalb | 24 | 4,552(0.53%)#22 | 157,000(0.02%)#23 |
| 25. | Carbondale | 24 | 4,552(0.53%)#23 | 157,000(0.02%)#24 |
| 26. | Hoffman Estates | 23 | 4,552(0.51%)#24 | 157,000(0.01%)#25 |
| 27. | Palatine | 22 | 4,552(0.48%)#25 | 157,000(0.01%)#26 |
| 28. | East Peoria | 19 | 4,552(0.42%)#26 | 157,000(0.01%)#27 |
| 29. | Des Plaines | 18 | 4,552(0.40%)#27 | 157,000(0.01%)#28 |
| 30. | West Chicago | 18 | 4,552(0.40%)#28 | 157,000(0.01%)#29 |
| 31. | Highland | 18 | 4,552(0.40%)#29 | 157,000(0.01%)#30 |
| 32. | Joliet | 15 | 4,552(0.33%)#30 | 157,000(0.01%)#31 |
| 33. | Tinley Park | 14 | 4,552(0.31%)#31 | 157,000(0.01%)#32 |
| 34. | Skokie | 13 | 4,552(0.29%)#32 | 157,000(0.01%)#33 |
| 35. | Hanover Park | 13 | 4,552(0.29%)#33 | 157,000(0.01%)#34 |
| 36. | Burr Ridge | 13 | 4,552(0.29%)#34 | 157,000(0.01%)#35 |
| 37. | Wheeling | 12 | 4,552(0.26%)#35 | 157,000(0.01%)#36 |
| 38. | Lisle | 11 | 4,552(0.24%)#36 | 157,000(0.01%)#37 |
| 39. | Arlington Heights | 10 | 4,552(0.22%)#37 | 157,000(0.01%)#38 |
| 40. | Buffalo Grove | 9 | 4,552(0.20%)#38 | 157,000(0.01%)#39 |
| 41. | Bartlett | 9 | 4,552(0.20%)#39 | 157,000(0.01%)#40 |
| 42. | Addison | 9 | 4,552(0.20%)#40 | 157,000(0.01%)#41 |
| 43. | Evanston | 6 | 4,552(0.13%)#41 | 157,000(0.00%)#42 |
| 44. | Carrier Mills | 6 | 4,552(0.13%)#42 | 157,000(0.00%)#43 |
| 45. | Sterling | 4 | 4,552(0.09%)#43 | 157,000(0.00%)#44 |
| 46. | Champaign | 2 | 4,552(0.04%)#44 | 157,000(0.00%)#45 |
| 47. | Bowen | 2 | 4,552(0.04%)#45 | 157,000(0.00%)#46 |
| 48. | Westmont | 1 | 4,552(0.02%)#46 | 157,000(0.00%)#47 |
| 49. | Hometown | 1 | 4,552(0.02%)#47 | 157,000(0.00%)#48 |
Common Questions
What are the Top 10 Cities with the Most Immigrants from Burma / Myanmar in Illinois?
Top 10 Cities with the Most Immigrants from Burma / Myanmar in Illinois are:
#1
810
#2
644
#3
350
#4
307
#5
255
#6
239
#7
226
#8
192
#9
187
#10
168
What city has the Most Immigrants from Burma / Myanmar in Illinois?
Chicago has the Most Immigrants from Burma / Myanmar in Illinois with 810.
What is the Total Immigrants from Burma / Myanmar in the State of Illinois?
Total Immigrants from Burma / Myanmar in Illinois is 4,552.
What is the Total Immigrants from Burma / Myanmar in the United States?
Total Immigrants from Burma / Myanmar in the United States is 157,000.