Cities with the Most Immigrants from Iraq in Illinois
RELATED REPORTS & OPTIONS
Iraq
Illinois
Compare Cities
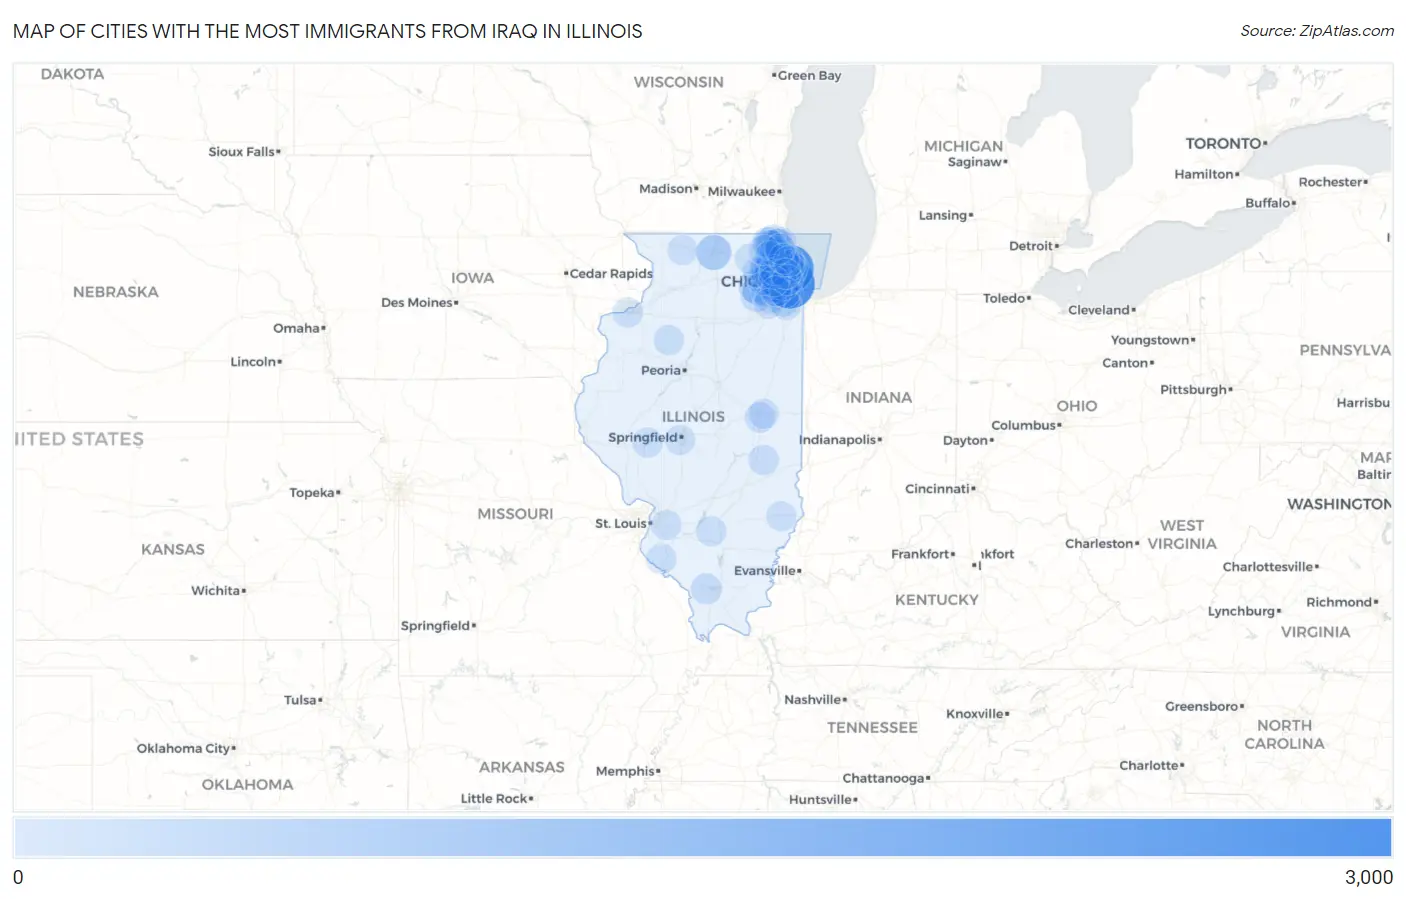
Map of Cities with the Most Immigrants from Iraq in Illinois
0
3,000
Cities with the Most Immigrants from Iraq in Illinois
| City | Iraq | vs State | vs National | |
| 1. | Chicago | 2,906 | 13,214(21.99%)#1 | 234,088(1.24%)#8 |
| 2. | Skokie | 2,583 | 13,214(19.55%)#2 | 234,088(1.10%)#11 |
| 3. | Niles | 830 | 13,214(6.28%)#3 | 234,088(0.35%)#44 |
| 4. | Rockford | 701 | 13,214(5.30%)#4 | 234,088(0.30%)#51 |
| 5. | Morton Grove | 525 | 13,214(3.97%)#5 | 234,088(0.22%)#63 |
| 6. | Des Plaines | 365 | 13,214(2.76%)#6 | 234,088(0.16%)#89 |
| 7. | North Aurora | 356 | 13,214(2.69%)#7 | 234,088(0.15%)#92 |
| 8. | Lincolnwood | 304 | 13,214(2.30%)#8 | 234,088(0.13%)#114 |
| 9. | Mount Prospect | 297 | 13,214(2.25%)#9 | 234,088(0.13%)#116 |
| 10. | Wheaton | 238 | 13,214(1.80%)#10 | 234,088(0.10%)#151 |
| 11. | Park Ridge | 161 | 13,214(1.22%)#11 | 234,088(0.07%)#205 |
| 12. | Oswego | 132 | 13,214(1.00%)#12 | 234,088(0.06%)#236 |
| 13. | Glenview | 125 | 13,214(0.95%)#13 | 234,088(0.05%)#249 |
| 14. | Rosemont | 119 | 13,214(0.90%)#14 | 234,088(0.05%)#262 |
| 15. | Aurora | 93 | 13,214(0.70%)#15 | 234,088(0.04%)#310 |
| 16. | Northbrook | 91 | 13,214(0.69%)#16 | 234,088(0.04%)#316 |
| 17. | Carbondale | 91 | 13,214(0.69%)#17 | 234,088(0.04%)#317 |
| 18. | Rolling Meadows | 82 | 13,214(0.62%)#18 | 234,088(0.04%)#347 |
| 19. | Chicago Ridge | 82 | 13,214(0.62%)#19 | 234,088(0.04%)#348 |
| 20. | Roselle | 79 | 13,214(0.60%)#20 | 234,088(0.03%)#356 |
| 21. | Palatine | 74 | 13,214(0.56%)#21 | 234,088(0.03%)#374 |
| 22. | Hoffman Estates | 72 | 13,214(0.54%)#22 | 234,088(0.03%)#378 |
| 23. | Carol Stream | 68 | 13,214(0.51%)#23 | 234,088(0.03%)#393 |
| 24. | Waukegan | 64 | 13,214(0.48%)#24 | 234,088(0.03%)#413 |
| 25. | Streamwood | 63 | 13,214(0.48%)#25 | 234,088(0.03%)#418 |
| 26. | Lindenhurst | 63 | 13,214(0.48%)#26 | 234,088(0.03%)#421 |
| 27. | Charleston | 62 | 13,214(0.47%)#27 | 234,088(0.03%)#427 |
| 28. | Glen Ellyn | 55 | 13,214(0.42%)#28 | 234,088(0.02%)#462 |
| 29. | Schaumburg | 52 | 13,214(0.39%)#29 | 234,088(0.02%)#482 |
| 30. | Franklin Park | 52 | 13,214(0.39%)#30 | 234,088(0.02%)#486 |
| 31. | Arlington Heights | 50 | 13,214(0.38%)#31 | 234,088(0.02%)#497 |
| 32. | Downers Grove | 48 | 13,214(0.36%)#32 | 234,088(0.02%)#518 |
| 33. | Evanston | 46 | 13,214(0.35%)#33 | 234,088(0.02%)#532 |
| 34. | Round Lake Beach | 46 | 13,214(0.35%)#34 | 234,088(0.02%)#538 |
| 35. | Round Lake | 46 | 13,214(0.35%)#35 | 234,088(0.02%)#540 |
| 36. | Wood Dale | 46 | 13,214(0.35%)#36 | 234,088(0.02%)#541 |
| 37. | Hanover Park | 45 | 13,214(0.34%)#37 | 234,088(0.02%)#549 |
| 38. | Naperville | 41 | 13,214(0.31%)#38 | 234,088(0.02%)#576 |
| 39. | Wheeling | 40 | 13,214(0.30%)#39 | 234,088(0.02%)#590 |
| 40. | Westmont | 38 | 13,214(0.29%)#40 | 234,088(0.02%)#607 |
| 41. | Winfield | 38 | 13,214(0.29%)#41 | 234,088(0.02%)#608 |
| 42. | Addison | 35 | 13,214(0.26%)#42 | 234,088(0.01%)#630 |
| 43. | Bloomingdale | 35 | 13,214(0.26%)#43 | 234,088(0.01%)#634 |
| 44. | Orland Park | 32 | 13,214(0.24%)#44 | 234,088(0.01%)#659 |
| 45. | Savoy | 32 | 13,214(0.24%)#45 | 234,088(0.01%)#663 |
| 46. | West Chicago | 31 | 13,214(0.23%)#46 | 234,088(0.01%)#670 |
| 47. | Gages Lake | 31 | 13,214(0.23%)#47 | 234,088(0.01%)#672 |
| 48. | Toulon | 31 | 13,214(0.23%)#48 | 234,088(0.01%)#675 |
| 49. | Buffalo Grove | 29 | 13,214(0.22%)#49 | 234,088(0.01%)#689 |
| 50. | Vernon Hills | 28 | 13,214(0.21%)#50 | 234,088(0.01%)#705 |
| 51. | Tinley Park | 27 | 13,214(0.20%)#51 | 234,088(0.01%)#712 |
| 52. | Oak Brook | 27 | 13,214(0.20%)#52 | 234,088(0.01%)#719 |
| 53. | Gurnee | 26 | 13,214(0.20%)#53 | 234,088(0.01%)#728 |
| 54. | Norridge | 26 | 13,214(0.20%)#54 | 234,088(0.01%)#731 |
| 55. | South Elgin | 23 | 13,214(0.17%)#55 | 234,088(0.01%)#779 |
| 56. | Brookfield | 21 | 13,214(0.16%)#56 | 234,088(0.01%)#811 |
| 57. | Mundelein | 20 | 13,214(0.15%)#57 | 234,088(0.01%)#829 |
| 58. | Romeoville | 17 | 13,214(0.13%)#58 | 234,088(0.01%)#877 |
| 59. | Wilmette | 17 | 13,214(0.13%)#59 | 234,088(0.01%)#879 |
| 60. | Long Lake | 17 | 13,214(0.13%)#60 | 234,088(0.01%)#887 |
| 61. | Centralia | 16 | 13,214(0.12%)#61 | 234,088(0.01%)#903 |
| 62. | Urbana | 15 | 13,214(0.11%)#62 | 234,088(0.01%)#913 |
| 63. | O Fallon | 14 | 13,214(0.11%)#63 | 234,088(0.01%)#933 |
| 64. | Huntley | 13 | 13,214(0.10%)#64 | 234,088(0.01%)#953 |
| 65. | Crest Hill | 13 | 13,214(0.10%)#65 | 234,088(0.01%)#958 |
| 66. | Itasca | 13 | 13,214(0.10%)#66 | 234,088(0.01%)#963 |
| 67. | Hickory Hills | 12 | 13,214(0.09%)#67 | 234,088(0.01%)#991 |
| 68. | Hainesville | 12 | 13,214(0.09%)#68 | 234,088(0.01%)#995 |
| 69. | Elk Grove Village | 11 | 13,214(0.08%)#69 | 234,088(0.00%)#1,013 |
| 70. | Jacksonville | 11 | 13,214(0.08%)#70 | 234,088(0.00%)#1,016 |
| 71. | Lake Zurich | 10 | 13,214(0.08%)#71 | 234,088(0.00%)#1,042 |
| 72. | Harwood Heights | 10 | 13,214(0.08%)#72 | 234,088(0.00%)#1,050 |
| 73. | Island Lake | 10 | 13,214(0.08%)#73 | 234,088(0.00%)#1,052 |
| 74. | Springfield | 9 | 13,214(0.07%)#74 | 234,088(0.00%)#1,055 |
| 75. | Oak Park | 9 | 13,214(0.07%)#75 | 234,088(0.00%)#1,059 |
| 76. | Lombard | 7 | 13,214(0.05%)#76 | 234,088(0.00%)#1,123 |
| 77. | Darien | 7 | 13,214(0.05%)#77 | 234,088(0.00%)#1,126 |
| 78. | Deerfield | 7 | 13,214(0.05%)#78 | 234,088(0.00%)#1,129 |
| 79. | Ruma | 6 | 13,214(0.05%)#79 | 234,088(0.00%)#1,168 |
| 80. | Rock Island | 5 | 13,214(0.04%)#80 | 234,088(0.00%)#1,170 |
| 81. | Glencoe | 5 | 13,214(0.04%)#81 | 234,088(0.00%)#1,175 |
| 82. | Freeport | 4 | 13,214(0.03%)#82 | 234,088(0.00%)#1,191 |
| 83. | Green Oaks | 3 | 13,214(0.02%)#83 | 234,088(0.00%)#1,215 |
| 84. | Sumner | 3 | 13,214(0.02%)#84 | 234,088(0.00%)#1,218 |
Common Questions
What are the Top 10 Cities with the Most Immigrants from Iraq in Illinois?
Top 10 Cities with the Most Immigrants from Iraq in Illinois are:
#1
2,906
#2
2,583
#3
830
#4
701
#5
525
#6
365
#7
356
#8
304
#9
297
#10
238
What city has the Most Immigrants from Iraq in Illinois?
Chicago has the Most Immigrants from Iraq in Illinois with 2,906.
What is the Total Immigrants from Iraq in the State of Illinois?
Total Immigrants from Iraq in Illinois is 13,214.
What is the Total Immigrants from Iraq in the United States?
Total Immigrants from Iraq in the United States is 234,088.