Springfield, IL Map & Demographics
Springfield Map
Springfield Overview
$39,648
PER CAPITA INCOME
$86,647
AVG FAMILY INCOME
$62,419
AVG HOUSEHOLD INCOME
20.5%
WAGE / INCOME GAP [ % ]
79.5¢/ $1
WAGE / INCOME GAP [ $ ]
$11,356
FAMILY INCOME DEFICIT
0.49
INEQUALITY / GINI INDEX
114,214
TOTAL POPULATION
55,056
MALE POPULATION
59,158
FEMALE POPULATION
93.07
MALES / 100 FEMALES
107.45
FEMALES / 100 MALES
40.1
MEDIAN AGE
3.0
AVG FAMILY SIZE
2.2
AVG HOUSEHOLD SIZE
56,051
LABOR FORCE [ PEOPLE ]
60.6%
PERCENT IN LABOR FORCE
6.6%
UNEMPLOYMENT RATE
Springfield Area Codes
Income in Springfield
Income Overview in Springfield
Per Capita Income in Springfield is $39,648, while median incomes of families and households are $86,647 and $62,419 respectively.
| Characteristic | Number | Measure |
| Per Capita Income | 114,214 | $39,648 |
| Median Family Income | 27,247 | $86,647 |
| Mean Family Income | 27,247 | $112,861 |
| Median Household Income | 50,686 | $62,419 |
| Mean Household Income | 50,686 | $87,291 |
| Income Deficit | 27,247 | $11,356 |
| Wage / Income Gap (%) | 114,214 | 20.45% |
| Wage / Income Gap ($) | 114,214 | 79.55¢ per $1 |
| Gini / Inequality Index | 114,214 | 0.49 |
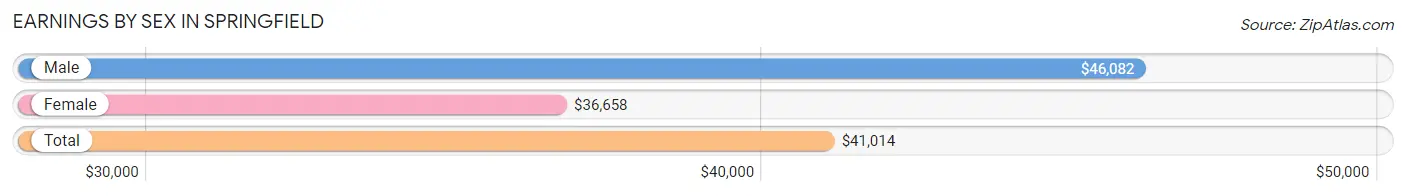
Earnings by Sex in Springfield
Average Earnings in Springfield are $41,014, $46,082 for men and $36,658 for women, a difference of 20.4%.
| Sex | Number | Average Earnings |
| Male | 28,481 (49.7%) | $46,082 |
| Female | 28,791 (50.3%) | $36,658 |
| Total | 57,272 (100.0%) | $41,014 |
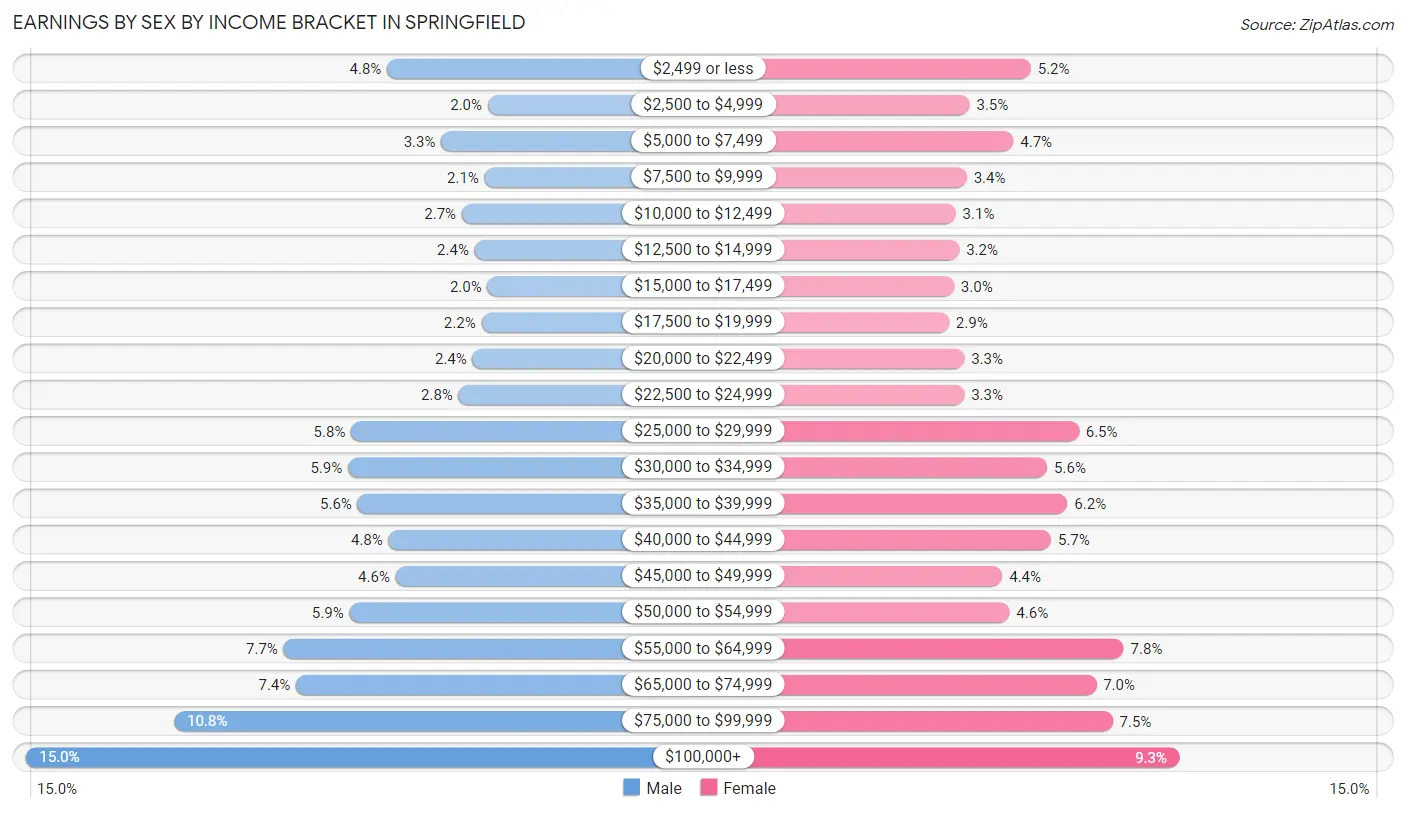
Earnings by Sex by Income Bracket in Springfield
The most common earnings brackets in Springfield are $100,000+ for men (4,257 | 14.9%) and $100,000+ for women (2,686 | 9.3%).
| Income | Male | Female |
| $2,499 or less | 1,370 (4.8%) | 1,489 (5.2%) |
| $2,500 to $4,999 | 565 (2.0%) | 994 (3.5%) |
| $5,000 to $7,499 | 937 (3.3%) | 1,347 (4.7%) |
| $7,500 to $9,999 | 590 (2.1%) | 971 (3.4%) |
| $10,000 to $12,499 | 772 (2.7%) | 881 (3.1%) |
| $12,500 to $14,999 | 669 (2.4%) | 911 (3.2%) |
| $15,000 to $17,499 | 568 (2.0%) | 867 (3.0%) |
| $17,500 to $19,999 | 615 (2.2%) | 825 (2.9%) |
| $20,000 to $22,499 | 687 (2.4%) | 949 (3.3%) |
| $22,500 to $24,999 | 797 (2.8%) | 951 (3.3%) |
| $25,000 to $29,999 | 1,659 (5.8%) | 1,876 (6.5%) |
| $30,000 to $34,999 | 1,684 (5.9%) | 1,621 (5.6%) |
| $35,000 to $39,999 | 1,605 (5.6%) | 1,786 (6.2%) |
| $40,000 to $44,999 | 1,358 (4.8%) | 1,652 (5.7%) |
| $45,000 to $49,999 | 1,303 (4.6%) | 1,259 (4.4%) |
| $50,000 to $54,999 | 1,671 (5.9%) | 1,316 (4.6%) |
| $55,000 to $64,999 | 2,199 (7.7%) | 2,241 (7.8%) |
| $65,000 to $74,999 | 2,100 (7.4%) | 2,017 (7.0%) |
| $75,000 to $99,999 | 3,075 (10.8%) | 2,152 (7.5%) |
| $100,000+ | 4,257 (14.9%) | 2,686 (9.3%) |
| Total | 28,481 (100.0%) | 28,791 (100.0%) |
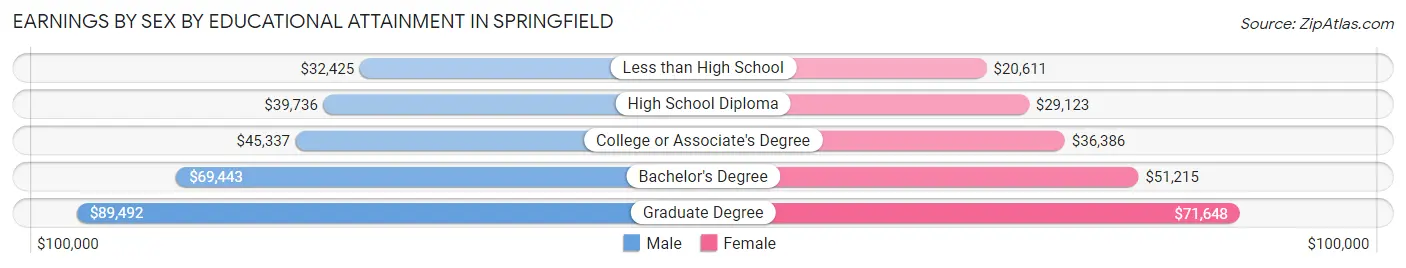
Earnings by Sex by Educational Attainment in Springfield
Average earnings in Springfield are $52,113 for men and $41,630 for women, a difference of 20.1%. Men with an educational attainment of graduate degree enjoy the highest average annual earnings of $89,492, while those with less than high school education earn the least with $32,425. Women with an educational attainment of graduate degree earn the most with the average annual earnings of $71,648, while those with less than high school education have the smallest earnings of $20,611.
| Educational Attainment | Male Income | Female Income |
| Less than High School | $32,425 | $20,611 |
| High School Diploma | $39,736 | $29,123 |
| College or Associate's Degree | $45,337 | $36,386 |
| Bachelor's Degree | $69,443 | $51,215 |
| Graduate Degree | $89,492 | $71,648 |
| Total | $52,113 | $41,630 |
Family Income in Springfield
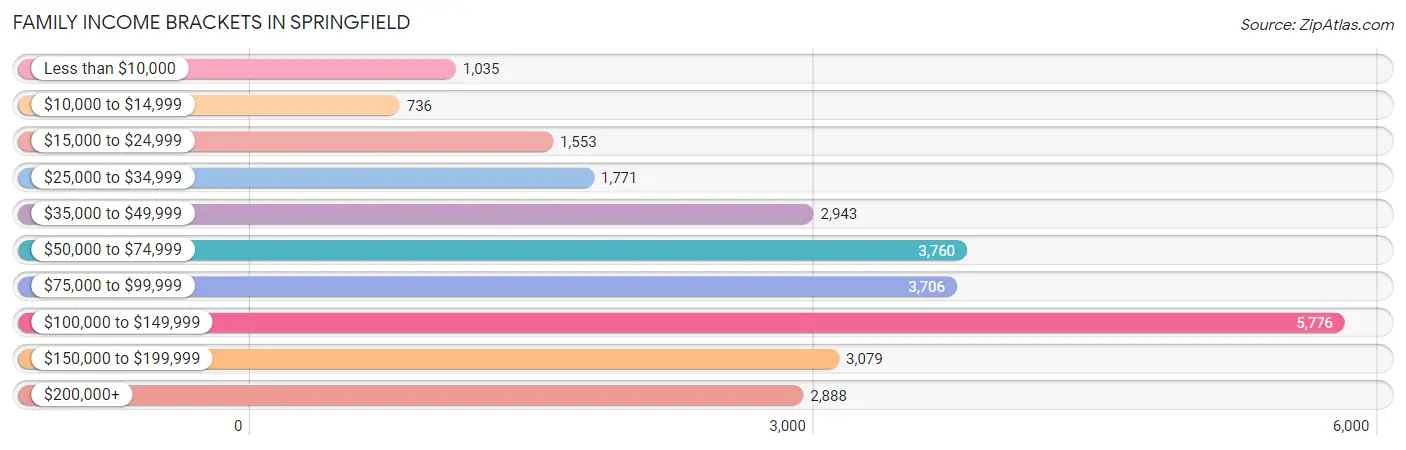
Family Income Brackets in Springfield
According to the Springfield family income data, there are 5,776 families falling into the $100,000 to $149,999 income range, which is the most common income bracket and makes up 21.2% of all families. Conversely, the $10,000 to $14,999 income bracket is the least frequent group with only 736 families (2.7%) belonging to this category.
| Income Bracket | # Families | % Families |
| Less than $10,000 | 1,035 | 3.8% |
| $10,000 to $14,999 | 736 | 2.7% |
| $15,000 to $24,999 | 1,553 | 5.7% |
| $25,000 to $34,999 | 1,771 | 6.5% |
| $35,000 to $49,999 | 2,943 | 10.8% |
| $50,000 to $74,999 | 3,760 | 13.8% |
| $75,000 to $99,999 | 3,706 | 13.6% |
| $100,000 to $149,999 | 5,776 | 21.2% |
| $150,000 to $199,999 | 3,079 | 11.3% |
| $200,000+ | 2,888 | 10.6% |
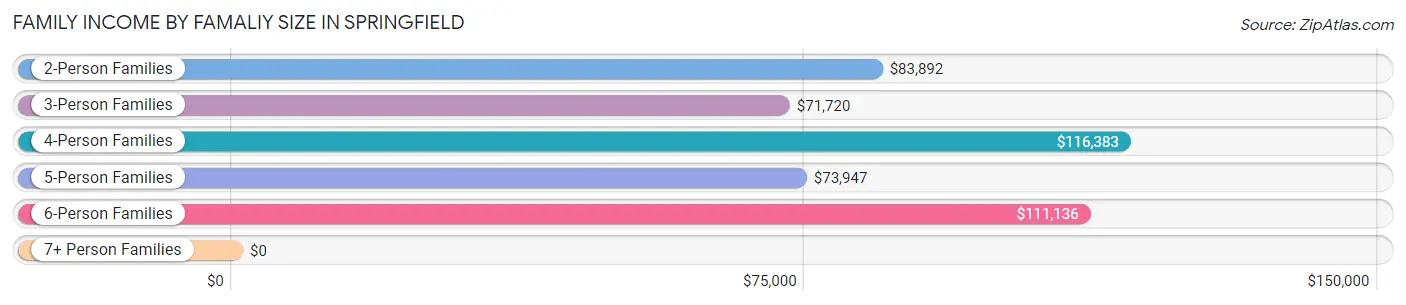
Family Income by Famaliy Size in Springfield
4-person families (4,159 | 15.3%) account for the highest median family income in Springfield with $116,383 per family, while 2-person families (14,671 | 53.8%) have the highest median income of $41,946 per family member.
| Income Bracket | # Families | Median Income |
| 2-Person Families | 14,671 (53.8%) | $83,892 |
| 3-Person Families | 5,806 (21.3%) | $71,720 |
| 4-Person Families | 4,159 (15.3%) | $116,383 |
| 5-Person Families | 1,636 (6.0%) | $73,947 |
| 6-Person Families | 676 (2.5%) | $111,136 |
| 7+ Person Families | 299 (1.1%) | $0 |
| Total | 27,247 (100.0%) | $86,647 |
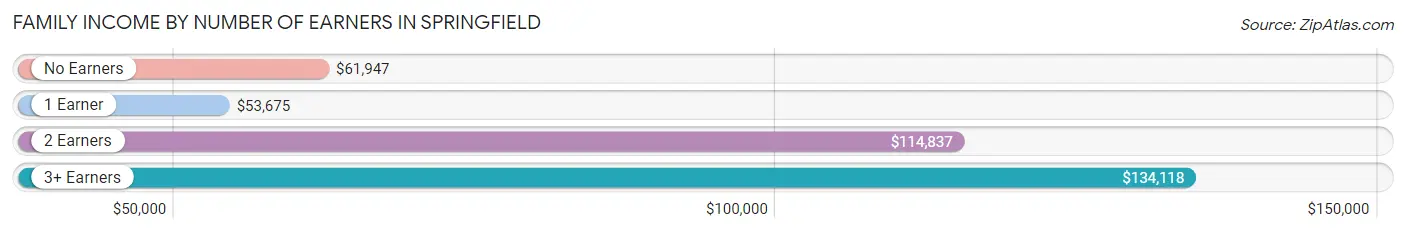
Family Income by Number of Earners in Springfield
The median family income in Springfield is $86,647, with families comprising 3+ earners (2,050) having the highest median family income of $134,118, while families with 1 earner (10,076) have the lowest median family income of $53,675, accounting for 7.5% and 37.0% of families, respectively.
| Number of Earners | # Families | Median Income |
| No Earners | 4,689 (17.2%) | $61,947 |
| 1 Earner | 10,076 (37.0%) | $53,675 |
| 2 Earners | 10,432 (38.3%) | $114,837 |
| 3+ Earners | 2,050 (7.5%) | $134,118 |
| Total | 27,247 (100.0%) | $86,647 |
Household Income in Springfield
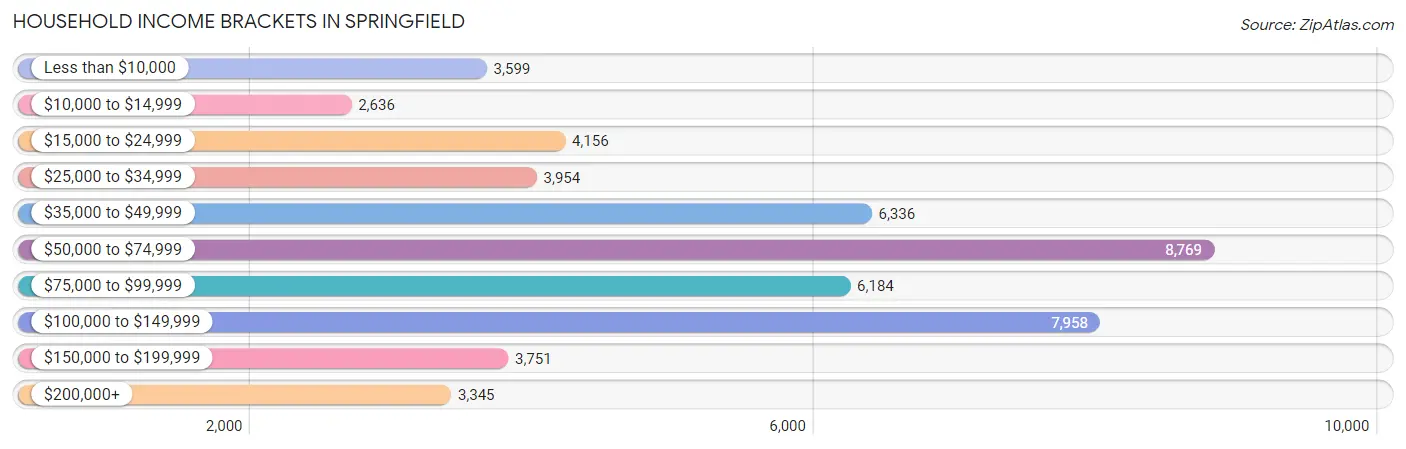
Household Income Brackets in Springfield
With 8,769 households falling in the category, the $50,000 to $74,999 income range is the most frequent in Springfield, accounting for 17.3% of all households. In contrast, only 2,636 households (5.2%) fall into the $10,000 to $14,999 income bracket, making it the least populous group.
| Income Bracket | # Households | % Households |
| Less than $10,000 | 3,599 | 7.1% |
| $10,000 to $14,999 | 2,636 | 5.2% |
| $15,000 to $24,999 | 4,156 | 8.2% |
| $25,000 to $34,999 | 3,954 | 7.8% |
| $35,000 to $49,999 | 6,336 | 12.5% |
| $50,000 to $74,999 | 8,769 | 17.3% |
| $75,000 to $99,999 | 6,184 | 12.2% |
| $100,000 to $149,999 | 7,958 | 15.7% |
| $150,000 to $199,999 | 3,751 | 7.4% |
| $200,000+ | 3,345 | 6.6% |
Household Income by Householder Age in Springfield
The median household income in Springfield is $62,419, with the highest median household income of $75,249 found in the 45 to 64 years age bracket for the primary householder. A total of 18,236 households (36.0%) fall into this category. Meanwhile, the 15 to 24 years age bracket for the primary householder has the lowest median household income of $30,417, with 1,990 households (3.9%) in this group.
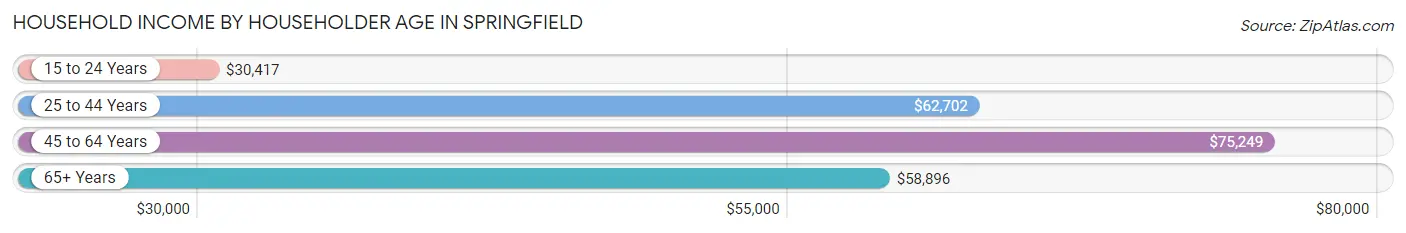
| Income Bracket | # Households | Median Income |
| 15 to 24 Years | 1,990 (3.9%) | $30,417 |
| 25 to 44 Years | 16,367 (32.3%) | $62,702 |
| 45 to 64 Years | 18,236 (36.0%) | $75,249 |
| 65+ Years | 14,093 (27.8%) | $58,896 |
| Total | 50,686 (100.0%) | $62,419 |
Poverty in Springfield
Income Below Poverty by Sex and Age in Springfield
With 14.9% poverty level for males and 18.4% for females among the residents of Springfield, under 5 year old males and 15 year old females are the most vulnerable to poverty, with 1,110 males (30.8%) and 209 females (37.6%) in their respective age groups living below the poverty level.
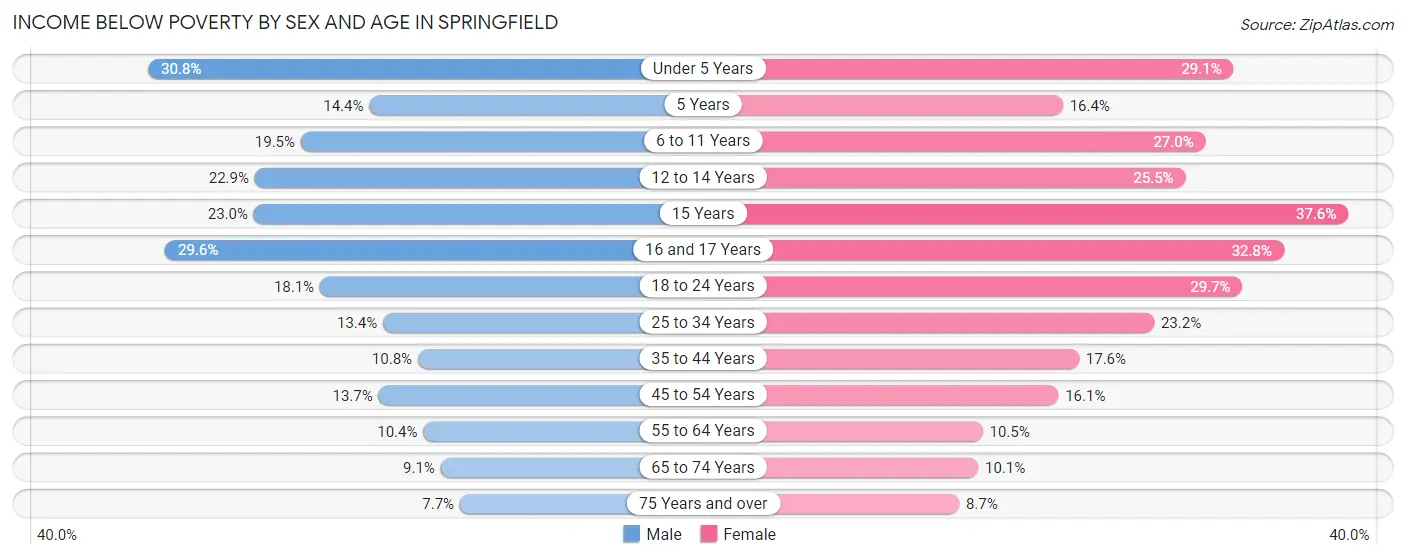
| Age Bracket | Male | Female |
| Under 5 Years | 1,110 (30.8%) | 867 (29.1%) |
| 5 Years | 66 (14.4%) | 102 (16.4%) |
| 6 to 11 Years | 855 (19.5%) | 1,149 (27.0%) |
| 12 to 14 Years | 476 (22.9%) | 416 (25.5%) |
| 15 Years | 142 (23.0%) | 209 (37.6%) |
| 16 and 17 Years | 435 (29.6%) | 458 (32.8%) |
| 18 to 24 Years | 791 (18.1%) | 1,243 (29.7%) |
| 25 to 34 Years | 959 (13.4%) | 1,850 (23.2%) |
| 35 to 44 Years | 717 (10.8%) | 1,251 (17.6%) |
| 45 to 54 Years | 908 (13.7%) | 1,090 (16.1%) |
| 55 to 64 Years | 743 (10.4%) | 864 (10.4%) |
| 65 to 74 Years | 505 (9.1%) | 682 (10.1%) |
| 75 Years and over | 239 (7.7%) | 460 (8.7%) |
| Total | 7,946 (14.9%) | 10,641 (18.4%) |
Income Above Poverty by Sex and Age in Springfield
According to the poverty statistics in Springfield, males aged 75 years and over and females aged 75 years and over are the age groups that are most secure financially, with 92.3% of males and 91.3% of females in these age groups living above the poverty line.
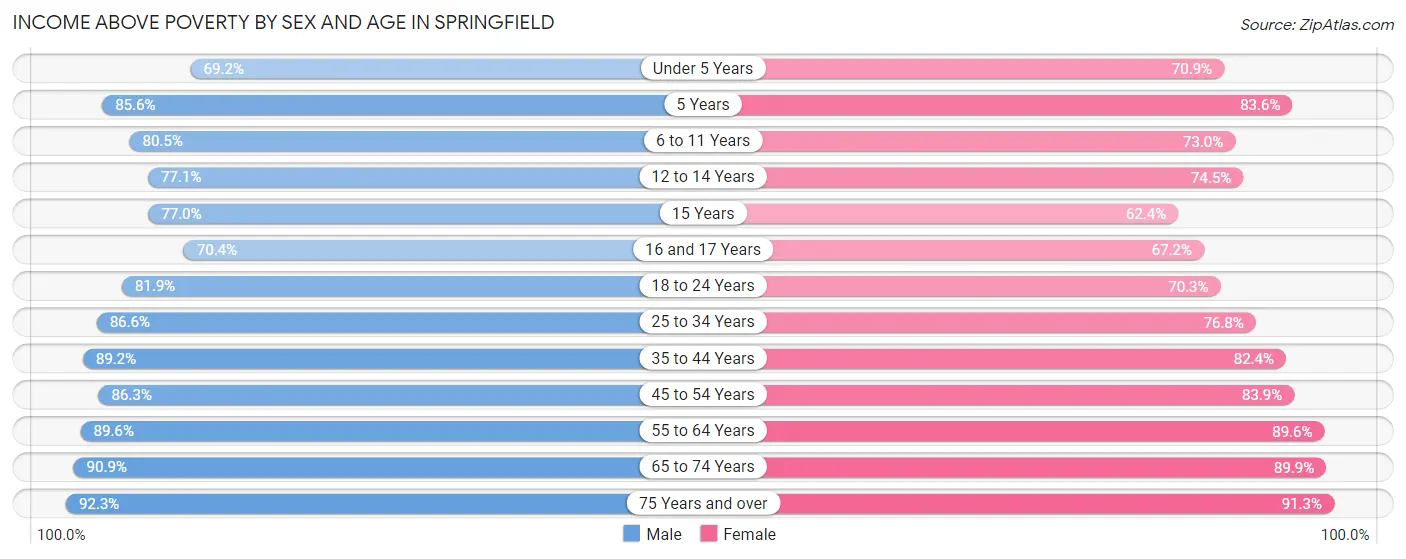
| Age Bracket | Male | Female |
| Under 5 Years | 2,490 (69.2%) | 2,114 (70.9%) |
| 5 Years | 392 (85.6%) | 520 (83.6%) |
| 6 to 11 Years | 3,531 (80.5%) | 3,107 (73.0%) |
| 12 to 14 Years | 1,602 (77.1%) | 1,215 (74.5%) |
| 15 Years | 476 (77.0%) | 347 (62.4%) |
| 16 and 17 Years | 1,036 (70.4%) | 938 (67.2%) |
| 18 to 24 Years | 3,586 (81.9%) | 2,936 (70.3%) |
| 25 to 34 Years | 6,204 (86.6%) | 6,132 (76.8%) |
| 35 to 44 Years | 5,924 (89.2%) | 5,857 (82.4%) |
| 45 to 54 Years | 5,708 (86.3%) | 5,692 (83.9%) |
| 55 to 64 Years | 6,400 (89.6%) | 7,407 (89.5%) |
| 65 to 74 Years | 5,036 (90.9%) | 6,057 (89.9%) |
| 75 Years and over | 2,873 (92.3%) | 4,829 (91.3%) |
| Total | 45,258 (85.1%) | 47,151 (81.6%) |
Income Below Poverty Among Married-Couple Families in Springfield
The poverty statistics for married-couple families in Springfield show that 2.7% or 483 of the total 17,785 families live below the poverty line. Families with 5 or more children have the highest poverty rate of 22.1%, comprising of 15 families. On the other hand, families with no children have the lowest poverty rate of 2.0%, which includes 228 families.
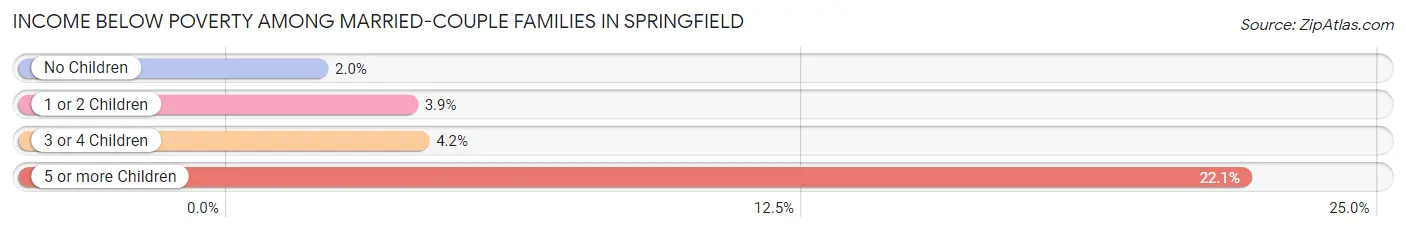
| Children | Above Poverty | Below Poverty |
| No Children | 11,430 (98.0%) | 228 (2.0%) |
| 1 or 2 Children | 4,689 (96.1%) | 191 (3.9%) |
| 3 or 4 Children | 1,130 (95.8%) | 49 (4.2%) |
| 5 or more Children | 53 (77.9%) | 15 (22.1%) |
| Total | 17,302 (97.3%) | 483 (2.7%) |
Income Below Poverty Among Single-Parent Households in Springfield
According to the poverty data in Springfield, 21.1% or 465 single-father households and 31.2% or 2,265 single-mother households are living below the poverty line. Among single-father households, those with 5 or more children have the highest poverty rate, with 6 households (100.0%) experiencing poverty. Likewise, among single-mother households, those with 3 or 4 children have the highest poverty rate, with 657 households (79.4%) falling below the poverty line.
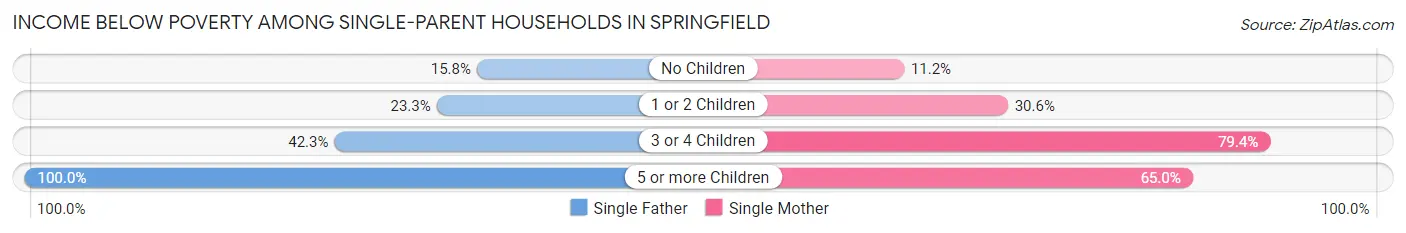
| Children | Single Father | Single Mother |
| No Children | 143 (15.8%) | 255 (11.2%) |
| 1 or 2 Children | 283 (23.3%) | 1,197 (30.6%) |
| 3 or 4 Children | 33 (42.3%) | 657 (79.4%) |
| 5 or more Children | 6 (100.0%) | 156 (65.0%) |
| Total | 465 (21.1%) | 2,265 (31.2%) |
Income Below Poverty Among Married-Couple vs Single-Parent Households in Springfield
The poverty data for Springfield shows that 483 of the married-couple family households (2.7%) and 2,730 of the single-parent households (28.8%) are living below the poverty level. Within the married-couple family households, those with 5 or more children have the highest poverty rate, with 15 households (22.1%) falling below the poverty line. Among the single-parent households, those with 3 or 4 children have the highest poverty rate, with 690 household (76.2%) living below poverty.
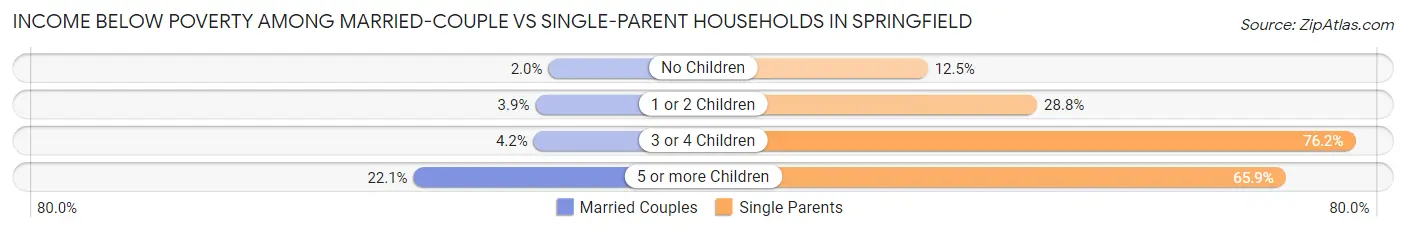
| Children | Married-Couple Families | Single-Parent Households |
| No Children | 228 (2.0%) | 398 (12.5%) |
| 1 or 2 Children | 191 (3.9%) | 1,480 (28.8%) |
| 3 or 4 Children | 49 (4.2%) | 690 (76.2%) |
| 5 or more Children | 15 (22.1%) | 162 (65.8%) |
| Total | 483 (2.7%) | 2,730 (28.8%) |
Race in Springfield
The most populous races in Springfield are White / Caucasian (80,925 | 70.9%), Black / African American (23,151 | 20.3%), and Two or more Races (5,806 | 5.1%).
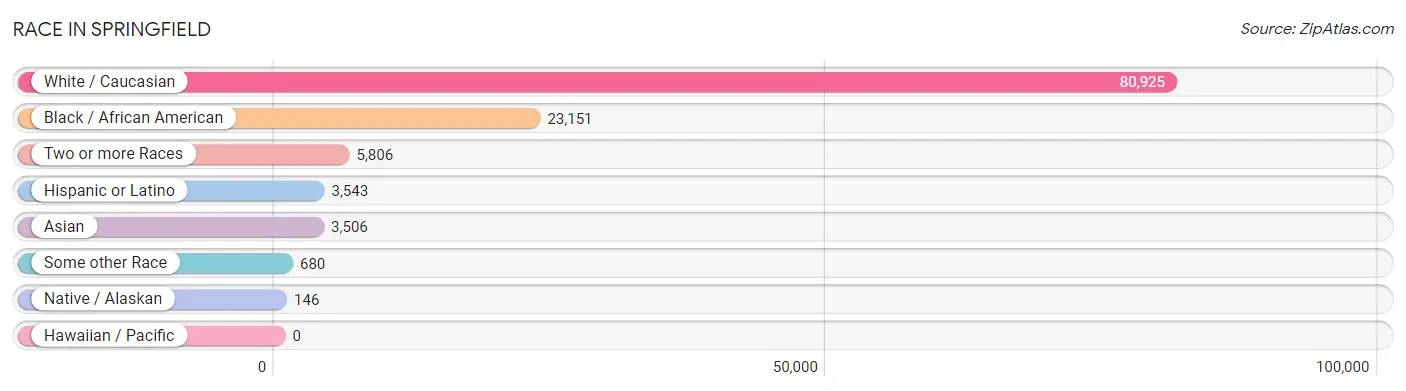
| Race | # Population | % Population |
| Asian | 3,506 | 3.1% |
| Black / African American | 23,151 | 20.3% |
| Hawaiian / Pacific | 0 | 0.0% |
| Hispanic or Latino | 3,543 | 3.1% |
| Native / Alaskan | 146 | 0.1% |
| White / Caucasian | 80,925 | 70.9% |
| Two or more Races | 5,806 | 5.1% |
| Some other Race | 680 | 0.6% |
| Total | 114,214 | 100.0% |
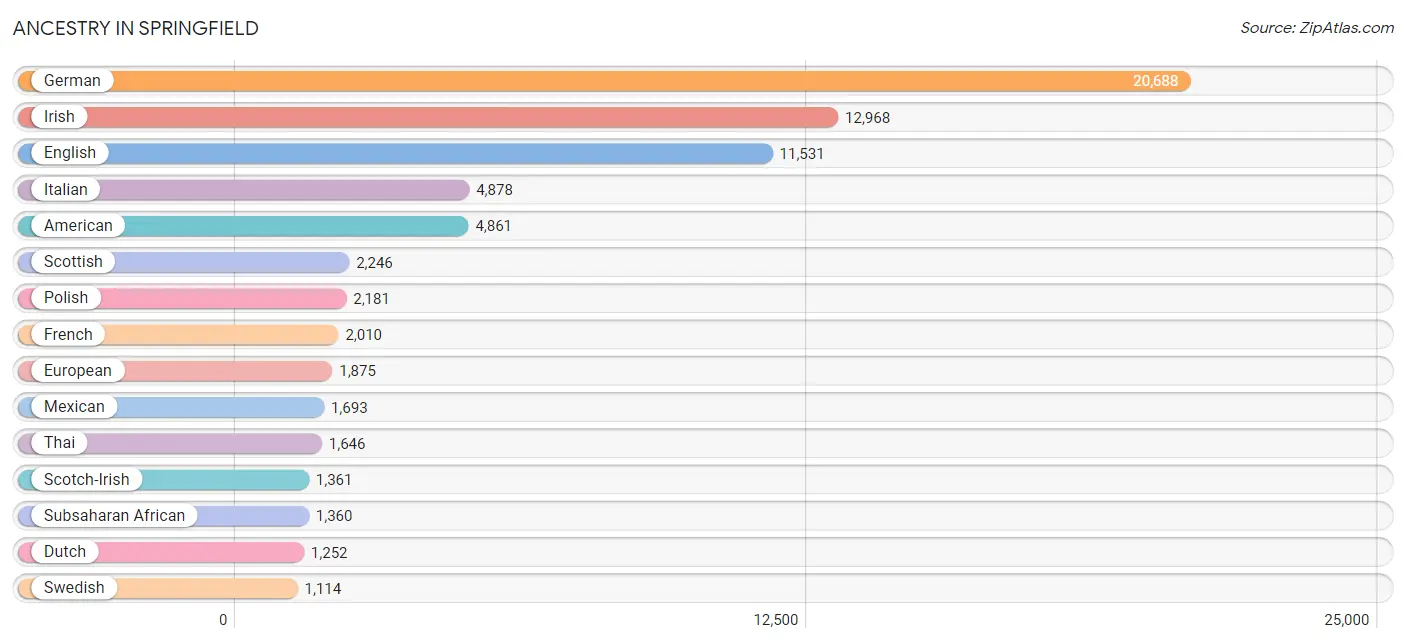
Ancestry in Springfield
The most populous ancestries reported in Springfield are German (20,688 | 18.1%), Irish (12,968 | 11.4%), English (11,531 | 10.1%), Italian (4,878 | 4.3%), and American (4,861 | 4.3%), together accounting for 48.1% of all Springfield residents.
| Ancestry | # Population | % Population |
| African | 571 | 0.5% |
| American | 4,861 | 4.3% |
| Apache | 45 | 0.0% |
| Arab | 320 | 0.3% |
| Argentinean | 35 | 0.0% |
| Armenian | 37 | 0.0% |
| Australian | 40 | 0.0% |
| Austrian | 253 | 0.2% |
| Belgian | 74 | 0.1% |
| Belizean | 79 | 0.1% |
| Bhutanese | 123 | 0.1% |
| Blackfeet | 27 | 0.0% |
| Bolivian | 15 | 0.0% |
| Brazilian | 31 | 0.0% |
| British | 937 | 0.8% |
| Bulgarian | 14 | 0.0% |
| Burmese | 256 | 0.2% |
| Cajun | 14 | 0.0% |
| Canadian | 40 | 0.0% |
| Central American | 54 | 0.1% |
| Cherokee | 119 | 0.1% |
| Chilean | 51 | 0.0% |
| Chippewa | 6 | 0.0% |
| Choctaw | 40 | 0.0% |
| Colombian | 129 | 0.1% |
| Comanche | 2 | 0.0% |
| Creek | 41 | 0.0% |
| Croatian | 151 | 0.1% |
| Cuban | 98 | 0.1% |
| Czech | 278 | 0.2% |
| Czechoslovakian | 200 | 0.2% |
| Danish | 196 | 0.2% |
| Dominican | 50 | 0.0% |
| Dutch | 1,252 | 1.1% |
| Eastern European | 196 | 0.2% |
| Egyptian | 14 | 0.0% |
| English | 11,531 | 10.1% |
| European | 1,875 | 1.6% |
| Filipino | 138 | 0.1% |
| Finnish | 30 | 0.0% |
| French | 2,010 | 1.8% |
| French Canadian | 424 | 0.4% |
| German | 20,688 | 18.1% |
| Ghanaian | 12 | 0.0% |
| Greek | 178 | 0.2% |
| Guatemalan | 28 | 0.0% |
| Haitian | 92 | 0.1% |
| Honduran | 26 | 0.0% |
| Hungarian | 223 | 0.2% |
| Icelander | 23 | 0.0% |
| Indian (Asian) | 588 | 0.5% |
| Indonesian | 34 | 0.0% |
| Inupiat | 13 | 0.0% |
| Iranian | 24 | 0.0% |
| Iraqi | 15 | 0.0% |
| Irish | 12,968 | 11.4% |
| Iroquois | 1 | 0.0% |
| Italian | 4,878 | 4.3% |
| Jamaican | 47 | 0.0% |
| Japanese | 19 | 0.0% |
| Jordanian | 63 | 0.1% |
| Korean | 802 | 0.7% |
| Latvian | 34 | 0.0% |
| Lebanese | 86 | 0.1% |
| Lithuanian | 392 | 0.3% |
| Malaysian | 37 | 0.0% |
| Mexican | 1,693 | 1.5% |
| Mexican American Indian | 124 | 0.1% |
| Moroccan | 11 | 0.0% |
| Nigerian | 430 | 0.4% |
| Northern European | 133 | 0.1% |
| Norwegian | 668 | 0.6% |
| Osage | 7 | 0.0% |
| Pakistani | 142 | 0.1% |
| Palestinian | 22 | 0.0% |
| Pennsylvania German | 31 | 0.0% |
| Peruvian | 16 | 0.0% |
| Polish | 2,181 | 1.9% |
| Portuguese | 177 | 0.2% |
| Pueblo | 10 | 0.0% |
| Puerto Rican | 745 | 0.6% |
| Romanian | 25 | 0.0% |
| Russian | 206 | 0.2% |
| Samoan | 6 | 0.0% |
| Scandinavian | 370 | 0.3% |
| Scotch-Irish | 1,361 | 1.2% |
| Scottish | 2,246 | 2.0% |
| Serbian | 16 | 0.0% |
| Sierra Leonean | 12 | 0.0% |
| Sioux | 33 | 0.0% |
| Slavic | 61 | 0.1% |
| Slovak | 401 | 0.4% |
| Slovene | 60 | 0.1% |
| Somali | 8 | 0.0% |
| South African | 93 | 0.1% |
| South American | 310 | 0.3% |
| Spaniard | 47 | 0.0% |
| Spanish | 104 | 0.1% |
| Sri Lankan | 234 | 0.2% |
| Subsaharan African | 1,360 | 1.2% |
| Swedish | 1,114 | 1.0% |
| Swiss | 489 | 0.4% |
| Syrian | 27 | 0.0% |
| Thai | 1,646 | 1.4% |
| Turkish | 111 | 0.1% |
| Ugandan | 1 | 0.0% |
| Ukrainian | 177 | 0.2% |
| Venezuelan | 64 | 0.1% |
| Welsh | 671 | 0.6% |
| Yugoslavian | 28 | 0.0% | View All 110 Rows |
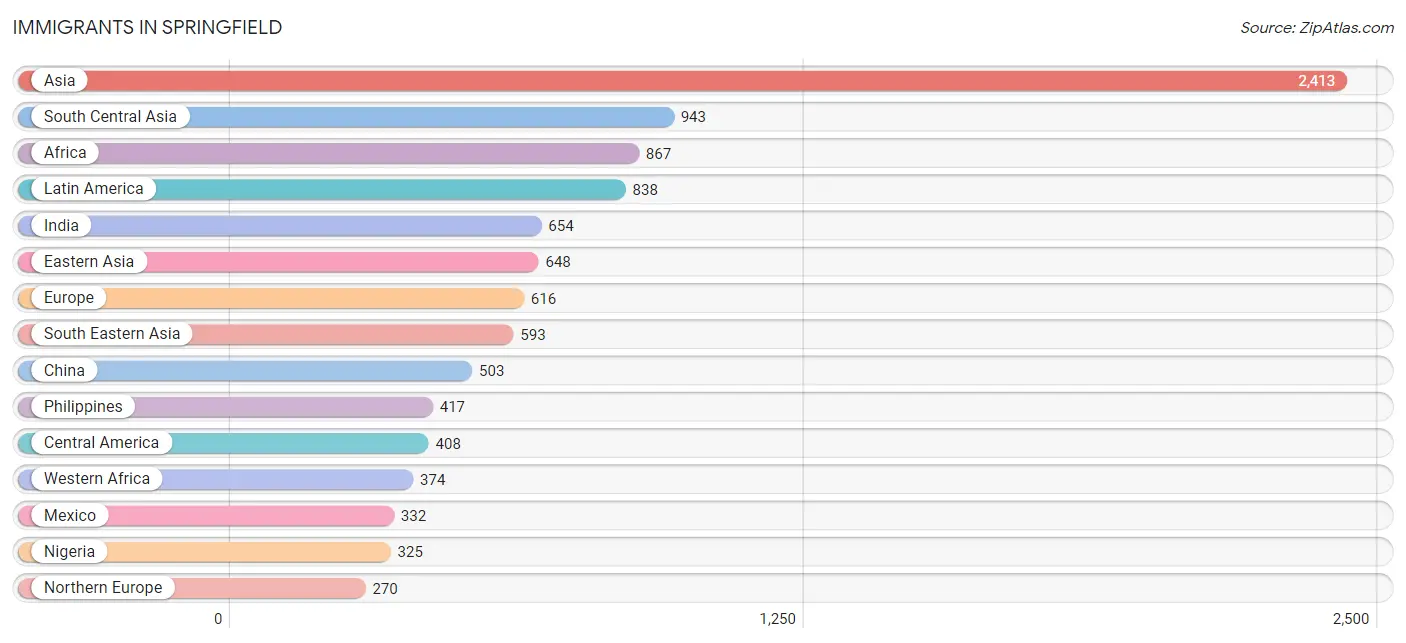
Immigrants in Springfield
The most numerous immigrant groups reported in Springfield came from Asia (2,413 | 2.1%), South Central Asia (943 | 0.8%), Africa (867 | 0.8%), Latin America (838 | 0.7%), and India (654 | 0.6%), together accounting for 5.0% of all Springfield residents.
| Immigration Origin | # Population | % Population |
| Africa | 867 | 0.8% |
| Argentina | 35 | 0.0% |
| Asia | 2,413 | 2.1% |
| Australia | 9 | 0.0% |
| Austria | 13 | 0.0% |
| Belarus | 19 | 0.0% |
| Belgium | 1 | 0.0% |
| Belize | 17 | 0.0% |
| Bulgaria | 14 | 0.0% |
| Cameroon | 136 | 0.1% |
| Canada | 78 | 0.1% |
| Caribbean | 177 | 0.2% |
| Central America | 408 | 0.4% |
| Chile | 51 | 0.0% |
| China | 503 | 0.4% |
| Colombia | 99 | 0.1% |
| Congo | 35 | 0.0% |
| Cuba | 37 | 0.0% |
| Dominican Republic | 50 | 0.0% |
| Eastern Africa | 46 | 0.0% |
| Eastern Asia | 648 | 0.6% |
| Eastern Europe | 170 | 0.2% |
| Egypt | 14 | 0.0% |
| England | 117 | 0.1% |
| Eritrea | 4 | 0.0% |
| Europe | 616 | 0.5% |
| Fiji | 12 | 0.0% |
| France | 40 | 0.0% |
| Germany | 70 | 0.1% |
| Ghana | 49 | 0.0% |
| Guatemala | 34 | 0.0% |
| Guyana | 7 | 0.0% |
| Haiti | 61 | 0.1% |
| Honduras | 11 | 0.0% |
| India | 654 | 0.6% |
| Iraq | 9 | 0.0% |
| Ireland | 34 | 0.0% |
| Italy | 41 | 0.0% |
| Jamaica | 23 | 0.0% |
| Japan | 20 | 0.0% |
| Jordan | 62 | 0.1% |
| Korea | 125 | 0.1% |
| Kuwait | 6 | 0.0% |
| Laos | 10 | 0.0% |
| Latin America | 838 | 0.7% |
| Lebanon | 4 | 0.0% |
| Mexico | 332 | 0.3% |
| Middle Africa | 234 | 0.2% |
| Morocco | 11 | 0.0% |
| Nepal | 139 | 0.1% |
| Nigeria | 325 | 0.3% |
| Northern Africa | 25 | 0.0% |
| Northern Europe | 270 | 0.2% |
| Norway | 9 | 0.0% |
| Oceania | 21 | 0.0% |
| Pakistan | 143 | 0.1% |
| Panama | 14 | 0.0% |
| Peru | 4 | 0.0% |
| Philippines | 417 | 0.4% |
| Poland | 25 | 0.0% |
| Russia | 42 | 0.0% |
| Saudi Arabia | 85 | 0.1% |
| Scotland | 20 | 0.0% |
| Somalia | 8 | 0.0% |
| South Africa | 93 | 0.1% |
| South America | 253 | 0.2% |
| South Central Asia | 943 | 0.8% |
| South Eastern Asia | 593 | 0.5% |
| Southern Europe | 52 | 0.1% |
| Spain | 11 | 0.0% |
| Sri Lanka | 7 | 0.0% |
| Syria | 8 | 0.0% |
| Taiwan | 126 | 0.1% |
| Thailand | 67 | 0.1% |
| Trinidad and Tobago | 6 | 0.0% |
| Turkey | 55 | 0.1% |
| Uganda | 1 | 0.0% |
| Ukraine | 70 | 0.1% |
| Venezuela | 57 | 0.1% |
| Vietnam | 65 | 0.1% |
| Western Africa | 374 | 0.3% |
| Western Asia | 229 | 0.2% |
| Western Europe | 124 | 0.1% |
| Zaire | 32 | 0.0% | View All 84 Rows |
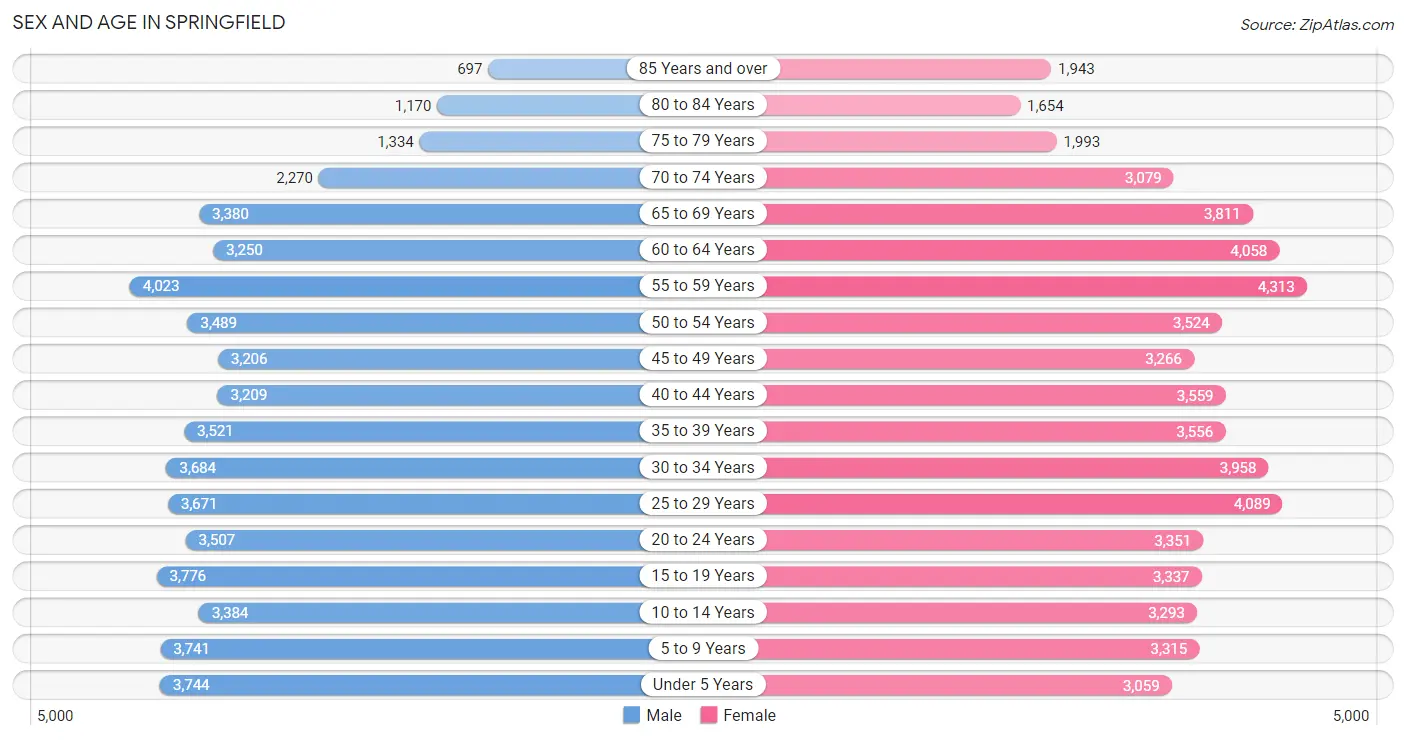
Sex and Age in Springfield
Sex and Age in Springfield
The most populous age groups in Springfield are 55 to 59 Years (4,023 | 7.3%) for men and 55 to 59 Years (4,313 | 7.3%) for women.
| Age Bracket | Male | Female |
| Under 5 Years | 3,744 (6.8%) | 3,059 (5.2%) |
| 5 to 9 Years | 3,741 (6.8%) | 3,315 (5.6%) |
| 10 to 14 Years | 3,384 (6.1%) | 3,293 (5.6%) |
| 15 to 19 Years | 3,776 (6.9%) | 3,337 (5.6%) |
| 20 to 24 Years | 3,507 (6.4%) | 3,351 (5.7%) |
| 25 to 29 Years | 3,671 (6.7%) | 4,089 (6.9%) |
| 30 to 34 Years | 3,684 (6.7%) | 3,958 (6.7%) |
| 35 to 39 Years | 3,521 (6.4%) | 3,556 (6.0%) |
| 40 to 44 Years | 3,209 (5.8%) | 3,559 (6.0%) |
| 45 to 49 Years | 3,206 (5.8%) | 3,266 (5.5%) |
| 50 to 54 Years | 3,489 (6.3%) | 3,524 (6.0%) |
| 55 to 59 Years | 4,023 (7.3%) | 4,313 (7.3%) |
| 60 to 64 Years | 3,250 (5.9%) | 4,058 (6.9%) |
| 65 to 69 Years | 3,380 (6.1%) | 3,811 (6.4%) |
| 70 to 74 Years | 2,270 (4.1%) | 3,079 (5.2%) |
| 75 to 79 Years | 1,334 (2.4%) | 1,993 (3.4%) |
| 80 to 84 Years | 1,170 (2.1%) | 1,654 (2.8%) |
| 85 Years and over | 697 (1.3%) | 1,943 (3.3%) |
| Total | 55,056 (100.0%) | 59,158 (100.0%) |
Families and Households in Springfield
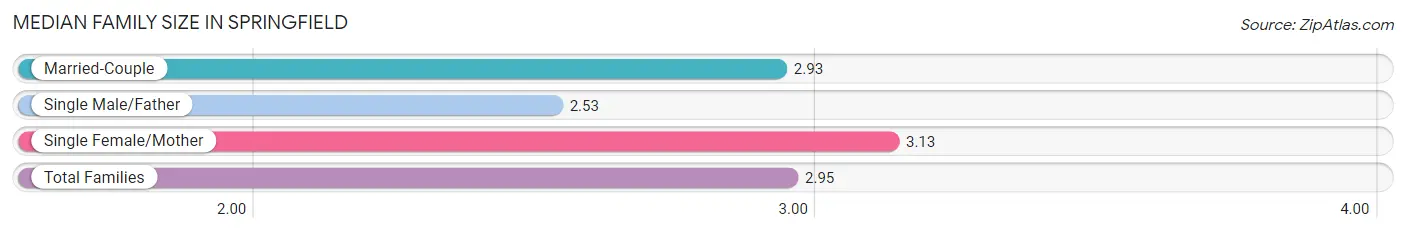
Median Family Size in Springfield
The median family size in Springfield is 2.95 persons per family, with single female/mother families (7,255 | 26.6%) accounting for the largest median family size of 3.13 persons per family. On the other hand, single male/father families (2,207 | 8.1%) represent the smallest median family size with 2.53 persons per family.
| Family Type | # Families | Family Size |
| Married-Couple | 17,785 (65.3%) | 2.93 |
| Single Male/Father | 2,207 (8.1%) | 2.53 |
| Single Female/Mother | 7,255 (26.6%) | 3.13 |
| Total Families | 27,247 (100.0%) | 2.95 |
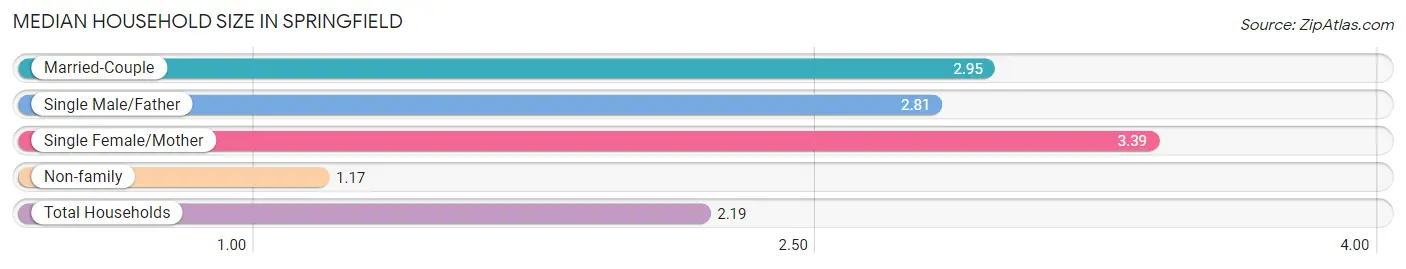
Median Household Size in Springfield
The median household size in Springfield is 2.19 persons per household, with single female/mother households (7,255 | 14.3%) accounting for the largest median household size of 3.39 persons per household. non-family households (23,439 | 46.2%) represent the smallest median household size with 1.17 persons per household.
| Household Type | # Households | Household Size |
| Married-Couple | 17,785 (35.1%) | 2.95 |
| Single Male/Father | 2,207 (4.3%) | 2.81 |
| Single Female/Mother | 7,255 (14.3%) | 3.39 |
| Non-family | 23,439 (46.2%) | 1.17 |
| Total Households | 50,686 (100.0%) | 2.19 |
Household Size by Marriage Status in Springfield
Out of a total of 50,686 households in Springfield, 27,247 (53.8%) are family households, while 23,439 (46.2%) are nonfamily households. The most numerous type of family households are 2-person households, comprising 13,595, and the most common type of nonfamily households are 1-person households, comprising 20,276.
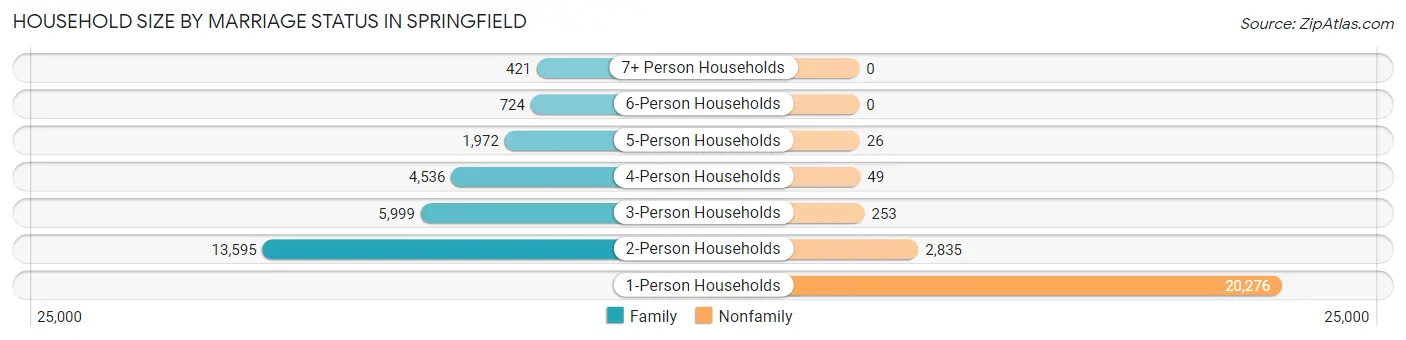
| Household Size | Family Households | Nonfamily Households |
| 1-Person Households | - | 20,276 (40.0%) |
| 2-Person Households | 13,595 (26.8%) | 2,835 (5.6%) |
| 3-Person Households | 5,999 (11.8%) | 253 (0.5%) |
| 4-Person Households | 4,536 (8.9%) | 49 (0.1%) |
| 5-Person Households | 1,972 (3.9%) | 26 (0.1%) |
| 6-Person Households | 724 (1.4%) | 0 (0.0%) |
| 7+ Person Households | 421 (0.8%) | 0 (0.0%) |
| Total | 27,247 (53.8%) | 23,439 (46.2%) |
Female Fertility in Springfield
Fertility by Age in Springfield
Average fertility rate in Springfield is 68.0 births per 1,000 women. Women in the age bracket of 20 to 34 years have the highest fertility rate with 109.0 births per 1,000 women. Women in the age bracket of 20 to 34 years acount for 70.6% of all women with births.
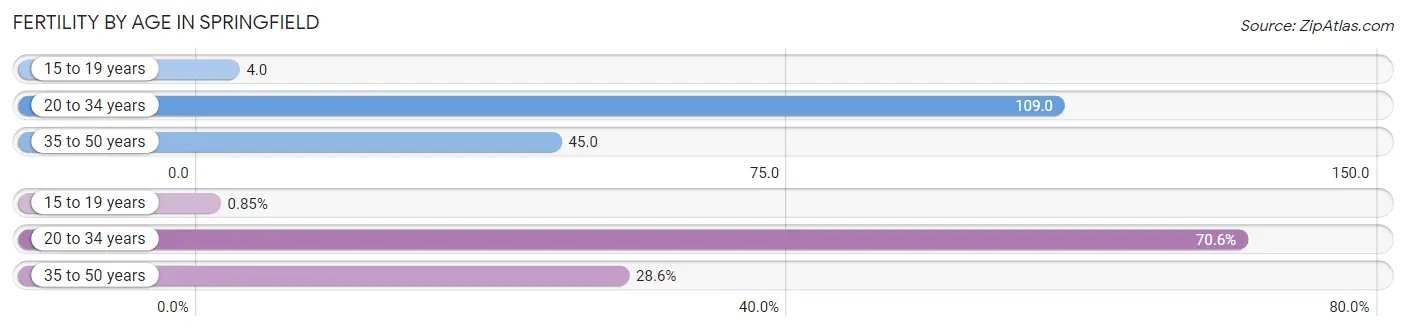
| Age Bracket | Women with Births | Births / 1,000 Women |
| 15 to 19 years | 15 (0.9%) | 4.0 |
| 20 to 34 years | 1,247 (70.6%) | 109.0 |
| 35 to 50 years | 505 (28.6%) | 45.0 |
| Total | 1,767 (100.0%) | 68.0 |
Fertility by Age by Marriage Status in Springfield
50.3% of women with births (1,767) in Springfield are married. The highest percentage of unmarried women with births falls into 15 to 19 years age bracket with 100.0% of them unmarried at the time of birth, while the lowest percentage of unmarried women with births belong to 35 to 50 years age bracket with 41.2% of them unmarried.
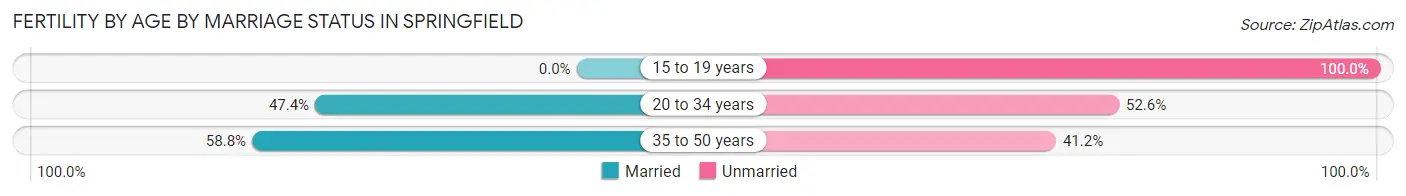
| Age Bracket | Married | Unmarried |
| 15 to 19 years | 0 (0.0%) | 15 (100.0%) |
| 20 to 34 years | 591 (47.4%) | 656 (52.6%) |
| 35 to 50 years | 297 (58.8%) | 208 (41.2%) |
| Total | 889 (50.3%) | 878 (49.7%) |
Fertility by Education in Springfield
Average fertility rate in Springfield is 68.0 births per 1,000 women. Women with the education attainment of bachelor's degree have the highest fertility rate of 99.0 births per 1,000 women, while women with the education attainment of less than high school have the lowest fertility at 41.0 births per 1,000 women. Women with the education attainment of bachelor's degree represent 27.7% of all women with births.
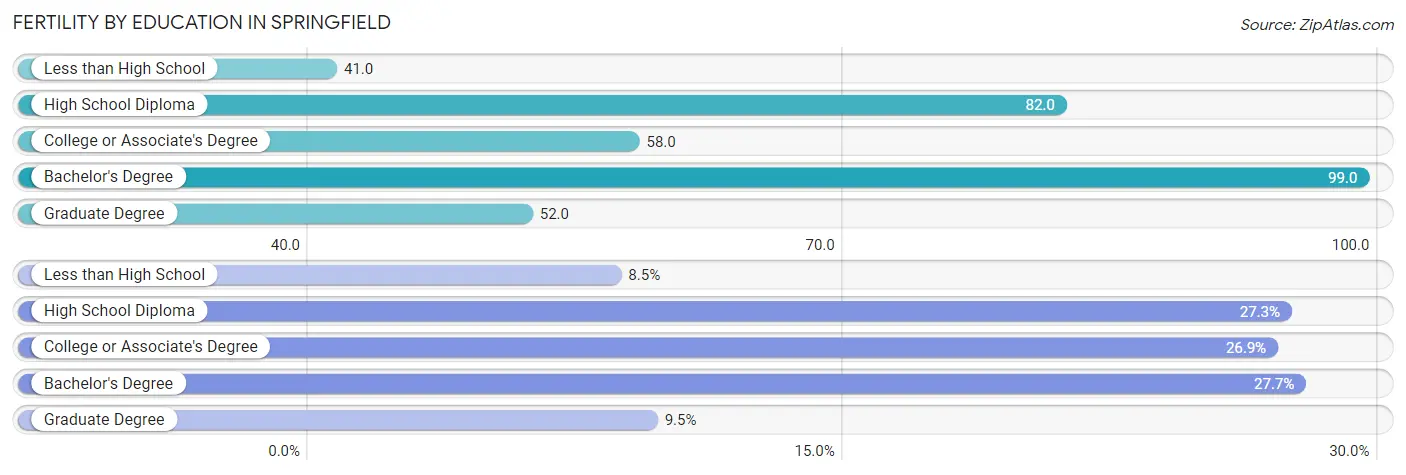
| Educational Attainment | Women with Births | Births / 1,000 Women |
| Less than High School | 150 (8.5%) | 41.0 |
| High School Diploma | 483 (27.3%) | 82.0 |
| College or Associate's Degree | 476 (26.9%) | 58.0 |
| Bachelor's Degree | 490 (27.7%) | 99.0 |
| Graduate Degree | 168 (9.5%) | 52.0 |
| Total | 1,767 (100.0%) | 68.0 |
Fertility by Education by Marriage Status in Springfield
49.7% of women with births in Springfield are unmarried. Women with the educational attainment of graduate degree are most likely to be married with 100.0% of them married at childbirth, while women with the educational attainment of less than high school are least likely to be married with 94.7% of them unmarried at childbirth.
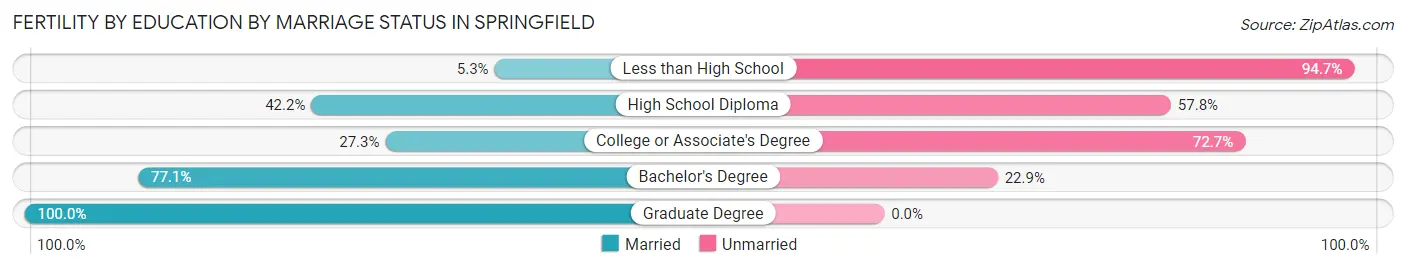
| Educational Attainment | Married | Unmarried |
| Less than High School | 8 (5.3%) | 142 (94.7%) |
| High School Diploma | 204 (42.2%) | 279 (57.8%) |
| College or Associate's Degree | 130 (27.3%) | 346 (72.7%) |
| Bachelor's Degree | 378 (77.1%) | 112 (22.9%) |
| Graduate Degree | 168 (100.0%) | 0 (0.0%) |
| Total | 889 (50.3%) | 878 (49.7%) |
Employment Characteristics in Springfield
Employment by Class of Employer in Springfield
Among the 51,624 employed individuals in Springfield, private company employees (29,755 | 57.6%), state government employees (8,006 | 15.5%), and not-for-profit organizations (6,022 | 11.7%) make up the most common classes of employment.
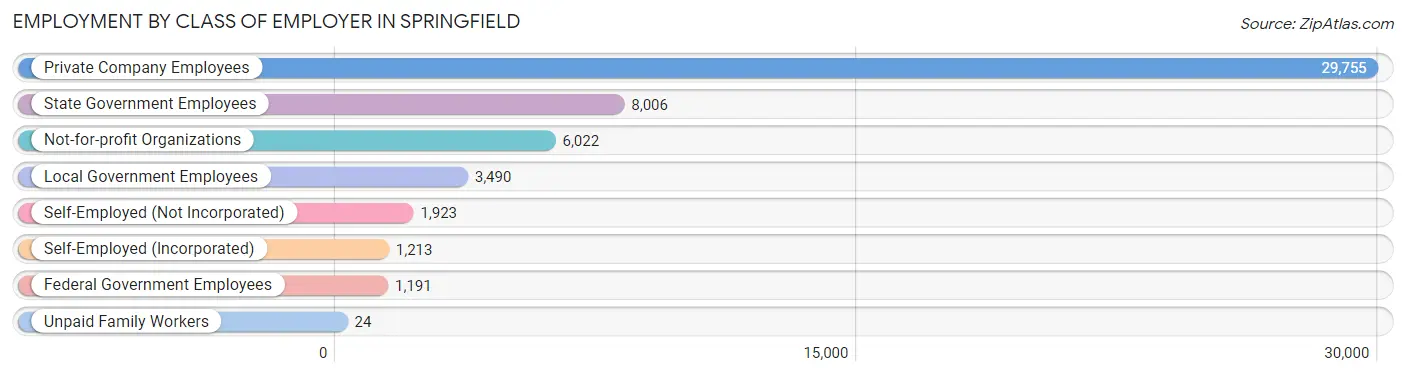
| Employer Class | # Employees | % Employees |
| Private Company Employees | 29,755 | 57.6% |
| Self-Employed (Incorporated) | 1,213 | 2.4% |
| Self-Employed (Not Incorporated) | 1,923 | 3.7% |
| Not-for-profit Organizations | 6,022 | 11.7% |
| Local Government Employees | 3,490 | 6.8% |
| State Government Employees | 8,006 | 15.5% |
| Federal Government Employees | 1,191 | 2.3% |
| Unpaid Family Workers | 24 | 0.1% |
| Total | 51,624 | 100.0% |
Employment Status by Age in Springfield
According to the labor force statistics for Springfield, out of the total population over 16 years of age (92,493), 60.6% or 56,051 individuals are in the labor force, with 6.6% or 3,699 of them unemployed. The age group with the highest labor force participation rate is 30 to 34 years, with 86.6% or 6,618 individuals in the labor force. Within the labor force, the 16 to 19 years age range has the highest percentage of unemployed individuals, with 20.2% or 475 of them being unemployed.
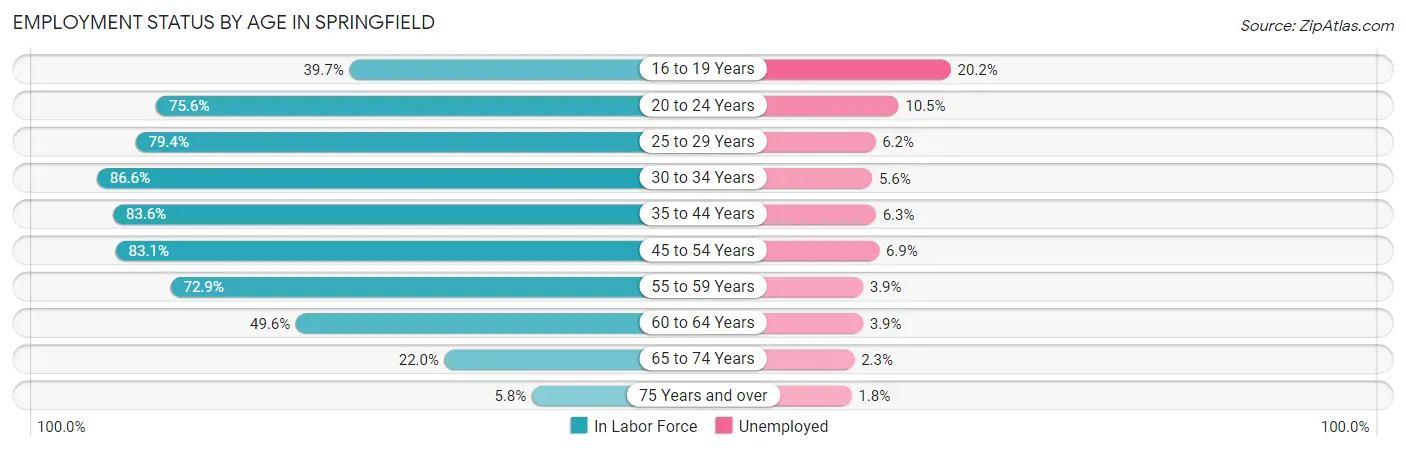
| Age Bracket | In Labor Force | Unemployed |
| 16 to 19 Years | 2,353 (39.7%) | 475 (20.2%) |
| 20 to 24 Years | 5,185 (75.6%) | 544 (10.5%) |
| 25 to 29 Years | 6,161 (79.4%) | 382 (6.2%) |
| 30 to 34 Years | 6,618 (86.6%) | 371 (5.6%) |
| 35 to 44 Years | 11,574 (83.6%) | 729 (6.3%) |
| 45 to 54 Years | 11,206 (83.1%) | 773 (6.9%) |
| 55 to 59 Years | 6,077 (72.9%) | 237 (3.9%) |
| 60 to 64 Years | 3,625 (49.6%) | 141 (3.9%) |
| 65 to 74 Years | 2,759 (22.0%) | 63 (2.3%) |
| 75 Years and over | 510 (5.8%) | 9 (1.8%) |
| Total | 56,051 (60.6%) | 3,699 (6.6%) |
Employment Status by Educational Attainment in Springfield
According to labor force statistics for Springfield, 77.5% of individuals (45,241) out of the total population between 25 and 64 years of age (58,376) are in the labor force, with 5.8% or 2,624 of them being unemployed. The group with the highest labor force participation rate are those with the educational attainment of bachelor's degree or higher, with 86.0% or 17,480 individuals in the labor force. Within the labor force, individuals with less than high school education have the highest percentage of unemployment, with 24.3% or 553 of them being unemployed.
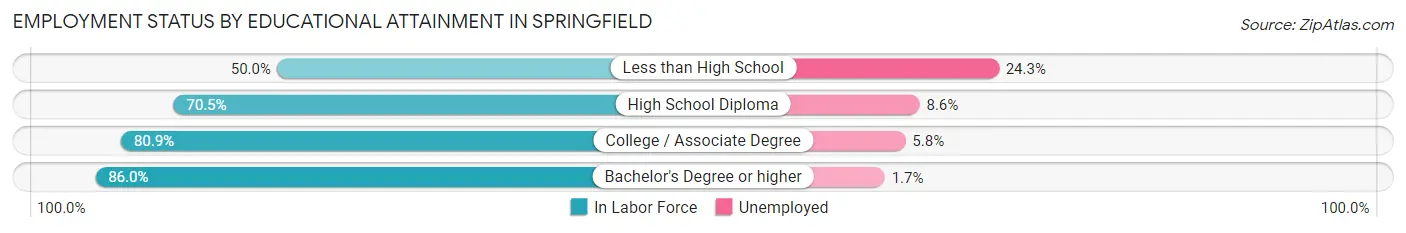
| Educational Attainment | In Labor Force | Unemployed |
| Less than High School | 2,274 (50.0%) | 1,105 (24.3%) |
| High School Diploma | 10,819 (70.5%) | 1,320 (8.6%) |
| College / Associate Degree | 14,689 (80.9%) | 1,053 (5.8%) |
| Bachelor's Degree or higher | 17,480 (86.0%) | 346 (1.7%) |
| Total | 45,241 (77.5%) | 3,386 (5.8%) |
Employment Occupations by Sex in Springfield
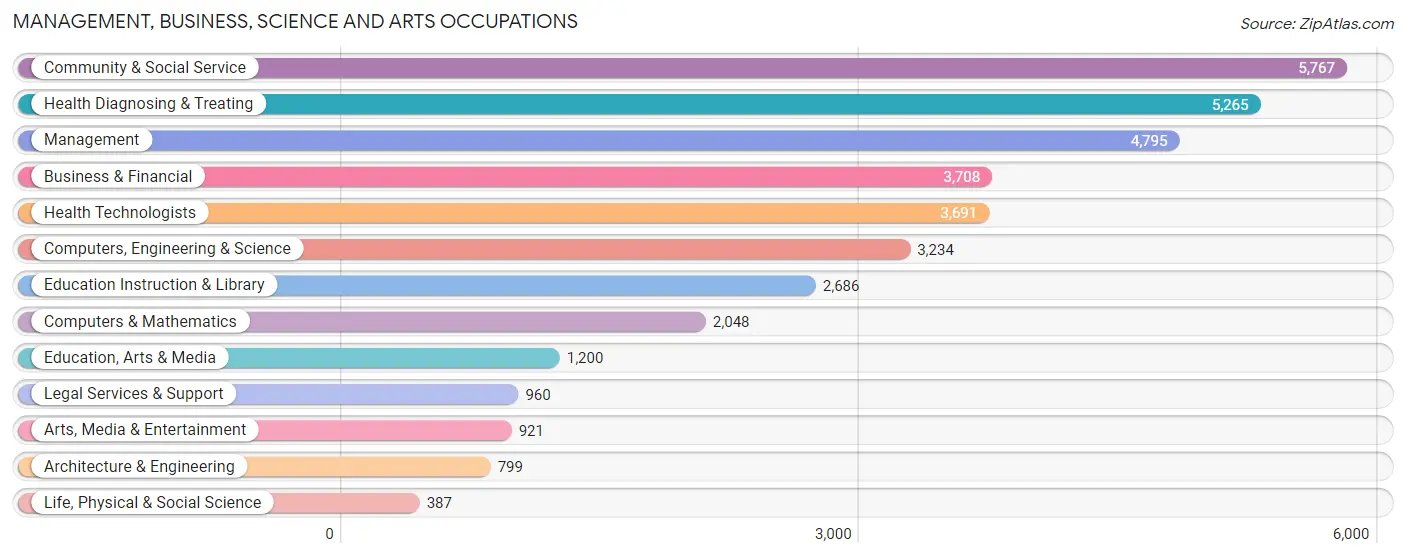
Management, Business, Science and Arts Occupations
The most common Management, Business, Science and Arts occupations in Springfield are Community & Social Service (5,767 | 11.0%), Health Diagnosing & Treating (5,265 | 10.1%), Management (4,795 | 9.2%), Business & Financial (3,708 | 7.1%), and Health Technologists (3,691 | 7.1%).
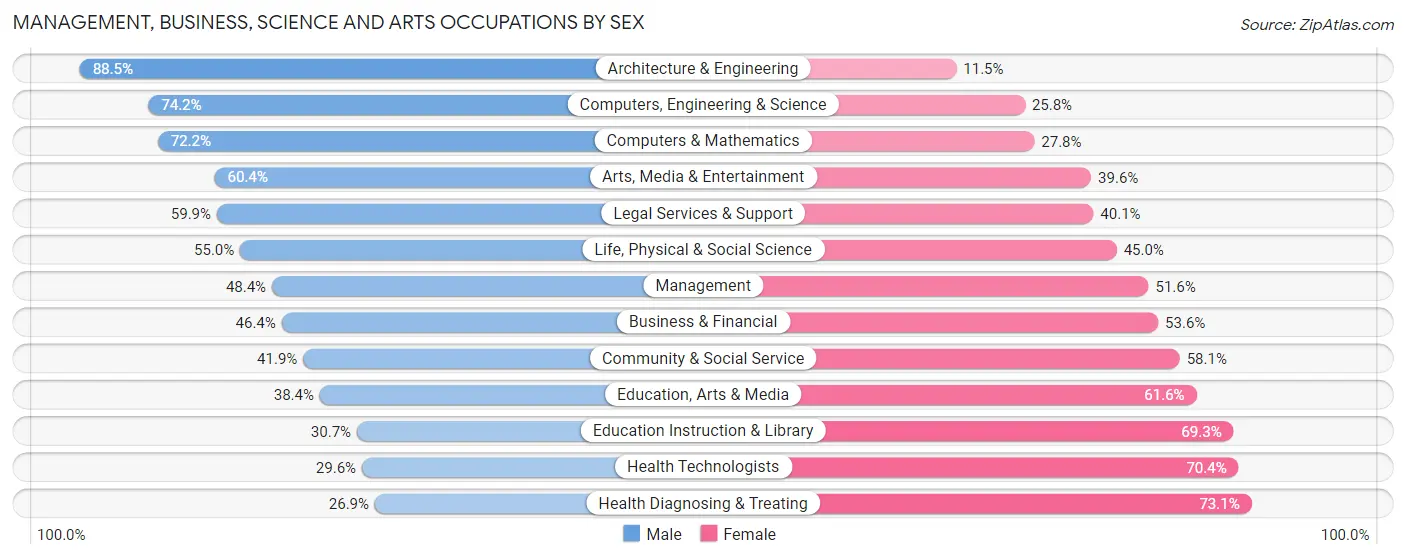
Management, Business, Science and Arts Occupations by Sex
Within the Management, Business, Science and Arts occupations in Springfield, the most male-oriented occupations are Architecture & Engineering (88.5%), Computers, Engineering & Science (74.2%), and Computers & Mathematics (72.2%), while the most female-oriented occupations are Health Diagnosing & Treating (73.1%), Health Technologists (70.4%), and Education Instruction & Library (69.3%).
| Occupation | Male | Female |
| Management | 2,321 (48.4%) | 2,474 (51.6%) |
| Business & Financial | 1,720 (46.4%) | 1,988 (53.6%) |
| Computers, Engineering & Science | 2,399 (74.2%) | 835 (25.8%) |
| Computers & Mathematics | 1,479 (72.2%) | 569 (27.8%) |
| Architecture & Engineering | 707 (88.5%) | 92 (11.5%) |
| Life, Physical & Social Science | 213 (55.0%) | 174 (45.0%) |
| Community & Social Service | 2,416 (41.9%) | 3,351 (58.1%) |
| Education, Arts & Media | 461 (38.4%) | 739 (61.6%) |
| Legal Services & Support | 575 (59.9%) | 385 (40.1%) |
| Education Instruction & Library | 824 (30.7%) | 1,862 (69.3%) |
| Arts, Media & Entertainment | 556 (60.4%) | 365 (39.6%) |
| Health Diagnosing & Treating | 1,418 (26.9%) | 3,847 (73.1%) |
| Health Technologists | 1,094 (29.6%) | 2,597 (70.4%) |
| Total (Category) | 10,274 (45.1%) | 12,495 (54.9%) |
| Total (Overall) | 25,929 (49.6%) | 26,314 (50.4%) |
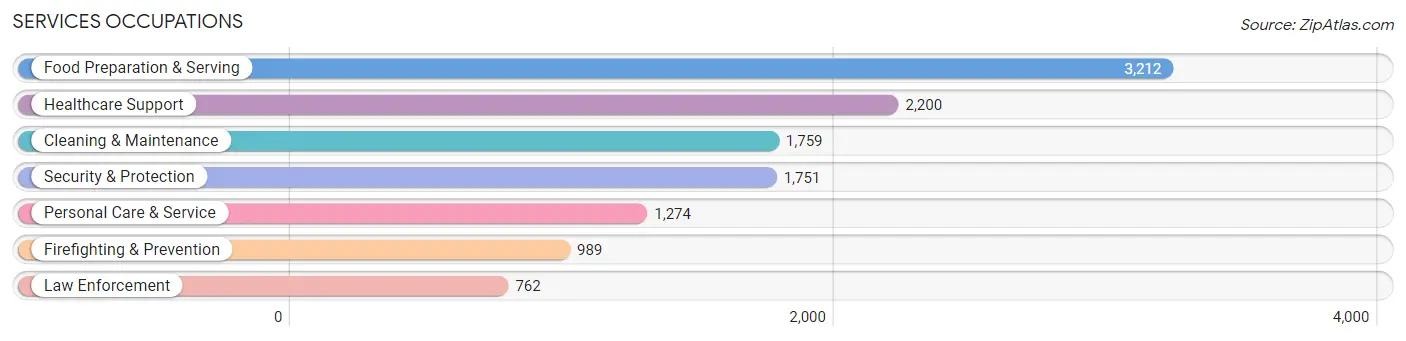
Services Occupations
The most common Services occupations in Springfield are Food Preparation & Serving (3,212 | 6.1%), Healthcare Support (2,200 | 4.2%), Cleaning & Maintenance (1,759 | 3.4%), Security & Protection (1,751 | 3.4%), and Personal Care & Service (1,274 | 2.4%).
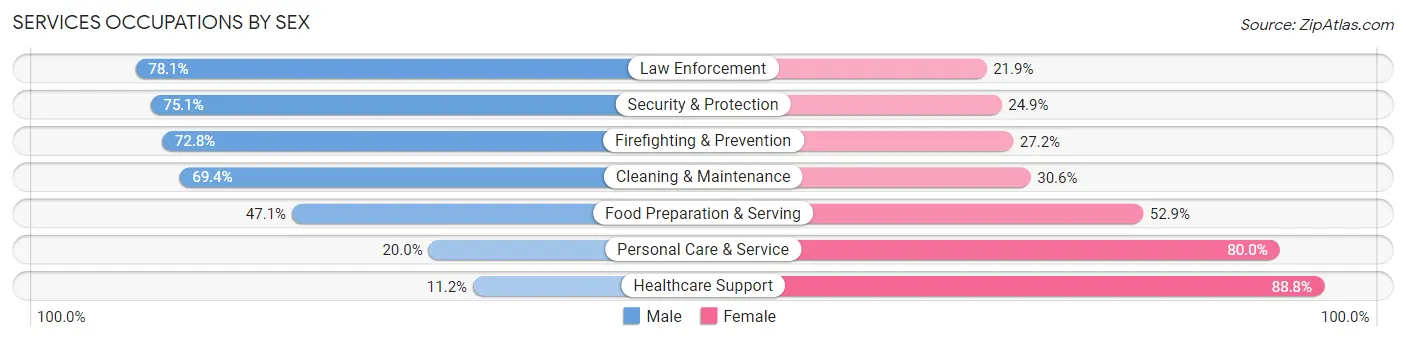
Services Occupations by Sex
Within the Services occupations in Springfield, the most male-oriented occupations are Law Enforcement (78.1%), Security & Protection (75.1%), and Firefighting & Prevention (72.8%), while the most female-oriented occupations are Healthcare Support (88.8%), Personal Care & Service (80.0%), and Food Preparation & Serving (52.9%).
| Occupation | Male | Female |
| Healthcare Support | 247 (11.2%) | 1,953 (88.8%) |
| Security & Protection | 1,315 (75.1%) | 436 (24.9%) |
| Firefighting & Prevention | 720 (72.8%) | 269 (27.2%) |
| Law Enforcement | 595 (78.1%) | 167 (21.9%) |
| Food Preparation & Serving | 1,512 (47.1%) | 1,700 (52.9%) |
| Cleaning & Maintenance | 1,220 (69.4%) | 539 (30.6%) |
| Personal Care & Service | 255 (20.0%) | 1,019 (80.0%) |
| Total (Category) | 4,549 (44.6%) | 5,647 (55.4%) |
| Total (Overall) | 25,929 (49.6%) | 26,314 (50.4%) |
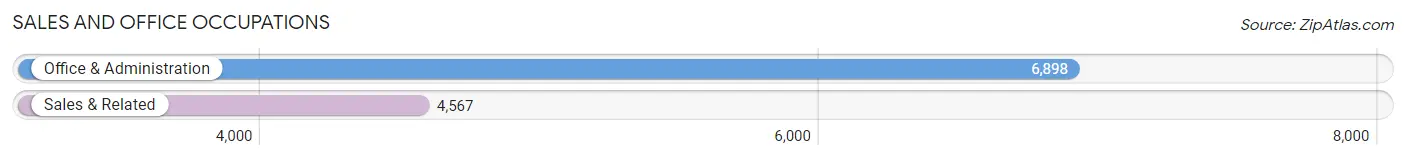
Sales and Office Occupations
The most common Sales and Office occupations in Springfield are Office & Administration (6,898 | 13.2%), and Sales & Related (4,567 | 8.7%).
Sales and Office Occupations by Sex
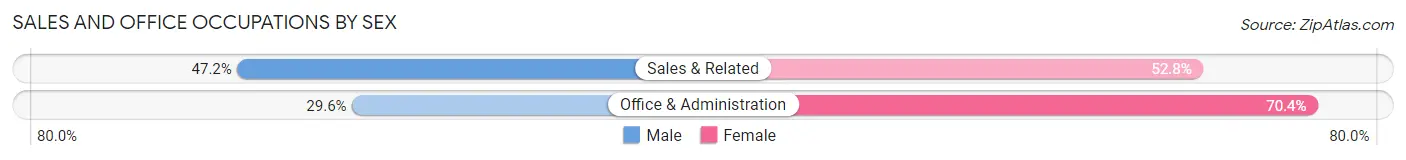
| Occupation | Male | Female |
| Sales & Related | 2,157 (47.2%) | 2,410 (52.8%) |
| Office & Administration | 2,040 (29.6%) | 4,858 (70.4%) |
| Total (Category) | 4,197 (36.6%) | 7,268 (63.4%) |
| Total (Overall) | 25,929 (49.6%) | 26,314 (50.4%) |
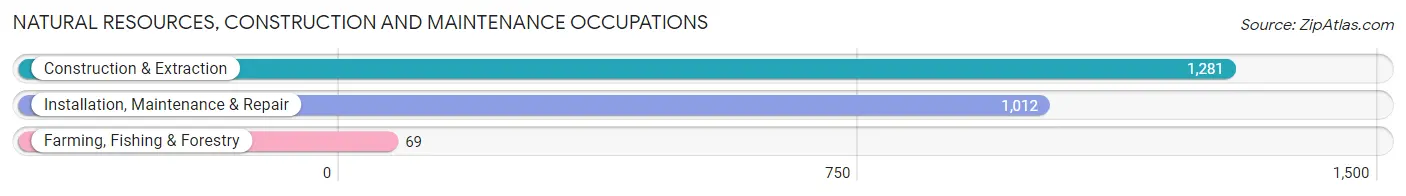
Natural Resources, Construction and Maintenance Occupations
The most common Natural Resources, Construction and Maintenance occupations in Springfield are Construction & Extraction (1,281 | 2.5%), Installation, Maintenance & Repair (1,012 | 1.9%), and Farming, Fishing & Forestry (69 | 0.1%).
Natural Resources, Construction and Maintenance Occupations by Sex
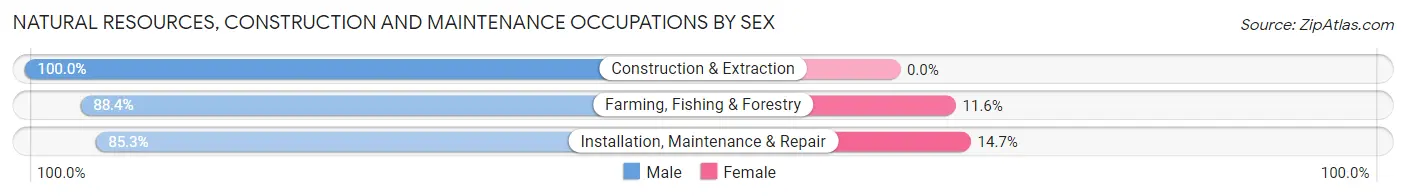
| Occupation | Male | Female |
| Farming, Fishing & Forestry | 61 (88.4%) | 8 (11.6%) |
| Construction & Extraction | 1,281 (100.0%) | 0 (0.0%) |
| Installation, Maintenance & Repair | 863 (85.3%) | 149 (14.7%) |
| Total (Category) | 2,205 (93.3%) | 157 (6.7%) |
| Total (Overall) | 25,929 (49.6%) | 26,314 (50.4%) |
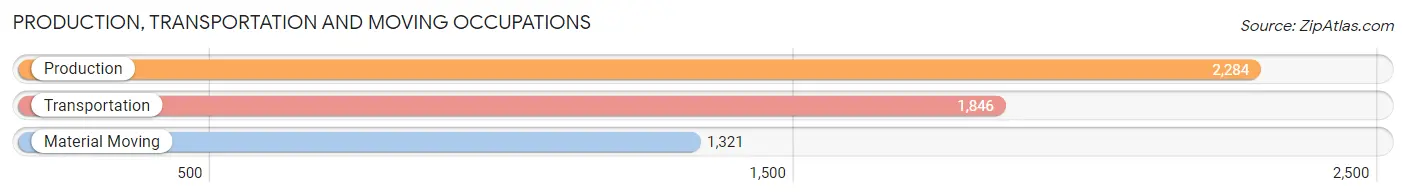
Production, Transportation and Moving Occupations
The most common Production, Transportation and Moving occupations in Springfield are Production (2,284 | 4.4%), Transportation (1,846 | 3.5%), and Material Moving (1,321 | 2.5%).
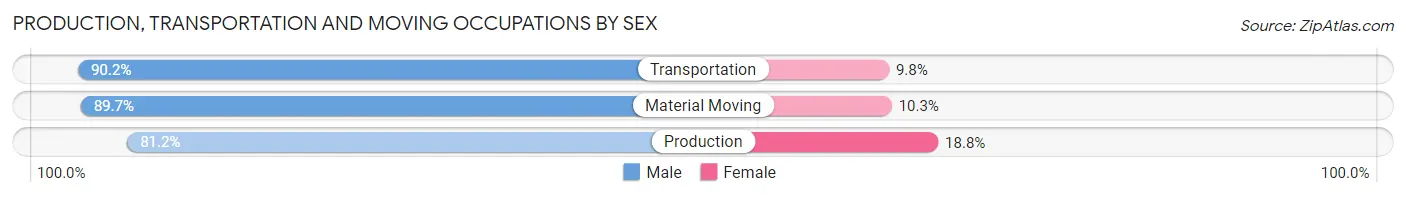
Production, Transportation and Moving Occupations by Sex
| Occupation | Male | Female |
| Production | 1,854 (81.2%) | 430 (18.8%) |
| Transportation | 1,665 (90.2%) | 181 (9.8%) |
| Material Moving | 1,185 (89.7%) | 136 (10.3%) |
| Total (Category) | 4,704 (86.3%) | 747 (13.7%) |
| Total (Overall) | 25,929 (49.6%) | 26,314 (50.4%) |
Employment Industries by Sex in Springfield
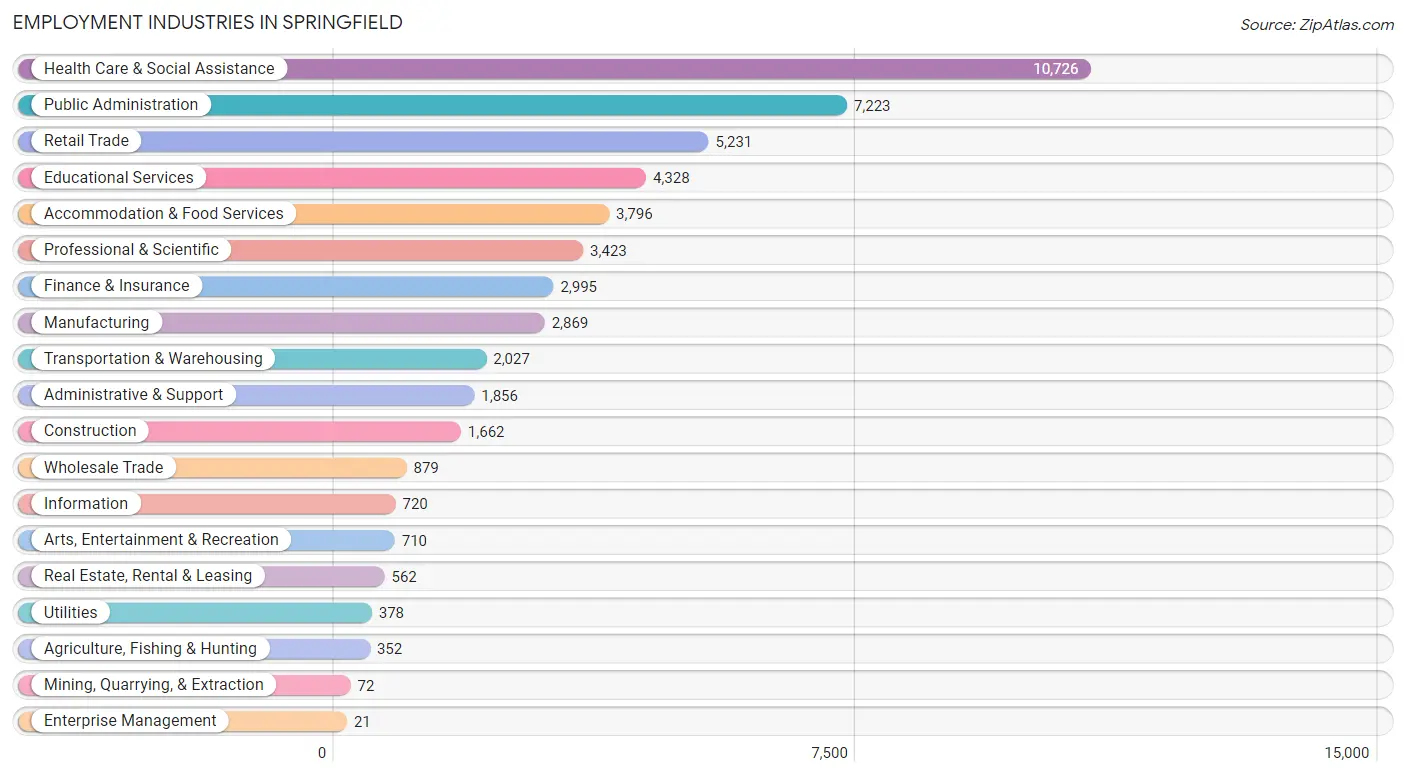
Employment Industries in Springfield
The major employment industries in Springfield include Health Care & Social Assistance (10,726 | 20.5%), Public Administration (7,223 | 13.8%), Retail Trade (5,231 | 10.0%), Educational Services (4,328 | 8.3%), and Accommodation & Food Services (3,796 | 7.3%).
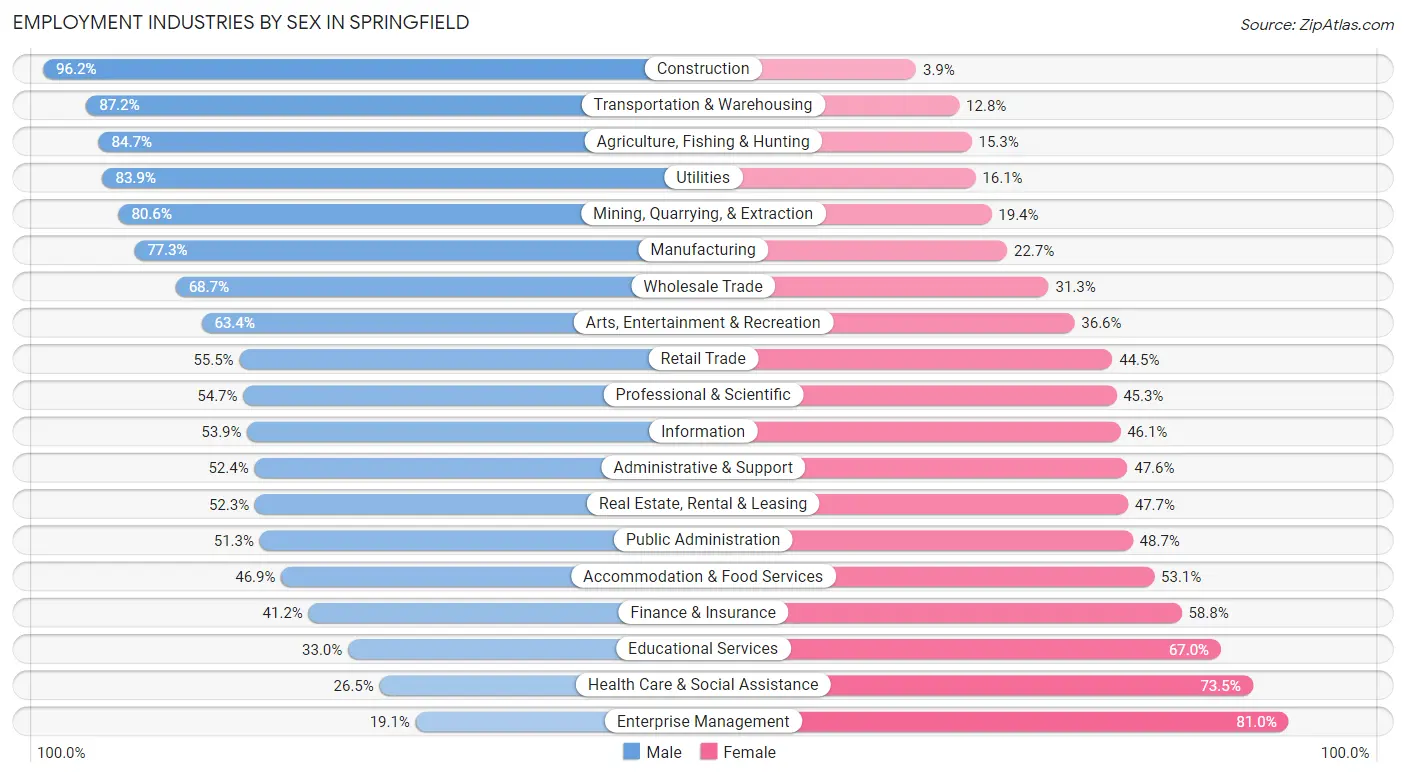
Employment Industries by Sex in Springfield
The Springfield industries that see more men than women are Construction (96.2%), Transportation & Warehousing (87.2%), and Agriculture, Fishing & Hunting (84.7%), whereas the industries that tend to have a higher number of women are Enterprise Management (80.9%), Health Care & Social Assistance (73.5%), and Educational Services (67.0%).
| Industry | Male | Female |
| Agriculture, Fishing & Hunting | 298 (84.7%) | 54 (15.3%) |
| Mining, Quarrying, & Extraction | 58 (80.6%) | 14 (19.4%) |
| Construction | 1,598 (96.2%) | 64 (3.8%) |
| Manufacturing | 2,218 (77.3%) | 651 (22.7%) |
| Wholesale Trade | 604 (68.7%) | 275 (31.3%) |
| Retail Trade | 2,905 (55.5%) | 2,326 (44.5%) |
| Transportation & Warehousing | 1,768 (87.2%) | 259 (12.8%) |
| Utilities | 317 (83.9%) | 61 (16.1%) |
| Information | 388 (53.9%) | 332 (46.1%) |
| Finance & Insurance | 1,234 (41.2%) | 1,761 (58.8%) |
| Real Estate, Rental & Leasing | 294 (52.3%) | 268 (47.7%) |
| Professional & Scientific | 1,873 (54.7%) | 1,550 (45.3%) |
| Enterprise Management | 4 (19.1%) | 17 (80.9%) |
| Administrative & Support | 973 (52.4%) | 883 (47.6%) |
| Educational Services | 1,430 (33.0%) | 2,898 (67.0%) |
| Health Care & Social Assistance | 2,845 (26.5%) | 7,881 (73.5%) |
| Arts, Entertainment & Recreation | 450 (63.4%) | 260 (36.6%) |
| Accommodation & Food Services | 1,779 (46.9%) | 2,017 (53.1%) |
| Public Administration | 3,706 (51.3%) | 3,517 (48.7%) |
| Total | 25,929 (49.6%) | 26,314 (50.4%) |
Education in Springfield
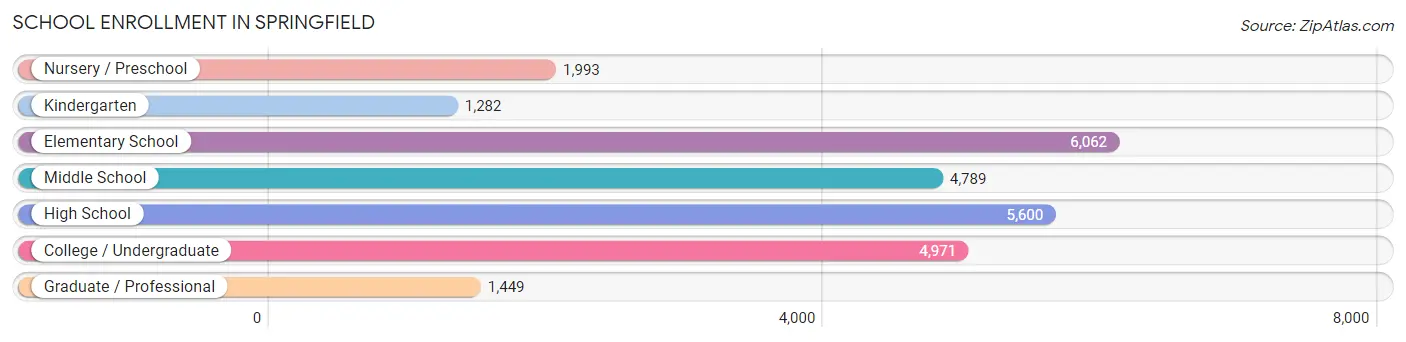
School Enrollment in Springfield
The most common levels of schooling among the 26,146 students in Springfield are elementary school (6,062 | 23.2%), high school (5,600 | 21.4%), and college / undergraduate (4,971 | 19.0%).
| School Level | # Students | % Students |
| Nursery / Preschool | 1,993 | 7.6% |
| Kindergarten | 1,282 | 4.9% |
| Elementary School | 6,062 | 23.2% |
| Middle School | 4,789 | 18.3% |
| High School | 5,600 | 21.4% |
| College / Undergraduate | 4,971 | 19.0% |
| Graduate / Professional | 1,449 | 5.5% |
| Total | 26,146 | 100.0% |
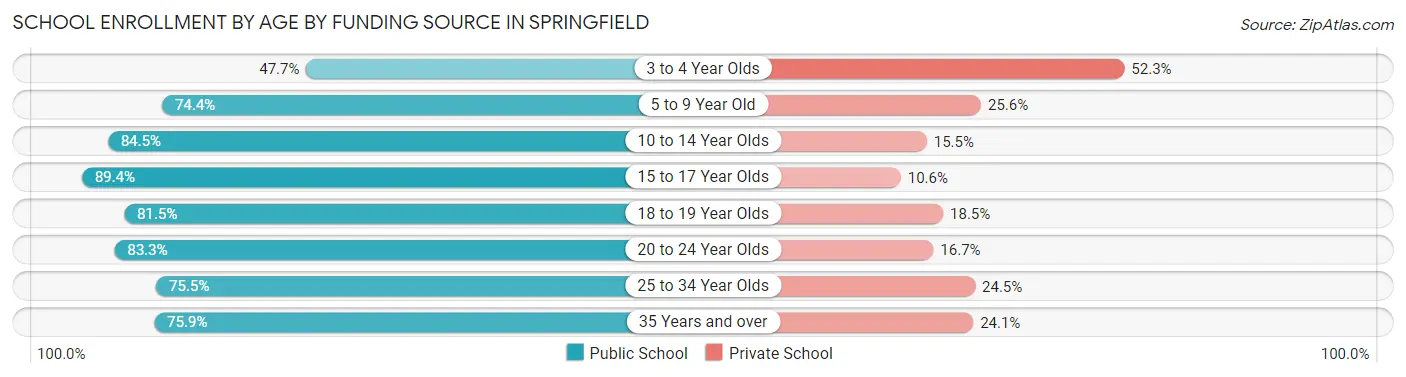
School Enrollment by Age by Funding Source in Springfield
Out of a total of 26,146 students who are enrolled in schools in Springfield, 5,465 (20.9%) attend a private institution, while the remaining 20,681 (79.1%) are enrolled in public schools. The age group of 3 to 4 year olds has the highest likelihood of being enrolled in private schools, with 809 (52.3% in the age bracket) enrolled. Conversely, the age group of 15 to 17 year olds has the lowest likelihood of being enrolled in a private school, with 3,560 (89.4% in the age bracket) attending a public institution.
| Age Bracket | Public School | Private School |
| 3 to 4 Year Olds | 738 (47.7%) | 809 (52.3%) |
| 5 to 9 Year Old | 5,013 (74.4%) | 1,724 (25.6%) |
| 10 to 14 Year Olds | 5,525 (84.5%) | 1,012 (15.5%) |
| 15 to 17 Year Olds | 3,560 (89.4%) | 424 (10.6%) |
| 18 to 19 Year Olds | 1,839 (81.5%) | 418 (18.5%) |
| 20 to 24 Year Olds | 1,884 (83.3%) | 378 (16.7%) |
| 25 to 34 Year Olds | 1,283 (75.5%) | 416 (24.5%) |
| 35 Years and over | 852 (75.9%) | 271 (24.1%) |
| Total | 20,681 (79.1%) | 5,465 (20.9%) |
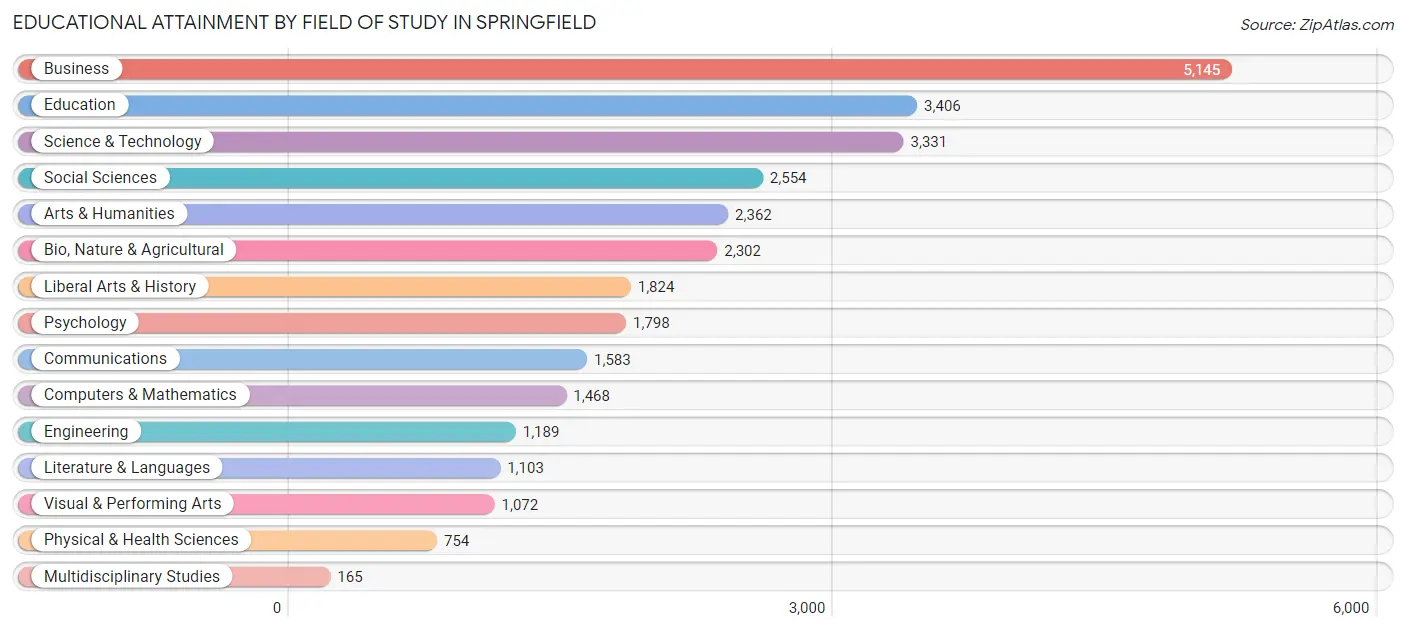
Educational Attainment by Field of Study in Springfield
Business (5,145 | 17.1%), education (3,406 | 11.3%), science & technology (3,331 | 11.1%), social sciences (2,554 | 8.5%), and arts & humanities (2,362 | 7.9%) are the most common fields of study among 30,056 individuals in Springfield who have obtained a bachelor's degree or higher.
| Field of Study | # Graduates | % Graduates |
| Computers & Mathematics | 1,468 | 4.9% |
| Bio, Nature & Agricultural | 2,302 | 7.7% |
| Physical & Health Sciences | 754 | 2.5% |
| Psychology | 1,798 | 6.0% |
| Social Sciences | 2,554 | 8.5% |
| Engineering | 1,189 | 4.0% |
| Multidisciplinary Studies | 165 | 0.5% |
| Science & Technology | 3,331 | 11.1% |
| Business | 5,145 | 17.1% |
| Education | 3,406 | 11.3% |
| Literature & Languages | 1,103 | 3.7% |
| Liberal Arts & History | 1,824 | 6.1% |
| Visual & Performing Arts | 1,072 | 3.6% |
| Communications | 1,583 | 5.3% |
| Arts & Humanities | 2,362 | 7.9% |
| Total | 30,056 | 100.0% |
Transportation & Commute in Springfield
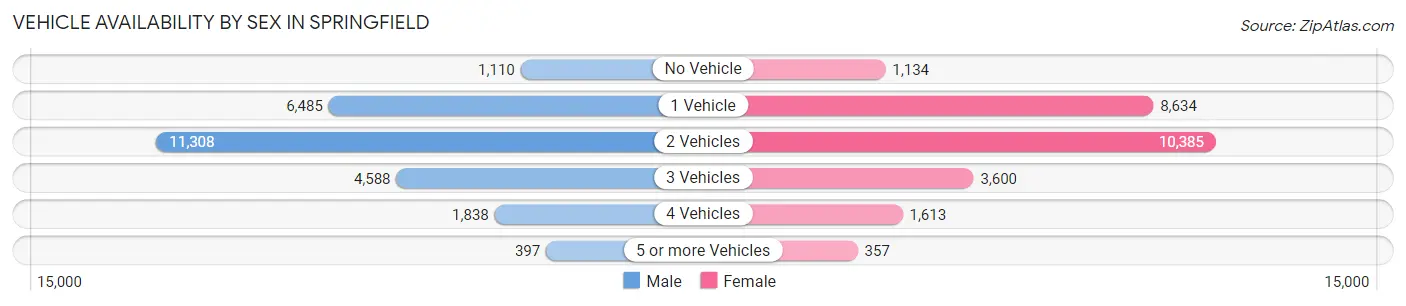
Vehicle Availability by Sex in Springfield
The most prevalent vehicle ownership categories in Springfield are males with 2 vehicles (11,308, accounting for 44.0%) and females with 2 vehicles (10,385, making up 44.0%).
| Vehicles Available | Male | Female |
| No Vehicle | 1,110 (4.3%) | 1,134 (4.4%) |
| 1 Vehicle | 6,485 (25.2%) | 8,634 (33.6%) |
| 2 Vehicles | 11,308 (44.0%) | 10,385 (40.4%) |
| 3 Vehicles | 4,588 (17.8%) | 3,600 (14.0%) |
| 4 Vehicles | 1,838 (7.1%) | 1,613 (6.3%) |
| 5 or more Vehicles | 397 (1.5%) | 357 (1.4%) |
| Total | 25,726 (100.0%) | 25,723 (100.0%) |
Commute Time in Springfield
The most frequently occuring commute durations in Springfield are 15 to 19 minutes (13,771 commuters, 29.7%), 10 to 14 minutes (10,946 commuters, 23.6%), and 20 to 24 minutes (7,192 commuters, 15.5%).
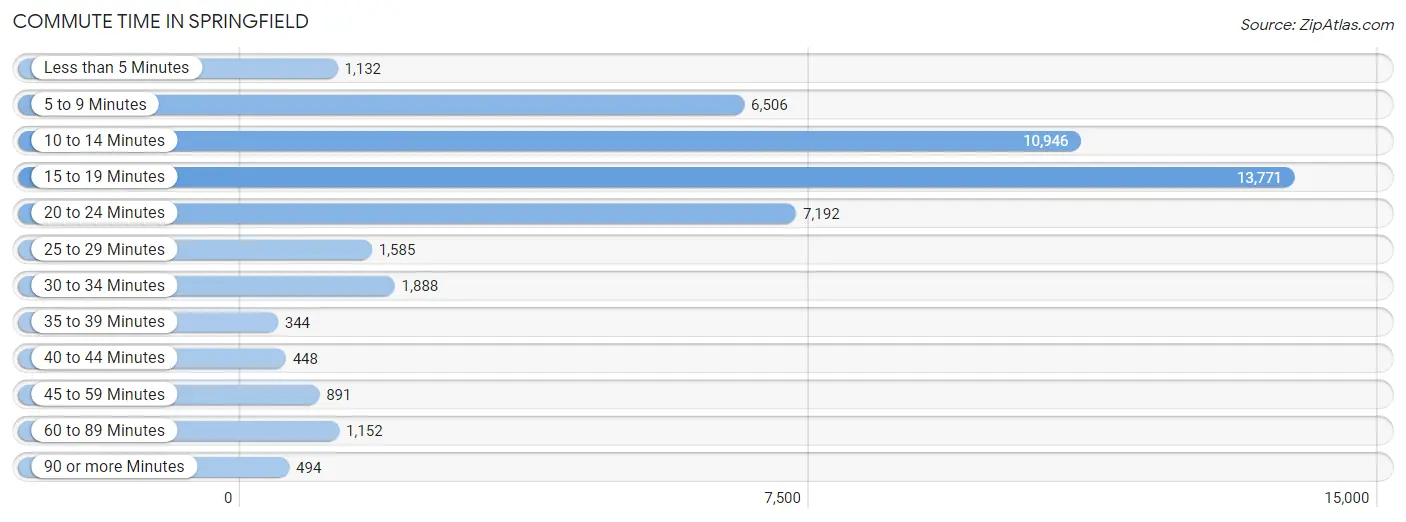
| Commute Time | # Commuters | % Commuters |
| Less than 5 Minutes | 1,132 | 2.4% |
| 5 to 9 Minutes | 6,506 | 14.0% |
| 10 to 14 Minutes | 10,946 | 23.6% |
| 15 to 19 Minutes | 13,771 | 29.7% |
| 20 to 24 Minutes | 7,192 | 15.5% |
| 25 to 29 Minutes | 1,585 | 3.4% |
| 30 to 34 Minutes | 1,888 | 4.1% |
| 35 to 39 Minutes | 344 | 0.7% |
| 40 to 44 Minutes | 448 | 1.0% |
| 45 to 59 Minutes | 891 | 1.9% |
| 60 to 89 Minutes | 1,152 | 2.5% |
| 90 or more Minutes | 494 | 1.1% |
Commute Time by Sex in Springfield
The most common commute times in Springfield are 15 to 19 minutes (6,892 commuters, 29.2%) for males and 15 to 19 minutes (6,879 commuters, 30.3%) for females.
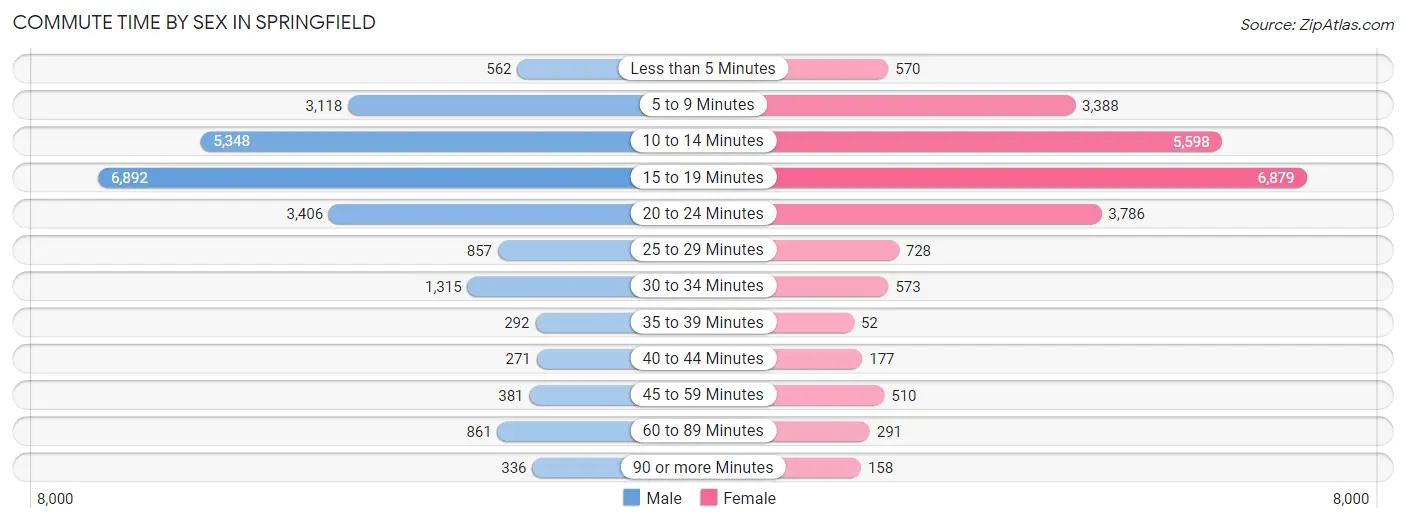
| Commute Time | Male | Female |
| Less than 5 Minutes | 562 (2.4%) | 570 (2.5%) |
| 5 to 9 Minutes | 3,118 (13.2%) | 3,388 (14.9%) |
| 10 to 14 Minutes | 5,348 (22.6%) | 5,598 (24.6%) |
| 15 to 19 Minutes | 6,892 (29.2%) | 6,879 (30.3%) |
| 20 to 24 Minutes | 3,406 (14.4%) | 3,786 (16.7%) |
| 25 to 29 Minutes | 857 (3.6%) | 728 (3.2%) |
| 30 to 34 Minutes | 1,315 (5.6%) | 573 (2.5%) |
| 35 to 39 Minutes | 292 (1.2%) | 52 (0.2%) |
| 40 to 44 Minutes | 271 (1.1%) | 177 (0.8%) |
| 45 to 59 Minutes | 381 (1.6%) | 510 (2.2%) |
| 60 to 89 Minutes | 861 (3.6%) | 291 (1.3%) |
| 90 or more Minutes | 336 (1.4%) | 158 (0.7%) |
Time of Departure to Work by Sex in Springfield
The most frequent times of departure to work in Springfield are 7:30 AM to 7:59 AM (4,444, 18.8%) for males and 7:30 AM to 7:59 AM (4,325, 19.0%) for females.
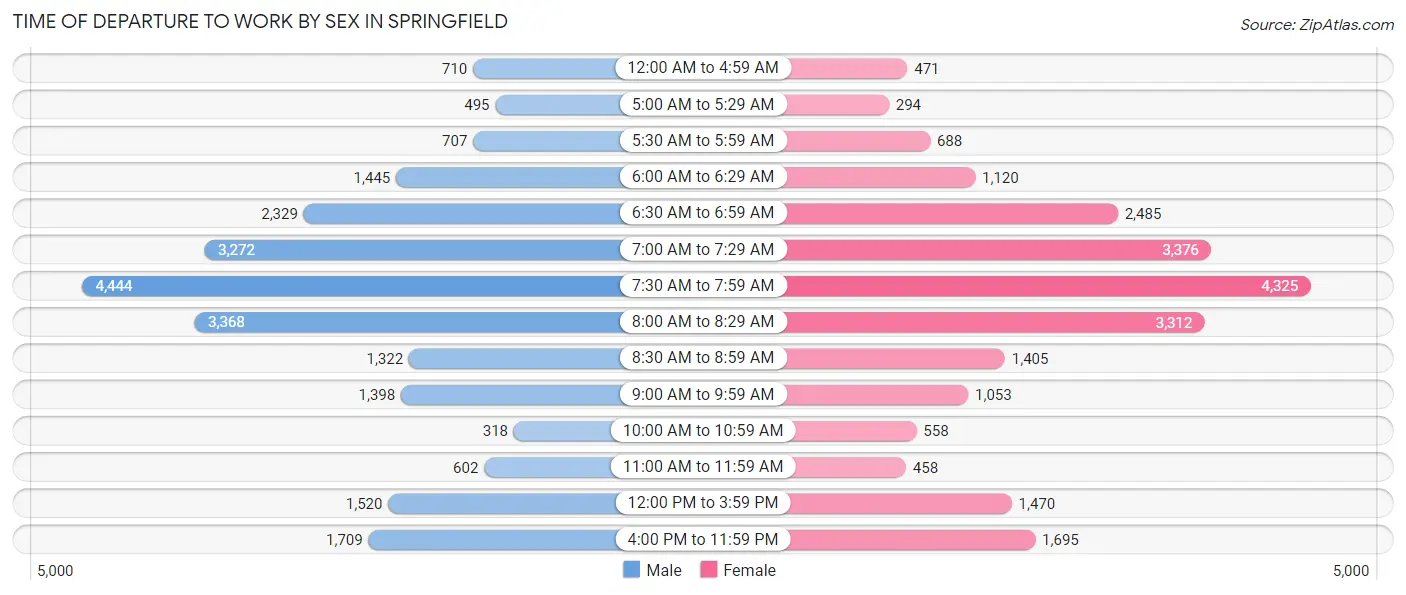
| Time of Departure | Male | Female |
| 12:00 AM to 4:59 AM | 710 (3.0%) | 471 (2.1%) |
| 5:00 AM to 5:29 AM | 495 (2.1%) | 294 (1.3%) |
| 5:30 AM to 5:59 AM | 707 (3.0%) | 688 (3.0%) |
| 6:00 AM to 6:29 AM | 1,445 (6.1%) | 1,120 (4.9%) |
| 6:30 AM to 6:59 AM | 2,329 (9.9%) | 2,485 (10.9%) |
| 7:00 AM to 7:29 AM | 3,272 (13.8%) | 3,376 (14.9%) |
| 7:30 AM to 7:59 AM | 4,444 (18.8%) | 4,325 (19.0%) |
| 8:00 AM to 8:29 AM | 3,368 (14.2%) | 3,312 (14.6%) |
| 8:30 AM to 8:59 AM | 1,322 (5.6%) | 1,405 (6.2%) |
| 9:00 AM to 9:59 AM | 1,398 (5.9%) | 1,053 (4.6%) |
| 10:00 AM to 10:59 AM | 318 (1.3%) | 558 (2.5%) |
| 11:00 AM to 11:59 AM | 602 (2.5%) | 458 (2.0%) |
| 12:00 PM to 3:59 PM | 1,520 (6.4%) | 1,470 (6.5%) |
| 4:00 PM to 11:59 PM | 1,709 (7.2%) | 1,695 (7.5%) |
| Total | 23,639 (100.0%) | 22,710 (100.0%) |
Housing Occupancy in Springfield
Occupancy by Ownership in Springfield
Of the total 50,686 dwellings in Springfield, owner-occupied units account for 31,627 (62.4%), while renter-occupied units make up 19,059 (37.6%).
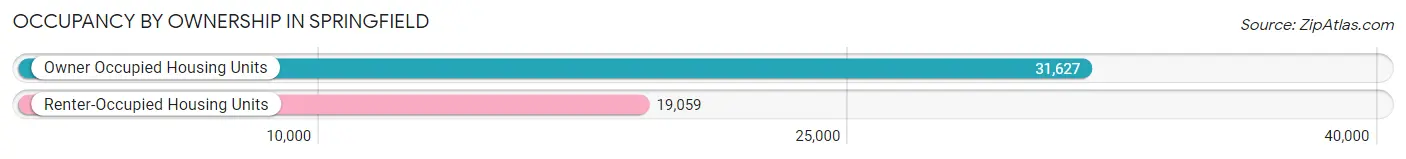
| Occupancy | # Housing Units | % Housing Units |
| Owner Occupied Housing Units | 31,627 | 62.4% |
| Renter-Occupied Housing Units | 19,059 | 37.6% |
| Total Occupied Housing Units | 50,686 | 100.0% |
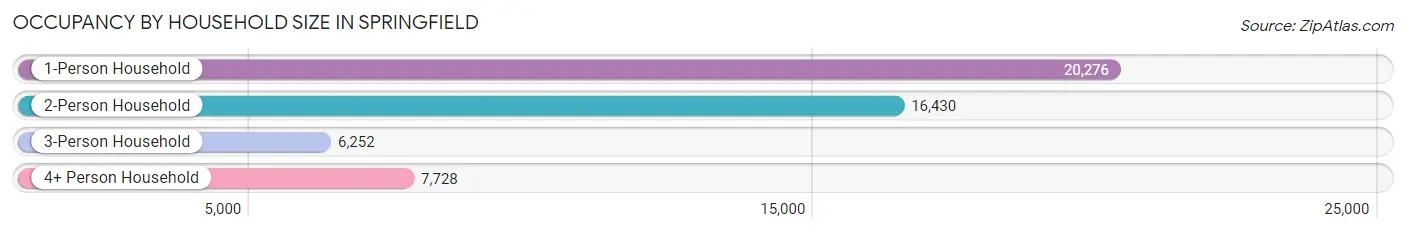
Occupancy by Household Size in Springfield
| Household Size | # Housing Units | % Housing Units |
| 1-Person Household | 20,276 | 40.0% |
| 2-Person Household | 16,430 | 32.4% |
| 3-Person Household | 6,252 | 12.3% |
| 4+ Person Household | 7,728 | 15.2% |
| Total Housing Units | 50,686 | 100.0% |
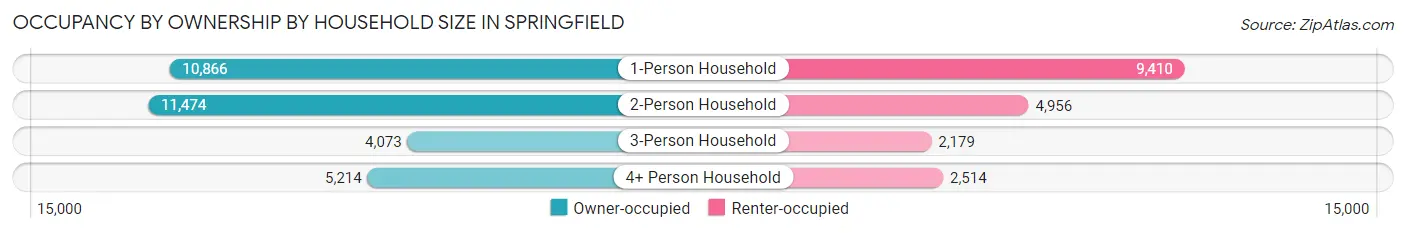
Occupancy by Ownership by Household Size in Springfield
| Household Size | Owner-occupied | Renter-occupied |
| 1-Person Household | 10,866 (53.6%) | 9,410 (46.4%) |
| 2-Person Household | 11,474 (69.8%) | 4,956 (30.2%) |
| 3-Person Household | 4,073 (65.1%) | 2,179 (34.8%) |
| 4+ Person Household | 5,214 (67.5%) | 2,514 (32.5%) |
| Total Housing Units | 31,627 (62.4%) | 19,059 (37.6%) |
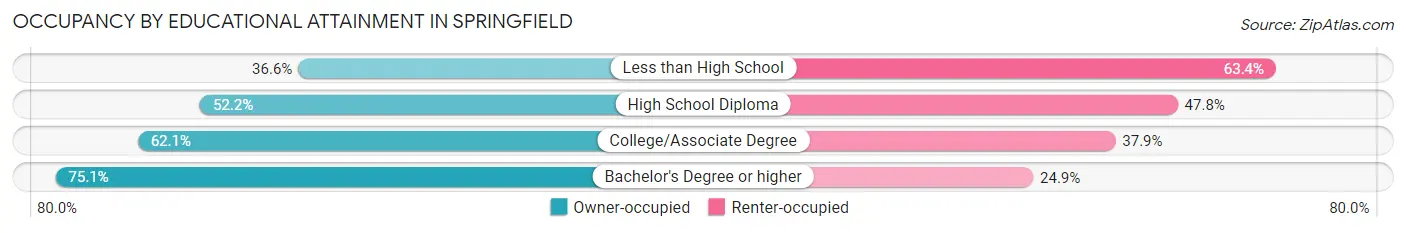
Occupancy by Educational Attainment in Springfield
| Household Size | Owner-occupied | Renter-occupied |
| Less than High School | 1,316 (36.6%) | 2,279 (63.4%) |
| High School Diploma | 6,893 (52.2%) | 6,318 (47.8%) |
| College/Associate Degree | 9,655 (62.1%) | 5,902 (37.9%) |
| Bachelor's Degree or higher | 13,763 (75.1%) | 4,560 (24.9%) |
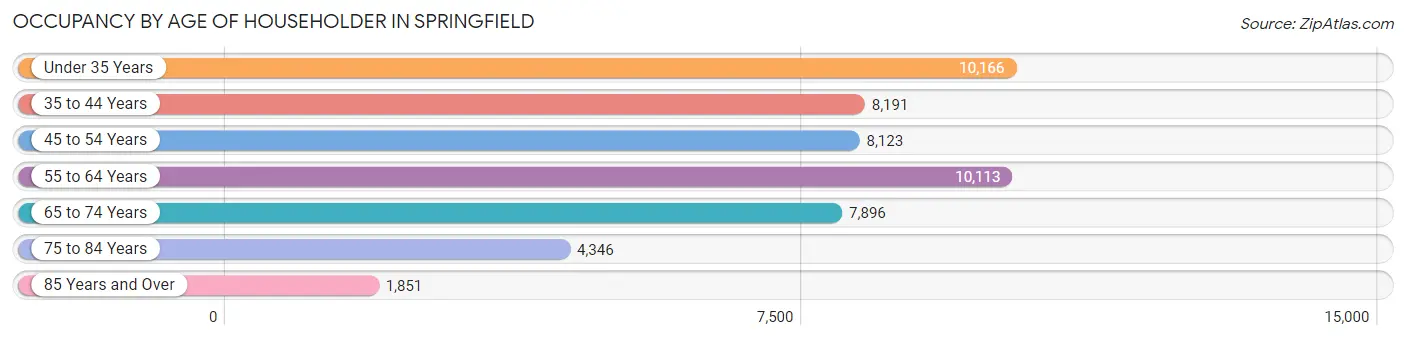
Occupancy by Age of Householder in Springfield
| Age Bracket | # Households | % Households |
| Under 35 Years | 10,166 | 20.1% |
| 35 to 44 Years | 8,191 | 16.2% |
| 45 to 54 Years | 8,123 | 16.0% |
| 55 to 64 Years | 10,113 | 20.0% |
| 65 to 74 Years | 7,896 | 15.6% |
| 75 to 84 Years | 4,346 | 8.6% |
| 85 Years and Over | 1,851 | 3.6% |
| Total | 50,686 | 100.0% |
Housing Finances in Springfield
Median Income by Occupancy in Springfield
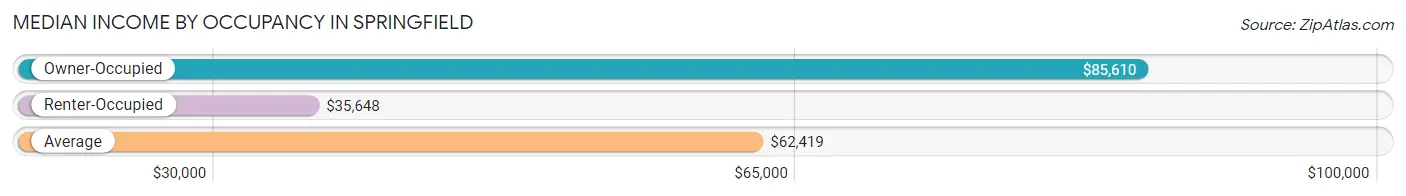
| Occupancy Type | # Households | Median Income |
| Owner-Occupied | 31,627 (62.4%) | $85,610 |
| Renter-Occupied | 19,059 (37.6%) | $35,648 |
| Average | 50,686 (100.0%) | $62,419 |
Occupancy by Householder Income Bracket in Springfield
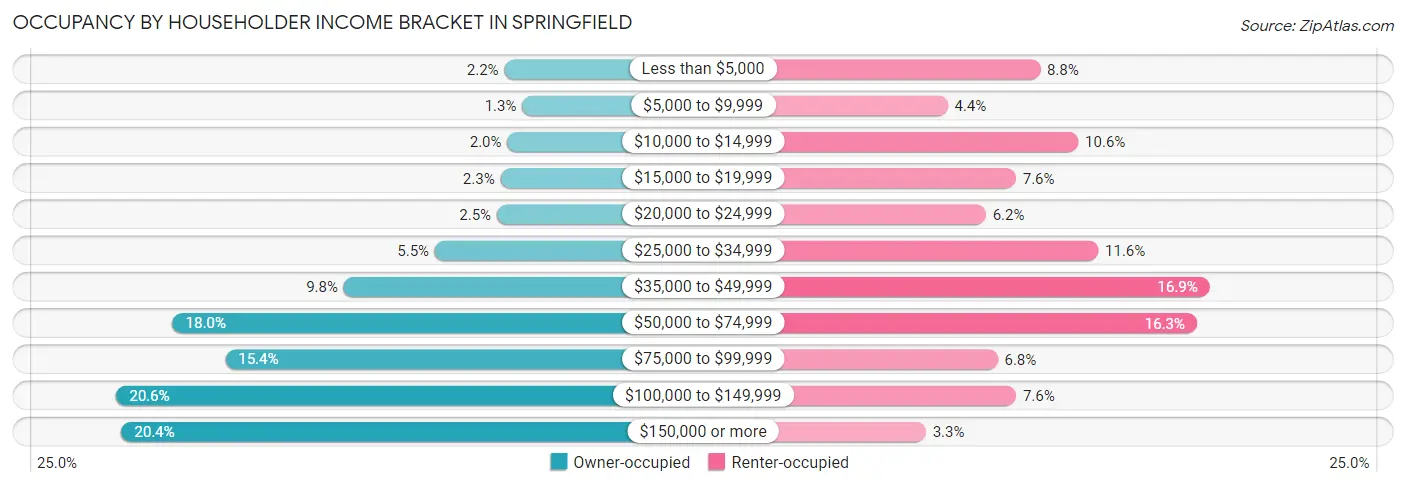
| Income Bracket | Owner-occupied | Renter-occupied |
| Less than $5,000 | 680 (2.1%) | 1,674 (8.8%) |
| $5,000 to $9,999 | 410 (1.3%) | 834 (4.4%) |
| $10,000 to $14,999 | 637 (2.0%) | 2,021 (10.6%) |
| $15,000 to $19,999 | 741 (2.3%) | 1,454 (7.6%) |
| $20,000 to $24,999 | 795 (2.5%) | 1,181 (6.2%) |
| $25,000 to $34,999 | 1,728 (5.5%) | 2,202 (11.6%) |
| $35,000 to $49,999 | 3,100 (9.8%) | 3,213 (16.9%) |
| $50,000 to $74,999 | 5,678 (17.9%) | 3,098 (16.3%) |
| $75,000 to $99,999 | 4,883 (15.4%) | 1,288 (6.8%) |
| $100,000 to $149,999 | 6,525 (20.6%) | 1,457 (7.6%) |
| $150,000 or more | 6,450 (20.4%) | 637 (3.3%) |
| Total | 31,627 (100.0%) | 19,059 (100.0%) |
Monthly Housing Cost Tiers in Springfield
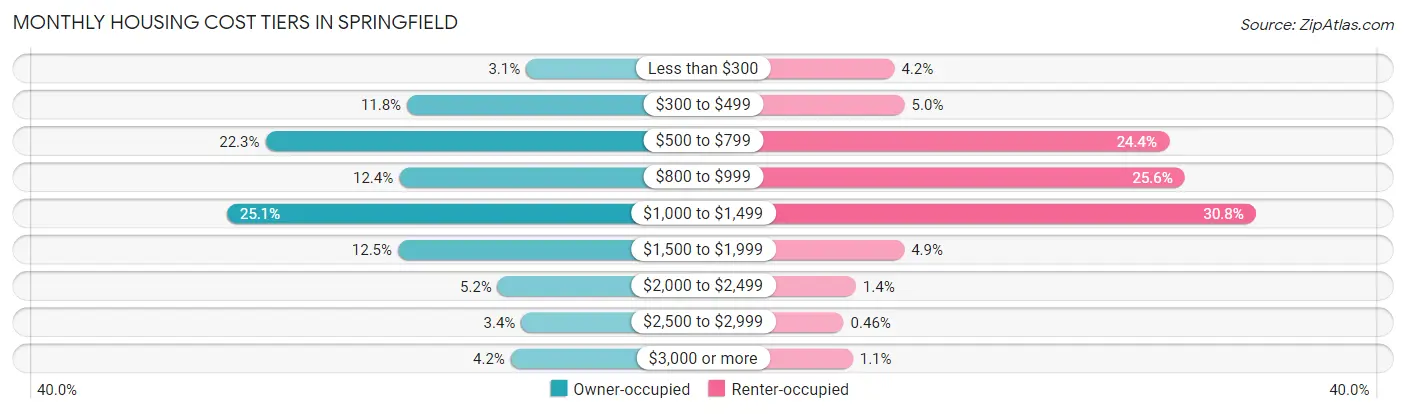
| Monthly Cost | Owner-occupied | Renter-occupied |
| Less than $300 | 972 (3.1%) | 801 (4.2%) |
| $300 to $499 | 3,745 (11.8%) | 943 (5.0%) |
| $500 to $799 | 7,044 (22.3%) | 4,650 (24.4%) |
| $800 to $999 | 3,927 (12.4%) | 4,872 (25.6%) |
| $1,000 to $1,499 | 7,937 (25.1%) | 5,869 (30.8%) |
| $1,500 to $1,999 | 3,957 (12.5%) | 938 (4.9%) |
| $2,000 to $2,499 | 1,632 (5.2%) | 259 (1.4%) |
| $2,500 to $2,999 | 1,084 (3.4%) | 88 (0.5%) |
| $3,000 or more | 1,329 (4.2%) | 216 (1.1%) |
| Total | 31,627 (100.0%) | 19,059 (100.0%) |
Physical Housing Characteristics in Springfield
Housing Structures in Springfield
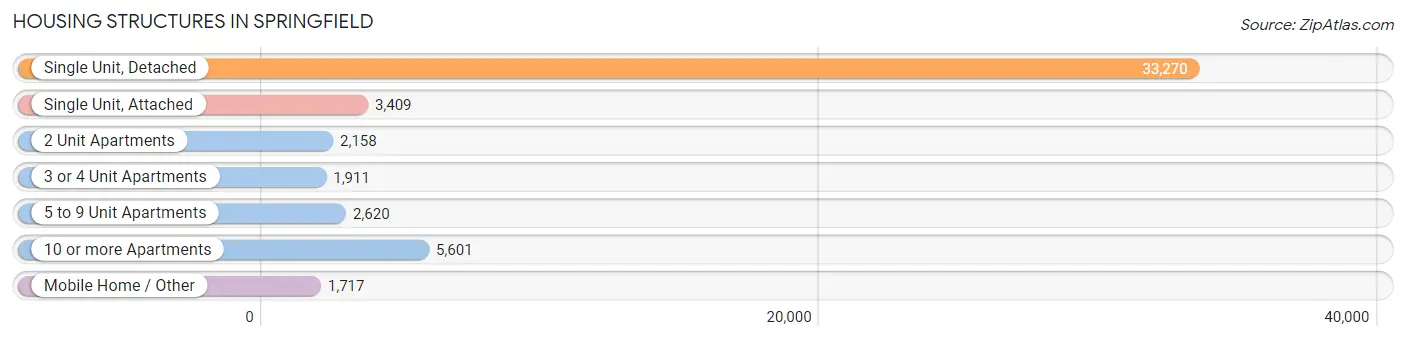
| Structure Type | # Housing Units | % Housing Units |
| Single Unit, Detached | 33,270 | 65.6% |
| Single Unit, Attached | 3,409 | 6.7% |
| 2 Unit Apartments | 2,158 | 4.3% |
| 3 or 4 Unit Apartments | 1,911 | 3.8% |
| 5 to 9 Unit Apartments | 2,620 | 5.2% |
| 10 or more Apartments | 5,601 | 11.1% |
| Mobile Home / Other | 1,717 | 3.4% |
| Total | 50,686 | 100.0% |
Housing Structures by Occupancy in Springfield
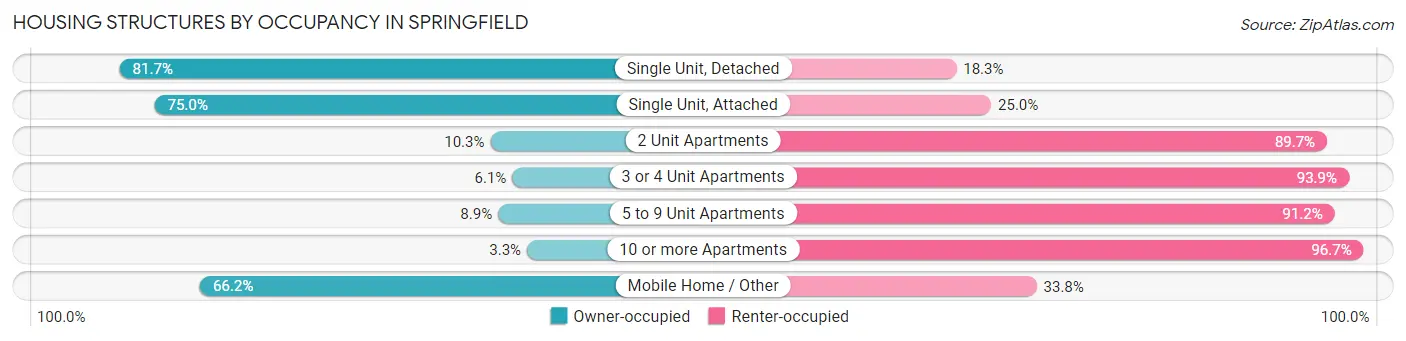
| Structure Type | Owner-occupied | Renter-occupied |
| Single Unit, Detached | 27,178 (81.7%) | 6,092 (18.3%) |
| Single Unit, Attached | 2,556 (75.0%) | 853 (25.0%) |
| 2 Unit Apartments | 223 (10.3%) | 1,935 (89.7%) |
| 3 or 4 Unit Apartments | 117 (6.1%) | 1,794 (93.9%) |
| 5 to 9 Unit Apartments | 232 (8.8%) | 2,388 (91.1%) |
| 10 or more Apartments | 184 (3.3%) | 5,417 (96.7%) |
| Mobile Home / Other | 1,137 (66.2%) | 580 (33.8%) |
| Total | 31,627 (62.4%) | 19,059 (37.6%) |
Housing Structures by Number of Rooms in Springfield
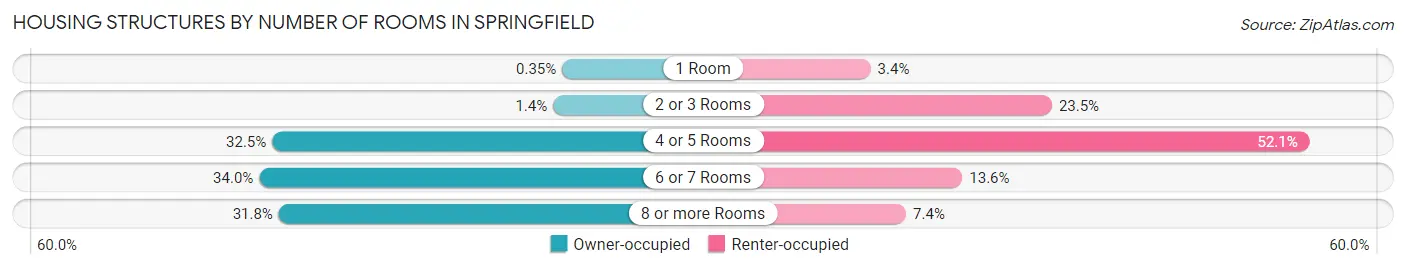
| Number of Rooms | Owner-occupied | Renter-occupied |
| 1 Room | 110 (0.4%) | 649 (3.4%) |
| 2 or 3 Rooms | 427 (1.3%) | 4,485 (23.5%) |
| 4 or 5 Rooms | 10,287 (32.5%) | 9,933 (52.1%) |
| 6 or 7 Rooms | 10,745 (34.0%) | 2,591 (13.6%) |
| 8 or more Rooms | 10,058 (31.8%) | 1,401 (7.3%) |
| Total | 31,627 (100.0%) | 19,059 (100.0%) |
Housing Structure by Heating Type in Springfield
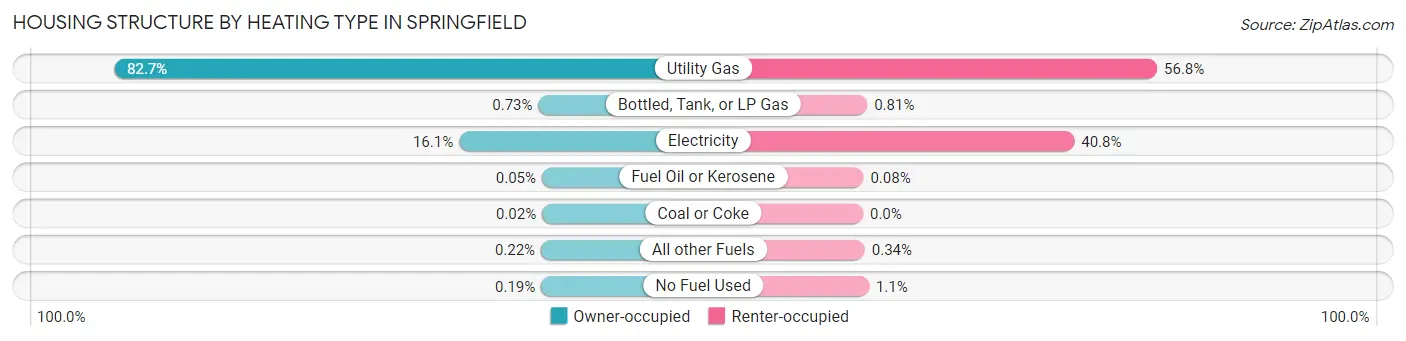
| Heating Type | Owner-occupied | Renter-occupied |
| Utility Gas | 26,165 (82.7%) | 10,829 (56.8%) |
| Bottled, Tank, or LP Gas | 230 (0.7%) | 154 (0.8%) |
| Electricity | 5,079 (16.1%) | 7,779 (40.8%) |
| Fuel Oil or Kerosene | 15 (0.1%) | 15 (0.1%) |
| Coal or Coke | 7 (0.0%) | 0 (0.0%) |
| All other Fuels | 71 (0.2%) | 65 (0.3%) |
| No Fuel Used | 60 (0.2%) | 217 (1.1%) |
| Total | 31,627 (100.0%) | 19,059 (100.0%) |
Household Vehicle Usage in Springfield
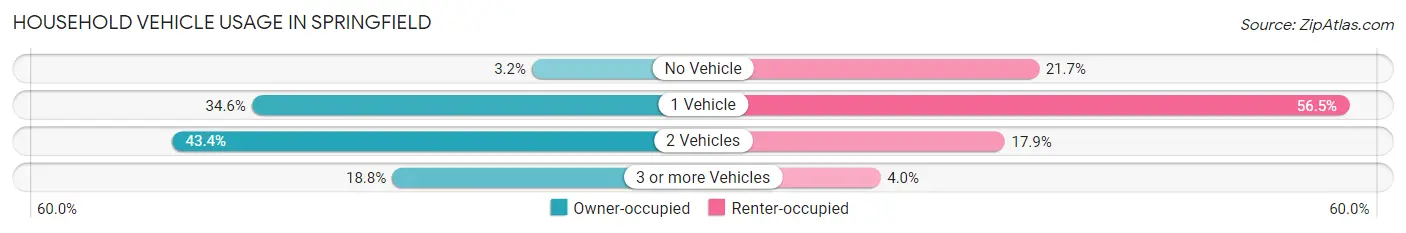
| Vehicles per Household | Owner-occupied | Renter-occupied |
| No Vehicle | 1,007 (3.2%) | 4,138 (21.7%) |
| 1 Vehicle | 10,934 (34.6%) | 10,759 (56.5%) |
| 2 Vehicles | 13,729 (43.4%) | 3,408 (17.9%) |
| 3 or more Vehicles | 5,957 (18.8%) | 754 (4.0%) |
| Total | 31,627 (100.0%) | 19,059 (100.0%) |
Real Estate & Mortgages in Springfield
Real Estate and Mortgage Overview in Springfield
| Characteristic | Without Mortgage | With Mortgage |
| Housing Units | 13,173 | 18,454 |
| Median Property Value | $139,000 | $154,100 |
| Median Household Income | $72,290 | $4,033 |
| Monthly Housing Costs | $588 | $1,226 |
| Real Estate Taxes | $2,818 | $189 |
Property Value by Mortgage Status in Springfield
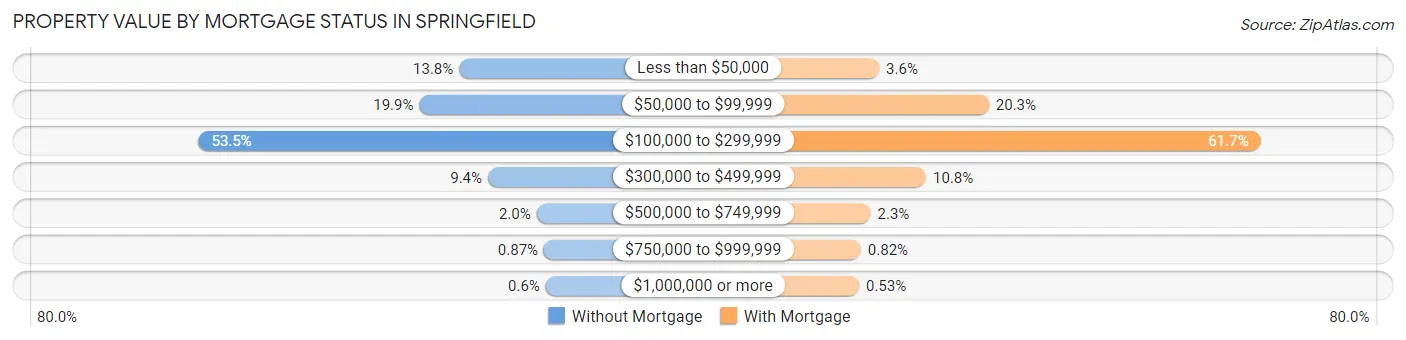
| Property Value | Without Mortgage | With Mortgage |
| Less than $50,000 | 1,817 (13.8%) | 664 (3.6%) |
| $50,000 to $99,999 | 2,616 (19.9%) | 3,748 (20.3%) |
| $100,000 to $299,999 | 7,047 (53.5%) | 11,387 (61.7%) |
| $300,000 to $499,999 | 1,239 (9.4%) | 1,983 (10.7%) |
| $500,000 to $749,999 | 261 (2.0%) | 424 (2.3%) |
| $750,000 to $999,999 | 114 (0.9%) | 151 (0.8%) |
| $1,000,000 or more | 79 (0.6%) | 97 (0.5%) |
| Total | 13,173 (100.0%) | 18,454 (100.0%) |
Household Income by Mortgage Status in Springfield
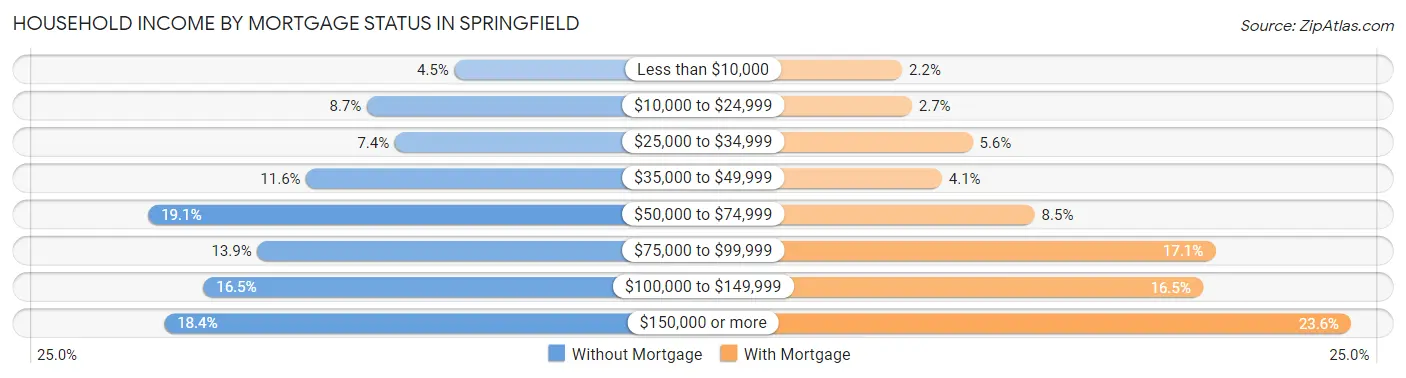
| Household Income | Without Mortgage | With Mortgage |
| Less than $10,000 | 595 (4.5%) | 409 (2.2%) |
| $10,000 to $24,999 | 1,145 (8.7%) | 495 (2.7%) |
| $25,000 to $34,999 | 969 (7.4%) | 1,028 (5.6%) |
| $35,000 to $49,999 | 1,525 (11.6%) | 759 (4.1%) |
| $50,000 to $74,999 | 2,518 (19.1%) | 1,575 (8.5%) |
| $75,000 to $99,999 | 1,832 (13.9%) | 3,160 (17.1%) |
| $100,000 to $149,999 | 2,172 (16.5%) | 3,051 (16.5%) |
| $150,000 or more | 2,417 (18.3%) | 4,353 (23.6%) |
| Total | 13,173 (100.0%) | 18,454 (100.0%) |
Property Value to Household Income Ratio in Springfield
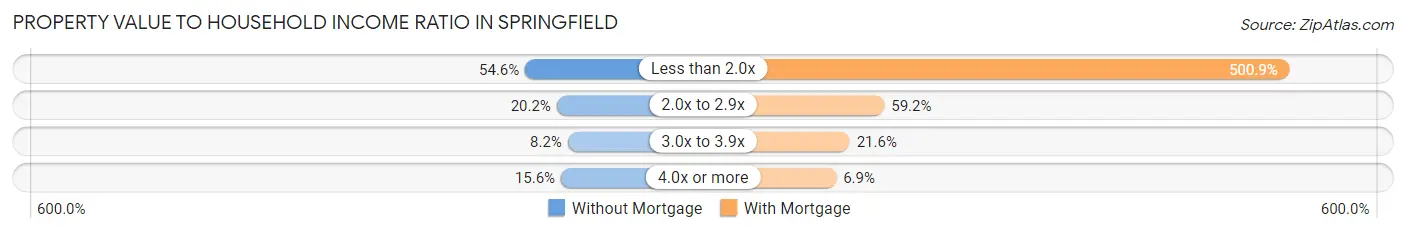
| Value-to-Income Ratio | Without Mortgage | With Mortgage |
| Less than 2.0x | 7,193 (54.6%) | 92,436 (500.9%) |
| 2.0x to 2.9x | 2,658 (20.2%) | 10,932 (59.2%) |
| 3.0x to 3.9x | 1,079 (8.2%) | 3,986 (21.6%) |
| 4.0x or more | 2,049 (15.5%) | 1,270 (6.9%) |
| Total | 13,173 (100.0%) | 18,454 (100.0%) |
Real Estate Taxes by Mortgage Status in Springfield
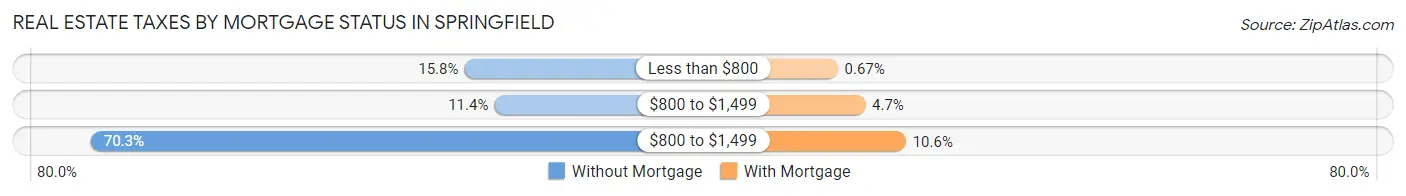
| Property Taxes | Without Mortgage | With Mortgage |
| Less than $800 | 2,075 (15.8%) | 123 (0.7%) |
| $800 to $1,499 | 1,499 (11.4%) | 864 (4.7%) |
| $800 to $1,499 | 9,263 (70.3%) | 1,960 (10.6%) |
| Total | 13,173 (100.0%) | 18,454 (100.0%) |
Health & Disability in Springfield
Health Insurance Coverage by Age in Springfield
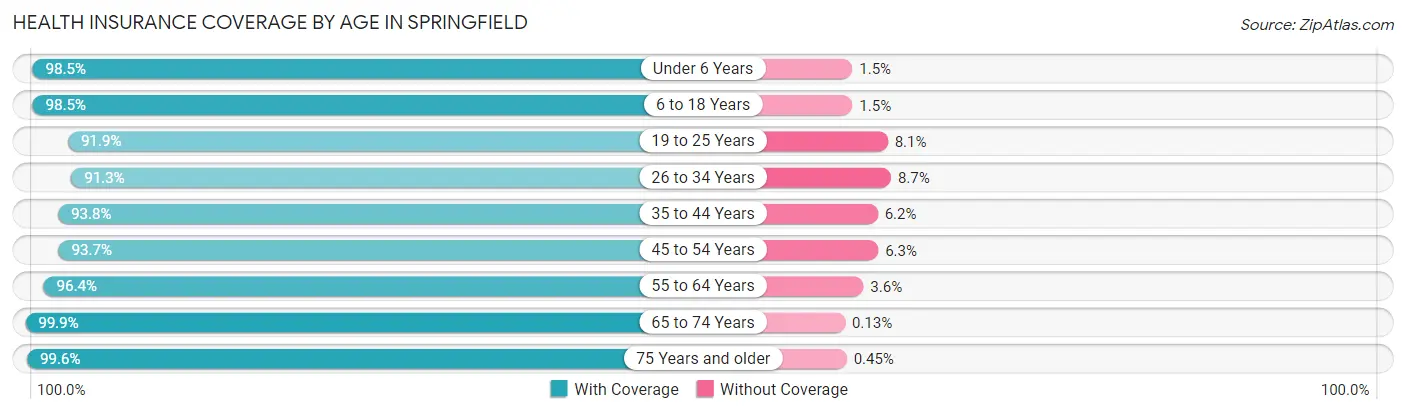
| Age Bracket | With Coverage | Without Coverage |
| Under 6 Years | 7,796 (98.5%) | 119 (1.5%) |
| 6 to 18 Years | 17,930 (98.5%) | 275 (1.5%) |
| 19 to 25 Years | 8,874 (91.9%) | 782 (8.1%) |
| 26 to 34 Years | 12,514 (91.3%) | 1,194 (8.7%) |
| 35 to 44 Years | 12,857 (93.8%) | 854 (6.2%) |
| 45 to 54 Years | 12,544 (93.7%) | 847 (6.3%) |
| 55 to 64 Years | 14,865 (96.4%) | 549 (3.6%) |
| 65 to 74 Years | 12,264 (99.9%) | 16 (0.1%) |
| 75 Years and older | 8,363 (99.6%) | 38 (0.4%) |
| Total | 108,007 (95.9%) | 4,674 (4.2%) |
Health Insurance Coverage by Citizenship Status in Springfield
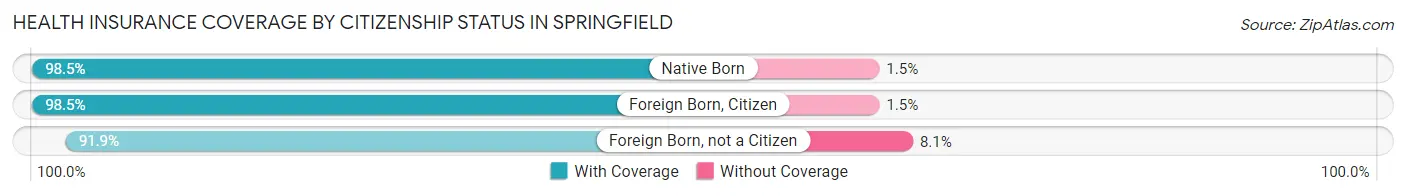
| Citizenship Status | With Coverage | Without Coverage |
| Native Born | 7,796 (98.5%) | 119 (1.5%) |
| Foreign Born, Citizen | 17,930 (98.5%) | 275 (1.5%) |
| Foreign Born, not a Citizen | 8,874 (91.9%) | 782 (8.1%) |
Health Insurance Coverage by Household Income in Springfield
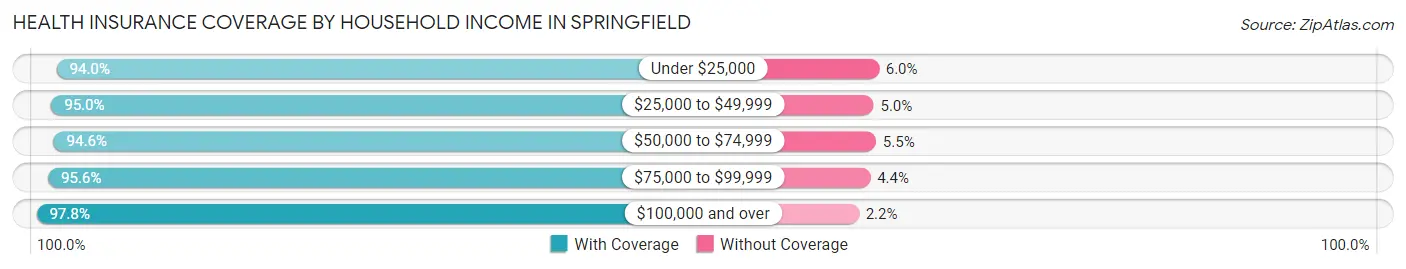
| Household Income | With Coverage | Without Coverage |
| Under $25,000 | 16,727 (94.0%) | 1,066 (6.0%) |
| $25,000 to $49,999 | 18,214 (95.0%) | 960 (5.0%) |
| $50,000 to $74,999 | 16,565 (94.6%) | 955 (5.4%) |
| $75,000 to $99,999 | 13,483 (95.6%) | 619 (4.4%) |
| $100,000 and over | 41,207 (97.8%) | 940 (2.2%) |
Public vs Private Health Insurance Coverage by Age in Springfield
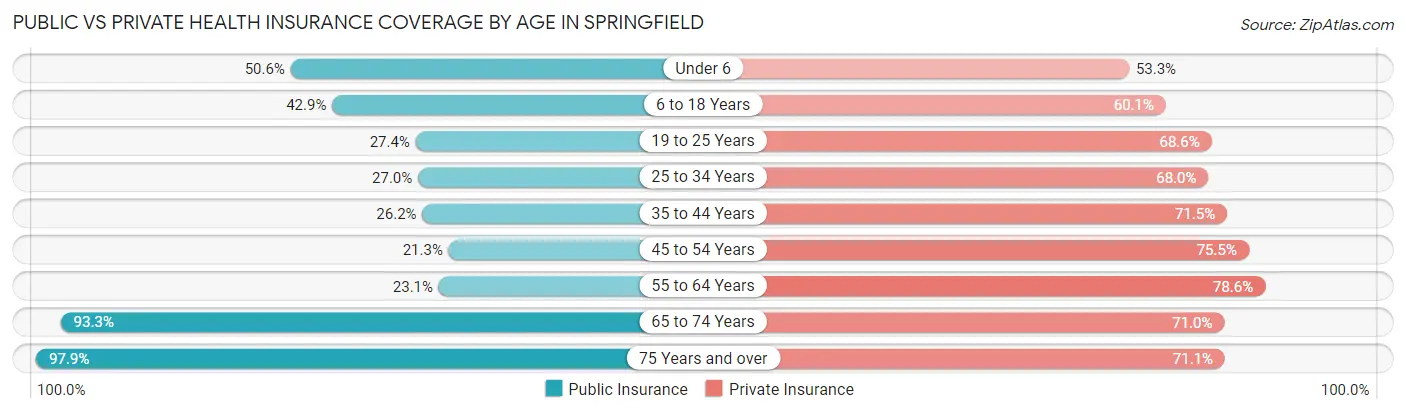
| Age Bracket | Public Insurance | Private Insurance |
| Under 6 | 4,006 (50.6%) | 4,219 (53.3%) |
| 6 to 18 Years | 7,810 (42.9%) | 10,946 (60.1%) |
| 19 to 25 Years | 2,647 (27.4%) | 6,626 (68.6%) |
| 25 to 34 Years | 3,696 (27.0%) | 9,324 (68.0%) |
| 35 to 44 Years | 3,587 (26.2%) | 9,804 (71.5%) |
| 45 to 54 Years | 2,848 (21.3%) | 10,114 (75.5%) |
| 55 to 64 Years | 3,562 (23.1%) | 12,108 (78.5%) |
| 65 to 74 Years | 11,459 (93.3%) | 8,719 (71.0%) |
| 75 Years and over | 8,223 (97.9%) | 5,973 (71.1%) |
| Total | 47,838 (42.4%) | 77,833 (69.1%) |
Disability Status by Sex by Age in Springfield
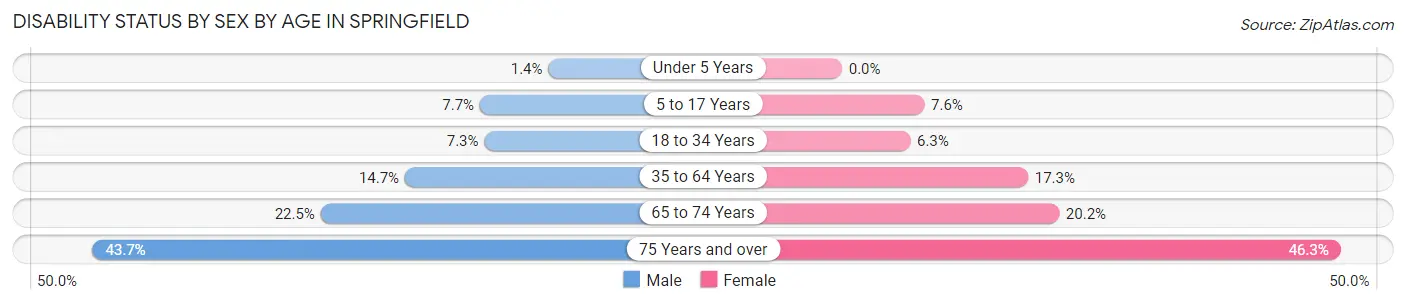
| Age Bracket | Male | Female |
| Under 5 Years | 52 (1.4%) | 0 (0.0%) |
| 5 to 17 Years | 713 (7.7%) | 654 (7.6%) |
| 18 to 34 Years | 897 (7.3%) | 803 (6.3%) |
| 35 to 64 Years | 2,993 (14.7%) | 3,825 (17.3%) |
| 65 to 74 Years | 1,248 (22.5%) | 1,358 (20.2%) |
| 75 Years and over | 1,360 (43.7%) | 2,449 (46.3%) |
Disability Class by Sex by Age in Springfield
Disability Class: Hearing Difficulty
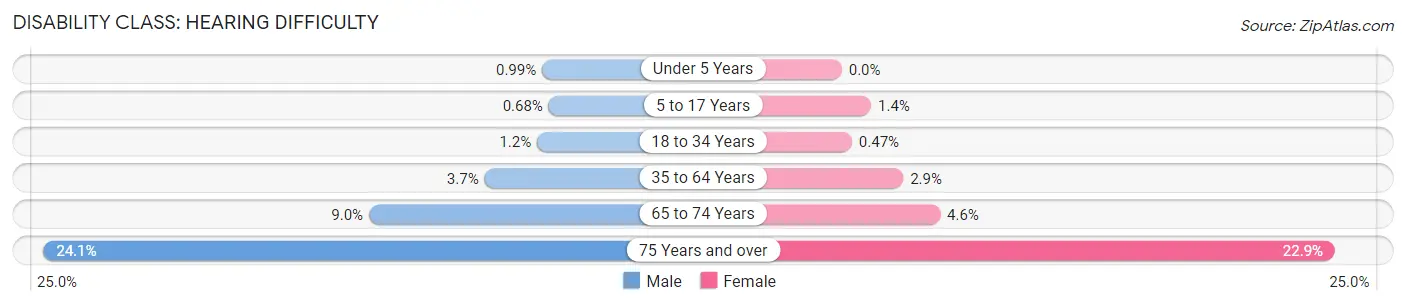
| Age Bracket | Male | Female |
| Under 5 Years | 37 (1.0%) | 0 (0.0%) |
| 5 to 17 Years | 63 (0.7%) | 116 (1.4%) |
| 18 to 34 Years | 149 (1.2%) | 59 (0.5%) |
| 35 to 64 Years | 744 (3.7%) | 632 (2.9%) |
| 65 to 74 Years | 500 (9.0%) | 307 (4.6%) |
| 75 Years and over | 751 (24.1%) | 1,210 (22.9%) |
Disability Class: Vision Difficulty
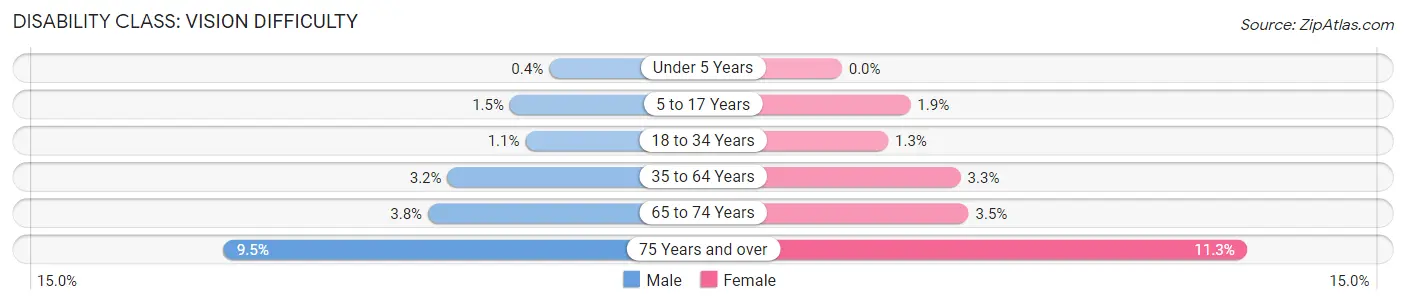
| Age Bracket | Male | Female |
| Under 5 Years | 15 (0.4%) | 0 (0.0%) |
| 5 to 17 Years | 137 (1.5%) | 163 (1.9%) |
| 18 to 34 Years | 130 (1.1%) | 163 (1.3%) |
| 35 to 64 Years | 657 (3.2%) | 733 (3.3%) |
| 65 to 74 Years | 209 (3.8%) | 238 (3.5%) |
| 75 Years and over | 294 (9.5%) | 596 (11.3%) |
Disability Class: Cognitive Difficulty
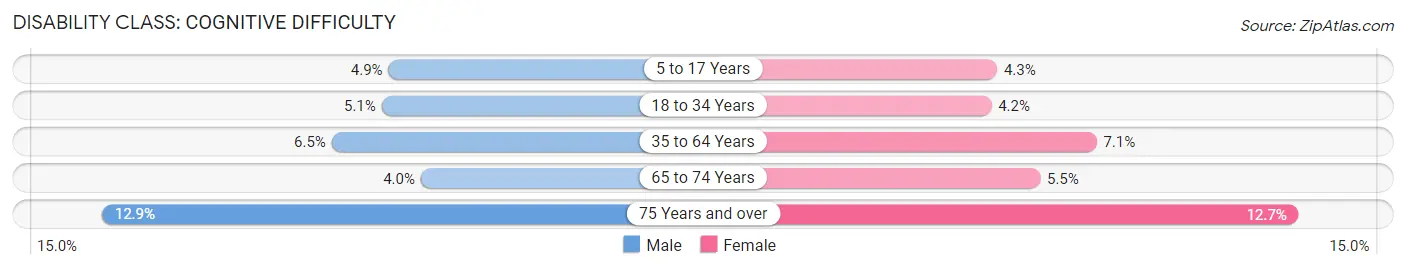
| Age Bracket | Male | Female |
| 5 to 17 Years | 448 (4.9%) | 370 (4.3%) |
| 18 to 34 Years | 619 (5.1%) | 527 (4.2%) |
| 35 to 64 Years | 1,312 (6.5%) | 1,571 (7.1%) |
| 65 to 74 Years | 220 (4.0%) | 372 (5.5%) |
| 75 Years and over | 400 (12.9%) | 673 (12.7%) |
Disability Class: Ambulatory Difficulty
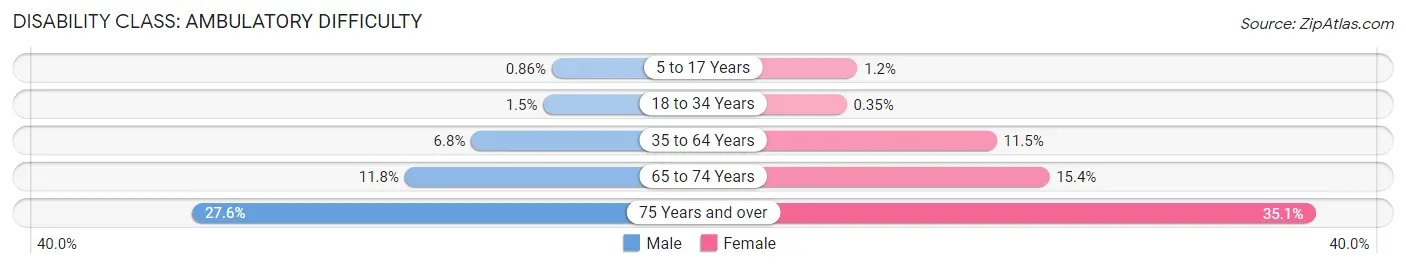
| Age Bracket | Male | Female |
| 5 to 17 Years | 79 (0.9%) | 98 (1.1%) |
| 18 to 34 Years | 182 (1.5%) | 45 (0.4%) |
| 35 to 64 Years | 1,392 (6.8%) | 2,546 (11.5%) |
| 65 to 74 Years | 652 (11.8%) | 1,038 (15.4%) |
| 75 Years and over | 858 (27.6%) | 1,858 (35.1%) |
Disability Class: Self-Care Difficulty
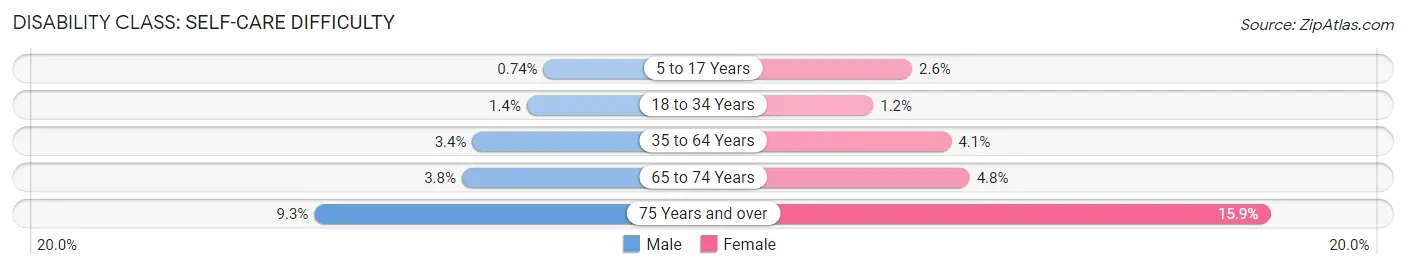
| Age Bracket | Male | Female |
| 5 to 17 Years | 68 (0.7%) | 223 (2.6%) |
| 18 to 34 Years | 167 (1.4%) | 148 (1.2%) |
| 35 to 64 Years | 687 (3.4%) | 902 (4.1%) |
| 65 to 74 Years | 209 (3.8%) | 320 (4.8%) |
| 75 Years and over | 288 (9.2%) | 841 (15.9%) |
Technology Access in Springfield
Computing Device Access in Springfield
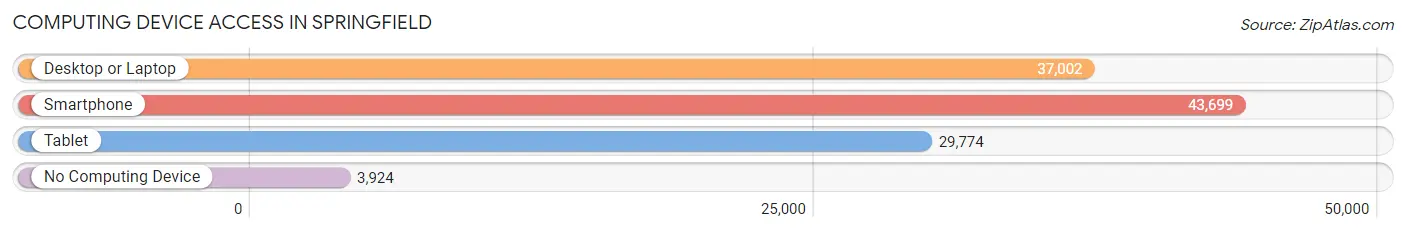
| Device Type | # Households | % Households |
| Desktop or Laptop | 37,002 | 73.0% |
| Smartphone | 43,699 | 86.2% |
| Tablet | 29,774 | 58.7% |
| No Computing Device | 3,924 | 7.7% |
| Total | 50,686 | 100.0% |
Internet Access in Springfield
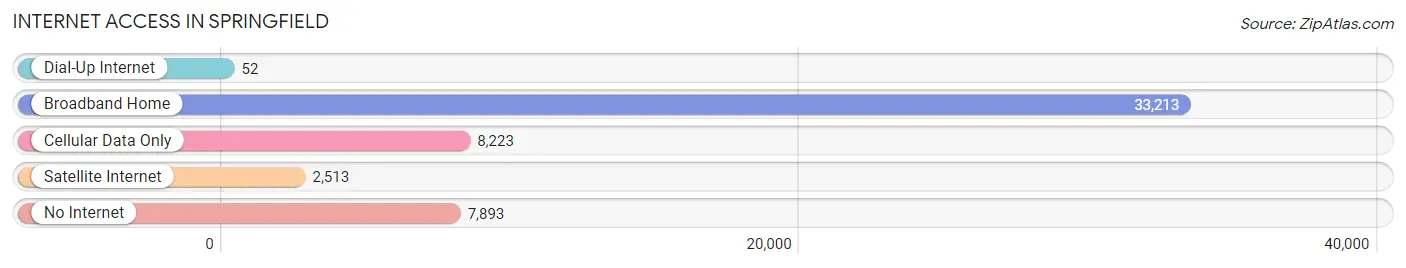
| Internet Type | # Households | % Households |
| Dial-Up Internet | 52 | 0.1% |
| Broadband Home | 33,213 | 65.5% |
| Cellular Data Only | 8,223 | 16.2% |
| Satellite Internet | 2,513 | 5.0% |
| No Internet | 7,893 | 15.6% |
| Total | 50,686 | 100.0% |
Springfield Summary
Springfield, Illinois is the capital of the state of Illinois and the county seat of Sangamon County. It is located in the central part of the state, about 90 miles northeast of St. Louis, Missouri. The city has a population of 116,250, making it the sixth most populous city in the state.
History
The area that is now Springfield was first settled in 1818 by John Kelly, a trapper and trader from Kentucky. He built a cabin on the Sangamon River, and the settlement that grew up around it was known as Calhoun. In 1821, the state of Illinois was formed, and the town was renamed Springfield after the nearby town of Springfield, Massachusetts.
In 1832, Springfield was chosen as the state capital, and the city began to grow rapidly. The Illinois State Capitol was built in 1837, and the city was incorporated in 1840. During the Civil War, Springfield was a major center of Union activity, and the city was the site of the first Lincoln-Douglas debate in 1858.
Geography
Springfield is located in the central part of the state, about 90 miles northeast of St. Louis, Missouri. The city is situated on the Sangamon River, and is surrounded by rolling hills and farmland. The city has a total area of 58.2 square miles, of which 57.7 square miles is land and 0.5 square miles is water.
Climate
Springfield has a humid continental climate, with hot, humid summers and cold, snowy winters. The average temperature in July is 81°F, and the average temperature in January is 24°F. The city receives an average of 39 inches of precipitation per year, with the most occurring in May and June.
Economy
The economy of Springfield is largely based on government and services. The city is home to the Illinois State Capitol, the Abraham Lincoln Presidential Library and Museum, and the University of Illinois at Springfield. The city is also home to several major employers, including the State of Illinois, Memorial Medical Center, and the Illinois Department of Transportation.
Demographics
As of the 2010 census, the population of Springfield was 116,250. The racial makeup of the city was 68.2% White, 24.3% African American, 0.4% Native American, 2.2% Asian, and 4.9% from other races. The median household income was $41,919, and the median family income was $50,919.
Conclusion
Springfield, Illinois is the capital of the state of Illinois and the county seat of Sangamon County. It is located in the central part of the state, about 90 miles northeast of St. Louis, Missouri. The city has a population of 116,250, making it the sixth most populous city in the state. The economy of Springfield is largely based on government and services, and the city is home to several major employers. The racial makeup of the city is 68.2% White, 24.3% African American, 0.4% Native American, 2.2% Asian, and 4.9% from other races. The median household income was $41,919, and the median family income was $50,919.
Common Questions
What is Per Capita Income in Springfield?
Per Capita income in Springfield is $39,648.
What is the Median Family Income in Springfield?
Median Family Income in Springfield is $86,647.
What is the Median Household income in Springfield?
Median Household Income in Springfield is $62,419.
What is Income or Wage Gap in Springfield?
Income or Wage Gap in Springfield is 20.5%.
Women in Springfield earn 79.5 cents for every dollar earned by a man.
What is Family Income Deficit in Springfield?
Family Income Deficit in Springfield is $11,356.
Families that are below poverty line in Springfield earn $11,356 less on average than the poverty threshold level.
What is Inequality or Gini Index in Springfield?
Inequality or Gini Index in Springfield is 0.49.
What is the Total Population of Springfield?
Total Population of Springfield is 114,214.
What is the Total Male Population of Springfield?
Total Male Population of Springfield is 55,056.
What is the Total Female Population of Springfield?
Total Female Population of Springfield is 59,158.
What is the Ratio of Males per 100 Females in Springfield?
There are 93.07 Males per 100 Females in Springfield.
What is the Ratio of Females per 100 Males in Springfield?
There are 107.45 Females per 100 Males in Springfield.
What is the Median Population Age in Springfield?
Median Population Age in Springfield is 40.1 Years.
What is the Average Family Size in Springfield
Average Family Size in Springfield is 3.0 People.
What is the Average Household Size in Springfield
Average Household Size in Springfield is 2.2 People.
How Large is the Labor Force in Springfield?
There are 56,051 People in the Labor Forcein in Springfield.
What is the Percentage of People in the Labor Force in Springfield?
60.6% of People are in the Labor Force in Springfield.
What is the Unemployment Rate in Springfield?
Unemployment Rate in Springfield is 6.6%.