Cities with the Most Immigrants from Northern Africa in Illinois
RELATED REPORTS & OPTIONS
Northern Africa
Illinois
Compare Cities
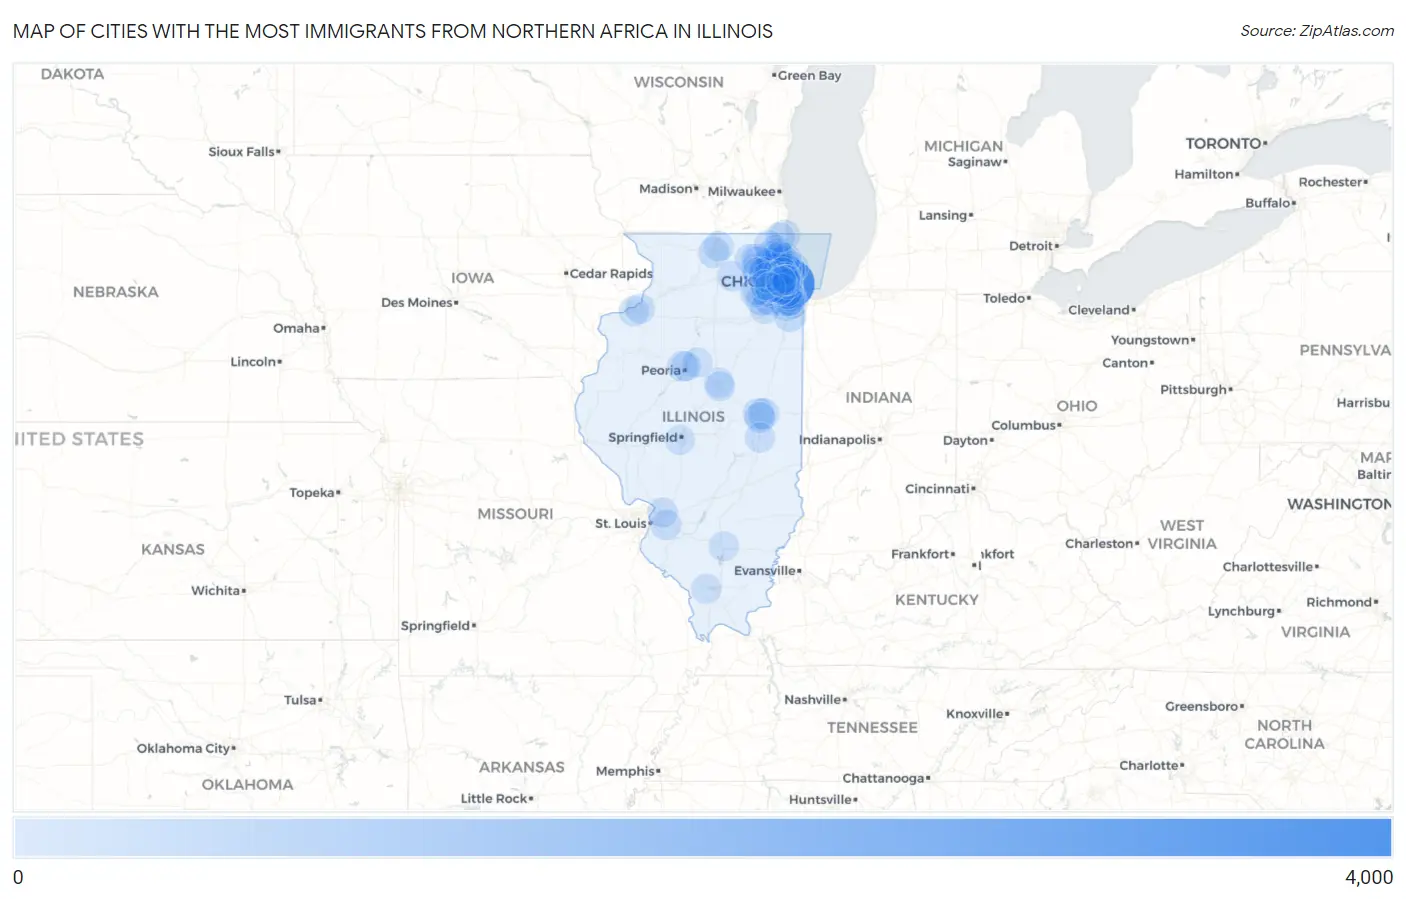
Map of Cities with the Most Immigrants from Northern Africa in Illinois
0
4,000
Cities with the Most Immigrants from Northern Africa in Illinois
| City | Northern Africa | vs State | vs National | |
| 1. | Chicago | 3,928 | 14,035(27.99%)#1 | 421,832(0.93%)#9 |
| 2. | Glendale Heights | 722 | 14,035(5.14%)#2 | 421,832(0.17%)#66 |
| 3. | Romeoville | 560 | 14,035(3.99%)#3 | 421,832(0.13%)#100 |
| 4. | Woodridge | 392 | 14,035(2.79%)#4 | 421,832(0.09%)#156 |
| 5. | Tinley Park | 286 | 14,035(2.04%)#5 | 421,832(0.07%)#245 |
| 6. | Wheaton | 278 | 14,035(1.98%)#6 | 421,832(0.07%)#255 |
| 7. | Monee | 257 | 14,035(1.83%)#7 | 421,832(0.06%)#271 |
| 8. | Champaign | 252 | 14,035(1.80%)#8 | 421,832(0.06%)#278 |
| 9. | Evanston | 251 | 14,035(1.79%)#9 | 421,832(0.06%)#279 |
| 10. | Plainfield | 238 | 14,035(1.70%)#10 | 421,832(0.06%)#295 |
| 11. | Bridgeview | 226 | 14,035(1.61%)#11 | 421,832(0.05%)#313 |
| 12. | Niles | 212 | 14,035(1.51%)#12 | 421,832(0.05%)#343 |
| 13. | Rockford | 210 | 14,035(1.50%)#13 | 421,832(0.05%)#348 |
| 14. | Urbana | 199 | 14,035(1.42%)#14 | 421,832(0.05%)#370 |
| 15. | Arlington Heights | 195 | 14,035(1.39%)#15 | 421,832(0.05%)#380 |
| 16. | Hoffman Estates | 183 | 14,035(1.30%)#16 | 421,832(0.04%)#408 |
| 17. | Des Plaines | 176 | 14,035(1.25%)#17 | 421,832(0.04%)#423 |
| 18. | Palos Hills | 166 | 14,035(1.18%)#18 | 421,832(0.04%)#442 |
| 19. | Peoria | 144 | 14,035(1.03%)#19 | 421,832(0.03%)#514 |
| 20. | Prospect Heights | 142 | 14,035(1.01%)#20 | 421,832(0.03%)#523 |
| 21. | Hanover Park | 138 | 14,035(0.98%)#21 | 421,832(0.03%)#531 |
| 22. | O Fallon | 138 | 14,035(0.98%)#22 | 421,832(0.03%)#533 |
| 23. | River Grove | 135 | 14,035(0.96%)#23 | 421,832(0.03%)#542 |
| 24. | Savoy | 133 | 14,035(0.95%)#24 | 421,832(0.03%)#547 |
| 25. | Orland Park | 130 | 14,035(0.93%)#25 | 421,832(0.03%)#555 |
| 26. | Hickory Hills | 127 | 14,035(0.90%)#26 | 421,832(0.03%)#567 |
| 27. | Oak Lawn | 124 | 14,035(0.88%)#27 | 421,832(0.03%)#578 |
| 28. | Darien | 109 | 14,035(0.78%)#28 | 421,832(0.03%)#652 |
| 29. | Midlothian | 109 | 14,035(0.78%)#29 | 421,832(0.03%)#653 |
| 30. | Wheeling | 107 | 14,035(0.76%)#30 | 421,832(0.03%)#656 |
| 31. | Winthrop Harbor | 103 | 14,035(0.73%)#31 | 421,832(0.02%)#683 |
| 32. | Northbrook | 99 | 14,035(0.71%)#32 | 421,832(0.02%)#696 |
| 33. | Palatine | 91 | 14,035(0.65%)#33 | 421,832(0.02%)#745 |
| 34. | Alsip | 90 | 14,035(0.64%)#34 | 421,832(0.02%)#755 |
| 35. | Algonquin | 82 | 14,035(0.58%)#35 | 421,832(0.02%)#796 |
| 36. | Harwood Heights | 81 | 14,035(0.58%)#36 | 421,832(0.02%)#803 |
| 37. | Hinsdale | 80 | 14,035(0.57%)#37 | 421,832(0.02%)#809 |
| 38. | Dekalb | 76 | 14,035(0.54%)#38 | 421,832(0.02%)#842 |
| 39. | Naperville | 72 | 14,035(0.51%)#39 | 421,832(0.02%)#875 |
| 40. | Lincolnwood | 68 | 14,035(0.48%)#40 | 421,832(0.02%)#919 |
| 41. | Aurora | 66 | 14,035(0.47%)#41 | 421,832(0.02%)#937 |
| 42. | Hazel Crest | 59 | 14,035(0.42%)#42 | 421,832(0.01%)#1,019 |
| 43. | Skokie | 58 | 14,035(0.41%)#43 | 421,832(0.01%)#1,026 |
| 44. | Forest Park | 58 | 14,035(0.41%)#44 | 421,832(0.01%)#1,031 |
| 45. | Schiller Park | 58 | 14,035(0.41%)#45 | 421,832(0.01%)#1,033 |
| 46. | Downers Grove | 56 | 14,035(0.40%)#46 | 421,832(0.01%)#1,045 |
| 47. | Justice | 56 | 14,035(0.40%)#47 | 421,832(0.01%)#1,049 |
| 48. | Elgin | 55 | 14,035(0.39%)#48 | 421,832(0.01%)#1,052 |
| 49. | Joliet | 54 | 14,035(0.38%)#49 | 421,832(0.01%)#1,068 |
| 50. | Mount Prospect | 53 | 14,035(0.38%)#50 | 421,832(0.01%)#1,087 |
| 51. | Lombard | 51 | 14,035(0.36%)#51 | 421,832(0.01%)#1,112 |
| 52. | Inverness | 51 | 14,035(0.36%)#52 | 421,832(0.01%)#1,117 |
| 53. | Elmhurst | 50 | 14,035(0.36%)#53 | 421,832(0.01%)#1,121 |
| 54. | Chicago Ridge | 50 | 14,035(0.36%)#54 | 421,832(0.01%)#1,129 |
| 55. | Oak Forest | 47 | 14,035(0.33%)#55 | 421,832(0.01%)#1,173 |
| 56. | Libertyville | 47 | 14,035(0.33%)#56 | 421,832(0.01%)#1,175 |
| 57. | Westmont | 46 | 14,035(0.33%)#57 | 421,832(0.01%)#1,191 |
| 58. | Villa Park | 46 | 14,035(0.33%)#58 | 421,832(0.01%)#1,193 |
| 59. | Buffalo Grove | 45 | 14,035(0.32%)#59 | 421,832(0.01%)#1,207 |
| 60. | Burbank | 43 | 14,035(0.31%)#60 | 421,832(0.01%)#1,243 |
| 61. | Schaumburg | 41 | 14,035(0.29%)#61 | 421,832(0.01%)#1,279 |
| 62. | Moline | 41 | 14,035(0.29%)#62 | 421,832(0.01%)#1,283 |
| 63. | Glen Carbon | 40 | 14,035(0.29%)#63 | 421,832(0.01%)#1,305 |
| 64. | Burr Ridge | 40 | 14,035(0.29%)#64 | 421,832(0.01%)#1,307 |
| 65. | Park Ridge | 39 | 14,035(0.28%)#65 | 421,832(0.01%)#1,316 |
| 66. | Loves Park | 38 | 14,035(0.27%)#66 | 421,832(0.01%)#1,339 |
| 67. | Morton Grove | 37 | 14,035(0.26%)#67 | 421,832(0.01%)#1,355 |
| 68. | Lake Zurich | 35 | 14,035(0.25%)#68 | 421,832(0.01%)#1,400 |
| 69. | Huntley | 34 | 14,035(0.24%)#69 | 421,832(0.01%)#1,421 |
| 70. | Vernon Hills | 34 | 14,035(0.24%)#70 | 421,832(0.01%)#1,422 |
| 71. | Tuscola | 34 | 14,035(0.24%)#71 | 421,832(0.01%)#1,442 |
| 72. | Lincolnshire | 33 | 14,035(0.24%)#72 | 421,832(0.01%)#1,461 |
| 73. | Highland Park | 30 | 14,035(0.21%)#73 | 421,832(0.01%)#1,516 |
| 74. | Mount Vernon | 30 | 14,035(0.21%)#74 | 421,832(0.01%)#1,522 |
| 75. | East Moline | 29 | 14,035(0.21%)#75 | 421,832(0.01%)#1,547 |
| 76. | Berkeley | 27 | 14,035(0.19%)#76 | 421,832(0.01%)#1,617 |
| 77. | Addison | 26 | 14,035(0.19%)#77 | 421,832(0.01%)#1,624 |
| 78. | Springfield | 25 | 14,035(0.18%)#78 | 421,832(0.01%)#1,647 |
| 79. | Carpentersville | 24 | 14,035(0.17%)#79 | 421,832(0.01%)#1,685 |
| 80. | Montgomery | 24 | 14,035(0.17%)#80 | 421,832(0.01%)#1,693 |
| 81. | Westchester | 23 | 14,035(0.16%)#81 | 421,832(0.01%)#1,724 |
| 82. | Bartlett | 22 | 14,035(0.16%)#82 | 421,832(0.01%)#1,748 |
| 83. | Carol Stream | 22 | 14,035(0.16%)#83 | 421,832(0.01%)#1,749 |
| 84. | Rosemont | 22 | 14,035(0.16%)#84 | 421,832(0.01%)#1,766 |
| 85. | Berwyn | 21 | 14,035(0.15%)#85 | 421,832(0.00%)#1,778 |
| 86. | Normal | 19 | 14,035(0.14%)#86 | 421,832(0.00%)#1,844 |
| 87. | Elmwood Park | 19 | 14,035(0.14%)#87 | 421,832(0.00%)#1,852 |
| 88. | South Elgin | 19 | 14,035(0.14%)#88 | 421,832(0.00%)#1,853 |
| 89. | Carbondale | 19 | 14,035(0.14%)#89 | 421,832(0.00%)#1,855 |
| 90. | Round Lake | 19 | 14,035(0.14%)#90 | 421,832(0.00%)#1,859 |
| 91. | Indian Head Park | 19 | 14,035(0.14%)#91 | 421,832(0.00%)#1,873 |
| 92. | Warrenville | 18 | 14,035(0.13%)#92 | 421,832(0.00%)#1,901 |
| 93. | River Forest | 18 | 14,035(0.13%)#93 | 421,832(0.00%)#1,904 |
| 94. | Oak Park | 17 | 14,035(0.12%)#94 | 421,832(0.00%)#1,925 |
| 95. | Lisle | 17 | 14,035(0.12%)#95 | 421,832(0.00%)#1,937 |
| 96. | Hillside | 16 | 14,035(0.11%)#96 | 421,832(0.00%)#2,017 |
| 97. | Metamora | 16 | 14,035(0.11%)#97 | 421,832(0.00%)#2,029 |
| 98. | Peoria Heights | 15 | 14,035(0.11%)#98 | 421,832(0.00%)#2,079 |
| 99. | Bloomington | 14 | 14,035(0.10%)#99 | 421,832(0.00%)#2,101 |
| 100. | Wadsworth | 14 | 14,035(0.10%)#100 | 421,832(0.00%)#2,142 |
Common Questions
What are the Top 10 Cities with the Most Immigrants from Northern Africa in Illinois?
Top 10 Cities with the Most Immigrants from Northern Africa in Illinois are:
#1
3,928
#2
722
#3
560
#4
392
#5
286
#6
278
#7
257
#8
252
#9
251
#10
238
What city has the Most Immigrants from Northern Africa in Illinois?
Chicago has the Most Immigrants from Northern Africa in Illinois with 3,928.
What is the Total Immigrants from Northern Africa in the State of Illinois?
Total Immigrants from Northern Africa in Illinois is 14,035.
What is the Total Immigrants from Northern Africa in the United States?
Total Immigrants from Northern Africa in the United States is 421,832.