North Chicago, IL Map & Demographics
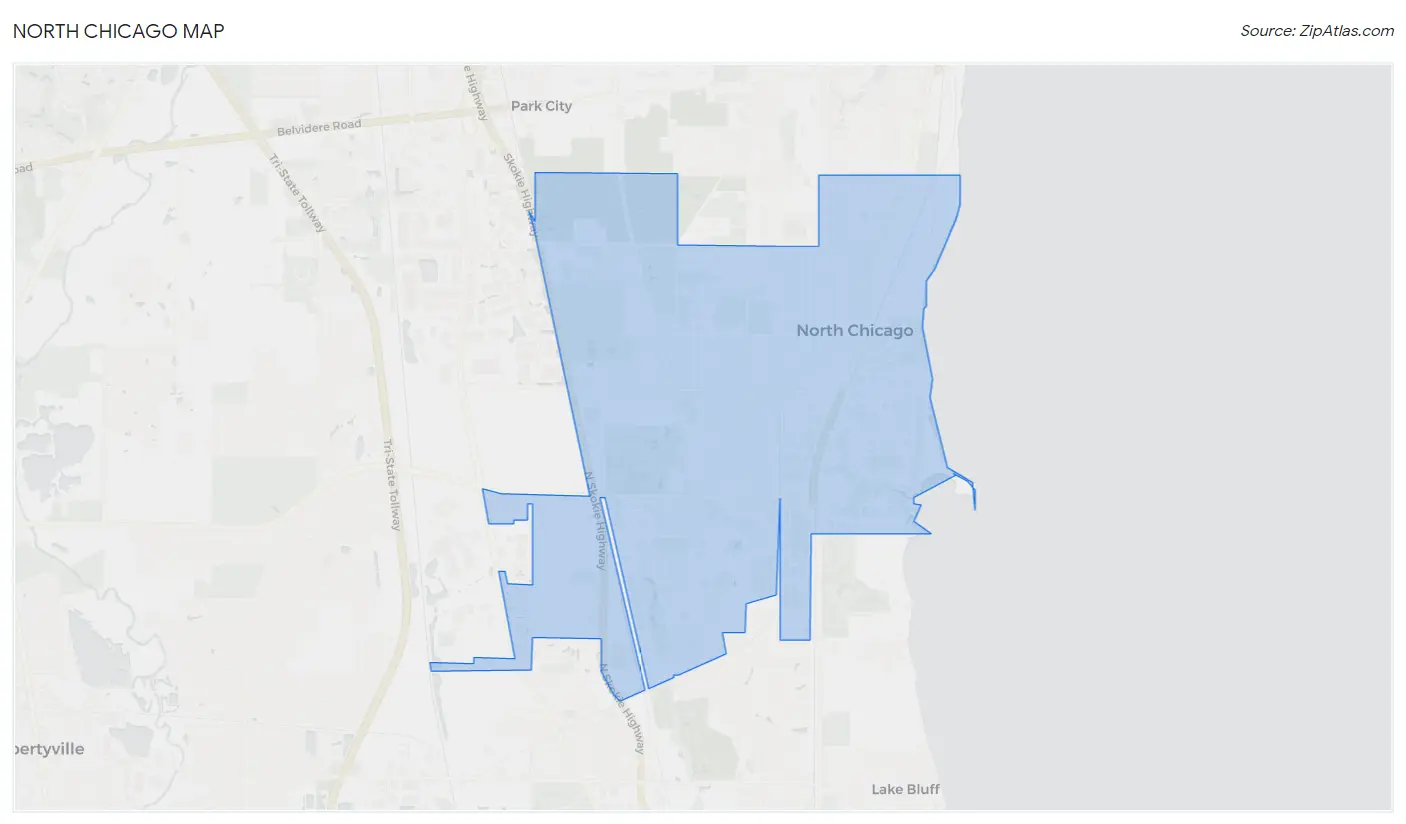
North Chicago Map
North Chicago Overview
$24,441
PER CAPITA INCOME
$62,163
AVG FAMILY INCOME
$52,011
AVG HOUSEHOLD INCOME
4.1%
WAGE / INCOME GAP [ % ]
95.9¢/ $1
WAGE / INCOME GAP [ $ ]
$11,090
FAMILY INCOME DEFICIT
0.46
INEQUALITY / GINI INDEX
30,890
TOTAL POPULATION
18,583
MALE POPULATION
12,307
FEMALE POPULATION
151.00
MALES / 100 FEMALES
66.23
FEMALES / 100 MALES
23.5
MEDIAN AGE
3.5
AVG FAMILY SIZE
2.6
AVG HOUSEHOLD SIZE
19,780
LABOR FORCE [ PEOPLE ]
76.0%
PERCENT IN LABOR FORCE
9.5%
UNEMPLOYMENT RATE
North Chicago Zip Codes
Income in North Chicago
Income Overview in North Chicago
Per Capita Income in North Chicago is $24,441, while median incomes of families and households are $62,163 and $52,011 respectively.
| Characteristic | Number | Measure |
| Per Capita Income | 30,890 | $24,441 |
| Median Family Income | 4,373 | $62,163 |
| Mean Family Income | 4,373 | $75,439 |
| Median Household Income | 7,487 | $52,011 |
| Mean Household Income | 7,487 | $65,939 |
| Income Deficit | 4,373 | $11,090 |
| Wage / Income Gap (%) | 30,890 | 4.12% |
| Wage / Income Gap ($) | 30,890 | 95.88¢ per $1 |
| Gini / Inequality Index | 30,890 | 0.46 |
Earnings by Sex in North Chicago
Average Earnings in North Chicago are $23,844, $24,078 for men and $23,086 for women, a difference of 4.1%.
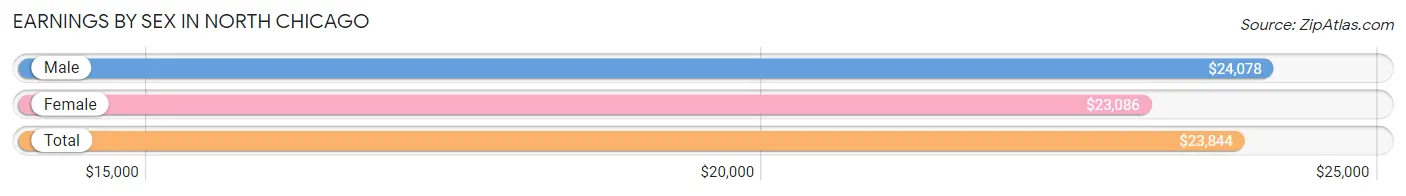
| Sex | Number | Average Earnings |
| Male | 13,673 (65.9%) | $24,078 |
| Female | 7,089 (34.1%) | $23,086 |
| Total | 20,762 (100.0%) | $23,844 |
Earnings by Sex by Income Bracket in North Chicago
The most common earnings brackets in North Chicago are $22,500 to $24,999 for men (1,303 | 9.5%) and $25,000 to $29,999 for women (991 | 14.0%).
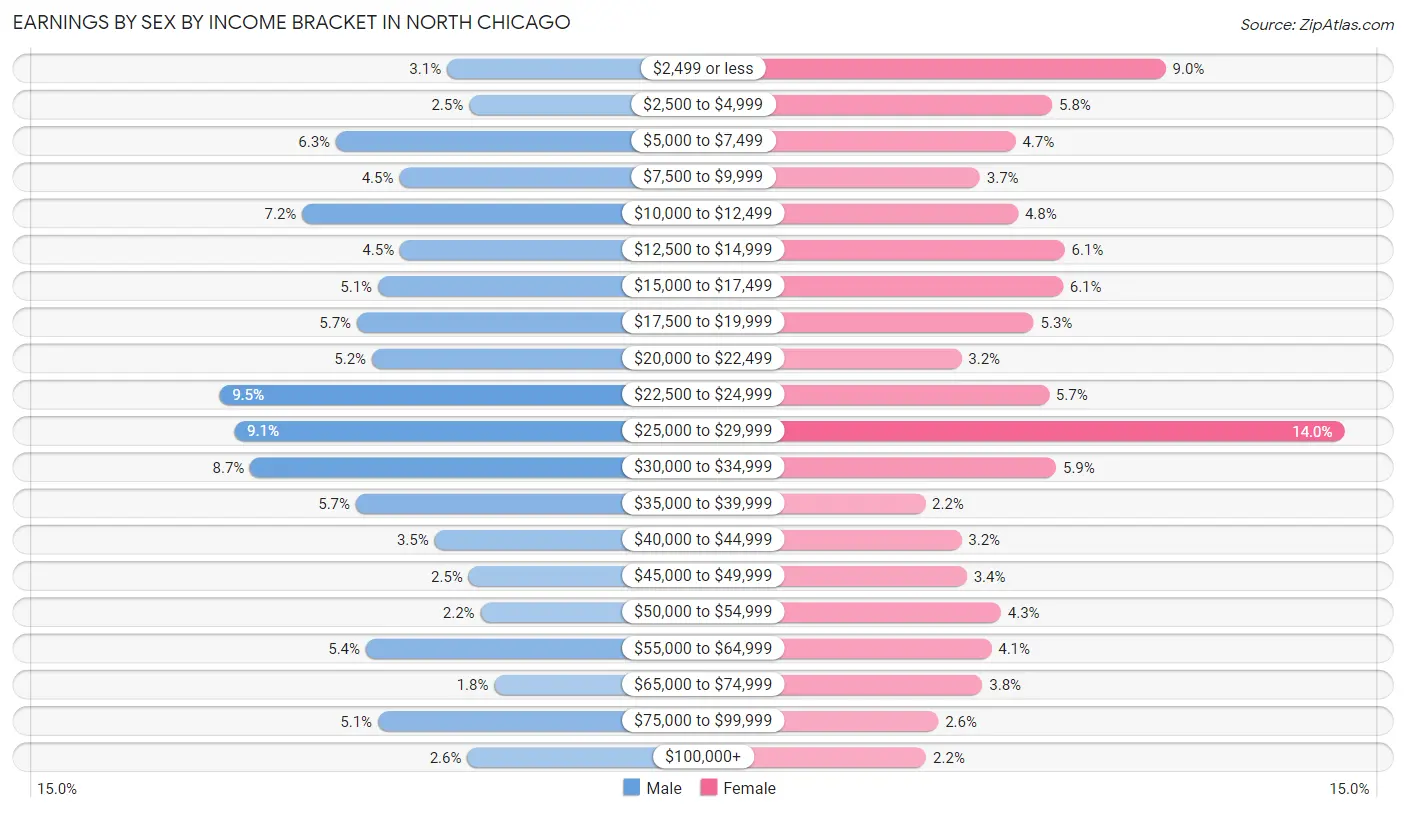
| Income | Male | Female |
| $2,499 or less | 428 (3.1%) | 635 (9.0%) |
| $2,500 to $4,999 | 343 (2.5%) | 409 (5.8%) |
| $5,000 to $7,499 | 854 (6.2%) | 336 (4.7%) |
| $7,500 to $9,999 | 611 (4.5%) | 265 (3.7%) |
| $10,000 to $12,499 | 985 (7.2%) | 341 (4.8%) |
| $12,500 to $14,999 | 609 (4.4%) | 434 (6.1%) |
| $15,000 to $17,499 | 693 (5.1%) | 430 (6.1%) |
| $17,500 to $19,999 | 774 (5.7%) | 372 (5.2%) |
| $20,000 to $22,499 | 717 (5.2%) | 228 (3.2%) |
| $22,500 to $24,999 | 1,303 (9.5%) | 403 (5.7%) |
| $25,000 to $29,999 | 1,246 (9.1%) | 991 (14.0%) |
| $30,000 to $34,999 | 1,184 (8.7%) | 417 (5.9%) |
| $35,000 to $39,999 | 778 (5.7%) | 156 (2.2%) |
| $40,000 to $44,999 | 476 (3.5%) | 228 (3.2%) |
| $45,000 to $49,999 | 344 (2.5%) | 239 (3.4%) |
| $50,000 to $54,999 | 299 (2.2%) | 307 (4.3%) |
| $55,000 to $64,999 | 740 (5.4%) | 288 (4.1%) |
| $65,000 to $74,999 | 246 (1.8%) | 270 (3.8%) |
| $75,000 to $99,999 | 693 (5.1%) | 182 (2.6%) |
| $100,000+ | 350 (2.6%) | 158 (2.2%) |
| Total | 13,673 (100.0%) | 7,089 (100.0%) |
Earnings by Sex by Educational Attainment in North Chicago
Average earnings in North Chicago are $37,037 for men and $28,408 for women, a difference of 23.3%. Men with an educational attainment of graduate degree enjoy the highest average annual earnings of $92,596, while those with less than high school education earn the least with $32,595. Women with an educational attainment of graduate degree earn the most with the average annual earnings of $65,156, while those with less than high school education have the smallest earnings of $20,865.
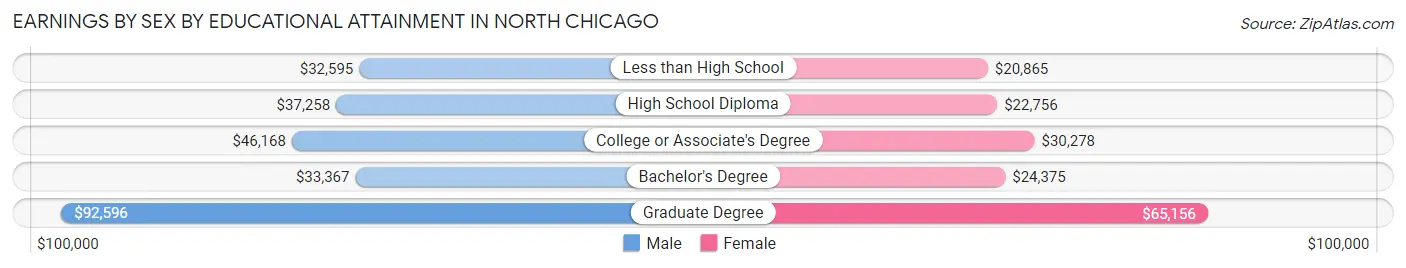
| Educational Attainment | Male Income | Female Income |
| Less than High School | $32,595 | $20,865 |
| High School Diploma | $37,258 | $22,756 |
| College or Associate's Degree | $46,168 | $30,278 |
| Bachelor's Degree | $33,367 | $24,375 |
| Graduate Degree | $92,596 | $65,156 |
| Total | $37,037 | $28,408 |
Family Income in North Chicago
Family Income Brackets in North Chicago
According to the North Chicago family income data, there are 800 families falling into the $75,000 to $99,999 income range, which is the most common income bracket and makes up 18.3% of all families. Conversely, the $10,000 to $14,999 income bracket is the least frequent group with only 140 families (3.2%) belonging to this category.
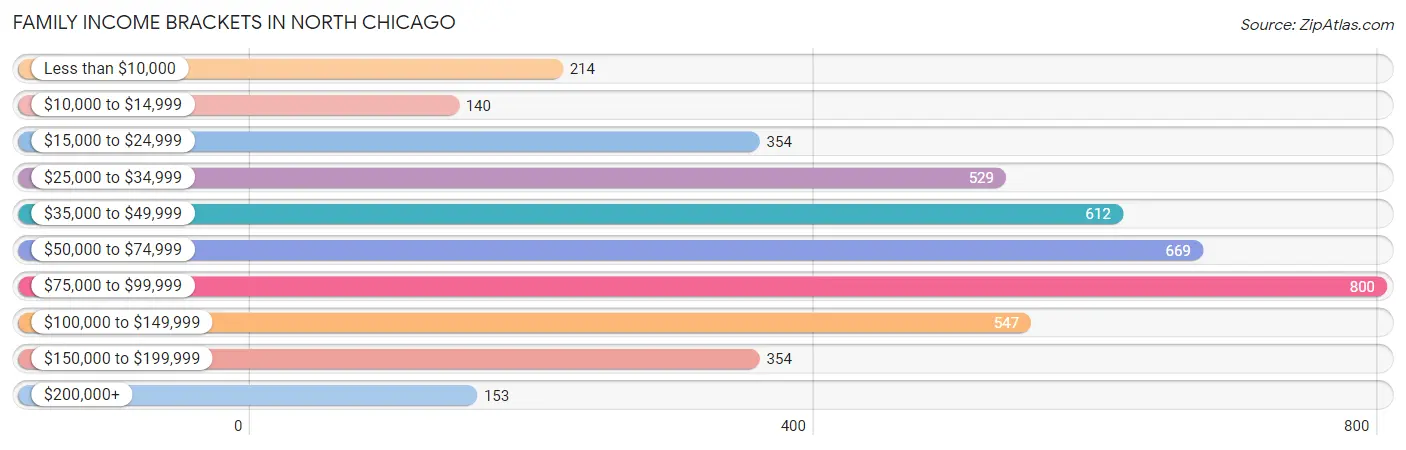
| Income Bracket | # Families | % Families |
| Less than $10,000 | 214 | 4.9% |
| $10,000 to $14,999 | 140 | 3.2% |
| $15,000 to $24,999 | 354 | 8.1% |
| $25,000 to $34,999 | 529 | 12.1% |
| $35,000 to $49,999 | 612 | 14.0% |
| $50,000 to $74,999 | 669 | 15.3% |
| $75,000 to $99,999 | 800 | 18.3% |
| $100,000 to $149,999 | 547 | 12.5% |
| $150,000 to $199,999 | 354 | 8.1% |
| $200,000+ | 153 | 3.5% |
Family Income by Famaliy Size in North Chicago
7+ person families (241 | 5.5%) account for the highest median family income in North Chicago with $167,628 per family, while 2-person families (1,475 | 33.7%) have the highest median income of $26,498 per family member.
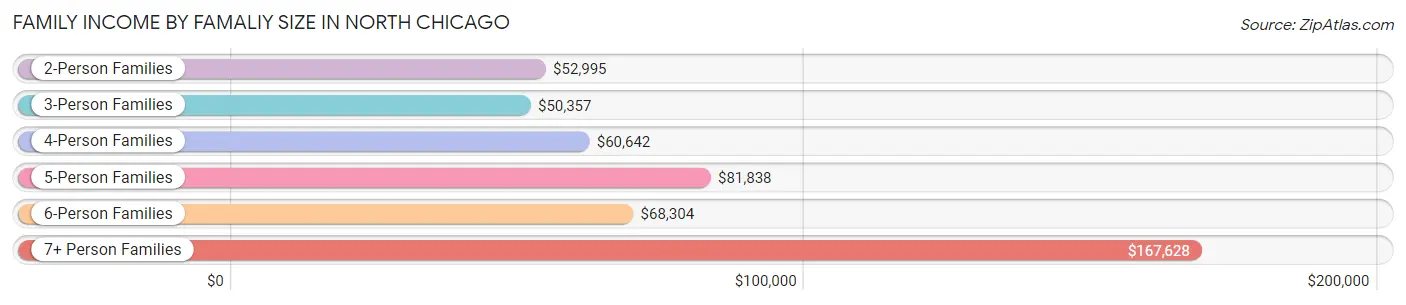
| Income Bracket | # Families | Median Income |
| 2-Person Families | 1,475 (33.7%) | $52,995 |
| 3-Person Families | 996 (22.8%) | $50,357 |
| 4-Person Families | 1,091 (24.9%) | $60,642 |
| 5-Person Families | 379 (8.7%) | $81,838 |
| 6-Person Families | 191 (4.4%) | $68,304 |
| 7+ Person Families | 241 (5.5%) | $167,628 |
| Total | 4,373 (100.0%) | $62,163 |
Family Income by Number of Earners in North Chicago
The median family income in North Chicago is $62,163, with families comprising 3+ earners (879) having the highest median family income of $126,414, while families with no earners (297) have the lowest median family income of $26,507, accounting for 20.1% and 6.8% of families, respectively.
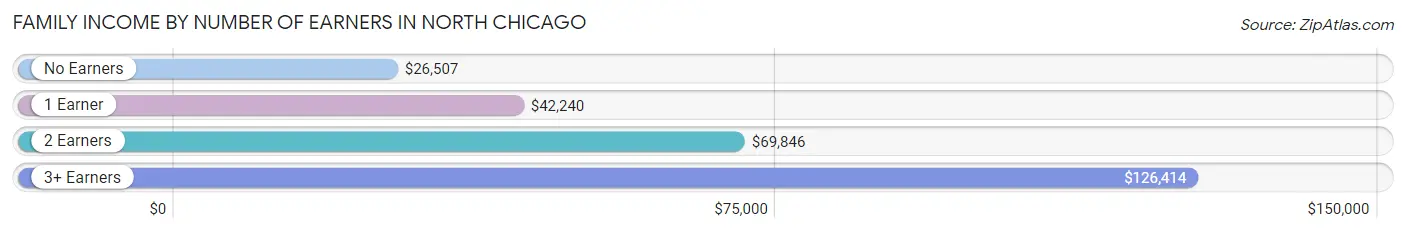
| Number of Earners | # Families | Median Income |
| No Earners | 297 (6.8%) | $26,507 |
| 1 Earner | 1,685 (38.5%) | $42,240 |
| 2 Earners | 1,512 (34.6%) | $69,846 |
| 3+ Earners | 879 (20.1%) | $126,414 |
| Total | 4,373 (100.0%) | $62,163 |
Household Income in North Chicago
Household Income Brackets in North Chicago
With 1,235 households falling in the category, the $50,000 to $74,999 income range is the most frequent in North Chicago, accounting for 16.5% of all households. In contrast, only 240 households (3.2%) fall into the $200,000+ income bracket, making it the least populous group.
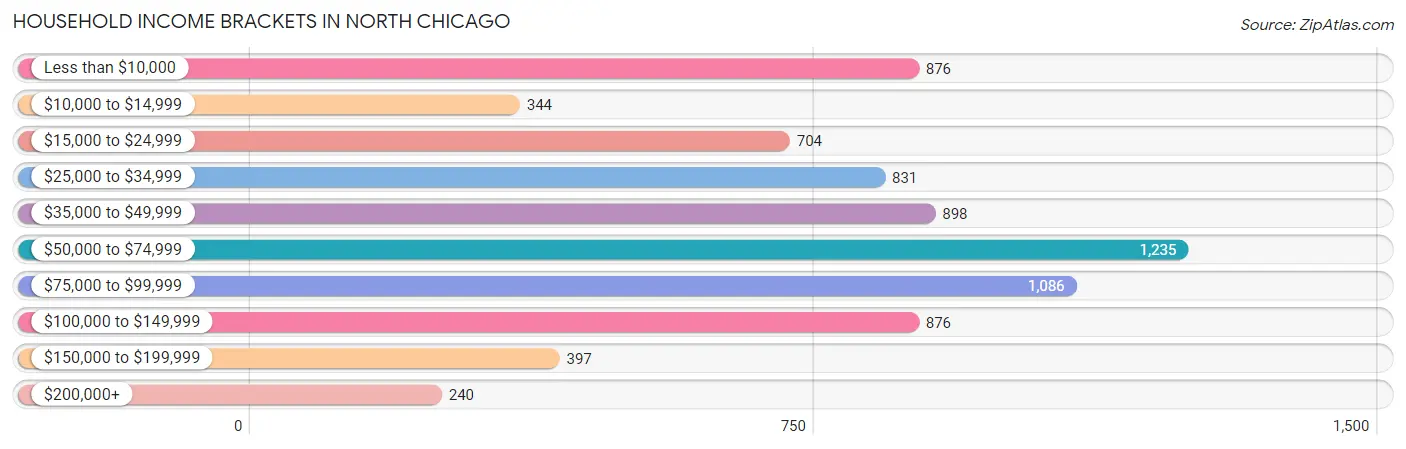
| Income Bracket | # Households | % Households |
| Less than $10,000 | 876 | 11.7% |
| $10,000 to $14,999 | 344 | 4.6% |
| $15,000 to $24,999 | 704 | 9.4% |
| $25,000 to $34,999 | 831 | 11.1% |
| $35,000 to $49,999 | 898 | 12.0% |
| $50,000 to $74,999 | 1,235 | 16.5% |
| $75,000 to $99,999 | 1,086 | 14.5% |
| $100,000 to $149,999 | 876 | 11.7% |
| $150,000 to $199,999 | 397 | 5.3% |
| $200,000+ | 240 | 3.2% |
Household Income by Householder Age in North Chicago
The median household income in North Chicago is $52,011, with the highest median household income of $74,412 found in the 45 to 64 years age bracket for the primary householder. A total of 1,958 households (26.2%) fall into this category. Meanwhile, the 65+ years age bracket for the primary householder has the lowest median household income of $37,444, with 1,331 households (17.8%) in this group.
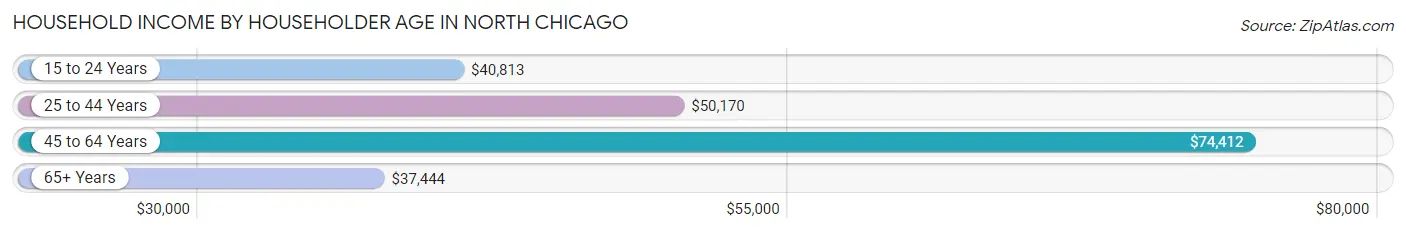
| Income Bracket | # Households | Median Income |
| 15 to 24 Years | 836 (11.2%) | $40,813 |
| 25 to 44 Years | 3,362 (44.9%) | $50,170 |
| 45 to 64 Years | 1,958 (26.2%) | $74,412 |
| 65+ Years | 1,331 (17.8%) | $37,444 |
| Total | 7,487 (100.0%) | $52,011 |
Poverty in North Chicago
Income Below Poverty by Sex and Age in North Chicago
With 17.5% poverty level for males and 26.4% for females among the residents of North Chicago, 15 year old males and under 5 year old females are the most vulnerable to poverty, with 49 males (42.2%) and 403 females (45.0%) in their respective age groups living below the poverty level.
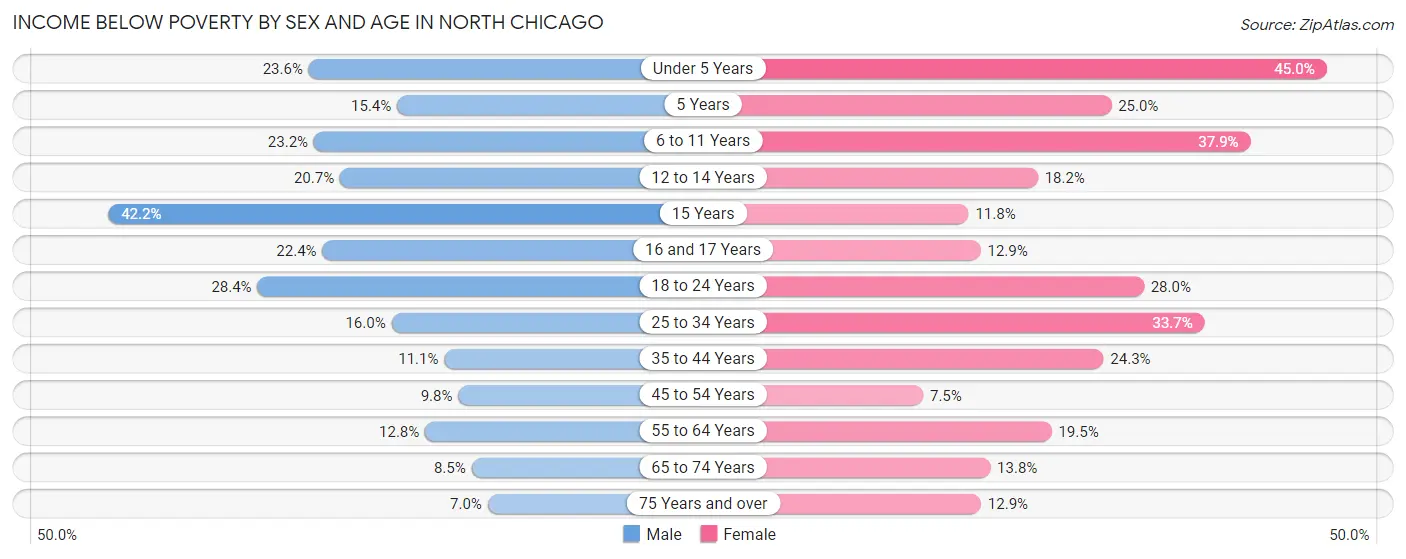
| Age Bracket | Male | Female |
| Under 5 Years | 212 (23.6%) | 403 (45.0%) |
| 5 Years | 25 (15.4%) | 26 (25.0%) |
| 6 to 11 Years | 216 (23.2%) | 391 (37.9%) |
| 12 to 14 Years | 68 (20.7%) | 58 (18.2%) |
| 15 Years | 49 (42.2%) | 8 (11.8%) |
| 16 and 17 Years | 36 (22.4%) | 30 (12.9%) |
| 18 to 24 Years | 377 (28.4%) | 406 (28.0%) |
| 25 to 34 Years | 350 (16.0%) | 623 (33.7%) |
| 35 to 44 Years | 129 (11.1%) | 287 (24.3%) |
| 45 to 54 Years | 87 (9.8%) | 59 (7.5%) |
| 55 to 64 Years | 117 (12.8%) | 165 (19.5%) |
| 65 to 74 Years | 50 (8.5%) | 91 (13.8%) |
| 75 Years and over | 17 (7.0%) | 55 (12.9%) |
| Total | 1,733 (17.5%) | 2,602 (26.4%) |
Income Above Poverty by Sex and Age in North Chicago
According to the poverty statistics in North Chicago, males aged 75 years and over and females aged 45 to 54 years are the age groups that are most secure financially, with 93.0% of males and 92.5% of females in these age groups living above the poverty line.
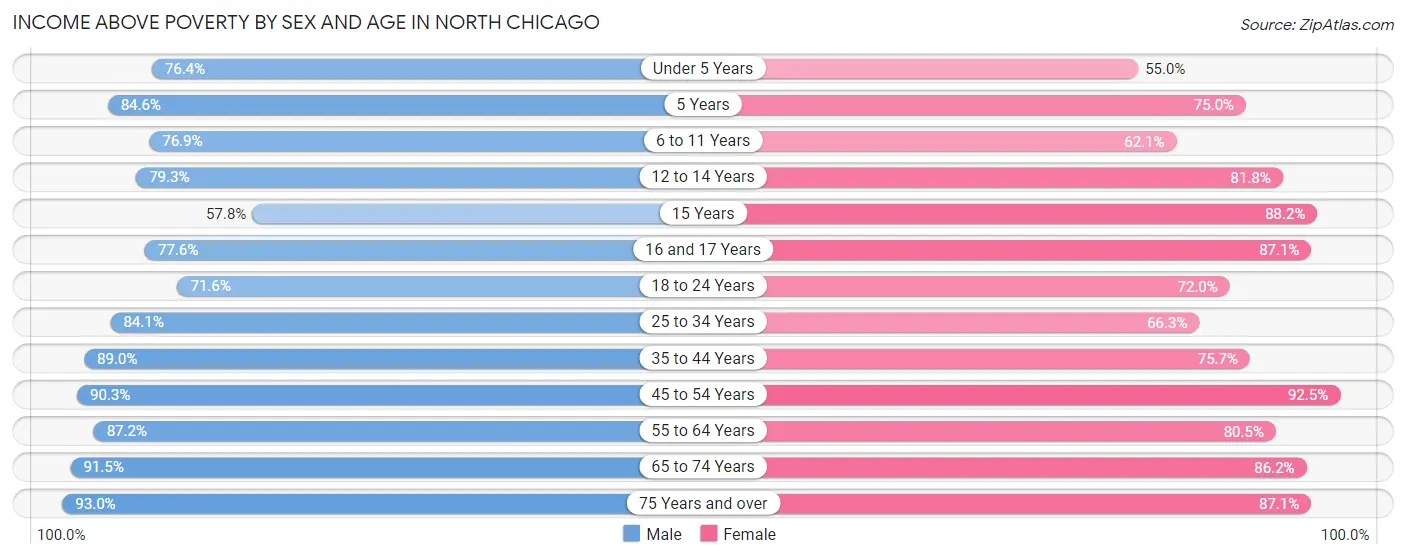
| Age Bracket | Male | Female |
| Under 5 Years | 685 (76.4%) | 493 (55.0%) |
| 5 Years | 137 (84.6%) | 78 (75.0%) |
| 6 to 11 Years | 717 (76.8%) | 640 (62.1%) |
| 12 to 14 Years | 260 (79.3%) | 261 (81.8%) |
| 15 Years | 67 (57.8%) | 60 (88.2%) |
| 16 and 17 Years | 125 (77.6%) | 203 (87.1%) |
| 18 to 24 Years | 951 (71.6%) | 1,043 (72.0%) |
| 25 to 34 Years | 1,845 (84.1%) | 1,228 (66.3%) |
| 35 to 44 Years | 1,038 (88.9%) | 895 (75.7%) |
| 45 to 54 Years | 805 (90.2%) | 724 (92.5%) |
| 55 to 64 Years | 795 (87.2%) | 683 (80.5%) |
| 65 to 74 Years | 537 (91.5%) | 570 (86.2%) |
| 75 Years and over | 225 (93.0%) | 371 (87.1%) |
| Total | 8,187 (82.5%) | 7,249 (73.6%) |
Income Below Poverty Among Married-Couple Families in North Chicago
The poverty statistics for married-couple families in North Chicago show that 8.9% or 233 of the total 2,616 families live below the poverty line. Families with 5 or more children have the highest poverty rate of 41.7%, comprising of 15 families. On the other hand, families with no children have the lowest poverty rate of 2.3%, which includes 25 families.
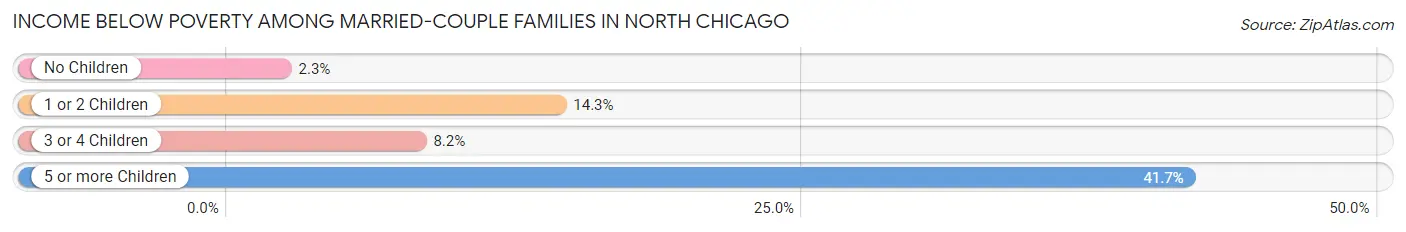
| Children | Above Poverty | Below Poverty |
| No Children | 1,048 (97.7%) | 25 (2.3%) |
| 1 or 2 Children | 978 (85.7%) | 163 (14.3%) |
| 3 or 4 Children | 336 (91.8%) | 30 (8.2%) |
| 5 or more Children | 21 (58.3%) | 15 (41.7%) |
| Total | 2,383 (91.1%) | 233 (8.9%) |
Income Below Poverty Among Single-Parent Households in North Chicago
According to the poverty data in North Chicago, 7.4% or 48 single-father households and 42.4% or 471 single-mother households are living below the poverty line. Among single-father households, those with 3 or 4 children have the highest poverty rate, with 19 households (30.6%) experiencing poverty. Likewise, among single-mother households, those with 3 or 4 children have the highest poverty rate, with 164 households (83.3%) falling below the poverty line.
| Children | Single Father | Single Mother |
| No Children | 29 (6.8%) | 78 (21.8%) |
| 1 or 2 Children | 0 (0.0%) | 229 (41.0%) |
| 3 or 4 Children | 19 (30.6%) | 164 (83.3%) |
| 5 or more Children | 0 (0.0%) | 0 (0.0%) |
| Total | 48 (7.4%) | 471 (42.4%) |
Income Below Poverty Among Married-Couple vs Single-Parent Households in North Chicago
The poverty data for North Chicago shows that 233 of the married-couple family households (8.9%) and 519 of the single-parent households (29.5%) are living below the poverty level. Within the married-couple family households, those with 5 or more children have the highest poverty rate, with 15 households (41.7%) falling below the poverty line. Among the single-parent households, those with 3 or 4 children have the highest poverty rate, with 183 household (70.7%) living below poverty.
| Children | Married-Couple Families | Single-Parent Households |
| No Children | 25 (2.3%) | 107 (13.7%) |
| 1 or 2 Children | 163 (14.3%) | 229 (32.0%) |
| 3 or 4 Children | 30 (8.2%) | 183 (70.7%) |
| 5 or more Children | 15 (41.7%) | 0 (0.0%) |
| Total | 233 (8.9%) | 519 (29.5%) |
Race in North Chicago
The most populous races in North Chicago are White / Caucasian (12,757 | 41.3%), Hispanic or Latino (11,095 | 35.9%), and Black / African American (7,908 | 25.6%).
| Race | # Population | % Population |
| Asian | 1,600 | 5.2% |
| Black / African American | 7,908 | 25.6% |
| Hawaiian / Pacific | 19 | 0.1% |
| Hispanic or Latino | 11,095 | 35.9% |
| Native / Alaskan | 465 | 1.5% |
| White / Caucasian | 12,757 | 41.3% |
| Two or more Races | 4,332 | 14.0% |
| Some other Race | 3,809 | 12.3% |
| Total | 30,890 | 100.0% |
Ancestry in North Chicago
The most populous ancestries reported in North Chicago are Mexican (8,618 | 27.9%), German (2,428 | 7.9%), Irish (1,764 | 5.7%), American (1,676 | 5.4%), and Korean (936 | 3.0%), together accounting for 49.9% of all North Chicago residents.
| Ancestry | # Population | % Population |
| Afghan | 3 | 0.0% |
| African | 189 | 0.6% |
| Albanian | 11 | 0.0% |
| American | 1,676 | 5.4% |
| Apache | 49 | 0.2% |
| Arab | 90 | 0.3% |
| Armenian | 122 | 0.4% |
| Australian | 14 | 0.1% |
| Austrian | 16 | 0.1% |
| Bangladeshi | 32 | 0.1% |
| Belgian | 14 | 0.1% |
| Belizean | 184 | 0.6% |
| Bhutanese | 134 | 0.4% |
| Blackfeet | 58 | 0.2% |
| Brazilian | 17 | 0.1% |
| British | 258 | 0.8% |
| British West Indian | 214 | 0.7% |
| Burmese | 84 | 0.3% |
| Canadian | 27 | 0.1% |
| Cape Verdean | 21 | 0.1% |
| Central American | 700 | 2.3% |
| Central American Indian | 131 | 0.4% |
| Cherokee | 140 | 0.4% |
| Chickasaw | 26 | 0.1% |
| Chippewa | 38 | 0.1% |
| Choctaw | 37 | 0.1% |
| Colombian | 145 | 0.5% |
| Comanche | 41 | 0.1% |
| Creek | 19 | 0.1% |
| Cuban | 138 | 0.4% |
| Czech | 41 | 0.1% |
| Danish | 42 | 0.1% |
| Dominican | 208 | 0.7% |
| Dutch | 191 | 0.6% |
| Eastern European | 28 | 0.1% |
| Ecuadorian | 270 | 0.9% |
| Egyptian | 3 | 0.0% |
| English | 704 | 2.3% |
| Estonian | 33 | 0.1% |
| European | 180 | 0.6% |
| Filipino | 23 | 0.1% |
| French | 240 | 0.8% |
| French Canadian | 18 | 0.1% |
| German | 2,428 | 7.9% |
| German Russian | 30 | 0.1% |
| Greek | 92 | 0.3% |
| Guatemalan | 76 | 0.3% |
| Haitian | 6 | 0.0% |
| Honduran | 219 | 0.7% |
| Hungarian | 5 | 0.0% |
| Indian (Asian) | 536 | 1.7% |
| Iranian | 103 | 0.3% |
| Irish | 1,764 | 5.7% |
| Iroquois | 20 | 0.1% |
| Italian | 807 | 2.6% |
| Jamaican | 60 | 0.2% |
| Japanese | 9 | 0.0% |
| Korean | 936 | 3.0% |
| Laotian | 13 | 0.0% |
| Lithuanian | 57 | 0.2% |
| Luxembourger | 4 | 0.0% |
| Macedonian | 11 | 0.0% |
| Mexican | 8,618 | 27.9% |
| Mexican American Indian | 268 | 0.9% |
| Native Hawaiian | 149 | 0.5% |
| Navajo | 13 | 0.0% |
| Nicaraguan | 38 | 0.1% |
| Nigerian | 177 | 0.6% |
| Norwegian | 169 | 0.5% |
| Peruvian | 17 | 0.1% |
| Polish | 861 | 2.8% |
| Portuguese | 36 | 0.1% |
| Puerto Rican | 815 | 2.6% |
| Russian | 168 | 0.5% |
| Salvadoran | 367 | 1.2% |
| Samoan | 31 | 0.1% |
| Scandinavian | 40 | 0.1% |
| Scotch-Irish | 97 | 0.3% |
| Scottish | 289 | 0.9% |
| Serbian | 24 | 0.1% |
| Sierra Leonean | 9 | 0.0% |
| Slovak | 5 | 0.0% |
| Slovene | 66 | 0.2% |
| South African | 35 | 0.1% |
| South American | 434 | 1.4% |
| Spaniard | 56 | 0.2% |
| Spanish | 76 | 0.3% |
| Sri Lankan | 81 | 0.3% |
| Subsaharan African | 504 | 1.6% |
| Swedish | 70 | 0.2% |
| Swiss | 74 | 0.2% |
| Thai | 426 | 1.4% |
| Turkish | 36 | 0.1% |
| Ukrainian | 25 | 0.1% |
| Venezuelan | 2 | 0.0% |
| Welsh | 27 | 0.1% |
| West Indian | 28 | 0.1% |
| Yugoslavian | 71 | 0.2% | View All 98 Rows |
Immigrants in North Chicago
The most numerous immigrant groups reported in North Chicago came from Latin America (4,055 | 13.1%), Central America (3,665 | 11.9%), Mexico (3,086 | 10.0%), Asia (873 | 2.8%), and South Eastern Asia (344 | 1.1%), together accounting for 38.9% of all North Chicago residents.
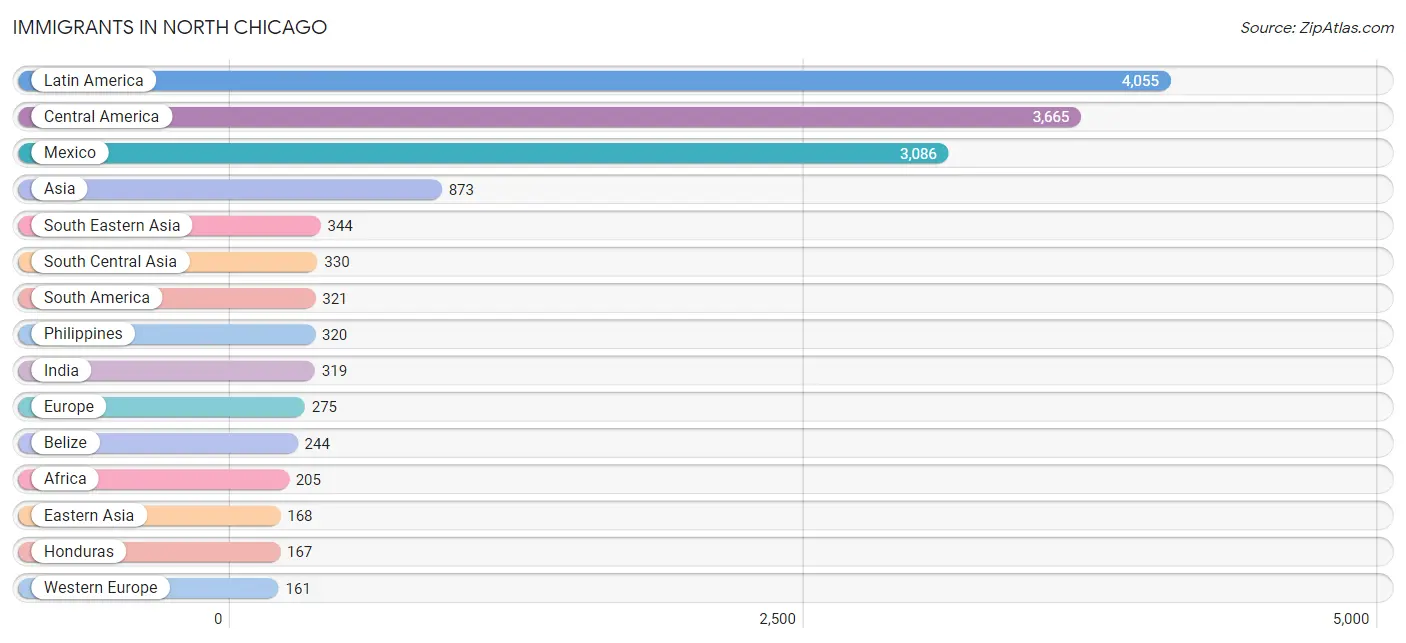
| Immigration Origin | # Population | % Population |
| Africa | 205 | 0.7% |
| Asia | 873 | 2.8% |
| Australia | 16 | 0.1% |
| Belize | 244 | 0.8% |
| Brazil | 48 | 0.2% |
| Caribbean | 69 | 0.2% |
| Central America | 3,665 | 11.9% |
| China | 145 | 0.5% |
| Colombia | 86 | 0.3% |
| Cuba | 23 | 0.1% |
| Dominican Republic | 16 | 0.1% |
| Eastern Africa | 59 | 0.2% |
| Eastern Asia | 168 | 0.5% |
| Eastern Europe | 106 | 0.3% |
| Ecuador | 151 | 0.5% |
| El Salvador | 105 | 0.3% |
| Europe | 275 | 0.9% |
| France | 123 | 0.4% |
| Germany | 38 | 0.1% |
| Guatemala | 25 | 0.1% |
| Haiti | 3 | 0.0% |
| Honduras | 167 | 0.5% |
| India | 319 | 1.0% |
| Jamaica | 27 | 0.1% |
| Japan | 13 | 0.0% |
| Kenya | 59 | 0.2% |
| Korea | 10 | 0.0% |
| Latin America | 4,055 | 13.1% |
| Mexico | 3,086 | 10.0% |
| Nicaragua | 38 | 0.1% |
| Nigeria | 73 | 0.2% |
| Oceania | 16 | 0.1% |
| Pakistan | 11 | 0.0% |
| Peru | 28 | 0.1% |
| Philippines | 320 | 1.0% |
| Poland | 22 | 0.1% |
| Russia | 84 | 0.3% |
| Saudi Arabia | 15 | 0.1% |
| South Africa | 35 | 0.1% |
| South America | 321 | 1.0% |
| South Central Asia | 330 | 1.1% |
| South Eastern Asia | 344 | 1.1% |
| Southern Europe | 8 | 0.0% |
| Spain | 8 | 0.0% |
| Taiwan | 16 | 0.1% |
| Turkey | 16 | 0.1% |
| Uruguay | 2 | 0.0% |
| Venezuela | 6 | 0.0% |
| Vietnam | 24 | 0.1% |
| Western Africa | 111 | 0.4% |
| Western Asia | 31 | 0.1% |
| Western Europe | 161 | 0.5% | View All 52 Rows |
Sex and Age in North Chicago
Sex and Age in North Chicago
The most populous age groups in North Chicago are 20 to 24 Years (4,735 | 25.5%) for men and 20 to 24 Years (2,303 | 18.7%) for women.
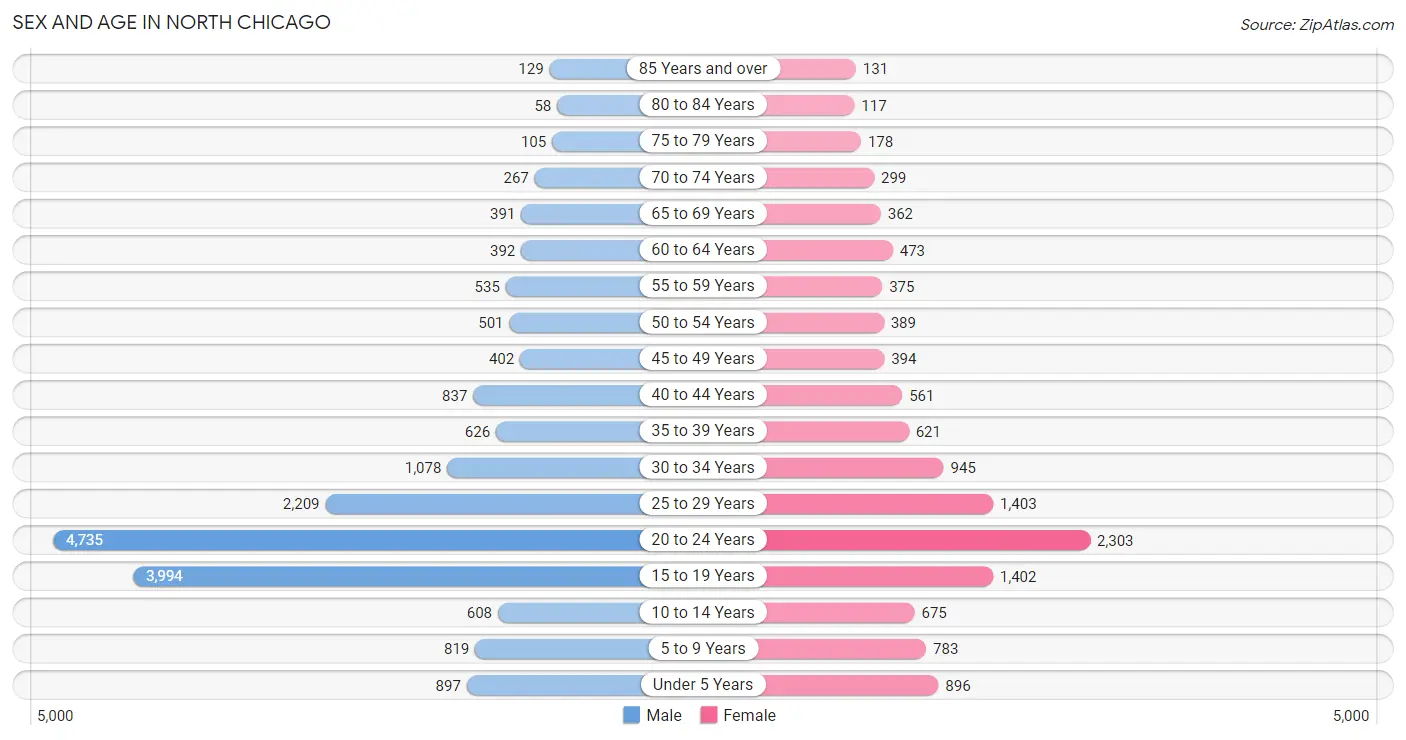
| Age Bracket | Male | Female |
| Under 5 Years | 897 (4.8%) | 896 (7.3%) |
| 5 to 9 Years | 819 (4.4%) | 783 (6.4%) |
| 10 to 14 Years | 608 (3.3%) | 675 (5.5%) |
| 15 to 19 Years | 3,994 (21.5%) | 1,402 (11.4%) |
| 20 to 24 Years | 4,735 (25.5%) | 2,303 (18.7%) |
| 25 to 29 Years | 2,209 (11.9%) | 1,403 (11.4%) |
| 30 to 34 Years | 1,078 (5.8%) | 945 (7.7%) |
| 35 to 39 Years | 626 (3.4%) | 621 (5.1%) |
| 40 to 44 Years | 837 (4.5%) | 561 (4.6%) |
| 45 to 49 Years | 402 (2.2%) | 394 (3.2%) |
| 50 to 54 Years | 501 (2.7%) | 389 (3.2%) |
| 55 to 59 Years | 535 (2.9%) | 375 (3.0%) |
| 60 to 64 Years | 392 (2.1%) | 473 (3.8%) |
| 65 to 69 Years | 391 (2.1%) | 362 (2.9%) |
| 70 to 74 Years | 267 (1.4%) | 299 (2.4%) |
| 75 to 79 Years | 105 (0.6%) | 178 (1.5%) |
| 80 to 84 Years | 58 (0.3%) | 117 (0.9%) |
| 85 Years and over | 129 (0.7%) | 131 (1.1%) |
| Total | 18,583 (100.0%) | 12,307 (100.0%) |
Families and Households in North Chicago
Median Family Size in North Chicago
The median family size in North Chicago is 3.47 persons per family, with married-couple families (2,616 | 59.8%) accounting for the largest median family size of 3.71 persons per family. On the other hand, single male/father families (645 | 14.7%) represent the smallest median family size with 2.95 persons per family.
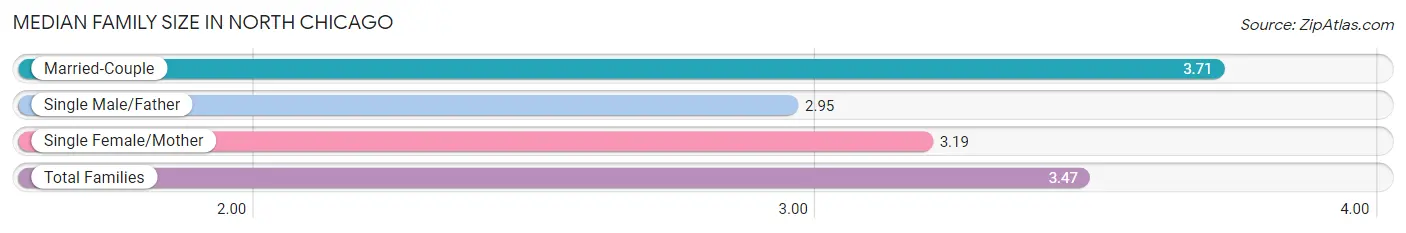
| Family Type | # Families | Family Size |
| Married-Couple | 2,616 (59.8%) | 3.71 |
| Single Male/Father | 645 (14.7%) | 2.95 |
| Single Female/Mother | 1,112 (25.4%) | 3.19 |
| Total Families | 4,373 (100.0%) | 3.47 |
Median Household Size in North Chicago
The median household size in North Chicago is 2.62 persons per household, with married-couple households (2,616 | 34.9%) accounting for the largest median household size of 3.75 persons per household. non-family households (3,114 | 41.6%) represent the smallest median household size with 1.26 persons per household.
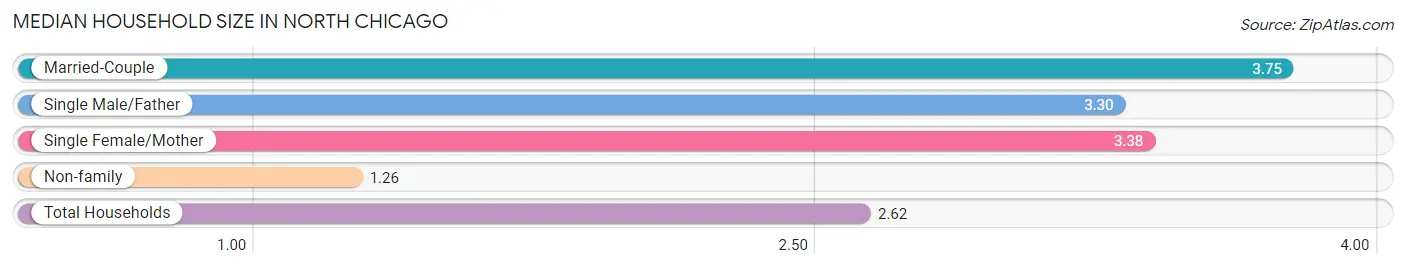
| Household Type | # Households | Household Size |
| Married-Couple | 2,616 (34.9%) | 3.75 |
| Single Male/Father | 645 (8.6%) | 3.30 |
| Single Female/Mother | 1,112 (14.8%) | 3.38 |
| Non-family | 3,114 (41.6%) | 1.26 |
| Total Households | 7,487 (100.0%) | 2.62 |
Household Size by Marriage Status in North Chicago
Out of a total of 7,487 households in North Chicago, 4,373 (58.4%) are family households, while 3,114 (41.6%) are nonfamily households. The most numerous type of family households are 2-person households, comprising 1,319, and the most common type of nonfamily households are 1-person households, comprising 2,359.
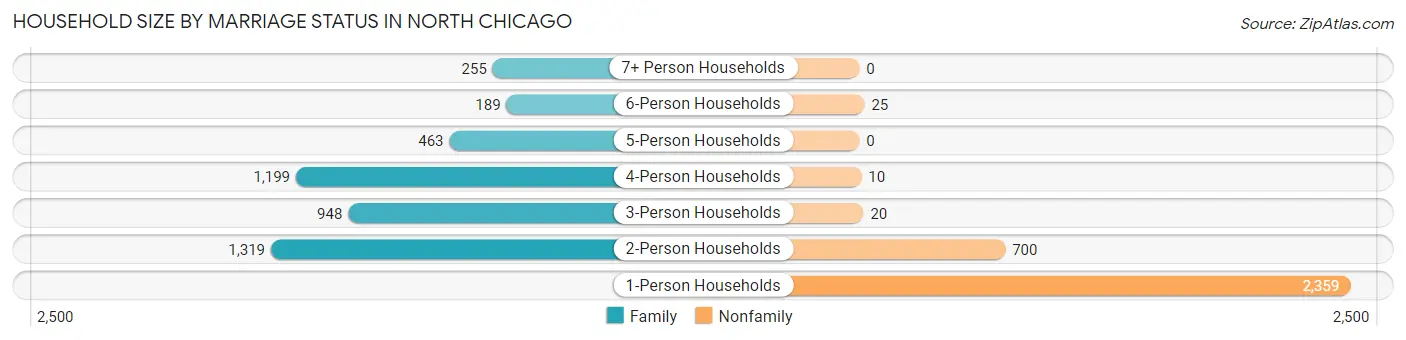
| Household Size | Family Households | Nonfamily Households |
| 1-Person Households | - | 2,359 (31.5%) |
| 2-Person Households | 1,319 (17.6%) | 700 (9.3%) |
| 3-Person Households | 948 (12.7%) | 20 (0.3%) |
| 4-Person Households | 1,199 (16.0%) | 10 (0.1%) |
| 5-Person Households | 463 (6.2%) | 0 (0.0%) |
| 6-Person Households | 189 (2.5%) | 25 (0.3%) |
| 7+ Person Households | 255 (3.4%) | 0 (0.0%) |
| Total | 4,373 (58.4%) | 3,114 (41.6%) |
Female Fertility in North Chicago
Fertility by Age in North Chicago
Average fertility rate in North Chicago is 47.0 births per 1,000 women. Women in the age bracket of 20 to 34 years have the highest fertility rate with 61.0 births per 1,000 women. Women in the age bracket of 20 to 34 years acount for 78.6% of all women with births.
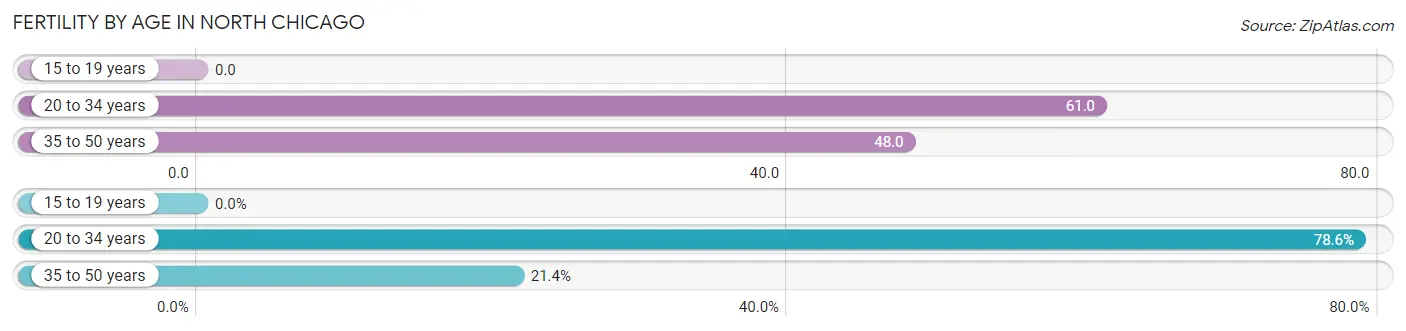
| Age Bracket | Women with Births | Births / 1,000 Women |
| 15 to 19 years | 0 (0.0%) | 0.0 |
| 20 to 34 years | 286 (78.6%) | 61.0 |
| 35 to 50 years | 78 (21.4%) | 48.0 |
| Total | 364 (100.0%) | 47.0 |
Fertility by Age by Marriage Status in North Chicago
69.5% of women with births (364) in North Chicago are married. The highest percentage of unmarried women with births falls into 20 to 34 years age bracket with 38.8% of them unmarried at the time of birth, while the lowest percentage of unmarried women with births belong to 35 to 50 years age bracket with 0.0% of them unmarried.
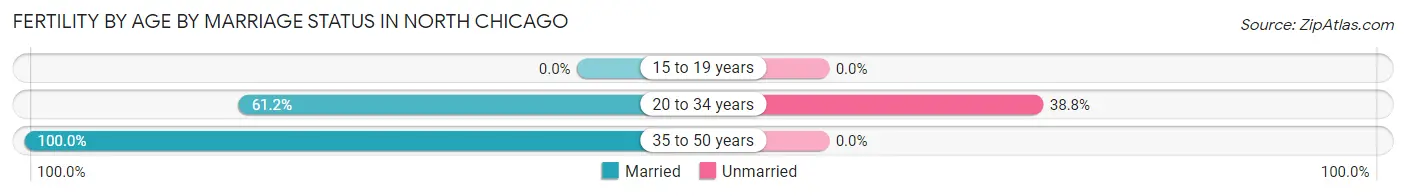
| Age Bracket | Married | Unmarried |
| 15 to 19 years | 0 (0.0%) | 0 (0.0%) |
| 20 to 34 years | 175 (61.2%) | 111 (38.8%) |
| 35 to 50 years | 78 (100.0%) | 0 (0.0%) |
| Total | 253 (69.5%) | 111 (30.5%) |
Fertility by Education in North Chicago
Average fertility rate in North Chicago is 47.0 births per 1,000 women. Women with the education attainment of less than high school have the highest fertility rate of 99.0 births per 1,000 women, while women with the education attainment of high school diploma have the lowest fertility at 21.0 births per 1,000 women. Women with the education attainment of college or associate's degree represent 40.7% of all women with births.
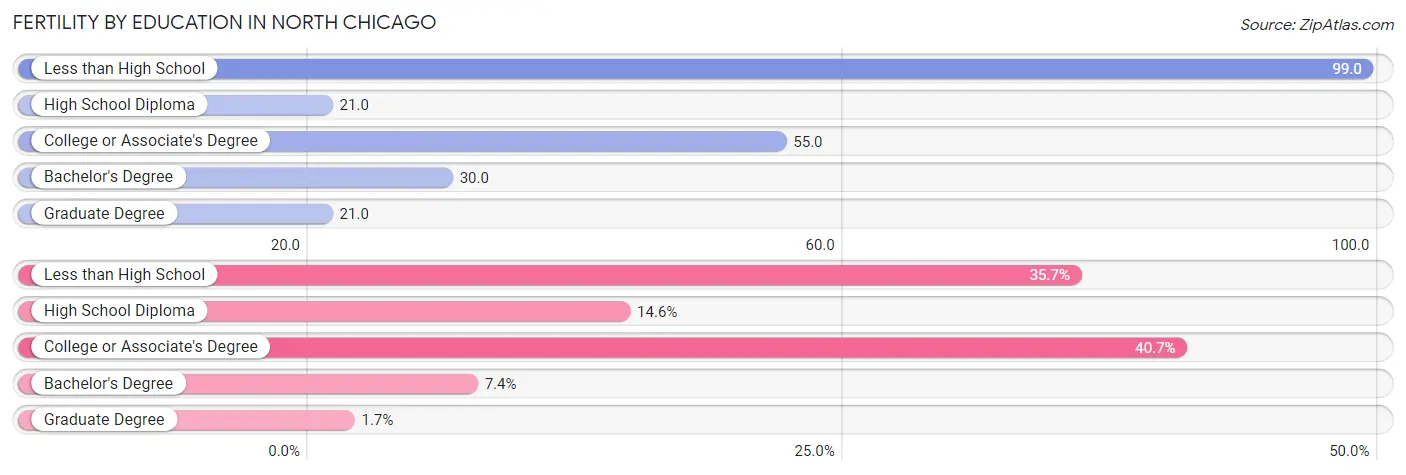
| Educational Attainment | Women with Births | Births / 1,000 Women |
| Less than High School | 130 (35.7%) | 99.0 |
| High School Diploma | 53 (14.6%) | 21.0 |
| College or Associate's Degree | 148 (40.7%) | 55.0 |
| Bachelor's Degree | 27 (7.4%) | 30.0 |
| Graduate Degree | 6 (1.7%) | 21.0 |
| Total | 364 (100.0%) | 47.0 |
Fertility by Education by Marriage Status in North Chicago
30.5% of women with births in North Chicago are unmarried. Women with the educational attainment of graduate degree are most likely to be married with 100.0% of them married at childbirth, while women with the educational attainment of high school diploma are least likely to be married with 100.0% of them unmarried at childbirth.
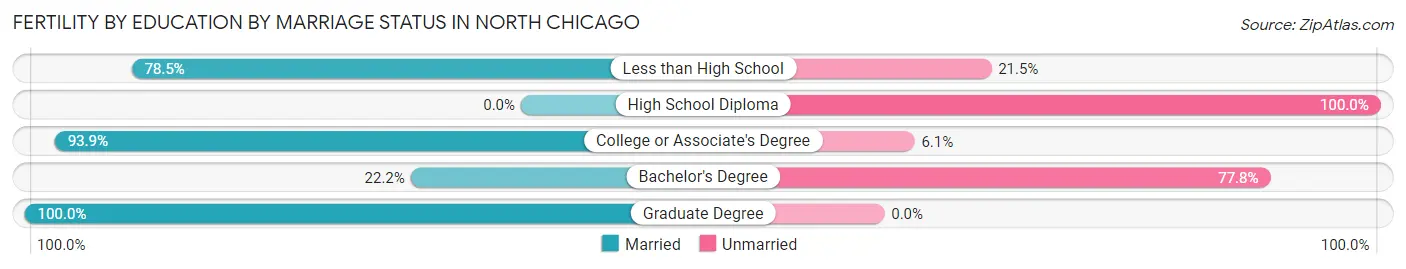
| Educational Attainment | Married | Unmarried |
| Less than High School | 102 (78.5%) | 28 (21.5%) |
| High School Diploma | 0 (0.0%) | 53 (100.0%) |
| College or Associate's Degree | 139 (93.9%) | 9 (6.1%) |
| Bachelor's Degree | 6 (22.2%) | 21 (77.8%) |
| Graduate Degree | 6 (100.0%) | 0 (0.0%) |
| Total | 253 (69.5%) | 111 (30.5%) |
Employment Characteristics in North Chicago
Employment by Class of Employer in North Chicago
Among the 17,365 employed individuals in North Chicago, federal government employees (8,599 | 49.5%), private company employees (6,915 | 39.8%), and not-for-profit organizations (549 | 3.2%) make up the most common classes of employment.
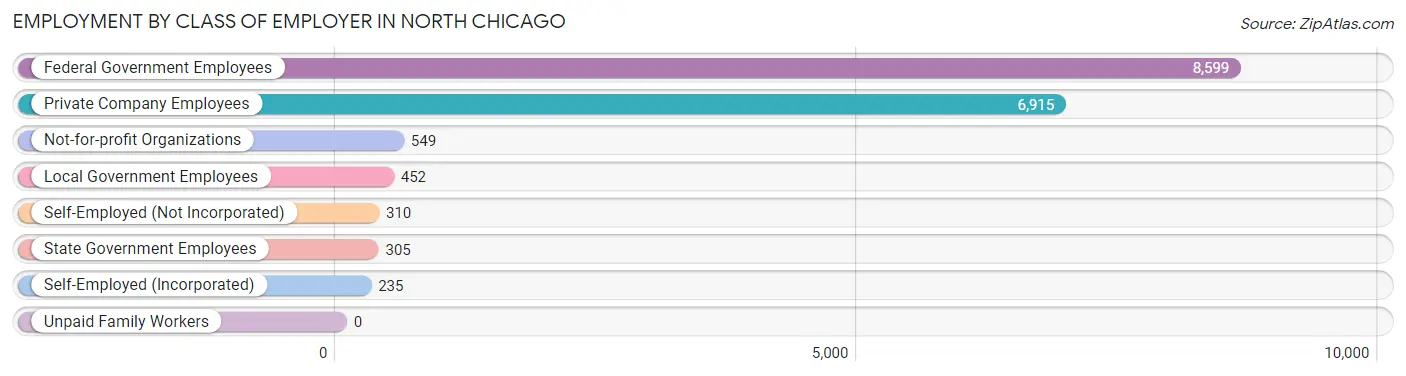
| Employer Class | # Employees | % Employees |
| Private Company Employees | 6,915 | 39.8% |
| Self-Employed (Incorporated) | 235 | 1.3% |
| Self-Employed (Not Incorporated) | 310 | 1.8% |
| Not-for-profit Organizations | 549 | 3.2% |
| Local Government Employees | 452 | 2.6% |
| State Government Employees | 305 | 1.8% |
| Federal Government Employees | 8,599 | 49.5% |
| Unpaid Family Workers | 0 | 0.0% |
| Total | 17,365 | 100.0% |
Employment Status by Age in North Chicago
According to the labor force statistics for North Chicago, out of the total population over 16 years of age (26,026), 76.0% or 19,780 individuals are in the labor force, with 9.5% or 1,879 of them unemployed. The age group with the highest labor force participation rate is 35 to 44 years, with 84.9% or 2,246 individuals in the labor force. Within the labor force, the 30 to 34 years age range has the highest percentage of unemployed individuals, with 15.1% or 256 of them being unemployed.
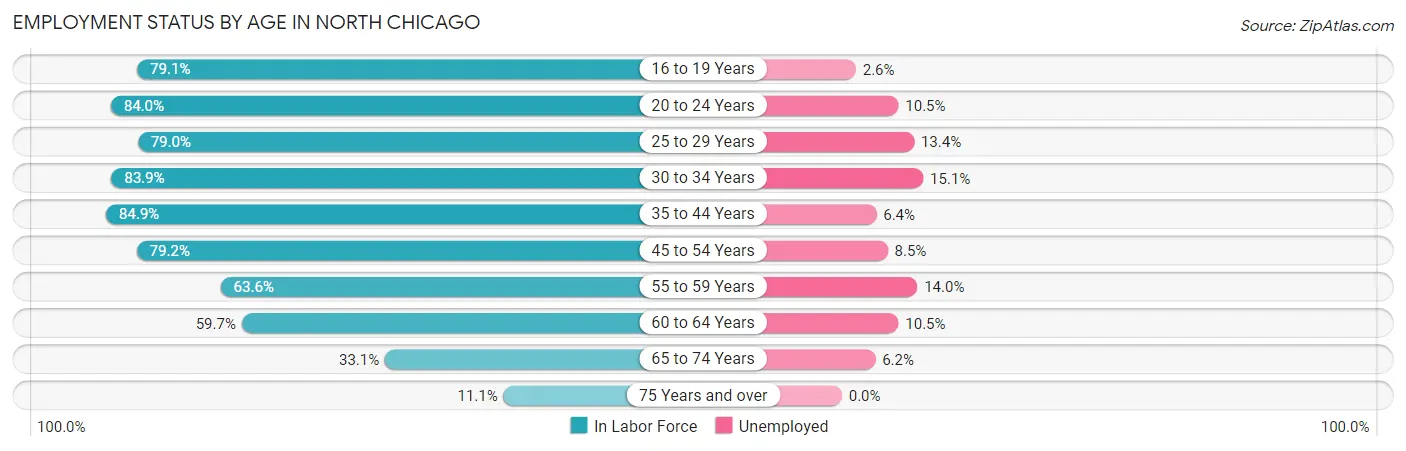
| Age Bracket | In Labor Force | Unemployed |
| 16 to 19 Years | 4,121 (79.1%) | 107 (2.6%) |
| 20 to 24 Years | 5,912 (84.0%) | 621 (10.5%) |
| 25 to 29 Years | 2,853 (79.0%) | 382 (13.4%) |
| 30 to 34 Years | 1,697 (83.9%) | 256 (15.1%) |
| 35 to 44 Years | 2,246 (84.9%) | 144 (6.4%) |
| 45 to 54 Years | 1,335 (79.2%) | 113 (8.5%) |
| 55 to 59 Years | 579 (63.6%) | 81 (14.0%) |
| 60 to 64 Years | 516 (59.7%) | 54 (10.5%) |
| 65 to 74 Years | 437 (33.1%) | 27 (6.2%) |
| 75 Years and over | 80 (11.1%) | 0 (0.0%) |
| Total | 19,780 (76.0%) | 1,879 (9.5%) |
Employment Status by Educational Attainment in North Chicago
According to labor force statistics for North Chicago, 78.6% of individuals (9,228) out of the total population between 25 and 64 years of age (11,741) are in the labor force, with 10.8% or 997 of them being unemployed. The group with the highest labor force participation rate are those with the educational attainment of college / associate degree, with 88.0% or 3,464 individuals in the labor force. Within the labor force, individuals with college / associate degree education have the highest percentage of unemployment, with 15.7% or 544 of them being unemployed.
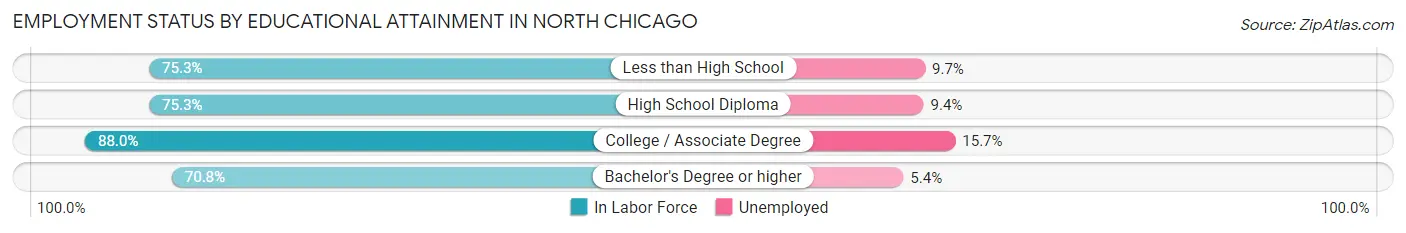
| Educational Attainment | In Labor Force | Unemployed |
| Less than High School | 1,609 (75.3%) | 207 (9.7%) |
| High School Diploma | 2,370 (75.3%) | 296 (9.4%) |
| College / Associate Degree | 3,464 (88.0%) | 618 (15.7%) |
| Bachelor's Degree or higher | 1,784 (70.8%) | 136 (5.4%) |
| Total | 9,228 (78.6%) | 1,268 (10.8%) |
Employment Occupations by Sex in North Chicago
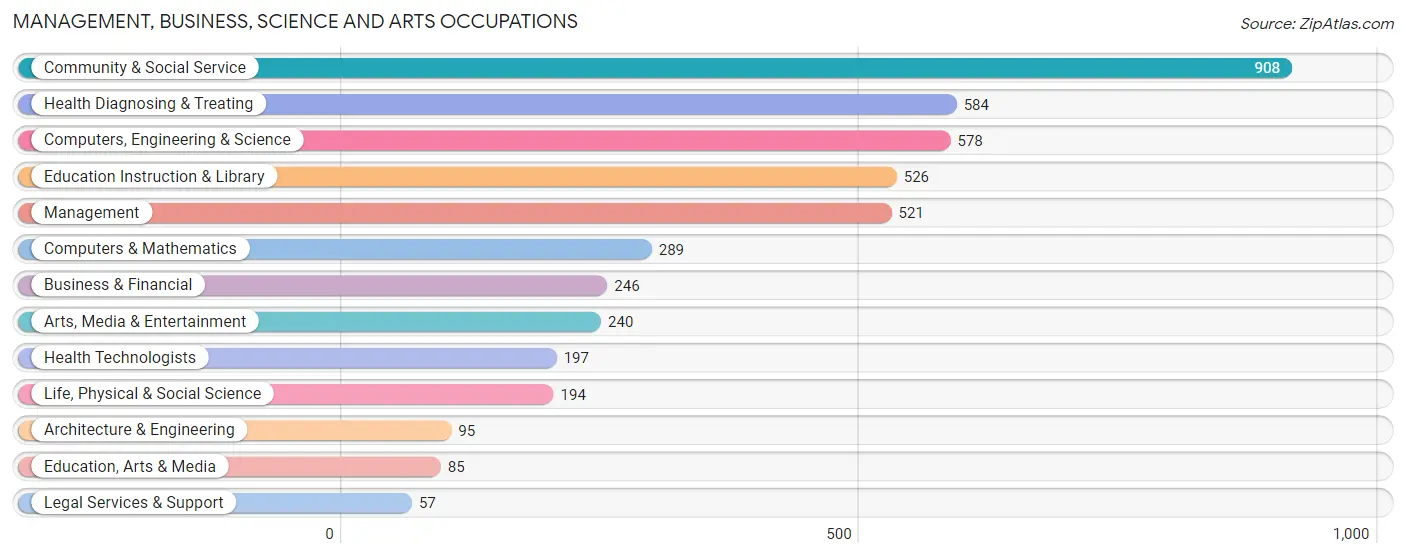
Management, Business, Science and Arts Occupations
The most common Management, Business, Science and Arts occupations in North Chicago are Community & Social Service (908 | 8.8%), Health Diagnosing & Treating (584 | 5.7%), Computers, Engineering & Science (578 | 5.6%), Education Instruction & Library (526 | 5.1%), and Management (521 | 5.1%).
Management, Business, Science and Arts Occupations by Sex
Within the Management, Business, Science and Arts occupations in North Chicago, the most male-oriented occupations are Architecture & Engineering (100.0%), Life, Physical & Social Science (89.7%), and Computers, Engineering & Science (87.9%), while the most female-oriented occupations are Health Technologists (84.8%), Health Diagnosing & Treating (78.8%), and Education, Arts & Media (63.5%).
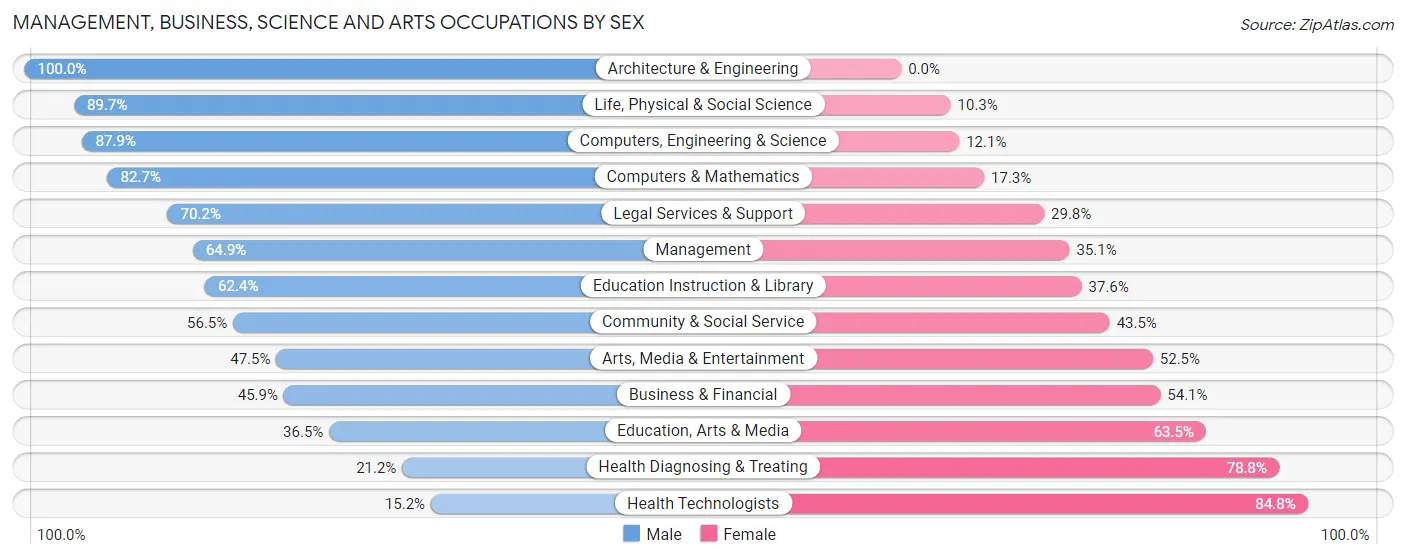
| Occupation | Male | Female |
| Management | 338 (64.9%) | 183 (35.1%) |
| Business & Financial | 113 (45.9%) | 133 (54.1%) |
| Computers, Engineering & Science | 508 (87.9%) | 70 (12.1%) |
| Computers & Mathematics | 239 (82.7%) | 50 (17.3%) |
| Architecture & Engineering | 95 (100.0%) | 0 (0.0%) |
| Life, Physical & Social Science | 174 (89.7%) | 20 (10.3%) |
| Community & Social Service | 513 (56.5%) | 395 (43.5%) |
| Education, Arts & Media | 31 (36.5%) | 54 (63.5%) |
| Legal Services & Support | 40 (70.2%) | 17 (29.8%) |
| Education Instruction & Library | 328 (62.4%) | 198 (37.6%) |
| Arts, Media & Entertainment | 114 (47.5%) | 126 (52.5%) |
| Health Diagnosing & Treating | 124 (21.2%) | 460 (78.8%) |
| Health Technologists | 30 (15.2%) | 167 (84.8%) |
| Total (Category) | 1,596 (56.3%) | 1,241 (43.7%) |
| Total (Overall) | 5,997 (58.2%) | 4,311 (41.8%) |
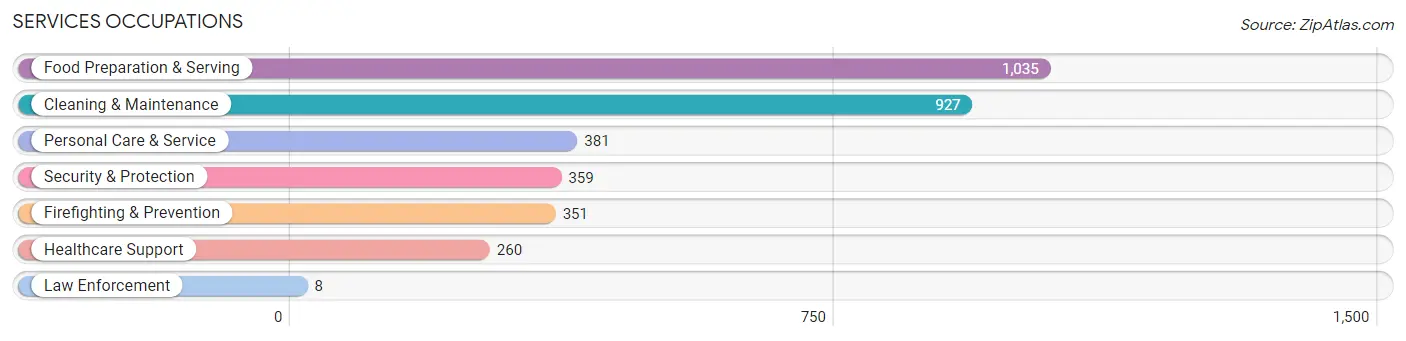
Services Occupations
The most common Services occupations in North Chicago are Food Preparation & Serving (1,035 | 10.0%), Cleaning & Maintenance (927 | 9.0%), Personal Care & Service (381 | 3.7%), Security & Protection (359 | 3.5%), and Firefighting & Prevention (351 | 3.4%).
Services Occupations by Sex
Within the Services occupations in North Chicago, the most male-oriented occupations are Firefighting & Prevention (91.7%), Security & Protection (90.2%), and Cleaning & Maintenance (77.4%), while the most female-oriented occupations are Healthcare Support (85.8%), Personal Care & Service (75.8%), and Law Enforcement (75.0%).
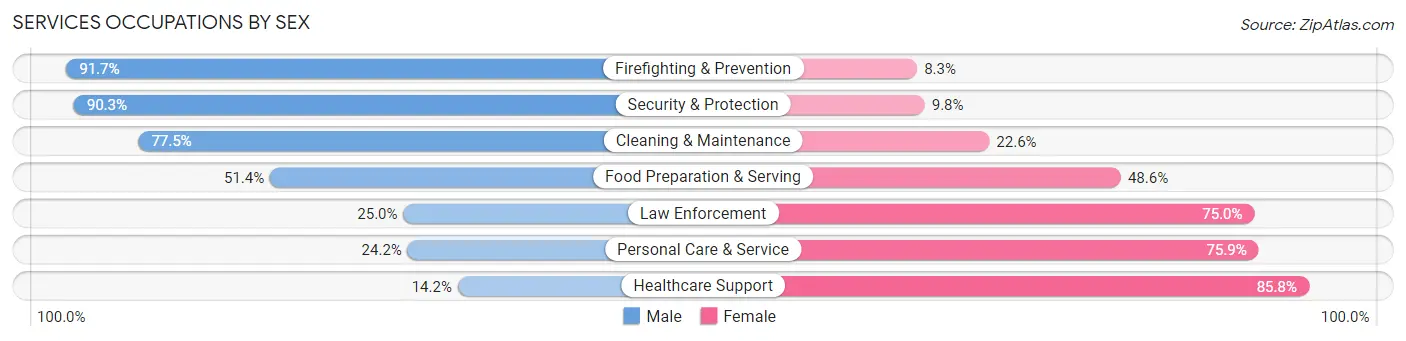
| Occupation | Male | Female |
| Healthcare Support | 37 (14.2%) | 223 (85.8%) |
| Security & Protection | 324 (90.2%) | 35 (9.8%) |
| Firefighting & Prevention | 322 (91.7%) | 29 (8.3%) |
| Law Enforcement | 2 (25.0%) | 6 (75.0%) |
| Food Preparation & Serving | 532 (51.4%) | 503 (48.6%) |
| Cleaning & Maintenance | 718 (77.4%) | 209 (22.6%) |
| Personal Care & Service | 92 (24.1%) | 289 (75.8%) |
| Total (Category) | 1,703 (57.5%) | 1,259 (42.5%) |
| Total (Overall) | 5,997 (58.2%) | 4,311 (41.8%) |
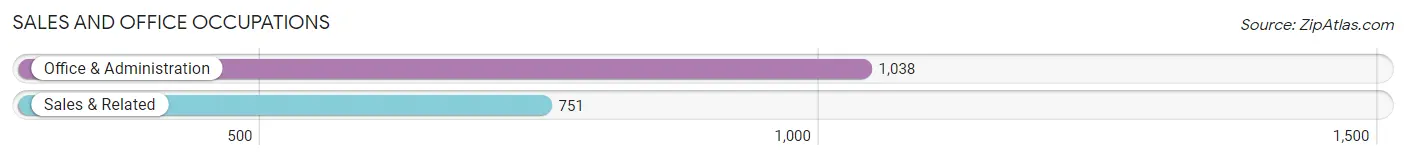
Sales and Office Occupations
The most common Sales and Office occupations in North Chicago are Office & Administration (1,038 | 10.1%), and Sales & Related (751 | 7.3%).
Sales and Office Occupations by Sex
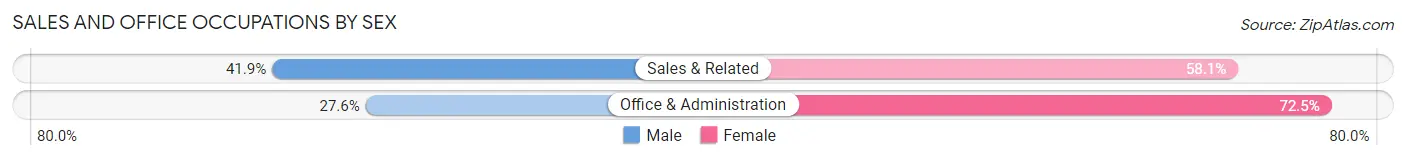
| Occupation | Male | Female |
| Sales & Related | 315 (41.9%) | 436 (58.1%) |
| Office & Administration | 286 (27.6%) | 752 (72.5%) |
| Total (Category) | 601 (33.6%) | 1,188 (66.4%) |
| Total (Overall) | 5,997 (58.2%) | 4,311 (41.8%) |
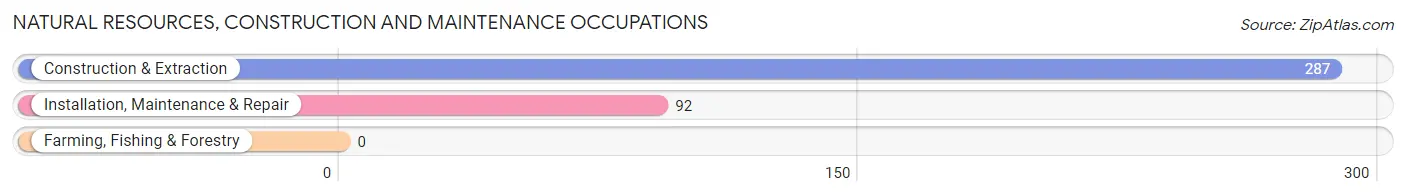
Natural Resources, Construction and Maintenance Occupations
The most common Natural Resources, Construction and Maintenance occupations in North Chicago are Construction & Extraction (287 | 2.8%), and Installation, Maintenance & Repair (92 | 0.9%).
Natural Resources, Construction and Maintenance Occupations by Sex
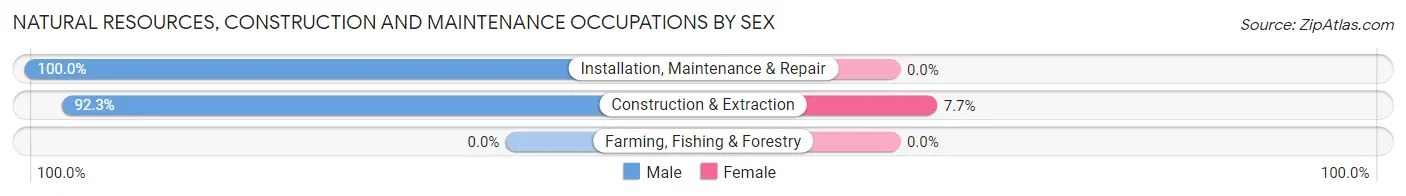
| Occupation | Male | Female |
| Farming, Fishing & Forestry | 0 (0.0%) | 0 (0.0%) |
| Construction & Extraction | 265 (92.3%) | 22 (7.7%) |
| Installation, Maintenance & Repair | 92 (100.0%) | 0 (0.0%) |
| Total (Category) | 357 (94.2%) | 22 (5.8%) |
| Total (Overall) | 5,997 (58.2%) | 4,311 (41.8%) |
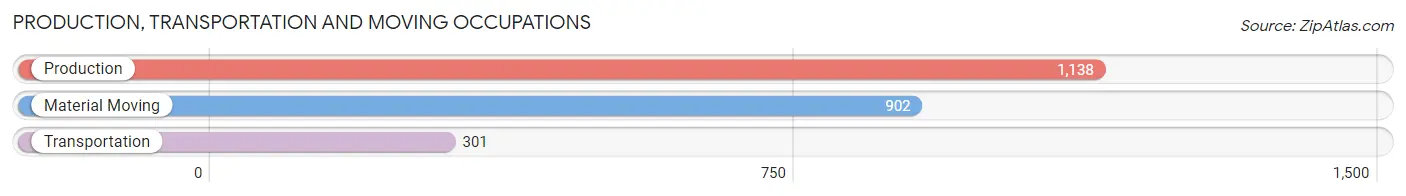
Production, Transportation and Moving Occupations
The most common Production, Transportation and Moving occupations in North Chicago are Production (1,138 | 11.0%), Material Moving (902 | 8.7%), and Transportation (301 | 2.9%).
Production, Transportation and Moving Occupations by Sex
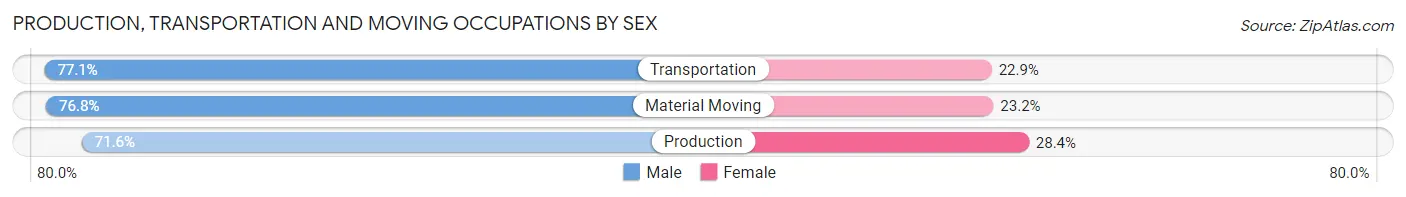
| Occupation | Male | Female |
| Production | 815 (71.6%) | 323 (28.4%) |
| Transportation | 232 (77.1%) | 69 (22.9%) |
| Material Moving | 693 (76.8%) | 209 (23.2%) |
| Total (Category) | 1,740 (74.3%) | 601 (25.7%) |
| Total (Overall) | 5,997 (58.2%) | 4,311 (41.8%) |
Employment Industries by Sex in North Chicago
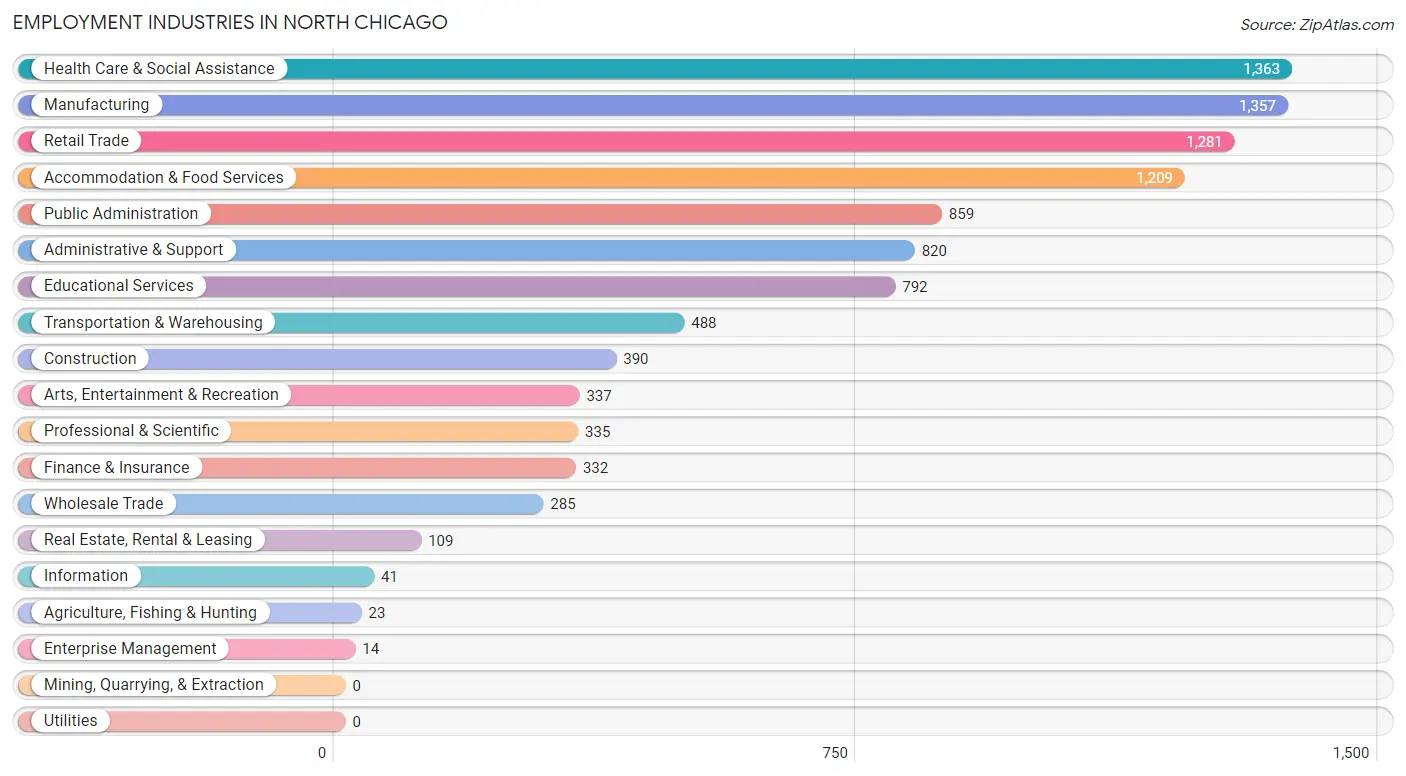
Employment Industries in North Chicago
The major employment industries in North Chicago include Health Care & Social Assistance (1,363 | 13.2%), Manufacturing (1,357 | 13.2%), Retail Trade (1,281 | 12.4%), Accommodation & Food Services (1,209 | 11.7%), and Public Administration (859 | 8.3%).
Employment Industries by Sex in North Chicago
The North Chicago industries that see more men than women are Agriculture, Fishing & Hunting (100.0%), Construction (92.6%), and Wholesale Trade (74.7%), whereas the industries that tend to have a higher number of women are Information (100.0%), Enterprise Management (100.0%), and Real Estate, Rental & Leasing (78.0%).
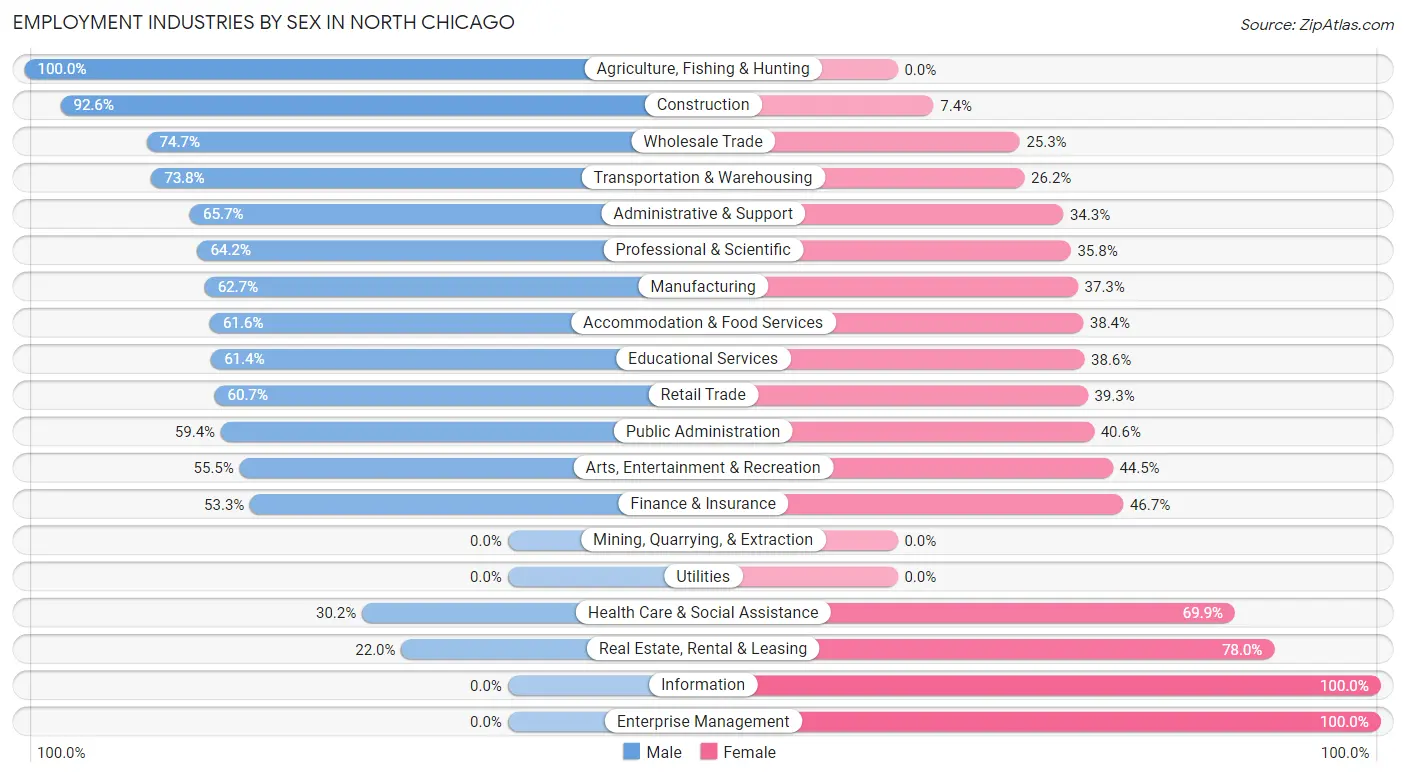
| Industry | Male | Female |
| Agriculture, Fishing & Hunting | 23 (100.0%) | 0 (0.0%) |
| Mining, Quarrying, & Extraction | 0 (0.0%) | 0 (0.0%) |
| Construction | 361 (92.6%) | 29 (7.4%) |
| Manufacturing | 851 (62.7%) | 506 (37.3%) |
| Wholesale Trade | 213 (74.7%) | 72 (25.3%) |
| Retail Trade | 777 (60.7%) | 504 (39.3%) |
| Transportation & Warehousing | 360 (73.8%) | 128 (26.2%) |
| Utilities | 0 (0.0%) | 0 (0.0%) |
| Information | 0 (0.0%) | 41 (100.0%) |
| Finance & Insurance | 177 (53.3%) | 155 (46.7%) |
| Real Estate, Rental & Leasing | 24 (22.0%) | 85 (78.0%) |
| Professional & Scientific | 215 (64.2%) | 120 (35.8%) |
| Enterprise Management | 0 (0.0%) | 14 (100.0%) |
| Administrative & Support | 539 (65.7%) | 281 (34.3%) |
| Educational Services | 486 (61.4%) | 306 (38.6%) |
| Health Care & Social Assistance | 411 (30.1%) | 952 (69.9%) |
| Arts, Entertainment & Recreation | 187 (55.5%) | 150 (44.5%) |
| Accommodation & Food Services | 745 (61.6%) | 464 (38.4%) |
| Public Administration | 510 (59.4%) | 349 (40.6%) |
| Total | 5,997 (58.2%) | 4,311 (41.8%) |
Education in North Chicago
School Enrollment in North Chicago
The most common levels of schooling among the 6,849 students in North Chicago are college / undergraduate (1,600 | 23.4%), elementary school (1,254 | 18.3%), and graduate / professional (1,220 | 17.8%).
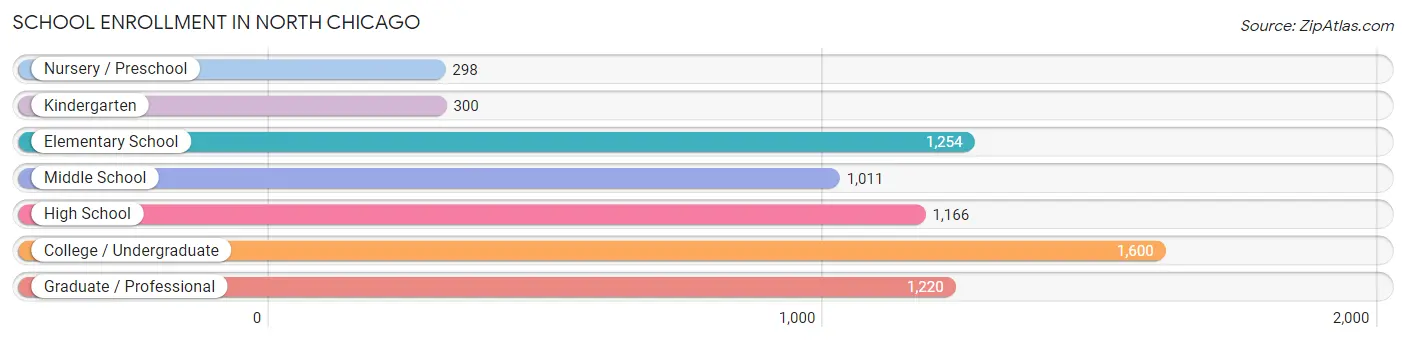
| School Level | # Students | % Students |
| Nursery / Preschool | 298 | 4.3% |
| Kindergarten | 300 | 4.4% |
| Elementary School | 1,254 | 18.3% |
| Middle School | 1,011 | 14.8% |
| High School | 1,166 | 17.0% |
| College / Undergraduate | 1,600 | 23.4% |
| Graduate / Professional | 1,220 | 17.8% |
| Total | 6,849 | 100.0% |
School Enrollment by Age by Funding Source in North Chicago
Out of a total of 6,849 students who are enrolled in schools in North Chicago, 2,048 (29.9%) attend a private institution, while the remaining 4,801 (70.1%) are enrolled in public schools. The age group of 20 to 24 year olds has the highest likelihood of being enrolled in private schools, with 723 (68.0% in the age bracket) enrolled. Conversely, the age group of 10 to 14 year olds has the lowest likelihood of being enrolled in a private school, with 1,154 (92.4% in the age bracket) attending a public institution.
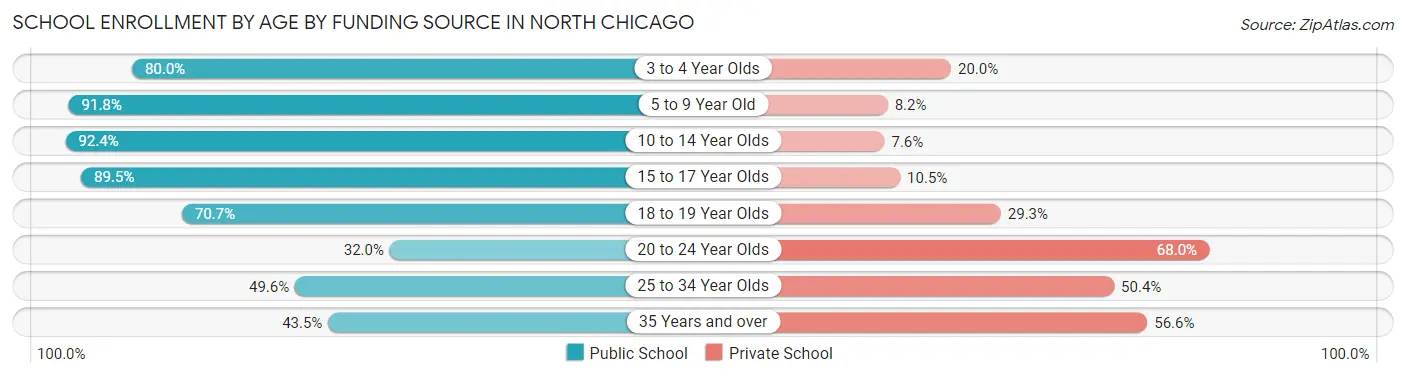
| Age Bracket | Public School | Private School |
| 3 to 4 Year Olds | 180 (80.0%) | 45 (20.0%) |
| 5 to 9 Year Old | 1,411 (91.8%) | 126 (8.2%) |
| 10 to 14 Year Olds | 1,154 (92.4%) | 95 (7.6%) |
| 15 to 17 Year Olds | 519 (89.5%) | 61 (10.5%) |
| 18 to 19 Year Olds | 425 (70.7%) | 176 (29.3%) |
| 20 to 24 Year Olds | 340 (32.0%) | 723 (68.0%) |
| 25 to 34 Year Olds | 647 (49.6%) | 657 (50.4%) |
| 35 Years and over | 126 (43.4%) | 164 (56.6%) |
| Total | 4,801 (70.1%) | 2,048 (29.9%) |
Educational Attainment by Field of Study in North Chicago
Business (477 | 14.9%), bio, nature & agricultural (452 | 14.2%), social sciences (296 | 9.3%), education (286 | 9.0%), and arts & humanities (254 | 8.0%) are the most common fields of study among 3,193 individuals in North Chicago who have obtained a bachelor's degree or higher.
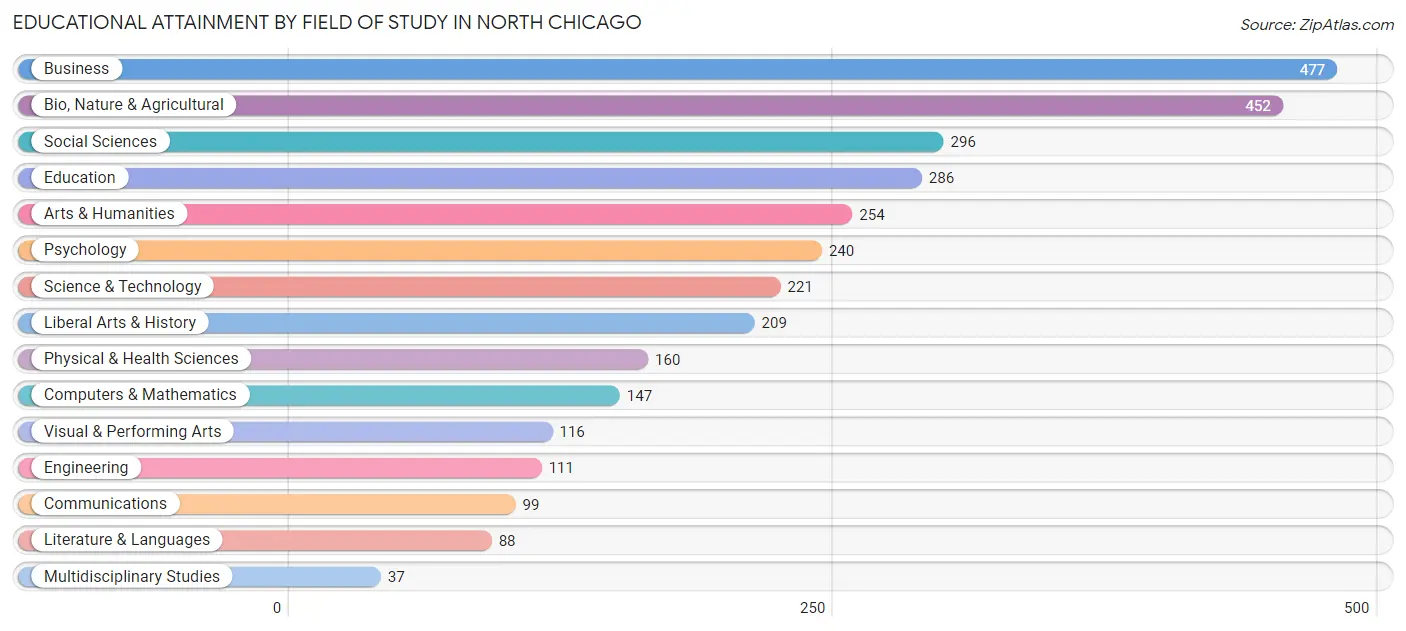
| Field of Study | # Graduates | % Graduates |
| Computers & Mathematics | 147 | 4.6% |
| Bio, Nature & Agricultural | 452 | 14.2% |
| Physical & Health Sciences | 160 | 5.0% |
| Psychology | 240 | 7.5% |
| Social Sciences | 296 | 9.3% |
| Engineering | 111 | 3.5% |
| Multidisciplinary Studies | 37 | 1.2% |
| Science & Technology | 221 | 6.9% |
| Business | 477 | 14.9% |
| Education | 286 | 9.0% |
| Literature & Languages | 88 | 2.8% |
| Liberal Arts & History | 209 | 6.6% |
| Visual & Performing Arts | 116 | 3.6% |
| Communications | 99 | 3.1% |
| Arts & Humanities | 254 | 8.0% |
| Total | 3,193 | 100.0% |
Transportation & Commute in North Chicago
Vehicle Availability by Sex in North Chicago
The most prevalent vehicle ownership categories in North Chicago are males with 2 vehicles (1,996, accounting for 40.3%) and females with 2 vehicles (1,424, making up 51.7%).
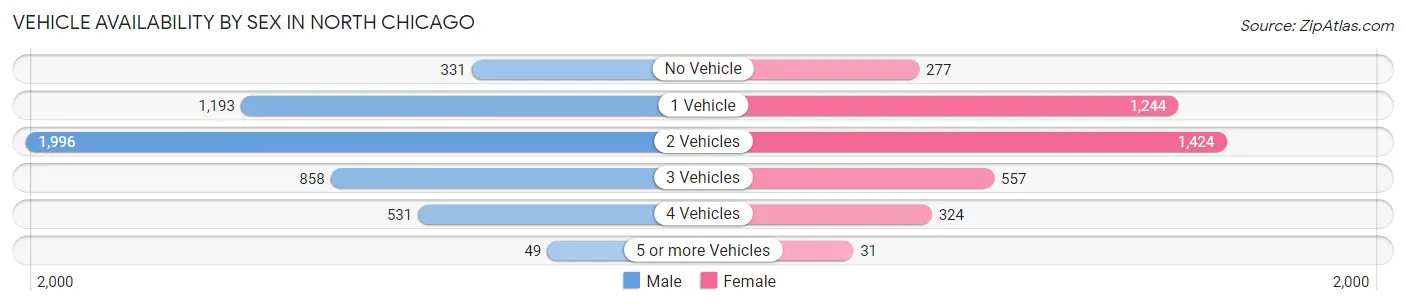
| Vehicles Available | Male | Female |
| No Vehicle | 331 (6.7%) | 277 (7.2%) |
| 1 Vehicle | 1,193 (24.1%) | 1,244 (32.3%) |
| 2 Vehicles | 1,996 (40.3%) | 1,424 (36.9%) |
| 3 Vehicles | 858 (17.3%) | 557 (14.4%) |
| 4 Vehicles | 531 (10.7%) | 324 (8.4%) |
| 5 or more Vehicles | 49 (1.0%) | 31 (0.8%) |
| Total | 4,958 (100.0%) | 3,857 (100.0%) |
Commute Time in North Chicago
The most frequently occuring commute durations in North Chicago are 10 to 14 minutes (3,237 commuters, 22.5%), 5 to 9 minutes (2,773 commuters, 19.3%), and 15 to 19 minutes (2,144 commuters, 14.9%).
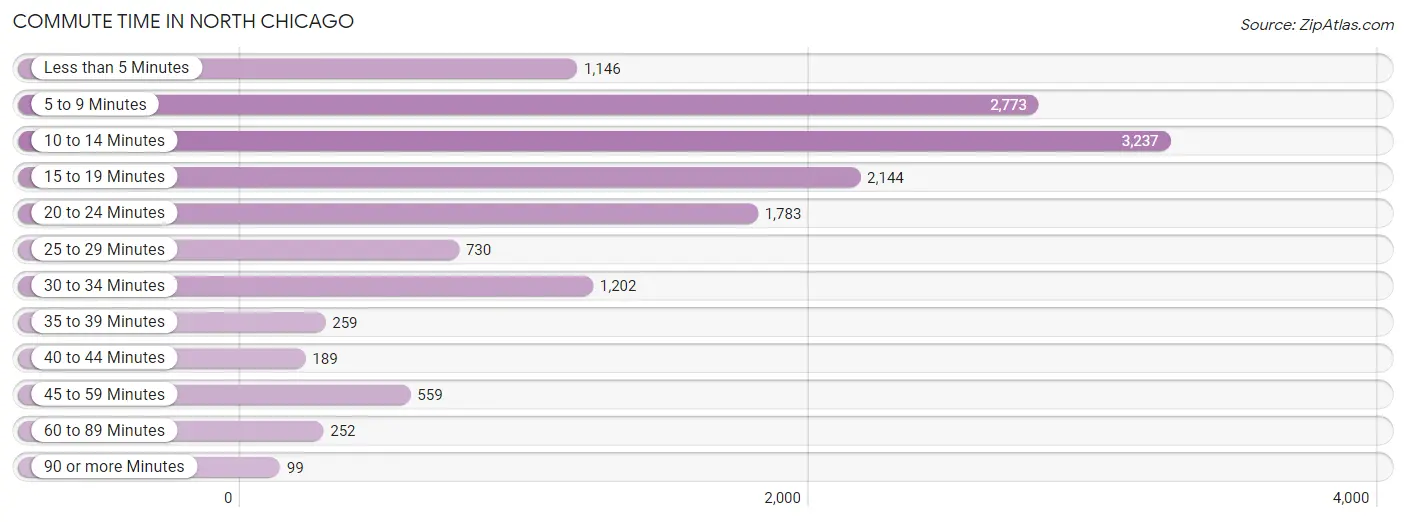
| Commute Time | # Commuters | % Commuters |
| Less than 5 Minutes | 1,146 | 8.0% |
| 5 to 9 Minutes | 2,773 | 19.3% |
| 10 to 14 Minutes | 3,237 | 22.5% |
| 15 to 19 Minutes | 2,144 | 14.9% |
| 20 to 24 Minutes | 1,783 | 12.4% |
| 25 to 29 Minutes | 730 | 5.1% |
| 30 to 34 Minutes | 1,202 | 8.4% |
| 35 to 39 Minutes | 259 | 1.8% |
| 40 to 44 Minutes | 189 | 1.3% |
| 45 to 59 Minutes | 559 | 3.9% |
| 60 to 89 Minutes | 252 | 1.8% |
| 90 or more Minutes | 99 | 0.7% |
Commute Time by Sex in North Chicago
The most common commute times in North Chicago are 10 to 14 minutes (2,700 commuters, 28.4%) for males and 5 to 9 minutes (1,148 commuters, 23.6%) for females.
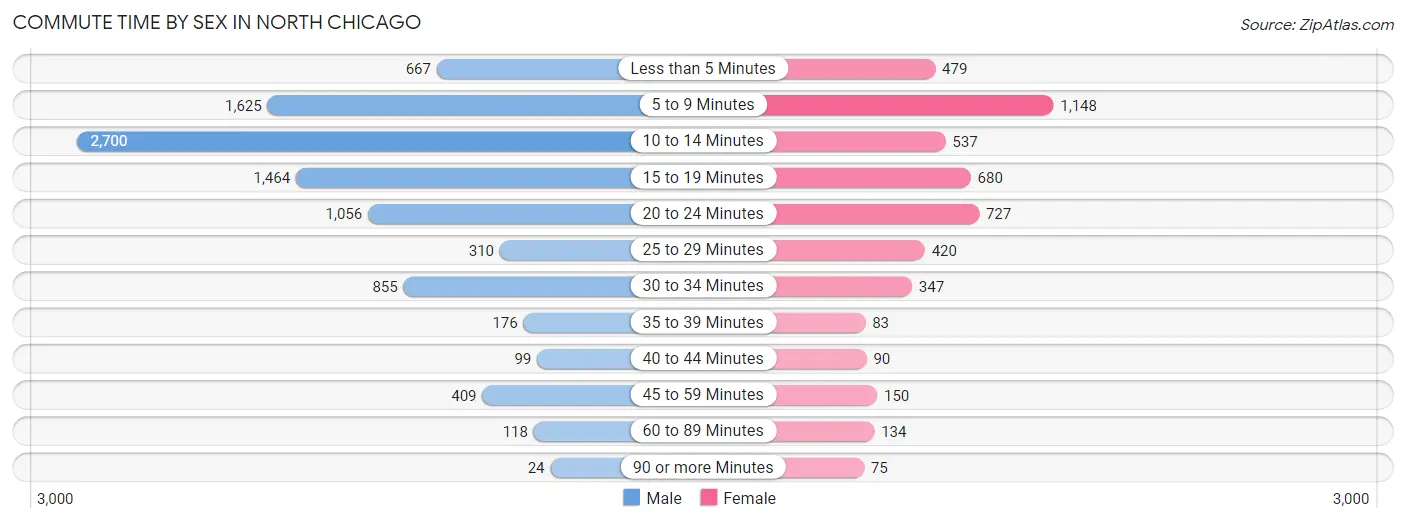
| Commute Time | Male | Female |
| Less than 5 Minutes | 667 (7.0%) | 479 (9.8%) |
| 5 to 9 Minutes | 1,625 (17.1%) | 1,148 (23.6%) |
| 10 to 14 Minutes | 2,700 (28.4%) | 537 (11.0%) |
| 15 to 19 Minutes | 1,464 (15.4%) | 680 (14.0%) |
| 20 to 24 Minutes | 1,056 (11.1%) | 727 (14.9%) |
| 25 to 29 Minutes | 310 (3.3%) | 420 (8.6%) |
| 30 to 34 Minutes | 855 (9.0%) | 347 (7.1%) |
| 35 to 39 Minutes | 176 (1.8%) | 83 (1.7%) |
| 40 to 44 Minutes | 99 (1.0%) | 90 (1.8%) |
| 45 to 59 Minutes | 409 (4.3%) | 150 (3.1%) |
| 60 to 89 Minutes | 118 (1.2%) | 134 (2.8%) |
| 90 or more Minutes | 24 (0.3%) | 75 (1.5%) |
Time of Departure to Work by Sex in North Chicago
The most frequent times of departure to work in North Chicago are 6:30 AM to 6:59 AM (1,694, 17.8%) for males and 6:00 AM to 6:29 AM (674, 13.8%) for females.
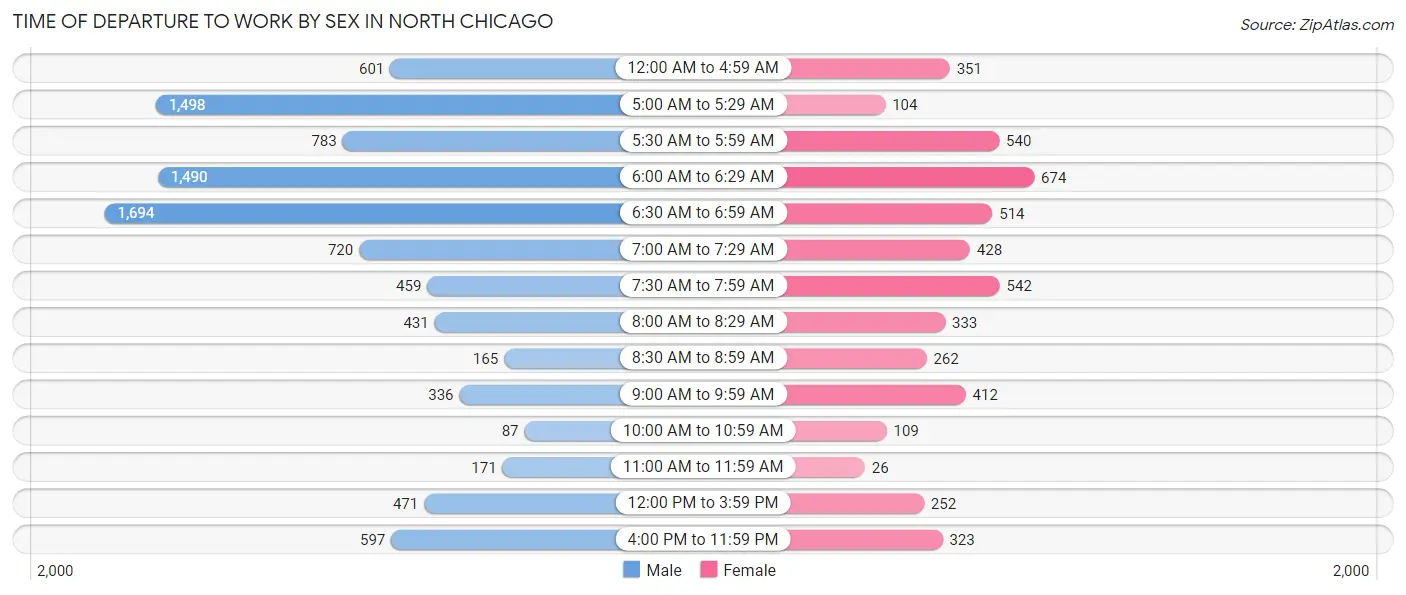
| Time of Departure | Male | Female |
| 12:00 AM to 4:59 AM | 601 (6.3%) | 351 (7.2%) |
| 5:00 AM to 5:29 AM | 1,498 (15.8%) | 104 (2.1%) |
| 5:30 AM to 5:59 AM | 783 (8.2%) | 540 (11.1%) |
| 6:00 AM to 6:29 AM | 1,490 (15.7%) | 674 (13.8%) |
| 6:30 AM to 6:59 AM | 1,694 (17.8%) | 514 (10.5%) |
| 7:00 AM to 7:29 AM | 720 (7.6%) | 428 (8.8%) |
| 7:30 AM to 7:59 AM | 459 (4.8%) | 542 (11.1%) |
| 8:00 AM to 8:29 AM | 431 (4.5%) | 333 (6.8%) |
| 8:30 AM to 8:59 AM | 165 (1.7%) | 262 (5.4%) |
| 9:00 AM to 9:59 AM | 336 (3.5%) | 412 (8.5%) |
| 10:00 AM to 10:59 AM | 87 (0.9%) | 109 (2.2%) |
| 11:00 AM to 11:59 AM | 171 (1.8%) | 26 (0.5%) |
| 12:00 PM to 3:59 PM | 471 (5.0%) | 252 (5.2%) |
| 4:00 PM to 11:59 PM | 597 (6.3%) | 323 (6.6%) |
| Total | 9,503 (100.0%) | 4,870 (100.0%) |
Housing Occupancy in North Chicago
Occupancy by Ownership in North Chicago
Of the total 7,487 dwellings in North Chicago, owner-occupied units account for 2,372 (31.7%), while renter-occupied units make up 5,115 (68.3%).
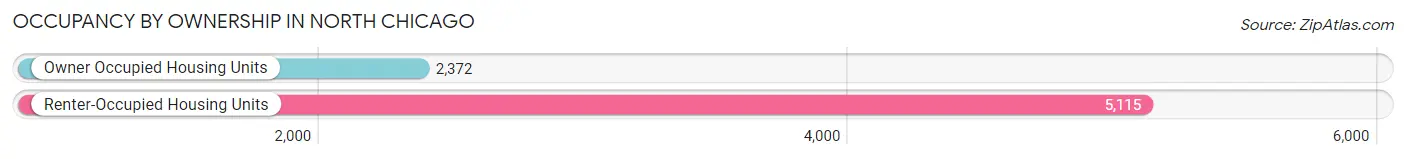
| Occupancy | # Housing Units | % Housing Units |
| Owner Occupied Housing Units | 2,372 | 31.7% |
| Renter-Occupied Housing Units | 5,115 | 68.3% |
| Total Occupied Housing Units | 7,487 | 100.0% |
Occupancy by Household Size in North Chicago
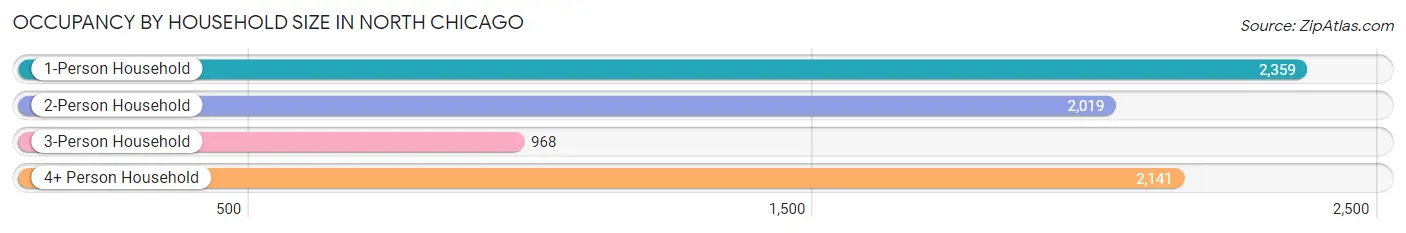
| Household Size | # Housing Units | % Housing Units |
| 1-Person Household | 2,359 | 31.5% |
| 2-Person Household | 2,019 | 27.0% |
| 3-Person Household | 968 | 12.9% |
| 4+ Person Household | 2,141 | 28.6% |
| Total Housing Units | 7,487 | 100.0% |
Occupancy by Ownership by Household Size in North Chicago
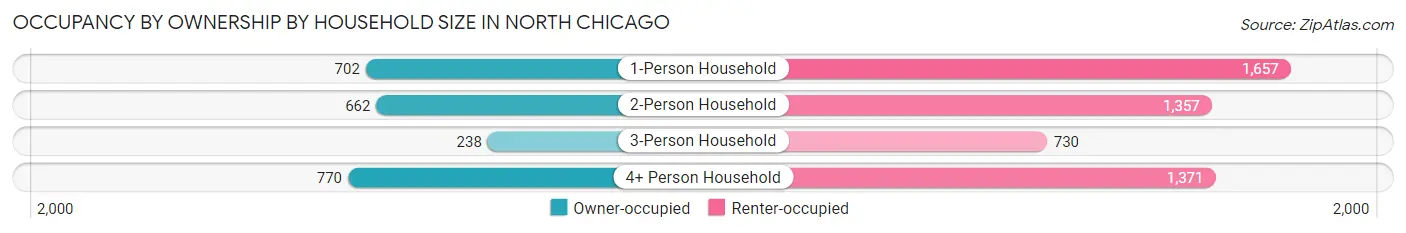
| Household Size | Owner-occupied | Renter-occupied |
| 1-Person Household | 702 (29.8%) | 1,657 (70.2%) |
| 2-Person Household | 662 (32.8%) | 1,357 (67.2%) |
| 3-Person Household | 238 (24.6%) | 730 (75.4%) |
| 4+ Person Household | 770 (36.0%) | 1,371 (64.0%) |
| Total Housing Units | 2,372 (31.7%) | 5,115 (68.3%) |
Occupancy by Educational Attainment in North Chicago
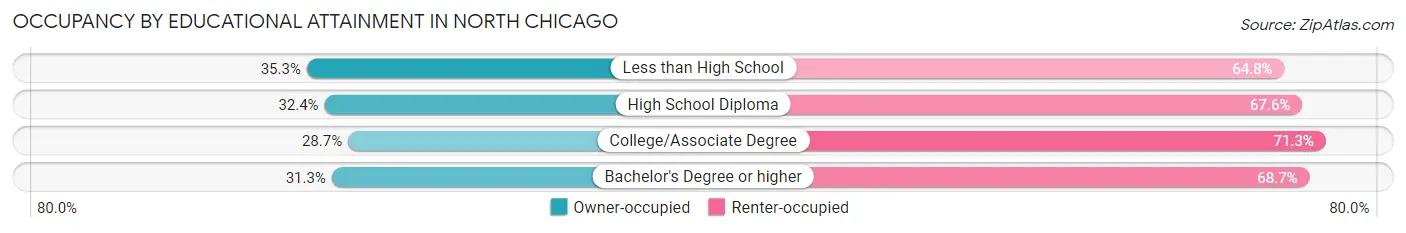
| Household Size | Owner-occupied | Renter-occupied |
| Less than High School | 577 (35.2%) | 1,060 (64.7%) |
| High School Diploma | 595 (32.4%) | 1,239 (67.6%) |
| College/Associate Degree | 632 (28.7%) | 1,569 (71.3%) |
| Bachelor's Degree or higher | 568 (31.3%) | 1,247 (68.7%) |
Occupancy by Age of Householder in North Chicago
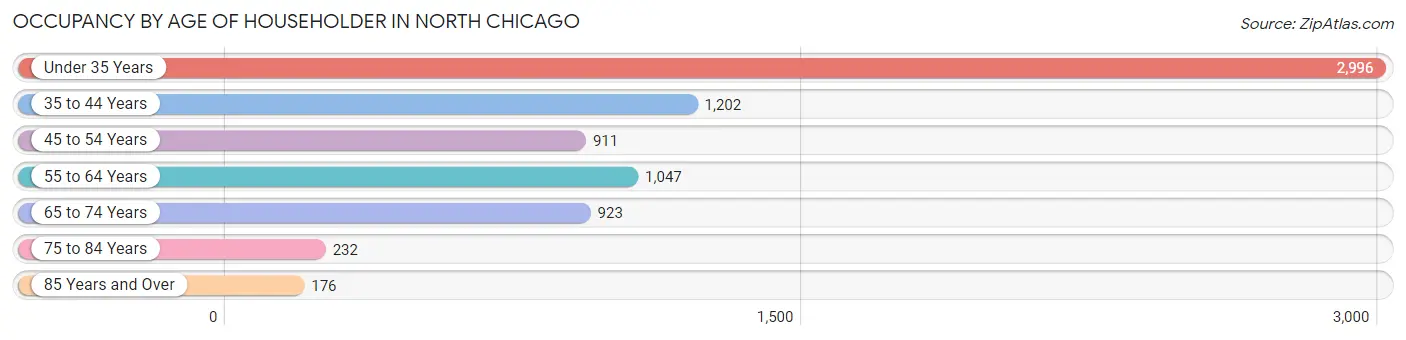
| Age Bracket | # Households | % Households |
| Under 35 Years | 2,996 | 40.0% |
| 35 to 44 Years | 1,202 | 16.1% |
| 45 to 54 Years | 911 | 12.2% |
| 55 to 64 Years | 1,047 | 14.0% |
| 65 to 74 Years | 923 | 12.3% |
| 75 to 84 Years | 232 | 3.1% |
| 85 Years and Over | 176 | 2.4% |
| Total | 7,487 | 100.0% |
Housing Finances in North Chicago
Median Income by Occupancy in North Chicago
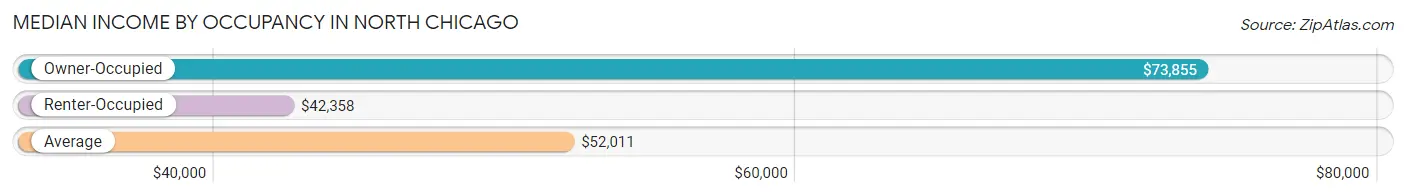
| Occupancy Type | # Households | Median Income |
| Owner-Occupied | 2,372 (31.7%) | $73,855 |
| Renter-Occupied | 5,115 (68.3%) | $42,358 |
| Average | 7,487 (100.0%) | $52,011 |
Occupancy by Householder Income Bracket in North Chicago
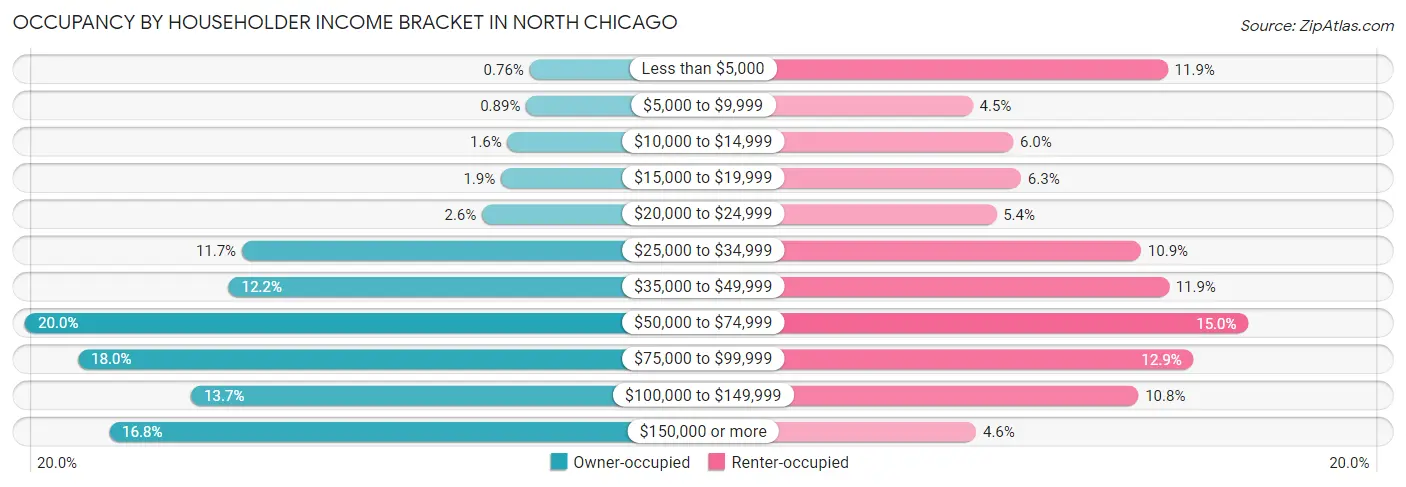
| Income Bracket | Owner-occupied | Renter-occupied |
| Less than $5,000 | 18 (0.8%) | 608 (11.9%) |
| $5,000 to $9,999 | 21 (0.9%) | 228 (4.5%) |
| $10,000 to $14,999 | 38 (1.6%) | 307 (6.0%) |
| $15,000 to $19,999 | 44 (1.8%) | 322 (6.3%) |
| $20,000 to $24,999 | 61 (2.6%) | 274 (5.4%) |
| $25,000 to $34,999 | 278 (11.7%) | 556 (10.9%) |
| $35,000 to $49,999 | 290 (12.2%) | 610 (11.9%) |
| $50,000 to $74,999 | 474 (20.0%) | 765 (15.0%) |
| $75,000 to $99,999 | 426 (18.0%) | 659 (12.9%) |
| $100,000 to $149,999 | 324 (13.7%) | 551 (10.8%) |
| $150,000 or more | 398 (16.8%) | 235 (4.6%) |
| Total | 2,372 (100.0%) | 5,115 (100.0%) |
Monthly Housing Cost Tiers in North Chicago
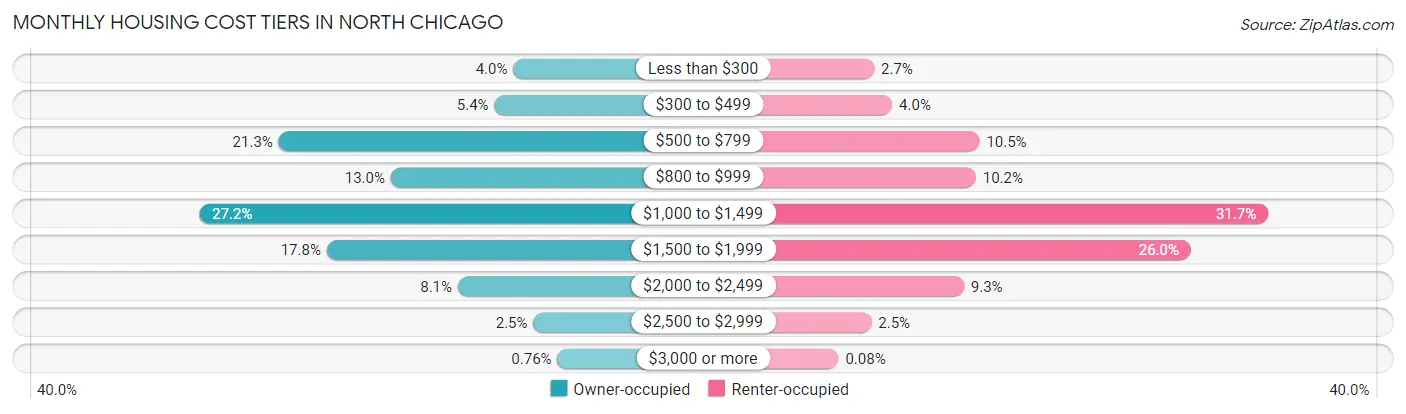
| Monthly Cost | Owner-occupied | Renter-occupied |
| Less than $300 | 95 (4.0%) | 138 (2.7%) |
| $300 to $499 | 128 (5.4%) | 206 (4.0%) |
| $500 to $799 | 505 (21.3%) | 535 (10.5%) |
| $800 to $999 | 309 (13.0%) | 521 (10.2%) |
| $1,000 to $1,499 | 644 (27.2%) | 1,622 (31.7%) |
| $1,500 to $1,999 | 421 (17.7%) | 1,331 (26.0%) |
| $2,000 to $2,499 | 192 (8.1%) | 476 (9.3%) |
| $2,500 to $2,999 | 60 (2.5%) | 128 (2.5%) |
| $3,000 or more | 18 (0.8%) | 4 (0.1%) |
| Total | 2,372 (100.0%) | 5,115 (100.0%) |
Physical Housing Characteristics in North Chicago
Housing Structures in North Chicago
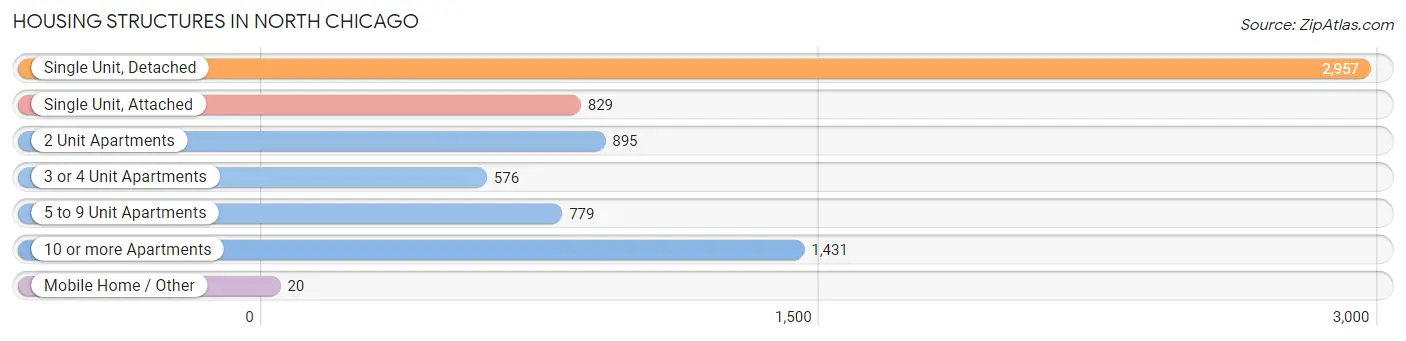
| Structure Type | # Housing Units | % Housing Units |
| Single Unit, Detached | 2,957 | 39.5% |
| Single Unit, Attached | 829 | 11.1% |
| 2 Unit Apartments | 895 | 11.9% |
| 3 or 4 Unit Apartments | 576 | 7.7% |
| 5 to 9 Unit Apartments | 779 | 10.4% |
| 10 or more Apartments | 1,431 | 19.1% |
| Mobile Home / Other | 20 | 0.3% |
| Total | 7,487 | 100.0% |
Housing Structures by Occupancy in North Chicago
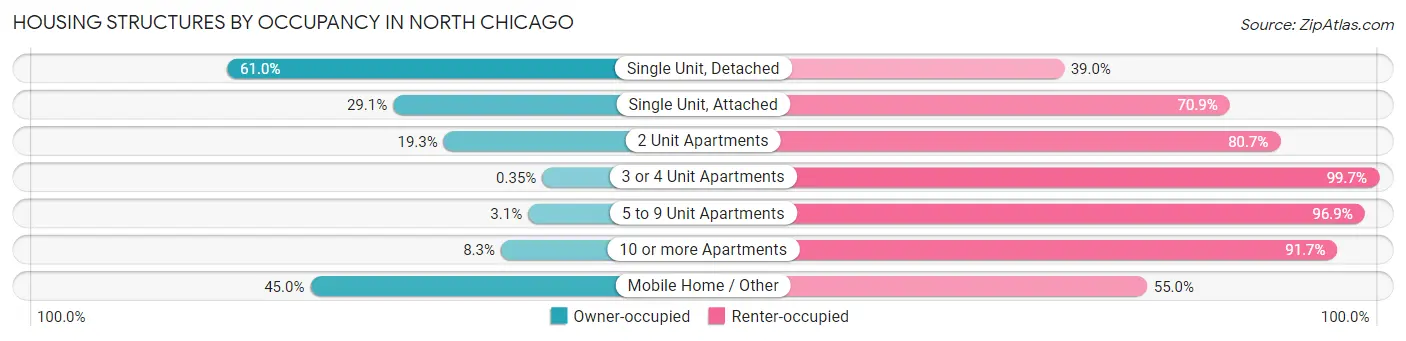
| Structure Type | Owner-occupied | Renter-occupied |
| Single Unit, Detached | 1,804 (61.0%) | 1,153 (39.0%) |
| Single Unit, Attached | 241 (29.1%) | 588 (70.9%) |
| 2 Unit Apartments | 173 (19.3%) | 722 (80.7%) |
| 3 or 4 Unit Apartments | 2 (0.4%) | 574 (99.7%) |
| 5 to 9 Unit Apartments | 24 (3.1%) | 755 (96.9%) |
| 10 or more Apartments | 119 (8.3%) | 1,312 (91.7%) |
| Mobile Home / Other | 9 (45.0%) | 11 (55.0%) |
| Total | 2,372 (31.7%) | 5,115 (68.3%) |
Housing Structures by Number of Rooms in North Chicago
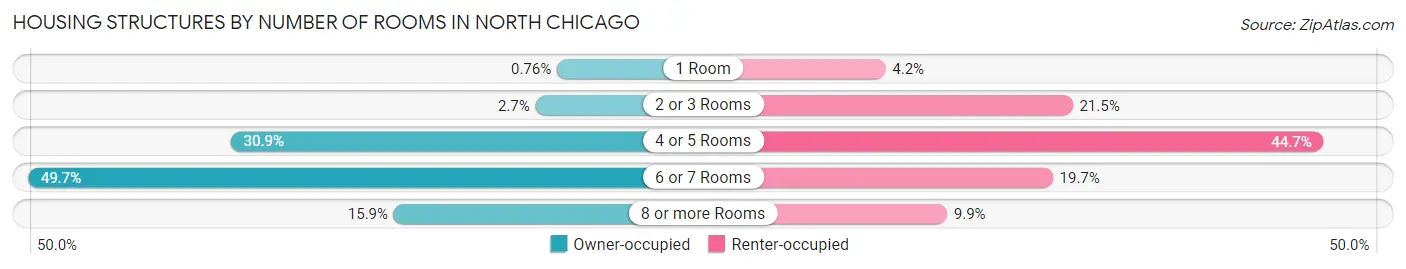
| Number of Rooms | Owner-occupied | Renter-occupied |
| 1 Room | 18 (0.8%) | 215 (4.2%) |
| 2 or 3 Rooms | 65 (2.7%) | 1,100 (21.5%) |
| 4 or 5 Rooms | 734 (30.9%) | 2,288 (44.7%) |
| 6 or 7 Rooms | 1,179 (49.7%) | 1,006 (19.7%) |
| 8 or more Rooms | 376 (15.9%) | 506 (9.9%) |
| Total | 2,372 (100.0%) | 5,115 (100.0%) |
Housing Structure by Heating Type in North Chicago
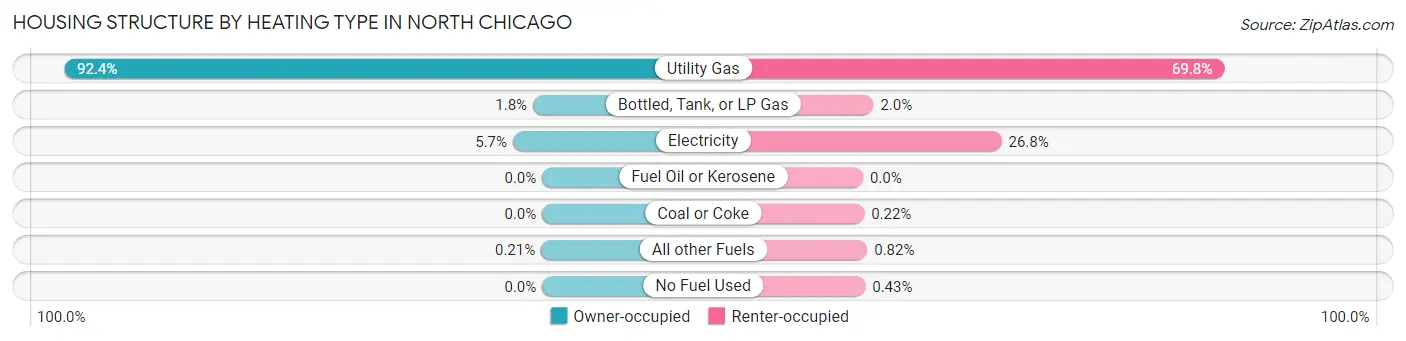
| Heating Type | Owner-occupied | Renter-occupied |
| Utility Gas | 2,191 (92.4%) | 3,568 (69.8%) |
| Bottled, Tank, or LP Gas | 42 (1.8%) | 103 (2.0%) |
| Electricity | 134 (5.7%) | 1,369 (26.8%) |
| Fuel Oil or Kerosene | 0 (0.0%) | 0 (0.0%) |
| Coal or Coke | 0 (0.0%) | 11 (0.2%) |
| All other Fuels | 5 (0.2%) | 42 (0.8%) |
| No Fuel Used | 0 (0.0%) | 22 (0.4%) |
| Total | 2,372 (100.0%) | 5,115 (100.0%) |
Household Vehicle Usage in North Chicago
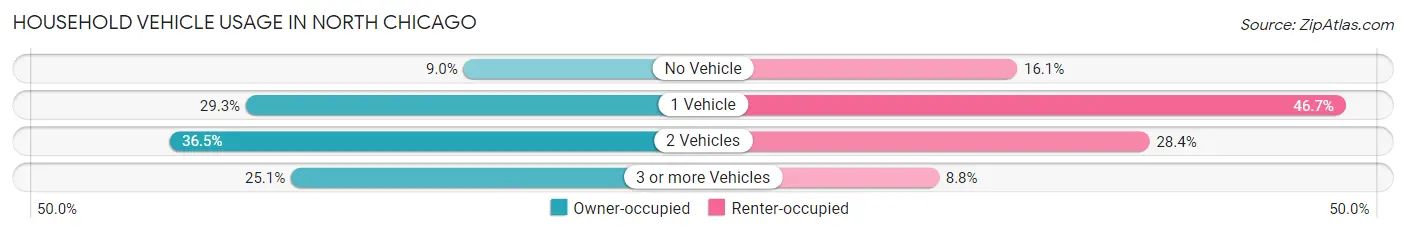
| Vehicles per Household | Owner-occupied | Renter-occupied |
| No Vehicle | 214 (9.0%) | 822 (16.1%) |
| 1 Vehicle | 696 (29.3%) | 2,391 (46.7%) |
| 2 Vehicles | 866 (36.5%) | 1,454 (28.4%) |
| 3 or more Vehicles | 596 (25.1%) | 448 (8.8%) |
| Total | 2,372 (100.0%) | 5,115 (100.0%) |
Real Estate & Mortgages in North Chicago
Real Estate and Mortgage Overview in North Chicago
| Characteristic | Without Mortgage | With Mortgage |
| Housing Units | 933 | 1,439 |
| Median Property Value | $109,000 | $151,800 |
| Median Household Income | $63,133 | $274 |
| Monthly Housing Costs | $642 | $18 |
| Real Estate Taxes | $3,082 | $16 |
Property Value by Mortgage Status in North Chicago
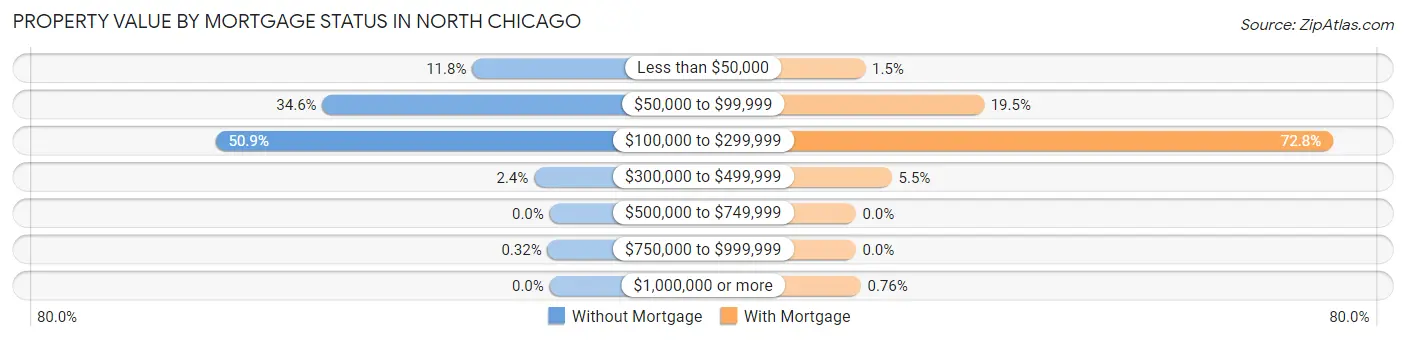
| Property Value | Without Mortgage | With Mortgage |
| Less than $50,000 | 110 (11.8%) | 21 (1.5%) |
| $50,000 to $99,999 | 323 (34.6%) | 281 (19.5%) |
| $100,000 to $299,999 | 475 (50.9%) | 1,047 (72.8%) |
| $300,000 to $499,999 | 22 (2.4%) | 79 (5.5%) |
| $500,000 to $749,999 | 0 (0.0%) | 0 (0.0%) |
| $750,000 to $999,999 | 3 (0.3%) | 0 (0.0%) |
| $1,000,000 or more | 0 (0.0%) | 11 (0.8%) |
| Total | 933 (100.0%) | 1,439 (100.0%) |
Household Income by Mortgage Status in North Chicago
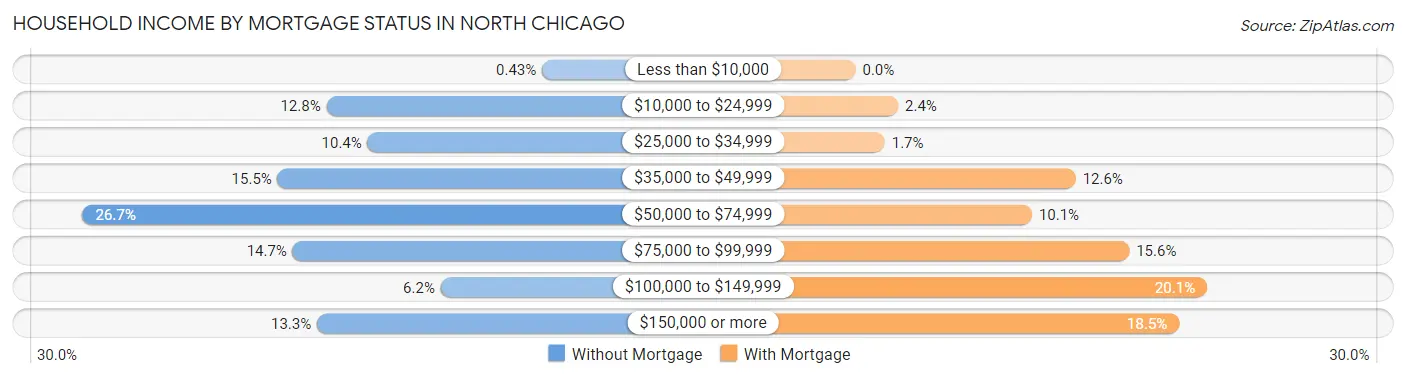
| Household Income | Without Mortgage | With Mortgage |
| Less than $10,000 | 4 (0.4%) | 0 (0.0%) |
| $10,000 to $24,999 | 119 (12.8%) | 35 (2.4%) |
| $25,000 to $34,999 | 97 (10.4%) | 24 (1.7%) |
| $35,000 to $49,999 | 145 (15.5%) | 181 (12.6%) |
| $50,000 to $74,999 | 249 (26.7%) | 145 (10.1%) |
| $75,000 to $99,999 | 137 (14.7%) | 225 (15.6%) |
| $100,000 to $149,999 | 58 (6.2%) | 289 (20.1%) |
| $150,000 or more | 124 (13.3%) | 266 (18.5%) |
| Total | 933 (100.0%) | 1,439 (100.0%) |
Property Value to Household Income Ratio in North Chicago
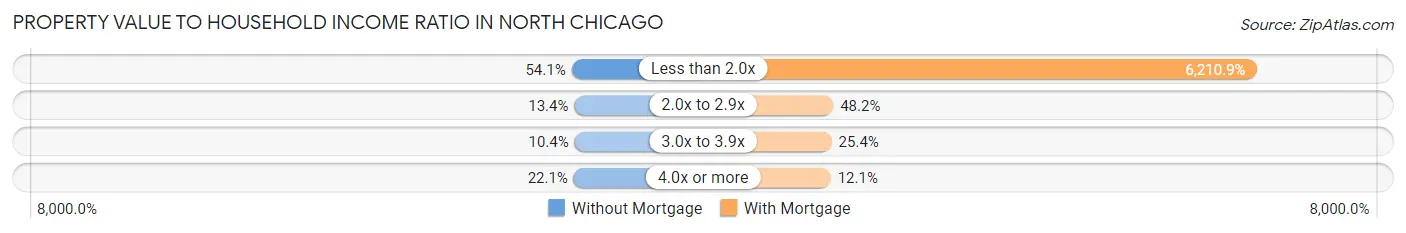
| Value-to-Income Ratio | Without Mortgage | With Mortgage |
| Less than 2.0x | 505 (54.1%) | 89,375 (6,210.9%) |
| 2.0x to 2.9x | 125 (13.4%) | 693 (48.2%) |
| 3.0x to 3.9x | 97 (10.4%) | 365 (25.4%) |
| 4.0x or more | 206 (22.1%) | 174 (12.1%) |
| Total | 933 (100.0%) | 1,439 (100.0%) |
Real Estate Taxes by Mortgage Status in North Chicago
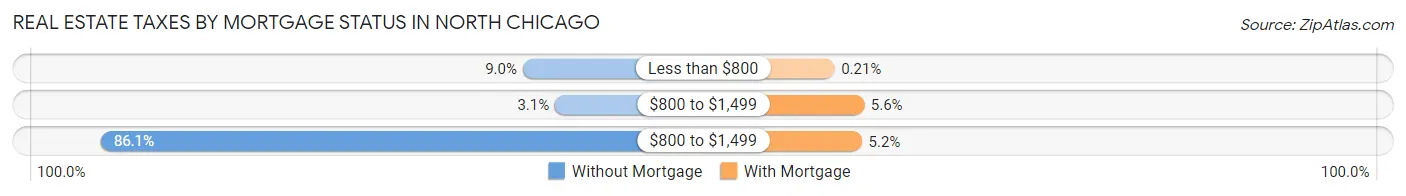
| Property Taxes | Without Mortgage | With Mortgage |
| Less than $800 | 84 (9.0%) | 3 (0.2%) |
| $800 to $1,499 | 29 (3.1%) | 81 (5.6%) |
| $800 to $1,499 | 803 (86.1%) | 75 (5.2%) |
| Total | 933 (100.0%) | 1,439 (100.0%) |
Health & Disability in North Chicago
Health Insurance Coverage by Age in North Chicago
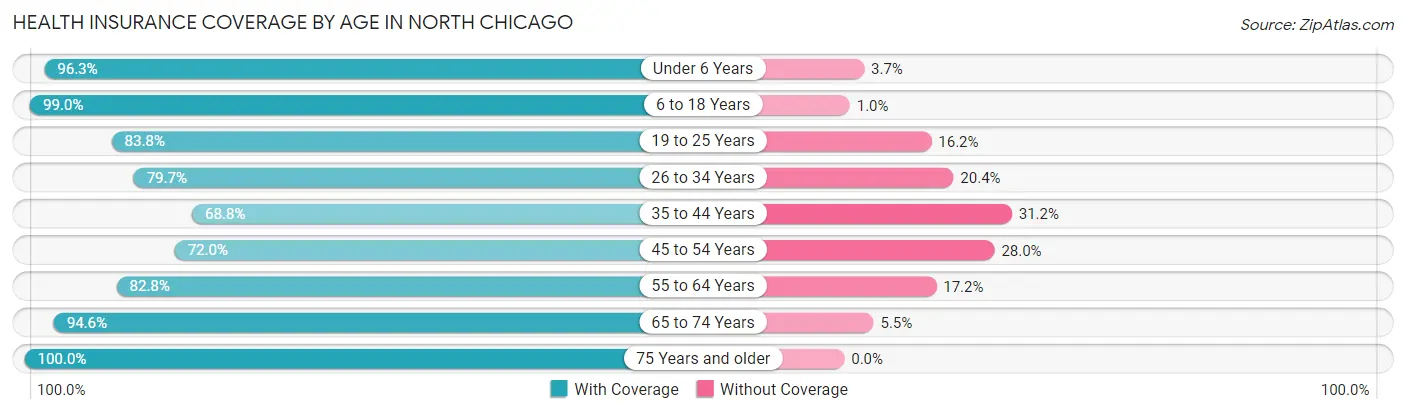
| Age Bracket | With Coverage | Without Coverage |
| Under 6 Years | 1,983 (96.3%) | 76 (3.7%) |
| 6 to 18 Years | 3,403 (99.0%) | 35 (1.0%) |
| 19 to 25 Years | 2,549 (83.8%) | 494 (16.2%) |
| 26 to 34 Years | 2,568 (79.6%) | 656 (20.3%) |
| 35 to 44 Years | 1,515 (68.8%) | 688 (31.2%) |
| 45 to 54 Years | 1,206 (72.0%) | 469 (28.0%) |
| 55 to 64 Years | 1,458 (82.8%) | 302 (17.2%) |
| 65 to 74 Years | 1,180 (94.6%) | 68 (5.4%) |
| 75 Years and older | 668 (100.0%) | 0 (0.0%) |
| Total | 16,530 (85.6%) | 2,788 (14.4%) |
Health Insurance Coverage by Citizenship Status in North Chicago

| Citizenship Status | With Coverage | Without Coverage |
| Native Born | 1,983 (96.3%) | 76 (3.7%) |
| Foreign Born, Citizen | 3,403 (99.0%) | 35 (1.0%) |
| Foreign Born, not a Citizen | 2,549 (83.8%) | 494 (16.2%) |
Health Insurance Coverage by Household Income in North Chicago
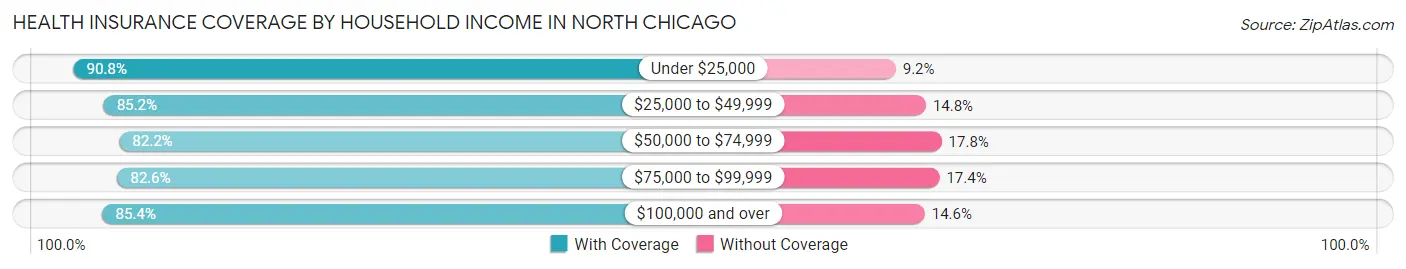
| Household Income | With Coverage | Without Coverage |
| Under $25,000 | 3,392 (90.8%) | 343 (9.2%) |
| $25,000 to $49,999 | 3,302 (85.2%) | 575 (14.8%) |
| $50,000 to $74,999 | 2,258 (82.2%) | 488 (17.8%) |
| $75,000 to $99,999 | 2,888 (82.6%) | 607 (17.4%) |
| $100,000 and over | 4,180 (85.4%) | 715 (14.6%) |
Public vs Private Health Insurance Coverage by Age in North Chicago
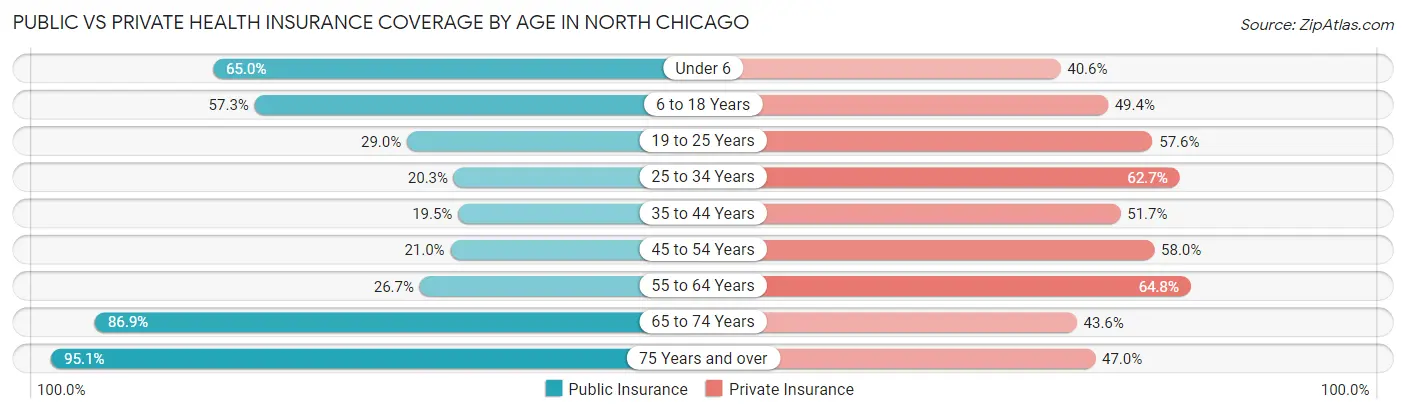
| Age Bracket | Public Insurance | Private Insurance |
| Under 6 | 1,339 (65.0%) | 835 (40.6%) |
| 6 to 18 Years | 1,970 (57.3%) | 1,697 (49.4%) |
| 19 to 25 Years | 883 (29.0%) | 1,754 (57.6%) |
| 25 to 34 Years | 655 (20.3%) | 2,021 (62.7%) |
| 35 to 44 Years | 430 (19.5%) | 1,139 (51.7%) |
| 45 to 54 Years | 351 (21.0%) | 971 (58.0%) |
| 55 to 64 Years | 469 (26.7%) | 1,140 (64.8%) |
| 65 to 74 Years | 1,085 (86.9%) | 544 (43.6%) |
| 75 Years and over | 635 (95.1%) | 314 (47.0%) |
| Total | 7,817 (40.5%) | 10,415 (53.9%) |
Disability Status by Sex by Age in North Chicago
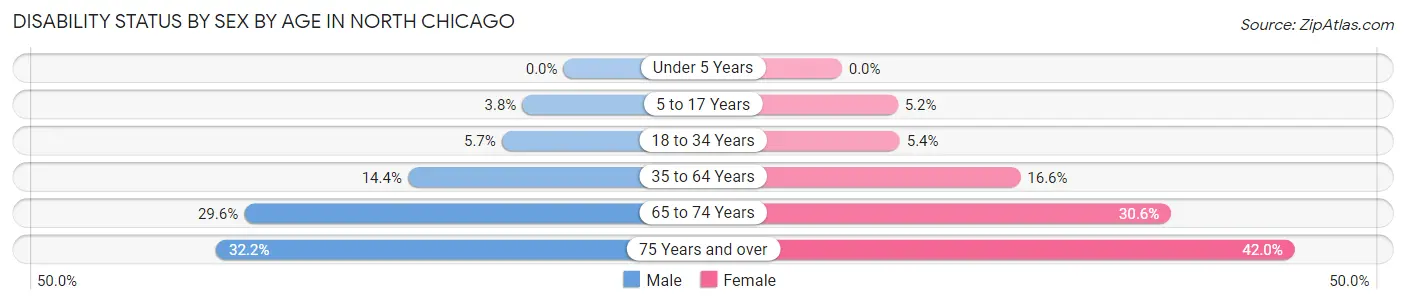
| Age Bracket | Male | Female |
| Under 5 Years | 0 (0.0%) | 0 (0.0%) |
| 5 to 17 Years | 65 (3.8%) | 91 (5.2%) |
| 18 to 34 Years | 188 (5.7%) | 174 (5.4%) |
| 35 to 64 Years | 408 (14.4%) | 466 (16.6%) |
| 65 to 74 Years | 174 (29.6%) | 202 (30.6%) |
| 75 Years and over | 78 (32.2%) | 179 (42.0%) |
Disability Class by Sex by Age in North Chicago
Disability Class: Hearing Difficulty
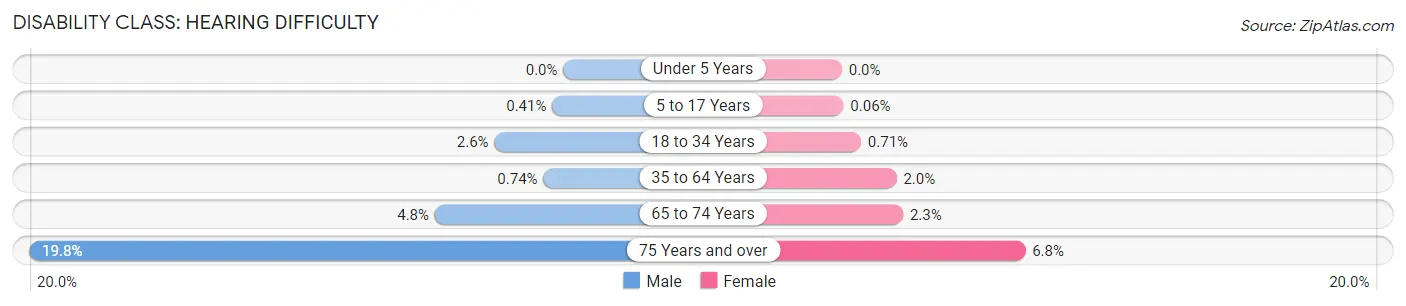
| Age Bracket | Male | Female |
| Under 5 Years | 0 (0.0%) | 0 (0.0%) |
| 5 to 17 Years | 7 (0.4%) | 1 (0.1%) |
| 18 to 34 Years | 84 (2.6%) | 23 (0.7%) |
| 35 to 64 Years | 21 (0.7%) | 57 (2.0%) |
| 65 to 74 Years | 28 (4.8%) | 15 (2.3%) |
| 75 Years and over | 48 (19.8%) | 29 (6.8%) |
Disability Class: Vision Difficulty
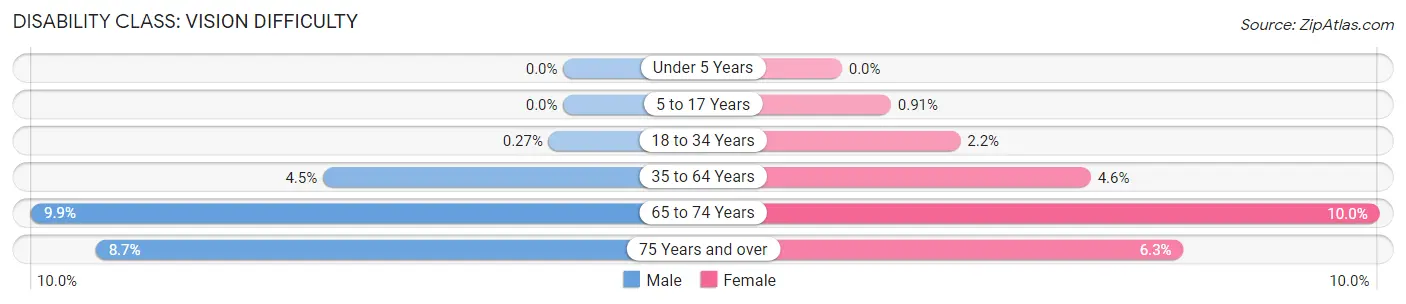
| Age Bracket | Male | Female |
| Under 5 Years | 0 (0.0%) | 0 (0.0%) |
| 5 to 17 Years | 0 (0.0%) | 16 (0.9%) |
| 18 to 34 Years | 9 (0.3%) | 71 (2.2%) |
| 35 to 64 Years | 126 (4.5%) | 130 (4.6%) |
| 65 to 74 Years | 58 (9.9%) | 66 (10.0%) |
| 75 Years and over | 21 (8.7%) | 27 (6.3%) |
Disability Class: Cognitive Difficulty
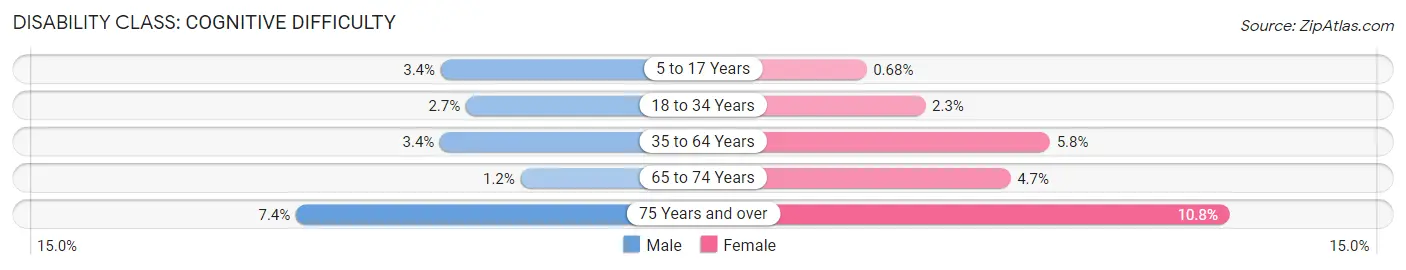
| Age Bracket | Male | Female |
| 5 to 17 Years | 58 (3.4%) | 12 (0.7%) |
| 18 to 34 Years | 89 (2.7%) | 75 (2.3%) |
| 35 to 64 Years | 97 (3.4%) | 163 (5.8%) |
| 65 to 74 Years | 7 (1.2%) | 31 (4.7%) |
| 75 Years and over | 18 (7.4%) | 46 (10.8%) |
Disability Class: Ambulatory Difficulty
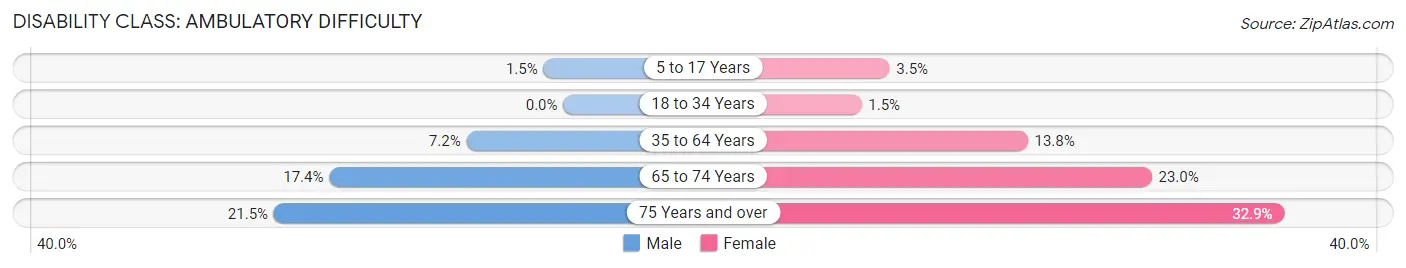
| Age Bracket | Male | Female |
| 5 to 17 Years | 25 (1.5%) | 62 (3.5%) |
| 18 to 34 Years | 0 (0.0%) | 47 (1.5%) |
| 35 to 64 Years | 203 (7.2%) | 388 (13.8%) |
| 65 to 74 Years | 102 (17.4%) | 152 (23.0%) |
| 75 Years and over | 52 (21.5%) | 140 (32.9%) |
Disability Class: Self-Care Difficulty
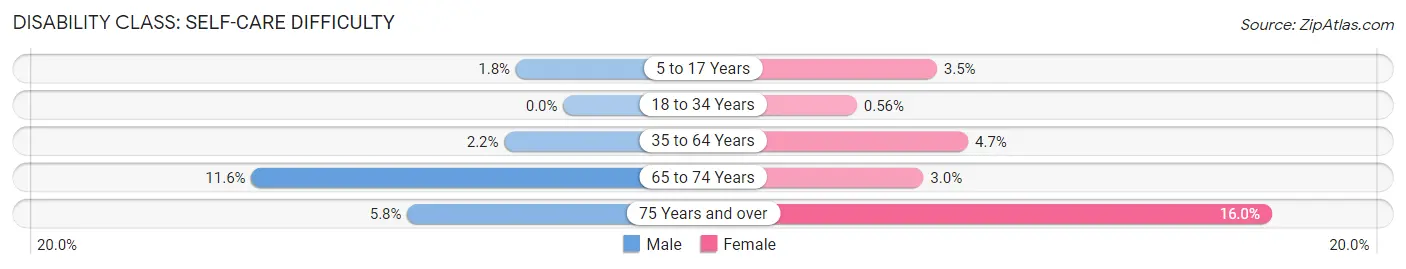
| Age Bracket | Male | Female |
| 5 to 17 Years | 30 (1.8%) | 62 (3.5%) |
| 18 to 34 Years | 0 (0.0%) | 18 (0.6%) |
| 35 to 64 Years | 62 (2.2%) | 132 (4.7%) |
| 65 to 74 Years | 68 (11.6%) | 20 (3.0%) |
| 75 Years and over | 14 (5.8%) | 68 (16.0%) |
Technology Access in North Chicago
Computing Device Access in North Chicago
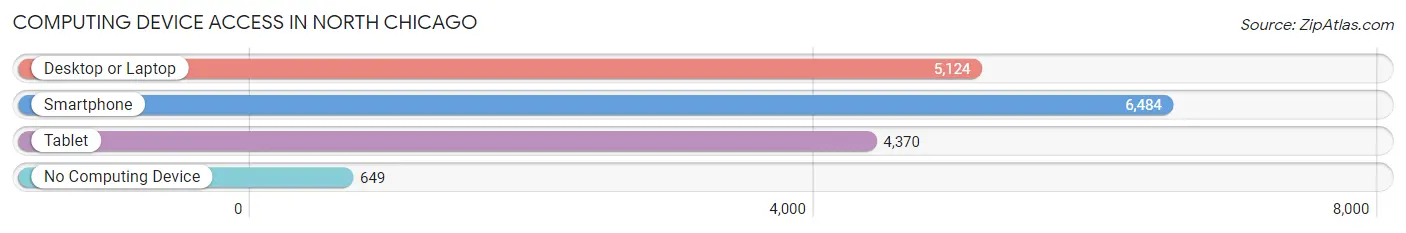
| Device Type | # Households | % Households |
| Desktop or Laptop | 5,124 | 68.4% |
| Smartphone | 6,484 | 86.6% |
| Tablet | 4,370 | 58.4% |
| No Computing Device | 649 | 8.7% |
| Total | 7,487 | 100.0% |
Internet Access in North Chicago
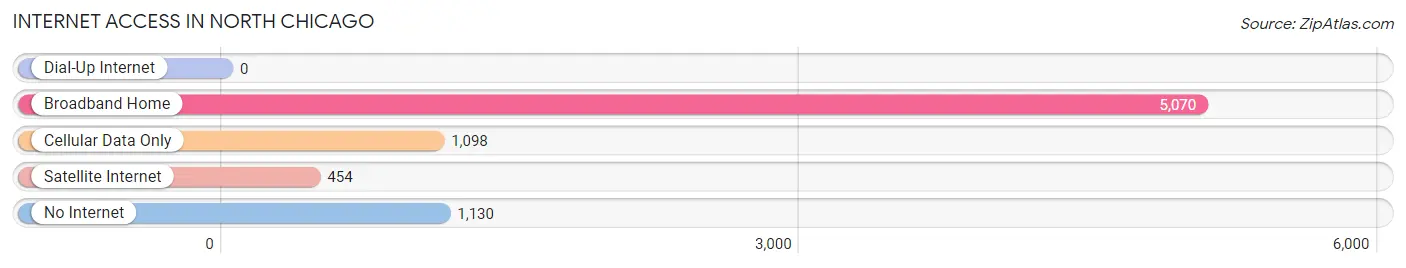
| Internet Type | # Households | % Households |
| Dial-Up Internet | 0 | 0.0% |
| Broadband Home | 5,070 | 67.7% |
| Cellular Data Only | 1,098 | 14.7% |
| Satellite Internet | 454 | 6.1% |
| No Internet | 1,130 | 15.1% |
| Total | 7,487 | 100.0% |
North Chicago Summary
Chicago, Illinois is a major city located in the northeastern part of the state. It is the third-largest city in the United States and the largest city in the Midwest. It is also the county seat of Cook County. The city is located on the southwestern shore of Lake Michigan and is home to a population of over 2.7 million people.
History
The area that is now Chicago was first settled by Native Americans in the late 17th century. The first Europeans to settle in the area were French fur traders in the late 17th century. The area was part of the Northwest Territory until 1818 when it became part of the Illinois Territory. In 1837, the city of Chicago was incorporated and quickly grew to become a major transportation hub and commercial center. The city was a major center of the industrial revolution and was home to many of the nation’s first skyscrapers.
The city was also a major center of the labor movement in the late 19th and early 20th centuries. The city was the site of the Haymarket Riot in 1886 and the Pullman Strike in 1894. The city was also the site of the famous Chicago Race Riot of 1919.
The city experienced a period of rapid growth in the mid-20th century and was home to the world’s first nuclear reactor. The city was also the site of the 1968 Democratic National Convention.
Geography
Chicago is located in the northeastern part of Illinois on the southwestern shore of Lake Michigan. The city is situated on a flat plain and is surrounded by several large bodies of water, including Lake Michigan, the Chicago River, and the Calumet River. The city is divided into 77 distinct neighborhoods, each with its own unique character and culture.
The city is home to several parks and green spaces, including Lincoln Park, Grant Park, and Millennium Park. The city is also home to several major sports teams, including the Chicago Bears, the Chicago Bulls, the Chicago Cubs, and the Chicago White Sox.
Economy
Chicago is a major economic center and is home to several Fortune 500 companies, including Boeing, McDonald’s, and United Airlines. The city is also home to several major financial institutions, including the Chicago Board of Trade and the Chicago Mercantile Exchange. The city is also home to several major universities, including the University of Chicago, Northwestern University, and the University of Illinois at Chicago.
The city is also a major transportation hub and is home to two major airports, O’Hare International Airport and Midway International Airport. The city is also home to several major highways, including the Dan Ryan Expressway, the Kennedy Expressway, and the Eisenhower Expressway.
Demographics
As of the 2010 census, the population of Chicago was 2,695,598. The city is home to a diverse population, with the largest ethnic groups being African Americans (32.9%), Hispanics (29.0%), and Whites (28.9%). The city is also home to a large immigrant population, with the largest groups being Mexicans (14.9%), Poles (7.4%), and Indians (4.2%).
The city is also home to a large LGBT population, with an estimated 10.1% of the population identifying as LGBT. The city is also home to a large number of religious groups, with the largest being Catholics (32.9%), Protestants (19.2%), and Jews (7.4%).
Conclusion
Chicago is a major city located in the northeastern part of Illinois. It is the third-largest city in the United States and the largest city in the Midwest. The city is home to a diverse population and is a major economic center. It is also a major transportation hub and is home to several major sports teams. The city is also home to several parks and green spaces and is a major center of the labor movement.
Common Questions
What is Per Capita Income in North Chicago?
Per Capita income in North Chicago is $24,441.
What is the Median Family Income in North Chicago?
Median Family Income in North Chicago is $62,163.
What is the Median Household income in North Chicago?
Median Household Income in North Chicago is $52,011.
What is Income or Wage Gap in North Chicago?
Income or Wage Gap in North Chicago is 4.1%.
Women in North Chicago earn 95.9 cents for every dollar earned by a man.
What is Family Income Deficit in North Chicago?
Family Income Deficit in North Chicago is $11,090.
Families that are below poverty line in North Chicago earn $11,090 less on average than the poverty threshold level.
What is Inequality or Gini Index in North Chicago?
Inequality or Gini Index in North Chicago is 0.46.
What is the Total Population of North Chicago?
Total Population of North Chicago is 30,890.
What is the Total Male Population of North Chicago?
Total Male Population of North Chicago is 18,583.
What is the Total Female Population of North Chicago?
Total Female Population of North Chicago is 12,307.
What is the Ratio of Males per 100 Females in North Chicago?
There are 151.00 Males per 100 Females in North Chicago.
What is the Ratio of Females per 100 Males in North Chicago?
There are 66.23 Females per 100 Males in North Chicago.
What is the Median Population Age in North Chicago?
Median Population Age in North Chicago is 23.5 Years.
What is the Average Family Size in North Chicago
Average Family Size in North Chicago is 3.5 People.
What is the Average Household Size in North Chicago
Average Household Size in North Chicago is 2.6 People.
How Large is the Labor Force in North Chicago?
There are 19,780 People in the Labor Forcein in North Chicago.
What is the Percentage of People in the Labor Force in North Chicago?
76.0% of People are in the Labor Force in North Chicago.
What is the Unemployment Rate in North Chicago?
Unemployment Rate in North Chicago is 9.5%.