Cities with the Highest Percentage of Immigrants from Panama in Illinois
RELATED REPORTS & OPTIONS
Panama
Illinois
Compare Cities
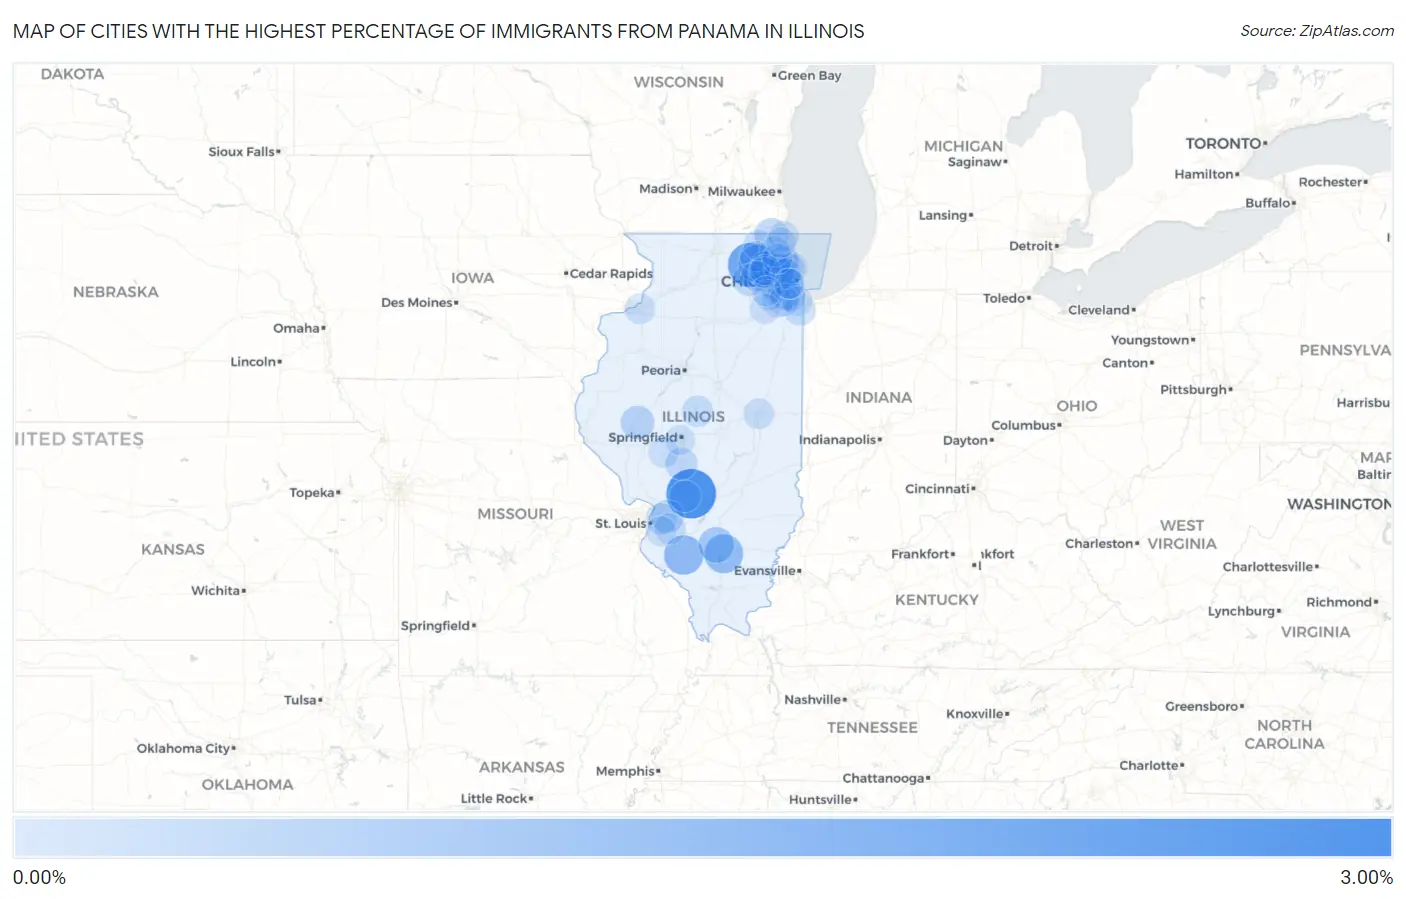
Map of Cities with the Highest Percentage of Immigrants from Panama in Illinois
0.00%
3.00%
Cities with the Highest Percentage of Immigrants from Panama in Illinois
| City | Panama | vs State | vs National | |
| 1. | Donnellson | 2.82% | 0.015%(+2.80)#-1 | 0.032%(+2.79)#0 |
| 2. | Pingree Grove | 2.02% | 0.015%(+2.00)#0 | 0.032%(+1.99)#1 |
| 3. | Coulterville | 1.32% | 0.015%(+1.30)#1 | 0.032%(+1.29)#2 |
| 4. | Bonnie | 1.24% | 0.015%(+1.23)#2 | 0.032%(+1.21)#3 |
| 5. | Sleepy Hollow | 1.19% | 0.015%(+1.17)#3 | 0.032%(+1.15)#4 |
| 6. | Woodlawn | 0.79% | 0.015%(+0.772)#4 | 0.032%(+0.756)#5 |
| 7. | Antioch | 0.47% | 0.015%(+0.454)#5 | 0.032%(+0.437)#6 |
| 8. | Beardstown | 0.46% | 0.015%(+0.444)#6 | 0.032%(+0.427)#7 |
| 9. | Troy | 0.36% | 0.015%(+0.342)#7 | 0.032%(+0.325)#8 |
| 10. | Glen Ellyn | 0.29% | 0.015%(+0.278)#8 | 0.032%(+0.261)#9 |
| 11. | Farmersville | 0.28% | 0.015%(+0.264)#9 | 0.032%(+0.248)#10 |
| 12. | Elburn | 0.23% | 0.015%(+0.220)#10 | 0.032%(+0.203)#11 |
| 13. | Elk Grove Village | 0.22% | 0.015%(+0.207)#11 | 0.032%(+0.190)#12 |
| 14. | Rolling Meadows | 0.21% | 0.015%(+0.197)#12 | 0.032%(+0.180)#13 |
| 15. | Sorento | 0.20% | 0.015%(+0.186)#13 | 0.032%(+0.169)#14 |
| 16. | Elmhurst | 0.18% | 0.015%(+0.165)#14 | 0.032%(+0.148)#15 |
| 17. | Sauk Village | 0.17% | 0.015%(+0.157)#15 | 0.032%(+0.141)#16 |
| 18. | Lincoln | 0.16% | 0.015%(+0.142)#16 | 0.032%(+0.125)#17 |
| 19. | Maywood | 0.14% | 0.015%(+0.126)#17 | 0.032%(+0.109)#18 |
| 20. | Berwyn | 0.14% | 0.015%(+0.121)#18 | 0.032%(+0.104)#19 |
| 21. | Worth | 0.13% | 0.015%(+0.114)#19 | 0.032%(+0.097)#20 |
| 22. | Collinsville | 0.13% | 0.015%(+0.113)#20 | 0.032%(+0.096)#21 |
| 23. | Scott Afb | 0.12% | 0.015%(+0.109)#21 | 0.032%(+0.092)#22 |
| 24. | Bensenville | 0.11% | 0.015%(+0.098)#22 | 0.032%(+0.081)#23 |
| 25. | Hanover Park | 0.11% | 0.015%(+0.095)#23 | 0.032%(+0.078)#24 |
| 26. | Hoffman Estates | 0.085% | 0.015%(+0.070)#24 | 0.032%(+0.053)#25 |
| 27. | Mchenry | 0.080% | 0.015%(+0.065)#25 | 0.032%(+0.048)#26 |
| 28. | Champaign | 0.076% | 0.015%(+0.061)#26 | 0.032%(+0.044)#27 |
| 29. | Palos Hills | 0.071% | 0.015%(+0.056)#27 | 0.032%(+0.039)#28 |
| 30. | Deerfield | 0.068% | 0.015%(+0.053)#28 | 0.032%(+0.036)#29 |
| 31. | Waverly | 0.067% | 0.015%(+0.052)#29 | 0.032%(+0.035)#30 |
| 32. | Northbrook | 0.066% | 0.015%(+0.051)#30 | 0.032%(+0.034)#31 |
| 33. | Homer Glen | 0.065% | 0.015%(+0.050)#31 | 0.032%(+0.033)#32 |
| 34. | East Moline | 0.062% | 0.015%(+0.047)#32 | 0.032%(+0.030)#33 |
| 35. | Westmont | 0.054% | 0.015%(+0.039)#33 | 0.032%(+0.022)#34 |
| 36. | Zion | 0.049% | 0.015%(+0.034)#34 | 0.032%(+0.017)#35 |
| 37. | Des Plaines | 0.048% | 0.015%(+0.033)#35 | 0.032%(+0.016)#36 |
| 38. | Alsip | 0.048% | 0.015%(+0.033)#36 | 0.032%(+0.016)#37 |
| 39. | Lake In The Hills | 0.045% | 0.015%(+0.030)#37 | 0.032%(+0.013)#38 |
| 40. | Evanston | 0.039% | 0.015%(+0.024)#38 | 0.032%(+0.007)#165 |
| 41. | St Charles | 0.034% | 0.015%(+0.019)#39 | 0.032%(+0.002)#166 |
| 42. | Bolingbrook | 0.028% | 0.015%(+0.014)#40 | 0.032%(-0.003)#167 |
| 43. | Bartlett | 0.024% | 0.015%(+0.010)#41 | 0.032%(-0.007)#168 |
| 44. | Orland Park | 0.024% | 0.015%(+0.009)#42 | 0.032%(-0.008)#169 |
| 45. | Skokie | 0.024% | 0.015%(+0.009)#43 | 0.032%(-0.008)#170 |
| 46. | South Holland | 0.023% | 0.015%(+0.009)#44 | 0.032%(-0.008)#171 |
| 47. | Harwood Heights | 0.022% | 0.015%(+0.007)#45 | 0.032%(-0.009)#172 |
| 48. | Cicero | 0.017% | 0.015%(+0.002)#46 | 0.032%(-0.015)#173 |
| 49. | Mundelein | 0.016% | 0.015%(+0.001)#47 | 0.032%(-0.016)#174 |
| 50. | Streamwood | 0.015% | 0.015%(+0.000)#48 | 0.032%(-0.017)#175 |
| 51. | Joliet | 0.013% | 0.015%(-0.002)#49 | 0.032%(-0.018)#176 |
| 52. | Chicago | 0.013% | 0.015%(-0.002)#50 | 0.032%(-0.019)#271 |
| 53. | Springfield | 0.012% | 0.015%(-0.003)#51 | 0.032%(-0.020)#272 |
| 54. | Belleville | 0.012% | 0.015%(-0.003)#52 | 0.032%(-0.020)#273 |
| 55. | Buffalo Grove | 0.012% | 0.015%(-0.003)#53 | 0.032%(-0.020)#274 |
| 56. | Naperville | 0.0074% | 0.015%(-0.008)#54 | 0.032%(-0.024)#275 |
| 57. | Waukegan | 0.0056% | 0.015%(-0.009)#55 | 0.032%(-0.026)#276 |
Common Questions
What are the Top 10 Cities with the Highest Percentage of Immigrants from Panama in Illinois?
Top 10 Cities with the Highest Percentage of Immigrants from Panama in Illinois are:
#1
2.82%
#2
2.02%
#3
1.32%
#4
1.24%
#5
1.19%
#6
0.79%
#7
0.47%
#8
0.46%
#9
0.36%
#10
0.29%
What city has the Highest Percentage of Immigrants from Panama in Illinois?
Donnellson has the Highest Percentage of Immigrants from Panama in Illinois with 2.82%.
What is the Percentage of Immigrants from Panama in the State of Illinois?
Percentage of Immigrants from Panama in Illinois is 0.015%.
What is the Percentage of Immigrants from Panama in the United States?
Percentage of Immigrants from Panama in the United States is 0.032%.