Cities with the Most Immigrants from Lebanon in Illinois
RELATED REPORTS & OPTIONS
Lebanon
Illinois
Compare Cities
Map of Cities with the Most Immigrants from Lebanon in Illinois
0
600
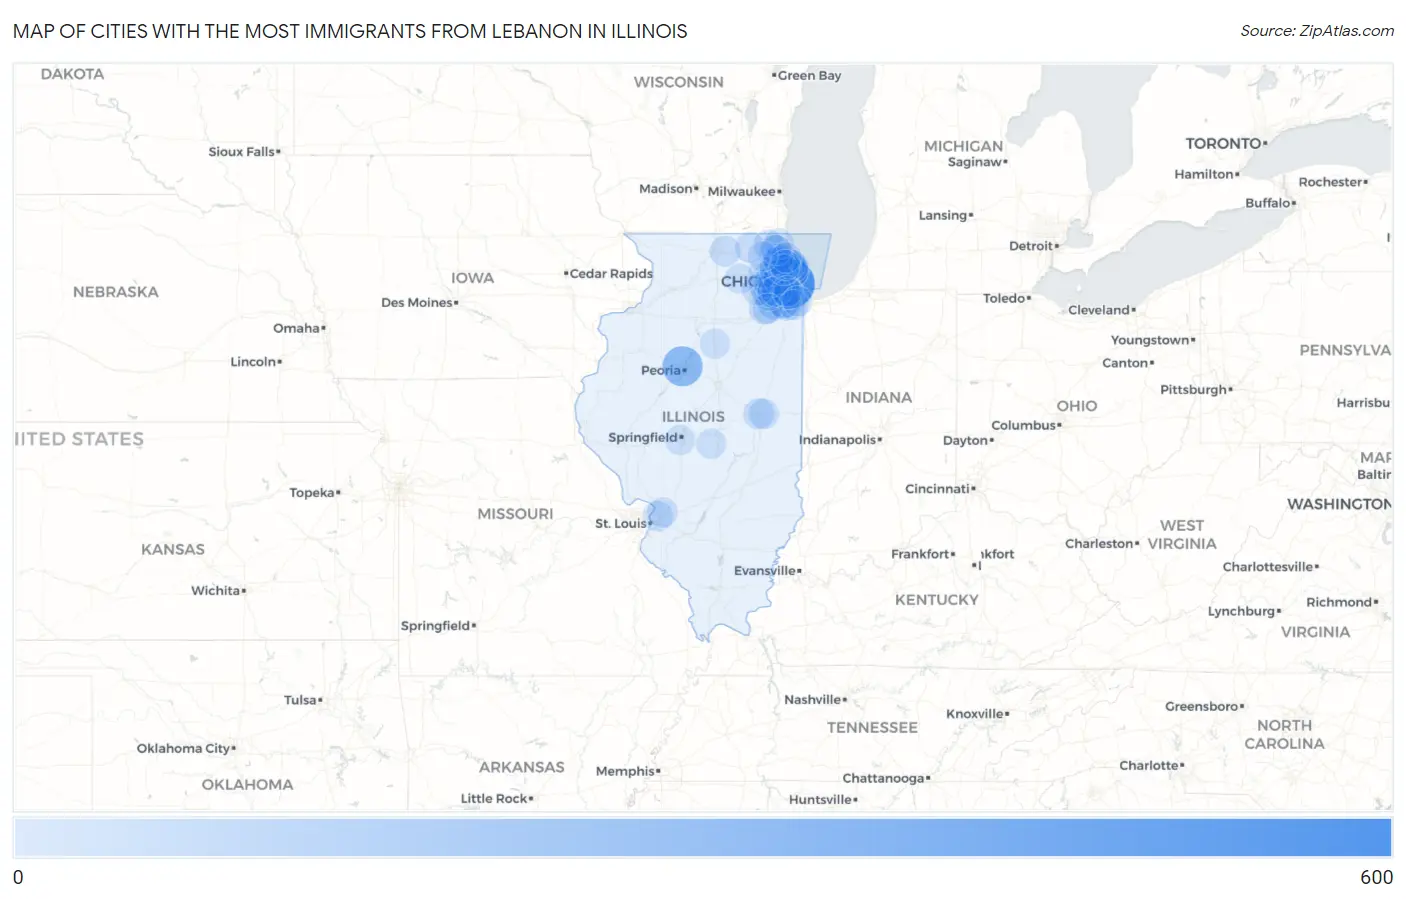
Cities with the Most Immigrants from Lebanon in Illinois
| City | Lebanon | vs State | vs National | |
| 1. | Chicago | 600 | 3,080(19.48%)#1 | 133,021(0.45%)#15 |
| 2. | Peoria | 299 | 3,080(9.71%)#2 | 133,021(0.22%)#50 |
| 3. | Skokie | 249 | 3,080(8.08%)#3 | 133,021(0.19%)#68 |
| 4. | Westmont | 213 | 3,080(6.92%)#4 | 133,021(0.16%)#85 |
| 5. | Lincolnwood | 190 | 3,080(6.17%)#5 | 133,021(0.14%)#94 |
| 6. | Lockport | 95 | 3,080(3.08%)#6 | 133,021(0.07%)#214 |
| 7. | Mount Prospect | 81 | 3,080(2.63%)#7 | 133,021(0.06%)#257 |
| 8. | Downers Grove | 65 | 3,080(2.11%)#8 | 133,021(0.05%)#327 |
| 9. | Northbrook | 65 | 3,080(2.11%)#9 | 133,021(0.05%)#329 |
| 10. | Orland Hills | 65 | 3,080(2.11%)#10 | 133,021(0.05%)#331 |
| 11. | Orland Park | 62 | 3,080(2.01%)#11 | 133,021(0.05%)#348 |
| 12. | Mundelein | 60 | 3,080(1.95%)#12 | 133,021(0.05%)#360 |
| 13. | Arlington Heights | 55 | 3,080(1.79%)#13 | 133,021(0.04%)#384 |
| 14. | Brookfield | 52 | 3,080(1.69%)#14 | 133,021(0.04%)#403 |
| 15. | Joliet | 46 | 3,080(1.49%)#15 | 133,021(0.03%)#449 |
| 16. | Hinsdale | 45 | 3,080(1.46%)#16 | 133,021(0.03%)#465 |
| 17. | Tinley Park | 37 | 3,080(1.20%)#17 | 133,021(0.03%)#539 |
| 18. | Wood Dale | 37 | 3,080(1.20%)#18 | 133,021(0.03%)#543 |
| 19. | Justice | 35 | 3,080(1.14%)#19 | 133,021(0.03%)#570 |
| 20. | Palos Hills | 34 | 3,080(1.10%)#20 | 133,021(0.03%)#584 |
| 21. | Bolingbrook | 30 | 3,080(0.97%)#21 | 133,021(0.02%)#645 |
| 22. | Bloomingdale | 30 | 3,080(0.97%)#22 | 133,021(0.02%)#649 |
| 23. | Warrenville | 30 | 3,080(0.97%)#23 | 133,021(0.02%)#653 |
| 24. | Champaign | 25 | 3,080(0.81%)#24 | 133,021(0.02%)#731 |
| 25. | Naperville | 22 | 3,080(0.71%)#25 | 133,021(0.02%)#794 |
| 26. | Belvidere | 22 | 3,080(0.71%)#26 | 133,021(0.02%)#804 |
| 27. | Lombard | 21 | 3,080(0.68%)#27 | 133,021(0.02%)#824 |
| 28. | Wilmette | 20 | 3,080(0.65%)#28 | 133,021(0.02%)#853 |
| 29. | Aurora | 19 | 3,080(0.62%)#29 | 133,021(0.01%)#867 |
| 30. | Bartlett | 16 | 3,080(0.52%)#30 | 133,021(0.01%)#977 |
| 31. | Wheaton | 14 | 3,080(0.45%)#31 | 133,021(0.01%)#1,039 |
| 32. | Elk Grove Village | 14 | 3,080(0.45%)#32 | 133,021(0.01%)#1,046 |
| 33. | Round Lake | 13 | 3,080(0.42%)#33 | 133,021(0.01%)#1,077 |
| 34. | Evanston | 12 | 3,080(0.39%)#34 | 133,021(0.01%)#1,094 |
| 35. | Pontoon Beach | 12 | 3,080(0.39%)#35 | 133,021(0.01%)#1,117 |
| 36. | Bridgeview | 11 | 3,080(0.36%)#36 | 133,021(0.01%)#1,148 |
| 37. | Elmhurst | 10 | 3,080(0.32%)#37 | 133,021(0.01%)#1,194 |
| 38. | Wheeling | 10 | 3,080(0.32%)#38 | 133,021(0.01%)#1,199 |
| 39. | Urbana | 10 | 3,080(0.32%)#39 | 133,021(0.01%)#1,200 |
| 40. | Woodstock | 10 | 3,080(0.32%)#40 | 133,021(0.01%)#1,210 |
| 41. | Morton Grove | 9 | 3,080(0.29%)#41 | 133,021(0.01%)#1,262 |
| 42. | Buffalo Grove | 8 | 3,080(0.26%)#42 | 133,021(0.01%)#1,291 |
| 43. | Woodridge | 8 | 3,080(0.26%)#43 | 133,021(0.01%)#1,294 |
| 44. | Gurnee | 8 | 3,080(0.26%)#44 | 133,021(0.01%)#1,298 |
| 45. | Burbank | 8 | 3,080(0.26%)#45 | 133,021(0.01%)#1,301 |
| 46. | Darien | 8 | 3,080(0.26%)#46 | 133,021(0.01%)#1,304 |
| 47. | Libertyville | 8 | 3,080(0.26%)#47 | 133,021(0.01%)#1,305 |
| 48. | Homewood | 8 | 3,080(0.26%)#48 | 133,021(0.01%)#1,307 |
| 49. | Park Ridge | 7 | 3,080(0.23%)#49 | 133,021(0.01%)#1,353 |
| 50. | Highland Park | 7 | 3,080(0.23%)#50 | 133,021(0.01%)#1,357 |
| 51. | Glen Carbon | 7 | 3,080(0.23%)#51 | 133,021(0.01%)#1,369 |
| 52. | Fox River Grove | 5 | 3,080(0.16%)#52 | 133,021(0.00%)#1,437 |
| 53. | Wenona | 5 | 3,080(0.16%)#53 | 133,021(0.00%)#1,444 |
| 54. | Springfield | 4 | 3,080(0.13%)#54 | 133,021(0.00%)#1,451 |
| 55. | Oak Lawn | 4 | 3,080(0.13%)#55 | 133,021(0.00%)#1,453 |
| 56. | South Holland | 4 | 3,080(0.13%)#56 | 133,021(0.00%)#1,460 |
| 57. | Rockdale | 4 | 3,080(0.13%)#57 | 133,021(0.00%)#1,470 |
| 58. | Glenview | 3 | 3,080(0.10%)#58 | 133,021(0.00%)#1,489 |
| 59. | Maple Park | 3 | 3,080(0.10%)#59 | 133,021(0.00%)#1,503 |
| 60. | Blue Mound | 3 | 3,080(0.10%)#60 | 133,021(0.00%)#1,512 |
Common Questions
What are the Top 10 Cities with the Most Immigrants from Lebanon in Illinois?
Top 10 Cities with the Most Immigrants from Lebanon in Illinois are:
#1
600
#2
299
#3
249
#4
213
#5
190
#6
95
#7
81
#8
65
#9
65
#10
65
What city has the Most Immigrants from Lebanon in Illinois?
Chicago has the Most Immigrants from Lebanon in Illinois with 600.
What is the Total Immigrants from Lebanon in the State of Illinois?
Total Immigrants from Lebanon in Illinois is 3,080.
What is the Total Immigrants from Lebanon in the United States?
Total Immigrants from Lebanon in the United States is 133,021.