Cities with the Highest Percentage of Jamaican Population in Illinois
RELATED REPORTS & OPTIONS
Jamaican
Illinois
Compare Cities
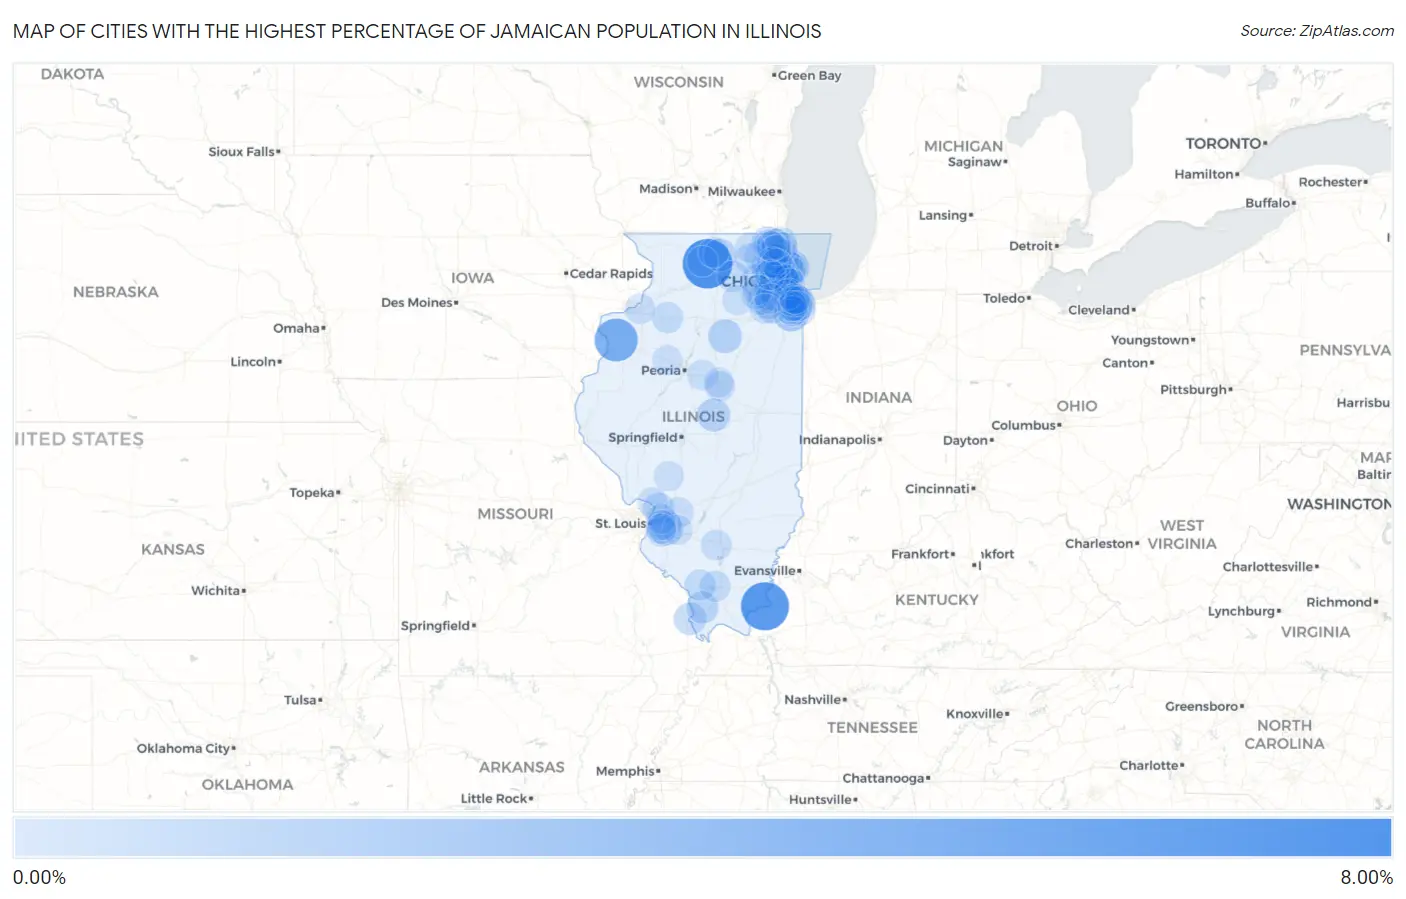
Map of Cities with the Highest Percentage of Jamaican Population in Illinois
0.00%
8.00%
Cities with the Highest Percentage of Jamaican Population in Illinois
| City | Jamaican | vs State | vs National | |
| 1. | Stillman Valley | 6.63% | 0.12%(+6.51)#1 | 0.36%(+6.26)#75 |
| 2. | Cave In Rock | 6.09% | 0.12%(+5.97)#2 | 0.36%(+5.73)#93 |
| 3. | Seaton | 4.38% | 0.12%(+4.26)#3 | 0.36%(+4.02)#141 |
| 4. | University Park | 1.83% | 0.12%(+1.71)#4 | 0.36%(+1.47)#436 |
| 5. | Evanston | 1.35% | 0.12%(+1.23)#5 | 0.36%(+0.988)#615 |
| 6. | Kangley | 1.28% | 0.12%(+1.16)#6 | 0.36%(+0.918)#656 |
| 7. | Berkeley | 1.25% | 0.12%(+1.13)#7 | 0.36%(+0.886)#678 |
| 8. | Shiloh | 1.21% | 0.12%(+1.09)#8 | 0.36%(+0.846)#704 |
| 9. | Skokie | 1.20% | 0.12%(+1.09)#9 | 0.36%(+0.841)#707 |
| 10. | Kenney | 1.08% | 0.12%(+0.965)#10 | 0.36%(+0.720)#795 |
| 11. | Bannockburn | 1.03% | 0.12%(+0.914)#11 | 0.36%(+0.669)#833 |
| 12. | Cherry Valley | 0.98% | 0.12%(+0.864)#12 | 0.36%(+0.619)#873 |
| 13. | East Cape Girardeau | 0.87% | 0.12%(+0.756)#13 | 0.36%(+0.511)#968 |
| 14. | Grayslake | 0.85% | 0.12%(+0.732)#14 | 0.36%(+0.487)#997 |
| 15. | Ingalls Park | 0.77% | 0.12%(+0.655)#15 | 0.36%(+0.410)#1,084 |
| 16. | Bellwood | 0.77% | 0.12%(+0.650)#16 | 0.36%(+0.405)#1,092 |
| 17. | Country Club Hills | 0.75% | 0.12%(+0.629)#17 | 0.36%(+0.384)#1,121 |
| 18. | Jonesboro | 0.72% | 0.12%(+0.597)#18 | 0.36%(+0.352)#1,165 |
| 19. | Rolling Meadows | 0.67% | 0.12%(+0.555)#19 | 0.36%(+0.310)#1,229 |
| 20. | Long Lake | 0.65% | 0.12%(+0.528)#20 | 0.36%(+0.283)#1,273 |
| 21. | Roxana | 0.64% | 0.12%(+0.518)#21 | 0.36%(+0.273)#1,287 |
| 22. | River Forest | 0.55% | 0.12%(+0.434)#22 | 0.36%(+0.190)#1,425 |
| 23. | Golf | 0.55% | 0.12%(+0.431)#23 | 0.36%(+0.186)#1,429 |
| 24. | Forest Park | 0.52% | 0.12%(+0.397)#24 | 0.36%(+0.152)#1,491 |
| 25. | Carol Stream | 0.51% | 0.12%(+0.388)#25 | 0.36%(+0.143)#1,512 |
| 26. | Annawan | 0.51% | 0.12%(+0.388)#26 | 0.36%(+0.143)#1,513 |
| 27. | Trout Valley | 0.51% | 0.12%(+0.387)#27 | 0.36%(+0.142)#1,514 |
| 28. | Sauk Village | 0.47% | 0.12%(+0.348)#28 | 0.36%(+0.103)#1,592 |
| 29. | Waukegan | 0.47% | 0.12%(+0.346)#29 | 0.36%(+0.102)#1,595 |
| 30. | Blue Island | 0.46% | 0.12%(+0.343)#30 | 0.36%(+0.099)#1,601 |
| 31. | Murphysboro | 0.45% | 0.12%(+0.332)#31 | 0.36%(+0.087)#1,619 |
| 32. | Schaumburg | 0.45% | 0.12%(+0.330)#32 | 0.36%(+0.085)#1,626 |
| 33. | Dekalb | 0.44% | 0.12%(+0.319)#33 | 0.36%(+0.074)#1,652 |
| 34. | Lombard | 0.44% | 0.12%(+0.317)#34 | 0.36%(+0.072)#1,655 |
| 35. | Crainville | 0.42% | 0.12%(+0.298)#35 | 0.36%(+0.053)#1,707 |
| 36. | Geneva | 0.42% | 0.12%(+0.297)#36 | 0.36%(+0.052)#1,711 |
| 37. | Melrose Park | 0.41% | 0.12%(+0.286)#37 | 0.36%(+0.042)#1,739 |
| 38. | Mundelein | 0.39% | 0.12%(+0.271)#38 | 0.36%(+0.026)#1,779 |
| 39. | Homewood | 0.38% | 0.12%(+0.264)#39 | 0.36%(+0.019)#1,797 |
| 40. | Huntley | 0.38% | 0.12%(+0.261)#40 | 0.36%(+0.016)#1,802 |
| 41. | Lisle | 0.37% | 0.12%(+0.251)#41 | 0.36%(+0.007)#1,836 |
| 42. | Mount Prospect | 0.37% | 0.12%(+0.250)#42 | 0.36%(+0.005)#1,843 |
| 43. | Hoffman Estates | 0.36% | 0.12%(+0.245)#43 | 0.36%(-0.000)#1,858 |
| 44. | Crest Hill | 0.36% | 0.12%(+0.238)#44 | 0.36%(-0.007)#1,884 |
| 45. | Woodlawn | 0.31% | 0.12%(+0.196)#45 | 0.36%(-0.049)#2,018 |
| 46. | Lansing | 0.31% | 0.12%(+0.191)#46 | 0.36%(-0.054)#2,036 |
| 47. | Lincolnwood | 0.31% | 0.12%(+0.190)#47 | 0.36%(-0.055)#2,040 |
| 48. | South Holland | 0.30% | 0.12%(+0.182)#48 | 0.36%(-0.063)#2,069 |
| 49. | Bolingbrook | 0.30% | 0.12%(+0.177)#49 | 0.36%(-0.068)#2,086 |
| 50. | Byron | 0.29% | 0.12%(+0.175)#50 | 0.36%(-0.069)#2,092 |
| 51. | Boulder Hill | 0.29% | 0.12%(+0.174)#51 | 0.36%(-0.070)#2,095 |
| 52. | Chicago Heights | 0.29% | 0.12%(+0.170)#52 | 0.36%(-0.075)#2,117 |
| 53. | Oak Park | 0.28% | 0.12%(+0.165)#53 | 0.36%(-0.079)#2,140 |
| 54. | Highland | 0.27% | 0.12%(+0.155)#54 | 0.36%(-0.089)#2,180 |
| 55. | Belleville | 0.27% | 0.12%(+0.152)#55 | 0.36%(-0.093)#2,205 |
| 56. | Matteson | 0.26% | 0.12%(+0.146)#56 | 0.36%(-0.099)#2,235 |
| 57. | Round Lake | 0.26% | 0.12%(+0.144)#57 | 0.36%(-0.101)#2,242 |
| 58. | Maywood | 0.25% | 0.12%(+0.133)#58 | 0.36%(-0.111)#2,280 |
| 59. | Lemont | 0.25% | 0.12%(+0.132)#59 | 0.36%(-0.113)#2,287 |
| 60. | East Moline | 0.24% | 0.12%(+0.120)#60 | 0.36%(-0.125)#2,337 |
| 61. | Lake Holiday | 0.24% | 0.12%(+0.118)#61 | 0.36%(-0.127)#2,354 |
| 62. | Markham | 0.23% | 0.12%(+0.114)#62 | 0.36%(-0.131)#2,380 |
| 63. | O Fallon | 0.22% | 0.12%(+0.105)#63 | 0.36%(-0.139)#2,421 |
| 64. | Goodfield | 0.22% | 0.12%(+0.102)#64 | 0.36%(-0.143)#2,444 |
| 65. | Des Plaines | 0.22% | 0.12%(+0.101)#65 | 0.36%(-0.144)#2,451 |
| 66. | Alton | 0.22% | 0.12%(+0.100)#66 | 0.36%(-0.145)#2,460 |
| 67. | Plainfield | 0.21% | 0.12%(+0.088)#67 | 0.36%(-0.157)#2,507 |
| 68. | Buffalo Grove | 0.20% | 0.12%(+0.079)#68 | 0.36%(-0.166)#2,543 |
| 69. | North Chicago | 0.19% | 0.12%(+0.075)#69 | 0.36%(-0.169)#2,566 |
| 70. | Midlothian | 0.19% | 0.12%(+0.071)#70 | 0.36%(-0.173)#2,585 |
| 71. | Gages Lake | 0.18% | 0.12%(+0.065)#71 | 0.36%(-0.180)#2,624 |
| 72. | Dolton | 0.18% | 0.12%(+0.064)#72 | 0.36%(-0.180)#2,627 |
| 73. | Libertyville | 0.18% | 0.12%(+0.061)#73 | 0.36%(-0.184)#2,653 |
| 74. | Bloomington | 0.18% | 0.12%(+0.056)#74 | 0.36%(-0.188)#2,676 |
| 75. | Worth | 0.17% | 0.12%(+0.056)#75 | 0.36%(-0.189)#2,677 |
| 76. | Addison | 0.17% | 0.12%(+0.049)#76 | 0.36%(-0.195)#2,724 |
| 77. | Chicago | 0.16% | 0.12%(+0.045)#77 | 0.36%(-0.199)#2,743 |
| 78. | Normal | 0.15% | 0.12%(+0.036)#78 | 0.36%(-0.209)#2,807 |
| 79. | Harvey | 0.15% | 0.12%(+0.036)#79 | 0.36%(-0.209)#2,808 |
| 80. | Palatine | 0.15% | 0.12%(+0.036)#80 | 0.36%(-0.209)#2,809 |
| 81. | Rockford | 0.15% | 0.12%(+0.031)#81 | 0.36%(-0.214)#2,842 |
| 82. | Arlington Heights | 0.15% | 0.12%(+0.031)#82 | 0.36%(-0.214)#2,843 |
| 83. | Aurora | 0.15% | 0.12%(+0.027)#83 | 0.36%(-0.218)#2,868 |
| 84. | New Baden | 0.15% | 0.12%(+0.026)#84 | 0.36%(-0.218)#2,873 |
| 85. | Oak Lawn | 0.14% | 0.12%(+0.025)#85 | 0.36%(-0.220)#2,885 |
| 86. | Brimfield | 0.14% | 0.12%(+0.025)#86 | 0.36%(-0.220)#2,886 |
| 87. | Calumet City | 0.14% | 0.12%(+0.024)#87 | 0.36%(-0.221)#2,892 |
| 88. | Park Forest | 0.14% | 0.12%(+0.024)#88 | 0.36%(-0.221)#2,895 |
| 89. | Carlinville | 0.14% | 0.12%(+0.021)#89 | 0.36%(-0.224)#2,915 |
| 90. | Romeoville | 0.14% | 0.12%(+0.018)#90 | 0.36%(-0.227)#2,932 |
| 91. | Woodstock | 0.13% | 0.12%(+0.015)#91 | 0.36%(-0.229)#2,952 |
| 92. | Bloomingdale | 0.13% | 0.12%(+0.015)#92 | 0.36%(-0.230)#2,956 |
| 93. | Glenwood | 0.13% | 0.12%(+0.010)#93 | 0.36%(-0.235)#2,990 |
| 94. | Joliet | 0.13% | 0.12%(+0.009)#94 | 0.36%(-0.236)#2,999 |
| 95. | Collinsville | 0.13% | 0.12%(+0.009)#95 | 0.36%(-0.236)#3,000 |
| 96. | Flossmoor | 0.12% | 0.12%(-0.002)#96 | 0.36%(-0.247)#3,079 |
| 97. | Fairview Heights | 0.12% | 0.12%(-0.003)#97 | 0.36%(-0.247)#3,087 |
| 98. | Round Lake Park | 0.12% | 0.12%(-0.003)#98 | 0.36%(-0.248)#3,092 |
| 99. | Swansea | 0.11% | 0.12%(-0.005)#99 | 0.36%(-0.249)#3,110 |
| 100. | Riverdale | 0.11% | 0.12%(-0.005)#100 | 0.36%(-0.250)#3,111 |
Common Questions
What are the Top 10 Cities with the Highest Percentage of Jamaican Population in Illinois?
Top 10 Cities with the Highest Percentage of Jamaican Population in Illinois are:
#1
6.63%
#2
6.09%
#3
4.38%
#4
1.83%
#5
1.35%
#6
1.28%
#7
1.25%
#8
1.21%
#9
1.20%
#10
1.08%
What city has the Highest Percentage of Jamaican Population in Illinois?
Stillman Valley has the Highest Percentage of Jamaican Population in Illinois with 6.63%.
What is the Percentage of Jamaican Population in the State of Illinois?
Percentage of Jamaican Population in Illinois is 0.12%.
What is the Percentage of Jamaican Population in the United States?
Percentage of Jamaican Population in the United States is 0.36%.