Anna, IL Map & Demographics
Anna Map
Anna Overview
$24,592
PER CAPITA INCOME
$61,806
AVG FAMILY INCOME
$36,786
AVG HOUSEHOLD INCOME
67.4%
WAGE / INCOME GAP [ % ]
32.6¢/ $1
WAGE / INCOME GAP [ $ ]
0.47
INEQUALITY / GINI INDEX
4,259
TOTAL POPULATION
2,227
MALE POPULATION
2,032
FEMALE POPULATION
109.60
MALES / 100 FEMALES
91.24
FEMALES / 100 MALES
42.3
MEDIAN AGE
3.2
AVG FAMILY SIZE
2.2
AVG HOUSEHOLD SIZE
1,713
LABOR FORCE [ PEOPLE ]
50.7%
PERCENT IN LABOR FORCE
8.3%
UNEMPLOYMENT RATE
Anna Zip Codes
Anna Area Codes
Income in Anna
Income Overview in Anna
Per Capita Income in Anna is $24,592, while median incomes of families and households are $61,806 and $36,786 respectively.
| Characteristic | Number | Measure |
| Per Capita Income | 4,259 | $24,592 |
| Median Family Income | 871 | $61,806 |
| Mean Family Income | 871 | $75,623 |
| Median Household Income | 1,804 | $36,786 |
| Mean Household Income | 1,804 | $55,197 |
| Income Deficit | 871 | $0 |
| Wage / Income Gap (%) | 4,259 | 67.37% |
| Wage / Income Gap ($) | 4,259 | 32.63¢ per $1 |
| Gini / Inequality Index | 4,259 | 0.47 |
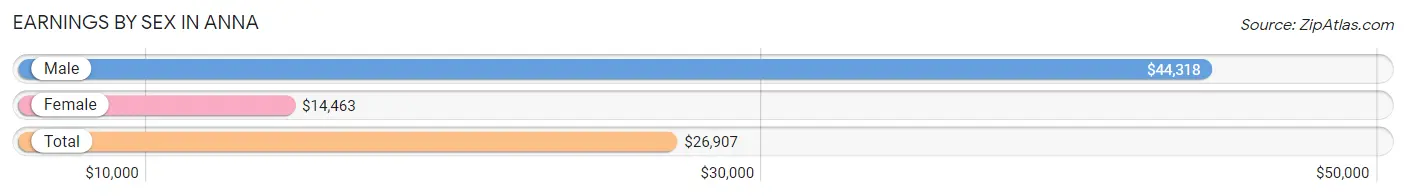
Earnings by Sex in Anna
Average Earnings in Anna are $26,907, $44,318 for men and $14,463 for women, a difference of 67.4%.
| Sex | Number | Average Earnings |
| Male | 822 (50.2%) | $44,318 |
| Female | 814 (49.8%) | $14,463 |
| Total | 1,636 (100.0%) | $26,907 |
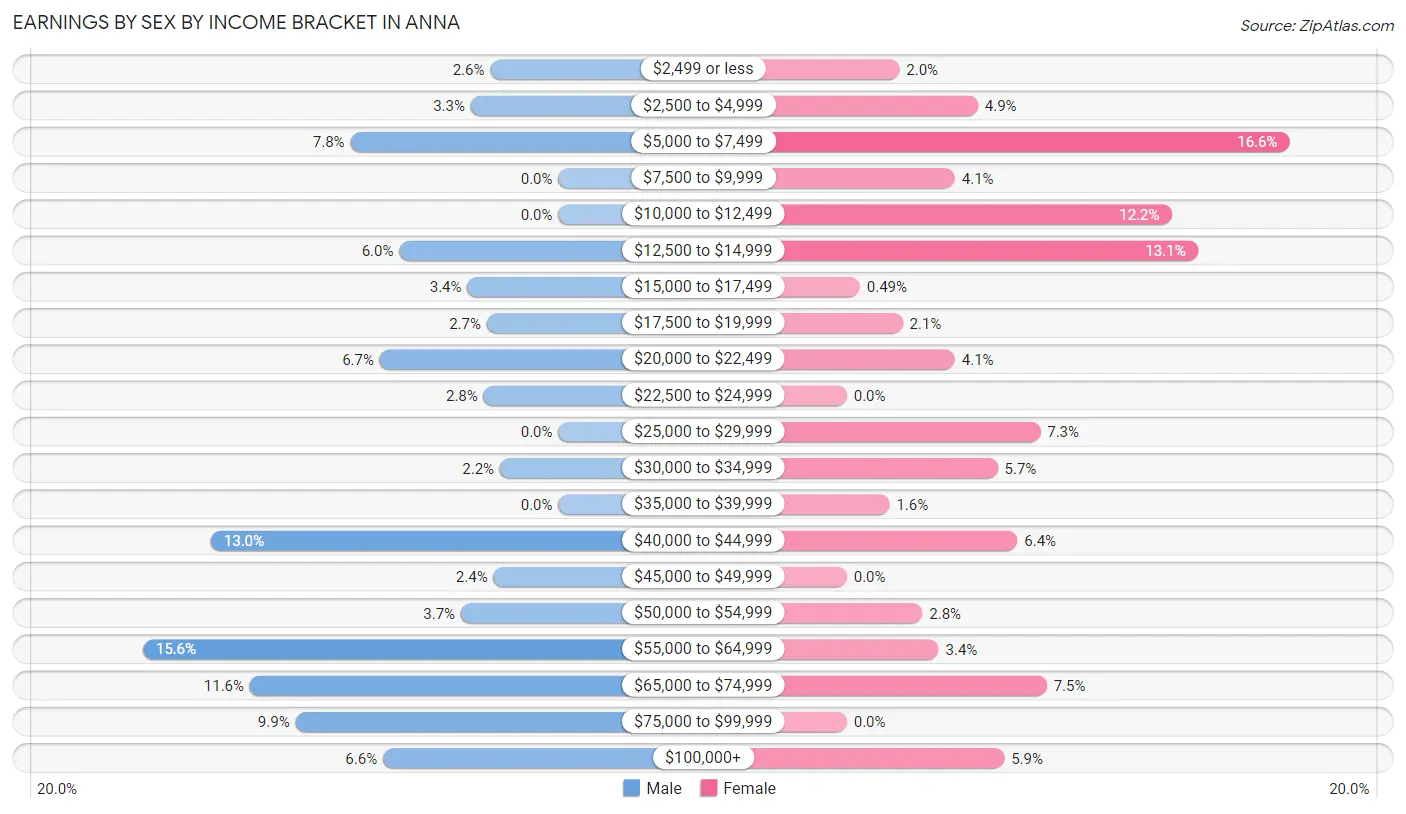
Earnings by Sex by Income Bracket in Anna
The most common earnings brackets in Anna are $55,000 to $64,999 for men (128 | 15.6%) and $5,000 to $7,499 for women (135 | 16.6%).
| Income | Male | Female |
| $2,499 or less | 21 (2.5%) | 16 (2.0%) |
| $2,500 to $4,999 | 27 (3.3%) | 40 (4.9%) |
| $5,000 to $7,499 | 64 (7.8%) | 135 (16.6%) |
| $7,500 to $9,999 | 0 (0.0%) | 33 (4.1%) |
| $10,000 to $12,499 | 0 (0.0%) | 99 (12.2%) |
| $12,500 to $14,999 | 49 (6.0%) | 107 (13.1%) |
| $15,000 to $17,499 | 28 (3.4%) | 4 (0.5%) |
| $17,500 to $19,999 | 22 (2.7%) | 17 (2.1%) |
| $20,000 to $22,499 | 55 (6.7%) | 33 (4.1%) |
| $22,500 to $24,999 | 23 (2.8%) | 0 (0.0%) |
| $25,000 to $29,999 | 0 (0.0%) | 59 (7.2%) |
| $30,000 to $34,999 | 18 (2.2%) | 46 (5.7%) |
| $35,000 to $39,999 | 0 (0.0%) | 13 (1.6%) |
| $40,000 to $44,999 | 107 (13.0%) | 52 (6.4%) |
| $45,000 to $49,999 | 20 (2.4%) | 0 (0.0%) |
| $50,000 to $54,999 | 30 (3.6%) | 23 (2.8%) |
| $55,000 to $64,999 | 128 (15.6%) | 28 (3.4%) |
| $65,000 to $74,999 | 95 (11.6%) | 61 (7.5%) |
| $75,000 to $99,999 | 81 (9.9%) | 0 (0.0%) |
| $100,000+ | 54 (6.6%) | 48 (5.9%) |
| Total | 822 (100.0%) | 814 (100.0%) |
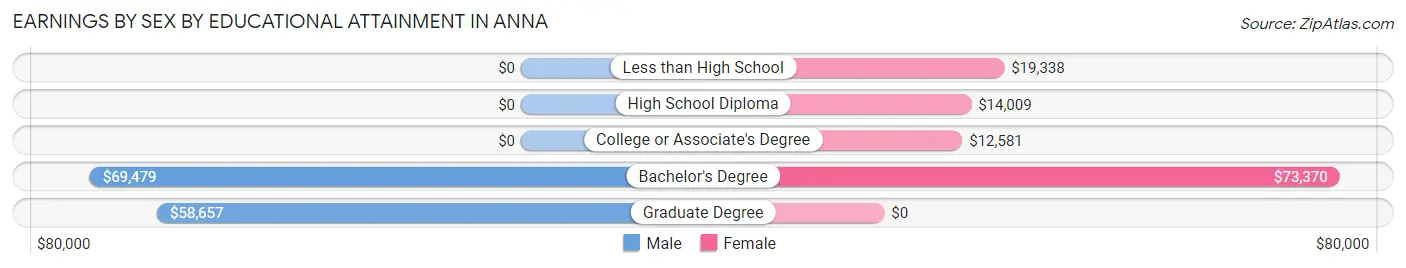
Earnings by Sex by Educational Attainment in Anna
Average earnings in Anna are $57,607 for men and $18,088 for women, a difference of 68.6%. Men with an educational attainment of bachelor's degree enjoy the highest average annual earnings of $69,479, while those with graduate degree education earn the least with $58,657. Women with an educational attainment of bachelor's degree earn the most with the average annual earnings of $73,370, while those with college or associate's degree education have the smallest earnings of $12,581.
| Educational Attainment | Male Income | Female Income |
| Less than High School | - | - |
| High School Diploma | - | - |
| College or Associate's Degree | - | - |
| Bachelor's Degree | $69,479 | $73,370 |
| Graduate Degree | $58,657 | $0 |
| Total | $57,607 | $18,088 |
Family Income in Anna
Family Income Brackets in Anna
According to the Anna family income data, there are 130 families falling into the $75,000 to $99,999 income range, which is the most common income bracket and makes up 14.9% of all families. Conversely, the $15,000 to $24,999 income bracket is the least frequent group with only 51 families (5.9%) belonging to this category.
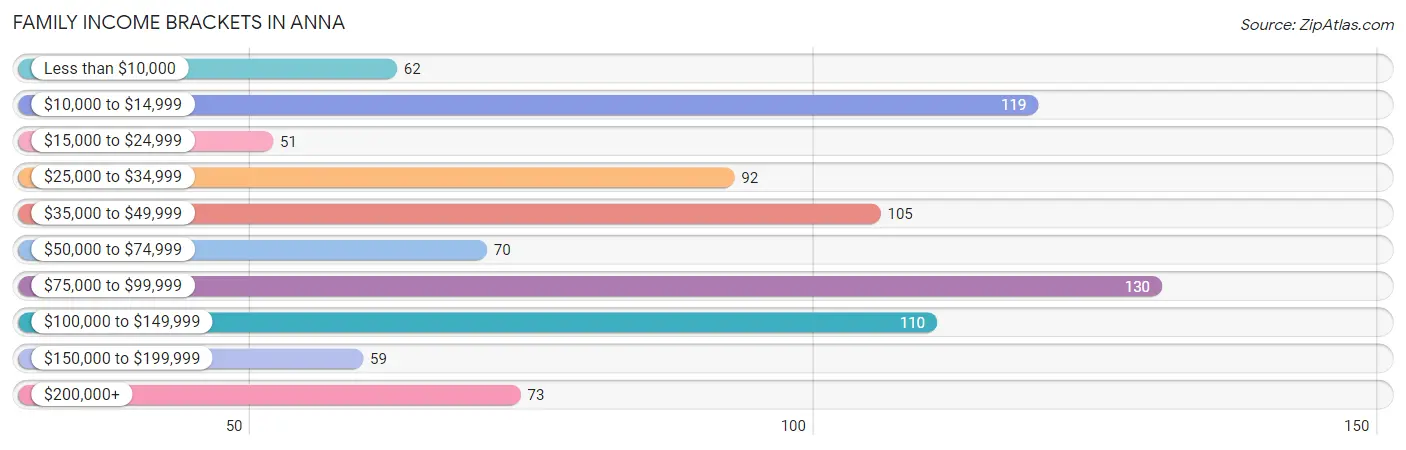
| Income Bracket | # Families | % Families |
| Less than $10,000 | 62 | 7.1% |
| $10,000 to $14,999 | 119 | 13.7% |
| $15,000 to $24,999 | 51 | 5.9% |
| $25,000 to $34,999 | 92 | 10.6% |
| $35,000 to $49,999 | 105 | 12.1% |
| $50,000 to $74,999 | 70 | 8.0% |
| $75,000 to $99,999 | 130 | 14.9% |
| $100,000 to $149,999 | 110 | 12.6% |
| $150,000 to $199,999 | 59 | 6.8% |
| $200,000+ | 73 | 8.4% |
Family Income by Famaliy Size in Anna
2-person families (500 | 57.4%) account for the highest median family income in Anna with $39,783 per family, while 2-person families (500 | 57.4%) have the highest median income of $19,892 per family member.
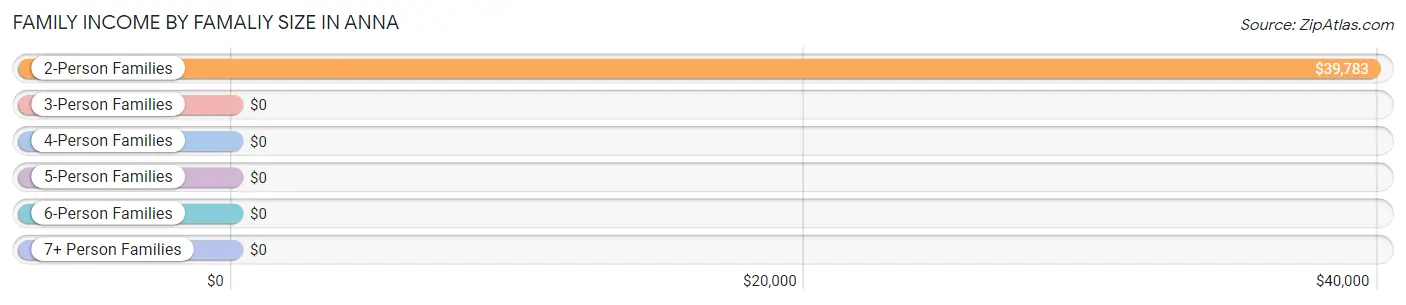
| Income Bracket | # Families | Median Income |
| 2-Person Families | 500 (57.4%) | $39,783 |
| 3-Person Families | 139 (16.0%) | $0 |
| 4-Person Families | 123 (14.1%) | $0 |
| 5-Person Families | 51 (5.9%) | $0 |
| 6-Person Families | 41 (4.7%) | $0 |
| 7+ Person Families | 17 (1.9%) | $0 |
| Total | 871 (100.0%) | $61,806 |
Family Income by Number of Earners in Anna
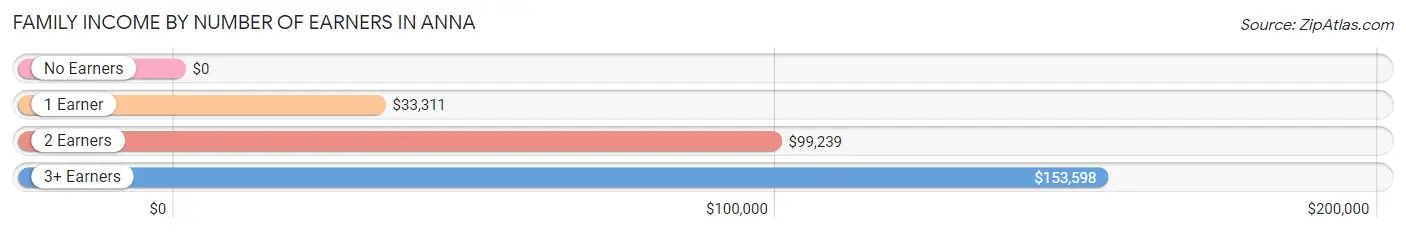
| Number of Earners | # Families | Median Income |
| No Earners | 171 (19.6%) | $0 |
| 1 Earner | 348 (40.0%) | $33,311 |
| 2 Earners | 278 (31.9%) | $99,239 |
| 3+ Earners | 74 (8.5%) | $153,598 |
| Total | 871 (100.0%) | $61,806 |
Household Income in Anna
Household Income Brackets in Anna
With 319 households falling in the category, the $35,000 to $49,999 income range is the most frequent in Anna, accounting for 17.7% of all households. In contrast, only 72 households (4.0%) fall into the $200,000+ income bracket, making it the least populous group.
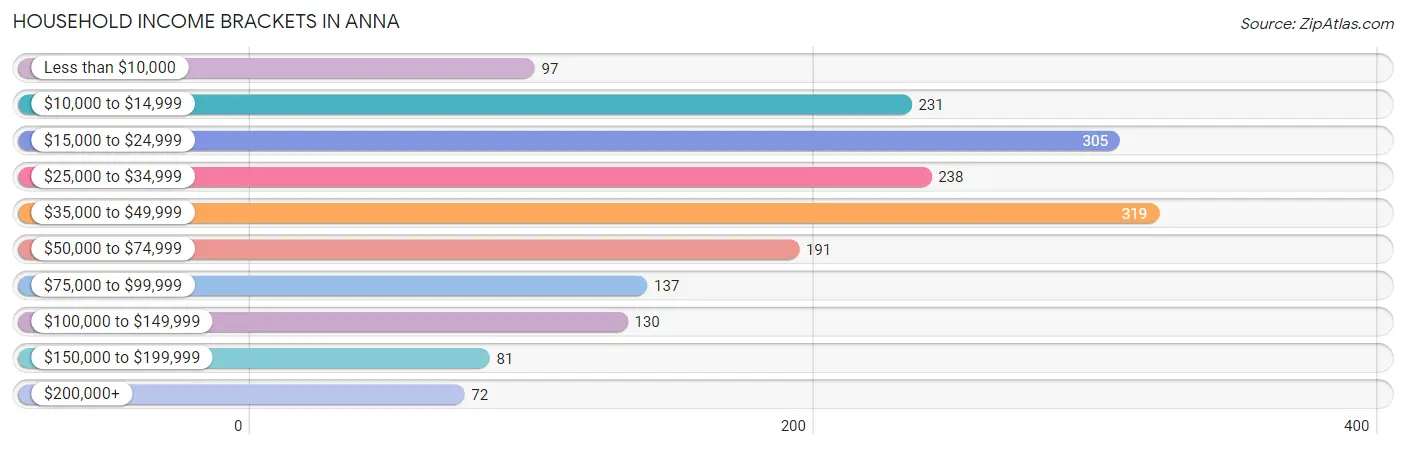
| Income Bracket | # Households | % Households |
| Less than $10,000 | 97 | 5.4% |
| $10,000 to $14,999 | 231 | 12.8% |
| $15,000 to $24,999 | 305 | 16.9% |
| $25,000 to $34,999 | 238 | 13.2% |
| $35,000 to $49,999 | 319 | 17.7% |
| $50,000 to $74,999 | 191 | 10.6% |
| $75,000 to $99,999 | 137 | 7.6% |
| $100,000 to $149,999 | 130 | 7.2% |
| $150,000 to $199,999 | 81 | 4.5% |
| $200,000+ | 72 | 4.0% |
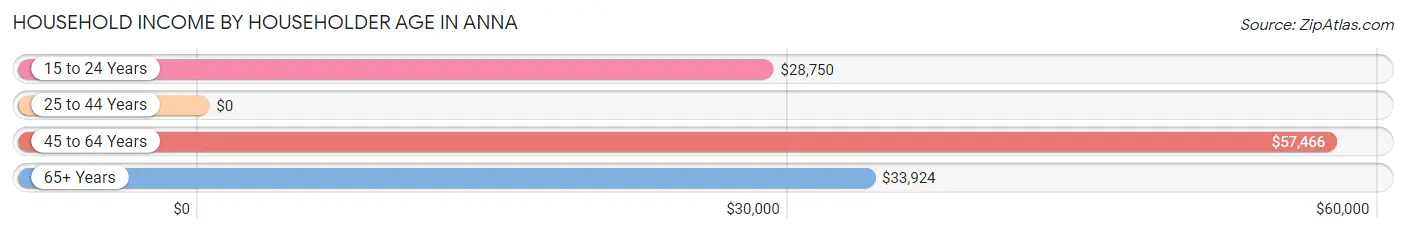
Household Income by Householder Age in Anna
The median household income in Anna is $36,786, with the highest median household income of $57,466 found in the 45 to 64 years age bracket for the primary householder. A total of 571 households (31.7%) fall into this category. Meanwhile, the 25 to 44 years age bracket for the primary householder has the lowest median household income of $0, with 345 households (19.1%) in this group.
| Income Bracket | # Households | Median Income |
| 15 to 24 Years | 120 (6.7%) | $28,750 |
| 25 to 44 Years | 345 (19.1%) | $0 |
| 45 to 64 Years | 571 (31.7%) | $57,466 |
| 65+ Years | 768 (42.6%) | $33,924 |
| Total | 1,804 (100.0%) | $36,786 |
Poverty in Anna
Income Below Poverty by Sex and Age in Anna
With 35.2% poverty level for males and 32.0% for females among the residents of Anna, 16 and 17 year old males and 15 year old females are the most vulnerable to poverty, with 33 males (100.0%) and 33 females (100.0%) in their respective age groups living below the poverty level.
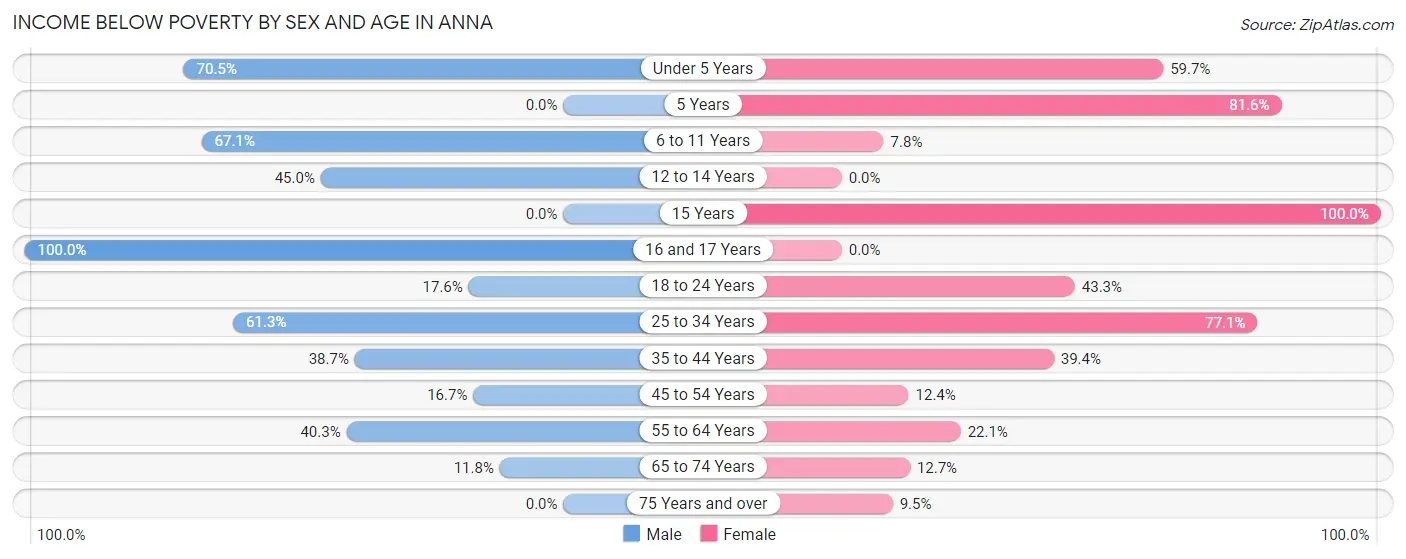
| Age Bracket | Male | Female |
| Under 5 Years | 117 (70.5%) | 71 (59.7%) |
| 5 Years | 0 (0.0%) | 62 (81.6%) |
| 6 to 11 Years | 94 (67.1%) | 8 (7.8%) |
| 12 to 14 Years | 68 (45.0%) | 0 (0.0%) |
| 15 Years | 0 (0.0%) | 33 (100.0%) |
| 16 and 17 Years | 33 (100.0%) | 0 (0.0%) |
| 18 to 24 Years | 29 (17.6%) | 77 (43.3%) |
| 25 to 34 Years | 122 (61.3%) | 182 (77.1%) |
| 35 to 44 Years | 115 (38.7%) | 61 (39.4%) |
| 45 to 54 Years | 44 (16.7%) | 31 (12.4%) |
| 55 to 64 Years | 97 (40.3%) | 49 (22.1%) |
| 65 to 74 Years | 30 (11.8%) | 31 (12.7%) |
| 75 Years and over | 0 (0.0%) | 24 (9.5%) |
| Total | 749 (35.2%) | 629 (32.0%) |
Income Above Poverty by Sex and Age in Anna
According to the poverty statistics in Anna, males aged 5 years and females aged 12 to 14 years are the age groups that are most secure financially, with 100.0% of males and 100.0% of females in these age groups living above the poverty line.
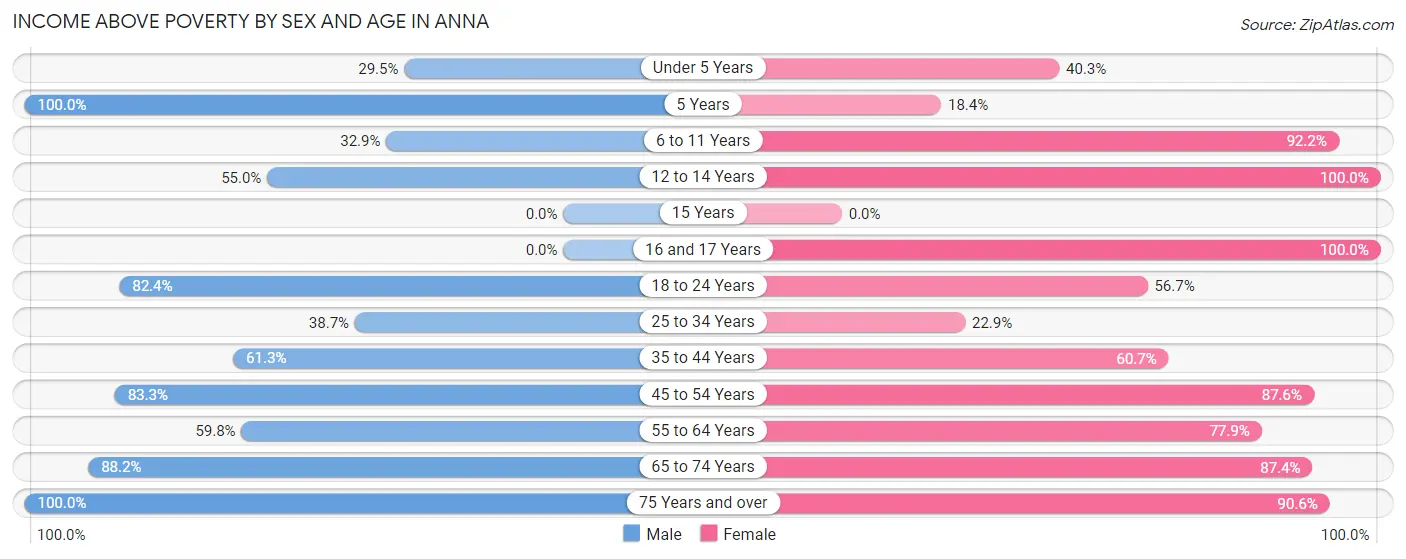
| Age Bracket | Male | Female |
| Under 5 Years | 49 (29.5%) | 48 (40.3%) |
| 5 Years | 41 (100.0%) | 14 (18.4%) |
| 6 to 11 Years | 46 (32.9%) | 95 (92.2%) |
| 12 to 14 Years | 83 (55.0%) | 52 (100.0%) |
| 15 Years | 0 (0.0%) | 0 (0.0%) |
| 16 and 17 Years | 0 (0.0%) | 40 (100.0%) |
| 18 to 24 Years | 136 (82.4%) | 101 (56.7%) |
| 25 to 34 Years | 77 (38.7%) | 54 (22.9%) |
| 35 to 44 Years | 182 (61.3%) | 94 (60.7%) |
| 45 to 54 Years | 219 (83.3%) | 219 (87.6%) |
| 55 to 64 Years | 144 (59.8%) | 173 (77.9%) |
| 65 to 74 Years | 224 (88.2%) | 214 (87.4%) |
| 75 Years and over | 179 (100.0%) | 230 (90.5%) |
| Total | 1,380 (64.8%) | 1,334 (68.0%) |
Income Below Poverty Among Married-Couple Families in Anna
The poverty statistics for married-couple families in Anna show that 12.4% or 73 of the total 589 families live below the poverty line. Families with 5 or more children have the highest poverty rate of 100.0%, comprising of 17 families. On the other hand, families with 3 or 4 children have the lowest poverty rate of 0.0%, which includes 0 families.
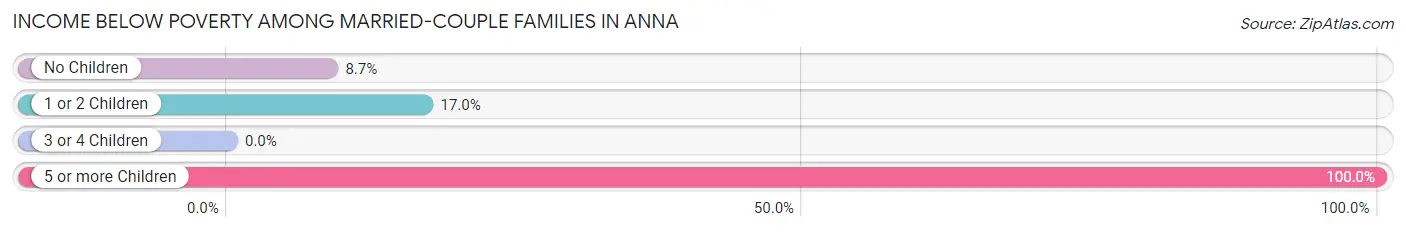
| Children | Above Poverty | Below Poverty |
| No Children | 334 (91.3%) | 32 (8.7%) |
| 1 or 2 Children | 117 (83.0%) | 24 (17.0%) |
| 3 or 4 Children | 65 (100.0%) | 0 (0.0%) |
| 5 or more Children | 0 (0.0%) | 17 (100.0%) |
| Total | 516 (87.6%) | 73 (12.4%) |
Income Below Poverty Among Single-Parent Households in Anna
According to the poverty data in Anna, 38.0% or 54 single-father households and 80.7% or 113 single-mother households are living below the poverty line. Among single-father households, those with 3 or 4 children have the highest poverty rate, with 27 households (77.1%) experiencing poverty. Likewise, among single-mother households, those with no children have the highest poverty rate, with 20 households (100.0%) falling below the poverty line.
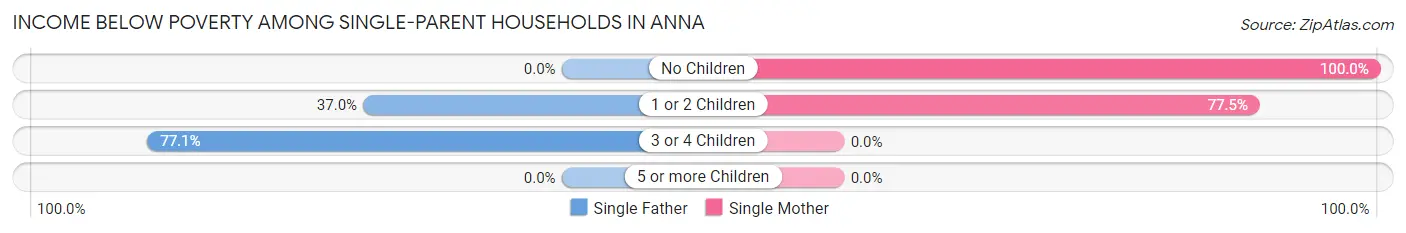
| Children | Single Father | Single Mother |
| No Children | 0 (0.0%) | 20 (100.0%) |
| 1 or 2 Children | 27 (37.0%) | 93 (77.5%) |
| 3 or 4 Children | 27 (77.1%) | 0 (0.0%) |
| 5 or more Children | 0 (0.0%) | 0 (0.0%) |
| Total | 54 (38.0%) | 113 (80.7%) |
Income Below Poverty Among Married-Couple vs Single-Parent Households in Anna
The poverty data for Anna shows that 73 of the married-couple family households (12.4%) and 167 of the single-parent households (59.2%) are living below the poverty level. Within the married-couple family households, those with 5 or more children have the highest poverty rate, with 17 households (100.0%) falling below the poverty line. Among the single-parent households, those with 3 or 4 children have the highest poverty rate, with 27 household (77.1%) living below poverty.
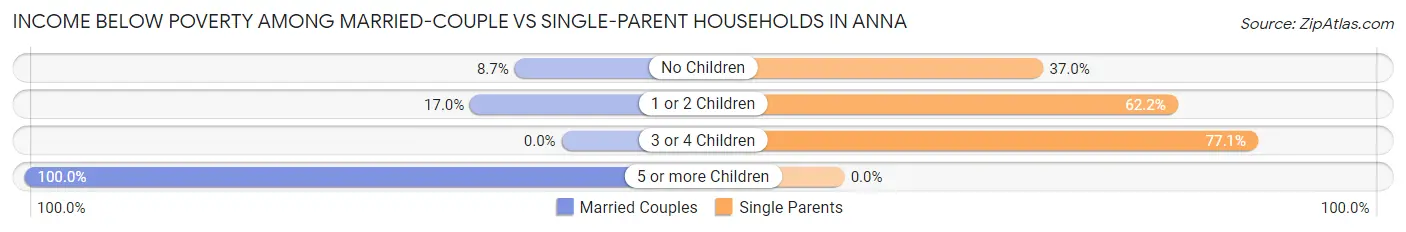
| Children | Married-Couple Families | Single-Parent Households |
| No Children | 32 (8.7%) | 20 (37.0%) |
| 1 or 2 Children | 24 (17.0%) | 120 (62.2%) |
| 3 or 4 Children | 0 (0.0%) | 27 (77.1%) |
| 5 or more Children | 17 (100.0%) | 0 (0.0%) |
| Total | 73 (12.4%) | 167 (59.2%) |
Race in Anna
The most populous races in Anna are White / Caucasian (3,863 | 90.7%), Hispanic or Latino (236 | 5.5%), and Two or more Races (213 | 5.0%).
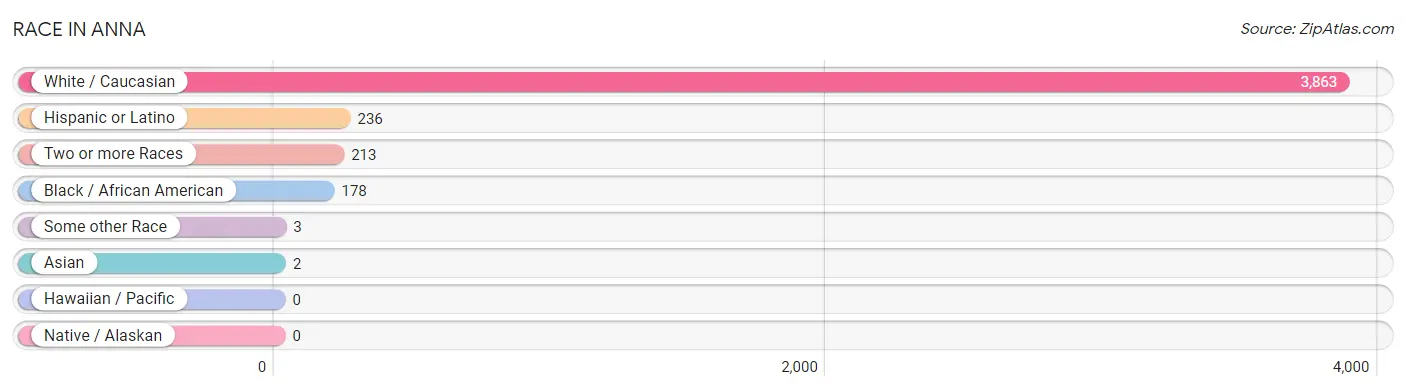
| Race | # Population | % Population |
| Asian | 2 | 0.1% |
| Black / African American | 178 | 4.2% |
| Hawaiian / Pacific | 0 | 0.0% |
| Hispanic or Latino | 236 | 5.5% |
| Native / Alaskan | 0 | 0.0% |
| White / Caucasian | 3,863 | 90.7% |
| Two or more Races | 213 | 5.0% |
| Some other Race | 3 | 0.1% |
| Total | 4,259 | 100.0% |
Ancestry in Anna
The most populous ancestries reported in Anna are German (709 | 16.7%), English (519 | 12.2%), Irish (424 | 10.0%), Central American (173 | 4.1%), and Honduran (173 | 4.1%), together accounting for 46.9% of all Anna residents.
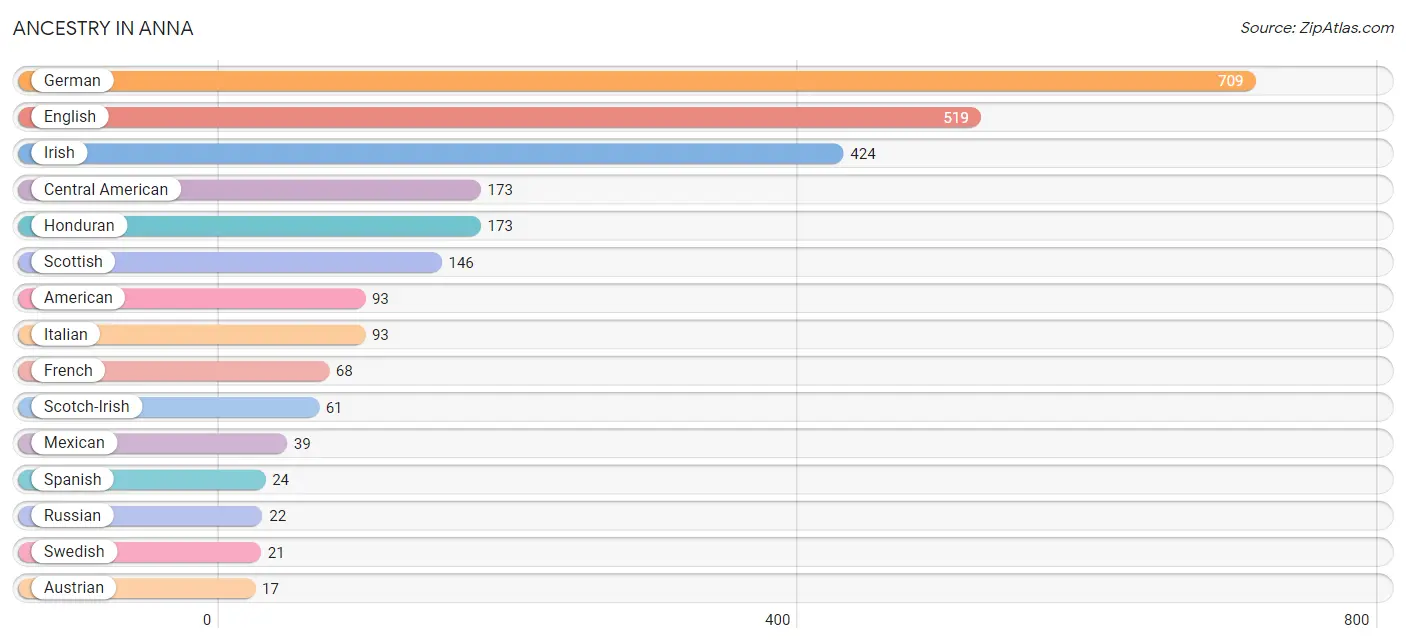
| Ancestry | # Population | % Population |
| African | 4 | 0.1% |
| American | 93 | 2.2% |
| Austrian | 17 | 0.4% |
| British | 16 | 0.4% |
| Burmese | 2 | 0.1% |
| Central American | 173 | 4.1% |
| Dutch | 4 | 0.1% |
| English | 519 | 12.2% |
| French | 68 | 1.6% |
| German | 709 | 16.7% |
| Honduran | 173 | 4.1% |
| Irish | 424 | 10.0% |
| Italian | 93 | 2.2% |
| Mexican | 39 | 0.9% |
| Northern European | 16 | 0.4% |
| Polish | 3 | 0.1% |
| Russian | 22 | 0.5% |
| Scotch-Irish | 61 | 1.4% |
| Scottish | 146 | 3.4% |
| Spanish | 24 | 0.6% |
| Subsaharan African | 4 | 0.1% |
| Swedish | 21 | 0.5% | View All 22 Rows |
Immigrants in Anna
The most numerous immigrant groups reported in Anna came from Central America (85 | 2.0%), Honduras (85 | 2.0%), Latin America (85 | 2.0%), Asia (2 | 0.1%), and Eastern Asia (2 | 0.1%), together accounting for 6.1% of all Anna residents.
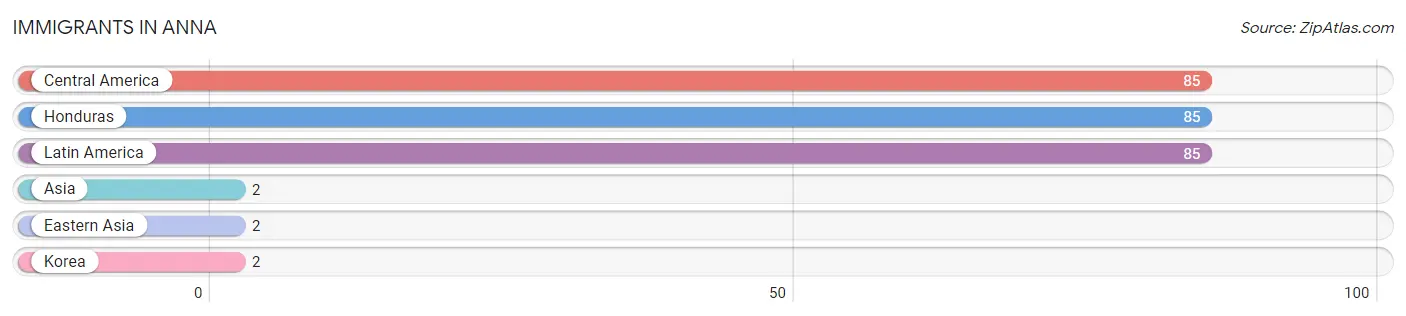
| Immigration Origin | # Population | % Population |
| Asia | 2 | 0.1% |
| Central America | 85 | 2.0% |
| Eastern Asia | 2 | 0.1% |
| Honduras | 85 | 2.0% |
| Korea | 2 | 0.1% |
| Latin America | 85 | 2.0% | View All 6 Rows |
Sex and Age in Anna
Sex and Age in Anna
The most populous age groups in Anna are 10 to 14 Years (246 | 11.1%) for men and 50 to 54 Years (185 | 9.1%) for women.
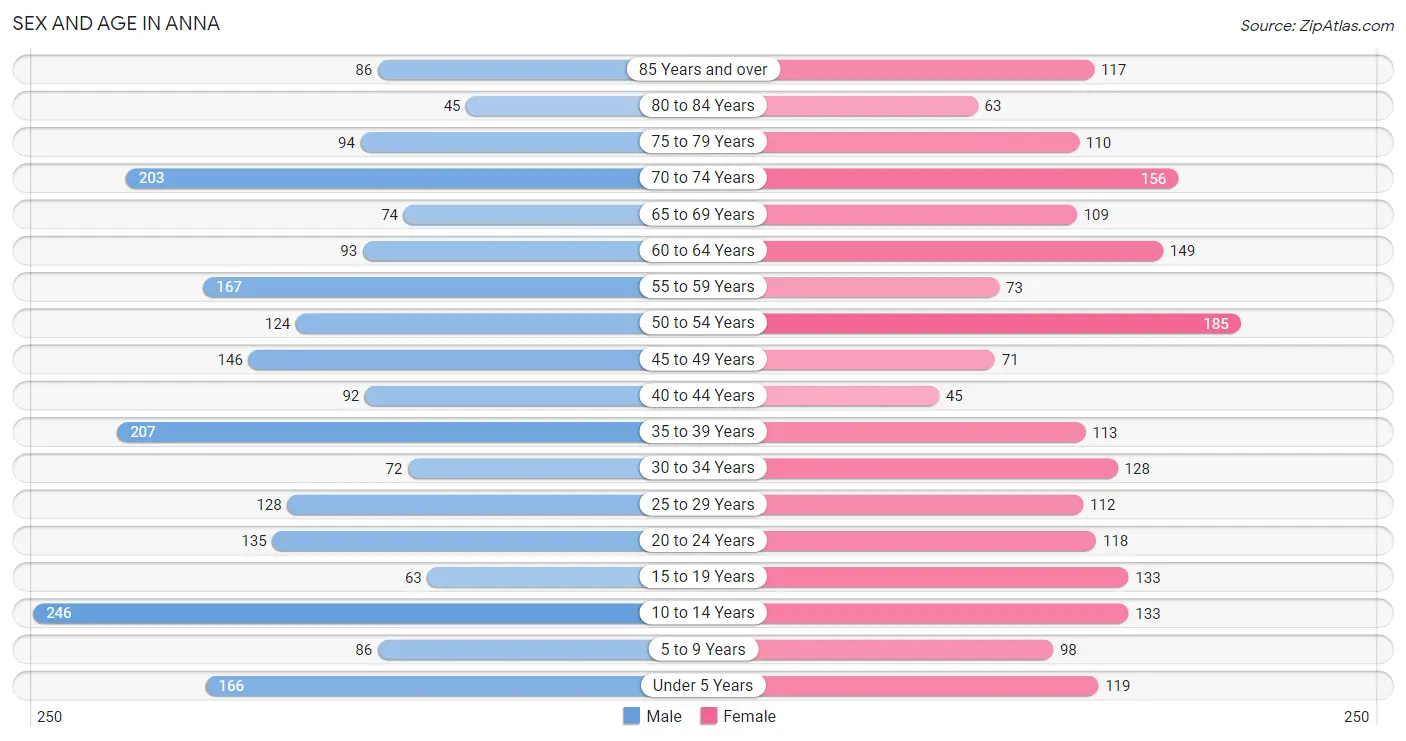
| Age Bracket | Male | Female |
| Under 5 Years | 166 (7.4%) | 119 (5.9%) |
| 5 to 9 Years | 86 (3.9%) | 98 (4.8%) |
| 10 to 14 Years | 246 (11.1%) | 133 (6.6%) |
| 15 to 19 Years | 63 (2.8%) | 133 (6.6%) |
| 20 to 24 Years | 135 (6.1%) | 118 (5.8%) |
| 25 to 29 Years | 128 (5.8%) | 112 (5.5%) |
| 30 to 34 Years | 72 (3.2%) | 128 (6.3%) |
| 35 to 39 Years | 207 (9.3%) | 113 (5.6%) |
| 40 to 44 Years | 92 (4.1%) | 45 (2.2%) |
| 45 to 49 Years | 146 (6.6%) | 71 (3.5%) |
| 50 to 54 Years | 124 (5.6%) | 185 (9.1%) |
| 55 to 59 Years | 167 (7.5%) | 73 (3.6%) |
| 60 to 64 Years | 93 (4.2%) | 149 (7.3%) |
| 65 to 69 Years | 74 (3.3%) | 109 (5.4%) |
| 70 to 74 Years | 203 (9.1%) | 156 (7.7%) |
| 75 to 79 Years | 94 (4.2%) | 110 (5.4%) |
| 80 to 84 Years | 45 (2.0%) | 63 (3.1%) |
| 85 Years and over | 86 (3.9%) | 117 (5.8%) |
| Total | 2,227 (100.0%) | 2,032 (100.0%) |
Families and Households in Anna
Median Family Size in Anna
The median family size in Anna is 3.16 persons per family, with single male/father families (142 | 16.3%) accounting for the largest median family size of 3.56 persons per family. On the other hand, single female/mother families (140 | 16.1%) represent the smallest median family size with 2.19 persons per family.
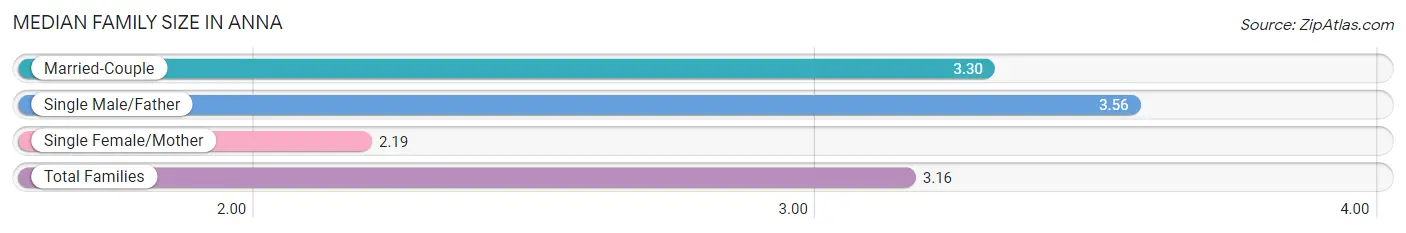
| Family Type | # Families | Family Size |
| Married-Couple | 589 (67.6%) | 3.30 |
| Single Male/Father | 142 (16.3%) | 3.56 |
| Single Female/Mother | 140 (16.1%) | 2.19 |
| Total Families | 871 (100.0%) | 3.16 |
Median Household Size in Anna
The median household size in Anna is 2.20 persons per household, with single male/father households (142 | 7.9%) accounting for the largest median household size of 4.18 persons per household. non-family households (933 | 51.7%) represent the smallest median household size with 1.13 persons per household.
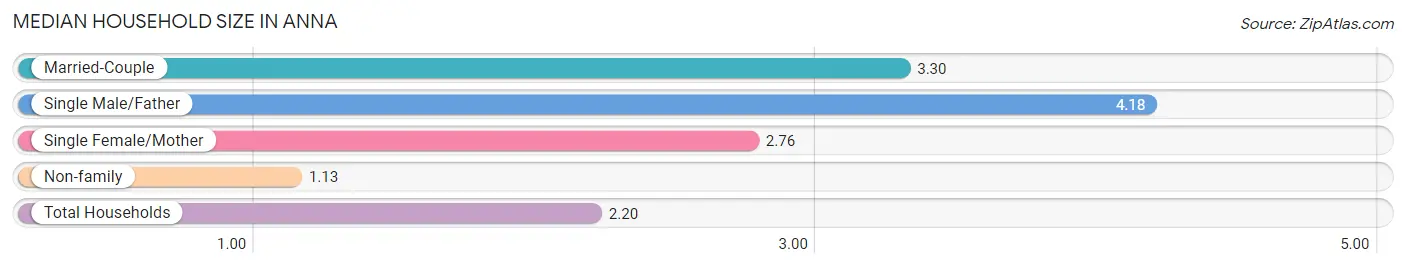
| Household Type | # Households | Household Size |
| Married-Couple | 589 (32.7%) | 3.30 |
| Single Male/Father | 142 (7.9%) | 4.18 |
| Single Female/Mother | 140 (7.8%) | 2.76 |
| Non-family | 933 (51.7%) | 1.13 |
| Total Households | 1,804 (100.0%) | 2.20 |
Household Size by Marriage Status in Anna
Out of a total of 1,804 households in Anna, 871 (48.3%) are family households, while 933 (51.7%) are nonfamily households. The most numerous type of family households are 2-person households, comprising 422, and the most common type of nonfamily households are 1-person households, comprising 853.
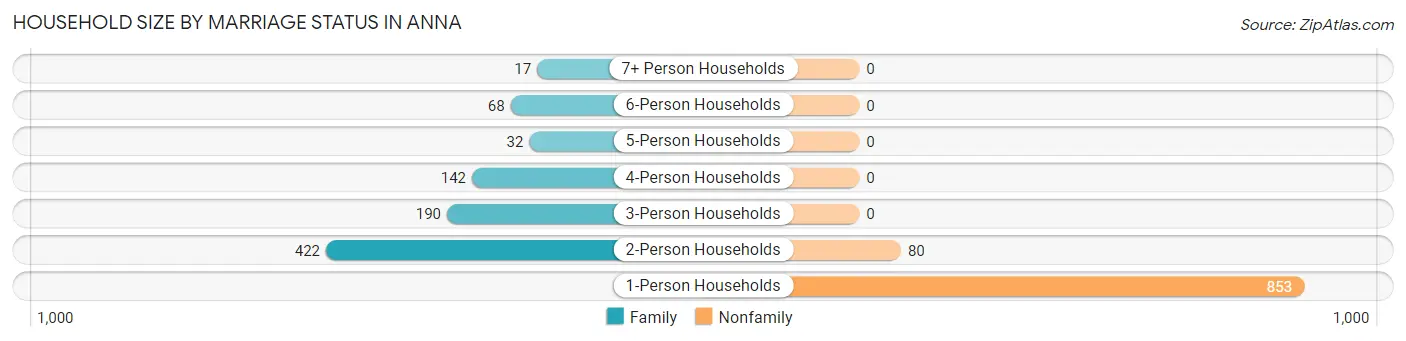
| Household Size | Family Households | Nonfamily Households |
| 1-Person Households | - | 853 (47.3%) |
| 2-Person Households | 422 (23.4%) | 80 (4.4%) |
| 3-Person Households | 190 (10.5%) | 0 (0.0%) |
| 4-Person Households | 142 (7.9%) | 0 (0.0%) |
| 5-Person Households | 32 (1.8%) | 0 (0.0%) |
| 6-Person Households | 68 (3.8%) | 0 (0.0%) |
| 7+ Person Households | 17 (0.9%) | 0 (0.0%) |
| Total | 871 (48.3%) | 933 (51.7%) |
Female Fertility in Anna
Fertility by Age in Anna
Average fertility rate in Anna is 64.0 births per 1,000 women. Women in the age bracket of 20 to 34 years have the highest fertility rate with 137.0 births per 1,000 women. Women in the age bracket of 20 to 34 years acount for 100.0% of all women with births.
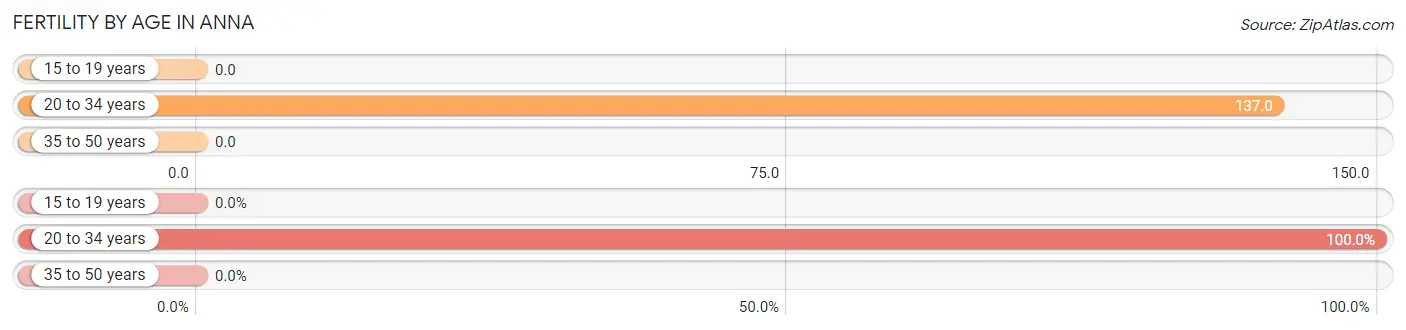
| Age Bracket | Women with Births | Births / 1,000 Women |
| 15 to 19 years | 0 (0.0%) | 0.0 |
| 20 to 34 years | 49 (100.0%) | 137.0 |
| 35 to 50 years | 0 (0.0%) | 0.0 |
| Total | 49 (100.0%) | 64.0 |
Fertility by Age by Marriage Status in Anna
69.4% of women with births (49) in Anna are married. The highest percentage of unmarried women with births falls into 20 to 34 years age bracket with 30.6% of them unmarried at the time of birth, while the lowest percentage of unmarried women with births belong to 20 to 34 years age bracket with 30.6% of them unmarried.

| Age Bracket | Married | Unmarried |
| 15 to 19 years | 0 (0.0%) | 0 (0.0%) |
| 20 to 34 years | 34 (69.4%) | 15 (30.6%) |
| 35 to 50 years | 0 (0.0%) | 0 (0.0%) |
| Total | 34 (69.4%) | 15 (30.6%) |
Fertility by Education in Anna
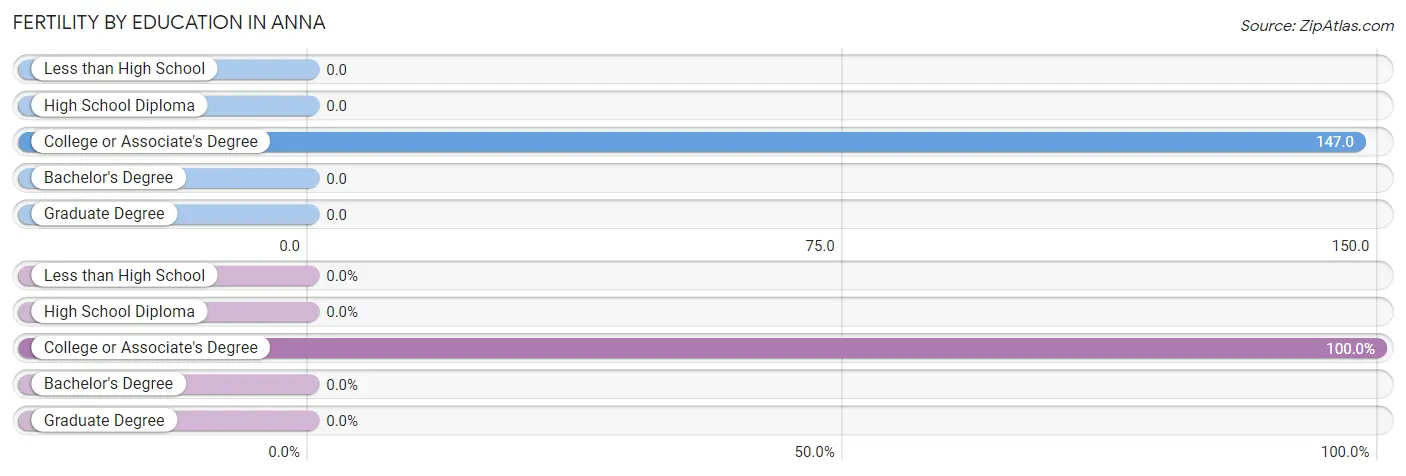
| Educational Attainment | Women with Births | Births / 1,000 Women |
| Less than High School | 0 (0.0%) | 0.0 |
| High School Diploma | 0 (0.0%) | 0.0 |
| College or Associate's Degree | 49 (100.0%) | 147.0 |
| Bachelor's Degree | 0 (0.0%) | 0.0 |
| Graduate Degree | 0 (0.0%) | 0.0 |
| Total | 49 (100.0%) | 64.0 |
Fertility by Education by Marriage Status in Anna
30.6% of women with births in Anna are unmarried. Women with the educational attainment of college or associate's degree are most likely to be married with 69.4% of them married at childbirth, while women with the educational attainment of college or associate's degree are least likely to be married with 30.6% of them unmarried at childbirth.
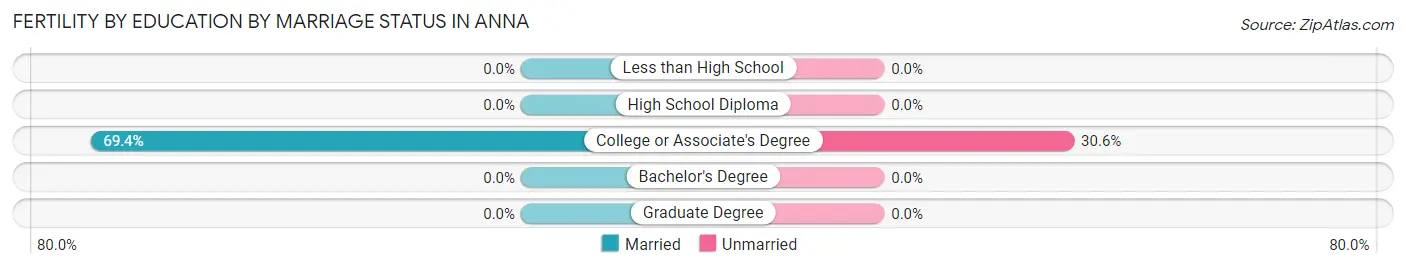
| Educational Attainment | Married | Unmarried |
| Less than High School | 0 (0.0%) | 0 (0.0%) |
| High School Diploma | 0 (0.0%) | 0 (0.0%) |
| College or Associate's Degree | 34 (69.4%) | 15 (30.6%) |
| Bachelor's Degree | 0 (0.0%) | 0 (0.0%) |
| Graduate Degree | 0 (0.0%) | 0 (0.0%) |
| Total | 34 (69.4%) | 15 (30.6%) |
Employment Characteristics in Anna
Employment by Class of Employer in Anna
Among the 1,571 employed individuals in Anna, private company employees (1,158 | 73.7%), state government employees (143 | 9.1%), and local government employees (84 | 5.3%) make up the most common classes of employment.
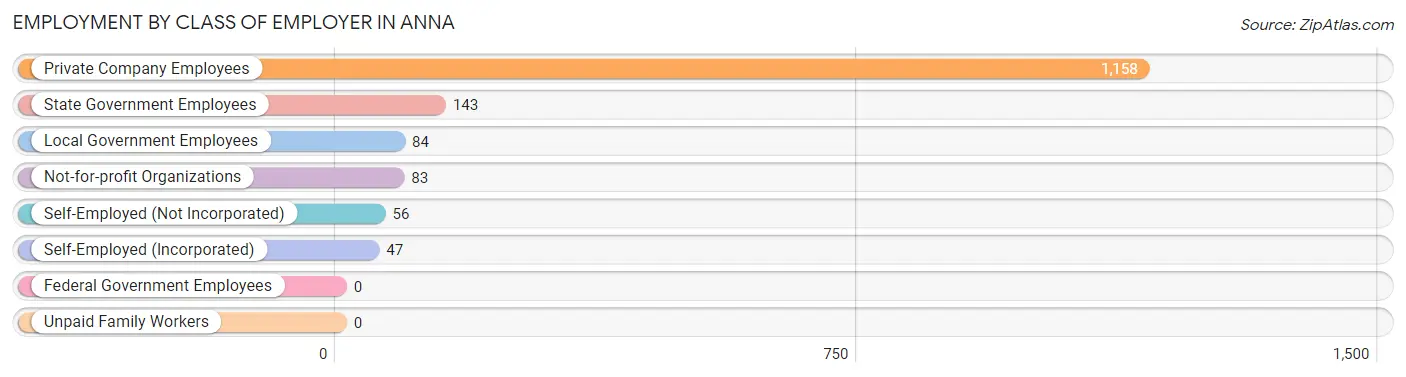
| Employer Class | # Employees | % Employees |
| Private Company Employees | 1,158 | 73.7% |
| Self-Employed (Incorporated) | 47 | 3.0% |
| Self-Employed (Not Incorporated) | 56 | 3.6% |
| Not-for-profit Organizations | 83 | 5.3% |
| Local Government Employees | 84 | 5.3% |
| State Government Employees | 143 | 9.1% |
| Federal Government Employees | 0 | 0.0% |
| Unpaid Family Workers | 0 | 0.0% |
| Total | 1,571 | 100.0% |
Employment Status by Age in Anna
According to the labor force statistics for Anna, out of the total population over 16 years of age (3,378), 50.7% or 1,713 individuals are in the labor force, with 8.3% or 142 of them unemployed. The age group with the highest labor force participation rate is 35 to 44 years, with 84.7% or 387 individuals in the labor force. Within the labor force, the 55 to 59 years age range has the highest percentage of unemployed individuals, with 37.5% or 18 of them being unemployed.
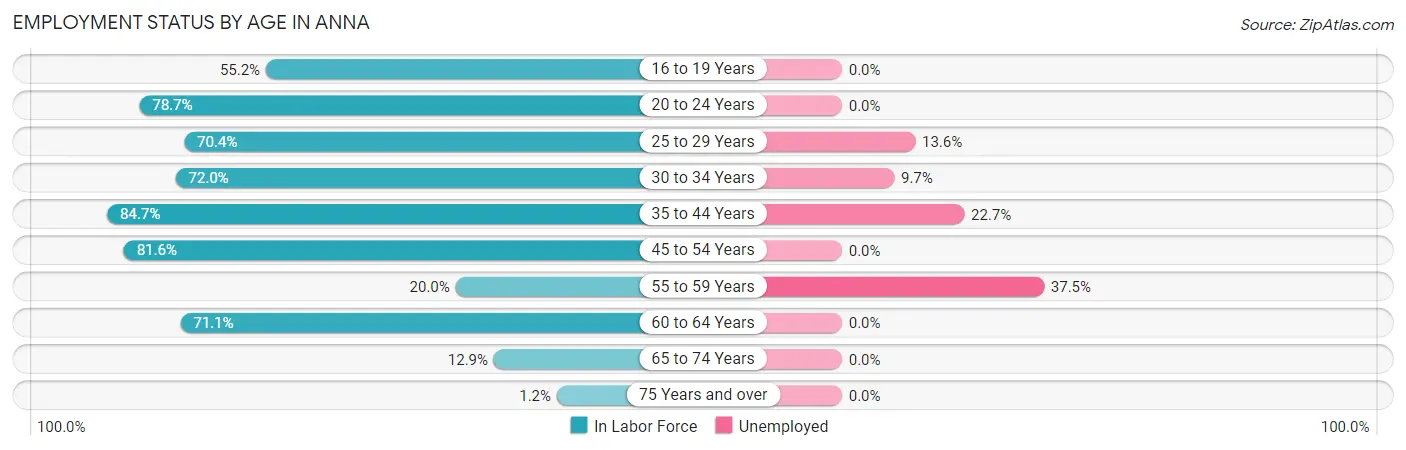
| Age Bracket | In Labor Force | Unemployed |
| 16 to 19 Years | 90 (55.2%) | 0 (0.0%) |
| 20 to 24 Years | 199 (78.7%) | 0 (0.0%) |
| 25 to 29 Years | 169 (70.4%) | 23 (13.6%) |
| 30 to 34 Years | 144 (72.0%) | 14 (9.7%) |
| 35 to 44 Years | 387 (84.7%) | 88 (22.7%) |
| 45 to 54 Years | 429 (81.6%) | 0 (0.0%) |
| 55 to 59 Years | 48 (20.0%) | 18 (37.5%) |
| 60 to 64 Years | 172 (71.1%) | 0 (0.0%) |
| 65 to 74 Years | 70 (12.9%) | 0 (0.0%) |
| 75 Years and over | 6 (1.2%) | 0 (0.0%) |
| Total | 1,713 (50.7%) | 142 (8.3%) |
Employment Status by Educational Attainment in Anna
According to labor force statistics for Anna, 70.8% of individuals (1,349) out of the total population between 25 and 64 years of age (1,905) are in the labor force, with 10.6% or 143 of them being unemployed. The group with the highest labor force participation rate are those with the educational attainment of college / associate degree, with 81.8% or 569 individuals in the labor force. Within the labor force, individuals with less than high school education have the highest percentage of unemployment, with 47.9% or 57 of them being unemployed.
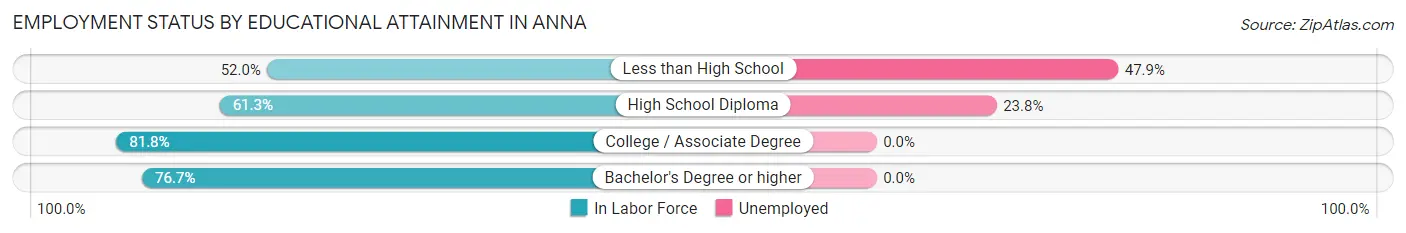
| Educational Attainment | In Labor Force | Unemployed |
| Less than High School | 119 (52.0%) | 110 (47.9%) |
| High School Diploma | 361 (61.3%) | 140 (23.8%) |
| College / Associate Degree | 569 (81.8%) | 0 (0.0%) |
| Bachelor's Degree or higher | 300 (76.7%) | 0 (0.0%) |
| Total | 1,349 (70.8%) | 202 (10.6%) |
Employment Occupations by Sex in Anna
Management, Business, Science and Arts Occupations
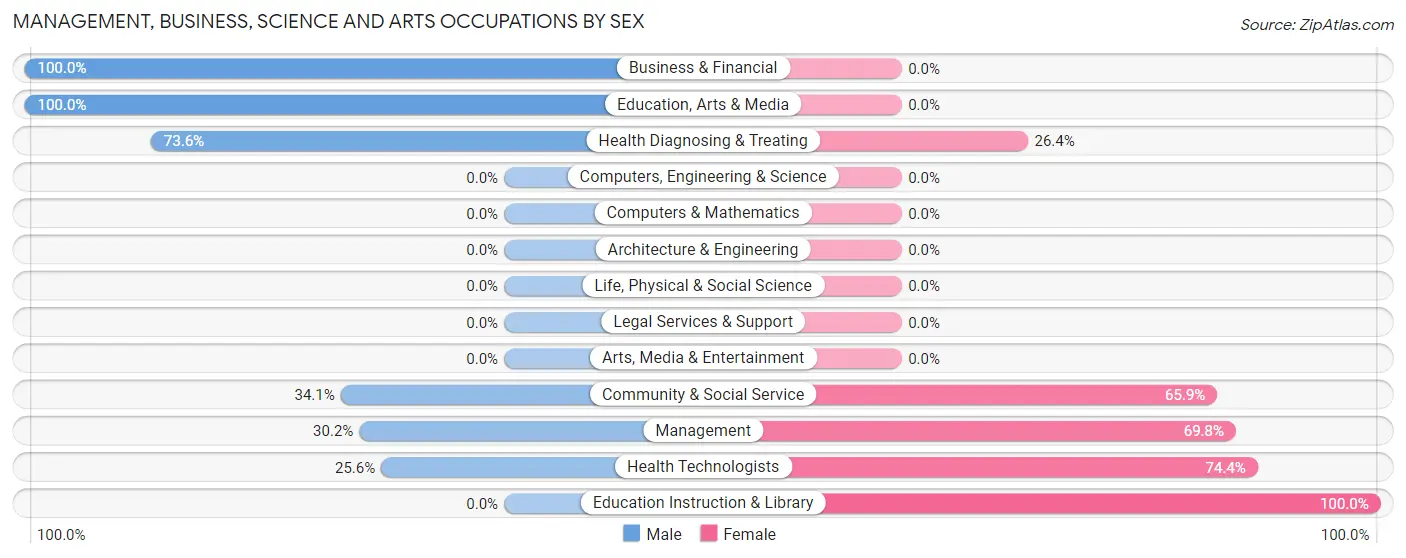
The most common Management, Business, Science and Arts occupations in Anna are Health Diagnosing & Treating (110 | 7.0%), Management (96 | 6.1%), Community & Social Service (88 | 5.6%), Education Instruction & Library (58 | 3.7%), and Business & Financial (40 | 2.5%).
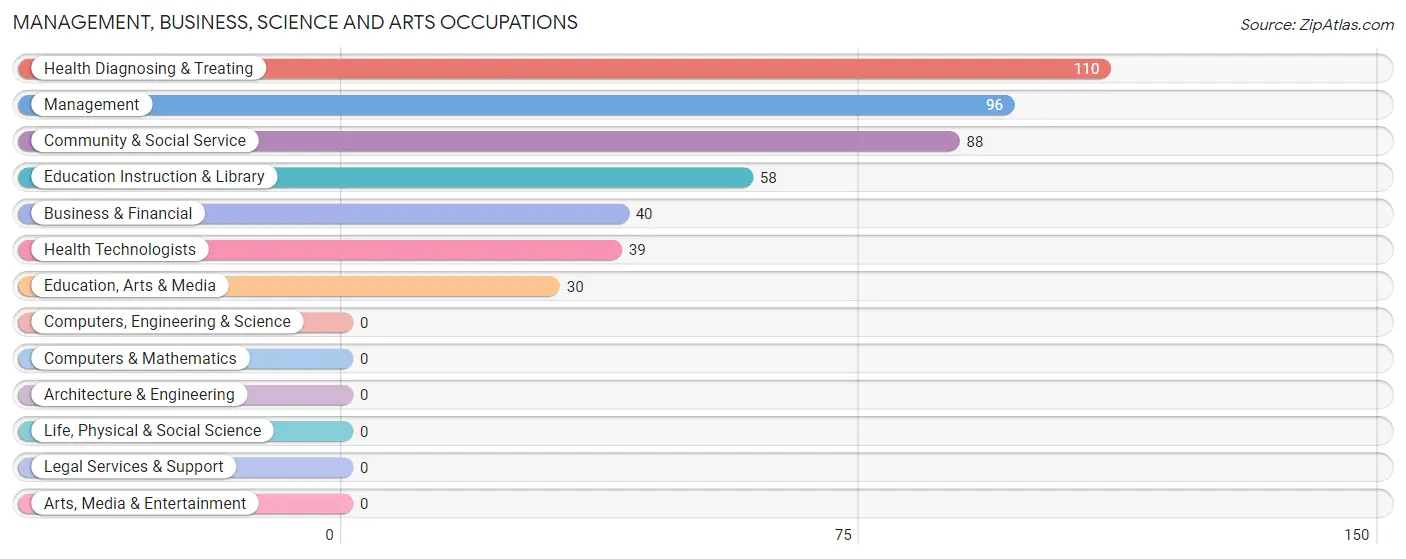
Management, Business, Science and Arts Occupations by Sex
Within the Management, Business, Science and Arts occupations in Anna, the most male-oriented occupations are Business & Financial (100.0%), Education, Arts & Media (100.0%), and Health Diagnosing & Treating (73.6%), while the most female-oriented occupations are Education Instruction & Library (100.0%), Health Technologists (74.4%), and Management (69.8%).
| Occupation | Male | Female |
| Management | 29 (30.2%) | 67 (69.8%) |
| Business & Financial | 40 (100.0%) | 0 (0.0%) |
| Computers, Engineering & Science | 0 (0.0%) | 0 (0.0%) |
| Computers & Mathematics | 0 (0.0%) | 0 (0.0%) |
| Architecture & Engineering | 0 (0.0%) | 0 (0.0%) |
| Life, Physical & Social Science | 0 (0.0%) | 0 (0.0%) |
| Community & Social Service | 30 (34.1%) | 58 (65.9%) |
| Education, Arts & Media | 30 (100.0%) | 0 (0.0%) |
| Legal Services & Support | 0 (0.0%) | 0 (0.0%) |
| Education Instruction & Library | 0 (0.0%) | 58 (100.0%) |
| Arts, Media & Entertainment | 0 (0.0%) | 0 (0.0%) |
| Health Diagnosing & Treating | 81 (73.6%) | 29 (26.4%) |
| Health Technologists | 10 (25.6%) | 29 (74.4%) |
| Total (Category) | 180 (53.9%) | 154 (46.1%) |
| Total (Overall) | 803 (51.1%) | 768 (48.9%) |
Services Occupations
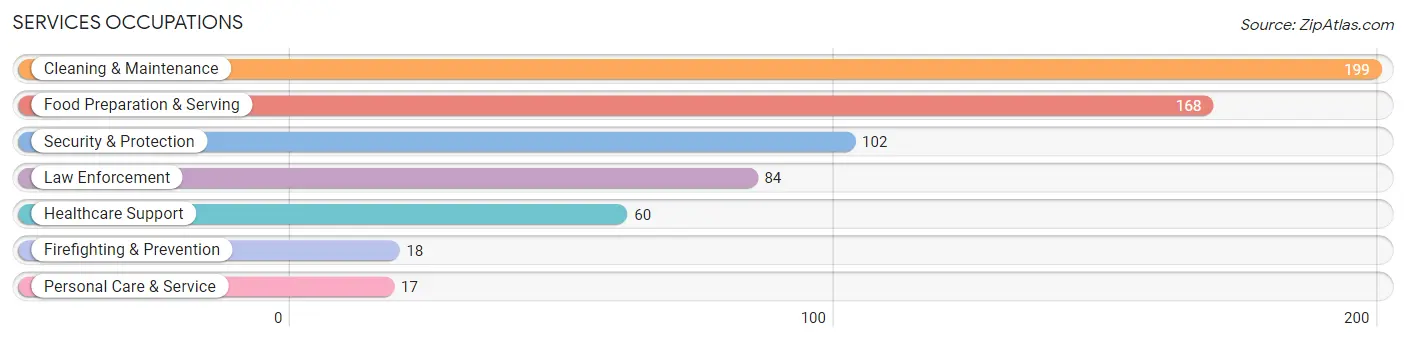
The most common Services occupations in Anna are Cleaning & Maintenance (199 | 12.7%), Food Preparation & Serving (168 | 10.7%), Security & Protection (102 | 6.5%), Law Enforcement (84 | 5.3%), and Healthcare Support (60 | 3.8%).
Services Occupations by Sex
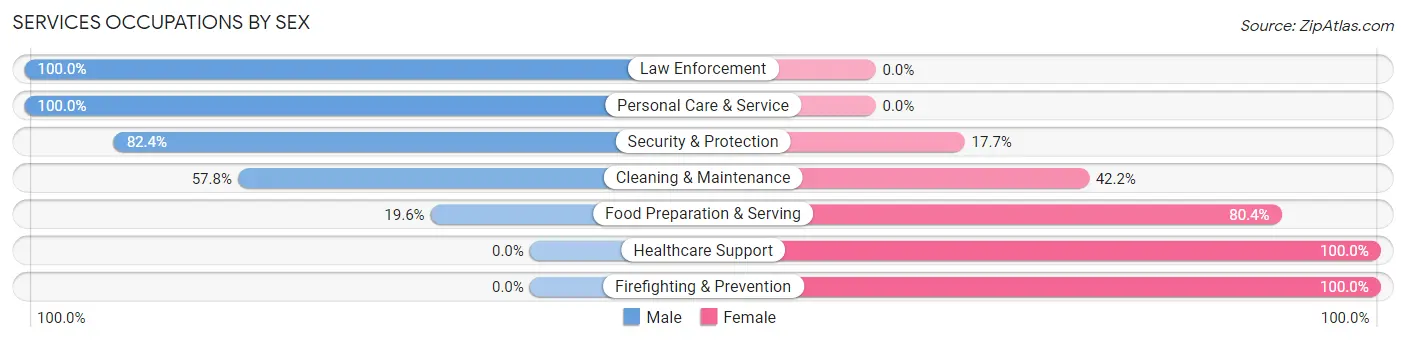
Within the Services occupations in Anna, the most male-oriented occupations are Law Enforcement (100.0%), Personal Care & Service (100.0%), and Security & Protection (82.4%), while the most female-oriented occupations are Healthcare Support (100.0%), Firefighting & Prevention (100.0%), and Food Preparation & Serving (80.4%).
| Occupation | Male | Female |
| Healthcare Support | 0 (0.0%) | 60 (100.0%) |
| Security & Protection | 84 (82.4%) | 18 (17.6%) |
| Firefighting & Prevention | 0 (0.0%) | 18 (100.0%) |
| Law Enforcement | 84 (100.0%) | 0 (0.0%) |
| Food Preparation & Serving | 33 (19.6%) | 135 (80.4%) |
| Cleaning & Maintenance | 115 (57.8%) | 84 (42.2%) |
| Personal Care & Service | 17 (100.0%) | 0 (0.0%) |
| Total (Category) | 249 (45.6%) | 297 (54.4%) |
| Total (Overall) | 803 (51.1%) | 768 (48.9%) |
Sales and Office Occupations
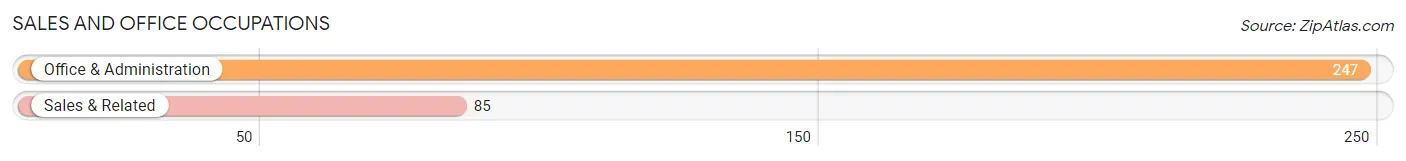
The most common Sales and Office occupations in Anna are Office & Administration (247 | 15.7%), and Sales & Related (85 | 5.4%).
Sales and Office Occupations by Sex
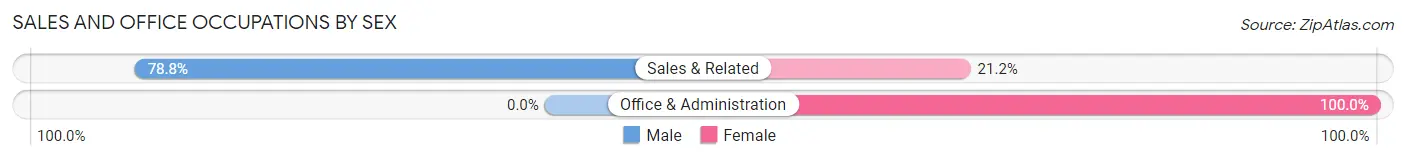
| Occupation | Male | Female |
| Sales & Related | 67 (78.8%) | 18 (21.2%) |
| Office & Administration | 0 (0.0%) | 247 (100.0%) |
| Total (Category) | 67 (20.2%) | 265 (79.8%) |
| Total (Overall) | 803 (51.1%) | 768 (48.9%) |
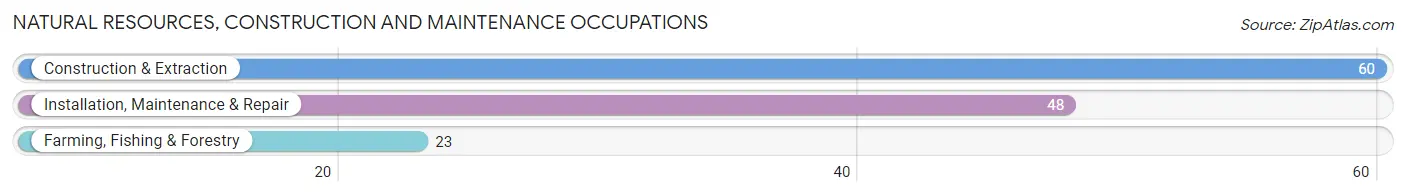
Natural Resources, Construction and Maintenance Occupations
The most common Natural Resources, Construction and Maintenance occupations in Anna are Construction & Extraction (60 | 3.8%), Installation, Maintenance & Repair (48 | 3.1%), and Farming, Fishing & Forestry (23 | 1.5%).
Natural Resources, Construction and Maintenance Occupations by Sex
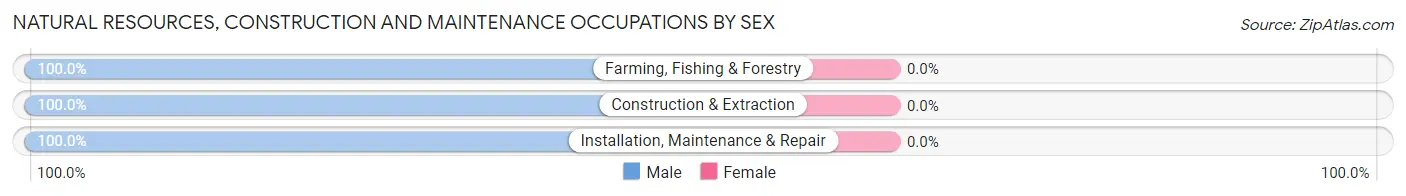
| Occupation | Male | Female |
| Farming, Fishing & Forestry | 23 (100.0%) | 0 (0.0%) |
| Construction & Extraction | 60 (100.0%) | 0 (0.0%) |
| Installation, Maintenance & Repair | 48 (100.0%) | 0 (0.0%) |
| Total (Category) | 131 (100.0%) | 0 (0.0%) |
| Total (Overall) | 803 (51.1%) | 768 (48.9%) |
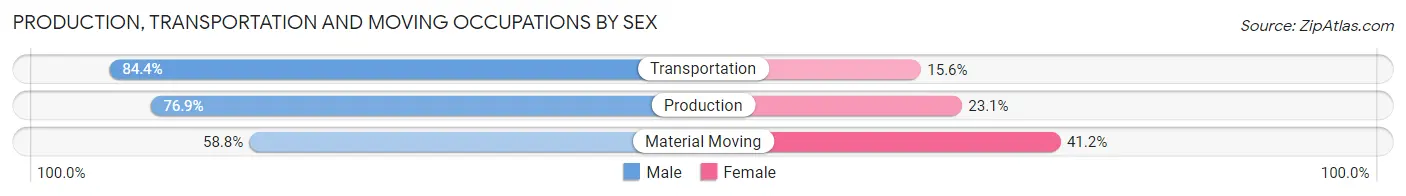
Production, Transportation and Moving Occupations
The most common Production, Transportation and Moving occupations in Anna are Production (104 | 6.6%), Transportation (90 | 5.7%), and Material Moving (34 | 2.2%).
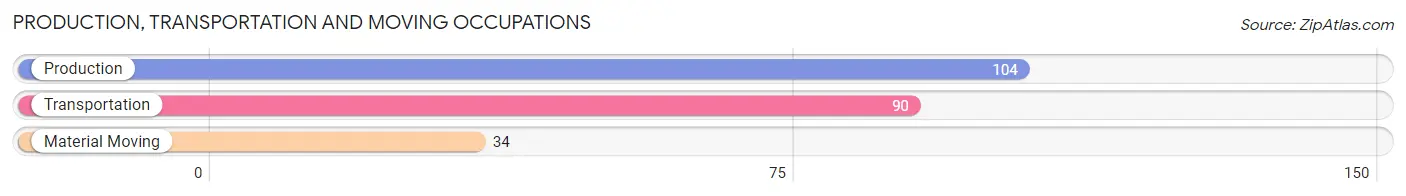
Production, Transportation and Moving Occupations by Sex
| Occupation | Male | Female |
| Production | 80 (76.9%) | 24 (23.1%) |
| Transportation | 76 (84.4%) | 14 (15.6%) |
| Material Moving | 20 (58.8%) | 14 (41.2%) |
| Total (Category) | 176 (77.2%) | 52 (22.8%) |
| Total (Overall) | 803 (51.1%) | 768 (48.9%) |
Employment Industries by Sex in Anna
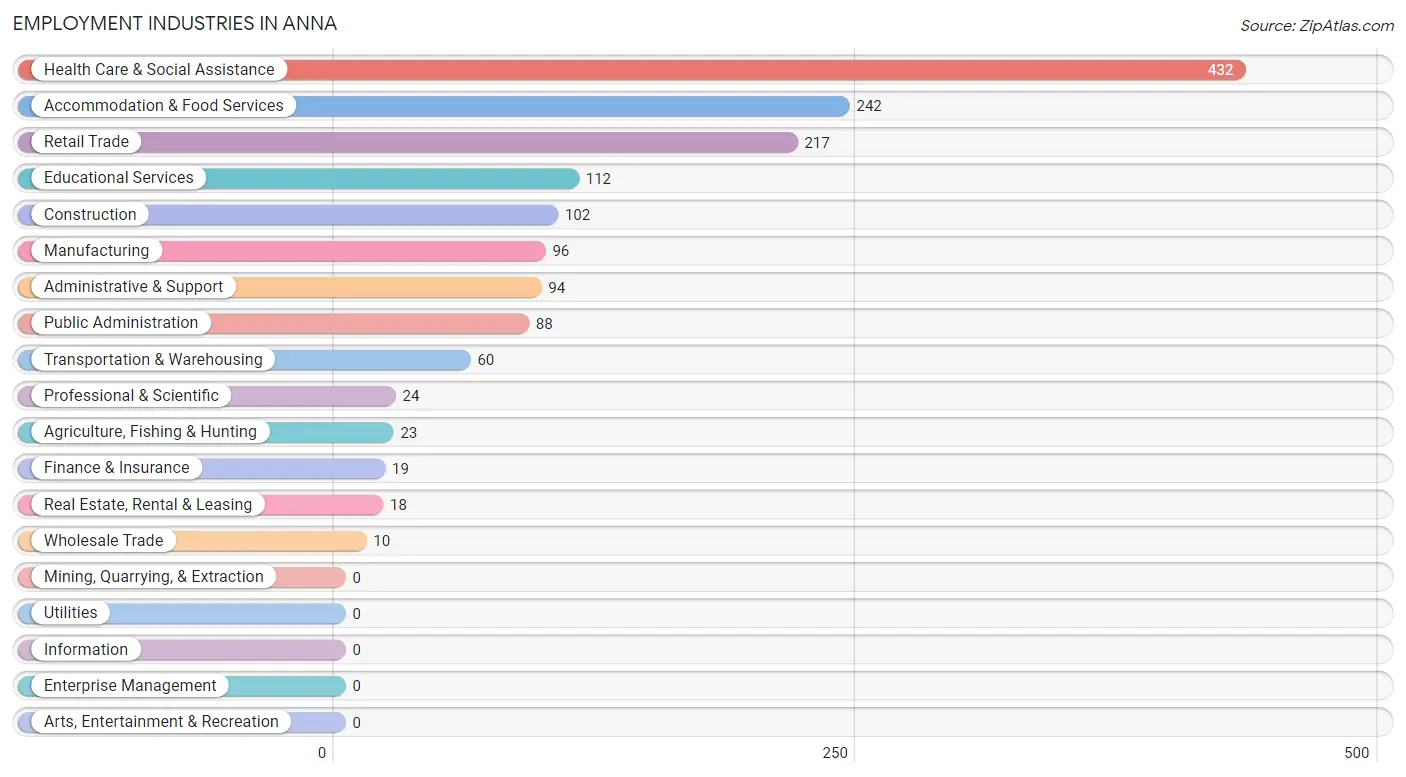
Employment Industries in Anna
The major employment industries in Anna include Health Care & Social Assistance (432 | 27.5%), Accommodation & Food Services (242 | 15.4%), Retail Trade (217 | 13.8%), Educational Services (112 | 7.1%), and Construction (102 | 6.5%).
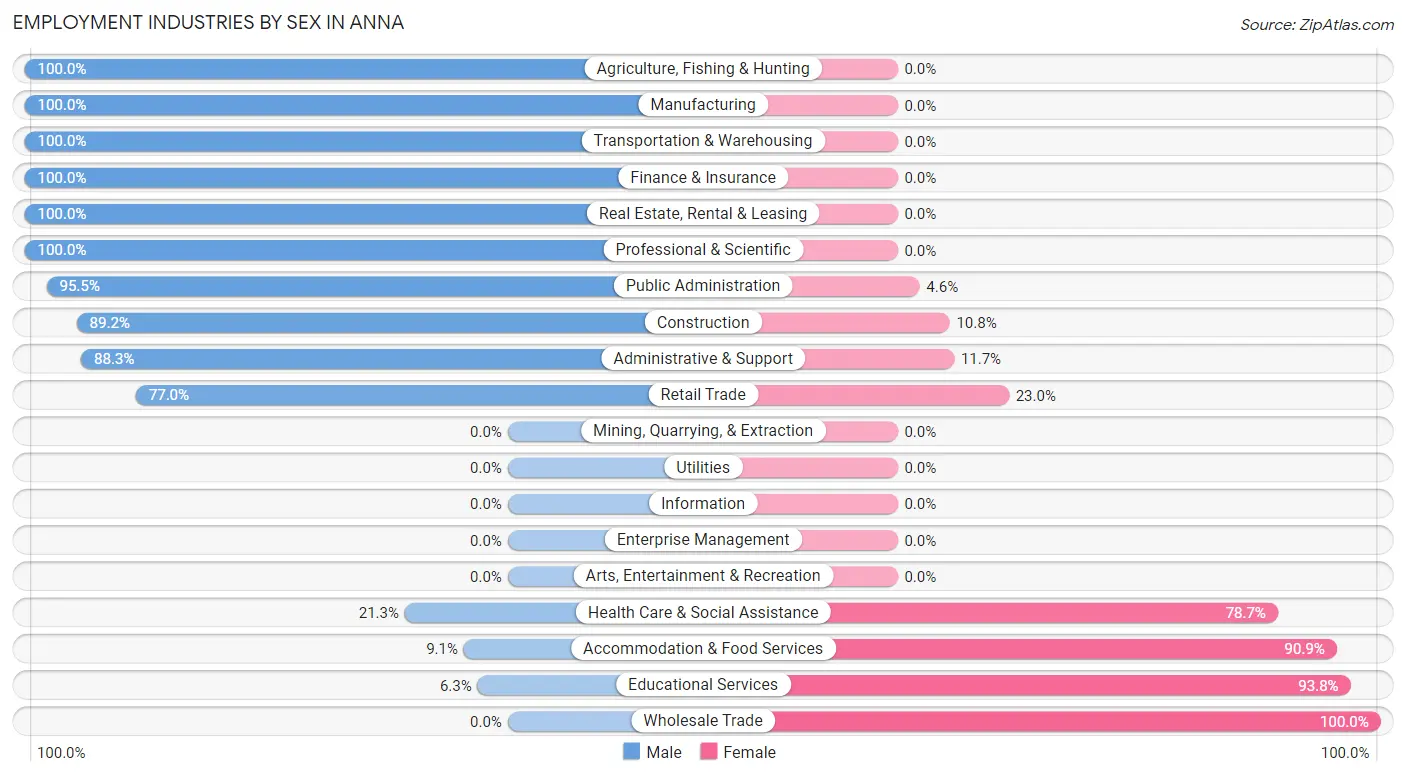
Employment Industries by Sex in Anna
The Anna industries that see more men than women are Agriculture, Fishing & Hunting (100.0%), Manufacturing (100.0%), and Transportation & Warehousing (100.0%), whereas the industries that tend to have a higher number of women are Wholesale Trade (100.0%), Educational Services (93.8%), and Accommodation & Food Services (90.9%).
| Industry | Male | Female |
| Agriculture, Fishing & Hunting | 23 (100.0%) | 0 (0.0%) |
| Mining, Quarrying, & Extraction | 0 (0.0%) | 0 (0.0%) |
| Construction | 91 (89.2%) | 11 (10.8%) |
| Manufacturing | 96 (100.0%) | 0 (0.0%) |
| Wholesale Trade | 0 (0.0%) | 10 (100.0%) |
| Retail Trade | 167 (77.0%) | 50 (23.0%) |
| Transportation & Warehousing | 60 (100.0%) | 0 (0.0%) |
| Utilities | 0 (0.0%) | 0 (0.0%) |
| Information | 0 (0.0%) | 0 (0.0%) |
| Finance & Insurance | 19 (100.0%) | 0 (0.0%) |
| Real Estate, Rental & Leasing | 18 (100.0%) | 0 (0.0%) |
| Professional & Scientific | 24 (100.0%) | 0 (0.0%) |
| Enterprise Management | 0 (0.0%) | 0 (0.0%) |
| Administrative & Support | 83 (88.3%) | 11 (11.7%) |
| Educational Services | 7 (6.2%) | 105 (93.8%) |
| Health Care & Social Assistance | 92 (21.3%) | 340 (78.7%) |
| Arts, Entertainment & Recreation | 0 (0.0%) | 0 (0.0%) |
| Accommodation & Food Services | 22 (9.1%) | 220 (90.9%) |
| Public Administration | 84 (95.5%) | 4 (4.5%) |
| Total | 803 (51.1%) | 768 (48.9%) |
Education in Anna
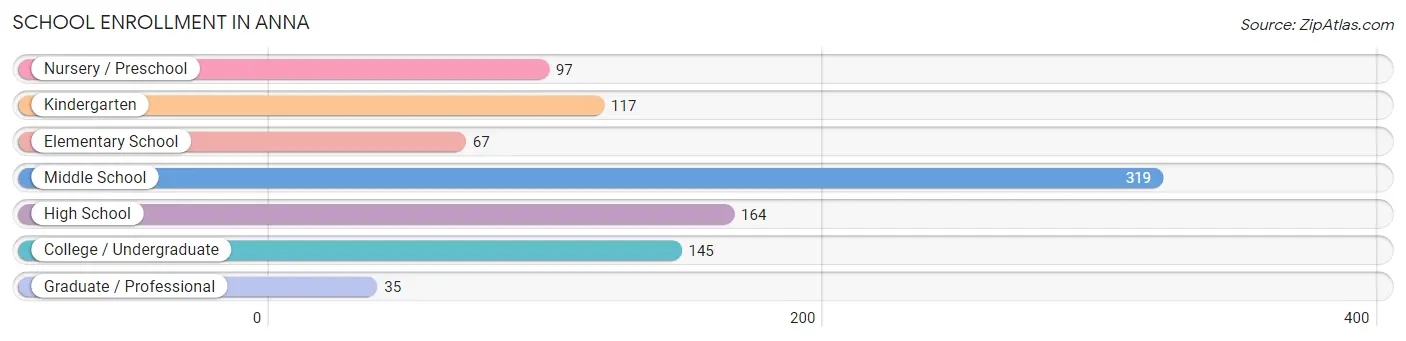
School Enrollment in Anna
The most common levels of schooling among the 944 students in Anna are middle school (319 | 33.8%), high school (164 | 17.4%), and college / undergraduate (145 | 15.4%).
| School Level | # Students | % Students |
| Nursery / Preschool | 97 | 10.3% |
| Kindergarten | 117 | 12.4% |
| Elementary School | 67 | 7.1% |
| Middle School | 319 | 33.8% |
| High School | 164 | 17.4% |
| College / Undergraduate | 145 | 15.4% |
| Graduate / Professional | 35 | 3.7% |
| Total | 944 | 100.0% |
School Enrollment by Age by Funding Source in Anna
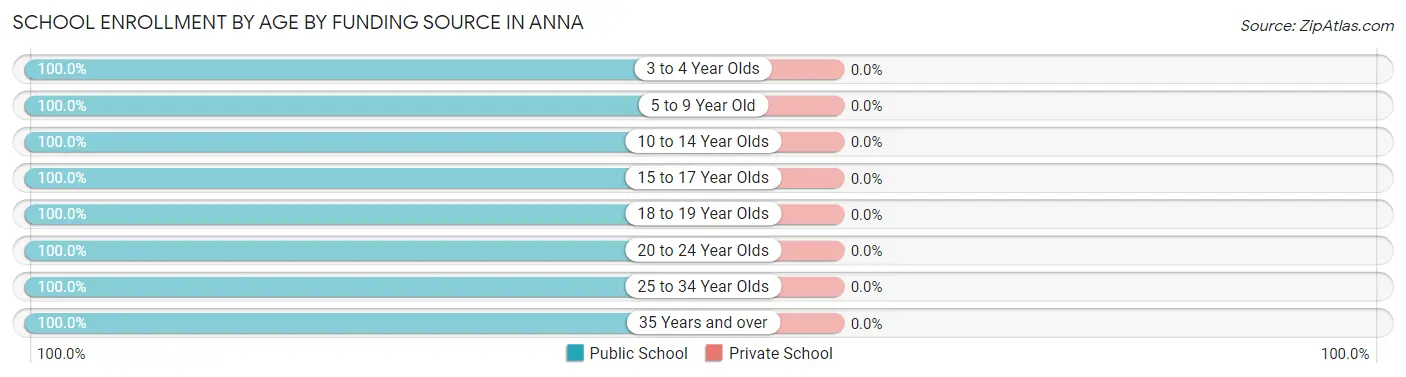
| Age Bracket | Public School | Private School |
| 3 to 4 Year Olds | 97 (100.0%) | 0 (0.0%) |
| 5 to 9 Year Old | 184 (100.0%) | 0 (0.0%) |
| 10 to 14 Year Olds | 361 (100.0%) | 0 (0.0%) |
| 15 to 17 Year Olds | 106 (100.0%) | 0 (0.0%) |
| 18 to 19 Year Olds | 90 (100.0%) | 0 (0.0%) |
| 20 to 24 Year Olds | 62 (100.0%) | 0 (0.0%) |
| 25 to 34 Year Olds | 13 (100.0%) | 0 (0.0%) |
| 35 Years and over | 31 (100.0%) | 0 (0.0%) |
| Total | 944 (100.0%) | 0 (0.0%) |
Educational Attainment by Field of Study in Anna
Arts & humanities (137 | 19.9%), business (110 | 16.0%), bio, nature & agricultural (107 | 15.6%), science & technology (100 | 14.6%), and education (82 | 11.9%) are the most common fields of study among 687 individuals in Anna who have obtained a bachelor's degree or higher.
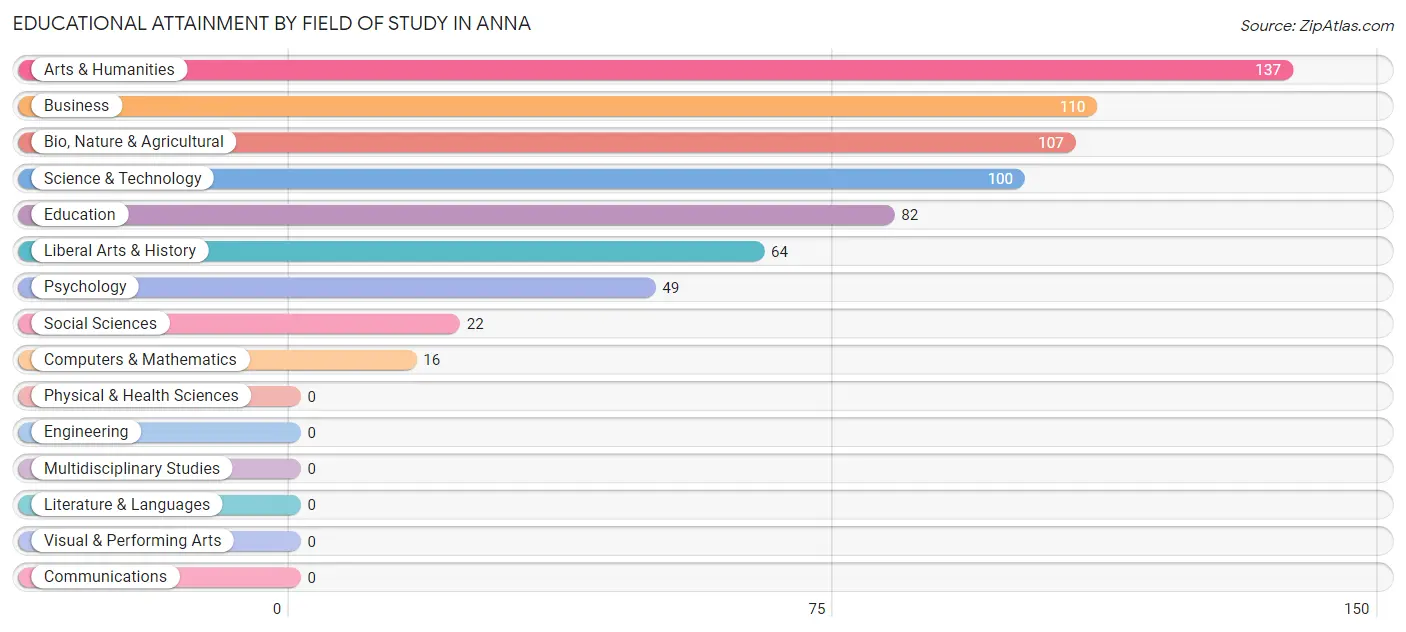
| Field of Study | # Graduates | % Graduates |
| Computers & Mathematics | 16 | 2.3% |
| Bio, Nature & Agricultural | 107 | 15.6% |
| Physical & Health Sciences | 0 | 0.0% |
| Psychology | 49 | 7.1% |
| Social Sciences | 22 | 3.2% |
| Engineering | 0 | 0.0% |
| Multidisciplinary Studies | 0 | 0.0% |
| Science & Technology | 100 | 14.6% |
| Business | 110 | 16.0% |
| Education | 82 | 11.9% |
| Literature & Languages | 0 | 0.0% |
| Liberal Arts & History | 64 | 9.3% |
| Visual & Performing Arts | 0 | 0.0% |
| Communications | 0 | 0.0% |
| Arts & Humanities | 137 | 19.9% |
| Total | 687 | 100.0% |
Transportation & Commute in Anna
Vehicle Availability by Sex in Anna
The most prevalent vehicle ownership categories in Anna are males with 2 vehicles (469, accounting for 58.4%) and females with 2 vehicles (272, making up 61.6%).
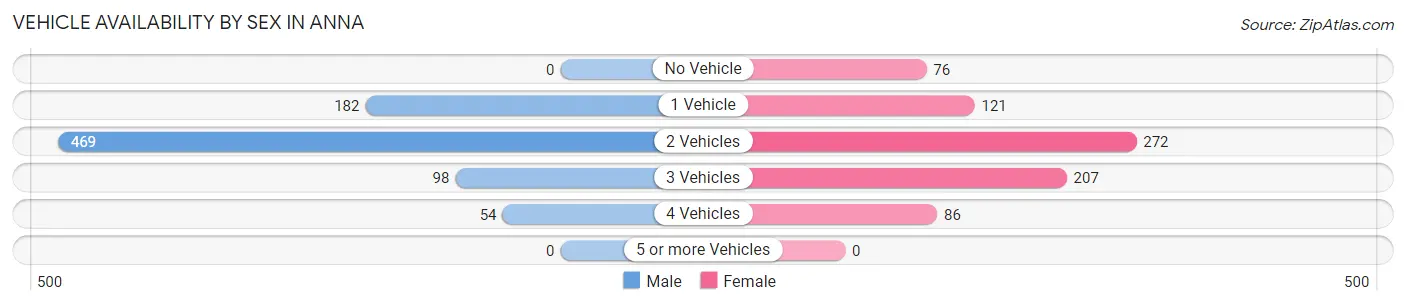
| Vehicles Available | Male | Female |
| No Vehicle | 0 (0.0%) | 76 (10.0%) |
| 1 Vehicle | 182 (22.7%) | 121 (15.9%) |
| 2 Vehicles | 469 (58.4%) | 272 (35.7%) |
| 3 Vehicles | 98 (12.2%) | 207 (27.2%) |
| 4 Vehicles | 54 (6.7%) | 86 (11.3%) |
| 5 or more Vehicles | 0 (0.0%) | 0 (0.0%) |
| Total | 803 (100.0%) | 762 (100.0%) |
Commute Time in Anna
The most frequently occuring commute durations in Anna are 10 to 14 minutes (378 commuters, 25.2%), 5 to 9 minutes (261 commuters, 17.4%), and 30 to 34 minutes (204 commuters, 13.6%).
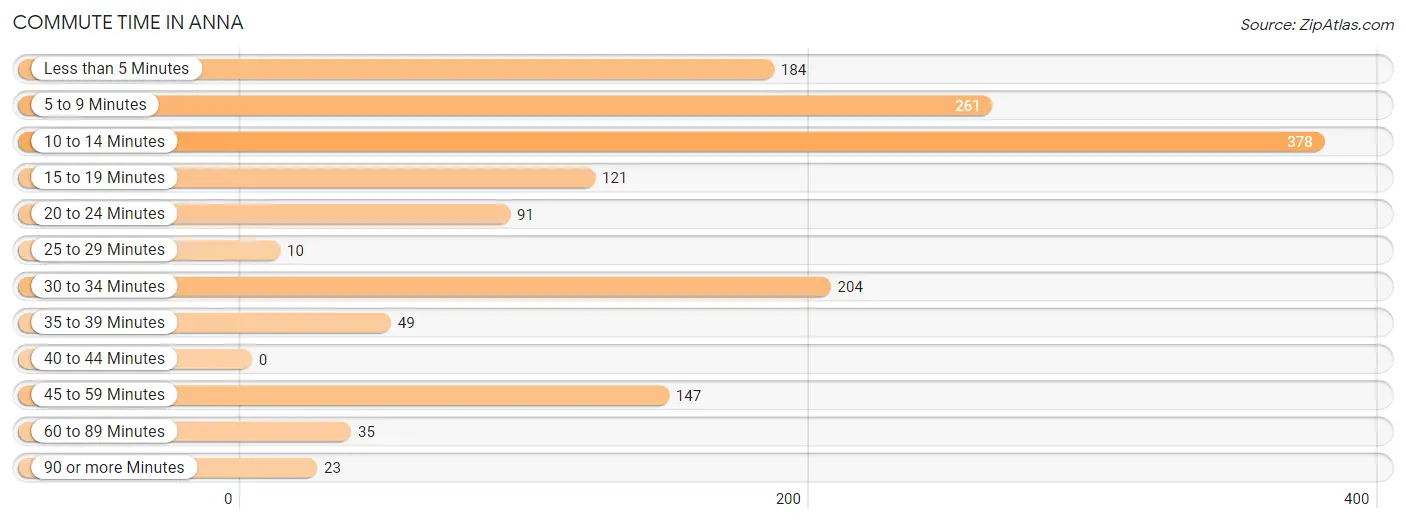
| Commute Time | # Commuters | % Commuters |
| Less than 5 Minutes | 184 | 12.2% |
| 5 to 9 Minutes | 261 | 17.4% |
| 10 to 14 Minutes | 378 | 25.2% |
| 15 to 19 Minutes | 121 | 8.1% |
| 20 to 24 Minutes | 91 | 6.0% |
| 25 to 29 Minutes | 10 | 0.7% |
| 30 to 34 Minutes | 204 | 13.6% |
| 35 to 39 Minutes | 49 | 3.3% |
| 40 to 44 Minutes | 0 | 0.0% |
| 45 to 59 Minutes | 147 | 9.8% |
| 60 to 89 Minutes | 35 | 2.3% |
| 90 or more Minutes | 23 | 1.5% |
Commute Time by Sex in Anna
The most common commute times in Anna are 10 to 14 minutes (171 commuters, 22.5%) for males and 10 to 14 minutes (207 commuters, 27.8%) for females.
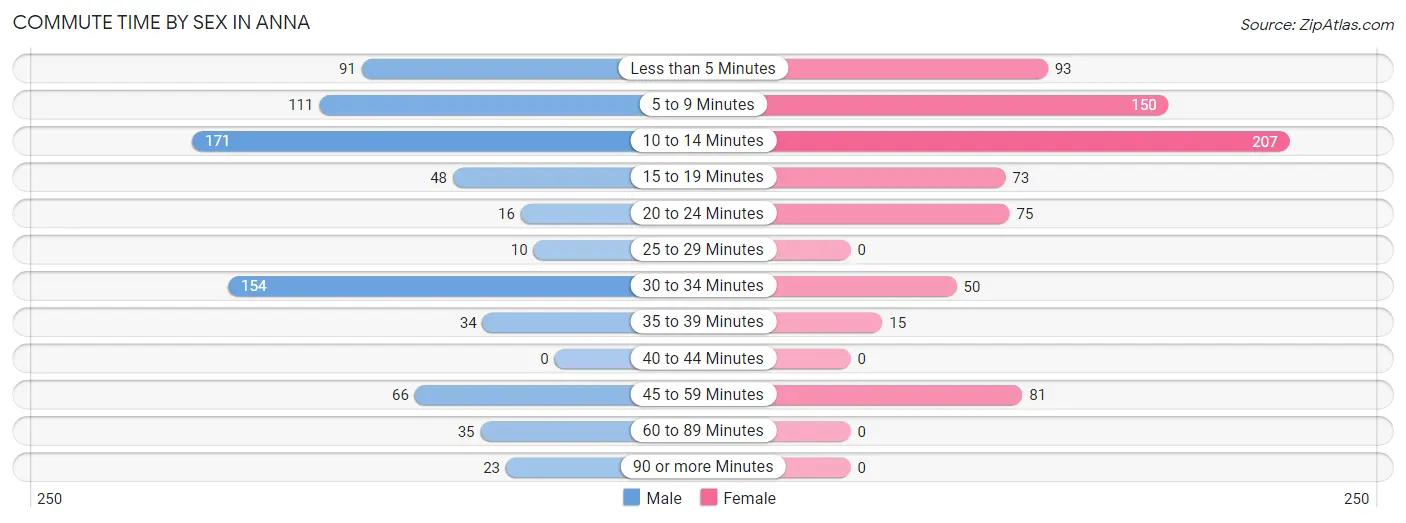
| Commute Time | Male | Female |
| Less than 5 Minutes | 91 (12.0%) | 93 (12.5%) |
| 5 to 9 Minutes | 111 (14.6%) | 150 (20.2%) |
| 10 to 14 Minutes | 171 (22.5%) | 207 (27.8%) |
| 15 to 19 Minutes | 48 (6.3%) | 73 (9.8%) |
| 20 to 24 Minutes | 16 (2.1%) | 75 (10.1%) |
| 25 to 29 Minutes | 10 (1.3%) | 0 (0.0%) |
| 30 to 34 Minutes | 154 (20.3%) | 50 (6.7%) |
| 35 to 39 Minutes | 34 (4.5%) | 15 (2.0%) |
| 40 to 44 Minutes | 0 (0.0%) | 0 (0.0%) |
| 45 to 59 Minutes | 66 (8.7%) | 81 (10.9%) |
| 60 to 89 Minutes | 35 (4.6%) | 0 (0.0%) |
| 90 or more Minutes | 23 (3.0%) | 0 (0.0%) |
Time of Departure to Work by Sex in Anna
The most frequent times of departure to work in Anna are 7:30 AM to 7:59 AM (170, 22.4%) for males and 8:00 AM to 8:29 AM (200, 26.9%) for females.
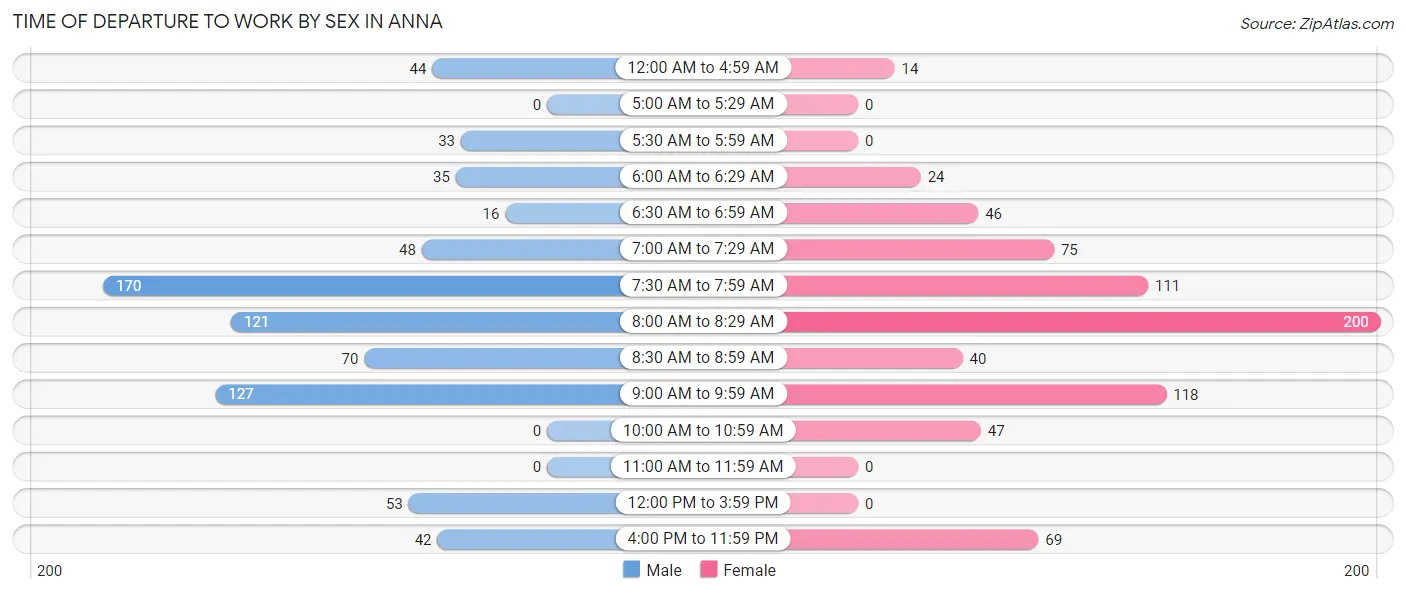
| Time of Departure | Male | Female |
| 12:00 AM to 4:59 AM | 44 (5.8%) | 14 (1.9%) |
| 5:00 AM to 5:29 AM | 0 (0.0%) | 0 (0.0%) |
| 5:30 AM to 5:59 AM | 33 (4.3%) | 0 (0.0%) |
| 6:00 AM to 6:29 AM | 35 (4.6%) | 24 (3.2%) |
| 6:30 AM to 6:59 AM | 16 (2.1%) | 46 (6.2%) |
| 7:00 AM to 7:29 AM | 48 (6.3%) | 75 (10.1%) |
| 7:30 AM to 7:59 AM | 170 (22.4%) | 111 (14.9%) |
| 8:00 AM to 8:29 AM | 121 (15.9%) | 200 (26.9%) |
| 8:30 AM to 8:59 AM | 70 (9.2%) | 40 (5.4%) |
| 9:00 AM to 9:59 AM | 127 (16.7%) | 118 (15.9%) |
| 10:00 AM to 10:59 AM | 0 (0.0%) | 47 (6.3%) |
| 11:00 AM to 11:59 AM | 0 (0.0%) | 0 (0.0%) |
| 12:00 PM to 3:59 PM | 53 (7.0%) | 0 (0.0%) |
| 4:00 PM to 11:59 PM | 42 (5.5%) | 69 (9.3%) |
| Total | 759 (100.0%) | 744 (100.0%) |
Housing Occupancy in Anna
Occupancy by Ownership in Anna
Of the total 1,804 dwellings in Anna, owner-occupied units account for 1,115 (61.8%), while renter-occupied units make up 689 (38.2%).
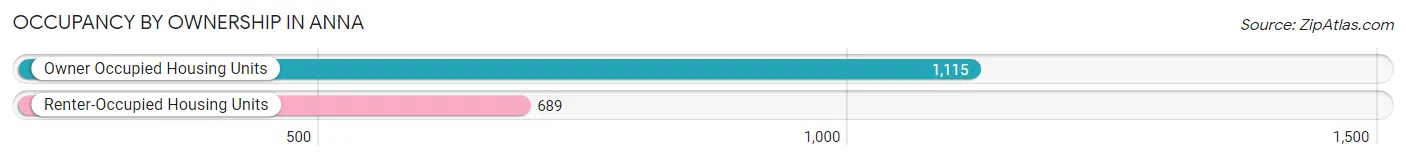
| Occupancy | # Housing Units | % Housing Units |
| Owner Occupied Housing Units | 1,115 | 61.8% |
| Renter-Occupied Housing Units | 689 | 38.2% |
| Total Occupied Housing Units | 1,804 | 100.0% |
Occupancy by Household Size in Anna
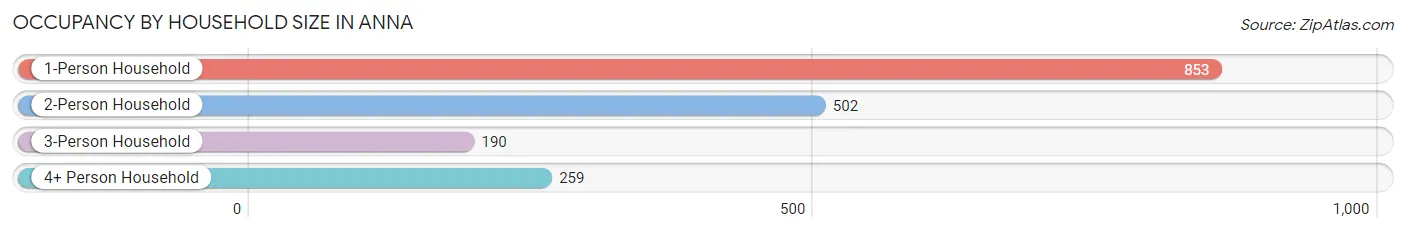
| Household Size | # Housing Units | % Housing Units |
| 1-Person Household | 853 | 47.3% |
| 2-Person Household | 502 | 27.8% |
| 3-Person Household | 190 | 10.5% |
| 4+ Person Household | 259 | 14.4% |
| Total Housing Units | 1,804 | 100.0% |
Occupancy by Ownership by Household Size in Anna
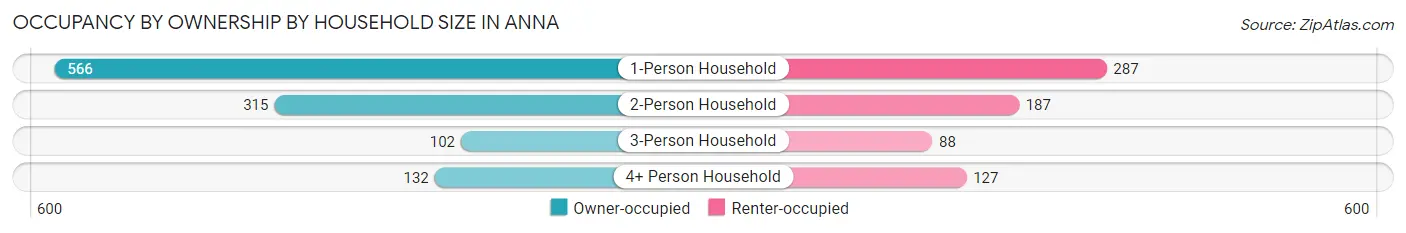
| Household Size | Owner-occupied | Renter-occupied |
| 1-Person Household | 566 (66.3%) | 287 (33.7%) |
| 2-Person Household | 315 (62.7%) | 187 (37.2%) |
| 3-Person Household | 102 (53.7%) | 88 (46.3%) |
| 4+ Person Household | 132 (51.0%) | 127 (49.0%) |
| Total Housing Units | 1,115 (61.8%) | 689 (38.2%) |
Occupancy by Educational Attainment in Anna
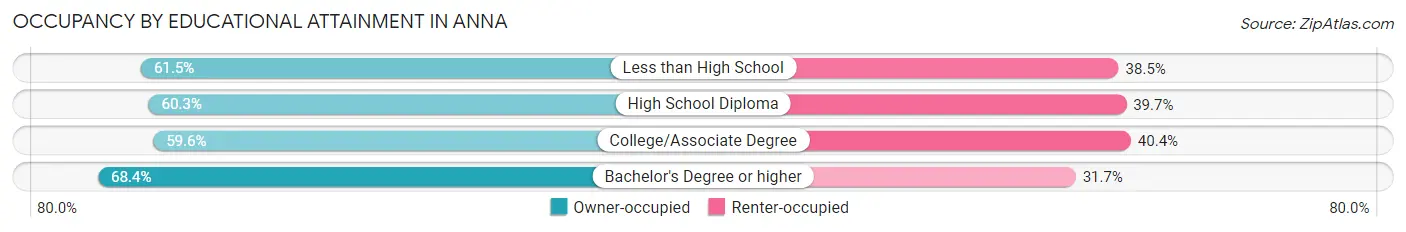
| Household Size | Owner-occupied | Renter-occupied |
| Less than High School | 96 (61.5%) | 60 (38.5%) |
| High School Diploma | 315 (60.3%) | 207 (39.7%) |
| College/Associate Degree | 447 (59.6%) | 303 (40.4%) |
| Bachelor's Degree or higher | 257 (68.3%) | 119 (31.7%) |
Occupancy by Age of Householder in Anna
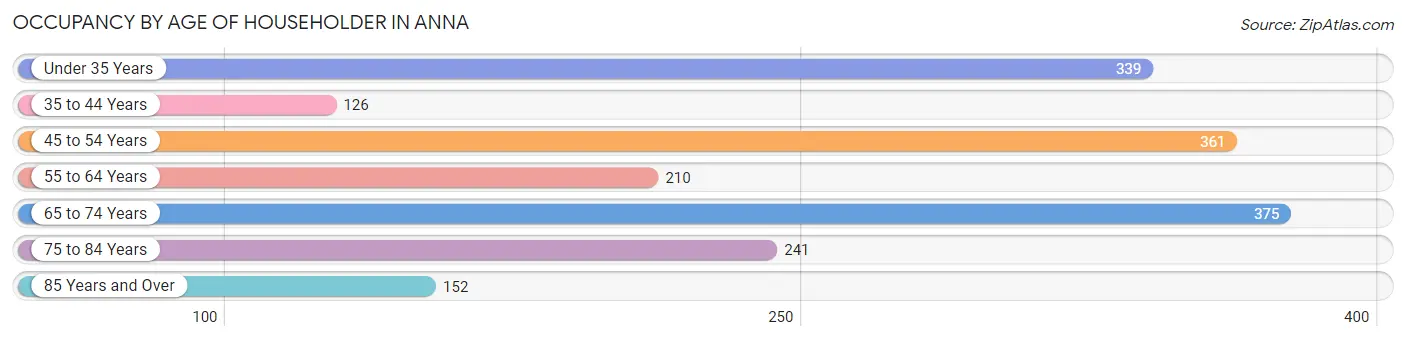
| Age Bracket | # Households | % Households |
| Under 35 Years | 339 | 18.8% |
| 35 to 44 Years | 126 | 7.0% |
| 45 to 54 Years | 361 | 20.0% |
| 55 to 64 Years | 210 | 11.6% |
| 65 to 74 Years | 375 | 20.8% |
| 75 to 84 Years | 241 | 13.4% |
| 85 Years and Over | 152 | 8.4% |
| Total | 1,804 | 100.0% |
Housing Finances in Anna
Median Income by Occupancy in Anna
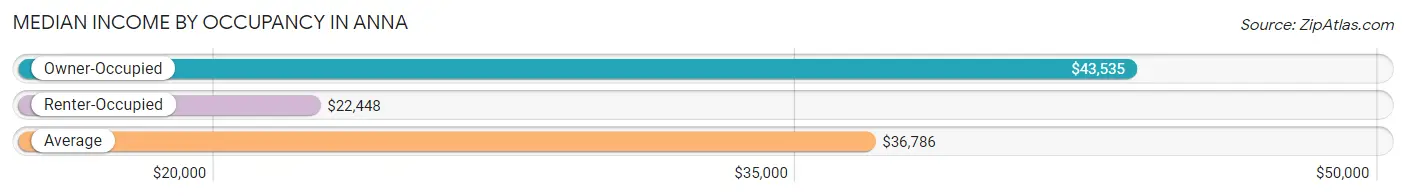
| Occupancy Type | # Households | Median Income |
| Owner-Occupied | 1,115 (61.8%) | $43,535 |
| Renter-Occupied | 689 (38.2%) | $22,448 |
| Average | 1,804 (100.0%) | $36,786 |
Occupancy by Householder Income Bracket in Anna
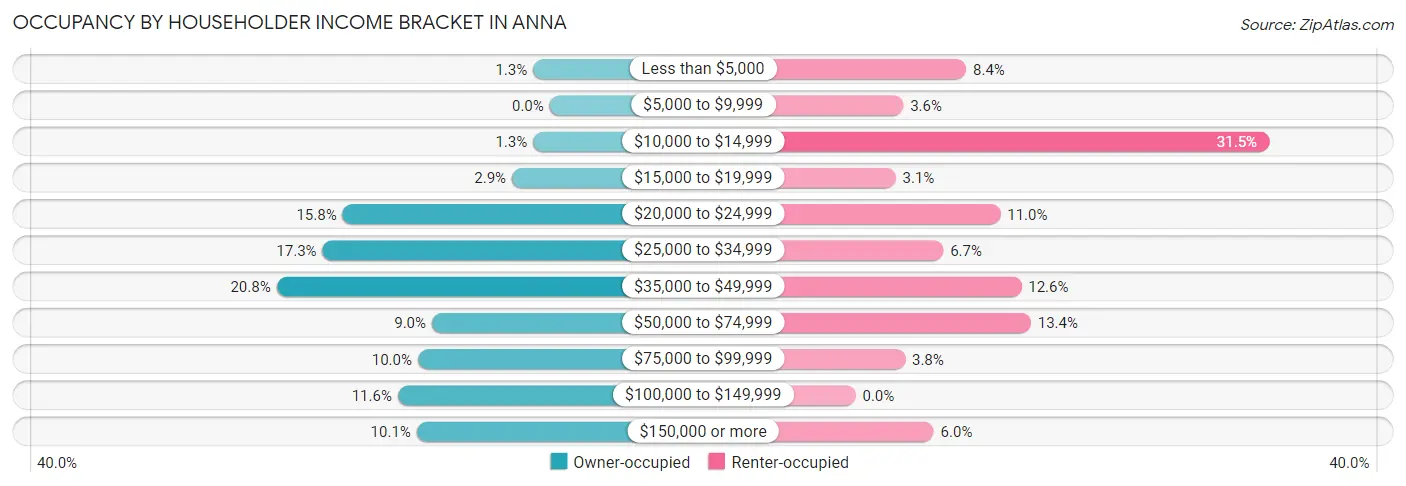
| Income Bracket | Owner-occupied | Renter-occupied |
| Less than $5,000 | 14 (1.3%) | 58 (8.4%) |
| $5,000 to $9,999 | 0 (0.0%) | 25 (3.6%) |
| $10,000 to $14,999 | 14 (1.3%) | 217 (31.5%) |
| $15,000 to $19,999 | 32 (2.9%) | 21 (3.0%) |
| $20,000 to $24,999 | 176 (15.8%) | 76 (11.0%) |
| $25,000 to $34,999 | 193 (17.3%) | 46 (6.7%) |
| $35,000 to $49,999 | 232 (20.8%) | 87 (12.6%) |
| $50,000 to $74,999 | 100 (9.0%) | 92 (13.4%) |
| $75,000 to $99,999 | 112 (10.0%) | 26 (3.8%) |
| $100,000 to $149,999 | 129 (11.6%) | 0 (0.0%) |
| $150,000 or more | 113 (10.1%) | 41 (5.9%) |
| Total | 1,115 (100.0%) | 689 (100.0%) |
Monthly Housing Cost Tiers in Anna
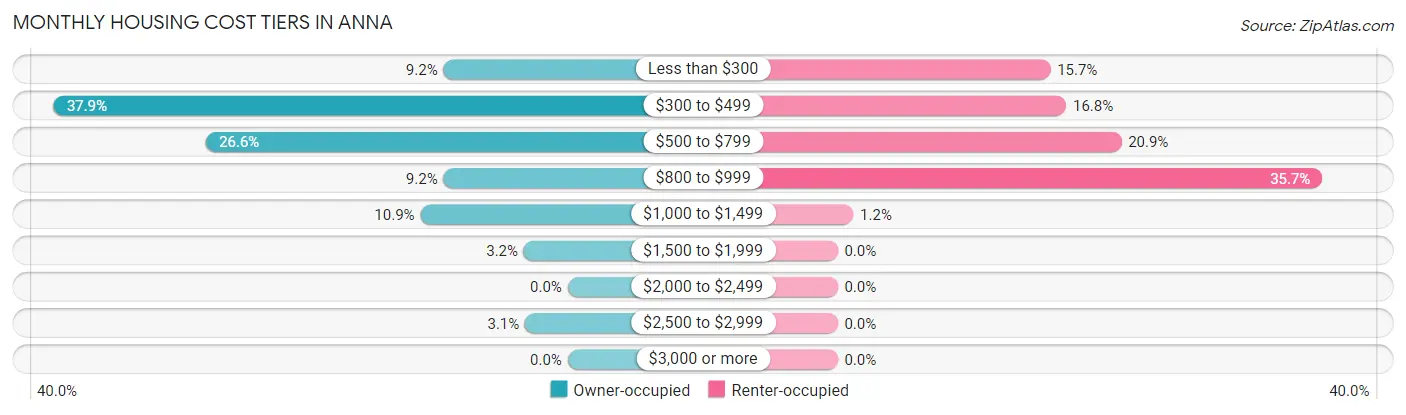
| Monthly Cost | Owner-occupied | Renter-occupied |
| Less than $300 | 102 (9.1%) | 108 (15.7%) |
| $300 to $499 | 422 (37.9%) | 116 (16.8%) |
| $500 to $799 | 297 (26.6%) | 144 (20.9%) |
| $800 to $999 | 102 (9.1%) | 246 (35.7%) |
| $1,000 to $1,499 | 121 (10.8%) | 8 (1.2%) |
| $1,500 to $1,999 | 36 (3.2%) | 0 (0.0%) |
| $2,000 to $2,499 | 0 (0.0%) | 0 (0.0%) |
| $2,500 to $2,999 | 35 (3.1%) | 0 (0.0%) |
| $3,000 or more | 0 (0.0%) | 0 (0.0%) |
| Total | 1,115 (100.0%) | 689 (100.0%) |
Physical Housing Characteristics in Anna
Housing Structures in Anna
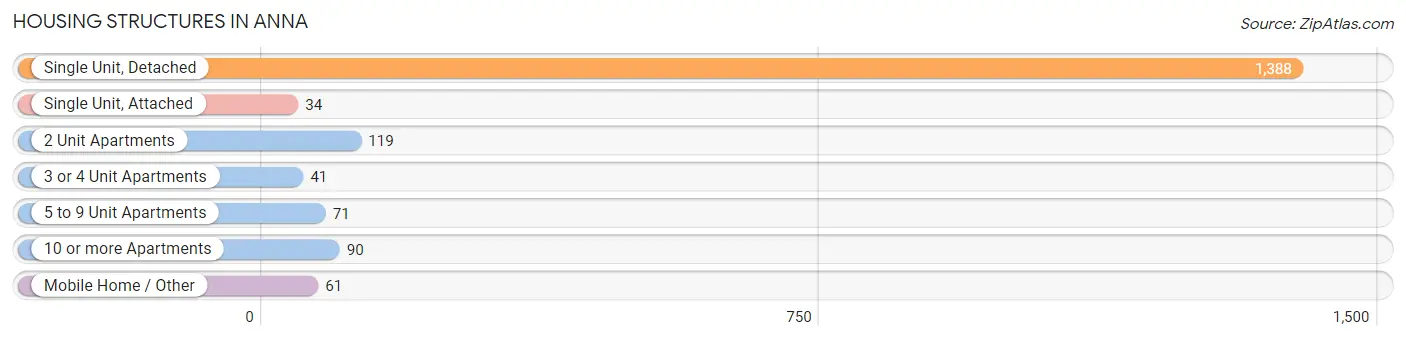
| Structure Type | # Housing Units | % Housing Units |
| Single Unit, Detached | 1,388 | 76.9% |
| Single Unit, Attached | 34 | 1.9% |
| 2 Unit Apartments | 119 | 6.6% |
| 3 or 4 Unit Apartments | 41 | 2.3% |
| 5 to 9 Unit Apartments | 71 | 3.9% |
| 10 or more Apartments | 90 | 5.0% |
| Mobile Home / Other | 61 | 3.4% |
| Total | 1,804 | 100.0% |
Housing Structures by Occupancy in Anna
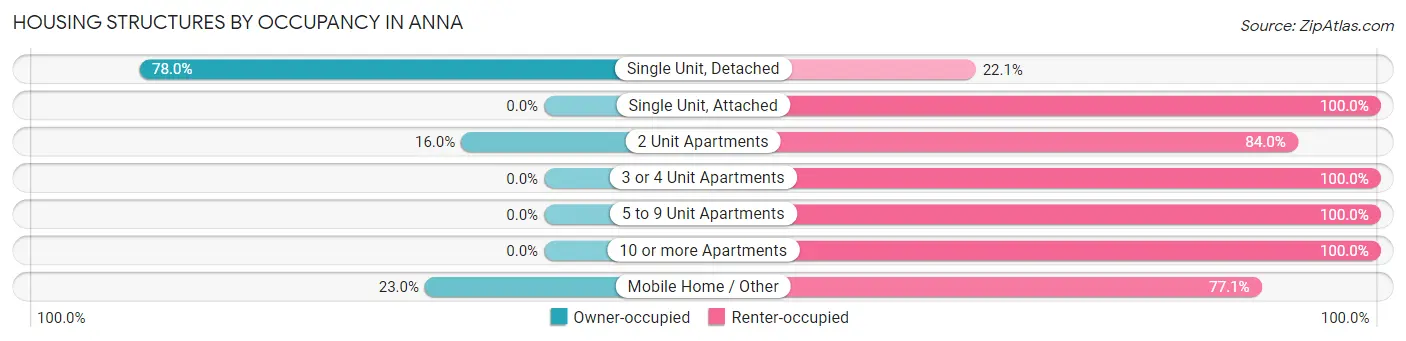
| Structure Type | Owner-occupied | Renter-occupied |
| Single Unit, Detached | 1,082 (77.9%) | 306 (22.1%) |
| Single Unit, Attached | 0 (0.0%) | 34 (100.0%) |
| 2 Unit Apartments | 19 (16.0%) | 100 (84.0%) |
| 3 or 4 Unit Apartments | 0 (0.0%) | 41 (100.0%) |
| 5 to 9 Unit Apartments | 0 (0.0%) | 71 (100.0%) |
| 10 or more Apartments | 0 (0.0%) | 90 (100.0%) |
| Mobile Home / Other | 14 (23.0%) | 47 (77.0%) |
| Total | 1,115 (61.8%) | 689 (38.2%) |
Housing Structures by Number of Rooms in Anna
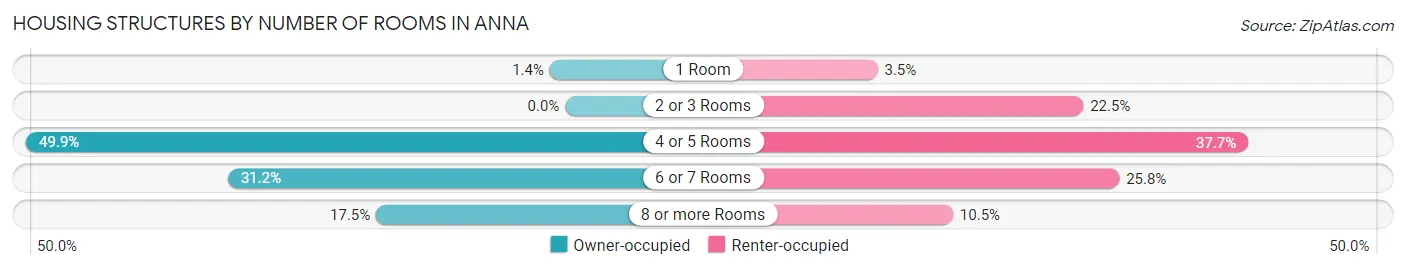
| Number of Rooms | Owner-occupied | Renter-occupied |
| 1 Room | 16 (1.4%) | 24 (3.5%) |
| 2 or 3 Rooms | 0 (0.0%) | 155 (22.5%) |
| 4 or 5 Rooms | 556 (49.9%) | 260 (37.7%) |
| 6 or 7 Rooms | 348 (31.2%) | 178 (25.8%) |
| 8 or more Rooms | 195 (17.5%) | 72 (10.4%) |
| Total | 1,115 (100.0%) | 689 (100.0%) |
Housing Structure by Heating Type in Anna
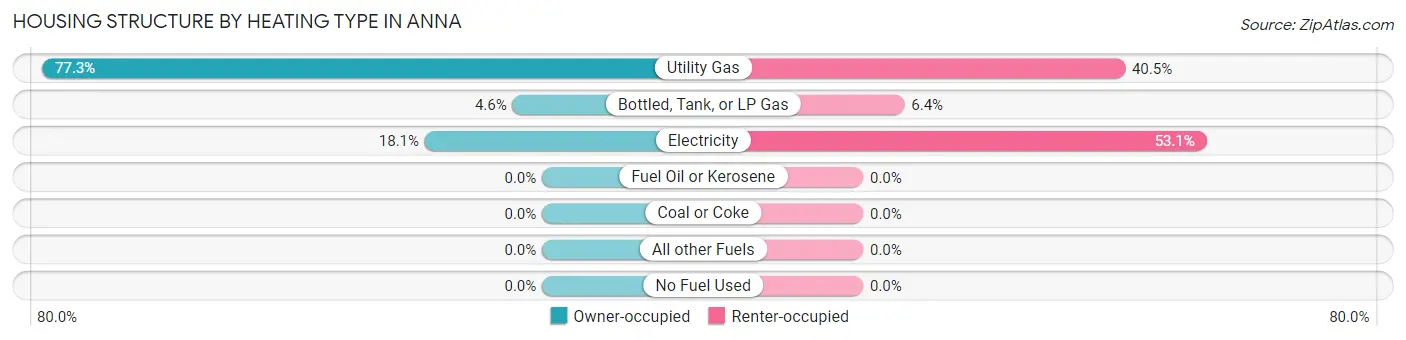
| Heating Type | Owner-occupied | Renter-occupied |
| Utility Gas | 862 (77.3%) | 279 (40.5%) |
| Bottled, Tank, or LP Gas | 51 (4.6%) | 44 (6.4%) |
| Electricity | 202 (18.1%) | 366 (53.1%) |
| Fuel Oil or Kerosene | 0 (0.0%) | 0 (0.0%) |
| Coal or Coke | 0 (0.0%) | 0 (0.0%) |
| All other Fuels | 0 (0.0%) | 0 (0.0%) |
| No Fuel Used | 0 (0.0%) | 0 (0.0%) |
| Total | 1,115 (100.0%) | 689 (100.0%) |
Household Vehicle Usage in Anna
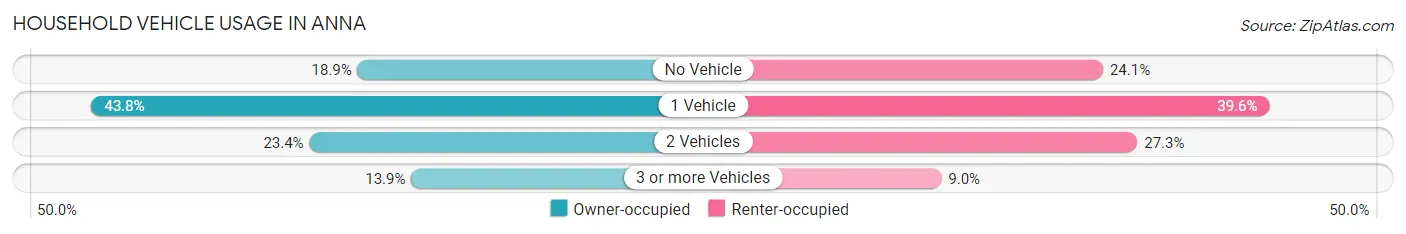
| Vehicles per Household | Owner-occupied | Renter-occupied |
| No Vehicle | 211 (18.9%) | 166 (24.1%) |
| 1 Vehicle | 488 (43.8%) | 273 (39.6%) |
| 2 Vehicles | 261 (23.4%) | 188 (27.3%) |
| 3 or more Vehicles | 155 (13.9%) | 62 (9.0%) |
| Total | 1,115 (100.0%) | 689 (100.0%) |
Real Estate & Mortgages in Anna
Real Estate and Mortgage Overview in Anna
| Characteristic | Without Mortgage | With Mortgage |
| Housing Units | 715 | 400 |
| Median Property Value | $128,000 | $111,400 |
| Median Household Income | $43,836 | $59 |
| Monthly Housing Costs | $430 | $0 |
| Real Estate Taxes | $1,629 | $116 |
Property Value by Mortgage Status in Anna
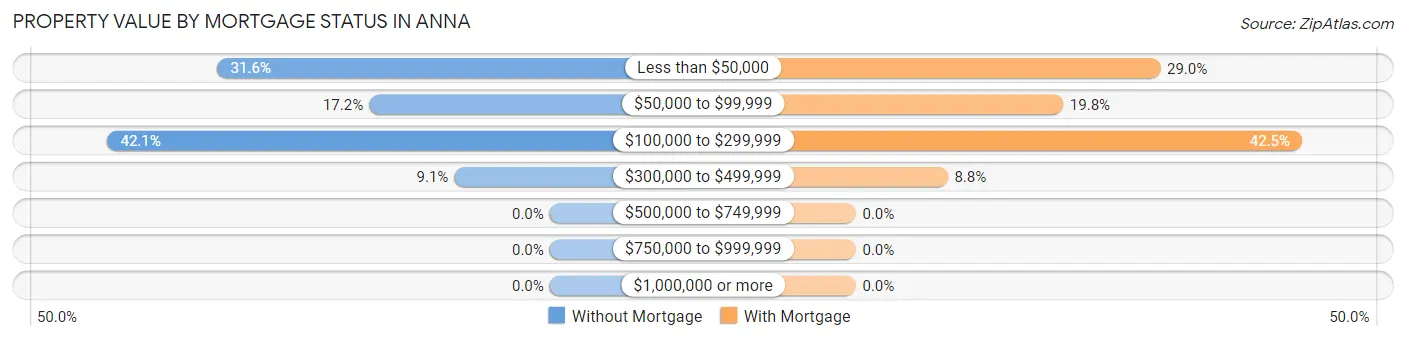
| Property Value | Without Mortgage | With Mortgage |
| Less than $50,000 | 226 (31.6%) | 116 (29.0%) |
| $50,000 to $99,999 | 123 (17.2%) | 79 (19.8%) |
| $100,000 to $299,999 | 301 (42.1%) | 170 (42.5%) |
| $300,000 to $499,999 | 65 (9.1%) | 35 (8.7%) |
| $500,000 to $749,999 | 0 (0.0%) | 0 (0.0%) |
| $750,000 to $999,999 | 0 (0.0%) | 0 (0.0%) |
| $1,000,000 or more | 0 (0.0%) | 0 (0.0%) |
| Total | 715 (100.0%) | 400 (100.0%) |
Household Income by Mortgage Status in Anna
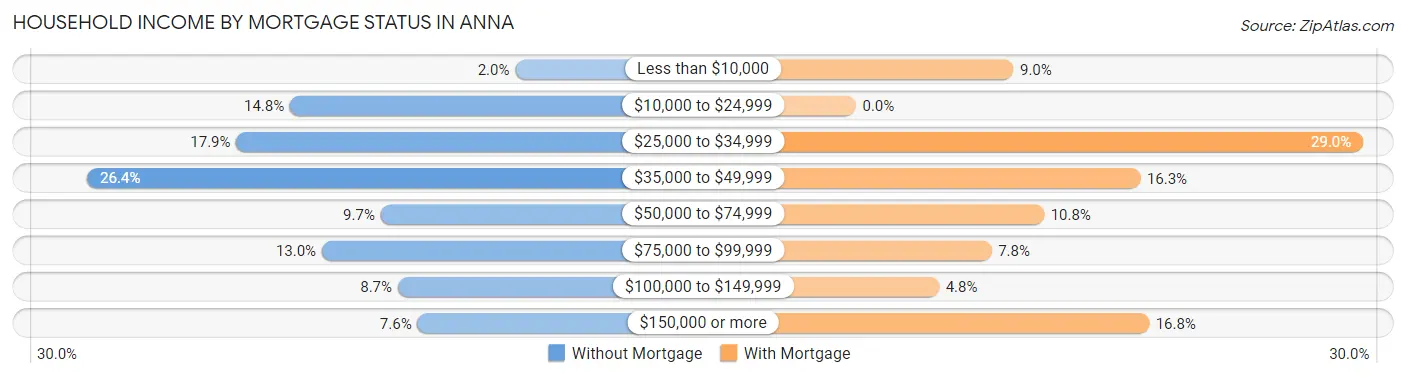
| Household Income | Without Mortgage | With Mortgage |
| Less than $10,000 | 14 (2.0%) | 36 (9.0%) |
| $10,000 to $24,999 | 106 (14.8%) | 0 (0.0%) |
| $25,000 to $34,999 | 128 (17.9%) | 116 (29.0%) |
| $35,000 to $49,999 | 189 (26.4%) | 65 (16.3%) |
| $50,000 to $74,999 | 69 (9.7%) | 43 (10.7%) |
| $75,000 to $99,999 | 93 (13.0%) | 31 (7.7%) |
| $100,000 to $149,999 | 62 (8.7%) | 19 (4.8%) |
| $150,000 or more | 54 (7.5%) | 67 (16.8%) |
| Total | 715 (100.0%) | 400 (100.0%) |
Property Value to Household Income Ratio in Anna
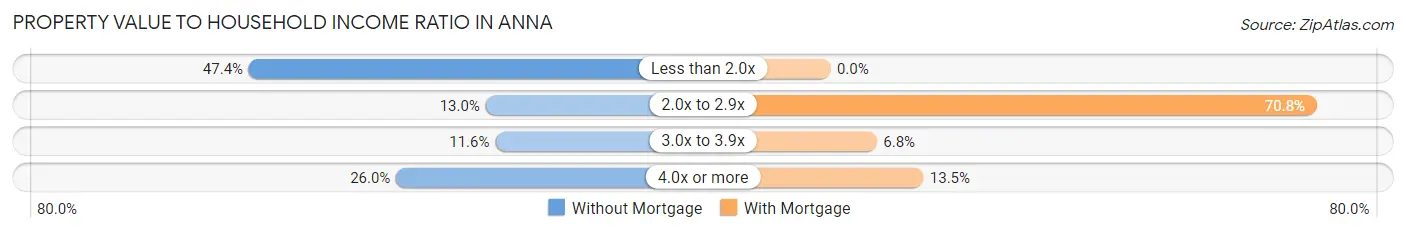
| Value-to-Income Ratio | Without Mortgage | With Mortgage |
| Less than 2.0x | 339 (47.4%) | 0 (0.0%) |
| 2.0x to 2.9x | 93 (13.0%) | 283 (70.8%) |
| 3.0x to 3.9x | 83 (11.6%) | 27 (6.8%) |
| 4.0x or more | 186 (26.0%) | 54 (13.5%) |
| Total | 715 (100.0%) | 400 (100.0%) |
Real Estate Taxes by Mortgage Status in Anna
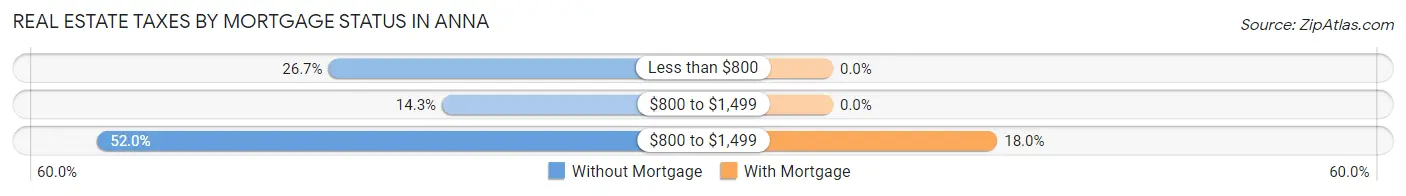
| Property Taxes | Without Mortgage | With Mortgage |
| Less than $800 | 191 (26.7%) | 0 (0.0%) |
| $800 to $1,499 | 102 (14.3%) | 0 (0.0%) |
| $800 to $1,499 | 372 (52.0%) | 72 (18.0%) |
| Total | 715 (100.0%) | 400 (100.0%) |
Health & Disability in Anna
Health Insurance Coverage by Age in Anna
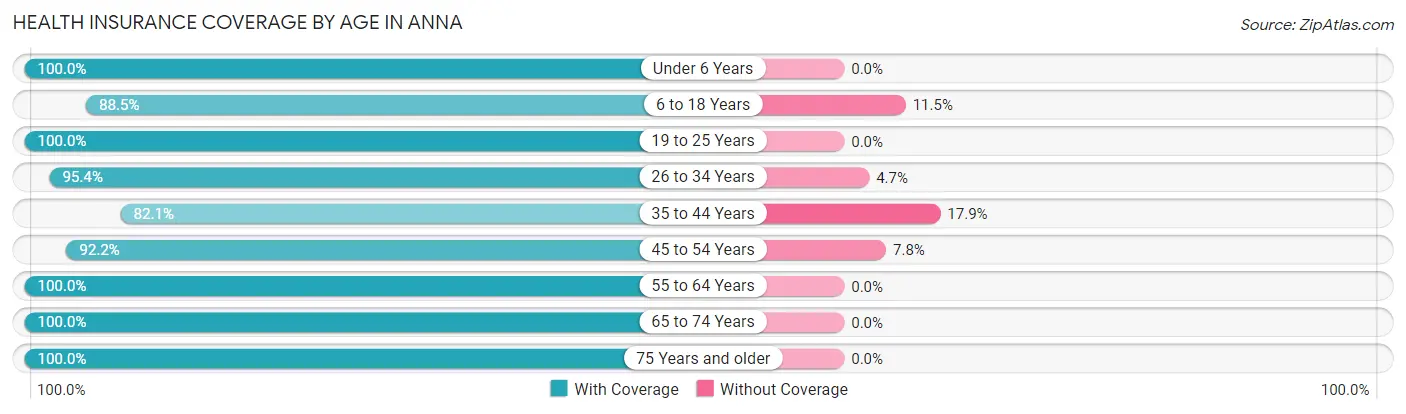
| Age Bracket | With Coverage | Without Coverage |
| Under 6 Years | 402 (100.0%) | 0 (0.0%) |
| 6 to 18 Years | 510 (88.5%) | 66 (11.5%) |
| 19 to 25 Years | 345 (100.0%) | 0 (0.0%) |
| 26 to 34 Years | 390 (95.4%) | 19 (4.6%) |
| 35 to 44 Years | 371 (82.1%) | 81 (17.9%) |
| 45 to 54 Years | 473 (92.2%) | 40 (7.8%) |
| 55 to 64 Years | 463 (100.0%) | 0 (0.0%) |
| 65 to 74 Years | 499 (100.0%) | 0 (0.0%) |
| 75 Years and older | 433 (100.0%) | 0 (0.0%) |
| Total | 3,886 (95.0%) | 206 (5.0%) |
Health Insurance Coverage by Citizenship Status in Anna
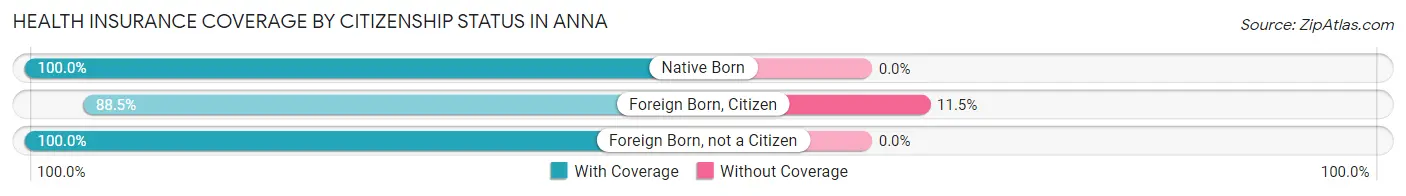
| Citizenship Status | With Coverage | Without Coverage |
| Native Born | 402 (100.0%) | 0 (0.0%) |
| Foreign Born, Citizen | 510 (88.5%) | 66 (11.5%) |
| Foreign Born, not a Citizen | 345 (100.0%) | 0 (0.0%) |
Health Insurance Coverage by Household Income in Anna
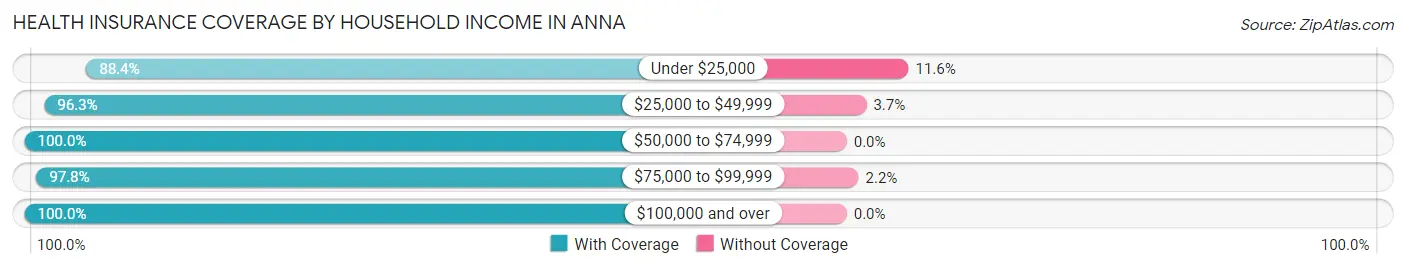
| Household Income | With Coverage | Without Coverage |
| Under $25,000 | 1,093 (88.4%) | 143 (11.6%) |
| $25,000 to $49,999 | 1,044 (96.3%) | 40 (3.7%) |
| $50,000 to $74,999 | 274 (100.0%) | 0 (0.0%) |
| $75,000 to $99,999 | 442 (97.8%) | 10 (2.2%) |
| $100,000 and over | 928 (100.0%) | 0 (0.0%) |
Public vs Private Health Insurance Coverage by Age in Anna
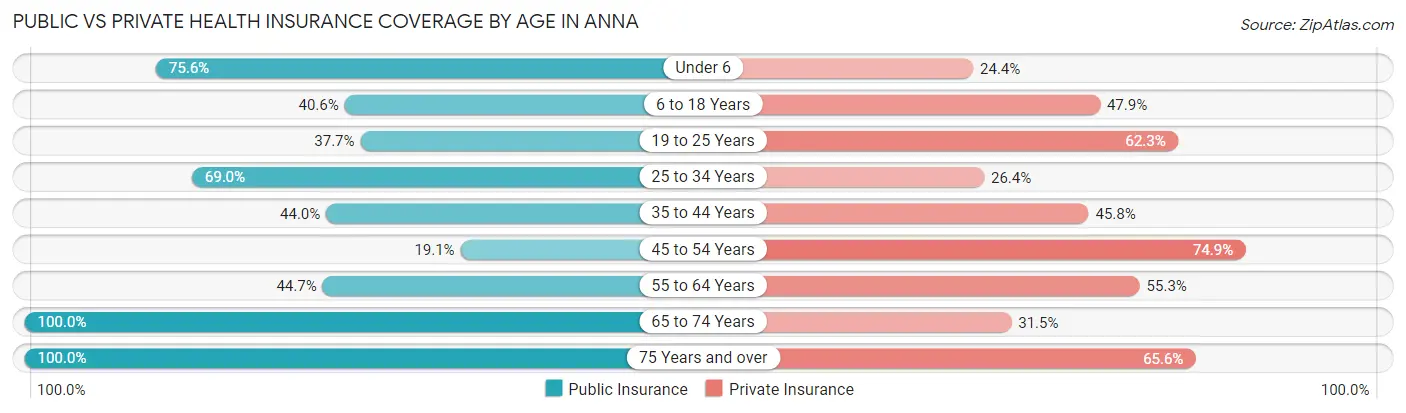
| Age Bracket | Public Insurance | Private Insurance |
| Under 6 | 304 (75.6%) | 98 (24.4%) |
| 6 to 18 Years | 234 (40.6%) | 276 (47.9%) |
| 19 to 25 Years | 130 (37.7%) | 215 (62.3%) |
| 25 to 34 Years | 282 (69.0%) | 108 (26.4%) |
| 35 to 44 Years | 199 (44.0%) | 207 (45.8%) |
| 45 to 54 Years | 98 (19.1%) | 384 (74.9%) |
| 55 to 64 Years | 207 (44.7%) | 256 (55.3%) |
| 65 to 74 Years | 499 (100.0%) | 157 (31.5%) |
| 75 Years and over | 433 (100.0%) | 284 (65.6%) |
| Total | 2,386 (58.3%) | 1,985 (48.5%) |
Disability Status by Sex by Age in Anna
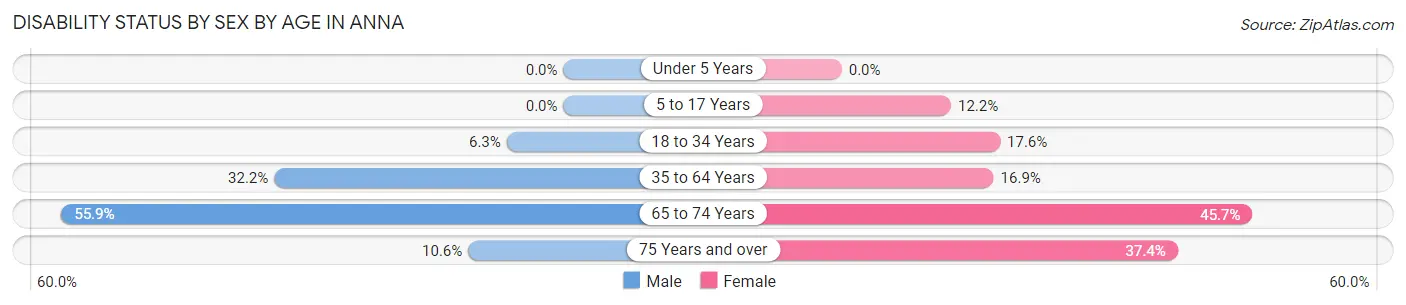
| Age Bracket | Male | Female |
| Under 5 Years | 0 (0.0%) | 0 (0.0%) |
| 5 to 17 Years | 0 (0.0%) | 37 (12.2%) |
| 18 to 34 Years | 23 (6.3%) | 73 (17.6%) |
| 35 to 64 Years | 258 (32.2%) | 106 (16.9%) |
| 65 to 74 Years | 142 (55.9%) | 112 (45.7%) |
| 75 Years and over | 19 (10.6%) | 95 (37.4%) |
Disability Class by Sex by Age in Anna
Disability Class: Hearing Difficulty
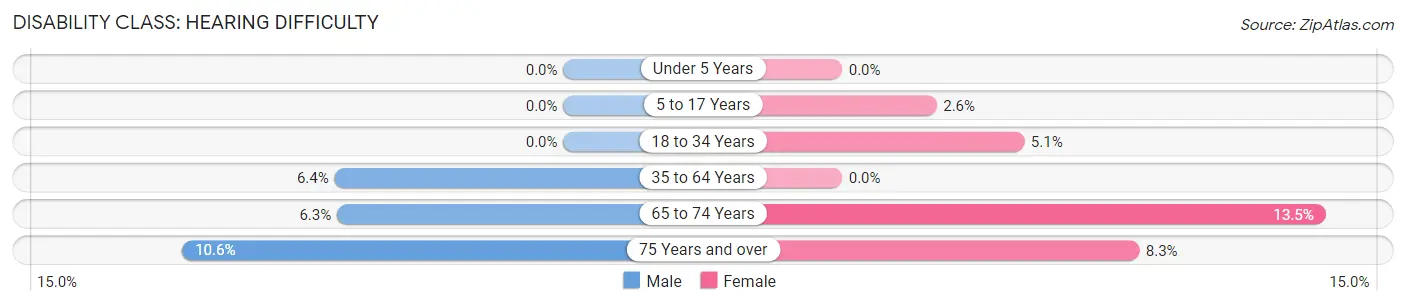
| Age Bracket | Male | Female |
| Under 5 Years | 0 (0.0%) | 0 (0.0%) |
| 5 to 17 Years | 0 (0.0%) | 8 (2.6%) |
| 18 to 34 Years | 0 (0.0%) | 21 (5.1%) |
| 35 to 64 Years | 51 (6.4%) | 0 (0.0%) |
| 65 to 74 Years | 16 (6.3%) | 33 (13.5%) |
| 75 Years and over | 19 (10.6%) | 21 (8.3%) |
Disability Class: Vision Difficulty
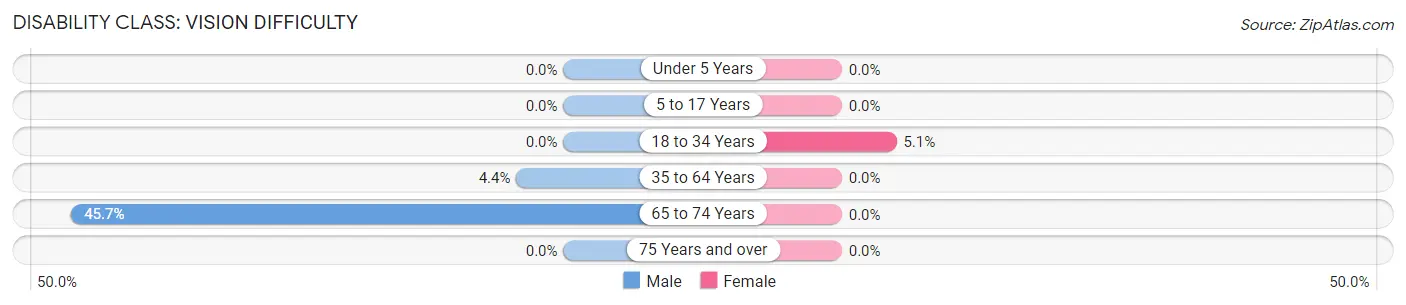
| Age Bracket | Male | Female |
| Under 5 Years | 0 (0.0%) | 0 (0.0%) |
| 5 to 17 Years | 0 (0.0%) | 0 (0.0%) |
| 18 to 34 Years | 0 (0.0%) | 21 (5.1%) |
| 35 to 64 Years | 35 (4.4%) | 0 (0.0%) |
| 65 to 74 Years | 116 (45.7%) | 0 (0.0%) |
| 75 Years and over | 0 (0.0%) | 0 (0.0%) |
Disability Class: Cognitive Difficulty
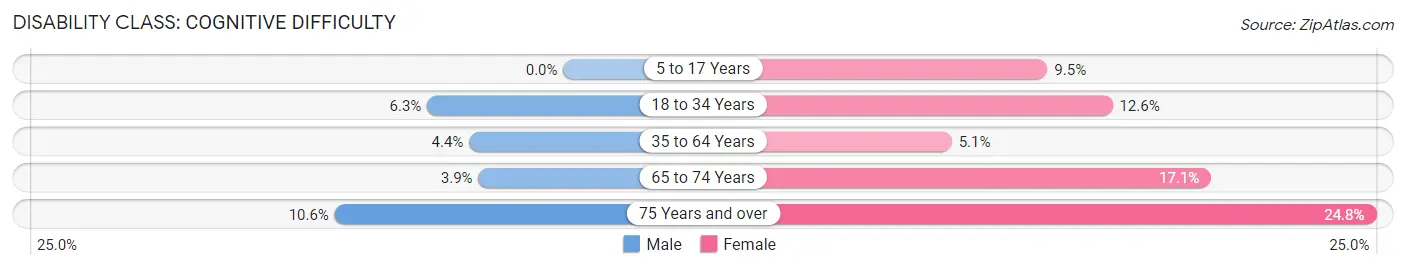
| Age Bracket | Male | Female |
| 5 to 17 Years | 0 (0.0%) | 29 (9.5%) |
| 18 to 34 Years | 23 (6.3%) | 52 (12.6%) |
| 35 to 64 Years | 35 (4.4%) | 32 (5.1%) |
| 65 to 74 Years | 10 (3.9%) | 42 (17.1%) |
| 75 Years and over | 19 (10.6%) | 63 (24.8%) |
Disability Class: Ambulatory Difficulty
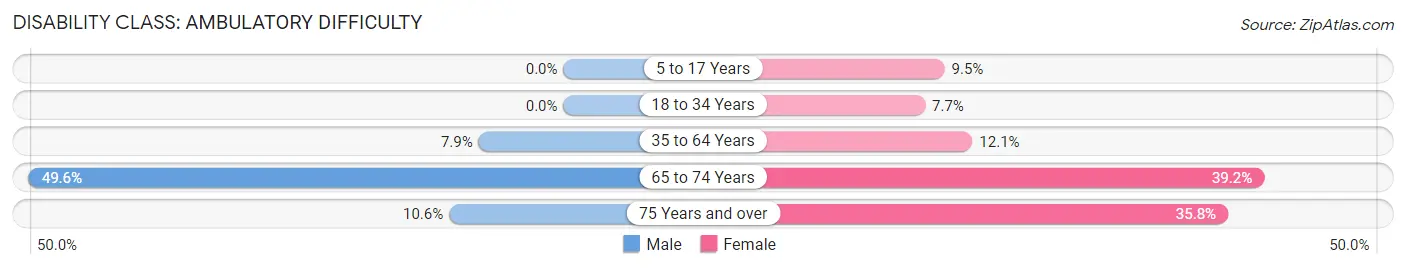
| Age Bracket | Male | Female |
| 5 to 17 Years | 0 (0.0%) | 29 (9.5%) |
| 18 to 34 Years | 0 (0.0%) | 32 (7.7%) |
| 35 to 64 Years | 63 (7.9%) | 76 (12.1%) |
| 65 to 74 Years | 126 (49.6%) | 96 (39.2%) |
| 75 Years and over | 19 (10.6%) | 91 (35.8%) |
Disability Class: Self-Care Difficulty
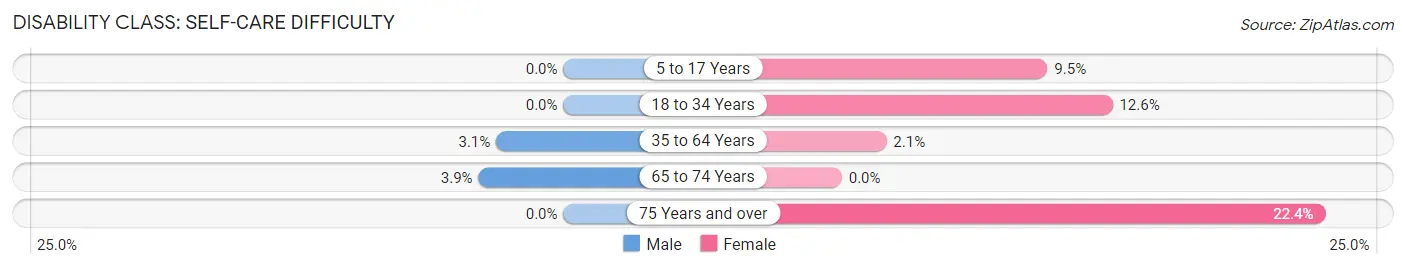
| Age Bracket | Male | Female |
| 5 to 17 Years | 0 (0.0%) | 29 (9.5%) |
| 18 to 34 Years | 0 (0.0%) | 52 (12.6%) |
| 35 to 64 Years | 25 (3.1%) | 13 (2.1%) |
| 65 to 74 Years | 10 (3.9%) | 0 (0.0%) |
| 75 Years and over | 0 (0.0%) | 57 (22.4%) |
Technology Access in Anna
Computing Device Access in Anna
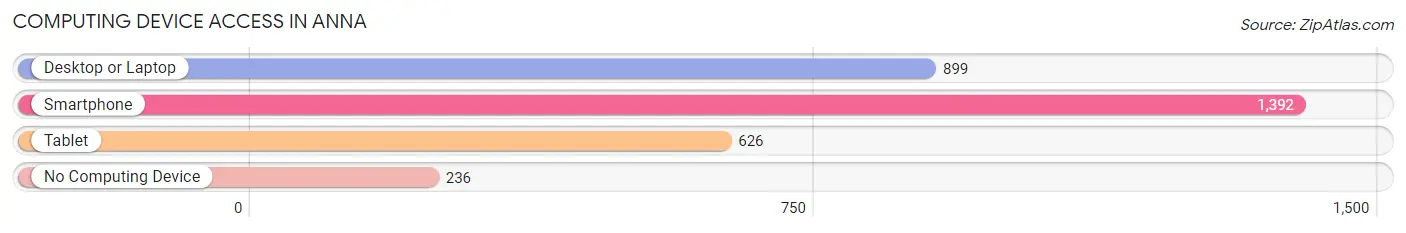
| Device Type | # Households | % Households |
| Desktop or Laptop | 899 | 49.8% |
| Smartphone | 1,392 | 77.2% |
| Tablet | 626 | 34.7% |
| No Computing Device | 236 | 13.1% |
| Total | 1,804 | 100.0% |
Internet Access in Anna
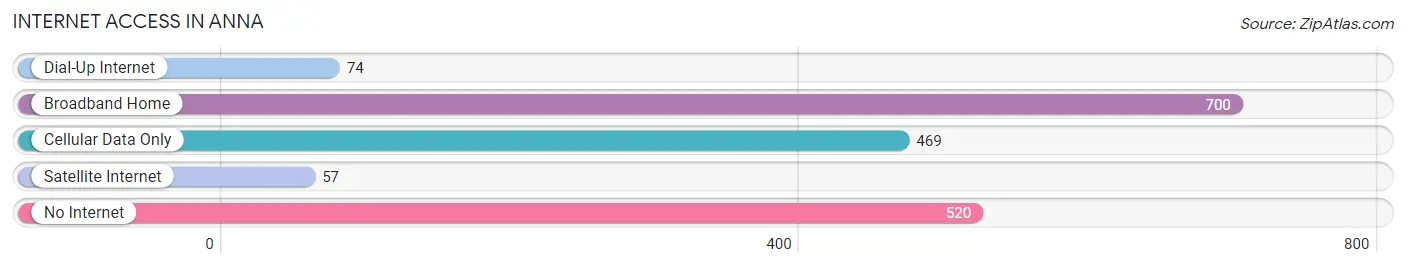
| Internet Type | # Households | % Households |
| Dial-Up Internet | 74 | 4.1% |
| Broadband Home | 700 | 38.8% |
| Cellular Data Only | 469 | 26.0% |
| Satellite Internet | 57 | 3.2% |
| No Internet | 520 | 28.8% |
| Total | 1,804 | 100.0% |
Anna Summary
Anna, Illinois is a small city located in Union County, Illinois. It is situated in the southern part of the state, about 40 miles southeast of St. Louis, Missouri. The city has a population of 4,541 as of the 2010 census, making it the largest city in Union County.
History
Anna was founded in 1854 by a group of settlers from Kentucky and Tennessee. The city was named after Anna, the daughter of one of the settlers. The city was incorporated in 1859 and was the first city in Union County to be incorporated.
The city was an important stop on the Cairo and St. Louis Railroad, which was built in 1854. The railroad was a major factor in the growth of the city, as it allowed for the transportation of goods and people to and from the city.
Geography
Anna is located in the southern part of Union County, Illinois. It is situated at the intersection of Interstate 57 and US Route 51. The city is located about 40 miles southeast of St. Louis, Missouri.
The city has a total area of 4.2 square miles, all of which is land. The city is located in the Shawnee Hills region of Illinois, which is characterized by rolling hills and forests.
Economy
The economy of Anna is largely based on agriculture and manufacturing. The city is home to several large agricultural operations, including a large hog farm and a large dairy farm. The city is also home to several manufacturing companies, including a plastics manufacturer and a metal fabrication company.
The city is also home to several retail stores, including a Walmart Supercenter and a Dollar General. The city also has several restaurants, including a McDonald's and a Subway.
Demographics
As of the 2010 census, the population of Anna was 4,541. The racial makeup of the city was 97.2% White, 0.7% African American, 0.2% Native American, 0.3% Asian, 0.1% Pacific Islander, 0.7% from other races, and 0.9% from two or more races. Hispanic or Latino of any race were 1.7% of the population.
The median household income in Anna was $37,917, and the median family income was $45,938. The per capita income for the city was $17,945. About 11.2% of families and 14.2% of the population were below the poverty line, including 19.2% of those under age 18 and 8.2% of those age 65 or over.
Common Questions
What is Per Capita Income in Anna?
Per Capita income in Anna is $24,592.
What is the Median Family Income in Anna?
Median Family Income in Anna is $61,806.
What is the Median Household income in Anna?
Median Household Income in Anna is $36,786.
What is Income or Wage Gap in Anna?
Income or Wage Gap in Anna is 67.4%.
Women in Anna earn 32.6 cents for every dollar earned by a man.
What is Inequality or Gini Index in Anna?
Inequality or Gini Index in Anna is 0.47.
What is the Total Population of Anna?
Total Population of Anna is 4,259.
What is the Total Male Population of Anna?
Total Male Population of Anna is 2,227.
What is the Total Female Population of Anna?
Total Female Population of Anna is 2,032.
What is the Ratio of Males per 100 Females in Anna?
There are 109.60 Males per 100 Females in Anna.
What is the Ratio of Females per 100 Males in Anna?
There are 91.24 Females per 100 Males in Anna.
What is the Median Population Age in Anna?
Median Population Age in Anna is 42.3 Years.
What is the Average Family Size in Anna
Average Family Size in Anna is 3.2 People.
What is the Average Household Size in Anna
Average Household Size in Anna is 2.2 People.
How Large is the Labor Force in Anna?
There are 1,713 People in the Labor Forcein in Anna.
What is the Percentage of People in the Labor Force in Anna?
50.7% of People are in the Labor Force in Anna.
What is the Unemployment Rate in Anna?
Unemployment Rate in Anna is 8.3%.