Cities with the Highest Percentage of Immigrants from Ghana in Illinois
RELATED REPORTS & OPTIONS
Ghana
Illinois
Compare Cities
Map of Cities with the Highest Percentage of Immigrants from Ghana in Illinois
0.00%
4.00%
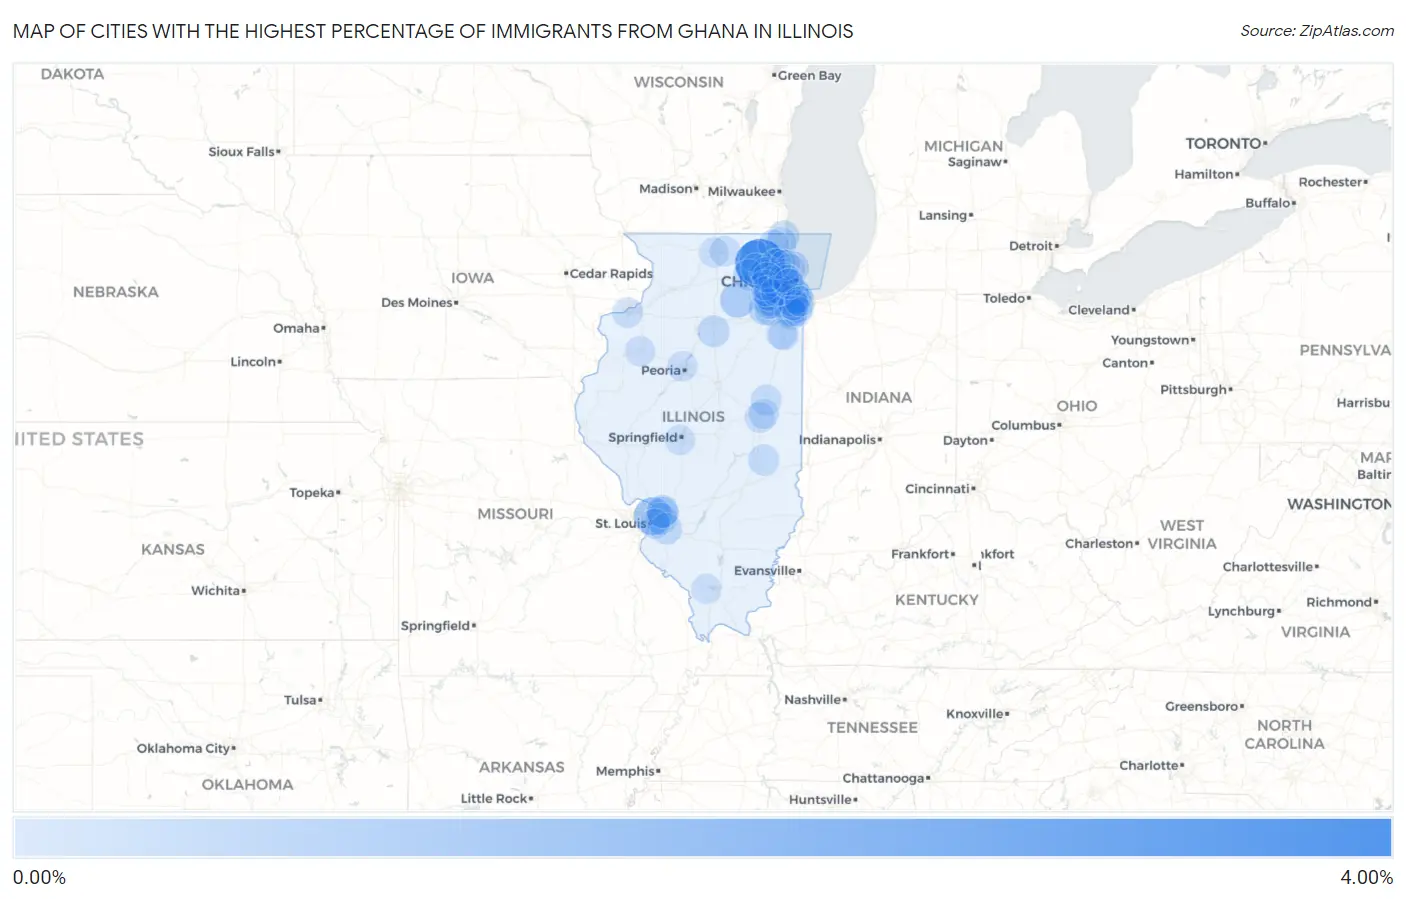
Cities with the Highest Percentage of Immigrants from Ghana in Illinois
| City | Ghana | vs State | vs National | |
| 1. | East Dundee | 3.33% | 0.055%(+3.27)#-1 | 0.061%(+3.26)#0 |
| 2. | Madison | 1.23% | 0.055%(+1.18)#0 | 0.061%(+1.17)#1 |
| 3. | Woodridge | 1.23% | 0.055%(+1.17)#1 | 0.061%(+1.17)#28 |
| 4. | Lake Holiday | 0.80% | 0.055%(+0.747)#2 | 0.061%(+0.741)#29 |
| 5. | Calumet Park | 0.78% | 0.055%(+0.723)#3 | 0.061%(+0.718)#30 |
| 6. | Romeoville | 0.55% | 0.055%(+0.495)#4 | 0.061%(+0.490)#31 |
| 7. | Evanston | 0.44% | 0.055%(+0.387)#24 | 0.061%(+0.381)#449 |
| 8. | Evergreen Park | 0.42% | 0.055%(+0.365)#25 | 0.061%(+0.360)#450 |
| 9. | Joliet | 0.41% | 0.055%(+0.355)#26 | 0.061%(+0.349)#472 |
| 10. | Edwardsville | 0.38% | 0.055%(+0.328)#27 | 0.061%(+0.322)#473 |
| 11. | Glenwood | 0.33% | 0.055%(+0.273)#28 | 0.061%(+0.267)#474 |
| 12. | Worth | 0.32% | 0.055%(+0.267)#29 | 0.061%(+0.261)#475 |
| 13. | Hazel Crest | 0.29% | 0.055%(+0.236)#30 | 0.061%(+0.230)#476 |
| 14. | Tonica | 0.29% | 0.055%(+0.231)#31 | 0.061%(+0.226)#477 |
| 15. | University Park | 0.27% | 0.055%(+0.218)#32 | 0.061%(+0.212)#478 |
| 16. | Zion | 0.27% | 0.055%(+0.217)#33 | 0.061%(+0.212)#479 |
| 17. | Collinsville | 0.26% | 0.055%(+0.208)#34 | 0.061%(+0.202)#480 |
| 18. | Lockport | 0.26% | 0.055%(+0.205)#35 | 0.061%(+0.199)#481 |
| 19. | Lisle | 0.25% | 0.055%(+0.192)#36 | 0.061%(+0.186)#482 |
| 20. | Streamwood | 0.24% | 0.055%(+0.187)#37 | 0.061%(+0.182)#483 |
| 21. | Shiloh | 0.24% | 0.055%(+0.182)#38 | 0.061%(+0.177)#484 |
| 22. | Lake In The Hills | 0.23% | 0.055%(+0.180)#39 | 0.061%(+0.174)#485 |
| 23. | Preston Heights | 0.23% | 0.055%(+0.177)#40 | 0.061%(+0.171)#486 |
| 24. | Riverdale | 0.22% | 0.055%(+0.163)#41 | 0.061%(+0.158)#487 |
| 25. | Lily Lake | 0.22% | 0.055%(+0.161)#42 | 0.061%(+0.155)#488 |
| 26. | Glen Carbon | 0.21% | 0.055%(+0.157)#43 | 0.061%(+0.151)#489 |
| 27. | Westmont | 0.20% | 0.055%(+0.143)#44 | 0.061%(+0.137)#490 |
| 28. | Bolingbrook | 0.18% | 0.055%(+0.124)#45 | 0.061%(+0.118)#491 |
| 29. | Charleston | 0.16% | 0.055%(+0.108)#46 | 0.061%(+0.102)#492 |
| 30. | Rantoul | 0.14% | 0.055%(+0.088)#47 | 0.061%(+0.083)#493 |
| 31. | Prospect Heights | 0.14% | 0.055%(+0.083)#48 | 0.061%(+0.078)#494 |
| 32. | Hanover Park | 0.14% | 0.055%(+0.082)#49 | 0.061%(+0.076)#495 |
| 33. | Waukegan | 0.13% | 0.055%(+0.076)#50 | 0.061%(+0.070)#496 |
| 34. | Maywood | 0.12% | 0.055%(+0.069)#51 | 0.061%(+0.063)#497 |
| 35. | Grayslake | 0.12% | 0.055%(+0.065)#52 | 0.061%(+0.059)#498 |
| 36. | Park Forest | 0.12% | 0.055%(+0.064)#53 | 0.061%(+0.058)#499 |
| 37. | Chicago | 0.11% | 0.055%(+0.056)#54 | 0.061%(+0.050)#500 |
| 38. | Savoy | 0.10% | 0.055%(+0.048)#55 | 0.061%(+0.043)#501 |
| 39. | Richton Park | 0.094% | 0.055%(+0.039)#56 | 0.061%(+0.033)#502 |
| 40. | Rock Island | 0.091% | 0.055%(+0.036)#57 | 0.061%(+0.030)#503 |
| 41. | Belvidere | 0.079% | 0.055%(+0.024)#58 | 0.061%(+0.018)#504 |
| 42. | Markham | 0.078% | 0.055%(+0.022)#59 | 0.061%(+0.017)#505 |
| 43. | Elgin | 0.074% | 0.055%(+0.019)#60 | 0.061%(+0.013)#506 |
| 44. | Lombard | 0.073% | 0.055%(+0.017)#61 | 0.061%(+0.012)#507 |
| 45. | Urbana | 0.065% | 0.055%(+0.009)#62 | 0.061%(+0.004)#508 |
| 46. | Burr Ridge | 0.063% | 0.055%(+0.008)#63 | 0.061%(+0.002)#509 |
| 47. | Homewood | 0.060% | 0.055%(+0.005)#64 | 0.061%(-0.001)#510 |
| 48. | Skokie | 0.058% | 0.055%(+0.003)#65 | 0.061%(-0.003)#511 |
| 49. | Peoria | 0.057% | 0.055%(+0.002)#66 | 0.061%(-0.003)#512 |
| 50. | Crest Hill | 0.045% | 0.055%(-0.010)#67 | 0.061%(-0.016)#513 |
| 51. | Bourbonnais | 0.044% | 0.055%(-0.011)#68 | 0.061%(-0.017)#514 |
| 52. | Springfield | 0.043% | 0.055%(-0.012)#69 | 0.061%(-0.018)#515 |
| 53. | Glenview | 0.042% | 0.055%(-0.013)#70 | 0.061%(-0.019)#516 |
| 54. | Galesburg | 0.037% | 0.055%(-0.018)#71 | 0.061%(-0.024)#517 |
| 55. | Bradley | 0.033% | 0.055%(-0.023)#72 | 0.061%(-0.028)#518 |
| 56. | Steger | 0.032% | 0.055%(-0.024)#73 | 0.061%(-0.029)#519 |
| 57. | Warrenville | 0.029% | 0.055%(-0.027)#74 | 0.061%(-0.032)#520 |
| 58. | Naperville | 0.025% | 0.055%(-0.030)#75 | 0.061%(-0.035)#521 |
| 59. | Darien | 0.023% | 0.055%(-0.032)#76 | 0.061%(-0.038)#522 |
| 60. | East St Louis | 0.021% | 0.055%(-0.034)#77 | 0.061%(-0.040)#523 |
| 61. | Rockford | 0.017% | 0.055%(-0.038)#78 | 0.061%(-0.044)#524 |
| 62. | Oak Park | 0.013% | 0.055%(-0.042)#79 | 0.061%(-0.048)#525 |
| 63. | River Grove | 0.0095% | 0.055%(-0.046)#80 | 0.061%(-0.051)#526 |
| 64. | Arlington Heights | 0.0091% | 0.055%(-0.046)#81 | 0.061%(-0.052)#527 |
| 65. | Cicero | 0.0083% | 0.055%(-0.047)#82 | 0.061%(-0.053)#528 |
| 66. | Carbondale | 0.0045% | 0.055%(-0.051)#83 | 0.061%(-0.056)#529 |
| 67. | Calumet City | 0.0028% | 0.055%(-0.052)#84 | 0.061%(-0.058)#530 |
| 68. | Carol Stream | 0.0025% | 0.055%(-0.053)#85 | 0.061%(-0.058)#531 |
Common Questions
What are the Top 10 Cities with the Highest Percentage of Immigrants from Ghana in Illinois?
Top 10 Cities with the Highest Percentage of Immigrants from Ghana in Illinois are:
#1
3.33%
#2
1.23%
#3
1.23%
#4
0.80%
#5
0.78%
#6
0.55%
#7
0.44%
#8
0.42%
#9
0.41%
#10
0.38%
What city has the Highest Percentage of Immigrants from Ghana in Illinois?
East Dundee has the Highest Percentage of Immigrants from Ghana in Illinois with 3.33%.
What is the Percentage of Immigrants from Ghana in the State of Illinois?
Percentage of Immigrants from Ghana in Illinois is 0.055%.
What is the Percentage of Immigrants from Ghana in the United States?
Percentage of Immigrants from Ghana in the United States is 0.061%.