Mascoutah, IL Map & Demographics
Mascoutah Map
Mascoutah Overview
$37,411
PER CAPITA INCOME
$126,313
AVG FAMILY INCOME
$93,403
AVG HOUSEHOLD INCOME
46.1%
WAGE / INCOME GAP [ % ]
53.9¢/ $1
WAGE / INCOME GAP [ $ ]
0.35
INEQUALITY / GINI INDEX
8,762
TOTAL POPULATION
4,296
MALE POPULATION
4,466
FEMALE POPULATION
96.19
MALES / 100 FEMALES
103.96
FEMALES / 100 MALES
36.6
MEDIAN AGE
3.5
AVG FAMILY SIZE
2.9
AVG HOUSEHOLD SIZE
4,860
LABOR FORCE [ PEOPLE ]
72.2%
PERCENT IN LABOR FORCE
4.5%
UNEMPLOYMENT RATE
Mascoutah Zip Codes
Mascoutah Area Codes
Income in Mascoutah
Income Overview in Mascoutah
Per Capita Income in Mascoutah is $37,411, while median incomes of families and households are $126,313 and $93,403 respectively.
| Characteristic | Number | Measure |
| Per Capita Income | 8,762 | $37,411 |
| Median Family Income | 2,041 | $126,313 |
| Mean Family Income | 2,041 | $126,955 |
| Median Household Income | 2,984 | $93,403 |
| Mean Household Income | 2,984 | $107,688 |
| Income Deficit | 2,041 | $0 |
| Wage / Income Gap (%) | 8,762 | 46.06% |
| Wage / Income Gap ($) | 8,762 | 53.94¢ per $1 |
| Gini / Inequality Index | 8,762 | 0.35 |
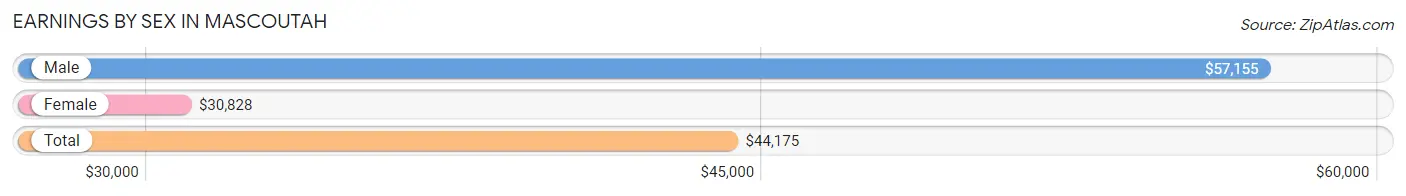
Earnings by Sex in Mascoutah
Average Earnings in Mascoutah are $44,175, $57,155 for men and $30,828 for women, a difference of 46.1%.
| Sex | Number | Average Earnings |
| Male | 2,559 (51.3%) | $57,155 |
| Female | 2,424 (48.6%) | $30,828 |
| Total | 4,983 (100.0%) | $44,175 |
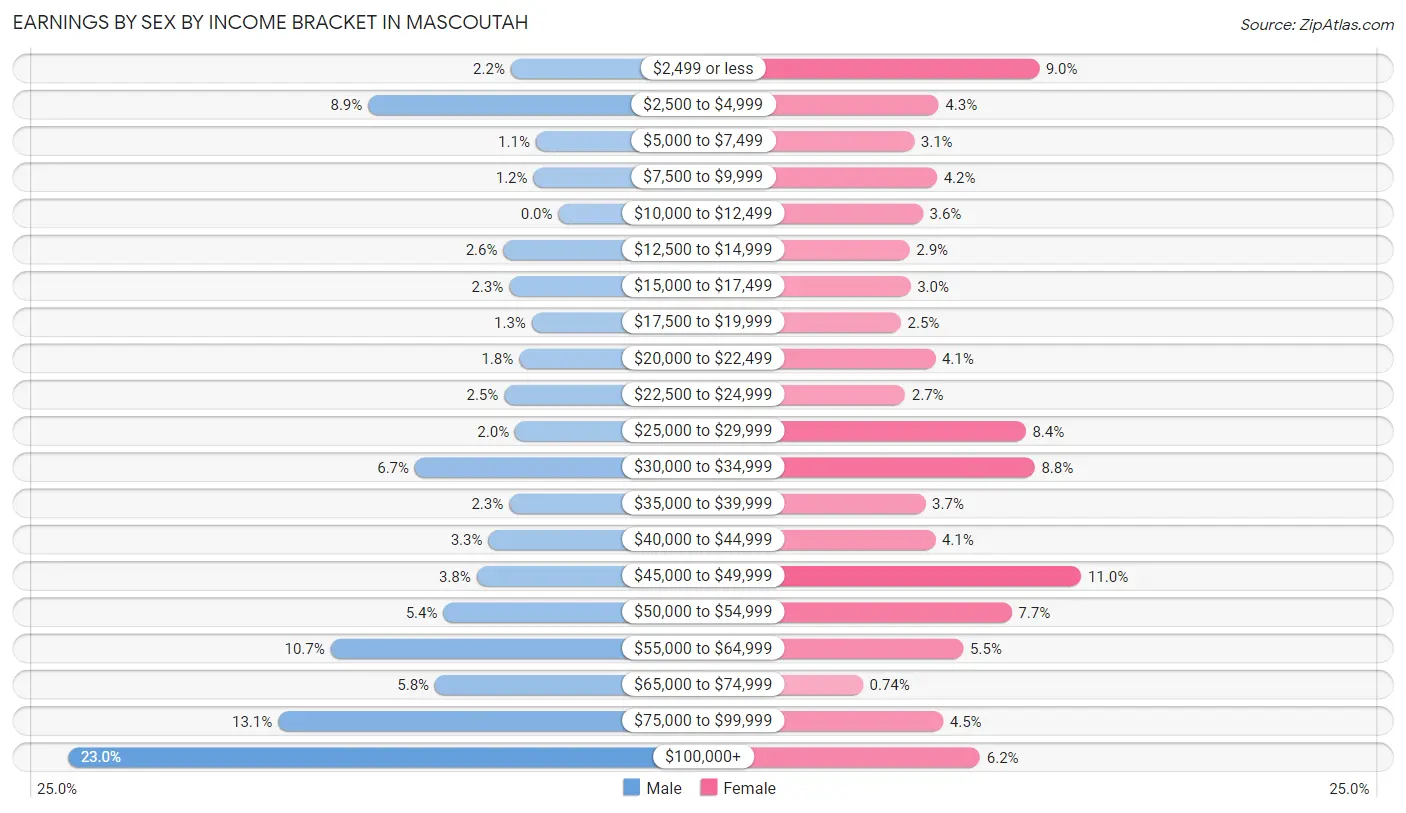
Earnings by Sex by Income Bracket in Mascoutah
The most common earnings brackets in Mascoutah are $100,000+ for men (588 | 23.0%) and $45,000 to $49,999 for women (266 | 11.0%).
| Income | Male | Female |
| $2,499 or less | 57 (2.2%) | 218 (9.0%) |
| $2,500 to $4,999 | 228 (8.9%) | 104 (4.3%) |
| $5,000 to $7,499 | 27 (1.1%) | 76 (3.1%) |
| $7,500 to $9,999 | 30 (1.2%) | 102 (4.2%) |
| $10,000 to $12,499 | 0 (0.0%) | 86 (3.5%) |
| $12,500 to $14,999 | 66 (2.6%) | 71 (2.9%) |
| $15,000 to $17,499 | 59 (2.3%) | 72 (3.0%) |
| $17,500 to $19,999 | 32 (1.3%) | 61 (2.5%) |
| $20,000 to $22,499 | 47 (1.8%) | 100 (4.1%) |
| $22,500 to $24,999 | 65 (2.5%) | 66 (2.7%) |
| $25,000 to $29,999 | 52 (2.0%) | 203 (8.4%) |
| $30,000 to $34,999 | 172 (6.7%) | 213 (8.8%) |
| $35,000 to $39,999 | 59 (2.3%) | 89 (3.7%) |
| $40,000 to $44,999 | 84 (3.3%) | 100 (4.1%) |
| $45,000 to $49,999 | 98 (3.8%) | 266 (11.0%) |
| $50,000 to $54,999 | 138 (5.4%) | 187 (7.7%) |
| $55,000 to $64,999 | 273 (10.7%) | 132 (5.4%) |
| $65,000 to $74,999 | 148 (5.8%) | 18 (0.7%) |
| $75,000 to $99,999 | 336 (13.1%) | 109 (4.5%) |
| $100,000+ | 588 (23.0%) | 151 (6.2%) |
| Total | 2,559 (100.0%) | 2,424 (100.0%) |
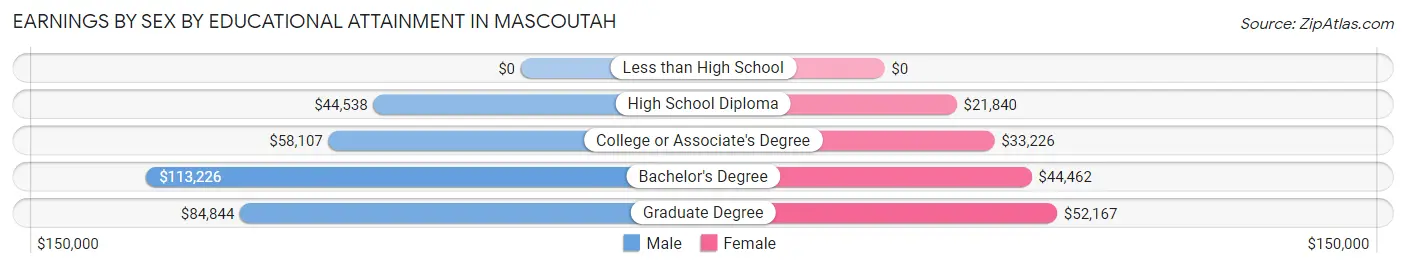
Earnings by Sex by Educational Attainment in Mascoutah
Average earnings in Mascoutah are $62,273 for men and $36,520 for women, a difference of 41.4%. Men with an educational attainment of bachelor's degree enjoy the highest average annual earnings of $113,226, while those with high school diploma education earn the least with $44,538. Women with an educational attainment of graduate degree earn the most with the average annual earnings of $52,167, while those with high school diploma education have the smallest earnings of $21,840.
| Educational Attainment | Male Income | Female Income |
| Less than High School | - | - |
| High School Diploma | $44,538 | $21,840 |
| College or Associate's Degree | $58,107 | $33,226 |
| Bachelor's Degree | $113,226 | $44,462 |
| Graduate Degree | $84,844 | $52,167 |
| Total | $62,273 | $36,520 |
Family Income in Mascoutah
Family Income Brackets in Mascoutah
According to the Mascoutah family income data, there are 555 families falling into the $100,000 to $149,999 income range, which is the most common income bracket and makes up 27.2% of all families. Conversely, the less than $10,000 income bracket is the least frequent group with only 6 families (0.3%) belonging to this category.
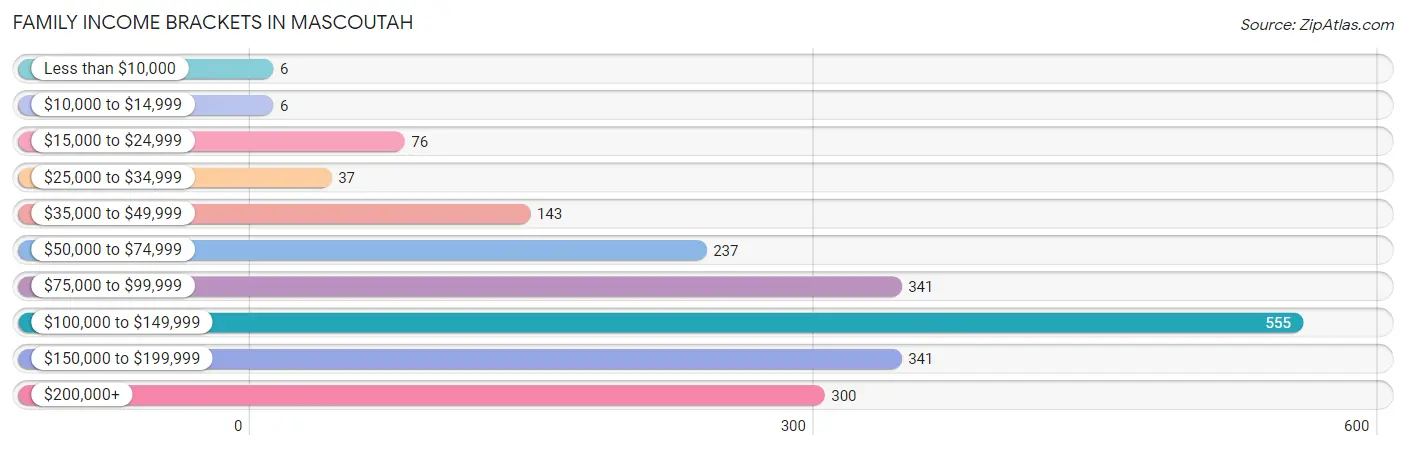
| Income Bracket | # Families | % Families |
| Less than $10,000 | 6 | 0.3% |
| $10,000 to $14,999 | 6 | 0.3% |
| $15,000 to $24,999 | 76 | 3.7% |
| $25,000 to $34,999 | 37 | 1.8% |
| $35,000 to $49,999 | 143 | 7.0% |
| $50,000 to $74,999 | 237 | 11.6% |
| $75,000 to $99,999 | 341 | 16.7% |
| $100,000 to $149,999 | 555 | 27.2% |
| $150,000 to $199,999 | 341 | 16.7% |
| $200,000+ | 300 | 14.7% |
Family Income by Famaliy Size in Mascoutah
3-person families (390 | 19.1%) account for the highest median family income in Mascoutah with $141,429 per family, while 2-person families (627 | 30.7%) have the highest median income of $48,312 per family member.
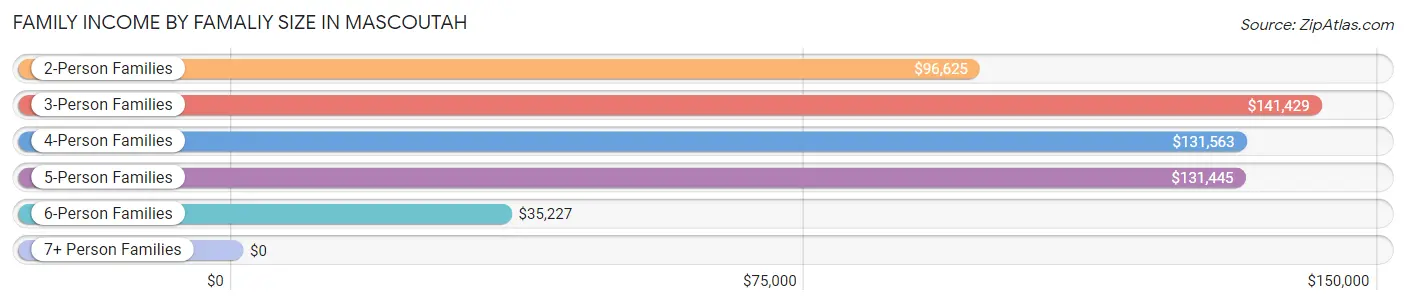
| Income Bracket | # Families | Median Income |
| 2-Person Families | 627 (30.7%) | $96,625 |
| 3-Person Families | 390 (19.1%) | $141,429 |
| 4-Person Families | 686 (33.6%) | $131,563 |
| 5-Person Families | 236 (11.6%) | $131,445 |
| 6-Person Families | 84 (4.1%) | $35,227 |
| 7+ Person Families | 18 (0.9%) | $0 |
| Total | 2,041 (100.0%) | $126,313 |
Family Income by Number of Earners in Mascoutah
The median family income in Mascoutah is $126,313, with families comprising 3+ earners (440) having the highest median family income of $166,447, while families with no earners (164) have the lowest median family income of $82,500, accounting for 21.6% and 8.0% of families, respectively.
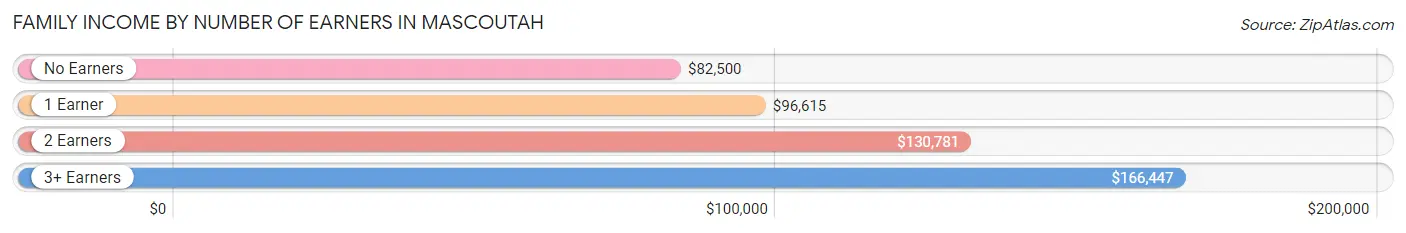
| Number of Earners | # Families | Median Income |
| No Earners | 164 (8.0%) | $82,500 |
| 1 Earner | 509 (24.9%) | $96,615 |
| 2 Earners | 928 (45.5%) | $130,781 |
| 3+ Earners | 440 (21.6%) | $166,447 |
| Total | 2,041 (100.0%) | $126,313 |
Household Income in Mascoutah
Household Income Brackets in Mascoutah
With 683 households falling in the category, the $100,000 to $149,999 income range is the most frequent in Mascoutah, accounting for 22.9% of all households. In contrast, only 18 households (0.6%) fall into the $10,000 to $14,999 income bracket, making it the least populous group.
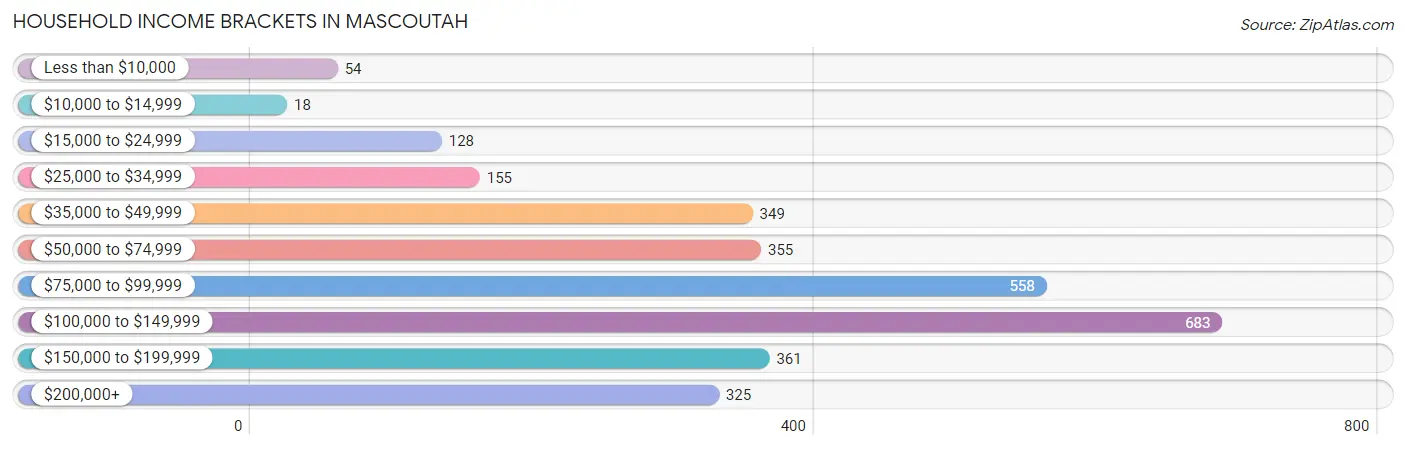
| Income Bracket | # Households | % Households |
| Less than $10,000 | 54 | 1.8% |
| $10,000 to $14,999 | 18 | 0.6% |
| $15,000 to $24,999 | 128 | 4.3% |
| $25,000 to $34,999 | 155 | 5.2% |
| $35,000 to $49,999 | 349 | 11.7% |
| $50,000 to $74,999 | 355 | 11.9% |
| $75,000 to $99,999 | 558 | 18.7% |
| $100,000 to $149,999 | 683 | 22.9% |
| $150,000 to $199,999 | 361 | 12.1% |
| $200,000+ | 325 | 10.9% |
Household Income by Householder Age in Mascoutah
The median household income in Mascoutah is $93,403, with the highest median household income of $112,439 found in the 45 to 64 years age bracket for the primary householder. A total of 1,229 households (41.2%) fall into this category. Meanwhile, the 15 to 24 years age bracket for the primary householder has the lowest median household income of $36,379, with 104 households (3.5%) in this group.
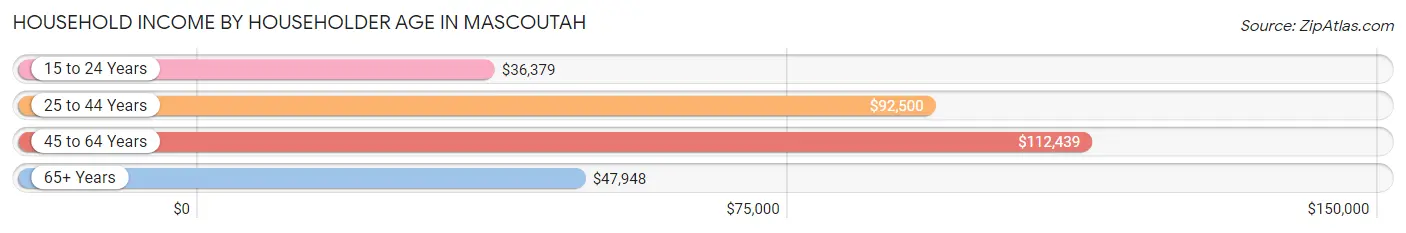
| Income Bracket | # Households | Median Income |
| 15 to 24 Years | 104 (3.5%) | $36,379 |
| 25 to 44 Years | 1,058 (35.5%) | $92,500 |
| 45 to 64 Years | 1,229 (41.2%) | $112,439 |
| 65+ Years | 593 (19.9%) | $47,948 |
| Total | 2,984 (100.0%) | $93,403 |
Poverty in Mascoutah
Income Below Poverty by Sex and Age in Mascoutah
With 6.3% poverty level for males and 13.6% for females among the residents of Mascoutah, 18 to 24 year old males and 15 year old females are the most vulnerable to poverty, with 102 males (26.8%) and 25 females (39.1%) in their respective age groups living below the poverty level.
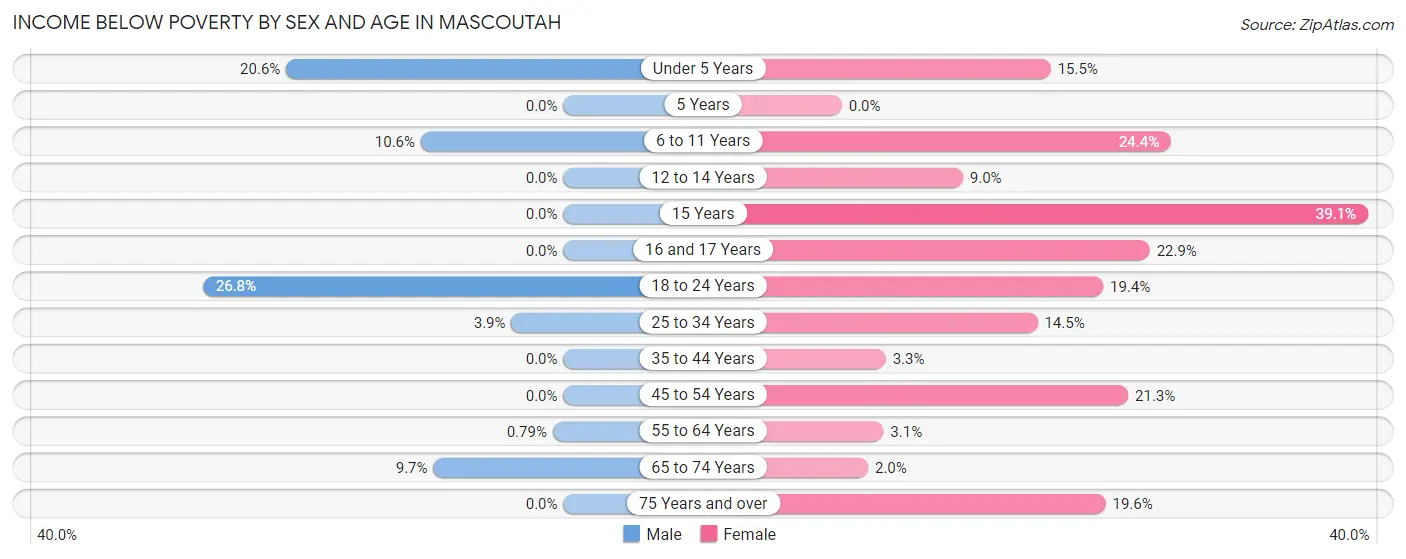
| Age Bracket | Male | Female |
| Under 5 Years | 71 (20.6%) | 49 (15.5%) |
| 5 Years | 0 (0.0%) | 0 (0.0%) |
| 6 to 11 Years | 42 (10.6%) | 119 (24.4%) |
| 12 to 14 Years | 0 (0.0%) | 8 (9.0%) |
| 15 Years | 0 (0.0%) | 25 (39.1%) |
| 16 and 17 Years | 0 (0.0%) | 24 (22.9%) |
| 18 to 24 Years | 102 (26.8%) | 78 (19.4%) |
| 25 to 34 Years | 20 (3.9%) | 94 (14.5%) |
| 35 to 44 Years | 0 (0.0%) | 22 (3.3%) |
| 45 to 54 Years | 0 (0.0%) | 105 (21.3%) |
| 55 to 64 Years | 5 (0.8%) | 15 (3.1%) |
| 65 to 74 Years | 30 (9.7%) | 7 (1.9%) |
| 75 Years and over | 0 (0.0%) | 47 (19.6%) |
| Total | 270 (6.3%) | 593 (13.6%) |
Income Above Poverty by Sex and Age in Mascoutah
According to the poverty statistics in Mascoutah, males aged 5 years and females aged 65 to 74 years are the age groups that are most secure financially, with 100.0% of males and 98.1% of females in these age groups living above the poverty line.
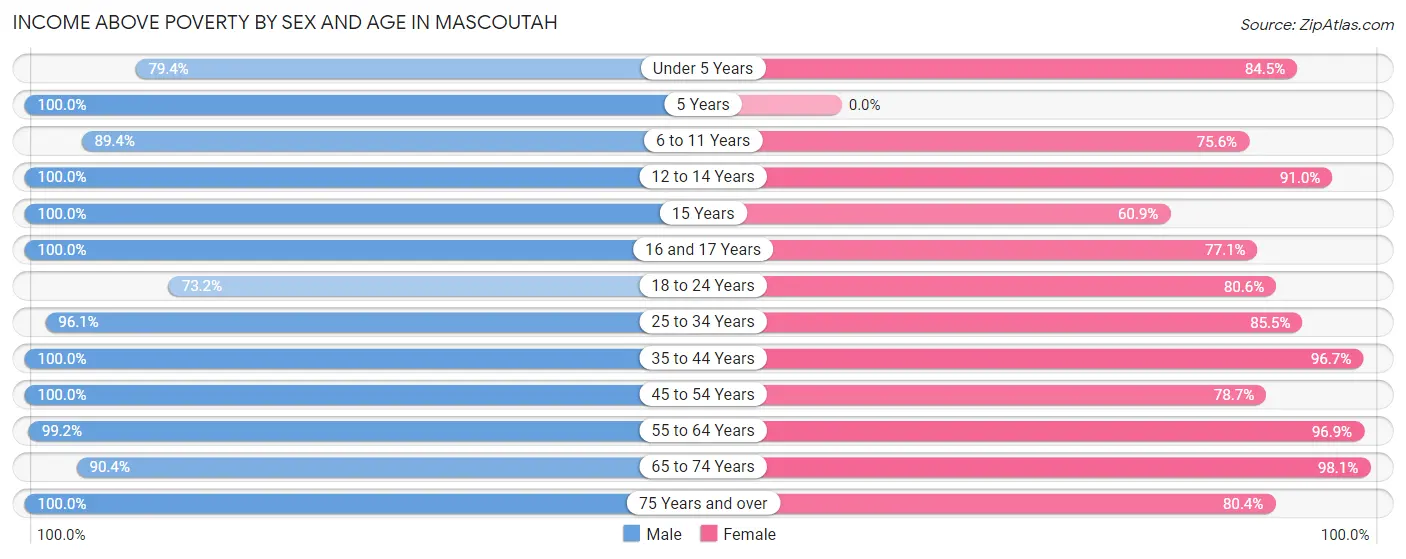
| Age Bracket | Male | Female |
| Under 5 Years | 274 (79.4%) | 267 (84.5%) |
| 5 Years | 40 (100.0%) | 0 (0.0%) |
| 6 to 11 Years | 355 (89.4%) | 368 (75.6%) |
| 12 to 14 Years | 169 (100.0%) | 81 (91.0%) |
| 15 Years | 98 (100.0%) | 39 (60.9%) |
| 16 and 17 Years | 72 (100.0%) | 81 (77.1%) |
| 18 to 24 Years | 279 (73.2%) | 324 (80.6%) |
| 25 to 34 Years | 498 (96.1%) | 553 (85.5%) |
| 35 to 44 Years | 740 (100.0%) | 652 (96.7%) |
| 45 to 54 Years | 486 (100.0%) | 389 (78.7%) |
| 55 to 64 Years | 624 (99.2%) | 470 (96.9%) |
| 65 to 74 Years | 281 (90.3%) | 352 (98.1%) |
| 75 Years and over | 76 (100.0%) | 193 (80.4%) |
| Total | 3,992 (93.7%) | 3,769 (86.4%) |
Income Below Poverty Among Married-Couple Families in Mascoutah
The poverty statistics for married-couple families in Mascoutah show that 1.5% or 27 of the total 1,737 families live below the poverty line. Families with 1 or 2 children have the highest poverty rate of 2.5%, comprising of 20 families. On the other hand, families with 3 or 4 children have the lowest poverty rate of 0.0%, which includes 0 families.
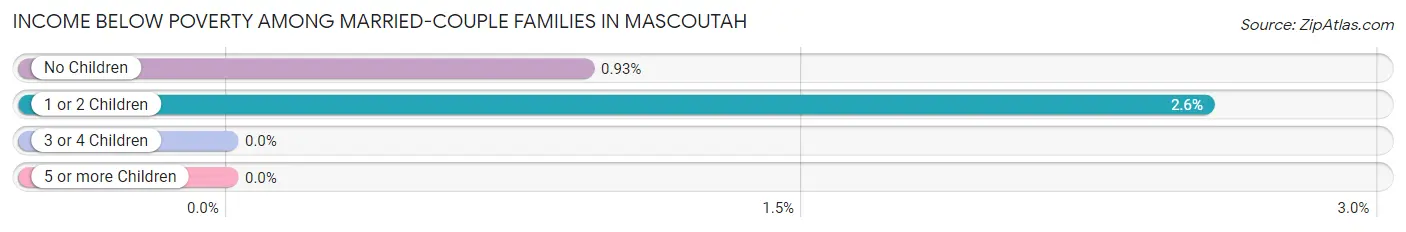
| Children | Above Poverty | Below Poverty |
| No Children | 743 (99.1%) | 7 (0.9%) |
| 1 or 2 Children | 764 (97.5%) | 20 (2.5%) |
| 3 or 4 Children | 185 (100.0%) | 0 (0.0%) |
| 5 or more Children | 18 (100.0%) | 0 (0.0%) |
| Total | 1,710 (98.5%) | 27 (1.5%) |
Income Below Poverty Among Single-Parent Households in Mascoutah
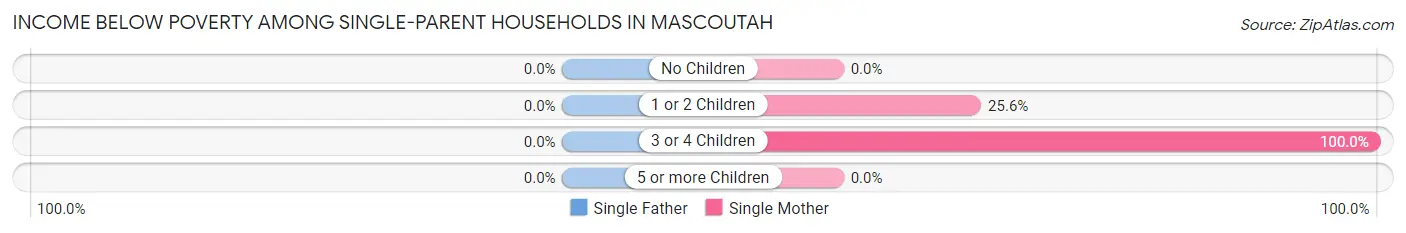
| Children | Single Father | Single Mother |
| No Children | 0 (0.0%) | 0 (0.0%) |
| 1 or 2 Children | 0 (0.0%) | 21 (25.6%) |
| 3 or 4 Children | 0 (0.0%) | 62 (100.0%) |
| 5 or more Children | 0 (0.0%) | 0 (0.0%) |
| Total | 0 (0.0%) | 83 (39.9%) |
Income Below Poverty Among Married-Couple vs Single-Parent Households in Mascoutah
The poverty data for Mascoutah shows that 27 of the married-couple family households (1.5%) and 83 of the single-parent households (27.3%) are living below the poverty level. Within the married-couple family households, those with 1 or 2 children have the highest poverty rate, with 20 households (2.5%) falling below the poverty line. Among the single-parent households, those with 3 or 4 children have the highest poverty rate, with 62 household (100.0%) living below poverty.
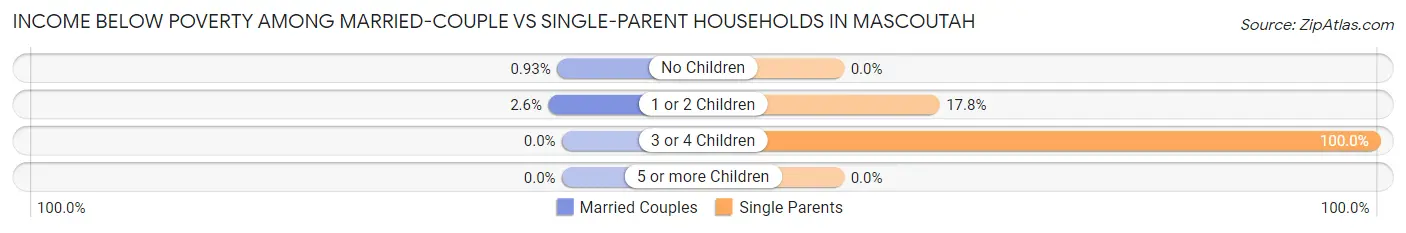
| Children | Married-Couple Families | Single-Parent Households |
| No Children | 7 (0.9%) | 0 (0.0%) |
| 1 or 2 Children | 20 (2.5%) | 21 (17.8%) |
| 3 or 4 Children | 0 (0.0%) | 62 (100.0%) |
| 5 or more Children | 0 (0.0%) | 0 (0.0%) |
| Total | 27 (1.5%) | 83 (27.3%) |
Race in Mascoutah
The most populous races in Mascoutah are White / Caucasian (7,168 | 81.8%), Two or more Races (779 | 8.9%), and Hispanic or Latino (666 | 7.6%).
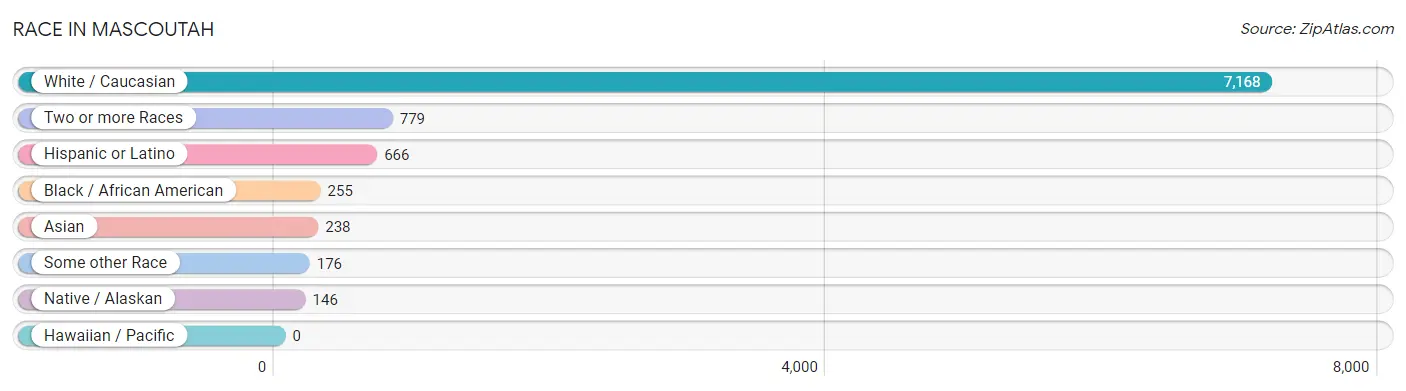
| Race | # Population | % Population |
| Asian | 238 | 2.7% |
| Black / African American | 255 | 2.9% |
| Hawaiian / Pacific | 0 | 0.0% |
| Hispanic or Latino | 666 | 7.6% |
| Native / Alaskan | 146 | 1.7% |
| White / Caucasian | 7,168 | 81.8% |
| Two or more Races | 779 | 8.9% |
| Some other Race | 176 | 2.0% |
| Total | 8,762 | 100.0% |
Ancestry in Mascoutah
The most populous ancestries reported in Mascoutah are German (2,643 | 30.2%), English (779 | 8.9%), Irish (760 | 8.7%), American (700 | 8.0%), and Italian (349 | 4.0%), together accounting for 59.7% of all Mascoutah residents.
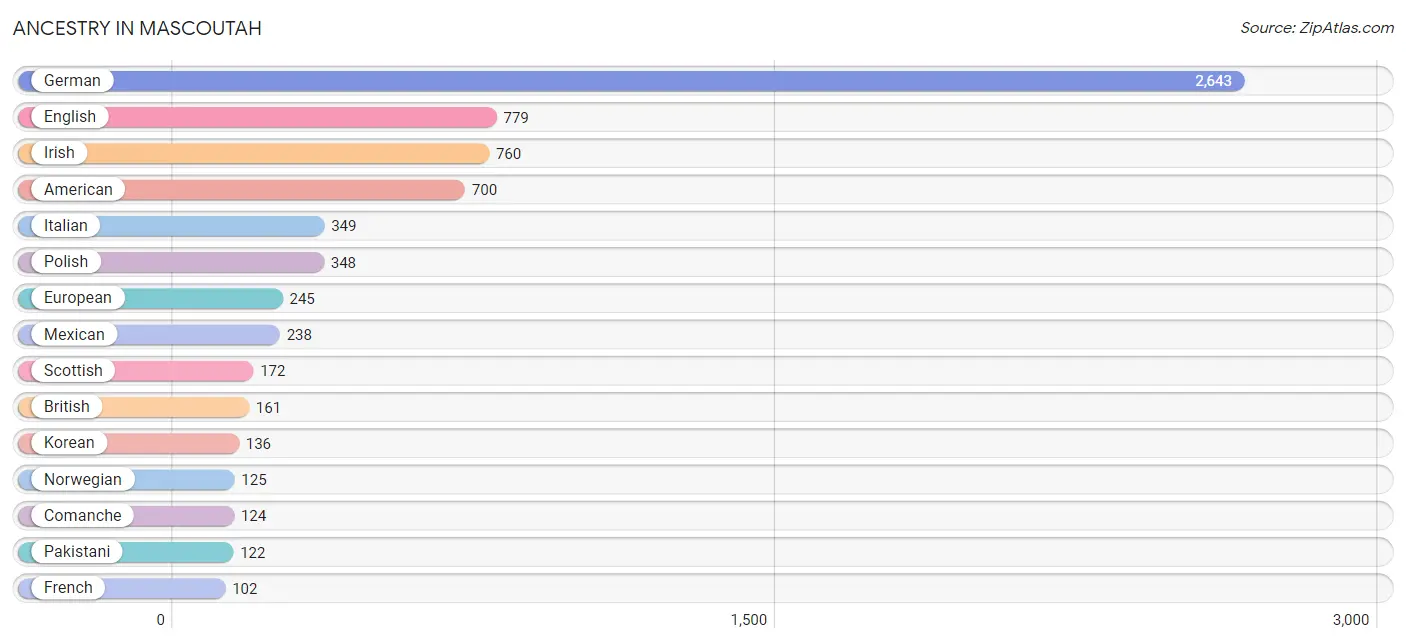
| Ancestry | # Population | % Population |
| American | 700 | 8.0% |
| Arab | 12 | 0.1% |
| Bhutanese | 19 | 0.2% |
| British | 161 | 1.8% |
| Bulgarian | 21 | 0.2% |
| Burmese | 25 | 0.3% |
| Central American | 5 | 0.1% |
| Cherokee | 22 | 0.3% |
| Comanche | 124 | 1.4% |
| Czech | 21 | 0.2% |
| Czechoslovakian | 11 | 0.1% |
| Dutch | 51 | 0.6% |
| Eastern European | 39 | 0.4% |
| English | 779 | 8.9% |
| European | 245 | 2.8% |
| French | 102 | 1.2% |
| French Canadian | 22 | 0.3% |
| German | 2,643 | 30.2% |
| Honduran | 5 | 0.1% |
| Hungarian | 11 | 0.1% |
| Indian (Asian) | 16 | 0.2% |
| Irish | 760 | 8.7% |
| Italian | 349 | 4.0% |
| Jamaican | 3 | 0.0% |
| Korean | 136 | 1.5% |
| Mexican | 238 | 2.7% |
| Norwegian | 125 | 1.4% |
| Pakistani | 122 | 1.4% |
| Peruvian | 11 | 0.1% |
| Polish | 348 | 4.0% |
| Puerto Rican | 63 | 0.7% |
| Scandinavian | 23 | 0.3% |
| Scotch-Irish | 14 | 0.2% |
| Scottish | 172 | 2.0% |
| Sioux | 82 | 0.9% |
| South American | 11 | 0.1% |
| Spanish | 12 | 0.1% |
| Swedish | 48 | 0.5% |
| Swiss | 24 | 0.3% |
| Syrian | 12 | 0.1% |
| Welsh | 53 | 0.6% | View All 41 Rows |
Immigrants in Mascoutah
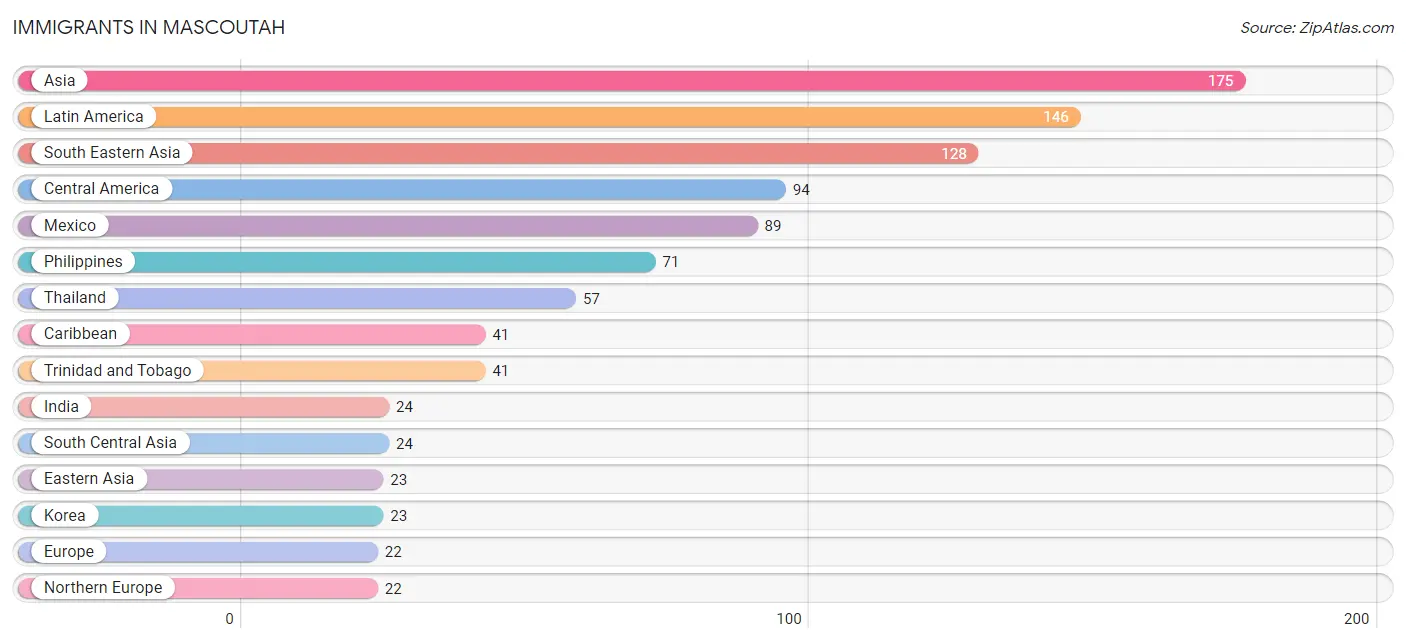
The most numerous immigrant groups reported in Mascoutah came from Asia (175 | 2.0%), Latin America (146 | 1.7%), South Eastern Asia (128 | 1.5%), Central America (94 | 1.1%), and Mexico (89 | 1.0%), together accounting for 7.2% of all Mascoutah residents.
| Immigration Origin | # Population | % Population |
| Asia | 175 | 2.0% |
| Caribbean | 41 | 0.5% |
| Central America | 94 | 1.1% |
| Eastern Asia | 23 | 0.3% |
| Europe | 22 | 0.3% |
| Honduras | 5 | 0.1% |
| India | 24 | 0.3% |
| Korea | 23 | 0.3% |
| Latin America | 146 | 1.7% |
| Mexico | 89 | 1.0% |
| Northern Europe | 22 | 0.3% |
| Peru | 11 | 0.1% |
| Philippines | 71 | 0.8% |
| South America | 11 | 0.1% |
| South Central Asia | 24 | 0.3% |
| South Eastern Asia | 128 | 1.5% |
| Thailand | 57 | 0.6% |
| Trinidad and Tobago | 41 | 0.5% | View All 18 Rows |
Sex and Age in Mascoutah
Sex and Age in Mascoutah
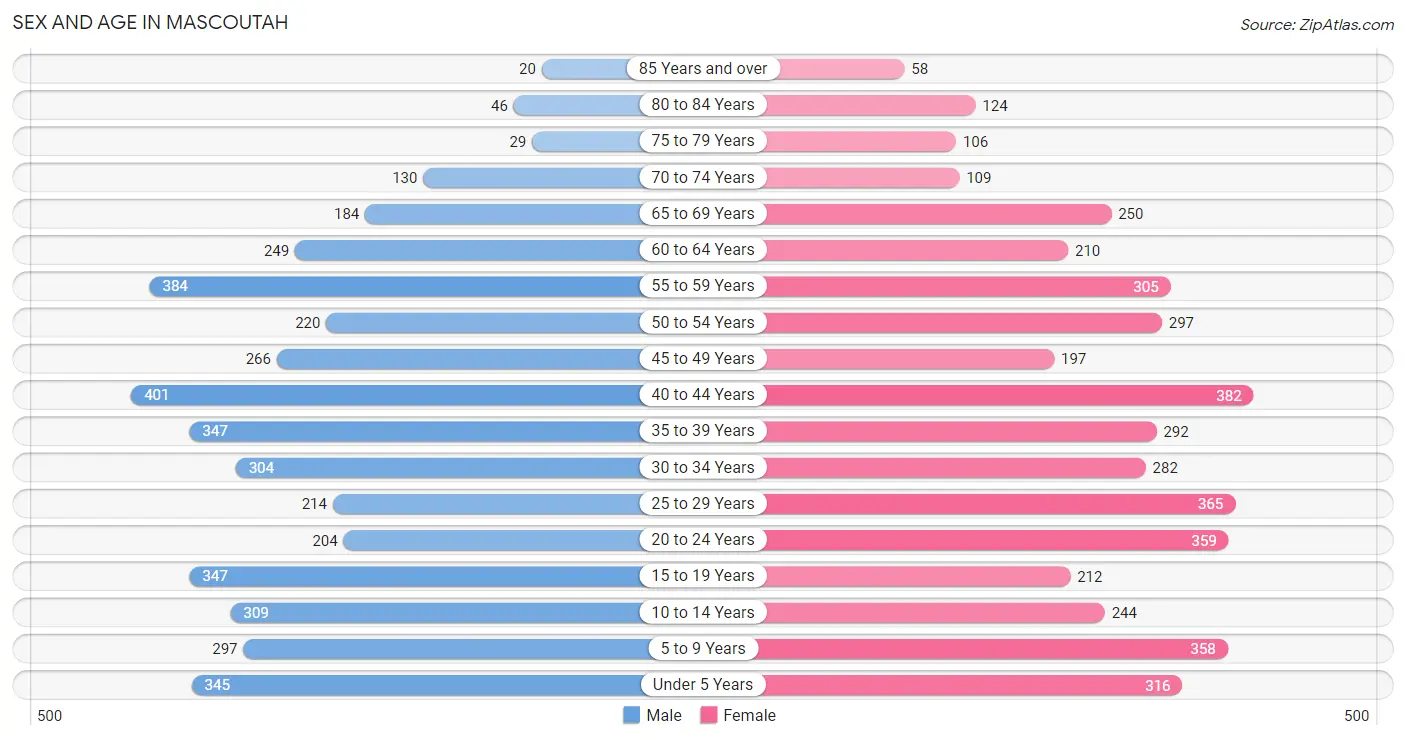
The most populous age groups in Mascoutah are 40 to 44 Years (401 | 9.3%) for men and 40 to 44 Years (382 | 8.6%) for women.
| Age Bracket | Male | Female |
| Under 5 Years | 345 (8.0%) | 316 (7.1%) |
| 5 to 9 Years | 297 (6.9%) | 358 (8.0%) |
| 10 to 14 Years | 309 (7.2%) | 244 (5.5%) |
| 15 to 19 Years | 347 (8.1%) | 212 (4.8%) |
| 20 to 24 Years | 204 (4.8%) | 359 (8.0%) |
| 25 to 29 Years | 214 (5.0%) | 365 (8.2%) |
| 30 to 34 Years | 304 (7.1%) | 282 (6.3%) |
| 35 to 39 Years | 347 (8.1%) | 292 (6.5%) |
| 40 to 44 Years | 401 (9.3%) | 382 (8.6%) |
| 45 to 49 Years | 266 (6.2%) | 197 (4.4%) |
| 50 to 54 Years | 220 (5.1%) | 297 (6.7%) |
| 55 to 59 Years | 384 (8.9%) | 305 (6.8%) |
| 60 to 64 Years | 249 (5.8%) | 210 (4.7%) |
| 65 to 69 Years | 184 (4.3%) | 250 (5.6%) |
| 70 to 74 Years | 130 (3.0%) | 109 (2.4%) |
| 75 to 79 Years | 29 (0.7%) | 106 (2.4%) |
| 80 to 84 Years | 46 (1.1%) | 124 (2.8%) |
| 85 Years and over | 20 (0.5%) | 58 (1.3%) |
| Total | 4,296 (100.0%) | 4,466 (100.0%) |
Families and Households in Mascoutah
Median Family Size in Mascoutah
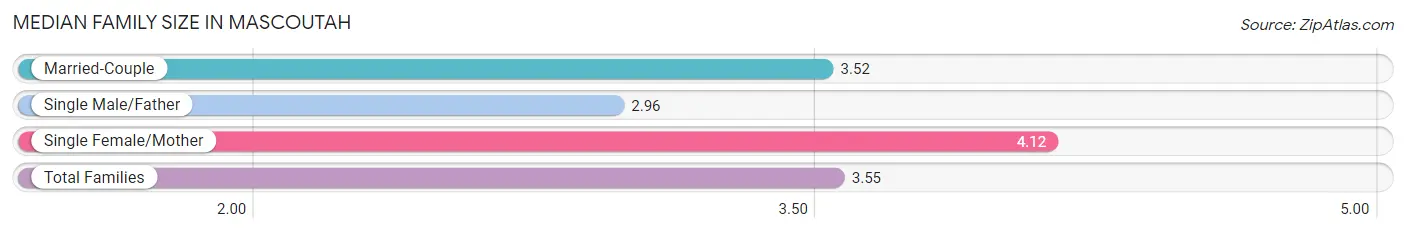
The median family size in Mascoutah is 3.55 persons per family, with single female/mother families (208 | 10.2%) accounting for the largest median family size of 4.12 persons per family. On the other hand, single male/father families (96 | 4.7%) represent the smallest median family size with 2.96 persons per family.
| Family Type | # Families | Family Size |
| Married-Couple | 1,737 (85.1%) | 3.52 |
| Single Male/Father | 96 (4.7%) | 2.96 |
| Single Female/Mother | 208 (10.2%) | 4.12 |
| Total Families | 2,041 (100.0%) | 3.55 |
Median Household Size in Mascoutah
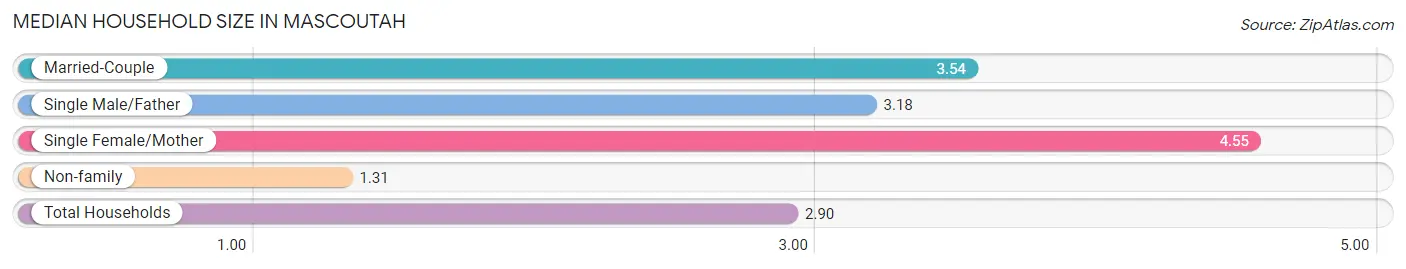
The median household size in Mascoutah is 2.90 persons per household, with single female/mother households (208 | 7.0%) accounting for the largest median household size of 4.55 persons per household. non-family households (943 | 31.6%) represent the smallest median household size with 1.31 persons per household.
| Household Type | # Households | Household Size |
| Married-Couple | 1,737 (58.2%) | 3.54 |
| Single Male/Father | 96 (3.2%) | 3.18 |
| Single Female/Mother | 208 (7.0%) | 4.55 |
| Non-family | 943 (31.6%) | 1.31 |
| Total Households | 2,984 (100.0%) | 2.90 |
Household Size by Marriage Status in Mascoutah
Out of a total of 2,984 households in Mascoutah, 2,041 (68.4%) are family households, while 943 (31.6%) are nonfamily households. The most numerous type of family households are 4-person households, comprising 678, and the most common type of nonfamily households are 1-person households, comprising 709.
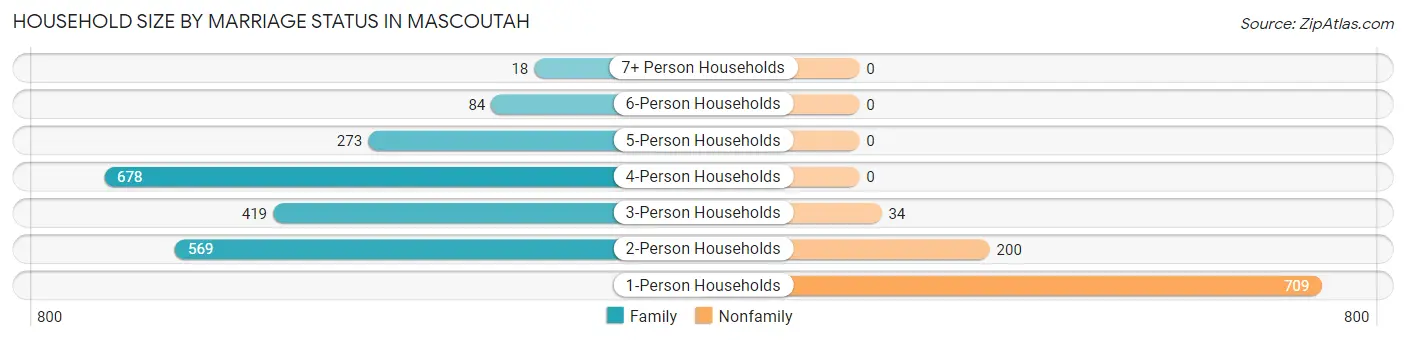
| Household Size | Family Households | Nonfamily Households |
| 1-Person Households | - | 709 (23.8%) |
| 2-Person Households | 569 (19.1%) | 200 (6.7%) |
| 3-Person Households | 419 (14.0%) | 34 (1.1%) |
| 4-Person Households | 678 (22.7%) | 0 (0.0%) |
| 5-Person Households | 273 (9.1%) | 0 (0.0%) |
| 6-Person Households | 84 (2.8%) | 0 (0.0%) |
| 7+ Person Households | 18 (0.6%) | 0 (0.0%) |
| Total | 2,041 (68.4%) | 943 (31.6%) |
Female Fertility in Mascoutah
Fertility by Age in Mascoutah
Average fertility rate in Mascoutah is 69.0 births per 1,000 women. Women in the age bracket of 20 to 34 years have the highest fertility rate with 136.0 births per 1,000 women. Women in the age bracket of 20 to 34 years acount for 92.6% of all women with births.
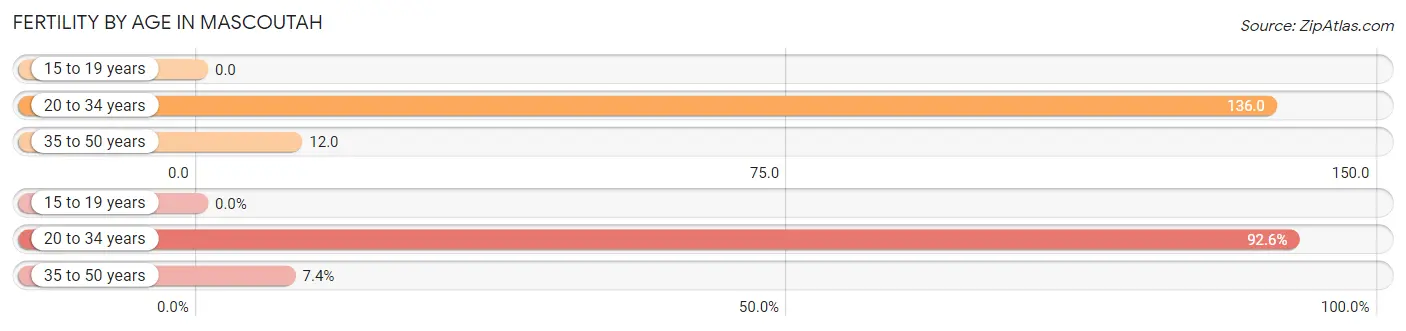
| Age Bracket | Women with Births | Births / 1,000 Women |
| 15 to 19 years | 0 (0.0%) | 0.0 |
| 20 to 34 years | 137 (92.6%) | 136.0 |
| 35 to 50 years | 11 (7.4%) | 12.0 |
| Total | 148 (100.0%) | 69.0 |
Fertility by Age by Marriage Status in Mascoutah
66.9% of women with births (148) in Mascoutah are married. The highest percentage of unmarried women with births falls into 20 to 34 years age bracket with 35.8% of them unmarried at the time of birth, while the lowest percentage of unmarried women with births belong to 35 to 50 years age bracket with 0.0% of them unmarried.
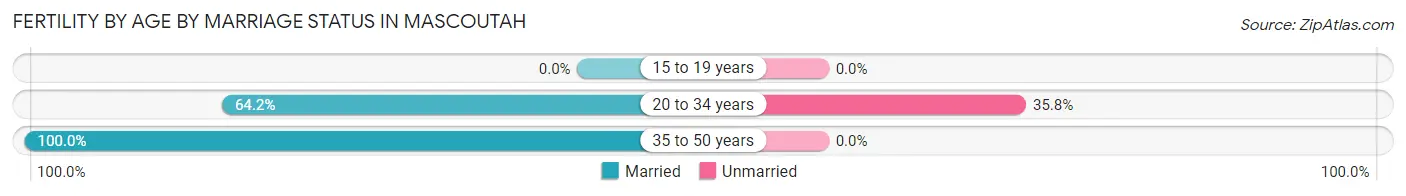
| Age Bracket | Married | Unmarried |
| 15 to 19 years | 0 (0.0%) | 0 (0.0%) |
| 20 to 34 years | 88 (64.2%) | 49 (35.8%) |
| 35 to 50 years | 11 (100.0%) | 0 (0.0%) |
| Total | 99 (66.9%) | 49 (33.1%) |
Fertility by Education in Mascoutah
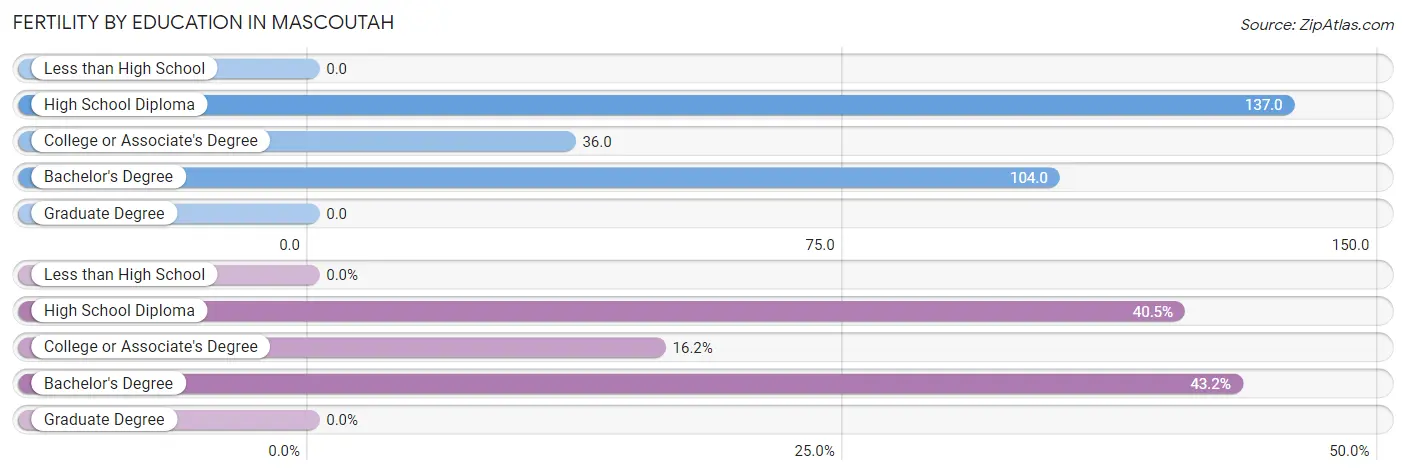
| Educational Attainment | Women with Births | Births / 1,000 Women |
| Less than High School | 0 (0.0%) | 0.0 |
| High School Diploma | 60 (40.5%) | 137.0 |
| College or Associate's Degree | 24 (16.2%) | 36.0 |
| Bachelor's Degree | 64 (43.2%) | 104.0 |
| Graduate Degree | 0 (0.0%) | 0.0 |
| Total | 148 (100.0%) | 69.0 |
Fertility by Education by Marriage Status in Mascoutah
33.1% of women with births in Mascoutah are unmarried. Women with the educational attainment of college or associate's degree are most likely to be married with 100.0% of them married at childbirth, while women with the educational attainment of high school diploma are least likely to be married with 81.7% of them unmarried at childbirth.
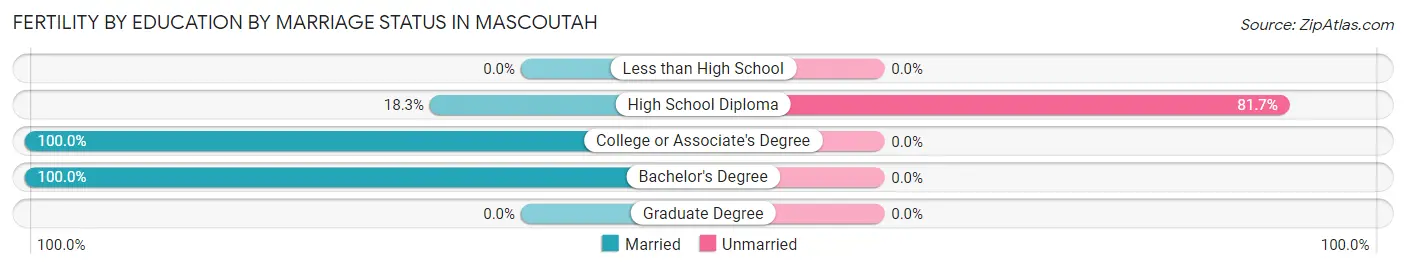
| Educational Attainment | Married | Unmarried |
| Less than High School | 0 (0.0%) | 0 (0.0%) |
| High School Diploma | 11 (18.3%) | 49 (81.7%) |
| College or Associate's Degree | 24 (100.0%) | 0 (0.0%) |
| Bachelor's Degree | 64 (100.0%) | 0 (0.0%) |
| Graduate Degree | 0 (0.0%) | 0 (0.0%) |
| Total | 99 (66.9%) | 49 (33.1%) |
Employment Characteristics in Mascoutah
Employment by Class of Employer in Mascoutah
Among the 4,596 employed individuals in Mascoutah, private company employees (2,831 | 61.6%), federal government employees (629 | 13.7%), and not-for-profit organizations (497 | 10.8%) make up the most common classes of employment.
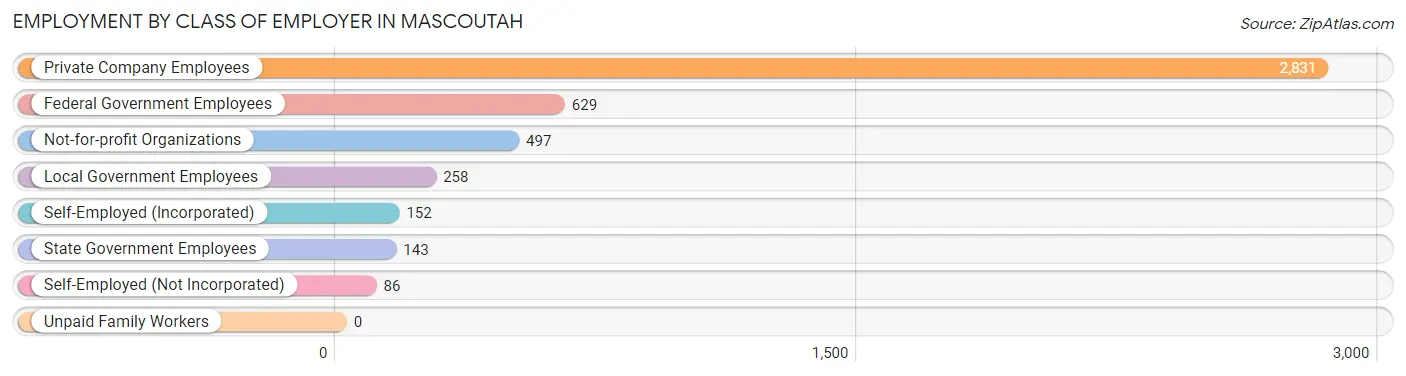
| Employer Class | # Employees | % Employees |
| Private Company Employees | 2,831 | 61.6% |
| Self-Employed (Incorporated) | 152 | 3.3% |
| Self-Employed (Not Incorporated) | 86 | 1.9% |
| Not-for-profit Organizations | 497 | 10.8% |
| Local Government Employees | 258 | 5.6% |
| State Government Employees | 143 | 3.1% |
| Federal Government Employees | 629 | 13.7% |
| Unpaid Family Workers | 0 | 0.0% |
| Total | 4,596 | 100.0% |
Employment Status by Age in Mascoutah
According to the labor force statistics for Mascoutah, out of the total population over 16 years of age (6,731), 72.2% or 4,860 individuals are in the labor force, with 4.5% or 219 of them unemployed. The age group with the highest labor force participation rate is 30 to 34 years, with 91.0% or 533 individuals in the labor force. Within the labor force, the 35 to 44 years age range has the highest percentage of unemployed individuals, with 13.9% or 177 of them being unemployed.
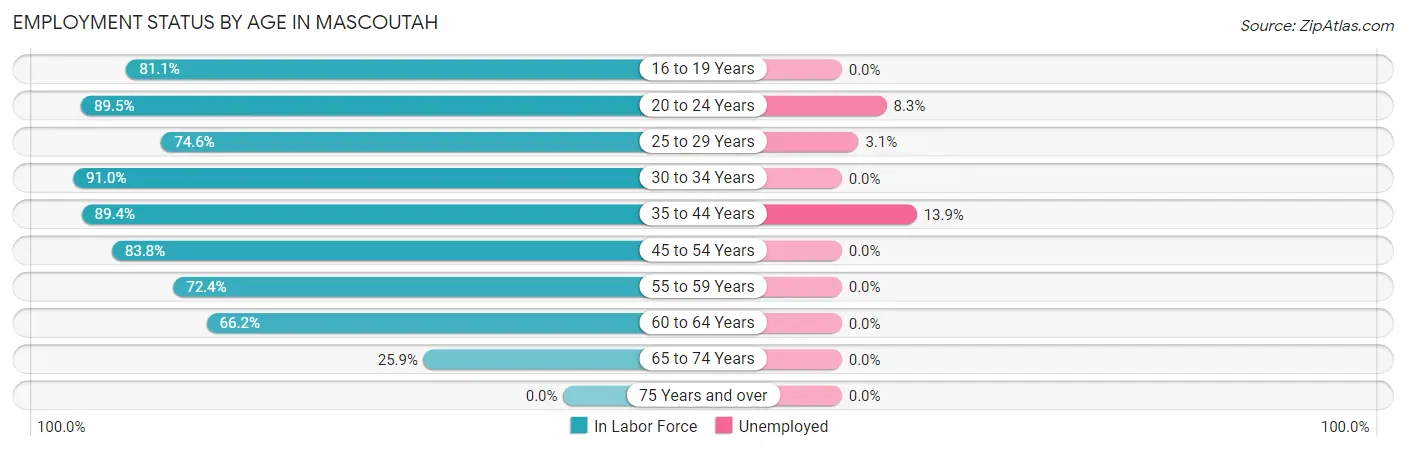
| Age Bracket | In Labor Force | Unemployed |
| 16 to 19 Years | 322 (81.1%) | 0 (0.0%) |
| 20 to 24 Years | 504 (89.5%) | 42 (8.3%) |
| 25 to 29 Years | 432 (74.6%) | 13 (3.1%) |
| 30 to 34 Years | 533 (91.0%) | 0 (0.0%) |
| 35 to 44 Years | 1,271 (89.4%) | 177 (13.9%) |
| 45 to 54 Years | 821 (83.8%) | 0 (0.0%) |
| 55 to 59 Years | 499 (72.4%) | 0 (0.0%) |
| 60 to 64 Years | 304 (66.2%) | 0 (0.0%) |
| 65 to 74 Years | 174 (25.9%) | 0 (0.0%) |
| 75 Years and over | 0 (0.0%) | 0 (0.0%) |
| Total | 4,860 (72.2%) | 219 (4.5%) |
Employment Status by Educational Attainment in Mascoutah
According to labor force statistics for Mascoutah, 81.9% of individuals (3,862) out of the total population between 25 and 64 years of age (4,715) are in the labor force, with 4.6% or 178 of them being unemployed. The group with the highest labor force participation rate are those with the educational attainment of bachelor's degree or higher, with 88.8% or 1,502 individuals in the labor force. Within the labor force, individuals with high school diploma education have the highest percentage of unemployment, with 17.8% or 155 of them being unemployed.
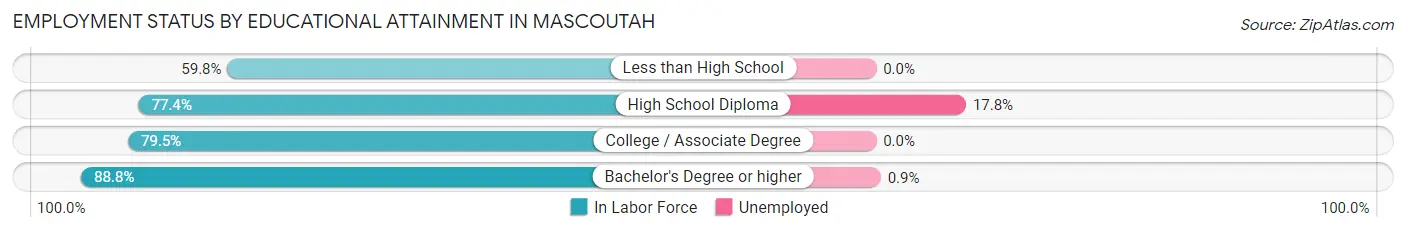
| Educational Attainment | In Labor Force | Unemployed |
| Less than High School | 70 (59.8%) | 0 (0.0%) |
| High School Diploma | 870 (77.4%) | 200 (17.8%) |
| College / Associate Degree | 1,417 (79.5%) | 0 (0.0%) |
| Bachelor's Degree or higher | 1,502 (88.8%) | 15 (0.9%) |
| Total | 3,862 (81.9%) | 217 (4.6%) |
Employment Occupations by Sex in Mascoutah
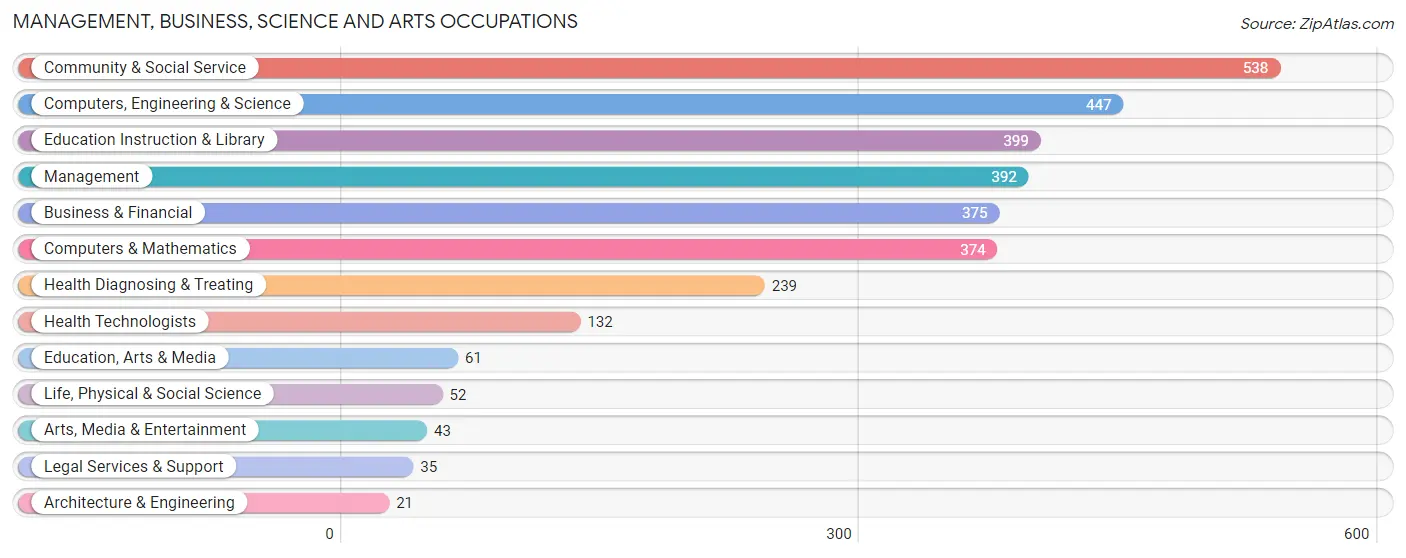
Management, Business, Science and Arts Occupations
The most common Management, Business, Science and Arts occupations in Mascoutah are Community & Social Service (538 | 12.3%), Computers, Engineering & Science (447 | 10.2%), Education Instruction & Library (399 | 9.1%), Management (392 | 8.9%), and Business & Financial (375 | 8.6%).
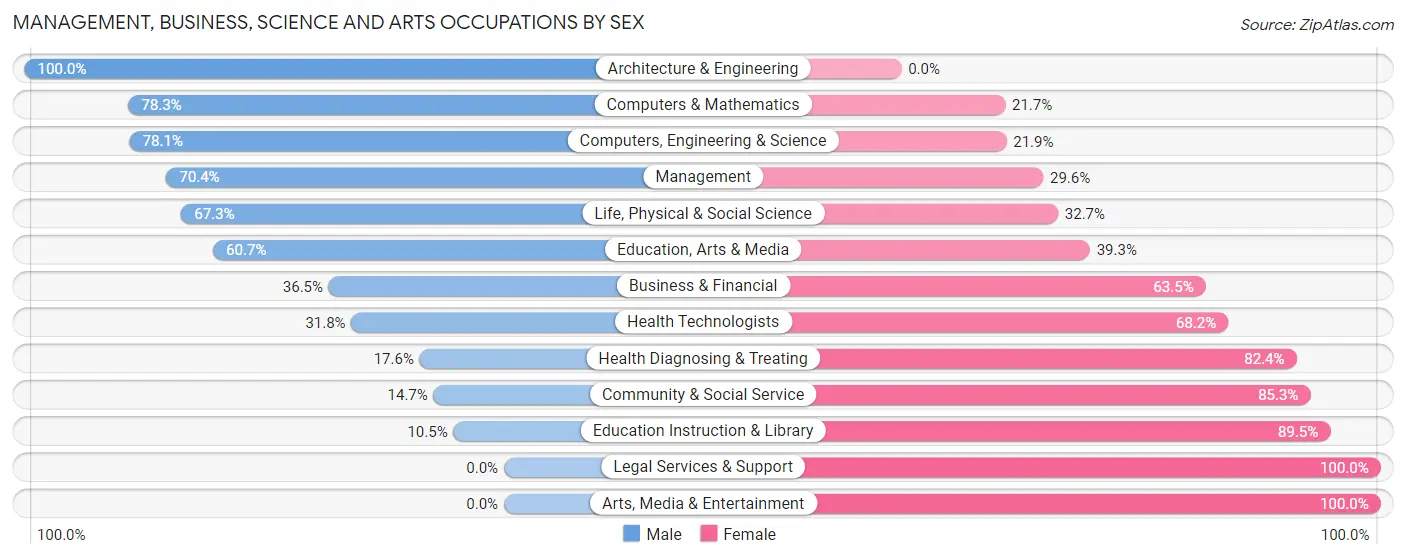
Management, Business, Science and Arts Occupations by Sex
Within the Management, Business, Science and Arts occupations in Mascoutah, the most male-oriented occupations are Architecture & Engineering (100.0%), Computers & Mathematics (78.3%), and Computers, Engineering & Science (78.1%), while the most female-oriented occupations are Legal Services & Support (100.0%), Arts, Media & Entertainment (100.0%), and Education Instruction & Library (89.5%).
| Occupation | Male | Female |
| Management | 276 (70.4%) | 116 (29.6%) |
| Business & Financial | 137 (36.5%) | 238 (63.5%) |
| Computers, Engineering & Science | 349 (78.1%) | 98 (21.9%) |
| Computers & Mathematics | 293 (78.3%) | 81 (21.7%) |
| Architecture & Engineering | 21 (100.0%) | 0 (0.0%) |
| Life, Physical & Social Science | 35 (67.3%) | 17 (32.7%) |
| Community & Social Service | 79 (14.7%) | 459 (85.3%) |
| Education, Arts & Media | 37 (60.7%) | 24 (39.3%) |
| Legal Services & Support | 0 (0.0%) | 35 (100.0%) |
| Education Instruction & Library | 42 (10.5%) | 357 (89.5%) |
| Arts, Media & Entertainment | 0 (0.0%) | 43 (100.0%) |
| Health Diagnosing & Treating | 42 (17.6%) | 197 (82.4%) |
| Health Technologists | 42 (31.8%) | 90 (68.2%) |
| Total (Category) | 883 (44.4%) | 1,108 (55.6%) |
| Total (Overall) | 2,167 (49.4%) | 2,219 (50.6%) |
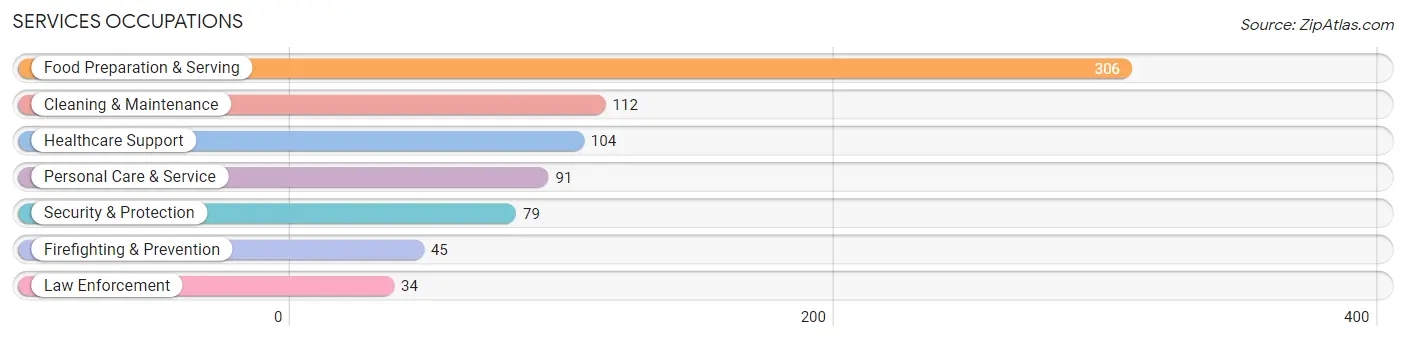
Services Occupations
The most common Services occupations in Mascoutah are Food Preparation & Serving (306 | 7.0%), Cleaning & Maintenance (112 | 2.5%), Healthcare Support (104 | 2.4%), Personal Care & Service (91 | 2.1%), and Security & Protection (79 | 1.8%).
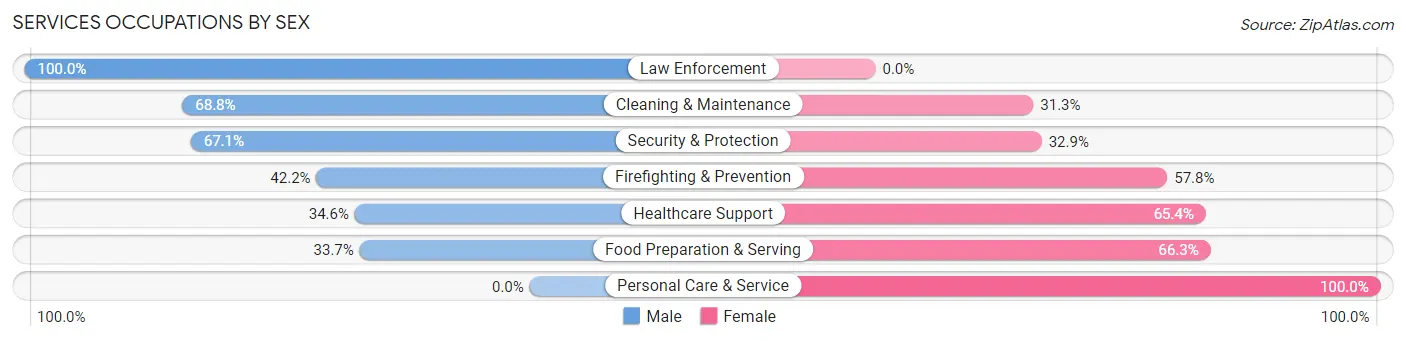
Services Occupations by Sex
Within the Services occupations in Mascoutah, the most male-oriented occupations are Law Enforcement (100.0%), Cleaning & Maintenance (68.8%), and Security & Protection (67.1%), while the most female-oriented occupations are Personal Care & Service (100.0%), Food Preparation & Serving (66.3%), and Healthcare Support (65.4%).
| Occupation | Male | Female |
| Healthcare Support | 36 (34.6%) | 68 (65.4%) |
| Security & Protection | 53 (67.1%) | 26 (32.9%) |
| Firefighting & Prevention | 19 (42.2%) | 26 (57.8%) |
| Law Enforcement | 34 (100.0%) | 0 (0.0%) |
| Food Preparation & Serving | 103 (33.7%) | 203 (66.3%) |
| Cleaning & Maintenance | 77 (68.8%) | 35 (31.2%) |
| Personal Care & Service | 0 (0.0%) | 91 (100.0%) |
| Total (Category) | 269 (38.9%) | 423 (61.1%) |
| Total (Overall) | 2,167 (49.4%) | 2,219 (50.6%) |
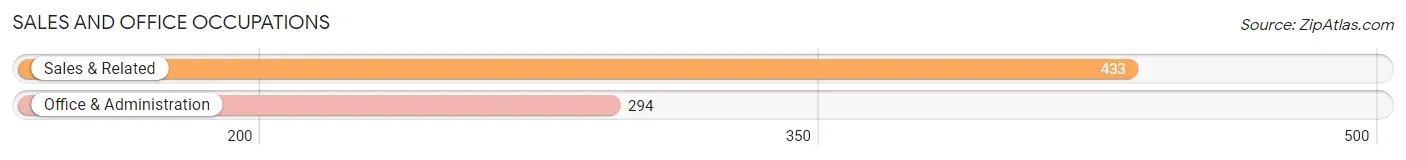
Sales and Office Occupations
The most common Sales and Office occupations in Mascoutah are Sales & Related (433 | 9.9%), and Office & Administration (294 | 6.7%).
Sales and Office Occupations by Sex
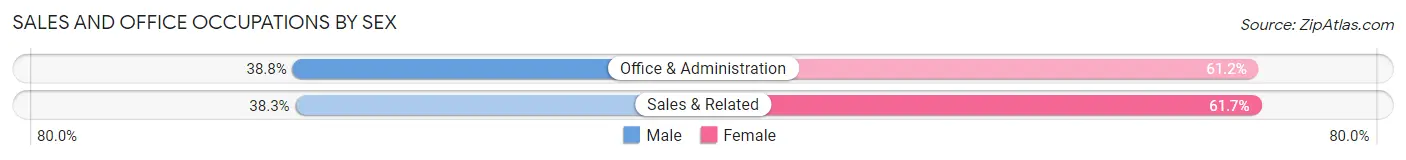
| Occupation | Male | Female |
| Sales & Related | 166 (38.3%) | 267 (61.7%) |
| Office & Administration | 114 (38.8%) | 180 (61.2%) |
| Total (Category) | 280 (38.5%) | 447 (61.5%) |
| Total (Overall) | 2,167 (49.4%) | 2,219 (50.6%) |
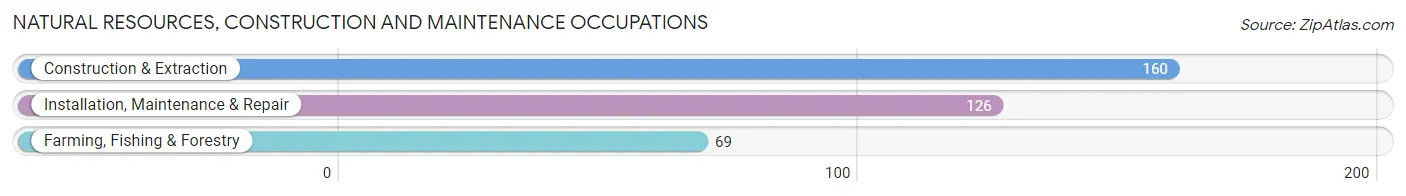
Natural Resources, Construction and Maintenance Occupations
The most common Natural Resources, Construction and Maintenance occupations in Mascoutah are Construction & Extraction (160 | 3.6%), Installation, Maintenance & Repair (126 | 2.9%), and Farming, Fishing & Forestry (69 | 1.6%).
Natural Resources, Construction and Maintenance Occupations by Sex
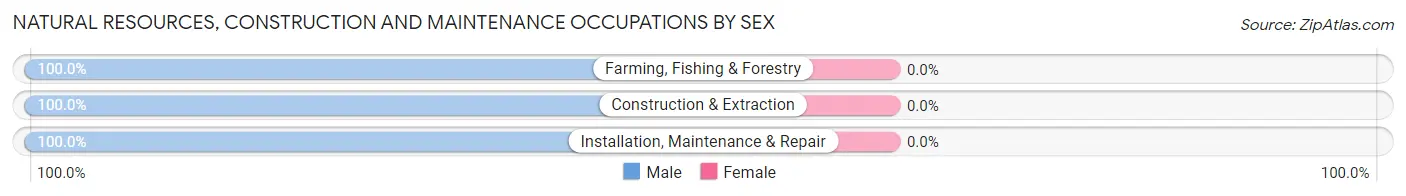
| Occupation | Male | Female |
| Farming, Fishing & Forestry | 69 (100.0%) | 0 (0.0%) |
| Construction & Extraction | 160 (100.0%) | 0 (0.0%) |
| Installation, Maintenance & Repair | 126 (100.0%) | 0 (0.0%) |
| Total (Category) | 355 (100.0%) | 0 (0.0%) |
| Total (Overall) | 2,167 (49.4%) | 2,219 (50.6%) |
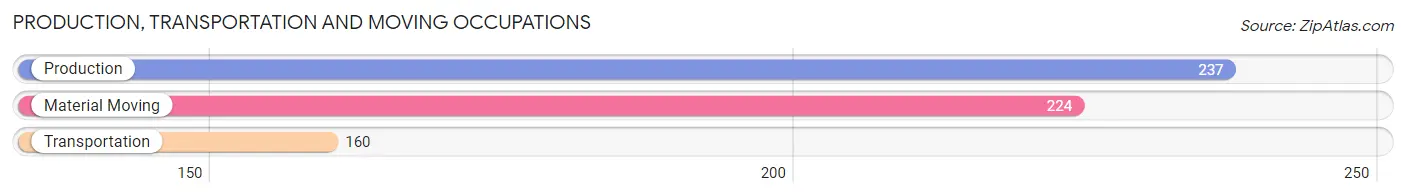
Production, Transportation and Moving Occupations
The most common Production, Transportation and Moving occupations in Mascoutah are Production (237 | 5.4%), Material Moving (224 | 5.1%), and Transportation (160 | 3.6%).
Production, Transportation and Moving Occupations by Sex
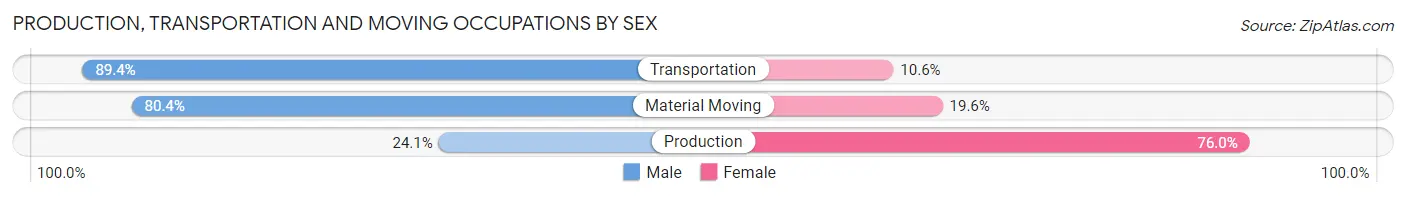
| Occupation | Male | Female |
| Production | 57 (24.0%) | 180 (75.9%) |
| Transportation | 143 (89.4%) | 17 (10.6%) |
| Material Moving | 180 (80.4%) | 44 (19.6%) |
| Total (Category) | 380 (61.2%) | 241 (38.8%) |
| Total (Overall) | 2,167 (49.4%) | 2,219 (50.6%) |
Employment Industries by Sex in Mascoutah
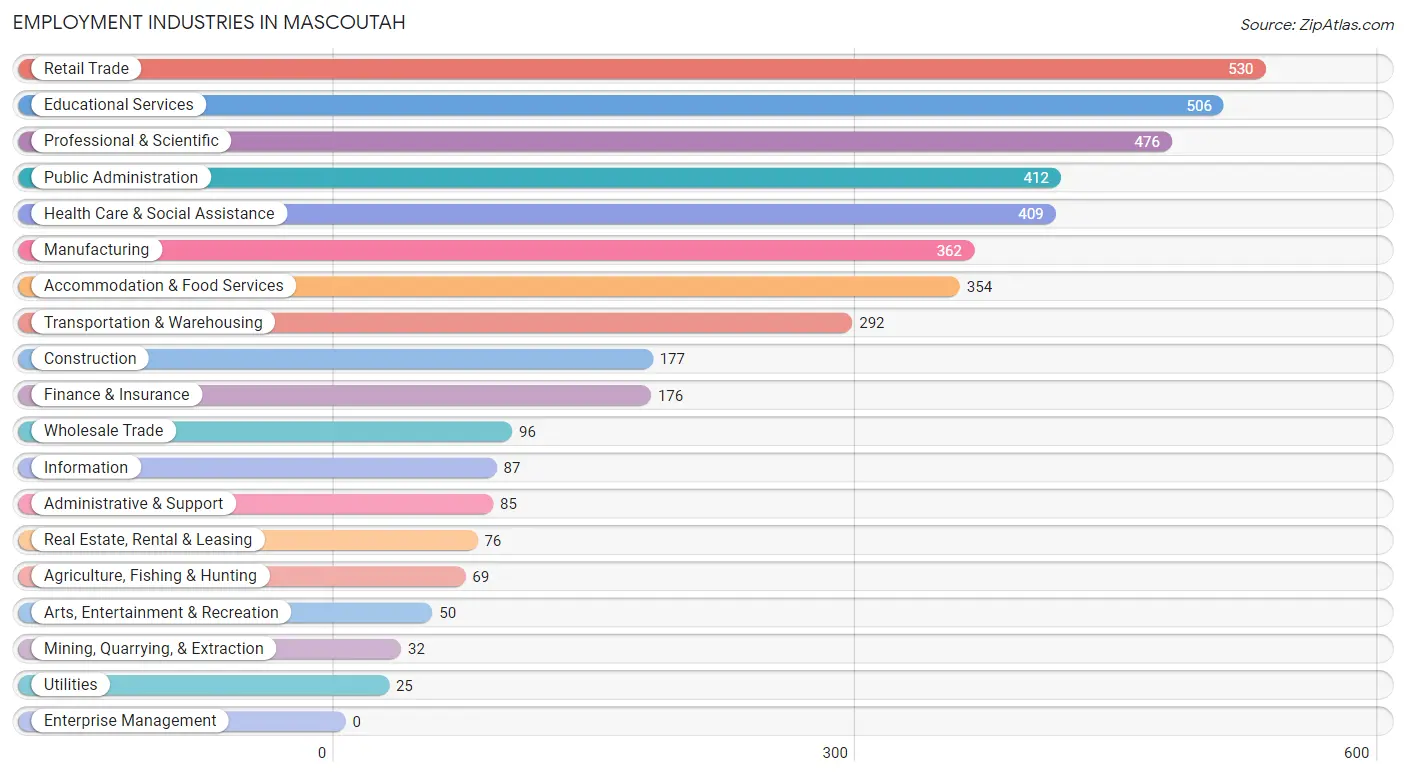
Employment Industries in Mascoutah
The major employment industries in Mascoutah include Retail Trade (530 | 12.1%), Educational Services (506 | 11.5%), Professional & Scientific (476 | 10.8%), Public Administration (412 | 9.4%), and Health Care & Social Assistance (409 | 9.3%).
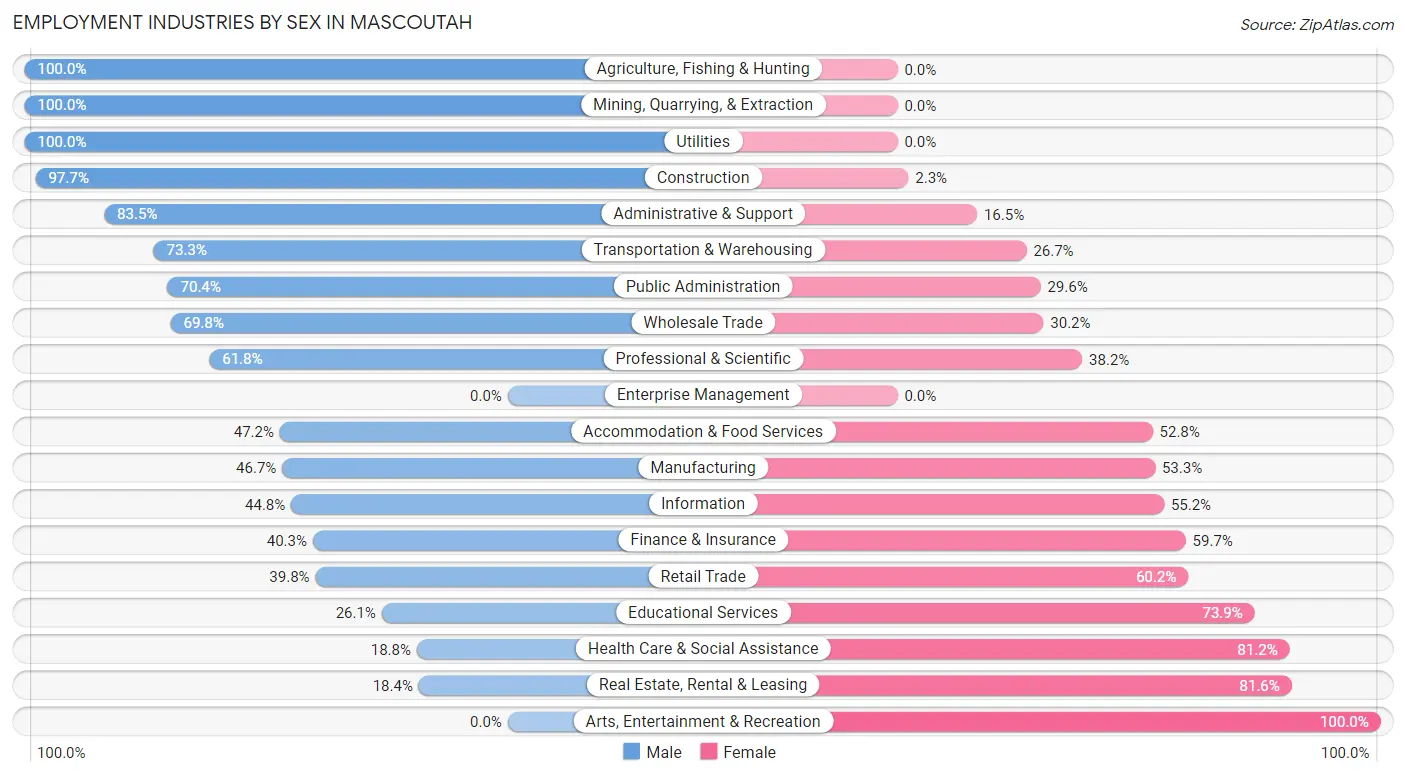
Employment Industries by Sex in Mascoutah
The Mascoutah industries that see more men than women are Agriculture, Fishing & Hunting (100.0%), Mining, Quarrying, & Extraction (100.0%), and Utilities (100.0%), whereas the industries that tend to have a higher number of women are Arts, Entertainment & Recreation (100.0%), Real Estate, Rental & Leasing (81.6%), and Health Care & Social Assistance (81.2%).
| Industry | Male | Female |
| Agriculture, Fishing & Hunting | 69 (100.0%) | 0 (0.0%) |
| Mining, Quarrying, & Extraction | 32 (100.0%) | 0 (0.0%) |
| Construction | 173 (97.7%) | 4 (2.3%) |
| Manufacturing | 169 (46.7%) | 193 (53.3%) |
| Wholesale Trade | 67 (69.8%) | 29 (30.2%) |
| Retail Trade | 211 (39.8%) | 319 (60.2%) |
| Transportation & Warehousing | 214 (73.3%) | 78 (26.7%) |
| Utilities | 25 (100.0%) | 0 (0.0%) |
| Information | 39 (44.8%) | 48 (55.2%) |
| Finance & Insurance | 71 (40.3%) | 105 (59.7%) |
| Real Estate, Rental & Leasing | 14 (18.4%) | 62 (81.6%) |
| Professional & Scientific | 294 (61.8%) | 182 (38.2%) |
| Enterprise Management | 0 (0.0%) | 0 (0.0%) |
| Administrative & Support | 71 (83.5%) | 14 (16.5%) |
| Educational Services | 132 (26.1%) | 374 (73.9%) |
| Health Care & Social Assistance | 77 (18.8%) | 332 (81.2%) |
| Arts, Entertainment & Recreation | 0 (0.0%) | 50 (100.0%) |
| Accommodation & Food Services | 167 (47.2%) | 187 (52.8%) |
| Public Administration | 290 (70.4%) | 122 (29.6%) |
| Total | 2,167 (49.4%) | 2,219 (50.6%) |
Education in Mascoutah
School Enrollment in Mascoutah
The most common levels of schooling among the 2,356 students in Mascoutah are elementary school (610 | 25.9%), middle school (515 | 21.9%), and high school (401 | 17.0%).
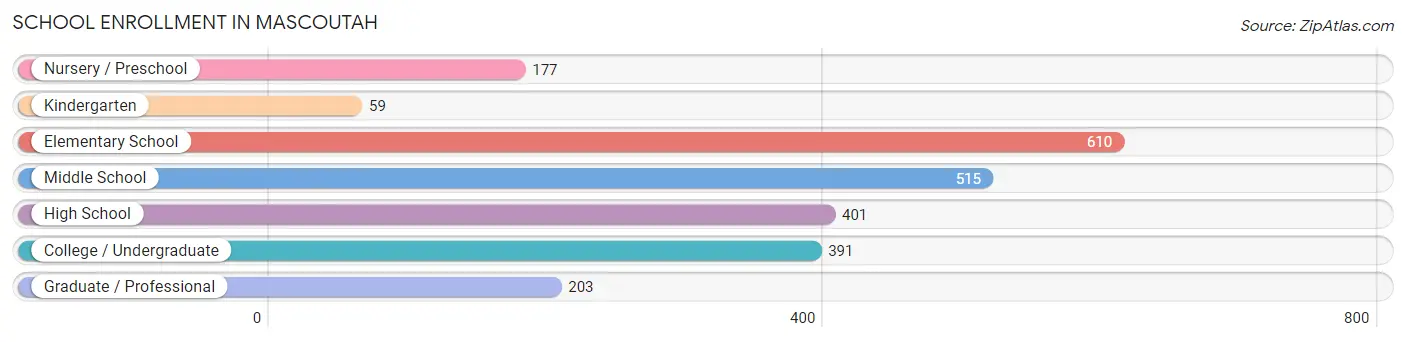
| School Level | # Students | % Students |
| Nursery / Preschool | 177 | 7.5% |
| Kindergarten | 59 | 2.5% |
| Elementary School | 610 | 25.9% |
| Middle School | 515 | 21.9% |
| High School | 401 | 17.0% |
| College / Undergraduate | 391 | 16.6% |
| Graduate / Professional | 203 | 8.6% |
| Total | 2,356 | 100.0% |
School Enrollment by Age by Funding Source in Mascoutah
Out of a total of 2,356 students who are enrolled in schools in Mascoutah, 349 (14.8%) attend a private institution, while the remaining 2,007 (85.2%) are enrolled in public schools. The age group of 3 to 4 year olds has the highest likelihood of being enrolled in private schools, with 45 (31.2% in the age bracket) enrolled. Conversely, the age group of 35 years and over has the lowest likelihood of being enrolled in a private school, with 75 (100.0% in the age bracket) attending a public institution.
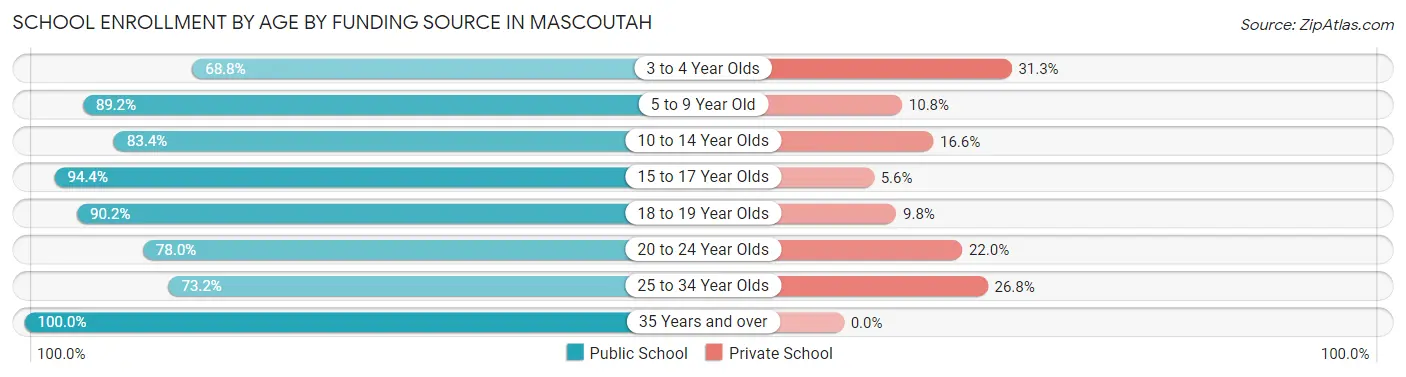
| Age Bracket | Public School | Private School |
| 3 to 4 Year Olds | 99 (68.8%) | 45 (31.2%) |
| 5 to 9 Year Old | 584 (89.2%) | 71 (10.8%) |
| 10 to 14 Year Olds | 461 (83.4%) | 92 (16.6%) |
| 15 to 17 Year Olds | 320 (94.4%) | 19 (5.6%) |
| 18 to 19 Year Olds | 120 (90.2%) | 13 (9.8%) |
| 20 to 24 Year Olds | 237 (78.0%) | 67 (22.0%) |
| 25 to 34 Year Olds | 112 (73.2%) | 41 (26.8%) |
| 35 Years and over | 75 (100.0%) | 0 (0.0%) |
| Total | 2,007 (85.2%) | 349 (14.8%) |
Educational Attainment by Field of Study in Mascoutah
Business (456 | 23.0%), education (312 | 15.8%), science & technology (201 | 10.2%), arts & humanities (187 | 9.4%), and computers & mathematics (155 | 7.8%) are the most common fields of study among 1,981 individuals in Mascoutah who have obtained a bachelor's degree or higher.
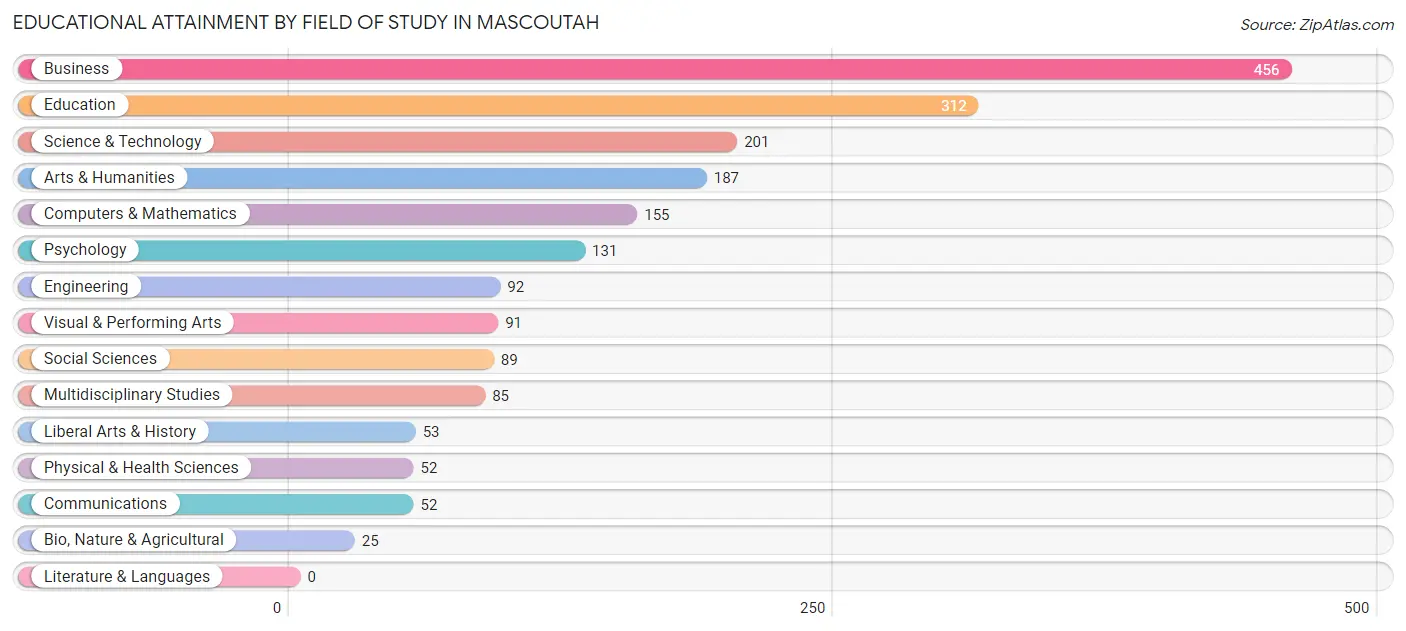
| Field of Study | # Graduates | % Graduates |
| Computers & Mathematics | 155 | 7.8% |
| Bio, Nature & Agricultural | 25 | 1.3% |
| Physical & Health Sciences | 52 | 2.6% |
| Psychology | 131 | 6.6% |
| Social Sciences | 89 | 4.5% |
| Engineering | 92 | 4.6% |
| Multidisciplinary Studies | 85 | 4.3% |
| Science & Technology | 201 | 10.2% |
| Business | 456 | 23.0% |
| Education | 312 | 15.8% |
| Literature & Languages | 0 | 0.0% |
| Liberal Arts & History | 53 | 2.7% |
| Visual & Performing Arts | 91 | 4.6% |
| Communications | 52 | 2.6% |
| Arts & Humanities | 187 | 9.4% |
| Total | 1,981 | 100.0% |
Transportation & Commute in Mascoutah
Vehicle Availability by Sex in Mascoutah
The most prevalent vehicle ownership categories in Mascoutah are males with 2 vehicles (1,046, accounting for 44.1%) and females with 2 vehicles (964, making up 47.0%).
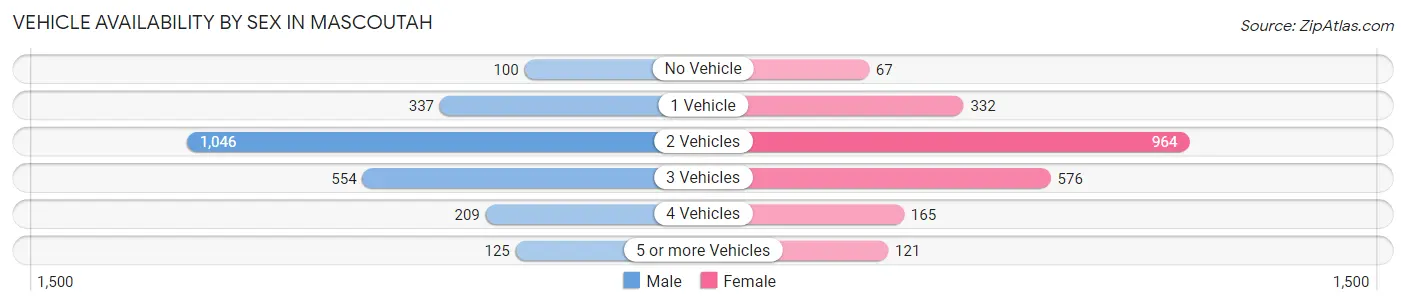
| Vehicles Available | Male | Female |
| No Vehicle | 100 (4.2%) | 67 (3.0%) |
| 1 Vehicle | 337 (14.2%) | 332 (14.9%) |
| 2 Vehicles | 1,046 (44.1%) | 964 (43.3%) |
| 3 Vehicles | 554 (23.4%) | 576 (25.9%) |
| 4 Vehicles | 209 (8.8%) | 165 (7.4%) |
| 5 or more Vehicles | 125 (5.3%) | 121 (5.4%) |
| Total | 2,371 (100.0%) | 2,225 (100.0%) |
Commute Time in Mascoutah
The most frequently occuring commute durations in Mascoutah are 15 to 19 minutes (833 commuters, 19.5%), 5 to 9 minutes (611 commuters, 14.3%), and 20 to 24 minutes (549 commuters, 12.8%).
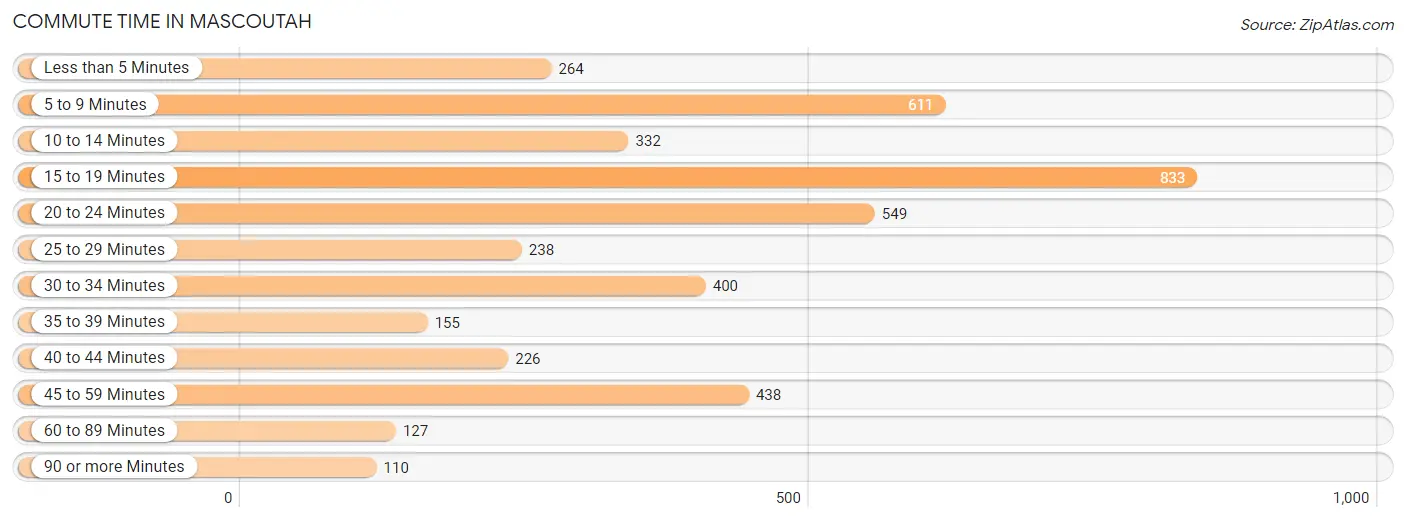
| Commute Time | # Commuters | % Commuters |
| Less than 5 Minutes | 264 | 6.2% |
| 5 to 9 Minutes | 611 | 14.3% |
| 10 to 14 Minutes | 332 | 7.7% |
| 15 to 19 Minutes | 833 | 19.5% |
| 20 to 24 Minutes | 549 | 12.8% |
| 25 to 29 Minutes | 238 | 5.6% |
| 30 to 34 Minutes | 400 | 9.3% |
| 35 to 39 Minutes | 155 | 3.6% |
| 40 to 44 Minutes | 226 | 5.3% |
| 45 to 59 Minutes | 438 | 10.2% |
| 60 to 89 Minutes | 127 | 3.0% |
| 90 or more Minutes | 110 | 2.6% |
Commute Time by Sex in Mascoutah
The most common commute times in Mascoutah are 15 to 19 minutes (473 commuters, 21.6%) for males and 5 to 9 minutes (380 commuters, 18.1%) for females.
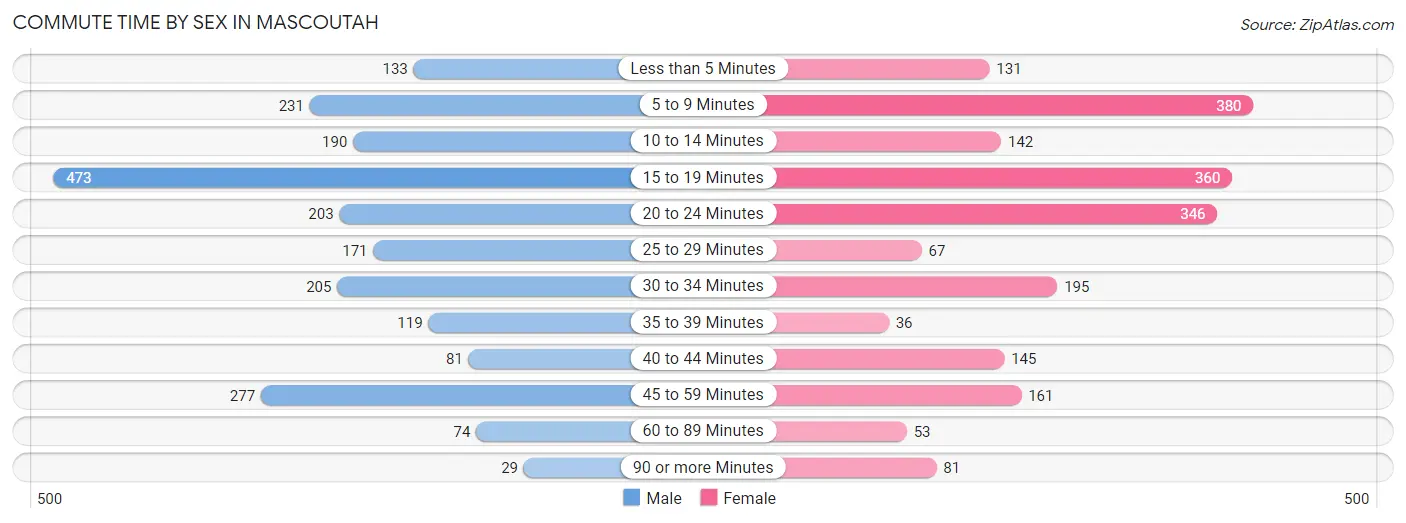
| Commute Time | Male | Female |
| Less than 5 Minutes | 133 (6.1%) | 131 (6.2%) |
| 5 to 9 Minutes | 231 (10.6%) | 380 (18.1%) |
| 10 to 14 Minutes | 190 (8.7%) | 142 (6.8%) |
| 15 to 19 Minutes | 473 (21.6%) | 360 (17.2%) |
| 20 to 24 Minutes | 203 (9.3%) | 346 (16.5%) |
| 25 to 29 Minutes | 171 (7.8%) | 67 (3.2%) |
| 30 to 34 Minutes | 205 (9.4%) | 195 (9.3%) |
| 35 to 39 Minutes | 119 (5.4%) | 36 (1.7%) |
| 40 to 44 Minutes | 81 (3.7%) | 145 (6.9%) |
| 45 to 59 Minutes | 277 (12.7%) | 161 (7.7%) |
| 60 to 89 Minutes | 74 (3.4%) | 53 (2.5%) |
| 90 or more Minutes | 29 (1.3%) | 81 (3.9%) |
Time of Departure to Work by Sex in Mascoutah
The most frequent times of departure to work in Mascoutah are 7:00 AM to 7:29 AM (458, 20.9%) for males and 7:00 AM to 7:29 AM (515, 24.6%) for females.
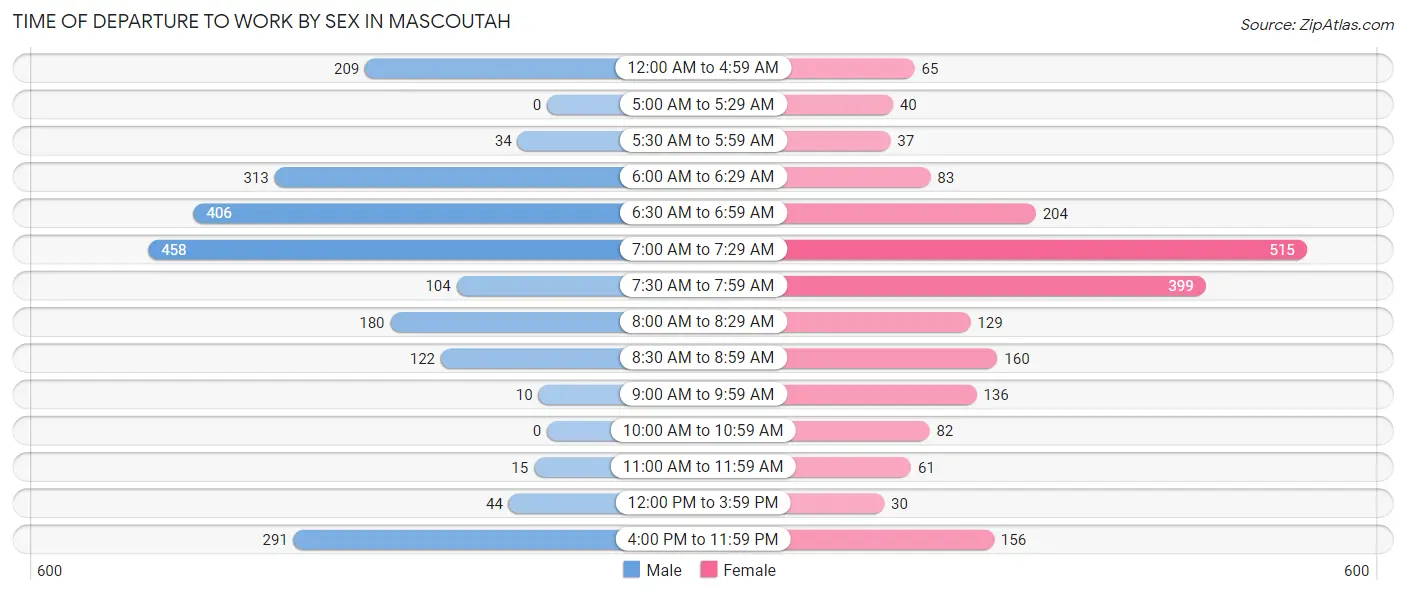
| Time of Departure | Male | Female |
| 12:00 AM to 4:59 AM | 209 (9.6%) | 65 (3.1%) |
| 5:00 AM to 5:29 AM | 0 (0.0%) | 40 (1.9%) |
| 5:30 AM to 5:59 AM | 34 (1.6%) | 37 (1.8%) |
| 6:00 AM to 6:29 AM | 313 (14.3%) | 83 (4.0%) |
| 6:30 AM to 6:59 AM | 406 (18.6%) | 204 (9.7%) |
| 7:00 AM to 7:29 AM | 458 (20.9%) | 515 (24.6%) |
| 7:30 AM to 7:59 AM | 104 (4.8%) | 399 (19.0%) |
| 8:00 AM to 8:29 AM | 180 (8.2%) | 129 (6.1%) |
| 8:30 AM to 8:59 AM | 122 (5.6%) | 160 (7.6%) |
| 9:00 AM to 9:59 AM | 10 (0.5%) | 136 (6.5%) |
| 10:00 AM to 10:59 AM | 0 (0.0%) | 82 (3.9%) |
| 11:00 AM to 11:59 AM | 15 (0.7%) | 61 (2.9%) |
| 12:00 PM to 3:59 PM | 44 (2.0%) | 30 (1.4%) |
| 4:00 PM to 11:59 PM | 291 (13.3%) | 156 (7.4%) |
| Total | 2,186 (100.0%) | 2,097 (100.0%) |
Housing Occupancy in Mascoutah
Occupancy by Ownership in Mascoutah
Of the total 2,984 dwellings in Mascoutah, owner-occupied units account for 2,123 (71.2%), while renter-occupied units make up 861 (28.8%).
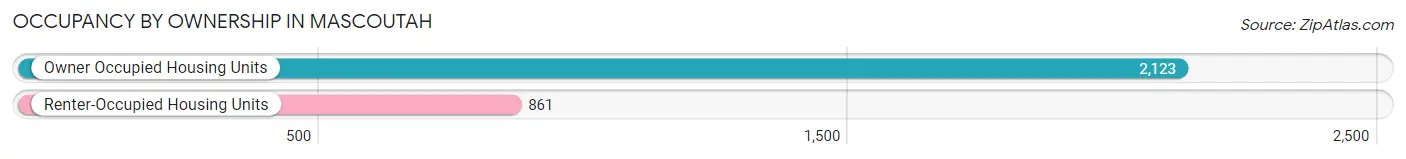
| Occupancy | # Housing Units | % Housing Units |
| Owner Occupied Housing Units | 2,123 | 71.2% |
| Renter-Occupied Housing Units | 861 | 28.8% |
| Total Occupied Housing Units | 2,984 | 100.0% |
Occupancy by Household Size in Mascoutah
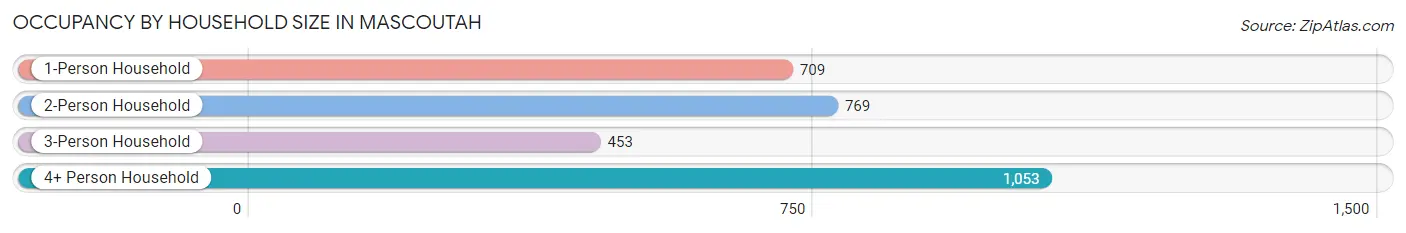
| Household Size | # Housing Units | % Housing Units |
| 1-Person Household | 709 | 23.8% |
| 2-Person Household | 769 | 25.8% |
| 3-Person Household | 453 | 15.2% |
| 4+ Person Household | 1,053 | 35.3% |
| Total Housing Units | 2,984 | 100.0% |
Occupancy by Ownership by Household Size in Mascoutah
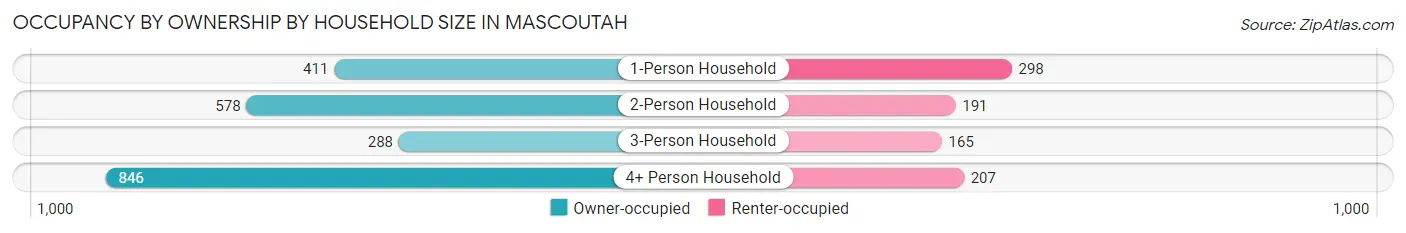
| Household Size | Owner-occupied | Renter-occupied |
| 1-Person Household | 411 (58.0%) | 298 (42.0%) |
| 2-Person Household | 578 (75.2%) | 191 (24.8%) |
| 3-Person Household | 288 (63.6%) | 165 (36.4%) |
| 4+ Person Household | 846 (80.3%) | 207 (19.7%) |
| Total Housing Units | 2,123 (71.2%) | 861 (28.8%) |
Occupancy by Educational Attainment in Mascoutah
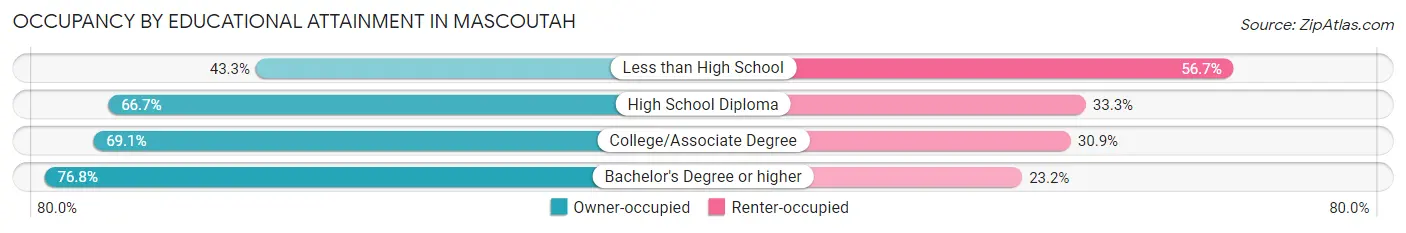
| Household Size | Owner-occupied | Renter-occupied |
| Less than High School | 26 (43.3%) | 34 (56.7%) |
| High School Diploma | 361 (66.7%) | 180 (33.3%) |
| College/Associate Degree | 850 (69.1%) | 380 (30.9%) |
| Bachelor's Degree or higher | 886 (76.8%) | 267 (23.2%) |
Occupancy by Age of Householder in Mascoutah
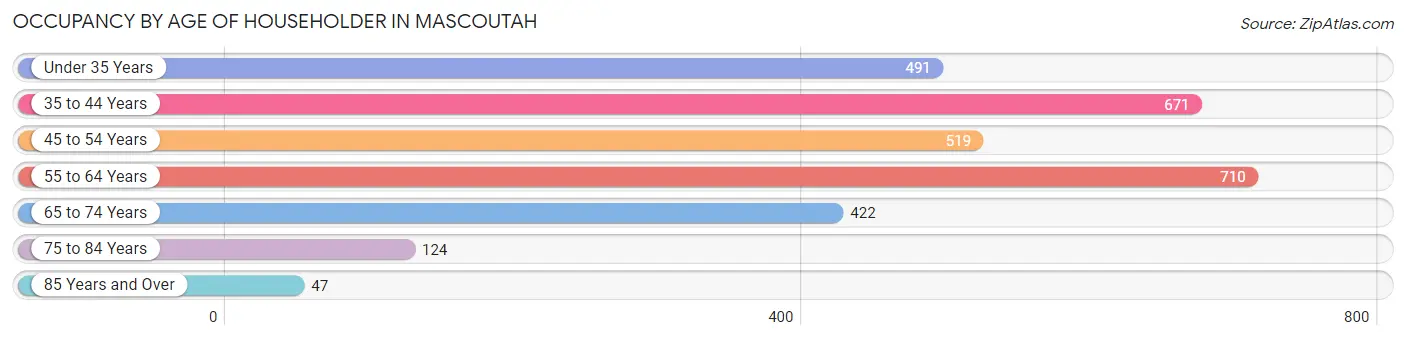
| Age Bracket | # Households | % Households |
| Under 35 Years | 491 | 16.5% |
| 35 to 44 Years | 671 | 22.5% |
| 45 to 54 Years | 519 | 17.4% |
| 55 to 64 Years | 710 | 23.8% |
| 65 to 74 Years | 422 | 14.1% |
| 75 to 84 Years | 124 | 4.2% |
| 85 Years and Over | 47 | 1.6% |
| Total | 2,984 | 100.0% |
Housing Finances in Mascoutah
Median Income by Occupancy in Mascoutah
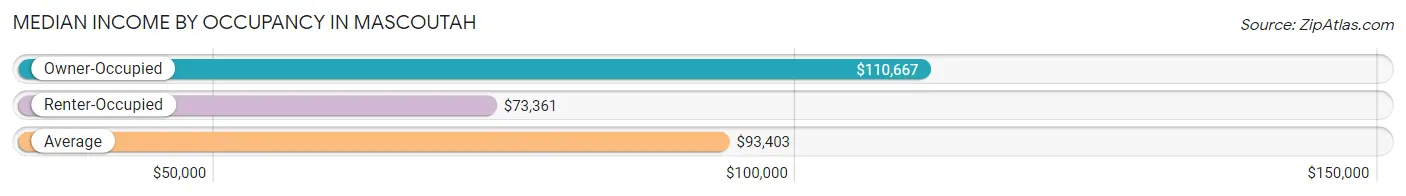
| Occupancy Type | # Households | Median Income |
| Owner-Occupied | 2,123 (71.2%) | $110,667 |
| Renter-Occupied | 861 (28.8%) | $73,361 |
| Average | 2,984 (100.0%) | $93,403 |
Occupancy by Householder Income Bracket in Mascoutah
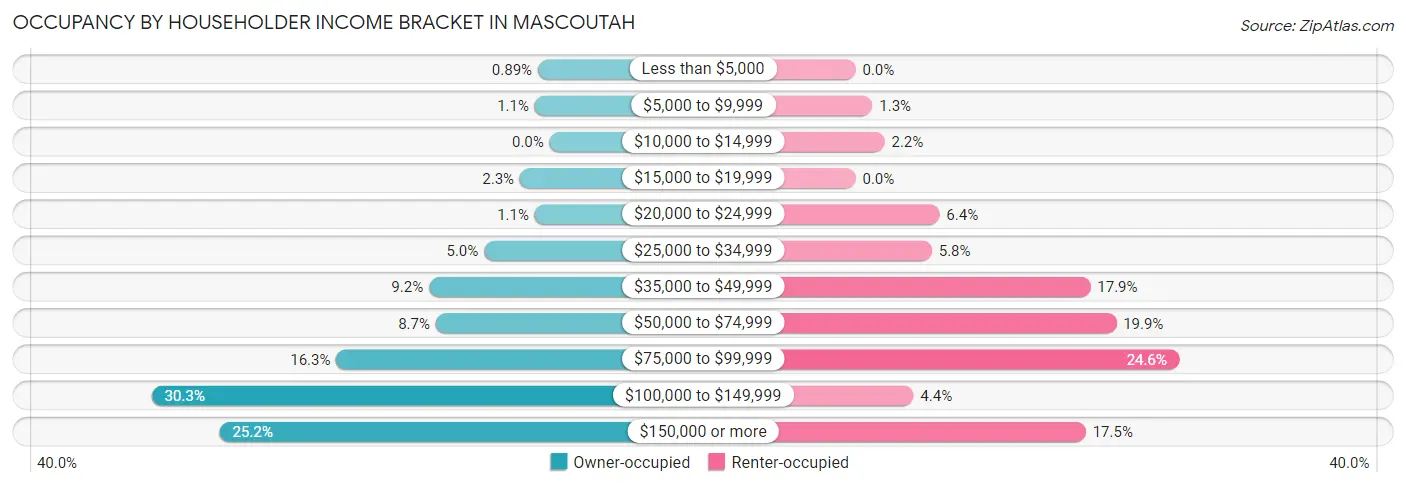
| Income Bracket | Owner-occupied | Renter-occupied |
| Less than $5,000 | 19 (0.9%) | 0 (0.0%) |
| $5,000 to $9,999 | 24 (1.1%) | 11 (1.3%) |
| $10,000 to $14,999 | 0 (0.0%) | 19 (2.2%) |
| $15,000 to $19,999 | 48 (2.3%) | 0 (0.0%) |
| $20,000 to $24,999 | 24 (1.1%) | 55 (6.4%) |
| $25,000 to $34,999 | 106 (5.0%) | 50 (5.8%) |
| $35,000 to $49,999 | 195 (9.2%) | 154 (17.9%) |
| $50,000 to $74,999 | 184 (8.7%) | 171 (19.9%) |
| $75,000 to $99,999 | 345 (16.3%) | 212 (24.6%) |
| $100,000 to $149,999 | 644 (30.3%) | 38 (4.4%) |
| $150,000 or more | 534 (25.2%) | 151 (17.5%) |
| Total | 2,123 (100.0%) | 861 (100.0%) |
Monthly Housing Cost Tiers in Mascoutah
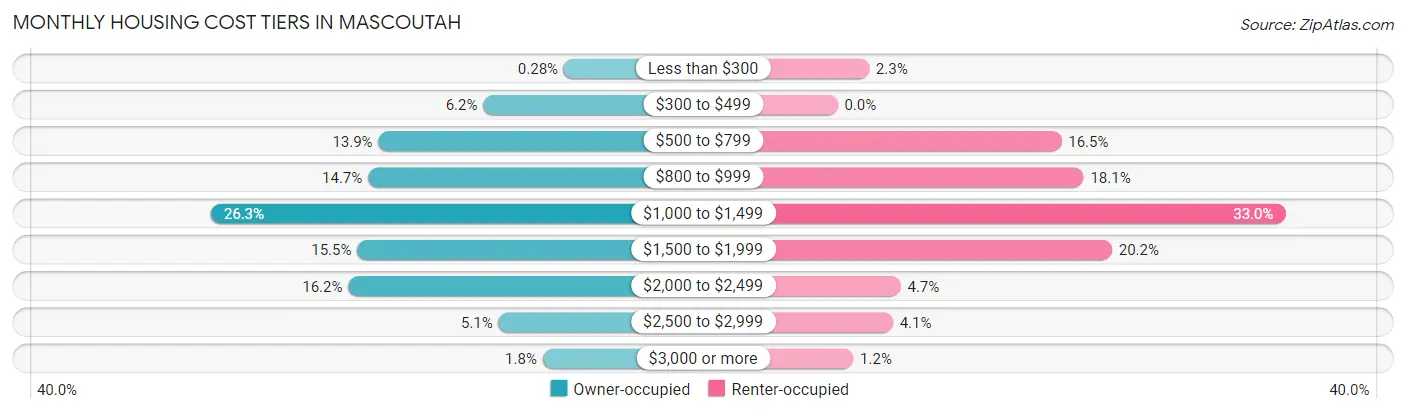
| Monthly Cost | Owner-occupied | Renter-occupied |
| Less than $300 | 6 (0.3%) | 20 (2.3%) |
| $300 to $499 | 132 (6.2%) | 0 (0.0%) |
| $500 to $799 | 296 (13.9%) | 142 (16.5%) |
| $800 to $999 | 312 (14.7%) | 156 (18.1%) |
| $1,000 to $1,499 | 558 (26.3%) | 284 (33.0%) |
| $1,500 to $1,999 | 329 (15.5%) | 174 (20.2%) |
| $2,000 to $2,499 | 343 (16.2%) | 40 (4.6%) |
| $2,500 to $2,999 | 108 (5.1%) | 35 (4.1%) |
| $3,000 or more | 39 (1.8%) | 10 (1.2%) |
| Total | 2,123 (100.0%) | 861 (100.0%) |
Physical Housing Characteristics in Mascoutah
Housing Structures in Mascoutah
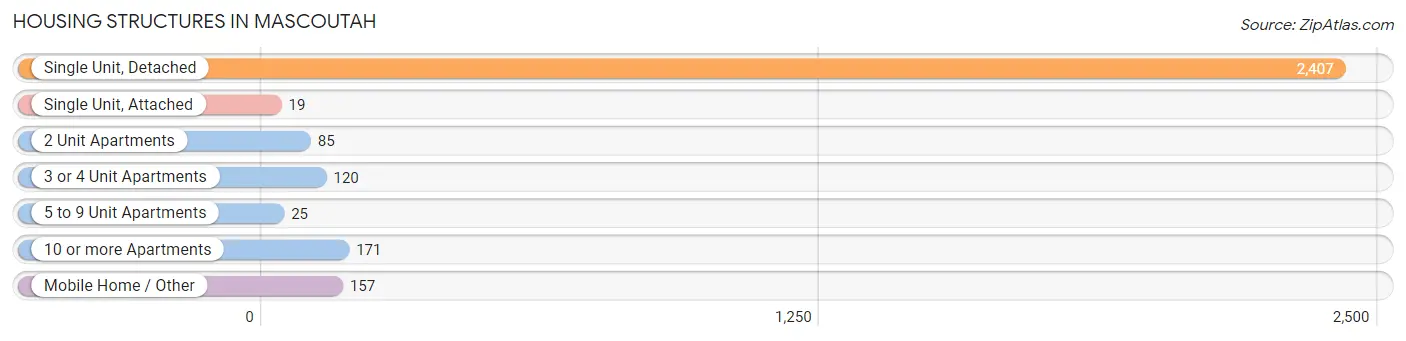
| Structure Type | # Housing Units | % Housing Units |
| Single Unit, Detached | 2,407 | 80.7% |
| Single Unit, Attached | 19 | 0.6% |
| 2 Unit Apartments | 85 | 2.9% |
| 3 or 4 Unit Apartments | 120 | 4.0% |
| 5 to 9 Unit Apartments | 25 | 0.8% |
| 10 or more Apartments | 171 | 5.7% |
| Mobile Home / Other | 157 | 5.3% |
| Total | 2,984 | 100.0% |
Housing Structures by Occupancy in Mascoutah
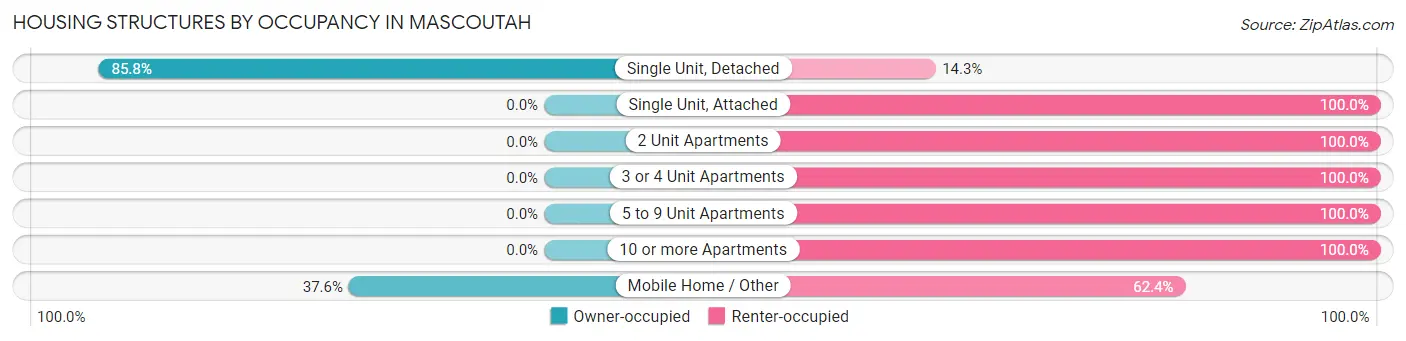
| Structure Type | Owner-occupied | Renter-occupied |
| Single Unit, Detached | 2,064 (85.8%) | 343 (14.2%) |
| Single Unit, Attached | 0 (0.0%) | 19 (100.0%) |
| 2 Unit Apartments | 0 (0.0%) | 85 (100.0%) |
| 3 or 4 Unit Apartments | 0 (0.0%) | 120 (100.0%) |
| 5 to 9 Unit Apartments | 0 (0.0%) | 25 (100.0%) |
| 10 or more Apartments | 0 (0.0%) | 171 (100.0%) |
| Mobile Home / Other | 59 (37.6%) | 98 (62.4%) |
| Total | 2,123 (71.2%) | 861 (28.8%) |
Housing Structures by Number of Rooms in Mascoutah
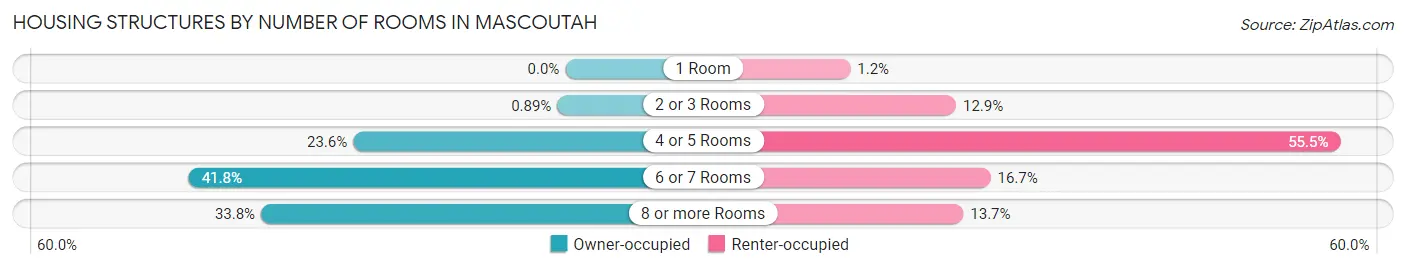
| Number of Rooms | Owner-occupied | Renter-occupied |
| 1 Room | 0 (0.0%) | 10 (1.2%) |
| 2 or 3 Rooms | 19 (0.9%) | 111 (12.9%) |
| 4 or 5 Rooms | 500 (23.5%) | 478 (55.5%) |
| 6 or 7 Rooms | 887 (41.8%) | 144 (16.7%) |
| 8 or more Rooms | 717 (33.8%) | 118 (13.7%) |
| Total | 2,123 (100.0%) | 861 (100.0%) |
Housing Structure by Heating Type in Mascoutah
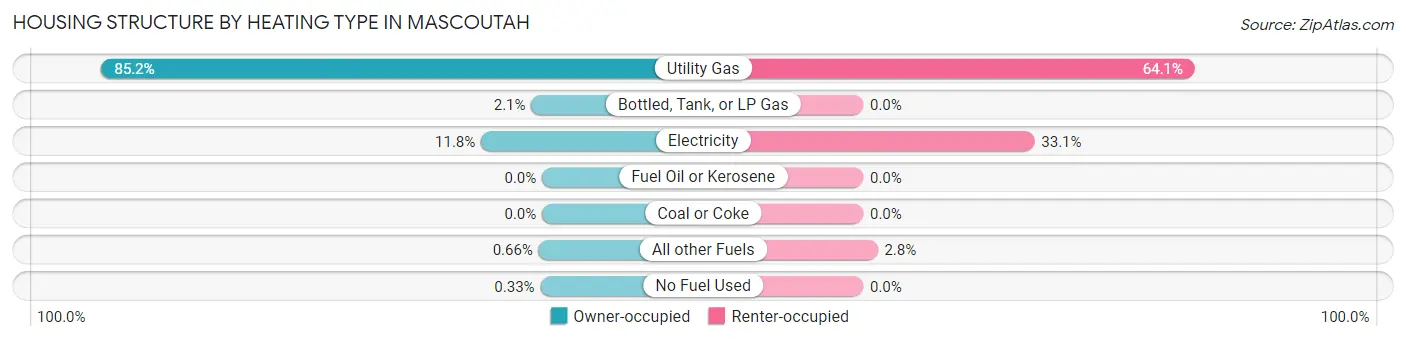
| Heating Type | Owner-occupied | Renter-occupied |
| Utility Gas | 1,808 (85.2%) | 552 (64.1%) |
| Bottled, Tank, or LP Gas | 44 (2.1%) | 0 (0.0%) |
| Electricity | 250 (11.8%) | 285 (33.1%) |
| Fuel Oil or Kerosene | 0 (0.0%) | 0 (0.0%) |
| Coal or Coke | 0 (0.0%) | 0 (0.0%) |
| All other Fuels | 14 (0.7%) | 24 (2.8%) |
| No Fuel Used | 7 (0.3%) | 0 (0.0%) |
| Total | 2,123 (100.0%) | 861 (100.0%) |
Household Vehicle Usage in Mascoutah
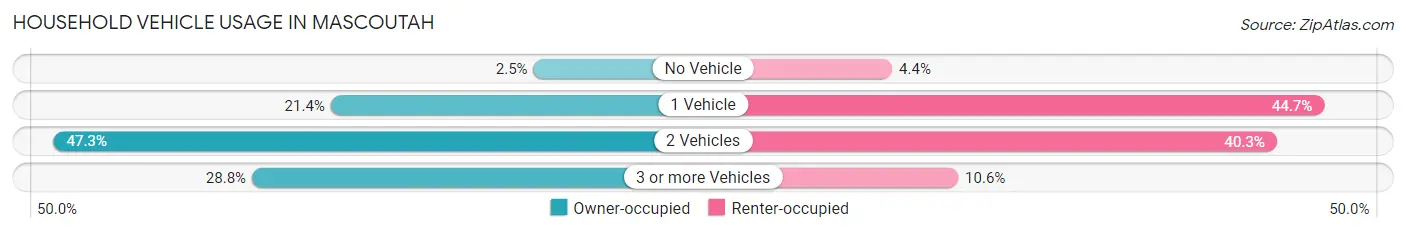
| Vehicles per Household | Owner-occupied | Renter-occupied |
| No Vehicle | 53 (2.5%) | 38 (4.4%) |
| 1 Vehicle | 455 (21.4%) | 385 (44.7%) |
| 2 Vehicles | 1,004 (47.3%) | 347 (40.3%) |
| 3 or more Vehicles | 611 (28.8%) | 91 (10.6%) |
| Total | 2,123 (100.0%) | 861 (100.0%) |
Real Estate & Mortgages in Mascoutah
Real Estate and Mortgage Overview in Mascoutah
| Characteristic | Without Mortgage | With Mortgage |
| Housing Units | 696 | 1,427 |
| Median Property Value | $206,100 | $201,200 |
| Median Household Income | $93,833 | $401 |
| Monthly Housing Costs | $811 | $39 |
| Real Estate Taxes | $4,697 | $42 |
Property Value by Mortgage Status in Mascoutah
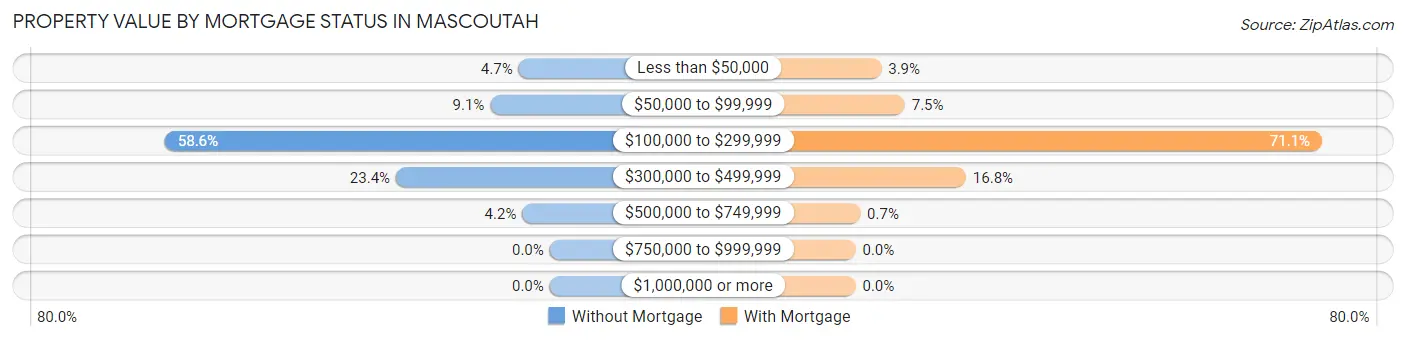
| Property Value | Without Mortgage | With Mortgage |
| Less than $50,000 | 33 (4.7%) | 56 (3.9%) |
| $50,000 to $99,999 | 63 (9.0%) | 107 (7.5%) |
| $100,000 to $299,999 | 408 (58.6%) | 1,014 (71.1%) |
| $300,000 to $499,999 | 163 (23.4%) | 240 (16.8%) |
| $500,000 to $749,999 | 29 (4.2%) | 10 (0.7%) |
| $750,000 to $999,999 | 0 (0.0%) | 0 (0.0%) |
| $1,000,000 or more | 0 (0.0%) | 0 (0.0%) |
| Total | 696 (100.0%) | 1,427 (100.0%) |
Household Income by Mortgage Status in Mascoutah
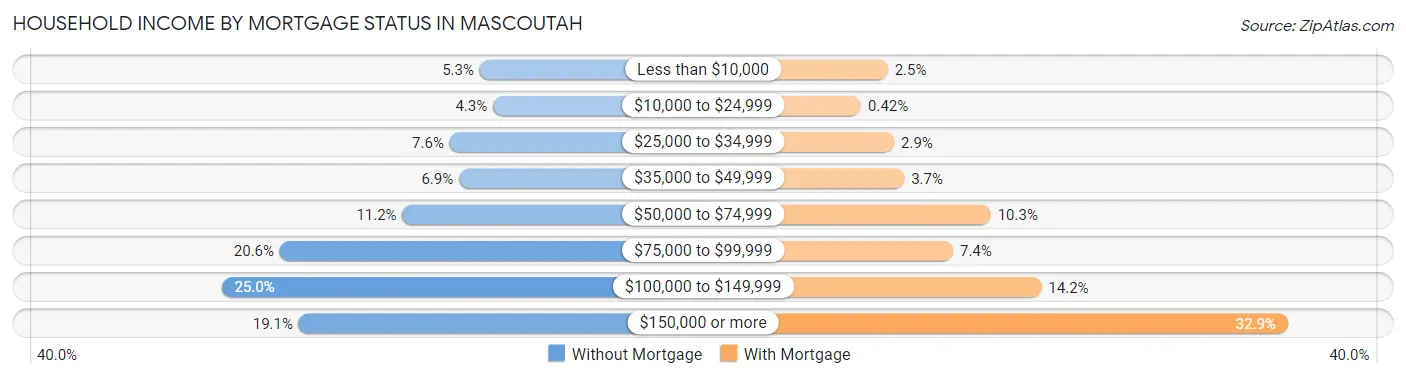
| Household Income | Without Mortgage | With Mortgage |
| Less than $10,000 | 37 (5.3%) | 35 (2.5%) |
| $10,000 to $24,999 | 30 (4.3%) | 6 (0.4%) |
| $25,000 to $34,999 | 53 (7.6%) | 42 (2.9%) |
| $35,000 to $49,999 | 48 (6.9%) | 53 (3.7%) |
| $50,000 to $74,999 | 78 (11.2%) | 147 (10.3%) |
| $75,000 to $99,999 | 143 (20.5%) | 106 (7.4%) |
| $100,000 to $149,999 | 174 (25.0%) | 202 (14.2%) |
| $150,000 or more | 133 (19.1%) | 470 (32.9%) |
| Total | 696 (100.0%) | 1,427 (100.0%) |
Property Value to Household Income Ratio in Mascoutah
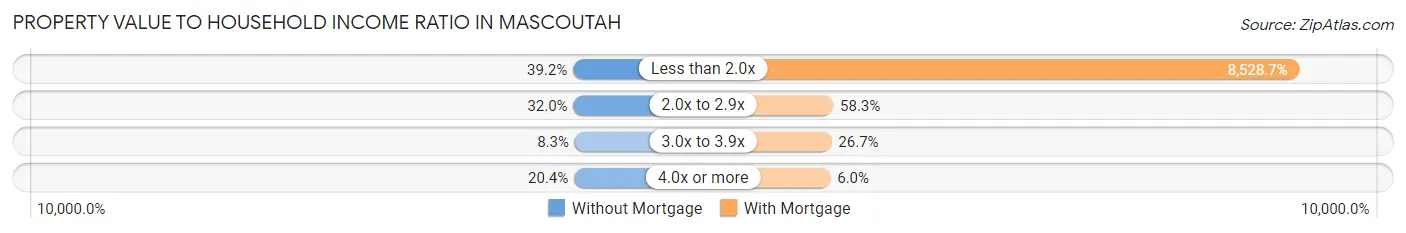
| Value-to-Income Ratio | Without Mortgage | With Mortgage |
| Less than 2.0x | 273 (39.2%) | 121,705 (8,528.7%) |
| 2.0x to 2.9x | 223 (32.0%) | 832 (58.3%) |
| 3.0x to 3.9x | 58 (8.3%) | 381 (26.7%) |
| 4.0x or more | 142 (20.4%) | 86 (6.0%) |
| Total | 696 (100.0%) | 1,427 (100.0%) |
Real Estate Taxes by Mortgage Status in Mascoutah
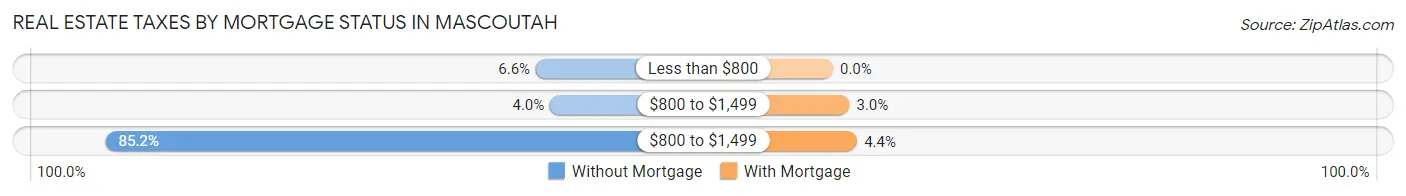
| Property Taxes | Without Mortgage | With Mortgage |
| Less than $800 | 46 (6.6%) | 0 (0.0%) |
| $800 to $1,499 | 28 (4.0%) | 43 (3.0%) |
| $800 to $1,499 | 593 (85.2%) | 63 (4.4%) |
| Total | 696 (100.0%) | 1,427 (100.0%) |
Health & Disability in Mascoutah
Health Insurance Coverage by Age in Mascoutah
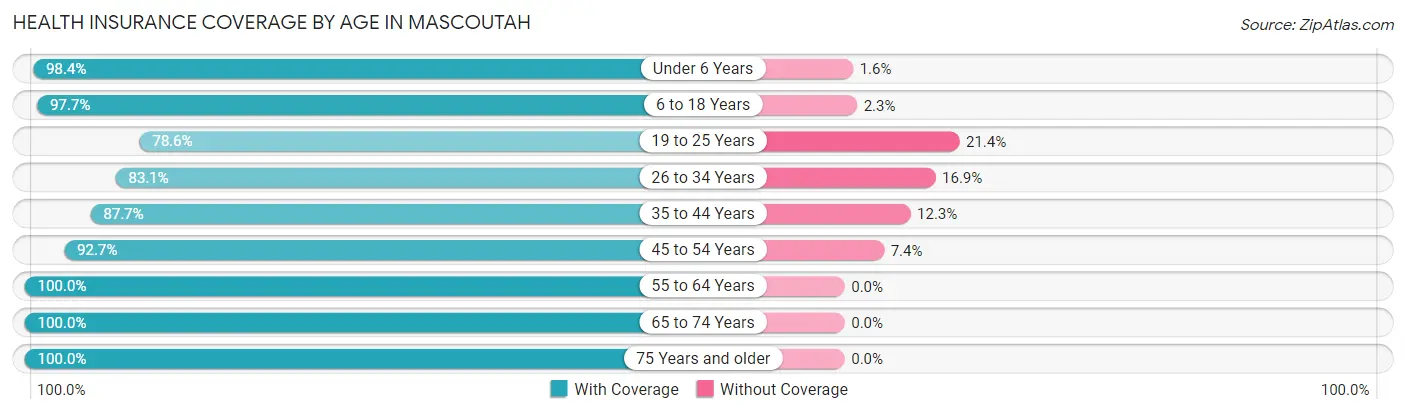
| Age Bracket | With Coverage | Without Coverage |
| Under 6 Years | 690 (98.4%) | 11 (1.6%) |
| 6 to 18 Years | 1,597 (97.7%) | 38 (2.3%) |
| 19 to 25 Years | 551 (78.6%) | 150 (21.4%) |
| 26 to 34 Years | 839 (83.1%) | 171 (16.9%) |
| 35 to 44 Years | 1,101 (87.7%) | 154 (12.3%) |
| 45 to 54 Years | 908 (92.6%) | 72 (7.3%) |
| 55 to 64 Years | 1,114 (100.0%) | 0 (0.0%) |
| 65 to 74 Years | 670 (100.0%) | 0 (0.0%) |
| 75 Years and older | 316 (100.0%) | 0 (0.0%) |
| Total | 7,786 (92.9%) | 596 (7.1%) |
Health Insurance Coverage by Citizenship Status in Mascoutah
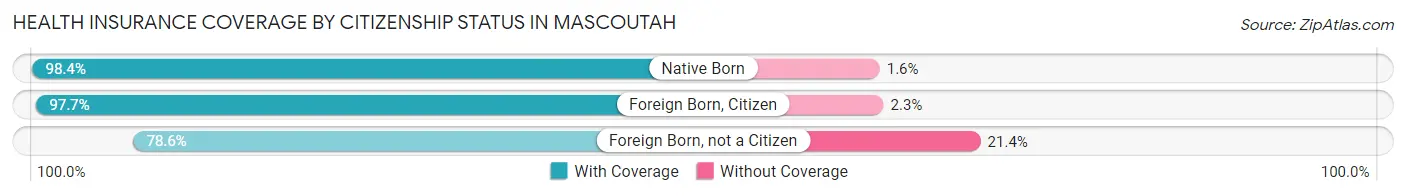
| Citizenship Status | With Coverage | Without Coverage |
| Native Born | 690 (98.4%) | 11 (1.6%) |
| Foreign Born, Citizen | 1,597 (97.7%) | 38 (2.3%) |
| Foreign Born, not a Citizen | 551 (78.6%) | 150 (21.4%) |
Health Insurance Coverage by Household Income in Mascoutah
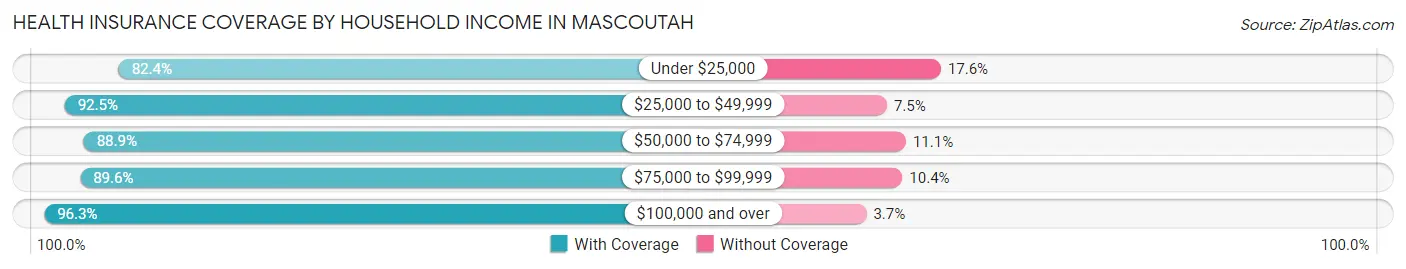
| Household Income | With Coverage | Without Coverage |
| Under $25,000 | 495 (82.4%) | 106 (17.6%) |
| $25,000 to $49,999 | 861 (92.5%) | 70 (7.5%) |
| $50,000 to $74,999 | 778 (88.9%) | 97 (11.1%) |
| $75,000 to $99,999 | 1,375 (89.6%) | 160 (10.4%) |
| $100,000 and over | 4,268 (96.3%) | 163 (3.7%) |
Public vs Private Health Insurance Coverage by Age in Mascoutah
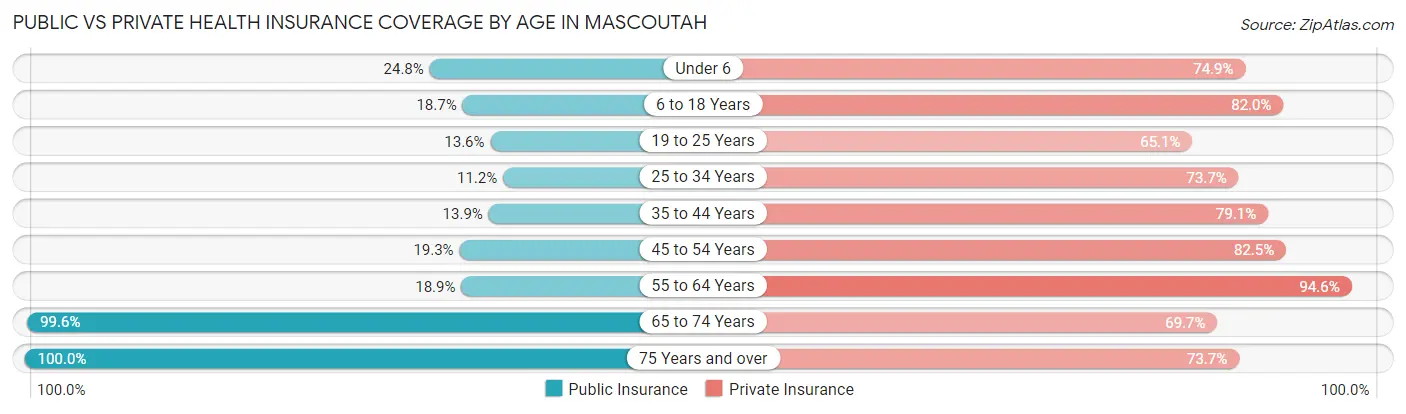
| Age Bracket | Public Insurance | Private Insurance |
| Under 6 | 174 (24.8%) | 525 (74.9%) |
| 6 to 18 Years | 306 (18.7%) | 1,340 (82.0%) |
| 19 to 25 Years | 95 (13.6%) | 456 (65.0%) |
| 25 to 34 Years | 113 (11.2%) | 744 (73.7%) |
| 35 to 44 Years | 174 (13.9%) | 993 (79.1%) |
| 45 to 54 Years | 189 (19.3%) | 808 (82.5%) |
| 55 to 64 Years | 211 (18.9%) | 1,054 (94.6%) |
| 65 to 74 Years | 667 (99.6%) | 467 (69.7%) |
| 75 Years and over | 316 (100.0%) | 233 (73.7%) |
| Total | 2,245 (26.8%) | 6,620 (79.0%) |
Disability Status by Sex by Age in Mascoutah
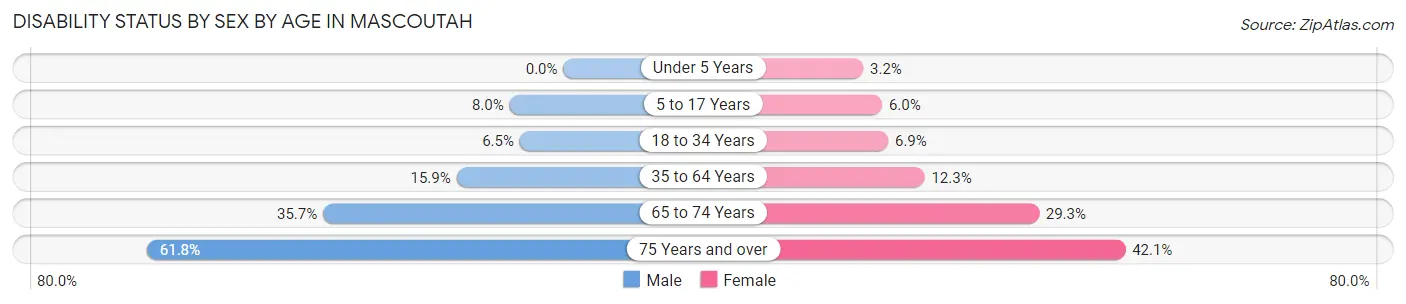
| Age Bracket | Male | Female |
| Under 5 Years | 0 (0.0%) | 10 (3.2%) |
| 5 to 17 Years | 62 (8.0%) | 46 (6.0%) |
| 18 to 34 Years | 54 (6.5%) | 69 (6.9%) |
| 35 to 64 Years | 269 (15.9%) | 203 (12.3%) |
| 65 to 74 Years | 111 (35.7%) | 105 (29.2%) |
| 75 Years and over | 47 (61.8%) | 101 (42.1%) |
Disability Class by Sex by Age in Mascoutah
Disability Class: Hearing Difficulty
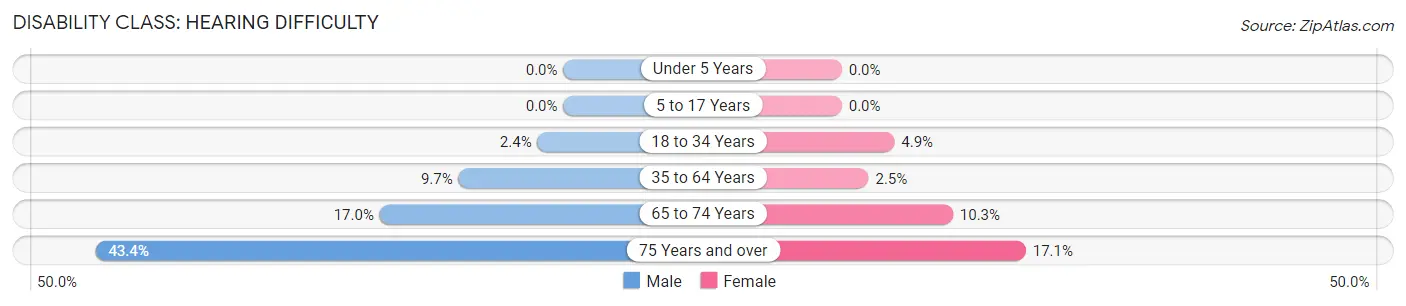
| Age Bracket | Male | Female |
| Under 5 Years | 0 (0.0%) | 0 (0.0%) |
| 5 to 17 Years | 0 (0.0%) | 0 (0.0%) |
| 18 to 34 Years | 20 (2.4%) | 49 (4.9%) |
| 35 to 64 Years | 165 (9.7%) | 41 (2.5%) |
| 65 to 74 Years | 53 (17.0%) | 37 (10.3%) |
| 75 Years and over | 33 (43.4%) | 41 (17.1%) |
Disability Class: Vision Difficulty
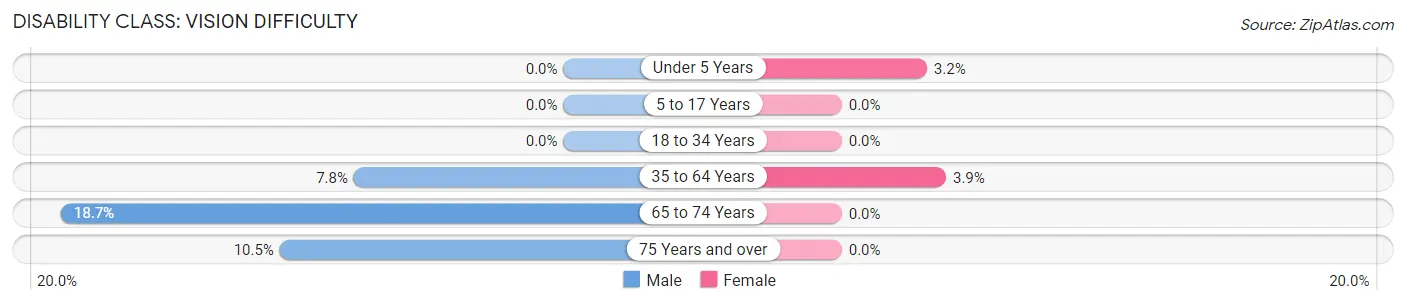
| Age Bracket | Male | Female |
| Under 5 Years | 0 (0.0%) | 10 (3.2%) |
| 5 to 17 Years | 0 (0.0%) | 0 (0.0%) |
| 18 to 34 Years | 0 (0.0%) | 0 (0.0%) |
| 35 to 64 Years | 132 (7.8%) | 64 (3.9%) |
| 65 to 74 Years | 58 (18.6%) | 0 (0.0%) |
| 75 Years and over | 8 (10.5%) | 0 (0.0%) |
Disability Class: Cognitive Difficulty
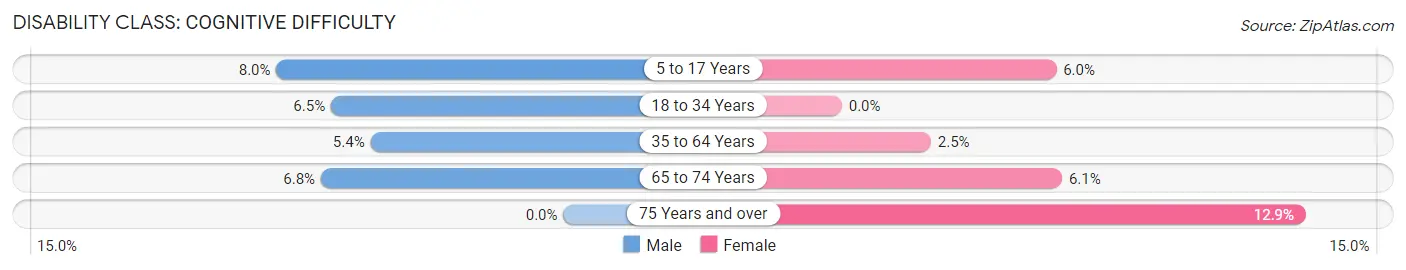
| Age Bracket | Male | Female |
| 5 to 17 Years | 62 (8.0%) | 46 (6.0%) |
| 18 to 34 Years | 54 (6.5%) | 0 (0.0%) |
| 35 to 64 Years | 91 (5.4%) | 41 (2.5%) |
| 65 to 74 Years | 21 (6.8%) | 22 (6.1%) |
| 75 Years and over | 0 (0.0%) | 31 (12.9%) |
Disability Class: Ambulatory Difficulty
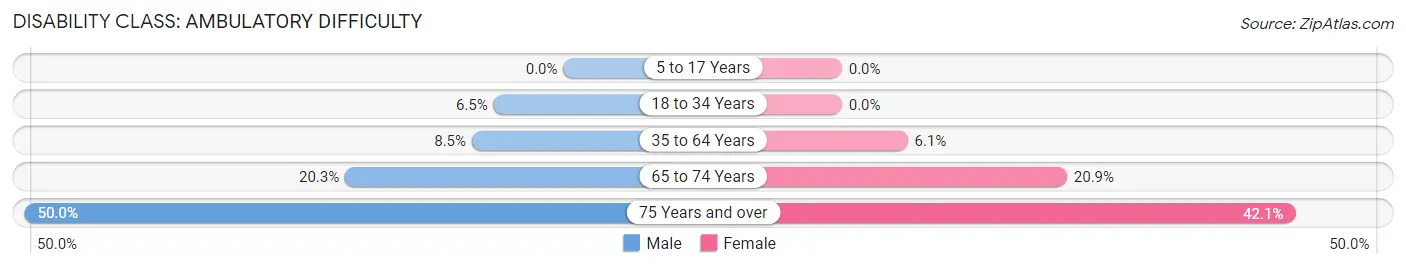
| Age Bracket | Male | Female |
| 5 to 17 Years | 0 (0.0%) | 0 (0.0%) |
| 18 to 34 Years | 54 (6.5%) | 0 (0.0%) |
| 35 to 64 Years | 144 (8.5%) | 101 (6.1%) |
| 65 to 74 Years | 63 (20.3%) | 75 (20.9%) |
| 75 Years and over | 38 (50.0%) | 101 (42.1%) |
Disability Class: Self-Care Difficulty
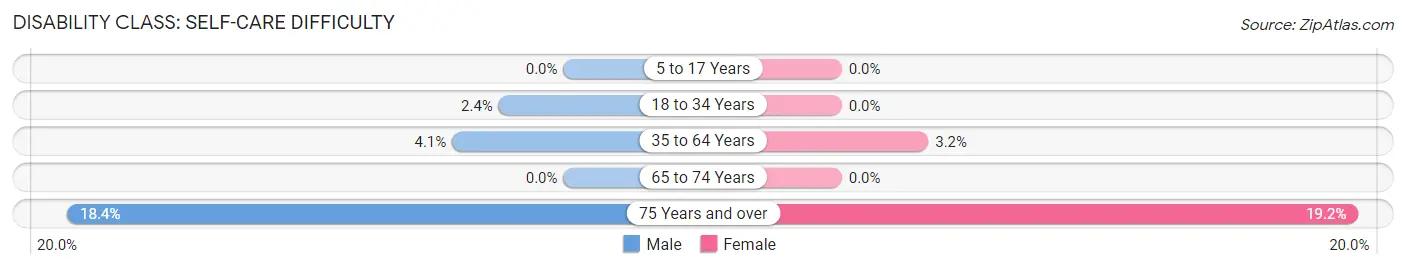
| Age Bracket | Male | Female |
| 5 to 17 Years | 0 (0.0%) | 0 (0.0%) |
| 18 to 34 Years | 20 (2.4%) | 0 (0.0%) |
| 35 to 64 Years | 70 (4.1%) | 53 (3.2%) |
| 65 to 74 Years | 0 (0.0%) | 0 (0.0%) |
| 75 Years and over | 14 (18.4%) | 46 (19.2%) |
Technology Access in Mascoutah
Computing Device Access in Mascoutah
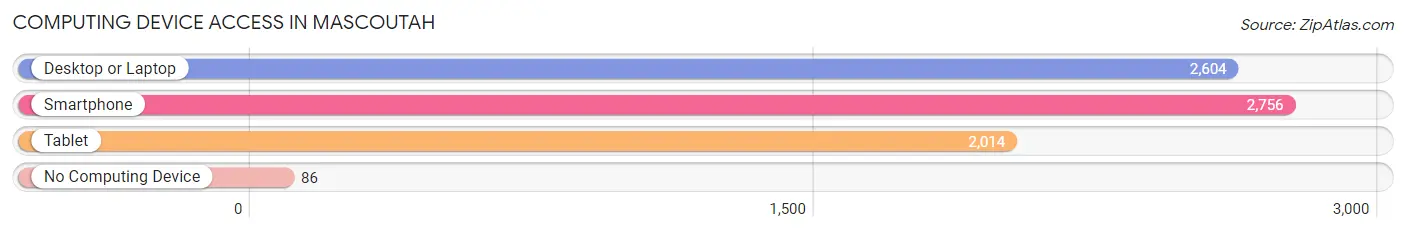
| Device Type | # Households | % Households |
| Desktop or Laptop | 2,604 | 87.3% |
| Smartphone | 2,756 | 92.4% |
| Tablet | 2,014 | 67.5% |
| No Computing Device | 86 | 2.9% |
| Total | 2,984 | 100.0% |
Internet Access in Mascoutah
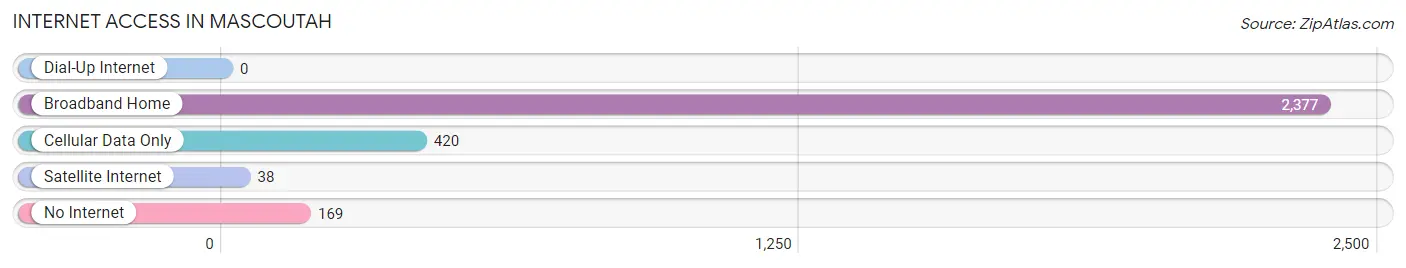
| Internet Type | # Households | % Households |
| Dial-Up Internet | 0 | 0.0% |
| Broadband Home | 2,377 | 79.7% |
| Cellular Data Only | 420 | 14.1% |
| Satellite Internet | 38 | 1.3% |
| No Internet | 169 | 5.7% |
| Total | 2,984 | 100.0% |
Mascoutah Summary
Mascoutah, Illinois is a small city located in St. Clair County, about 25 miles east of St. Louis, Missouri. The city is part of the Metro-East region of the Greater St. Louis metropolitan area. The city was founded in 1855 and has a population of 6,619 as of the 2010 census.
History
Mascoutah was founded in 1855 by German immigrants who had settled in the area. The city was named after the Mascouten Native American tribe, which had inhabited the area prior to the arrival of the Europeans. The city was incorporated in 1859 and was the first city in St. Clair County to be incorporated.
The city was an important stop on the Illinois Central Railroad, which ran through the city from 1856 to 1971. The railroad was an important factor in the city's growth and development.
The city was also home to a large German-American population, which was reflected in the city's culture and architecture. The city was home to several German-American churches, including St. John's Lutheran Church, which was founded in 1856.
Geography
Mascoutah is located in St. Clair County, about 25 miles east of St. Louis, Missouri. The city is situated on the banks of the Kaskaskia River, which flows through the city. The city is located in the Metro-East region of the Greater St. Louis metropolitan area.
The city has a total area of 4.2 square miles, all of which is land. The city is located in a flat, low-lying area, with an elevation of about 500 feet above sea level.
Economy
Mascoutah is home to a variety of businesses and industries. The city is home to several manufacturing companies, including a plant owned by the automotive parts manufacturer, Dana Corporation. The city is also home to several retail stores, including a Walmart Supercenter.
The city is also home to Scott Air Force Base, which is located just outside of the city limits. The base is home to the U.S. Air Mobility Command and is the largest employer in the city.
Demographics
As of the 2010 census, Mascoutah had a population of 6,619. The city has a population density of 1,567 people per square mile. The racial makeup of the city was 92.3% White, 4.2% African American, 0.3% Native American, 0.7% Asian, 0.1% Pacific Islander, and 2.4% from other races. Hispanic or Latino of any race were 2.7% of the population.
The median income for a household in the city was $50,902, and the median income for a family was $60,902. The per capita income for the city was $23,902. About 6.2% of families and 8.2% of the population were below the poverty line, including 10.2% of those under age 18 and 6.2% of those age 65 or over.
Common Questions
What is Per Capita Income in Mascoutah?
Per Capita income in Mascoutah is $37,411.
What is the Median Family Income in Mascoutah?
Median Family Income in Mascoutah is $126,313.
What is the Median Household income in Mascoutah?
Median Household Income in Mascoutah is $93,403.
What is Income or Wage Gap in Mascoutah?
Income or Wage Gap in Mascoutah is 46.1%.
Women in Mascoutah earn 53.9 cents for every dollar earned by a man.
What is Inequality or Gini Index in Mascoutah?
Inequality or Gini Index in Mascoutah is 0.35.
What is the Total Population of Mascoutah?
Total Population of Mascoutah is 8,762.
What is the Total Male Population of Mascoutah?
Total Male Population of Mascoutah is 4,296.
What is the Total Female Population of Mascoutah?
Total Female Population of Mascoutah is 4,466.
What is the Ratio of Males per 100 Females in Mascoutah?
There are 96.19 Males per 100 Females in Mascoutah.
What is the Ratio of Females per 100 Males in Mascoutah?
There are 103.96 Females per 100 Males in Mascoutah.
What is the Median Population Age in Mascoutah?
Median Population Age in Mascoutah is 36.6 Years.
What is the Average Family Size in Mascoutah
Average Family Size in Mascoutah is 3.5 People.
What is the Average Household Size in Mascoutah
Average Household Size in Mascoutah is 2.9 People.
How Large is the Labor Force in Mascoutah?
There are 4,860 People in the Labor Forcein in Mascoutah.
What is the Percentage of People in the Labor Force in Mascoutah?
72.2% of People are in the Labor Force in Mascoutah.
What is the Unemployment Rate in Mascoutah?
Unemployment Rate in Mascoutah is 4.5%.