Harvey, IL Map & Demographics
Harvey Map
Harvey Overview
$23,472
PER CAPITA INCOME
$57,624
AVG FAMILY INCOME
$40,898
AVG HOUSEHOLD INCOME
22.9%
WAGE / INCOME GAP [ % ]
77.1¢/ $1
WAGE / INCOME GAP [ $ ]
$10,249
FAMILY INCOME DEFICIT
0.51
INEQUALITY / GINI INDEX
20,035
TOTAL POPULATION
9,745
MALE POPULATION
10,290
FEMALE POPULATION
94.70
MALES / 100 FEMALES
105.59
FEMALES / 100 MALES
35.5
MEDIAN AGE
3.6
AVG FAMILY SIZE
2.7
AVG HOUSEHOLD SIZE
9,310
LABOR FORCE [ PEOPLE ]
58.8%
PERCENT IN LABOR FORCE
14.6%
UNEMPLOYMENT RATE
Harvey Zip Codes
Harvey Area Codes
Income in Harvey
Income Overview in Harvey
Per Capita Income in Harvey is $23,472, while median incomes of families and households are $57,624 and $40,898 respectively.
| Characteristic | Number | Measure |
| Per Capita Income | 20,035 | $23,472 |
| Median Family Income | 4,468 | $57,624 |
| Mean Family Income | 4,468 | $79,080 |
| Median Household Income | 7,217 | $40,898 |
| Mean Household Income | 7,217 | $62,416 |
| Income Deficit | 4,468 | $10,249 |
| Wage / Income Gap (%) | 20,035 | 22.85% |
| Wage / Income Gap ($) | 20,035 | 77.15¢ per $1 |
| Gini / Inequality Index | 20,035 | 0.51 |
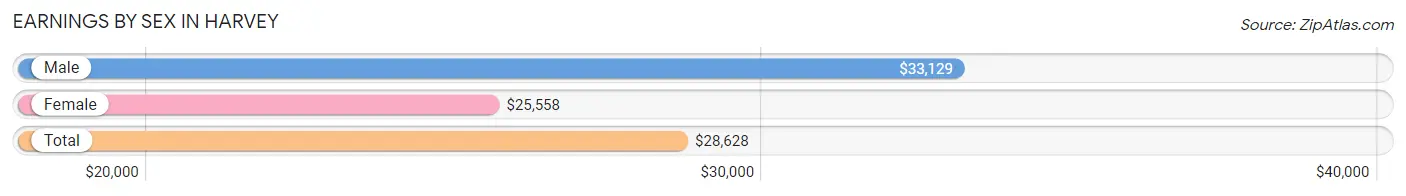
Earnings by Sex in Harvey
Average Earnings in Harvey are $28,628, $33,129 for men and $25,558 for women, a difference of 22.9%.
| Sex | Number | Average Earnings |
| Male | 4,488 (48.7%) | $33,129 |
| Female | 4,732 (51.3%) | $25,558 |
| Total | 9,220 (100.0%) | $28,628 |
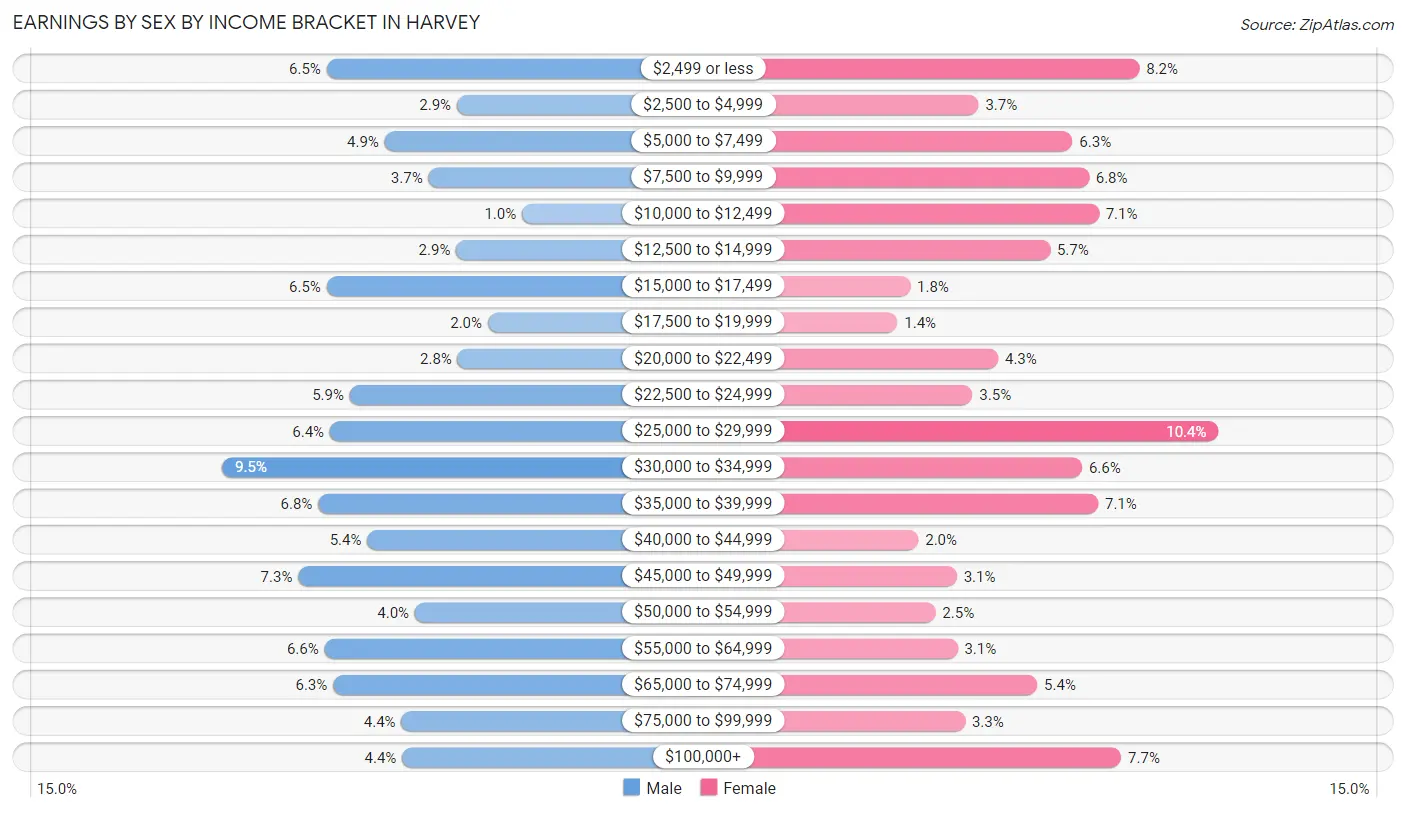
Earnings by Sex by Income Bracket in Harvey
The most common earnings brackets in Harvey are $30,000 to $34,999 for men (424 | 9.5%) and $25,000 to $29,999 for women (494 | 10.4%).
| Income | Male | Female |
| $2,499 or less | 292 (6.5%) | 389 (8.2%) |
| $2,500 to $4,999 | 128 (2.9%) | 175 (3.7%) |
| $5,000 to $7,499 | 219 (4.9%) | 300 (6.3%) |
| $7,500 to $9,999 | 164 (3.6%) | 322 (6.8%) |
| $10,000 to $12,499 | 46 (1.0%) | 335 (7.1%) |
| $12,500 to $14,999 | 129 (2.9%) | 270 (5.7%) |
| $15,000 to $17,499 | 292 (6.5%) | 84 (1.8%) |
| $17,500 to $19,999 | 89 (2.0%) | 67 (1.4%) |
| $20,000 to $22,499 | 127 (2.8%) | 201 (4.3%) |
| $22,500 to $24,999 | 263 (5.9%) | 167 (3.5%) |
| $25,000 to $29,999 | 288 (6.4%) | 494 (10.4%) |
| $30,000 to $34,999 | 424 (9.5%) | 313 (6.6%) |
| $35,000 to $39,999 | 303 (6.8%) | 334 (7.1%) |
| $40,000 to $44,999 | 241 (5.4%) | 95 (2.0%) |
| $45,000 to $49,999 | 328 (7.3%) | 146 (3.1%) |
| $50,000 to $54,999 | 181 (4.0%) | 118 (2.5%) |
| $55,000 to $64,999 | 295 (6.6%) | 147 (3.1%) |
| $65,000 to $74,999 | 284 (6.3%) | 253 (5.3%) |
| $75,000 to $99,999 | 198 (4.4%) | 157 (3.3%) |
| $100,000+ | 197 (4.4%) | 365 (7.7%) |
| Total | 4,488 (100.0%) | 4,732 (100.0%) |
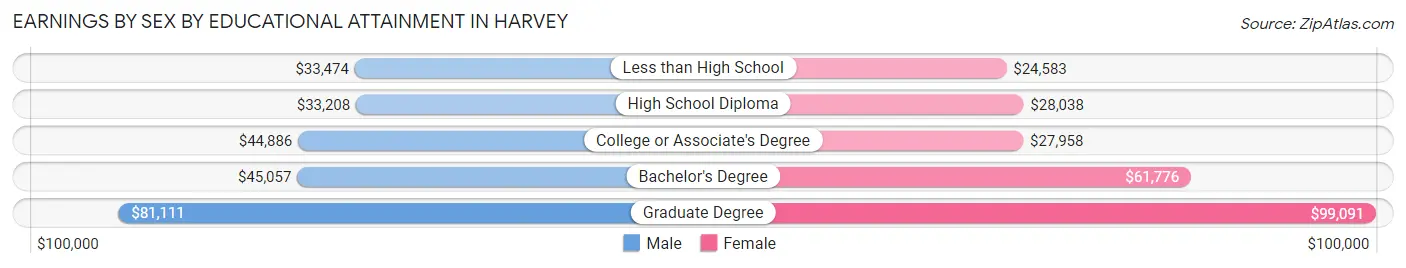
Earnings by Sex by Educational Attainment in Harvey
Average earnings in Harvey are $34,959 for men and $29,403 for women, a difference of 15.9%. Men with an educational attainment of graduate degree enjoy the highest average annual earnings of $81,111, while those with high school diploma education earn the least with $33,208. Women with an educational attainment of graduate degree earn the most with the average annual earnings of $99,091, while those with less than high school education have the smallest earnings of $24,583.
| Educational Attainment | Male Income | Female Income |
| Less than High School | $33,474 | $24,583 |
| High School Diploma | $33,208 | $28,038 |
| College or Associate's Degree | $44,886 | $27,958 |
| Bachelor's Degree | $45,057 | $61,776 |
| Graduate Degree | $81,111 | $99,091 |
| Total | $34,959 | $29,403 |
Family Income in Harvey
Family Income Brackets in Harvey
According to the Harvey family income data, there are 889 families falling into the $50,000 to $74,999 income range, which is the most common income bracket and makes up 19.9% of all families. Conversely, the $10,000 to $14,999 income bracket is the least frequent group with only 116 families (2.6%) belonging to this category.
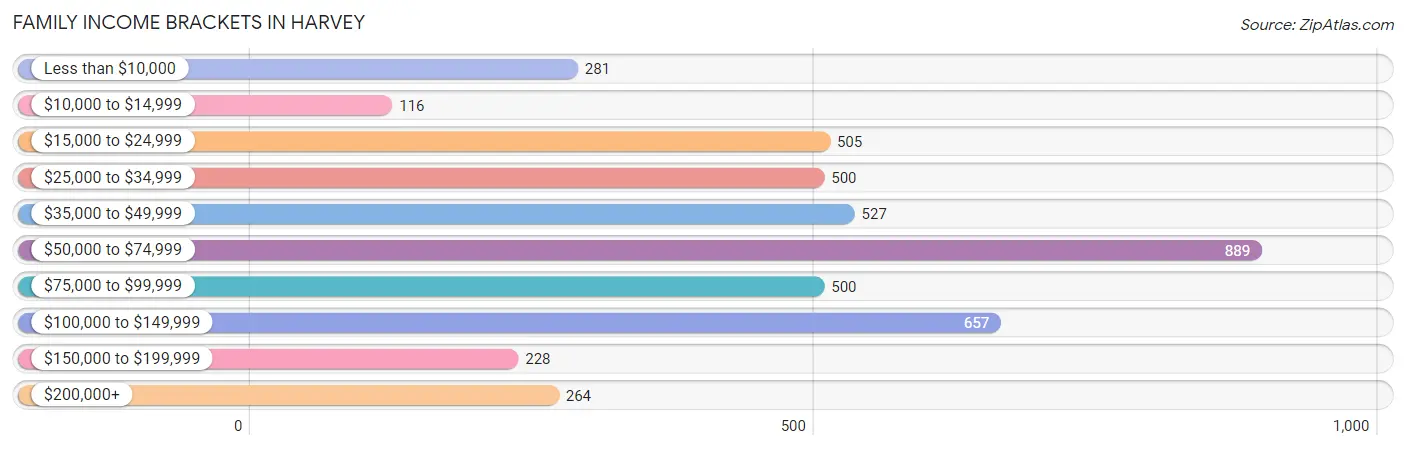
| Income Bracket | # Families | % Families |
| Less than $10,000 | 281 | 6.3% |
| $10,000 to $14,999 | 116 | 2.6% |
| $15,000 to $24,999 | 505 | 11.3% |
| $25,000 to $34,999 | 500 | 11.2% |
| $35,000 to $49,999 | 527 | 11.8% |
| $50,000 to $74,999 | 889 | 19.9% |
| $75,000 to $99,999 | 500 | 11.2% |
| $100,000 to $149,999 | 657 | 14.7% |
| $150,000 to $199,999 | 228 | 5.1% |
| $200,000+ | 264 | 5.9% |
Family Income by Famaliy Size in Harvey
7+ person families (167 | 3.7%) account for the highest median family income in Harvey with $126,375 per family, while 2-person families (1,513 | 33.9%) have the highest median income of $20,672 per family member.
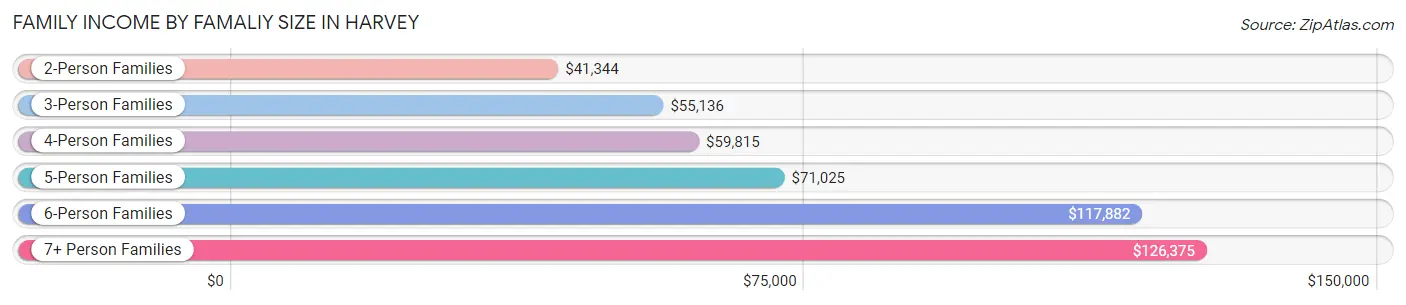
| Income Bracket | # Families | Median Income |
| 2-Person Families | 1,513 (33.9%) | $41,344 |
| 3-Person Families | 1,111 (24.9%) | $55,136 |
| 4-Person Families | 1,016 (22.7%) | $59,815 |
| 5-Person Families | 462 (10.3%) | $71,025 |
| 6-Person Families | 199 (4.4%) | $117,882 |
| 7+ Person Families | 167 (3.7%) | $126,375 |
| Total | 4,468 (100.0%) | $57,624 |
Family Income by Number of Earners in Harvey
The median family income in Harvey is $57,624, with families comprising 3+ earners (651) having the highest median family income of $127,022, while families with no earners (680) have the lowest median family income of $25,000, accounting for 14.6% and 15.2% of families, respectively.
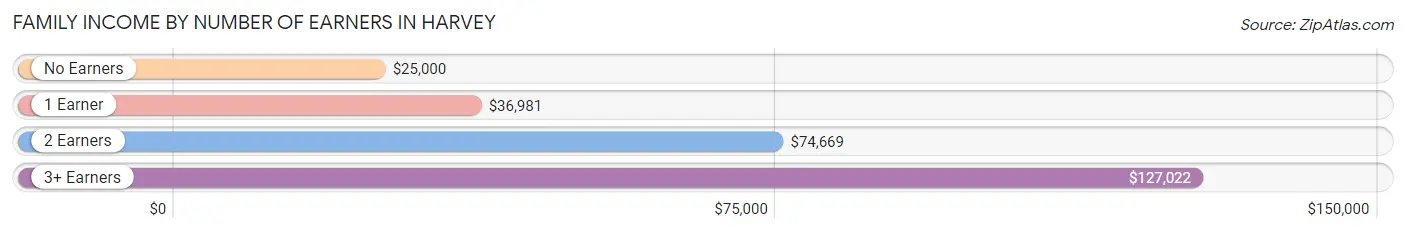
| Number of Earners | # Families | Median Income |
| No Earners | 680 (15.2%) | $25,000 |
| 1 Earner | 1,684 (37.7%) | $36,981 |
| 2 Earners | 1,453 (32.5%) | $74,669 |
| 3+ Earners | 651 (14.6%) | $127,022 |
| Total | 4,468 (100.0%) | $57,624 |
Household Income in Harvey
Household Income Brackets in Harvey
With 1,212 households falling in the category, the $50,000 to $74,999 income range is the most frequent in Harvey, accounting for 16.8% of all households. In contrast, only 245 households (3.4%) fall into the $150,000 to $199,999 income bracket, making it the least populous group.
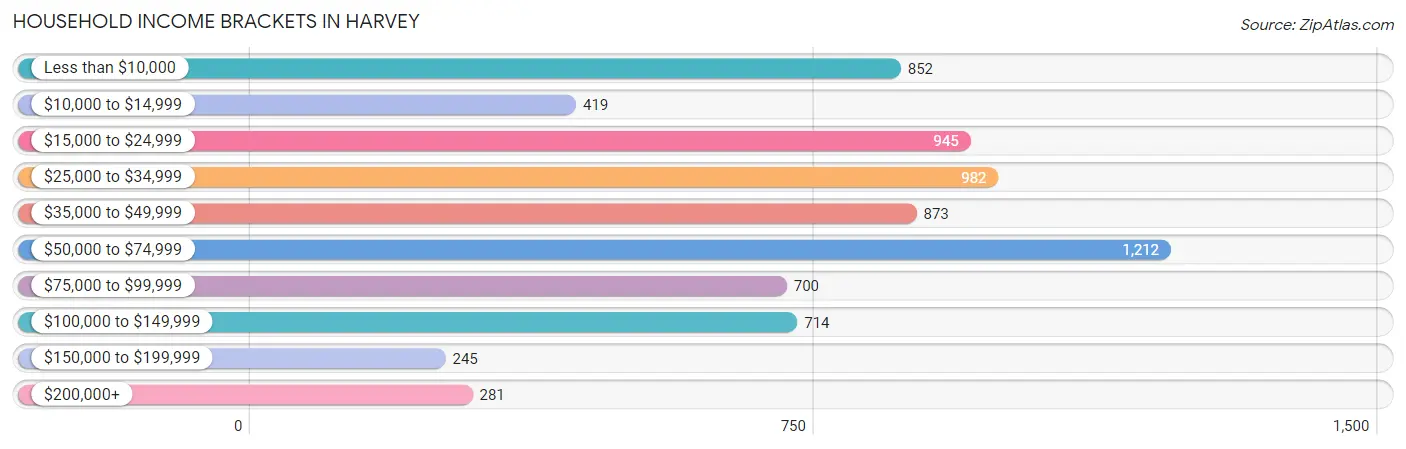
| Income Bracket | # Households | % Households |
| Less than $10,000 | 852 | 11.8% |
| $10,000 to $14,999 | 419 | 5.8% |
| $15,000 to $24,999 | 945 | 13.1% |
| $25,000 to $34,999 | 982 | 13.6% |
| $35,000 to $49,999 | 873 | 12.1% |
| $50,000 to $74,999 | 1,212 | 16.8% |
| $75,000 to $99,999 | 700 | 9.7% |
| $100,000 to $149,999 | 714 | 9.9% |
| $150,000 to $199,999 | 245 | 3.4% |
| $200,000+ | 281 | 3.9% |
Household Income by Householder Age in Harvey
The median household income in Harvey is $40,898, with the highest median household income of $50,526 found in the 45 to 64 years age bracket for the primary householder. A total of 2,776 households (38.5%) fall into this category. Meanwhile, the 15 to 24 years age bracket for the primary householder has the lowest median household income of $26,268, with 307 households (4.3%) in this group.
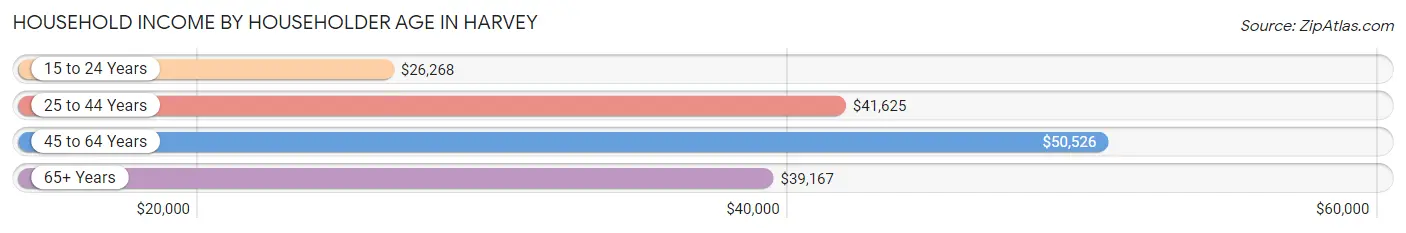
| Income Bracket | # Households | Median Income |
| 15 to 24 Years | 307 (4.3%) | $26,268 |
| 25 to 44 Years | 2,074 (28.7%) | $41,625 |
| 45 to 64 Years | 2,776 (38.5%) | $50,526 |
| 65+ Years | 2,060 (28.5%) | $39,167 |
| Total | 7,217 (100.0%) | $40,898 |
Poverty in Harvey
Income Below Poverty by Sex and Age in Harvey
With 22.4% poverty level for males and 26.0% for females among the residents of Harvey, 5 year old males and 15 year old females are the most vulnerable to poverty, with 156 males (85.3%) and 57 females (62.0%) in their respective age groups living below the poverty level.
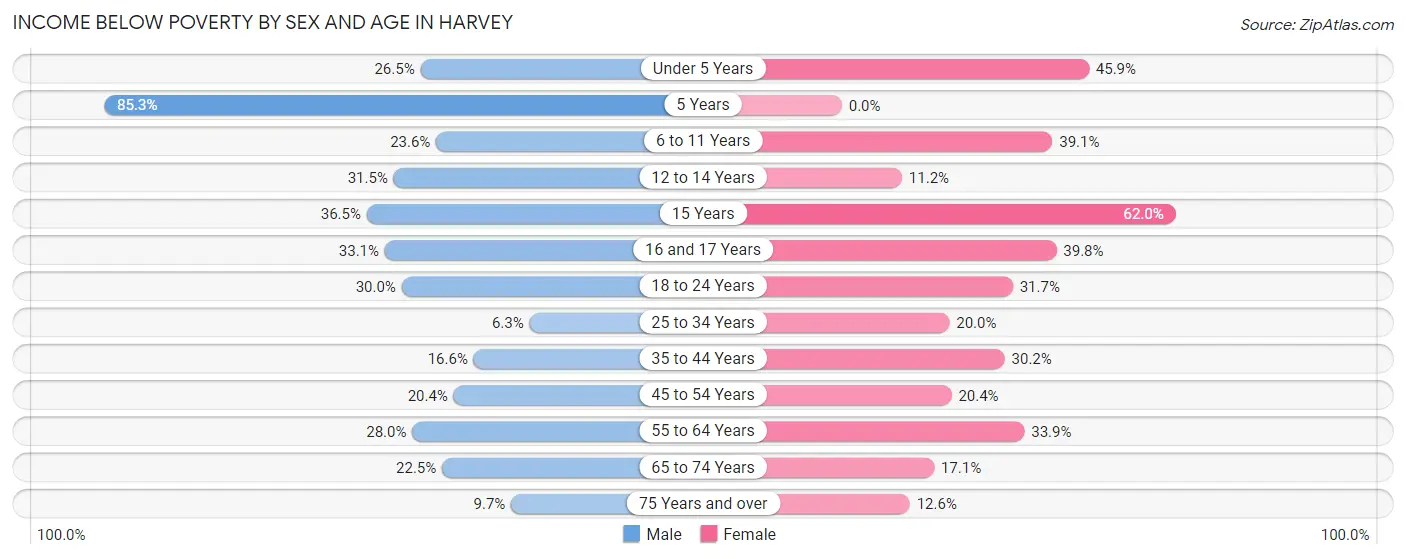
| Age Bracket | Male | Female |
| Under 5 Years | 122 (26.5%) | 205 (45.9%) |
| 5 Years | 156 (85.3%) | 0 (0.0%) |
| 6 to 11 Years | 219 (23.6%) | 365 (39.1%) |
| 12 to 14 Years | 164 (31.5%) | 47 (11.2%) |
| 15 Years | 27 (36.5%) | 57 (62.0%) |
| 16 and 17 Years | 110 (33.1%) | 96 (39.8%) |
| 18 to 24 Years | 256 (30.0%) | 389 (31.7%) |
| 25 to 34 Years | 94 (6.3%) | 299 (20.0%) |
| 35 to 44 Years | 172 (16.6%) | 340 (30.2%) |
| 45 to 54 Years | 245 (20.3%) | 282 (20.3%) |
| 55 to 64 Years | 387 (28.0%) | 311 (33.9%) |
| 65 to 74 Years | 160 (22.5%) | 148 (17.1%) |
| 75 Years and over | 44 (9.7%) | 113 (12.6%) |
| Total | 2,156 (22.4%) | 2,652 (26.0%) |
Income Above Poverty by Sex and Age in Harvey
According to the poverty statistics in Harvey, males aged 25 to 34 years and females aged 5 years are the age groups that are most secure financially, with 93.7% of males and 100.0% of females in these age groups living above the poverty line.
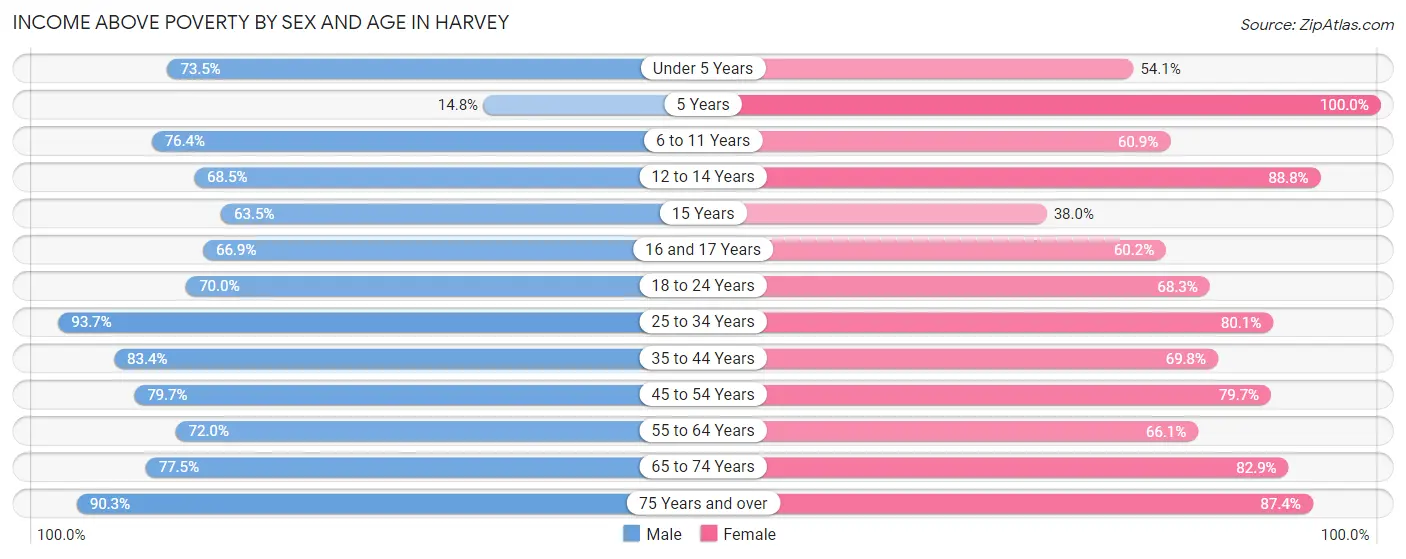
| Age Bracket | Male | Female |
| Under 5 Years | 338 (73.5%) | 242 (54.1%) |
| 5 Years | 27 (14.7%) | 134 (100.0%) |
| 6 to 11 Years | 709 (76.4%) | 569 (60.9%) |
| 12 to 14 Years | 357 (68.5%) | 374 (88.8%) |
| 15 Years | 47 (63.5%) | 35 (38.0%) |
| 16 and 17 Years | 222 (66.9%) | 145 (60.2%) |
| 18 to 24 Years | 597 (70.0%) | 837 (68.3%) |
| 25 to 34 Years | 1,405 (93.7%) | 1,200 (80.0%) |
| 35 to 44 Years | 862 (83.4%) | 785 (69.8%) |
| 45 to 54 Years | 959 (79.6%) | 1,104 (79.6%) |
| 55 to 64 Years | 993 (72.0%) | 607 (66.1%) |
| 65 to 74 Years | 551 (77.5%) | 717 (82.9%) |
| 75 Years and over | 410 (90.3%) | 783 (87.4%) |
| Total | 7,477 (77.6%) | 7,532 (74.0%) |
Income Below Poverty Among Married-Couple Families in Harvey
The poverty statistics for married-couple families in Harvey show that 10.4% or 223 of the total 2,152 families live below the poverty line. Families with 3 or 4 children have the highest poverty rate of 22.6%, comprising of 62 families. On the other hand, families with no children have the lowest poverty rate of 7.0%, which includes 81 families.
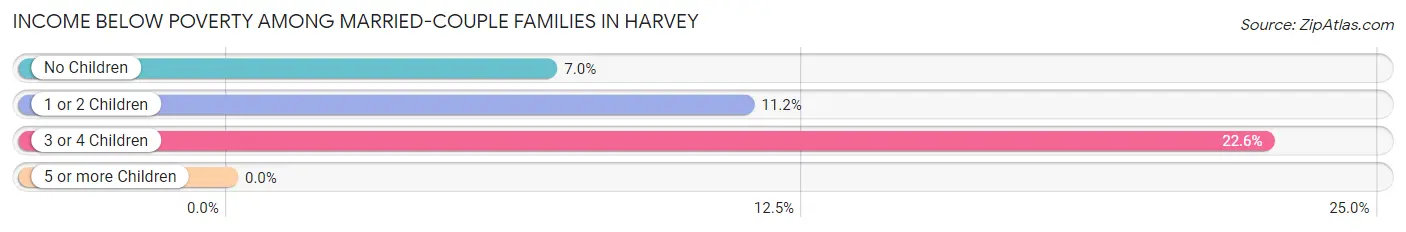
| Children | Above Poverty | Below Poverty |
| No Children | 1,084 (93.0%) | 81 (7.0%) |
| 1 or 2 Children | 632 (88.8%) | 80 (11.2%) |
| 3 or 4 Children | 213 (77.4%) | 62 (22.6%) |
| 5 or more Children | 0 (0.0%) | 0 (0.0%) |
| Total | 1,929 (89.6%) | 223 (10.4%) |
Income Below Poverty Among Single-Parent Households in Harvey
According to the poverty data in Harvey, 15.9% or 81 single-father households and 32.3% or 584 single-mother households are living below the poverty line. Among single-father households, those with 3 or 4 children have the highest poverty rate, with 9 households (25.0%) experiencing poverty. Likewise, among single-mother households, those with 3 or 4 children have the highest poverty rate, with 101 households (81.5%) falling below the poverty line.
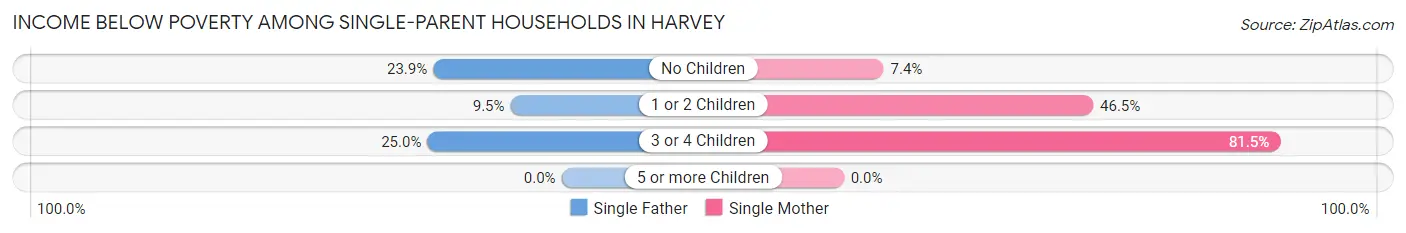
| Children | Single Father | Single Mother |
| No Children | 50 (23.9%) | 57 (7.4%) |
| 1 or 2 Children | 22 (9.5%) | 426 (46.5%) |
| 3 or 4 Children | 9 (25.0%) | 101 (81.5%) |
| 5 or more Children | 0 (0.0%) | 0 (0.0%) |
| Total | 81 (15.9%) | 584 (32.3%) |
Income Below Poverty Among Married-Couple vs Single-Parent Households in Harvey
The poverty data for Harvey shows that 223 of the married-couple family households (10.4%) and 665 of the single-parent households (28.7%) are living below the poverty level. Within the married-couple family households, those with 3 or 4 children have the highest poverty rate, with 62 households (22.6%) falling below the poverty line. Among the single-parent households, those with 3 or 4 children have the highest poverty rate, with 110 household (68.8%) living below poverty.
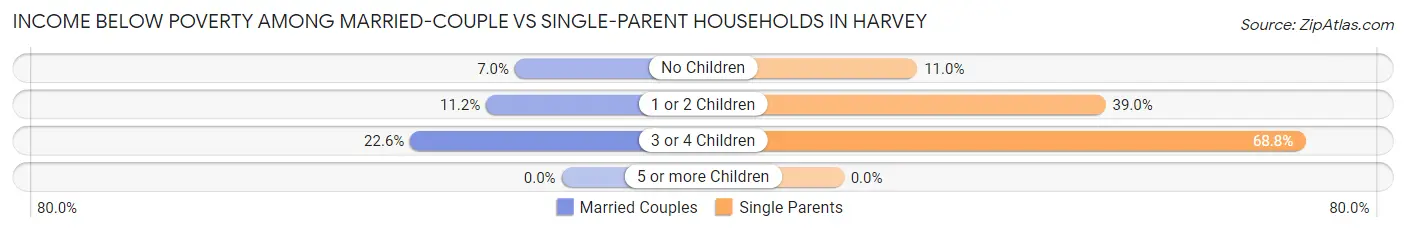
| Children | Married-Couple Families | Single-Parent Households |
| No Children | 81 (7.0%) | 107 (11.0%) |
| 1 or 2 Children | 80 (11.2%) | 448 (39.0%) |
| 3 or 4 Children | 62 (22.6%) | 110 (68.8%) |
| 5 or more Children | 0 (0.0%) | 0 (0.0%) |
| Total | 223 (10.4%) | 665 (28.7%) |
Race in Harvey
The most populous races in Harvey are Black / African American (11,812 | 59.0%), Hispanic or Latino (6,544 | 32.7%), and White / Caucasian (2,902 | 14.5%).
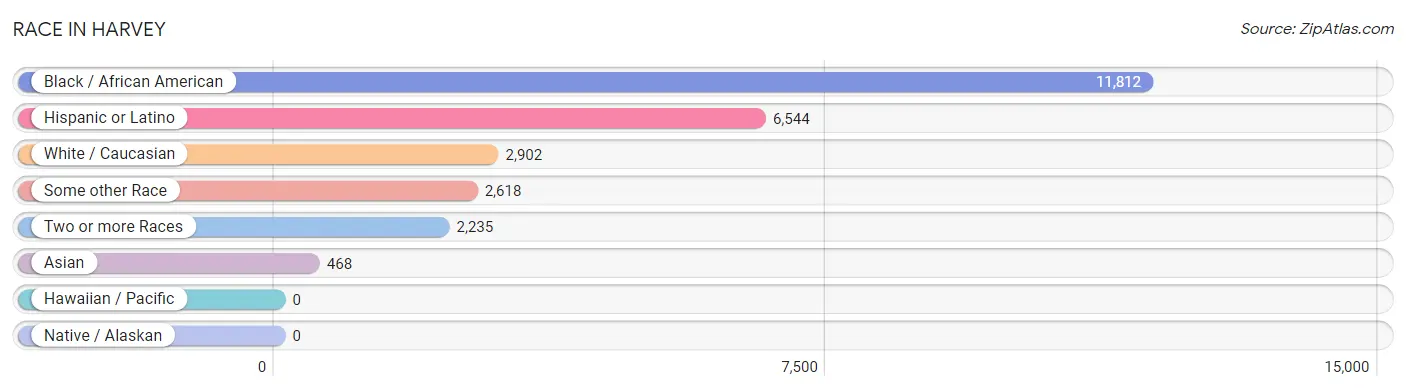
| Race | # Population | % Population |
| Asian | 468 | 2.3% |
| Black / African American | 11,812 | 59.0% |
| Hawaiian / Pacific | 0 | 0.0% |
| Hispanic or Latino | 6,544 | 32.7% |
| Native / Alaskan | 0 | 0.0% |
| White / Caucasian | 2,902 | 14.5% |
| Two or more Races | 2,235 | 11.2% |
| Some other Race | 2,618 | 13.1% |
| Total | 20,035 | 100.0% |
Ancestry in Harvey
The most populous ancestries reported in Harvey are Mexican (6,076 | 30.3%), Thai (450 | 2.2%), American (447 | 2.2%), German (259 | 1.3%), and Central American (203 | 1.0%), together accounting for 37.1% of all Harvey residents.
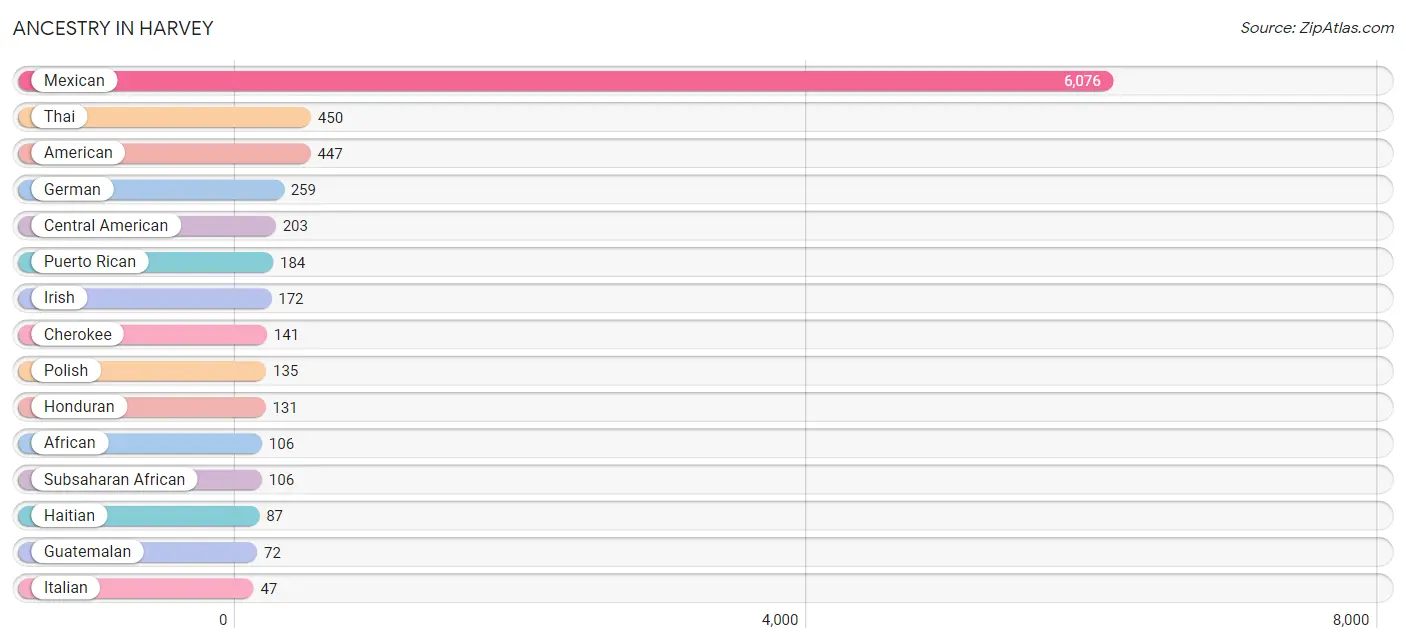
| Ancestry | # Population | % Population |
| African | 106 | 0.5% |
| American | 447 | 2.2% |
| Arab | 38 | 0.2% |
| Bhutanese | 12 | 0.1% |
| Burmese | 40 | 0.2% |
| Central American | 203 | 1.0% |
| Cherokee | 141 | 0.7% |
| Croatian | 12 | 0.1% |
| Cuban | 5 | 0.0% |
| Dominican | 38 | 0.2% |
| Dutch | 16 | 0.1% |
| English | 10 | 0.1% |
| French | 8 | 0.0% |
| French Canadian | 20 | 0.1% |
| German | 259 | 1.3% |
| Greek | 12 | 0.1% |
| Guamanian / Chamorro | 27 | 0.1% |
| Guatemalan | 72 | 0.4% |
| Haitian | 87 | 0.4% |
| Honduran | 131 | 0.6% |
| Indian (Asian) | 10 | 0.1% |
| Irish | 172 | 0.9% |
| Italian | 47 | 0.2% |
| Jamaican | 31 | 0.2% |
| Jordanian | 16 | 0.1% |
| Korean | 33 | 0.2% |
| Lithuanian | 8 | 0.0% |
| Mexican | 6,076 | 30.3% |
| Mexican American Indian | 20 | 0.1% |
| Norwegian | 1 | 0.0% |
| Polish | 135 | 0.7% |
| Puerto Rican | 184 | 0.9% |
| Samoan | 27 | 0.1% |
| Spanish | 28 | 0.1% |
| Sri Lankan | 42 | 0.2% |
| Subsaharan African | 106 | 0.5% |
| Swedish | 7 | 0.0% |
| Swiss | 8 | 0.0% |
| Syrian | 16 | 0.1% |
| Thai | 450 | 2.2% |
| Ukrainian | 1 | 0.0% | View All 41 Rows |
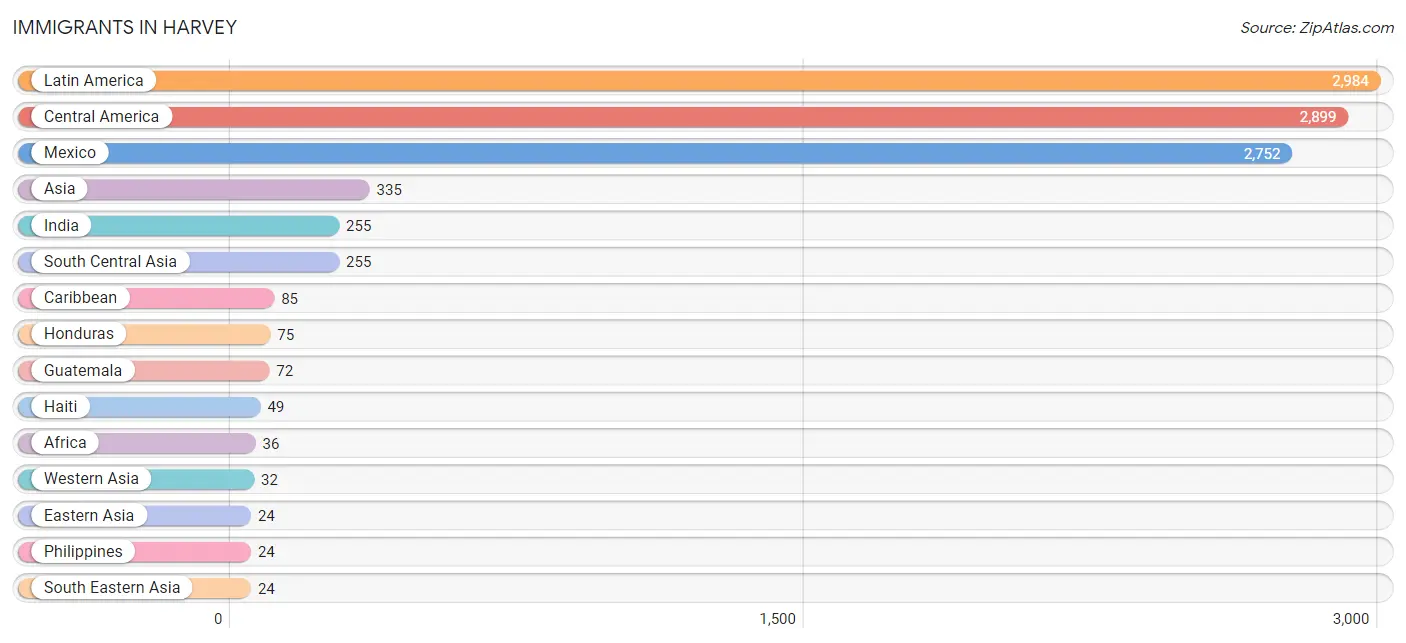
Immigrants in Harvey
The most numerous immigrant groups reported in Harvey came from Latin America (2,984 | 14.9%), Central America (2,899 | 14.5%), Mexico (2,752 | 13.7%), Asia (335 | 1.7%), and India (255 | 1.3%), together accounting for 46.0% of all Harvey residents.
| Immigration Origin | # Population | % Population |
| Africa | 36 | 0.2% |
| Asia | 335 | 1.7% |
| Caribbean | 85 | 0.4% |
| Central America | 2,899 | 14.5% |
| Cuba | 5 | 0.0% |
| Eastern Asia | 24 | 0.1% |
| Europe | 22 | 0.1% |
| Germany | 11 | 0.1% |
| Guatemala | 72 | 0.4% |
| Haiti | 49 | 0.2% |
| Honduras | 75 | 0.4% |
| India | 255 | 1.3% |
| Italy | 11 | 0.1% |
| Jamaica | 14 | 0.1% |
| Japan | 12 | 0.1% |
| Jordan | 16 | 0.1% |
| Korea | 12 | 0.1% |
| Latin America | 2,984 | 14.9% |
| Mexico | 2,752 | 13.7% |
| Philippines | 24 | 0.1% |
| South Central Asia | 255 | 1.3% |
| South Eastern Asia | 24 | 0.1% |
| Southern Europe | 11 | 0.1% |
| Syria | 16 | 0.1% |
| Trinidad and Tobago | 17 | 0.1% |
| Western Asia | 32 | 0.2% |
| Western Europe | 11 | 0.1% | View All 27 Rows |
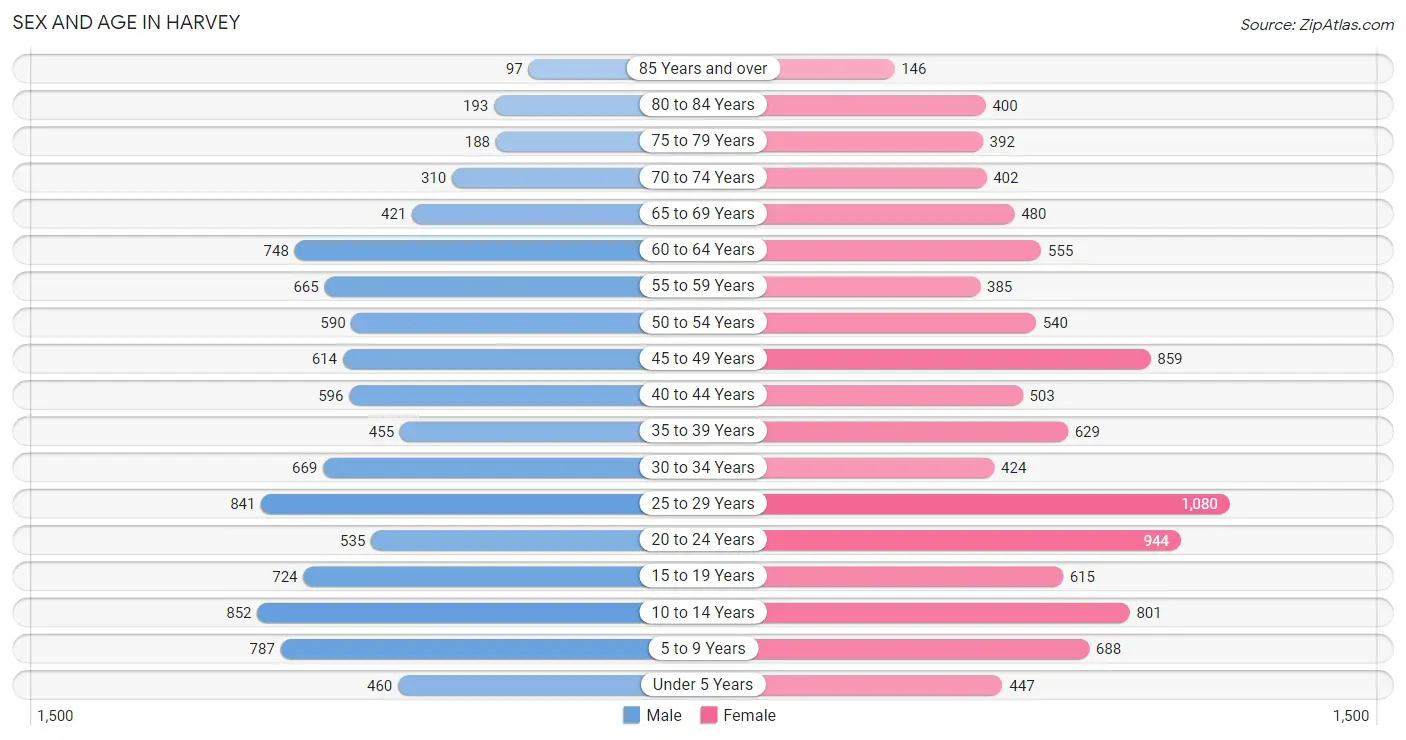
Sex and Age in Harvey
Sex and Age in Harvey
The most populous age groups in Harvey are 10 to 14 Years (852 | 8.7%) for men and 25 to 29 Years (1,080 | 10.5%) for women.
| Age Bracket | Male | Female |
| Under 5 Years | 460 (4.7%) | 447 (4.3%) |
| 5 to 9 Years | 787 (8.1%) | 688 (6.7%) |
| 10 to 14 Years | 852 (8.7%) | 801 (7.8%) |
| 15 to 19 Years | 724 (7.4%) | 615 (6.0%) |
| 20 to 24 Years | 535 (5.5%) | 944 (9.2%) |
| 25 to 29 Years | 841 (8.6%) | 1,080 (10.5%) |
| 30 to 34 Years | 669 (6.9%) | 424 (4.1%) |
| 35 to 39 Years | 455 (4.7%) | 629 (6.1%) |
| 40 to 44 Years | 596 (6.1%) | 503 (4.9%) |
| 45 to 49 Years | 614 (6.3%) | 859 (8.4%) |
| 50 to 54 Years | 590 (6.0%) | 540 (5.2%) |
| 55 to 59 Years | 665 (6.8%) | 385 (3.7%) |
| 60 to 64 Years | 748 (7.7%) | 555 (5.4%) |
| 65 to 69 Years | 421 (4.3%) | 480 (4.7%) |
| 70 to 74 Years | 310 (3.2%) | 402 (3.9%) |
| 75 to 79 Years | 188 (1.9%) | 392 (3.8%) |
| 80 to 84 Years | 193 (2.0%) | 400 (3.9%) |
| 85 Years and over | 97 (1.0%) | 146 (1.4%) |
| Total | 9,745 (100.0%) | 10,290 (100.0%) |
Families and Households in Harvey
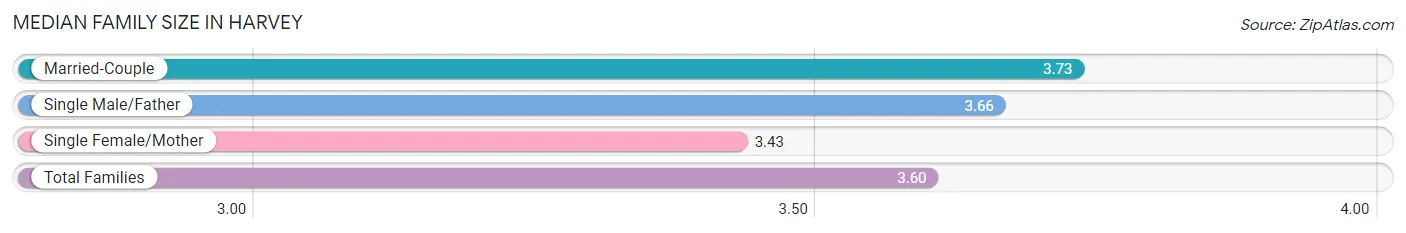
Median Family Size in Harvey
The median family size in Harvey is 3.60 persons per family, with married-couple families (2,152 | 48.2%) accounting for the largest median family size of 3.73 persons per family. On the other hand, single female/mother families (1,808 | 40.5%) represent the smallest median family size with 3.43 persons per family.
| Family Type | # Families | Family Size |
| Married-Couple | 2,152 (48.2%) | 3.73 |
| Single Male/Father | 508 (11.4%) | 3.66 |
| Single Female/Mother | 1,808 (40.5%) | 3.43 |
| Total Families | 4,468 (100.0%) | 3.60 |
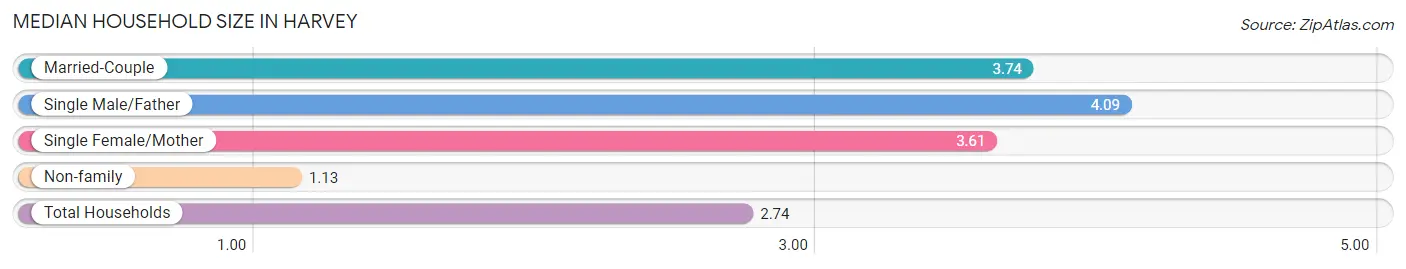
Median Household Size in Harvey
The median household size in Harvey is 2.74 persons per household, with single male/father households (508 | 7.0%) accounting for the largest median household size of 4.09 persons per household. non-family households (2,749 | 38.1%) represent the smallest median household size with 1.13 persons per household.
| Household Type | # Households | Household Size |
| Married-Couple | 2,152 (29.8%) | 3.74 |
| Single Male/Father | 508 (7.0%) | 4.09 |
| Single Female/Mother | 1,808 (25.1%) | 3.61 |
| Non-family | 2,749 (38.1%) | 1.13 |
| Total Households | 7,217 (100.0%) | 2.74 |
Household Size by Marriage Status in Harvey
Out of a total of 7,217 households in Harvey, 4,468 (61.9%) are family households, while 2,749 (38.1%) are nonfamily households. The most numerous type of family households are 2-person households, comprising 1,296, and the most common type of nonfamily households are 1-person households, comprising 2,481.
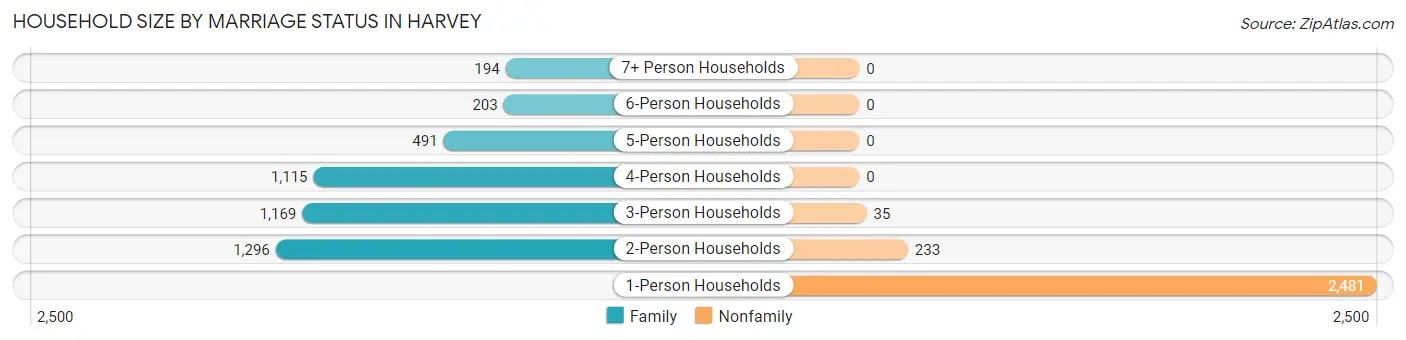
| Household Size | Family Households | Nonfamily Households |
| 1-Person Households | - | 2,481 (34.4%) |
| 2-Person Households | 1,296 (18.0%) | 233 (3.2%) |
| 3-Person Households | 1,169 (16.2%) | 35 (0.5%) |
| 4-Person Households | 1,115 (15.4%) | 0 (0.0%) |
| 5-Person Households | 491 (6.8%) | 0 (0.0%) |
| 6-Person Households | 203 (2.8%) | 0 (0.0%) |
| 7+ Person Households | 194 (2.7%) | 0 (0.0%) |
| Total | 4,468 (61.9%) | 2,749 (38.1%) |
Female Fertility in Harvey
Fertility by Age in Harvey
Average fertility rate in Harvey is 76.0 births per 1,000 women. Women in the age bracket of 20 to 34 years have the highest fertility rate with 162.0 births per 1,000 women. Women in the age bracket of 20 to 34 years acount for 100.0% of all women with births.
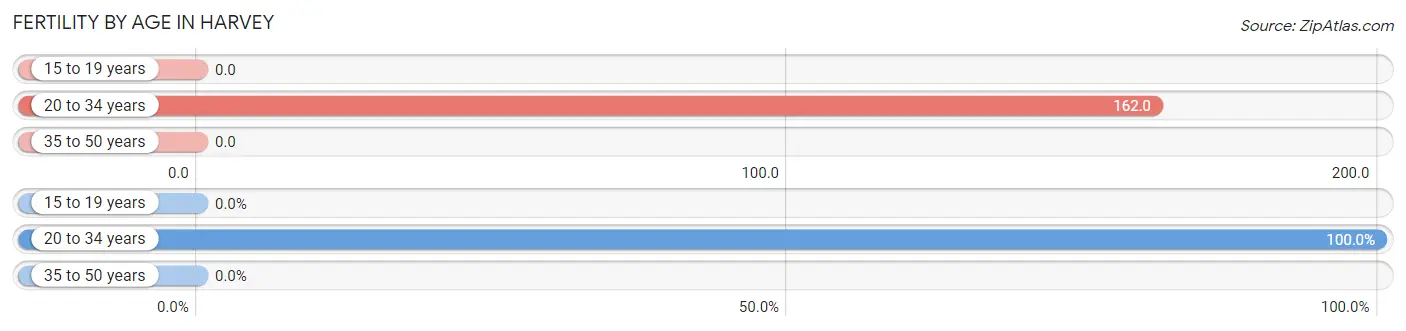
| Age Bracket | Women with Births | Births / 1,000 Women |
| 15 to 19 years | 0 (0.0%) | 0.0 |
| 20 to 34 years | 396 (100.0%) | 162.0 |
| 35 to 50 years | 0 (0.0%) | 0.0 |
| Total | 396 (100.0%) | 76.0 |
Fertility by Age by Marriage Status in Harvey
16.7% of women with births (396) in Harvey are married. The highest percentage of unmarried women with births falls into 20 to 34 years age bracket with 83.3% of them unmarried at the time of birth, while the lowest percentage of unmarried women with births belong to 20 to 34 years age bracket with 83.3% of them unmarried.
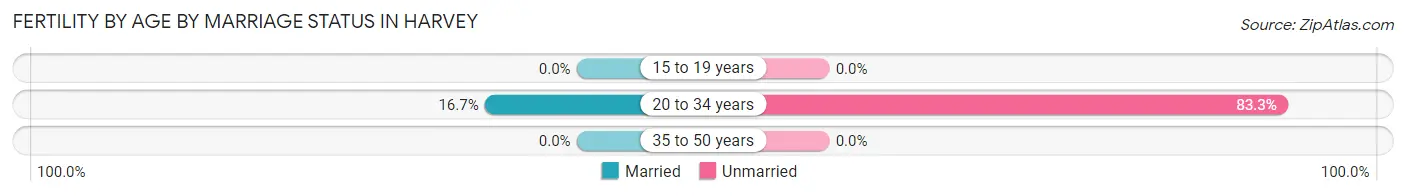
| Age Bracket | Married | Unmarried |
| 15 to 19 years | 0 (0.0%) | 0 (0.0%) |
| 20 to 34 years | 66 (16.7%) | 330 (83.3%) |
| 35 to 50 years | 0 (0.0%) | 0 (0.0%) |
| Total | 66 (16.7%) | 330 (83.3%) |
Fertility by Education in Harvey
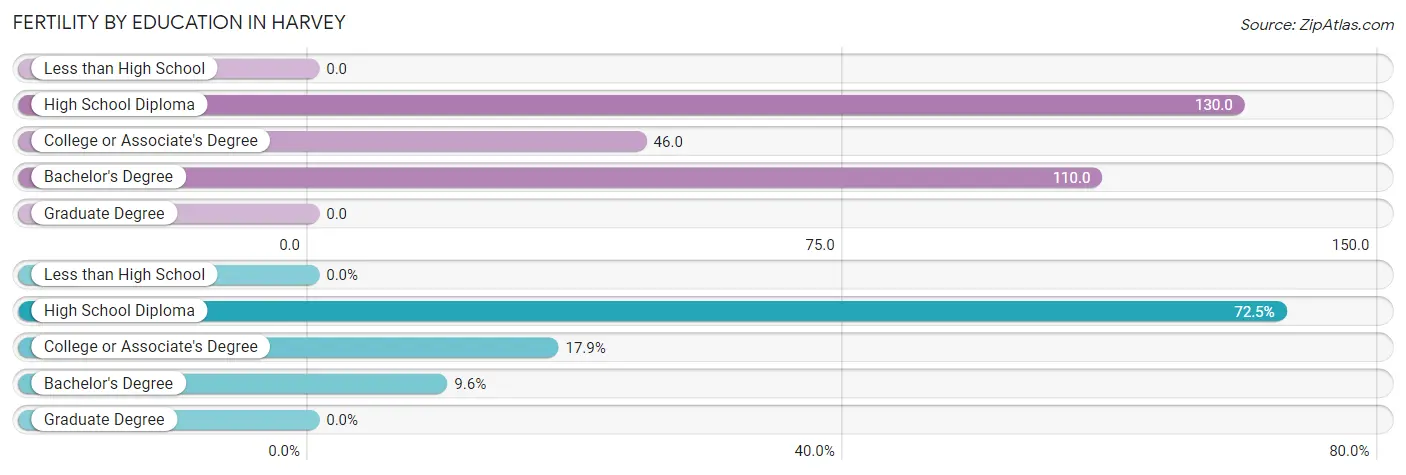
| Educational Attainment | Women with Births | Births / 1,000 Women |
| Less than High School | 0 (0.0%) | 0.0 |
| High School Diploma | 287 (72.5%) | 130.0 |
| College or Associate's Degree | 71 (17.9%) | 46.0 |
| Bachelor's Degree | 38 (9.6%) | 110.0 |
| Graduate Degree | 0 (0.0%) | 0.0 |
| Total | 396 (100.0%) | 76.0 |
Fertility by Education by Marriage Status in Harvey
83.3% of women with births in Harvey are unmarried. Women with the educational attainment of bachelor's degree are most likely to be married with 55.3% of them married at childbirth, while women with the educational attainment of high school diploma are least likely to be married with 95.1% of them unmarried at childbirth.
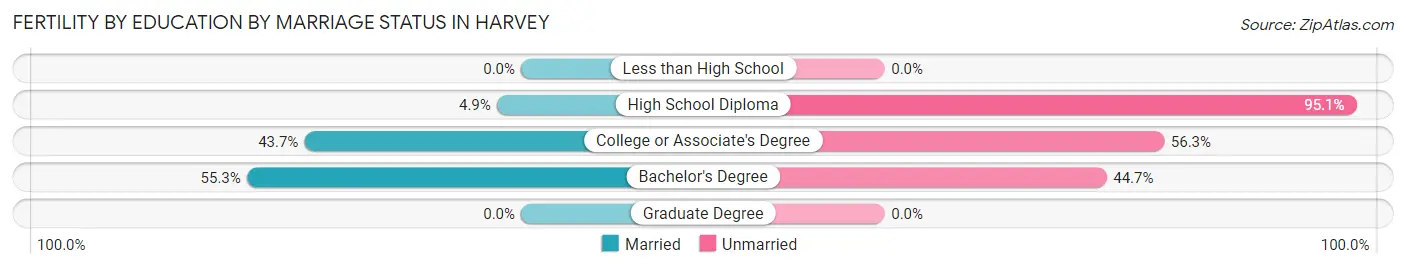
| Educational Attainment | Married | Unmarried |
| Less than High School | 0 (0.0%) | 0 (0.0%) |
| High School Diploma | 14 (4.9%) | 273 (95.1%) |
| College or Associate's Degree | 31 (43.7%) | 40 (56.3%) |
| Bachelor's Degree | 21 (55.3%) | 17 (44.7%) |
| Graduate Degree | 0 (0.0%) | 0 (0.0%) |
| Total | 66 (16.7%) | 330 (83.3%) |
Employment Characteristics in Harvey
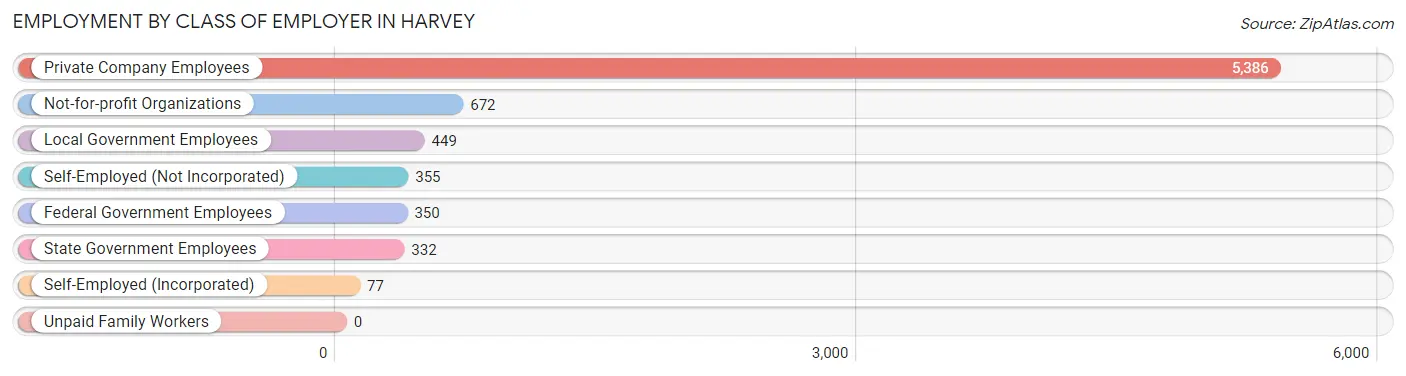
Employment by Class of Employer in Harvey
Among the 7,621 employed individuals in Harvey, private company employees (5,386 | 70.7%), not-for-profit organizations (672 | 8.8%), and local government employees (449 | 5.9%) make up the most common classes of employment.
| Employer Class | # Employees | % Employees |
| Private Company Employees | 5,386 | 70.7% |
| Self-Employed (Incorporated) | 77 | 1.0% |
| Self-Employed (Not Incorporated) | 355 | 4.7% |
| Not-for-profit Organizations | 672 | 8.8% |
| Local Government Employees | 449 | 5.9% |
| State Government Employees | 332 | 4.4% |
| Federal Government Employees | 350 | 4.6% |
| Unpaid Family Workers | 0 | 0.0% |
| Total | 7,621 | 100.0% |
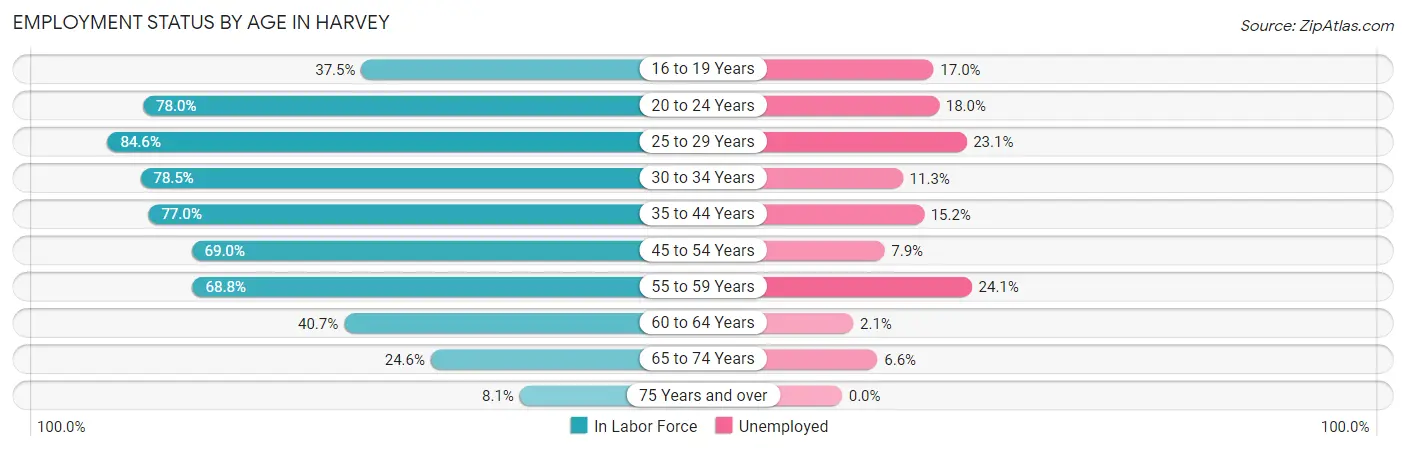
Employment Status by Age in Harvey
According to the labor force statistics for Harvey, out of the total population over 16 years of age (15,834), 58.8% or 9,310 individuals are in the labor force, with 14.6% or 1,359 of them unemployed. The age group with the highest labor force participation rate is 25 to 29 years, with 84.6% or 1,625 individuals in the labor force. Within the labor force, the 55 to 59 years age range has the highest percentage of unemployed individuals, with 24.1% or 174 of them being unemployed.
| Age Bracket | In Labor Force | Unemployed |
| 16 to 19 Years | 440 (37.5%) | 75 (17.0%) |
| 20 to 24 Years | 1,154 (78.0%) | 208 (18.0%) |
| 25 to 29 Years | 1,625 (84.6%) | 375 (23.1%) |
| 30 to 34 Years | 858 (78.5%) | 97 (11.3%) |
| 35 to 44 Years | 1,681 (77.0%) | 256 (15.2%) |
| 45 to 54 Years | 1,796 (69.0%) | 142 (7.9%) |
| 55 to 59 Years | 722 (68.8%) | 174 (24.1%) |
| 60 to 64 Years | 530 (40.7%) | 11 (2.1%) |
| 65 to 74 Years | 397 (24.6%) | 26 (6.6%) |
| 75 Years and over | 115 (8.1%) | 0 (0.0%) |
| Total | 9,310 (58.8%) | 1,359 (14.6%) |
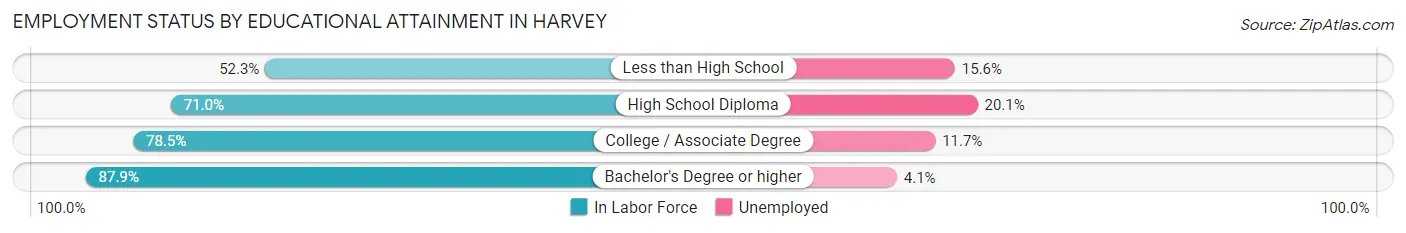
Employment Status by Educational Attainment in Harvey
According to labor force statistics for Harvey, 71.0% of individuals (7,209) out of the total population between 25 and 64 years of age (10,153) are in the labor force, with 14.6% or 1,053 of them being unemployed. The group with the highest labor force participation rate are those with the educational attainment of bachelor's degree or higher, with 87.9% or 990 individuals in the labor force. Within the labor force, individuals with high school diploma education have the highest percentage of unemployment, with 20.1% or 583 of them being unemployed.
| Educational Attainment | In Labor Force | Unemployed |
| Less than High School | 1,115 (52.3%) | 333 (15.6%) |
| High School Diploma | 2,899 (71.0%) | 821 (20.1%) |
| College / Associate Degree | 2,207 (78.5%) | 329 (11.7%) |
| Bachelor's Degree or higher | 990 (87.9%) | 46 (4.1%) |
| Total | 7,209 (71.0%) | 1,482 (14.6%) |
Employment Occupations by Sex in Harvey
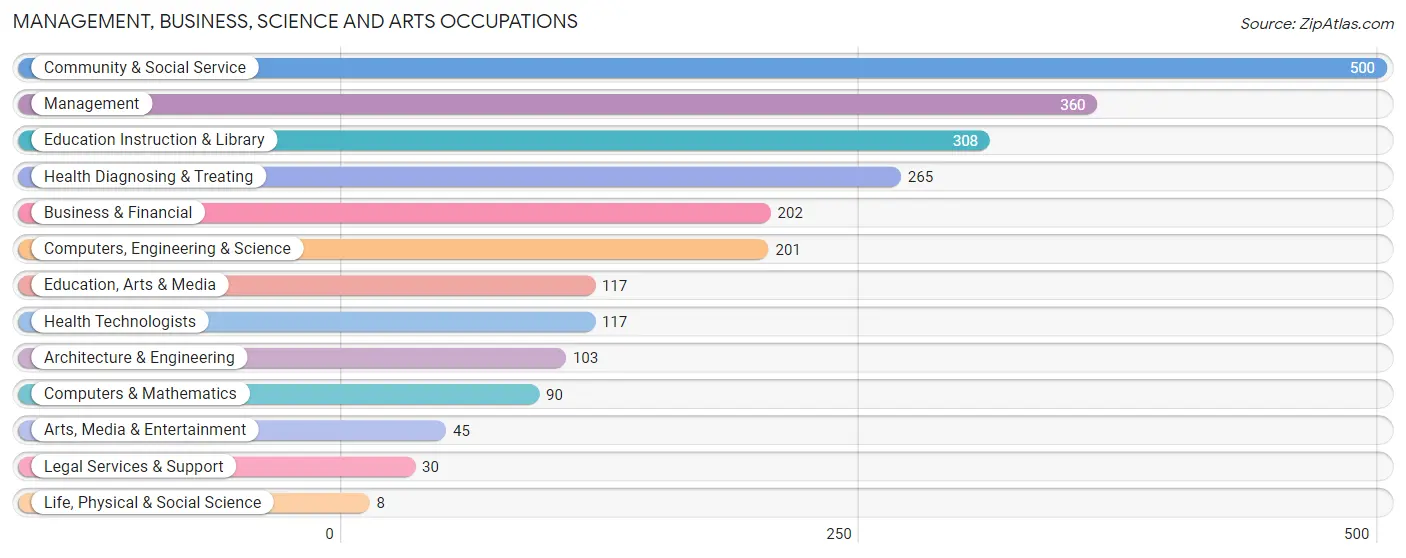
Management, Business, Science and Arts Occupations
The most common Management, Business, Science and Arts occupations in Harvey are Community & Social Service (500 | 6.3%), Management (360 | 4.5%), Education Instruction & Library (308 | 3.9%), Health Diagnosing & Treating (265 | 3.3%), and Business & Financial (202 | 2.5%).
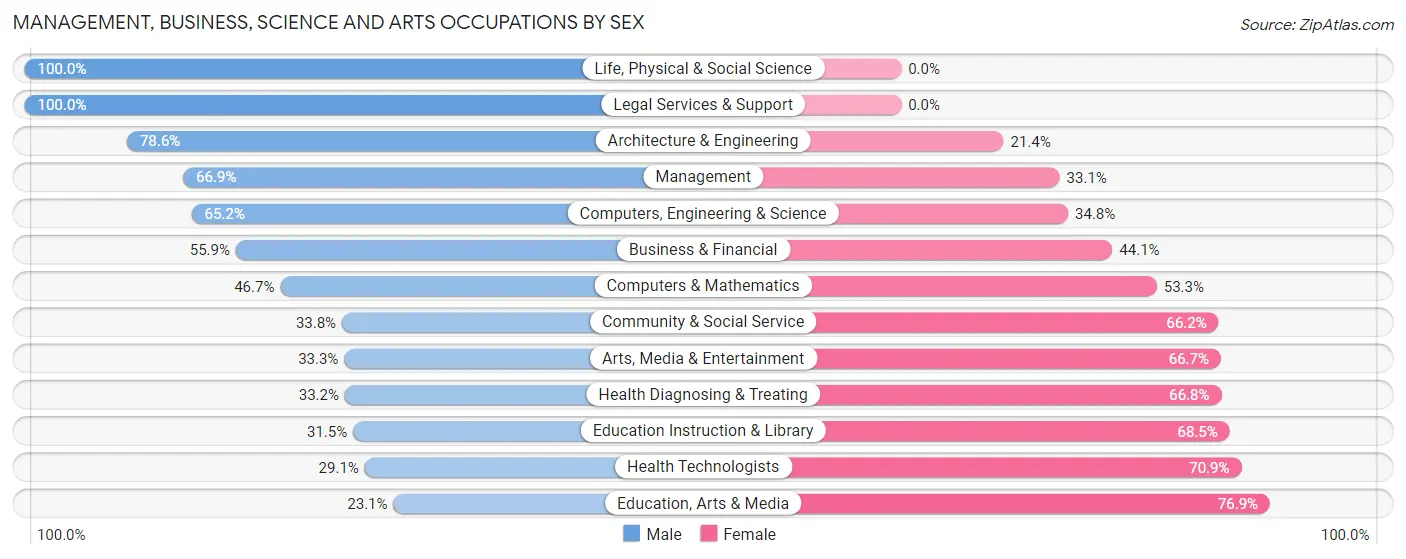
Management, Business, Science and Arts Occupations by Sex
Within the Management, Business, Science and Arts occupations in Harvey, the most male-oriented occupations are Life, Physical & Social Science (100.0%), Legal Services & Support (100.0%), and Architecture & Engineering (78.6%), while the most female-oriented occupations are Education, Arts & Media (76.9%), Health Technologists (70.9%), and Education Instruction & Library (68.5%).
| Occupation | Male | Female |
| Management | 241 (66.9%) | 119 (33.1%) |
| Business & Financial | 113 (55.9%) | 89 (44.1%) |
| Computers, Engineering & Science | 131 (65.2%) | 70 (34.8%) |
| Computers & Mathematics | 42 (46.7%) | 48 (53.3%) |
| Architecture & Engineering | 81 (78.6%) | 22 (21.4%) |
| Life, Physical & Social Science | 8 (100.0%) | 0 (0.0%) |
| Community & Social Service | 169 (33.8%) | 331 (66.2%) |
| Education, Arts & Media | 27 (23.1%) | 90 (76.9%) |
| Legal Services & Support | 30 (100.0%) | 0 (0.0%) |
| Education Instruction & Library | 97 (31.5%) | 211 (68.5%) |
| Arts, Media & Entertainment | 15 (33.3%) | 30 (66.7%) |
| Health Diagnosing & Treating | 88 (33.2%) | 177 (66.8%) |
| Health Technologists | 34 (29.1%) | 83 (70.9%) |
| Total (Category) | 742 (48.6%) | 786 (51.4%) |
| Total (Overall) | 3,816 (48.0%) | 4,137 (52.0%) |
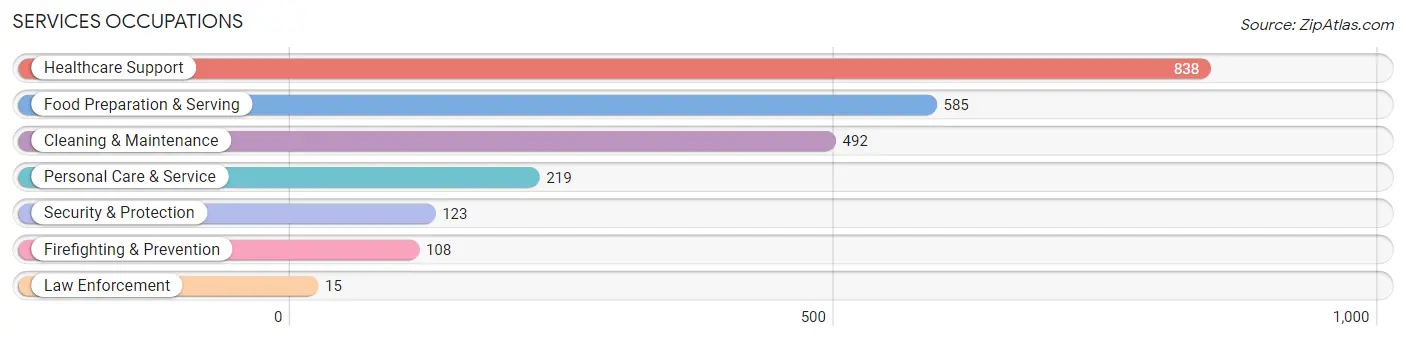
Services Occupations
The most common Services occupations in Harvey are Healthcare Support (838 | 10.5%), Food Preparation & Serving (585 | 7.4%), Cleaning & Maintenance (492 | 6.2%), Personal Care & Service (219 | 2.8%), and Security & Protection (123 | 1.5%).
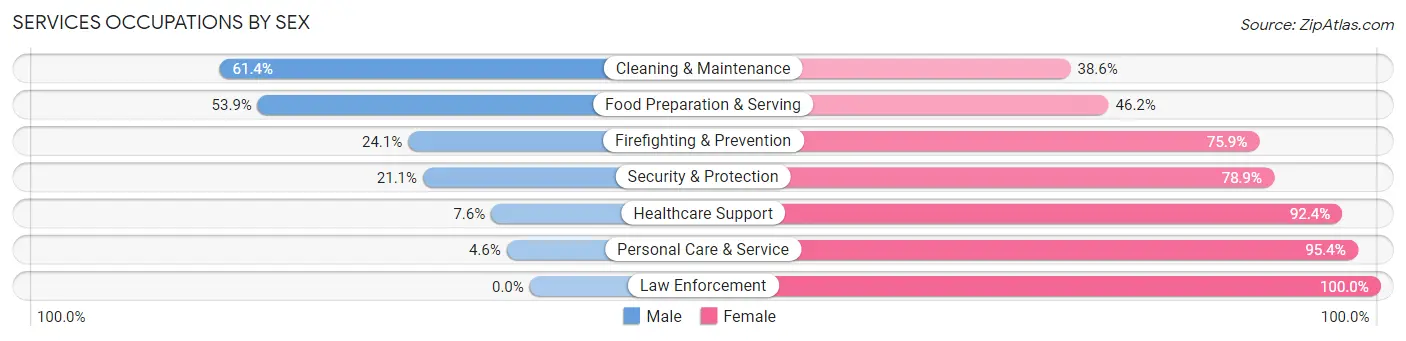
Services Occupations by Sex
Within the Services occupations in Harvey, the most male-oriented occupations are Cleaning & Maintenance (61.4%), Food Preparation & Serving (53.8%), and Firefighting & Prevention (24.1%), while the most female-oriented occupations are Law Enforcement (100.0%), Personal Care & Service (95.4%), and Healthcare Support (92.4%).
| Occupation | Male | Female |
| Healthcare Support | 64 (7.6%) | 774 (92.4%) |
| Security & Protection | 26 (21.1%) | 97 (78.9%) |
| Firefighting & Prevention | 26 (24.1%) | 82 (75.9%) |
| Law Enforcement | 0 (0.0%) | 15 (100.0%) |
| Food Preparation & Serving | 315 (53.8%) | 270 (46.2%) |
| Cleaning & Maintenance | 302 (61.4%) | 190 (38.6%) |
| Personal Care & Service | 10 (4.6%) | 209 (95.4%) |
| Total (Category) | 717 (31.8%) | 1,540 (68.2%) |
| Total (Overall) | 3,816 (48.0%) | 4,137 (52.0%) |
Sales and Office Occupations
The most common Sales and Office occupations in Harvey are Sales & Related (897 | 11.3%), and Office & Administration (893 | 11.2%).
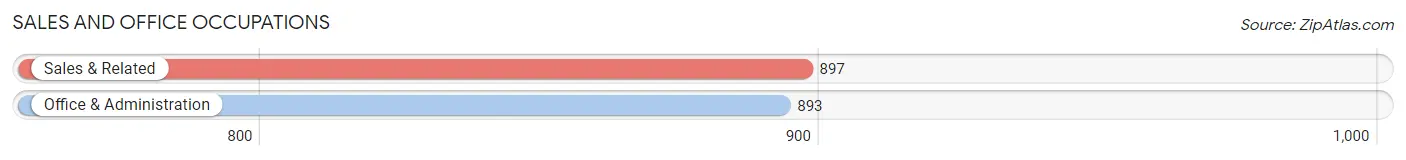
Sales and Office Occupations by Sex
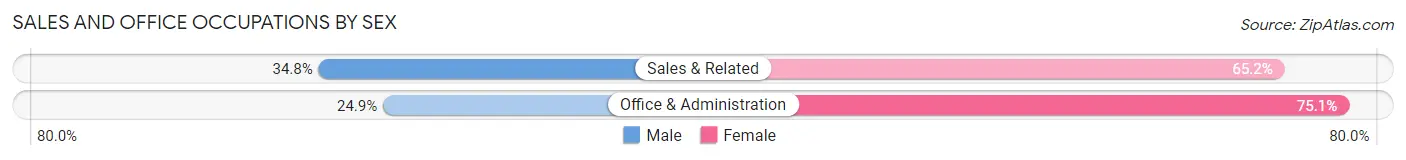
| Occupation | Male | Female |
| Sales & Related | 312 (34.8%) | 585 (65.2%) |
| Office & Administration | 222 (24.9%) | 671 (75.1%) |
| Total (Category) | 534 (29.8%) | 1,256 (70.2%) |
| Total (Overall) | 3,816 (48.0%) | 4,137 (52.0%) |
Natural Resources, Construction and Maintenance Occupations
The most common Natural Resources, Construction and Maintenance occupations in Harvey are Construction & Extraction (560 | 7.0%), and Installation, Maintenance & Repair (90 | 1.1%).
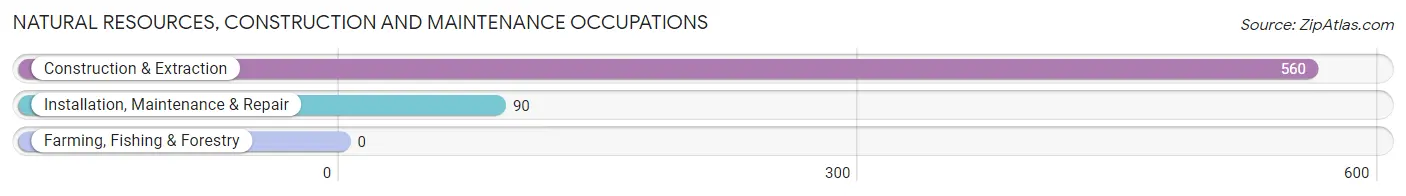
Natural Resources, Construction and Maintenance Occupations by Sex
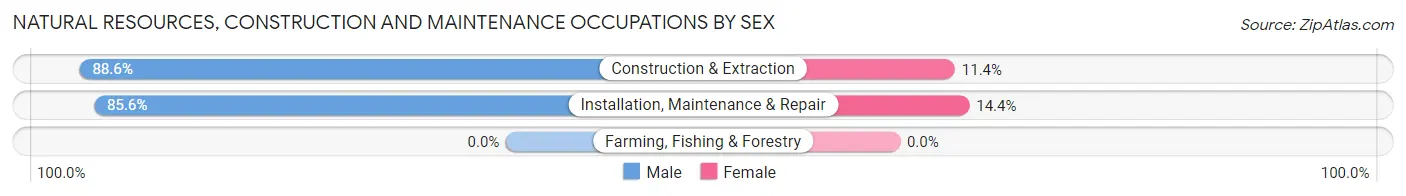
| Occupation | Male | Female |
| Farming, Fishing & Forestry | 0 (0.0%) | 0 (0.0%) |
| Construction & Extraction | 496 (88.6%) | 64 (11.4%) |
| Installation, Maintenance & Repair | 77 (85.6%) | 13 (14.4%) |
| Total (Category) | 573 (88.1%) | 77 (11.8%) |
| Total (Overall) | 3,816 (48.0%) | 4,137 (52.0%) |
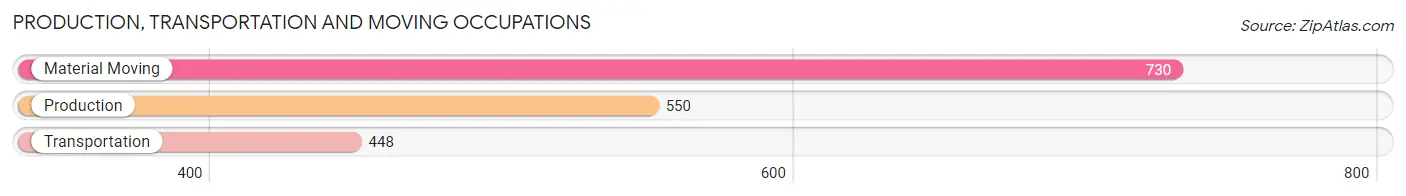
Production, Transportation and Moving Occupations
The most common Production, Transportation and Moving occupations in Harvey are Material Moving (730 | 9.2%), Production (550 | 6.9%), and Transportation (448 | 5.6%).
Production, Transportation and Moving Occupations by Sex
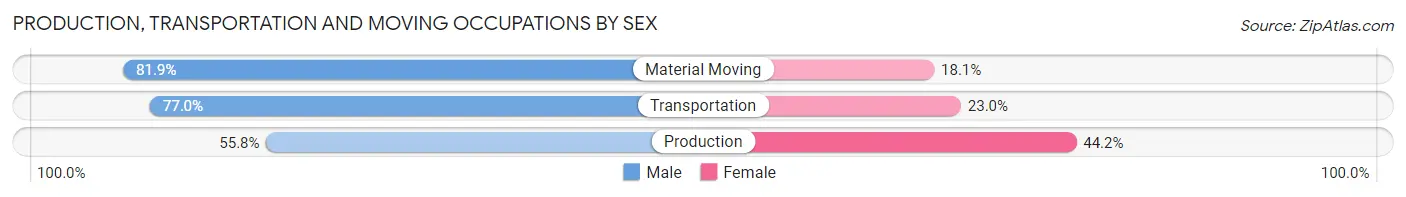
| Occupation | Male | Female |
| Production | 307 (55.8%) | 243 (44.2%) |
| Transportation | 345 (77.0%) | 103 (23.0%) |
| Material Moving | 598 (81.9%) | 132 (18.1%) |
| Total (Category) | 1,250 (72.3%) | 478 (27.7%) |
| Total (Overall) | 3,816 (48.0%) | 4,137 (52.0%) |
Employment Industries by Sex in Harvey
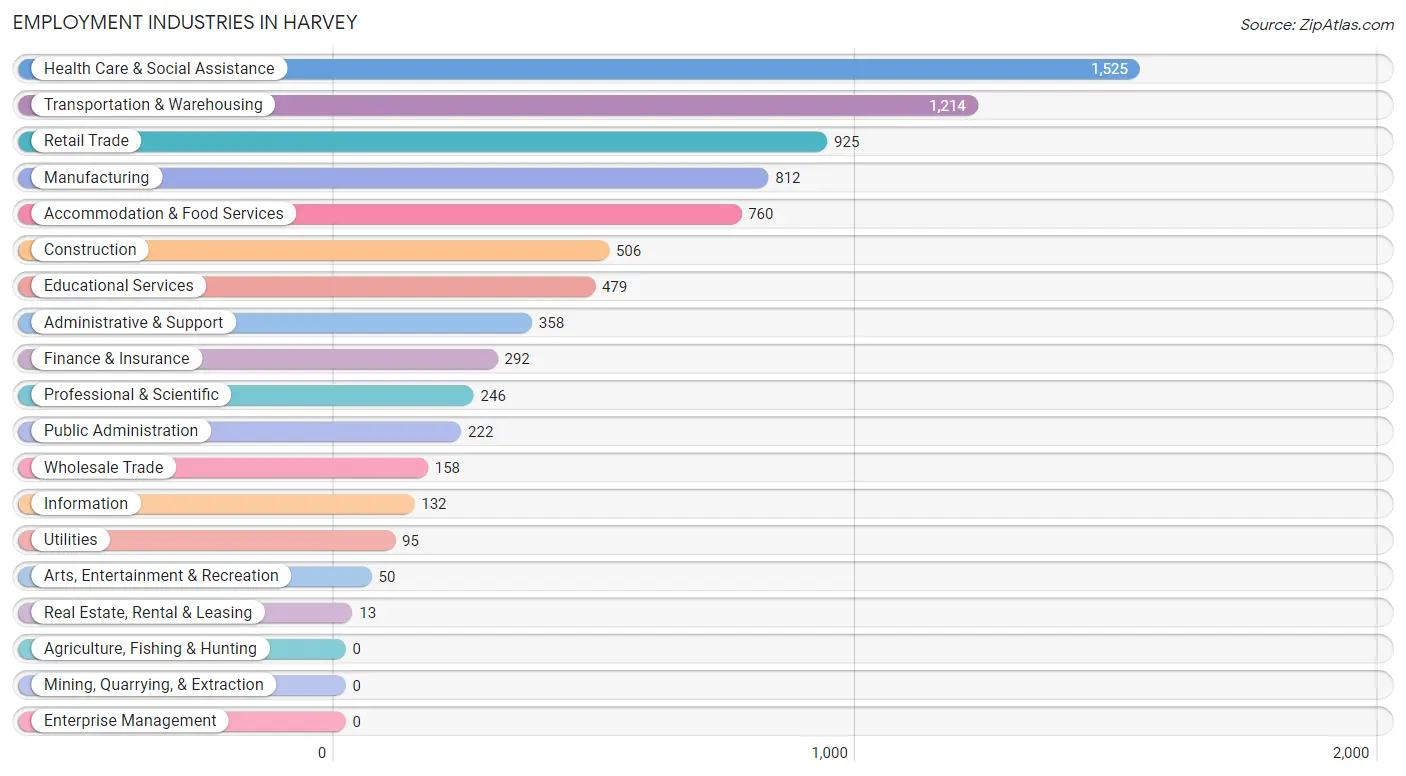
Employment Industries in Harvey
The major employment industries in Harvey include Health Care & Social Assistance (1,525 | 19.2%), Transportation & Warehousing (1,214 | 15.3%), Retail Trade (925 | 11.6%), Manufacturing (812 | 10.2%), and Accommodation & Food Services (760 | 9.6%).
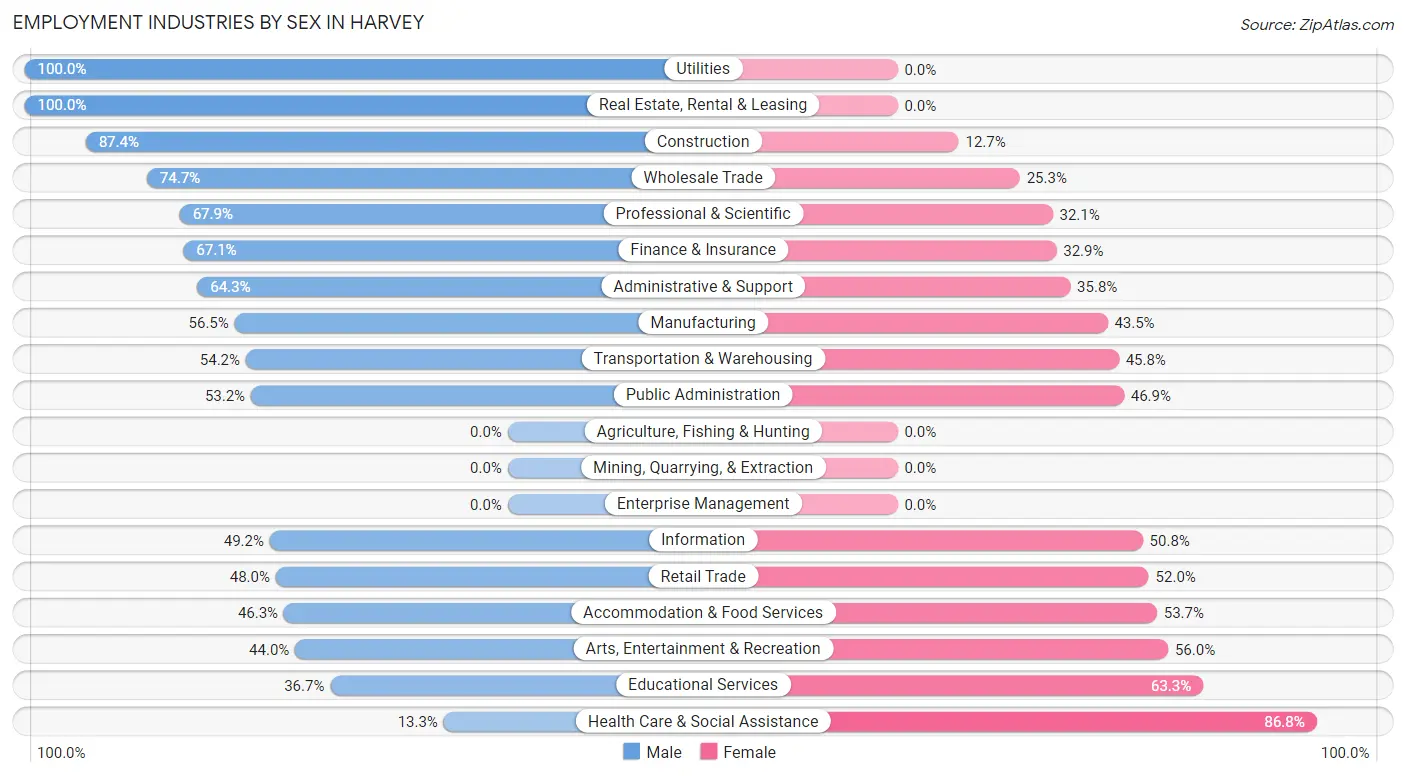
Employment Industries by Sex in Harvey
The Harvey industries that see more men than women are Utilities (100.0%), Real Estate, Rental & Leasing (100.0%), and Construction (87.4%), whereas the industries that tend to have a higher number of women are Health Care & Social Assistance (86.8%), Educational Services (63.3%), and Arts, Entertainment & Recreation (56.0%).
| Industry | Male | Female |
| Agriculture, Fishing & Hunting | 0 (0.0%) | 0 (0.0%) |
| Mining, Quarrying, & Extraction | 0 (0.0%) | 0 (0.0%) |
| Construction | 442 (87.4%) | 64 (12.7%) |
| Manufacturing | 459 (56.5%) | 353 (43.5%) |
| Wholesale Trade | 118 (74.7%) | 40 (25.3%) |
| Retail Trade | 444 (48.0%) | 481 (52.0%) |
| Transportation & Warehousing | 658 (54.2%) | 556 (45.8%) |
| Utilities | 95 (100.0%) | 0 (0.0%) |
| Information | 65 (49.2%) | 67 (50.8%) |
| Finance & Insurance | 196 (67.1%) | 96 (32.9%) |
| Real Estate, Rental & Leasing | 13 (100.0%) | 0 (0.0%) |
| Professional & Scientific | 167 (67.9%) | 79 (32.1%) |
| Enterprise Management | 0 (0.0%) | 0 (0.0%) |
| Administrative & Support | 230 (64.2%) | 128 (35.7%) |
| Educational Services | 176 (36.7%) | 303 (63.3%) |
| Health Care & Social Assistance | 202 (13.3%) | 1,323 (86.8%) |
| Arts, Entertainment & Recreation | 22 (44.0%) | 28 (56.0%) |
| Accommodation & Food Services | 352 (46.3%) | 408 (53.7%) |
| Public Administration | 118 (53.1%) | 104 (46.9%) |
| Total | 3,816 (48.0%) | 4,137 (52.0%) |
Education in Harvey
School Enrollment in Harvey
The most common levels of schooling among the 4,601 students in Harvey are middle school (1,184 | 25.7%), high school (1,136 | 24.7%), and elementary school (977 | 21.2%).
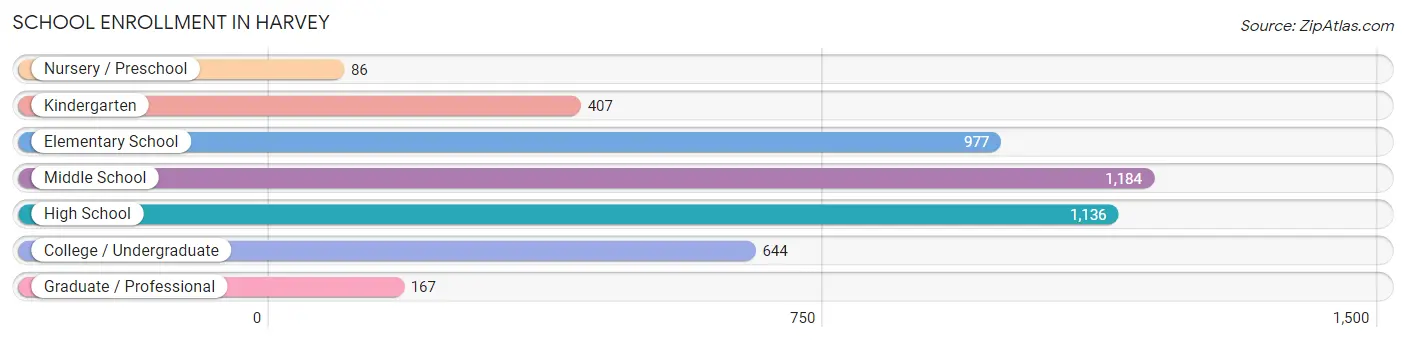
| School Level | # Students | % Students |
| Nursery / Preschool | 86 | 1.9% |
| Kindergarten | 407 | 8.8% |
| Elementary School | 977 | 21.2% |
| Middle School | 1,184 | 25.7% |
| High School | 1,136 | 24.7% |
| College / Undergraduate | 644 | 14.0% |
| Graduate / Professional | 167 | 3.6% |
| Total | 4,601 | 100.0% |
School Enrollment by Age by Funding Source in Harvey
Out of a total of 4,601 students who are enrolled in schools in Harvey, 327 (7.1%) attend a private institution, while the remaining 4,274 (92.9%) are enrolled in public schools. The age group of 35 years and over has the highest likelihood of being enrolled in private schools, with 163 (62.2% in the age bracket) enrolled. Conversely, the age group of 3 to 4 year olds has the lowest likelihood of being enrolled in a private school, with 58 (100.0% in the age bracket) attending a public institution.
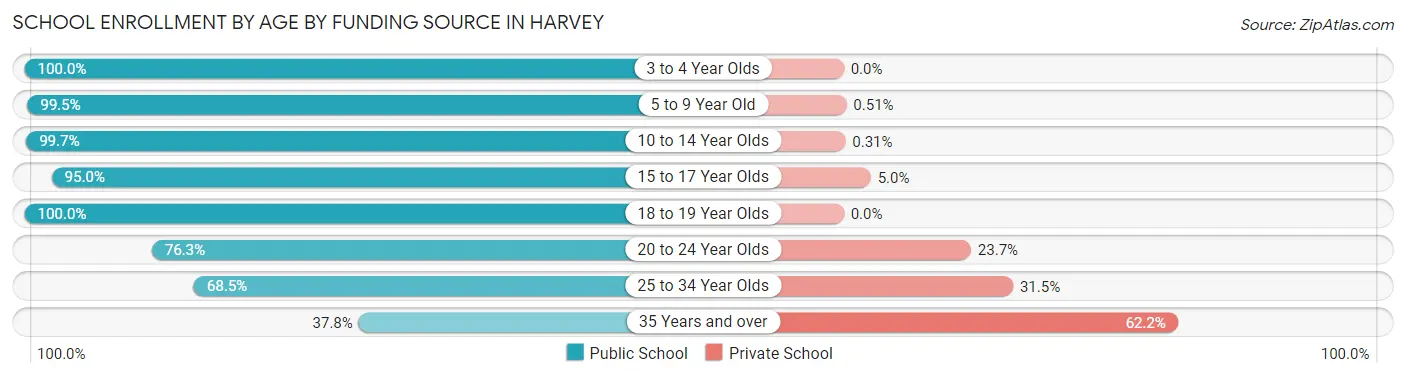
| Age Bracket | Public School | Private School |
| 3 to 4 Year Olds | 58 (100.0%) | 0 (0.0%) |
| 5 to 9 Year Old | 1,181 (99.5%) | 6 (0.5%) |
| 10 to 14 Year Olds | 1,603 (99.7%) | 5 (0.3%) |
| 15 to 17 Year Olds | 603 (95.0%) | 32 (5.0%) |
| 18 to 19 Year Olds | 394 (100.0%) | 0 (0.0%) |
| 20 to 24 Year Olds | 235 (76.3%) | 73 (23.7%) |
| 25 to 34 Year Olds | 102 (68.5%) | 47 (31.5%) |
| 35 Years and over | 99 (37.8%) | 163 (62.2%) |
| Total | 4,274 (92.9%) | 327 (7.1%) |
Educational Attainment by Field of Study in Harvey
Business (494 | 34.0%), arts & humanities (202 | 13.9%), education (187 | 12.9%), science & technology (104 | 7.2%), and bio, nature & agricultural (94 | 6.5%) are the most common fields of study among 1,453 individuals in Harvey who have obtained a bachelor's degree or higher.
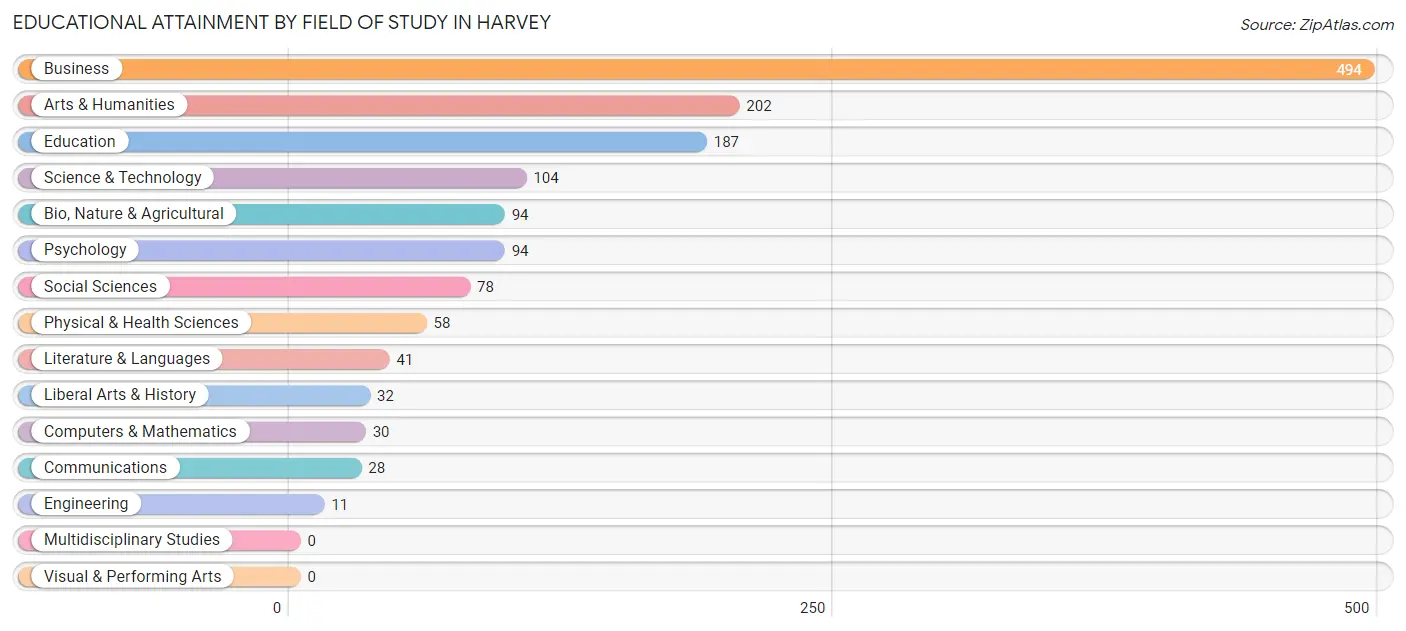
| Field of Study | # Graduates | % Graduates |
| Computers & Mathematics | 30 | 2.1% |
| Bio, Nature & Agricultural | 94 | 6.5% |
| Physical & Health Sciences | 58 | 4.0% |
| Psychology | 94 | 6.5% |
| Social Sciences | 78 | 5.4% |
| Engineering | 11 | 0.8% |
| Multidisciplinary Studies | 0 | 0.0% |
| Science & Technology | 104 | 7.2% |
| Business | 494 | 34.0% |
| Education | 187 | 12.9% |
| Literature & Languages | 41 | 2.8% |
| Liberal Arts & History | 32 | 2.2% |
| Visual & Performing Arts | 0 | 0.0% |
| Communications | 28 | 1.9% |
| Arts & Humanities | 202 | 13.9% |
| Total | 1,453 | 100.0% |
Transportation & Commute in Harvey
Vehicle Availability by Sex in Harvey
The most prevalent vehicle ownership categories in Harvey are males with 2 vehicles (1,191, accounting for 31.8%) and females with 2 vehicles (1,286, making up 30.9%).
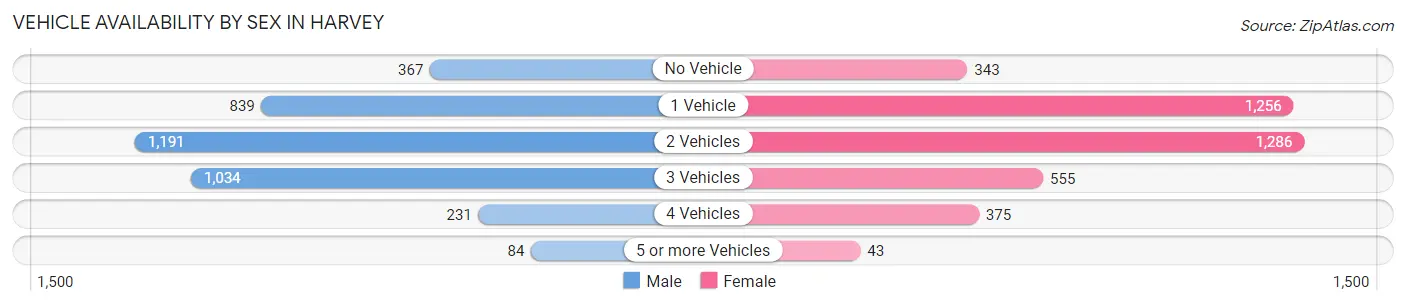
| Vehicles Available | Male | Female |
| No Vehicle | 367 (9.8%) | 343 (8.9%) |
| 1 Vehicle | 839 (22.4%) | 1,256 (32.6%) |
| 2 Vehicles | 1,191 (31.8%) | 1,286 (33.3%) |
| 3 Vehicles | 1,034 (27.6%) | 555 (14.4%) |
| 4 Vehicles | 231 (6.2%) | 375 (9.7%) |
| 5 or more Vehicles | 84 (2.2%) | 43 (1.1%) |
| Total | 3,746 (100.0%) | 3,858 (100.0%) |
Commute Time in Harvey
The most frequently occuring commute durations in Harvey are 30 to 34 minutes (1,191 commuters, 16.5%), 10 to 14 minutes (1,017 commuters, 14.1%), and 15 to 19 minutes (893 commuters, 12.3%).
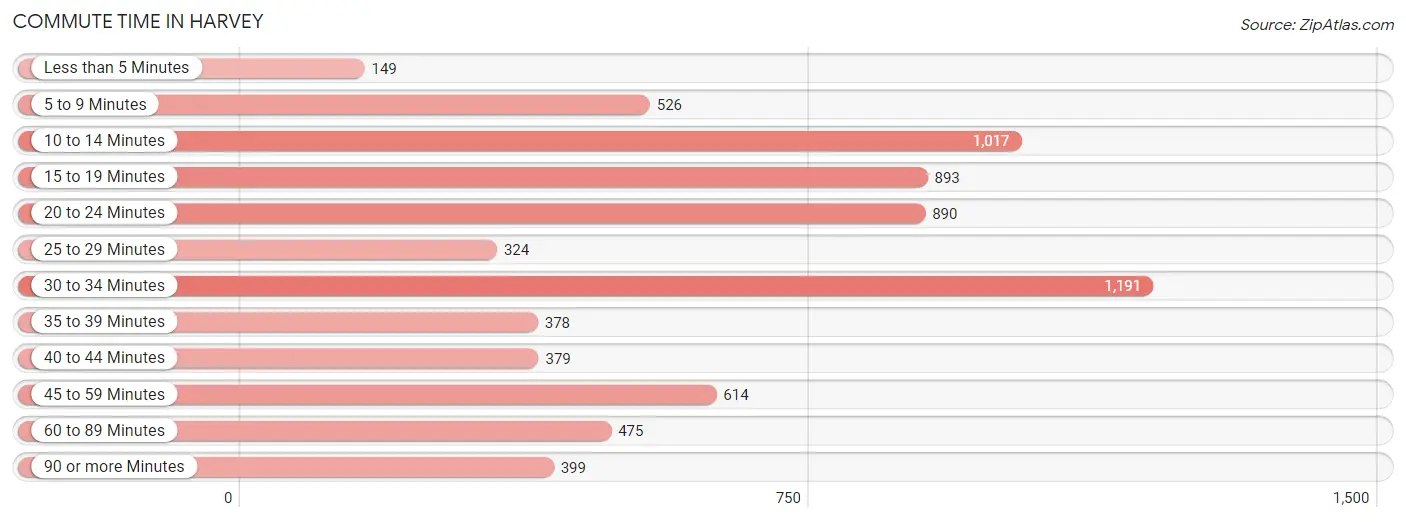
| Commute Time | # Commuters | % Commuters |
| Less than 5 Minutes | 149 | 2.1% |
| 5 to 9 Minutes | 526 | 7.3% |
| 10 to 14 Minutes | 1,017 | 14.1% |
| 15 to 19 Minutes | 893 | 12.3% |
| 20 to 24 Minutes | 890 | 12.3% |
| 25 to 29 Minutes | 324 | 4.5% |
| 30 to 34 Minutes | 1,191 | 16.5% |
| 35 to 39 Minutes | 378 | 5.2% |
| 40 to 44 Minutes | 379 | 5.2% |
| 45 to 59 Minutes | 614 | 8.5% |
| 60 to 89 Minutes | 475 | 6.6% |
| 90 or more Minutes | 399 | 5.5% |
Commute Time by Sex in Harvey
The most common commute times in Harvey are 30 to 34 minutes (532 commuters, 14.7%) for males and 30 to 34 minutes (659 commuters, 18.2%) for females.
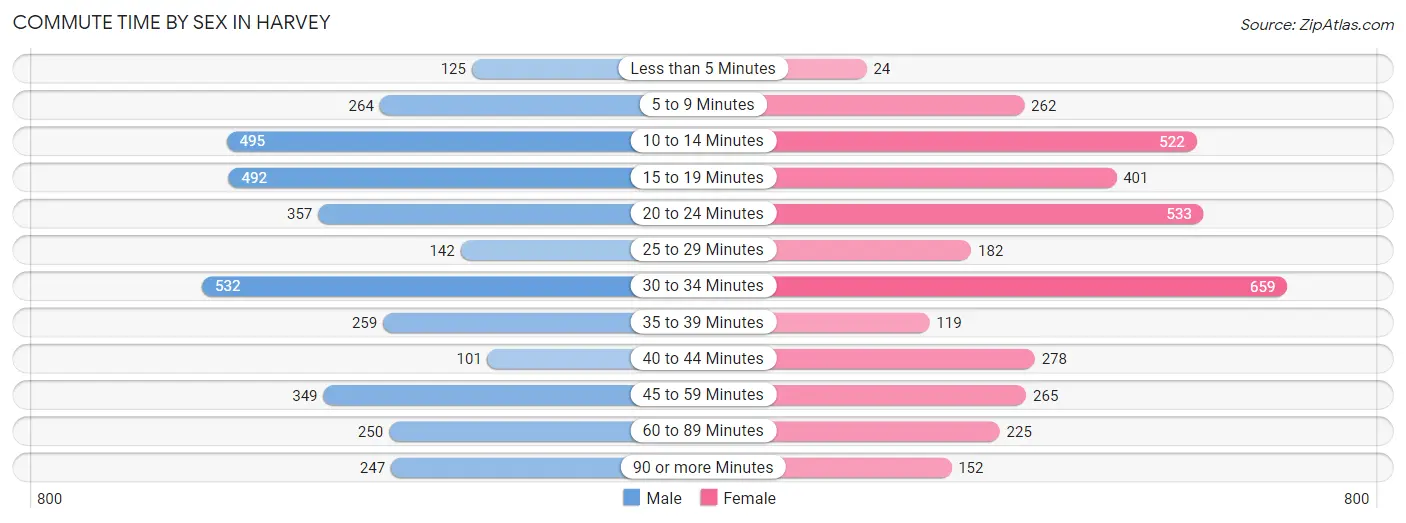
| Commute Time | Male | Female |
| Less than 5 Minutes | 125 (3.5%) | 24 (0.7%) |
| 5 to 9 Minutes | 264 (7.3%) | 262 (7.2%) |
| 10 to 14 Minutes | 495 (13.7%) | 522 (14.4%) |
| 15 to 19 Minutes | 492 (13.6%) | 401 (11.1%) |
| 20 to 24 Minutes | 357 (9.9%) | 533 (14.7%) |
| 25 to 29 Minutes | 142 (3.9%) | 182 (5.0%) |
| 30 to 34 Minutes | 532 (14.7%) | 659 (18.2%) |
| 35 to 39 Minutes | 259 (7.2%) | 119 (3.3%) |
| 40 to 44 Minutes | 101 (2.8%) | 278 (7.7%) |
| 45 to 59 Minutes | 349 (9.7%) | 265 (7.3%) |
| 60 to 89 Minutes | 250 (6.9%) | 225 (6.2%) |
| 90 or more Minutes | 247 (6.8%) | 152 (4.2%) |
Time of Departure to Work by Sex in Harvey
The most frequent times of departure to work in Harvey are 4:00 PM to 11:59 PM (656, 18.2%) for males and 7:00 AM to 7:29 AM (506, 14.0%) for females.
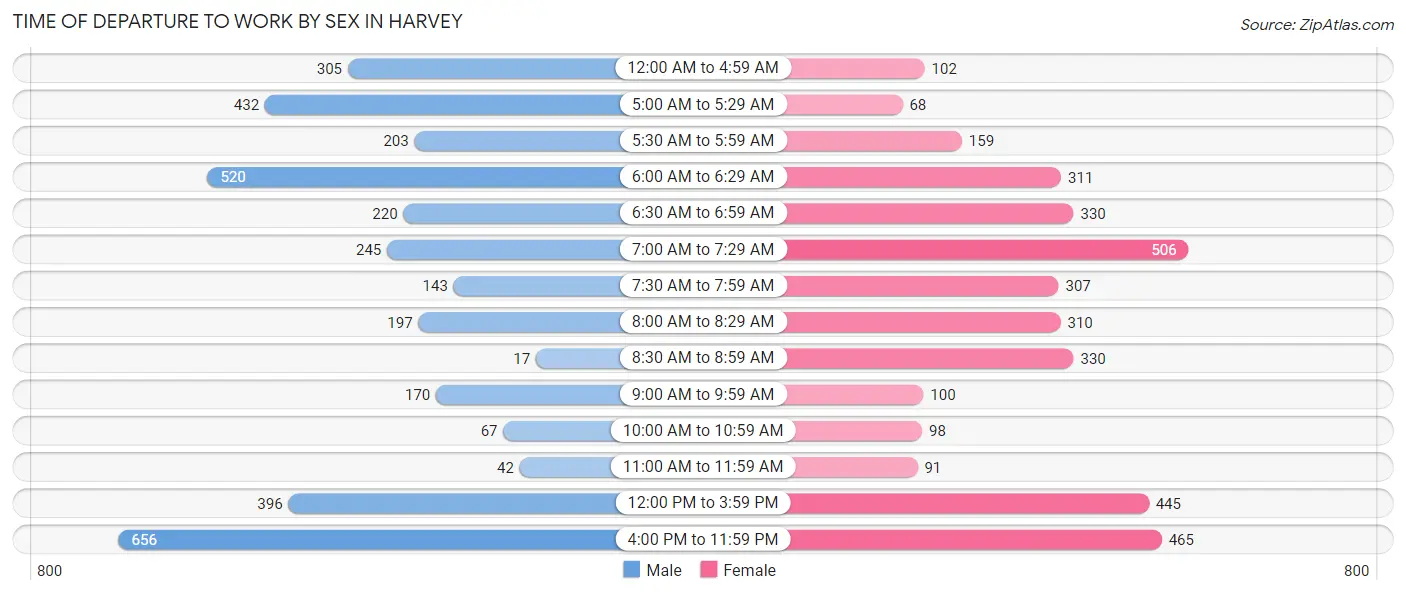
| Time of Departure | Male | Female |
| 12:00 AM to 4:59 AM | 305 (8.4%) | 102 (2.8%) |
| 5:00 AM to 5:29 AM | 432 (12.0%) | 68 (1.9%) |
| 5:30 AM to 5:59 AM | 203 (5.6%) | 159 (4.4%) |
| 6:00 AM to 6:29 AM | 520 (14.4%) | 311 (8.6%) |
| 6:30 AM to 6:59 AM | 220 (6.1%) | 330 (9.1%) |
| 7:00 AM to 7:29 AM | 245 (6.8%) | 506 (14.0%) |
| 7:30 AM to 7:59 AM | 143 (4.0%) | 307 (8.5%) |
| 8:00 AM to 8:29 AM | 197 (5.4%) | 310 (8.6%) |
| 8:30 AM to 8:59 AM | 17 (0.5%) | 330 (9.1%) |
| 9:00 AM to 9:59 AM | 170 (4.7%) | 100 (2.8%) |
| 10:00 AM to 10:59 AM | 67 (1.8%) | 98 (2.7%) |
| 11:00 AM to 11:59 AM | 42 (1.2%) | 91 (2.5%) |
| 12:00 PM to 3:59 PM | 396 (11.0%) | 445 (12.3%) |
| 4:00 PM to 11:59 PM | 656 (18.2%) | 465 (12.8%) |
| Total | 3,613 (100.0%) | 3,622 (100.0%) |
Housing Occupancy in Harvey
Occupancy by Ownership in Harvey
Of the total 7,217 dwellings in Harvey, owner-occupied units account for 3,584 (49.7%), while renter-occupied units make up 3,633 (50.3%).
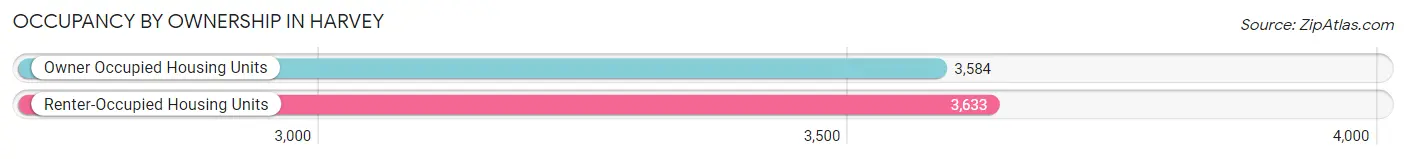
| Occupancy | # Housing Units | % Housing Units |
| Owner Occupied Housing Units | 3,584 | 49.7% |
| Renter-Occupied Housing Units | 3,633 | 50.3% |
| Total Occupied Housing Units | 7,217 | 100.0% |
Occupancy by Household Size in Harvey
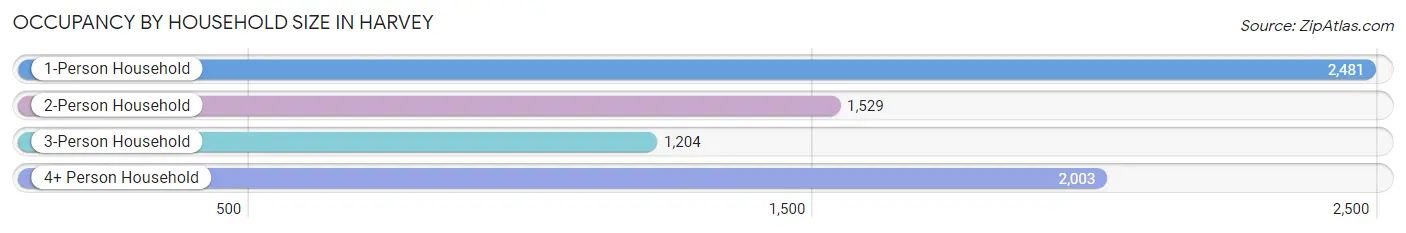
| Household Size | # Housing Units | % Housing Units |
| 1-Person Household | 2,481 | 34.4% |
| 2-Person Household | 1,529 | 21.2% |
| 3-Person Household | 1,204 | 16.7% |
| 4+ Person Household | 2,003 | 27.8% |
| Total Housing Units | 7,217 | 100.0% |
Occupancy by Ownership by Household Size in Harvey
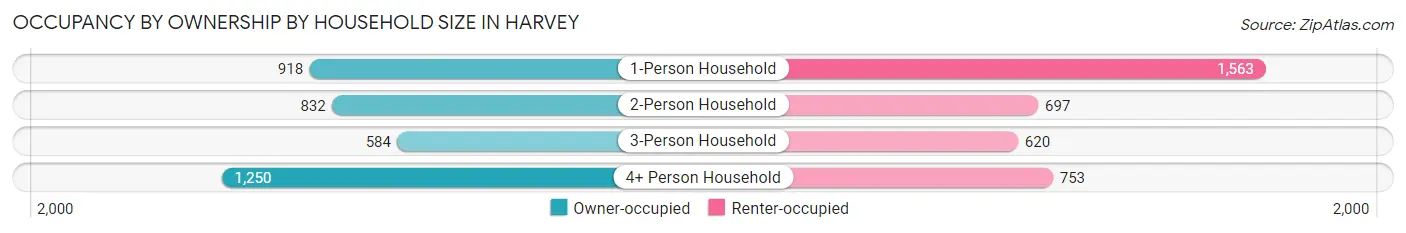
| Household Size | Owner-occupied | Renter-occupied |
| 1-Person Household | 918 (37.0%) | 1,563 (63.0%) |
| 2-Person Household | 832 (54.4%) | 697 (45.6%) |
| 3-Person Household | 584 (48.5%) | 620 (51.5%) |
| 4+ Person Household | 1,250 (62.4%) | 753 (37.6%) |
| Total Housing Units | 3,584 (49.7%) | 3,633 (50.3%) |
Occupancy by Educational Attainment in Harvey
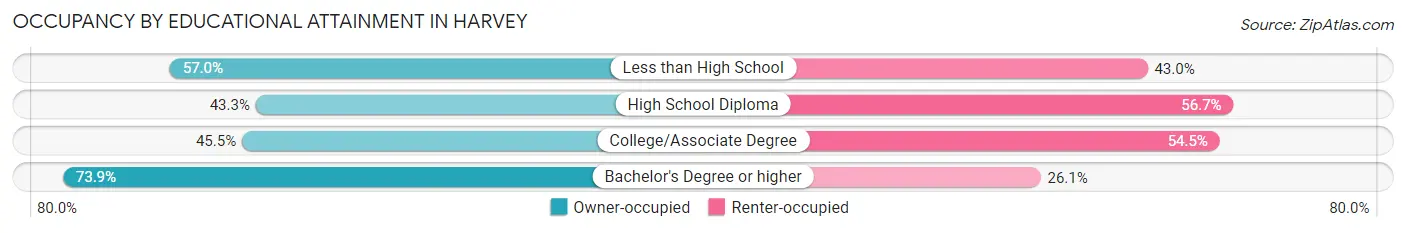
| Household Size | Owner-occupied | Renter-occupied |
| Less than High School | 772 (57.0%) | 583 (43.0%) |
| High School Diploma | 1,221 (43.3%) | 1,596 (56.7%) |
| College/Associate Degree | 1,058 (45.5%) | 1,266 (54.5%) |
| Bachelor's Degree or higher | 533 (73.9%) | 188 (26.1%) |
Occupancy by Age of Householder in Harvey
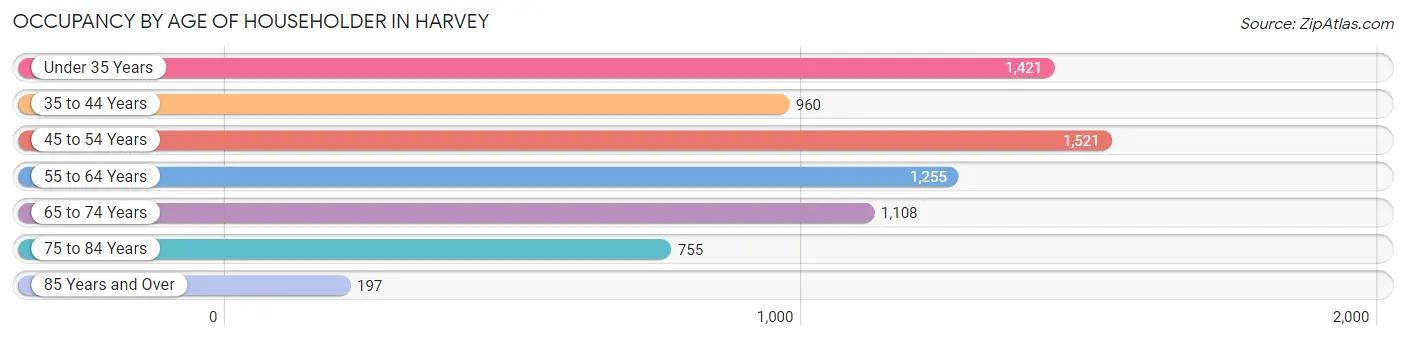
| Age Bracket | # Households | % Households |
| Under 35 Years | 1,421 | 19.7% |
| 35 to 44 Years | 960 | 13.3% |
| 45 to 54 Years | 1,521 | 21.1% |
| 55 to 64 Years | 1,255 | 17.4% |
| 65 to 74 Years | 1,108 | 15.3% |
| 75 to 84 Years | 755 | 10.5% |
| 85 Years and Over | 197 | 2.7% |
| Total | 7,217 | 100.0% |
Housing Finances in Harvey
Median Income by Occupancy in Harvey
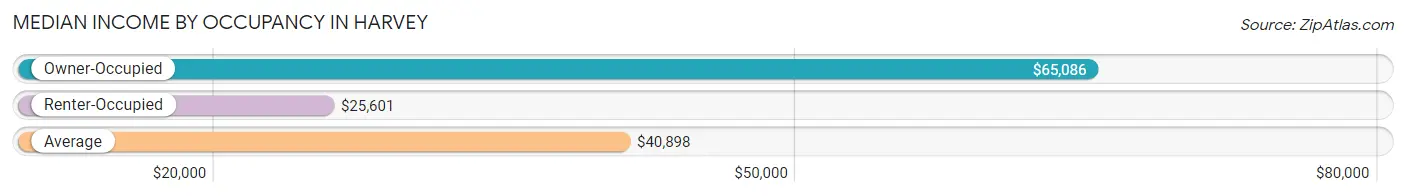
| Occupancy Type | # Households | Median Income |
| Owner-Occupied | 3,584 (49.7%) | $65,086 |
| Renter-Occupied | 3,633 (50.3%) | $25,601 |
| Average | 7,217 (100.0%) | $40,898 |
Occupancy by Householder Income Bracket in Harvey
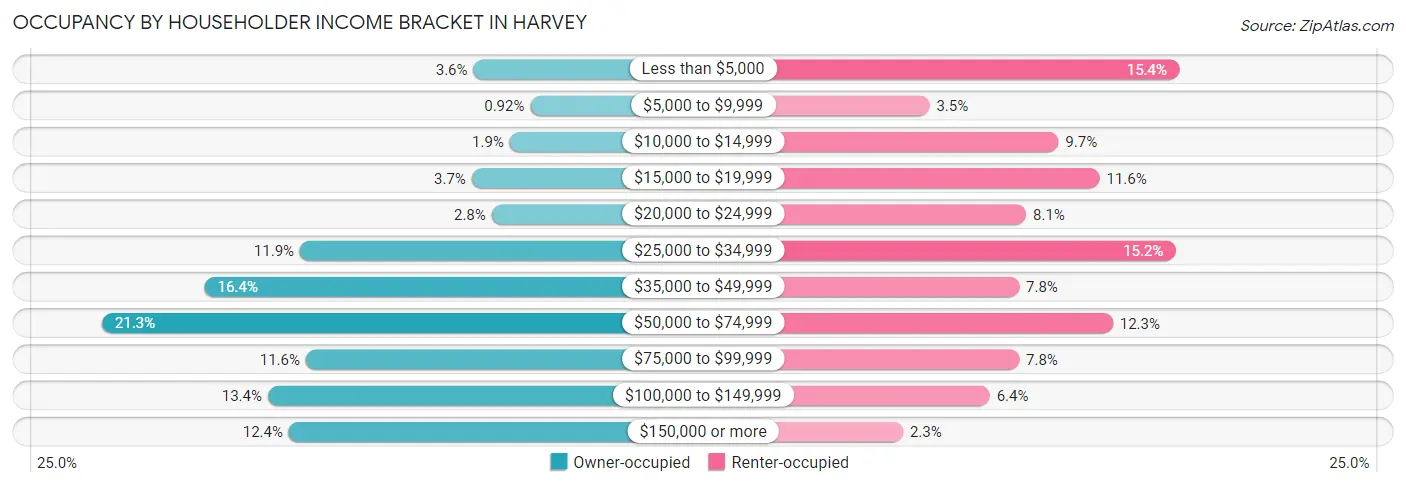
| Income Bracket | Owner-occupied | Renter-occupied |
| Less than $5,000 | 130 (3.6%) | 559 (15.4%) |
| $5,000 to $9,999 | 33 (0.9%) | 128 (3.5%) |
| $10,000 to $14,999 | 68 (1.9%) | 351 (9.7%) |
| $15,000 to $19,999 | 133 (3.7%) | 422 (11.6%) |
| $20,000 to $24,999 | 99 (2.8%) | 295 (8.1%) |
| $25,000 to $34,999 | 426 (11.9%) | 553 (15.2%) |
| $35,000 to $49,999 | 589 (16.4%) | 283 (7.8%) |
| $50,000 to $74,999 | 764 (21.3%) | 445 (12.2%) |
| $75,000 to $99,999 | 416 (11.6%) | 283 (7.8%) |
| $100,000 to $149,999 | 481 (13.4%) | 232 (6.4%) |
| $150,000 or more | 445 (12.4%) | 82 (2.3%) |
| Total | 3,584 (100.0%) | 3,633 (100.0%) |
Monthly Housing Cost Tiers in Harvey
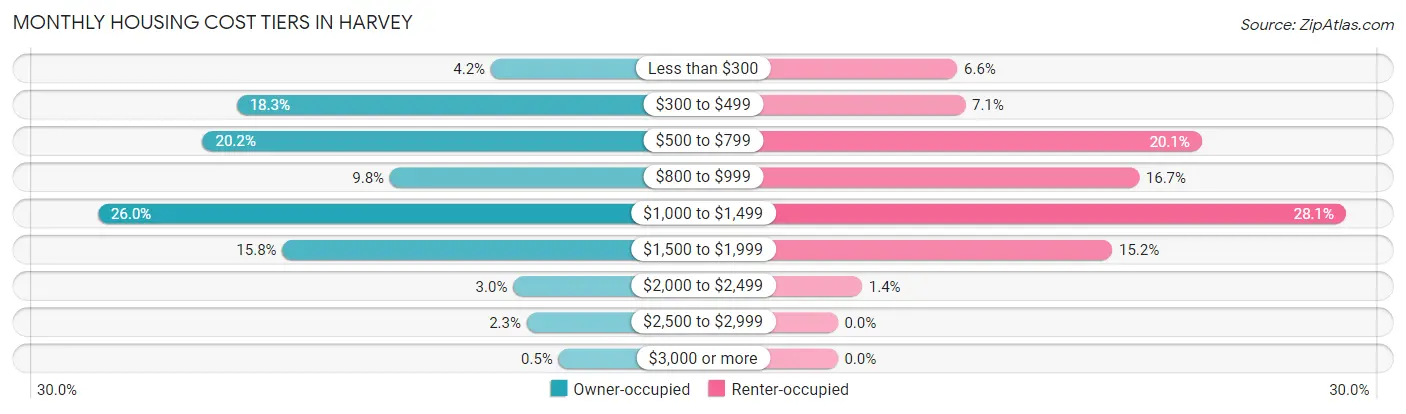
| Monthly Cost | Owner-occupied | Renter-occupied |
| Less than $300 | 152 (4.2%) | 240 (6.6%) |
| $300 to $499 | 655 (18.3%) | 256 (7.0%) |
| $500 to $799 | 723 (20.2%) | 731 (20.1%) |
| $800 to $999 | 352 (9.8%) | 605 (16.7%) |
| $1,000 to $1,499 | 930 (26.0%) | 1,020 (28.1%) |
| $1,500 to $1,999 | 565 (15.8%) | 551 (15.2%) |
| $2,000 to $2,499 | 108 (3.0%) | 49 (1.3%) |
| $2,500 to $2,999 | 81 (2.3%) | 0 (0.0%) |
| $3,000 or more | 18 (0.5%) | 0 (0.0%) |
| Total | 3,584 (100.0%) | 3,633 (100.0%) |
Physical Housing Characteristics in Harvey
Housing Structures in Harvey
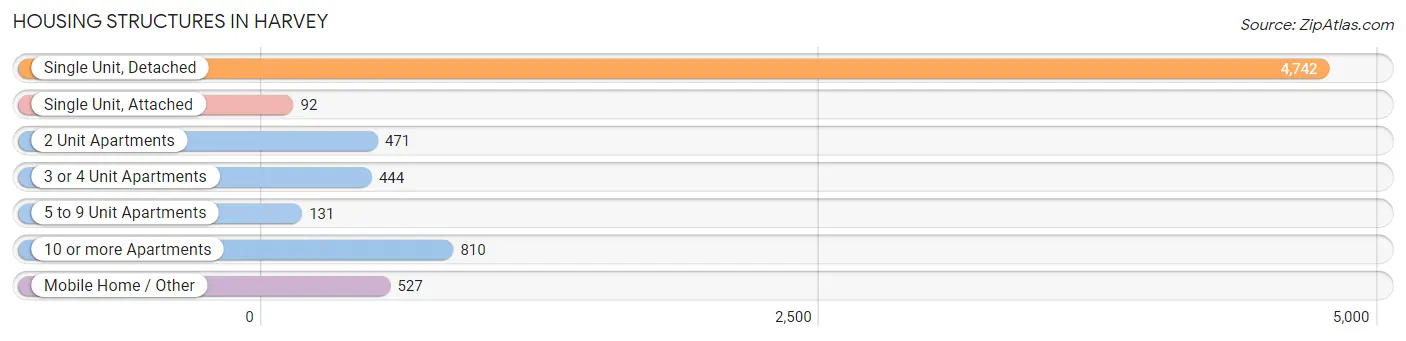
| Structure Type | # Housing Units | % Housing Units |
| Single Unit, Detached | 4,742 | 65.7% |
| Single Unit, Attached | 92 | 1.3% |
| 2 Unit Apartments | 471 | 6.5% |
| 3 or 4 Unit Apartments | 444 | 6.1% |
| 5 to 9 Unit Apartments | 131 | 1.8% |
| 10 or more Apartments | 810 | 11.2% |
| Mobile Home / Other | 527 | 7.3% |
| Total | 7,217 | 100.0% |
Housing Structures by Occupancy in Harvey
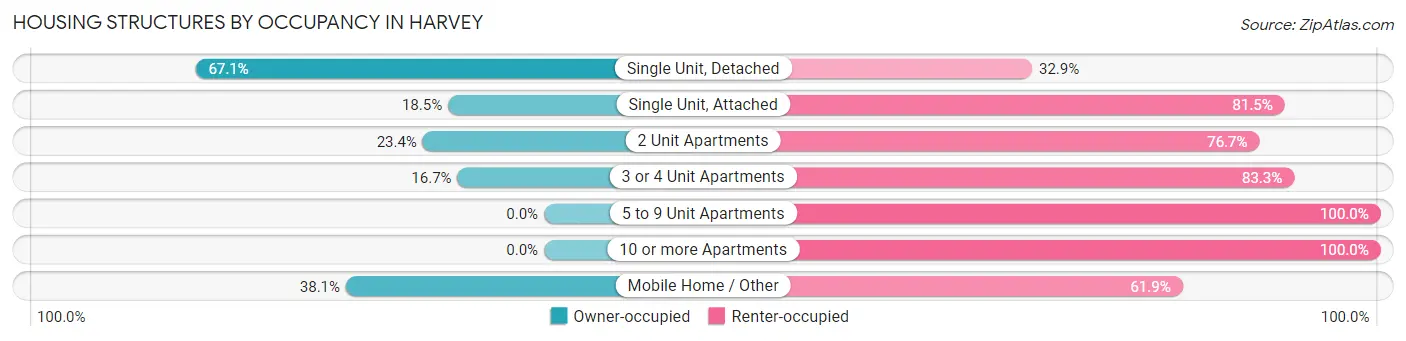
| Structure Type | Owner-occupied | Renter-occupied |
| Single Unit, Detached | 3,182 (67.1%) | 1,560 (32.9%) |
| Single Unit, Attached | 17 (18.5%) | 75 (81.5%) |
| 2 Unit Apartments | 110 (23.4%) | 361 (76.6%) |
| 3 or 4 Unit Apartments | 74 (16.7%) | 370 (83.3%) |
| 5 to 9 Unit Apartments | 0 (0.0%) | 131 (100.0%) |
| 10 or more Apartments | 0 (0.0%) | 810 (100.0%) |
| Mobile Home / Other | 201 (38.1%) | 326 (61.9%) |
| Total | 3,584 (49.7%) | 3,633 (50.3%) |
Housing Structures by Number of Rooms in Harvey
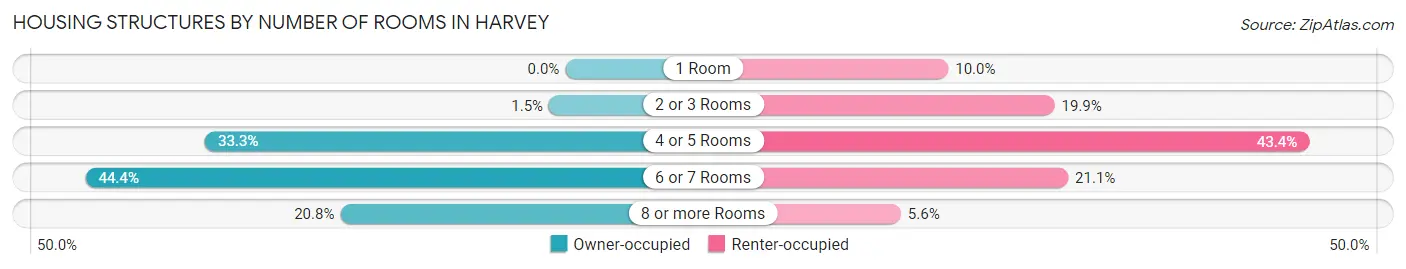
| Number of Rooms | Owner-occupied | Renter-occupied |
| 1 Room | 0 (0.0%) | 364 (10.0%) |
| 2 or 3 Rooms | 54 (1.5%) | 721 (19.9%) |
| 4 or 5 Rooms | 1,194 (33.3%) | 1,576 (43.4%) |
| 6 or 7 Rooms | 1,590 (44.4%) | 767 (21.1%) |
| 8 or more Rooms | 746 (20.8%) | 205 (5.6%) |
| Total | 3,584 (100.0%) | 3,633 (100.0%) |
Housing Structure by Heating Type in Harvey
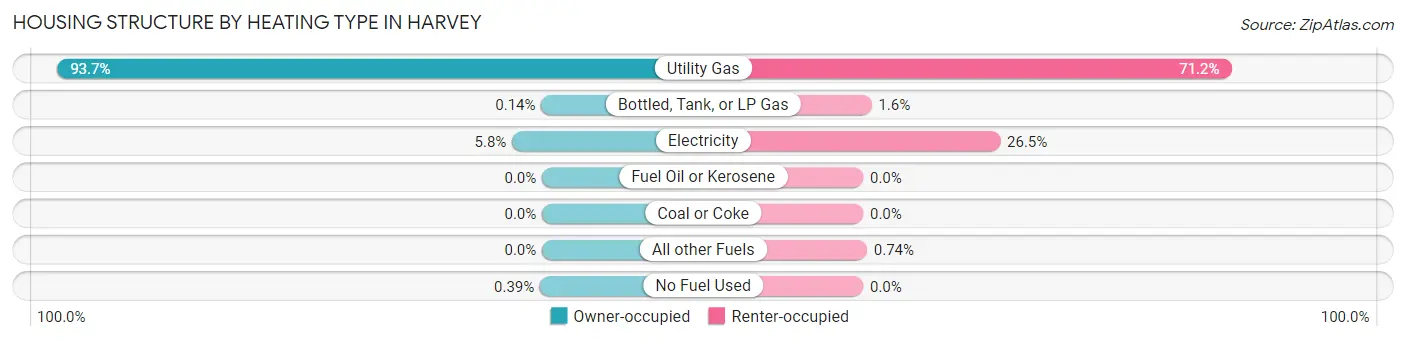
| Heating Type | Owner-occupied | Renter-occupied |
| Utility Gas | 3,358 (93.7%) | 2,585 (71.2%) |
| Bottled, Tank, or LP Gas | 5 (0.1%) | 59 (1.6%) |
| Electricity | 207 (5.8%) | 962 (26.5%) |
| Fuel Oil or Kerosene | 0 (0.0%) | 0 (0.0%) |
| Coal or Coke | 0 (0.0%) | 0 (0.0%) |
| All other Fuels | 0 (0.0%) | 27 (0.7%) |
| No Fuel Used | 14 (0.4%) | 0 (0.0%) |
| Total | 3,584 (100.0%) | 3,633 (100.0%) |
Household Vehicle Usage in Harvey
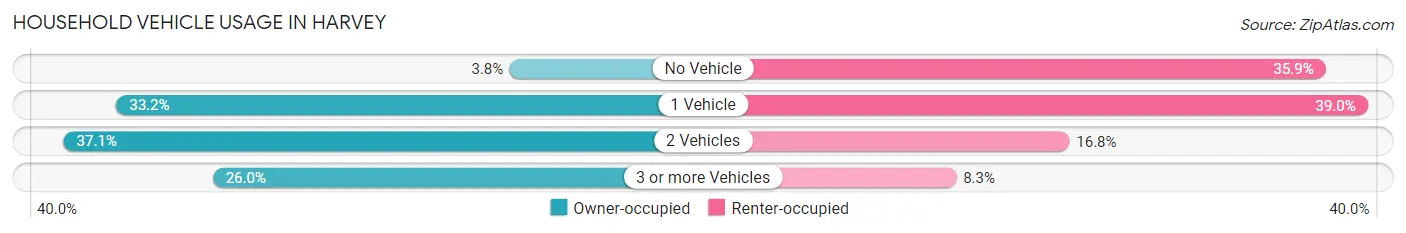
| Vehicles per Household | Owner-occupied | Renter-occupied |
| No Vehicle | 137 (3.8%) | 1,304 (35.9%) |
| 1 Vehicle | 1,188 (33.2%) | 1,418 (39.0%) |
| 2 Vehicles | 1,329 (37.1%) | 609 (16.8%) |
| 3 or more Vehicles | 930 (26.0%) | 302 (8.3%) |
| Total | 3,584 (100.0%) | 3,633 (100.0%) |
Real Estate & Mortgages in Harvey
Real Estate and Mortgage Overview in Harvey
| Characteristic | Without Mortgage | With Mortgage |
| Housing Units | 1,701 | 1,883 |
| Median Property Value | $83,500 | $94,500 |
| Median Household Income | $52,399 | $265 |
| Monthly Housing Costs | $522 | $18 |
| Real Estate Taxes | $2,374 | $424 |
Property Value by Mortgage Status in Harvey
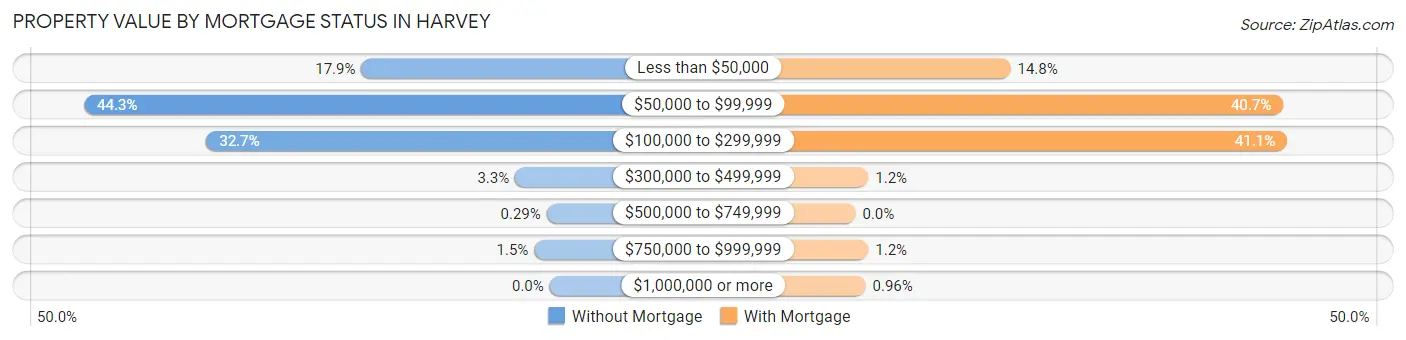
| Property Value | Without Mortgage | With Mortgage |
| Less than $50,000 | 305 (17.9%) | 278 (14.8%) |
| $50,000 to $99,999 | 754 (44.3%) | 767 (40.7%) |
| $100,000 to $299,999 | 556 (32.7%) | 774 (41.1%) |
| $300,000 to $499,999 | 56 (3.3%) | 23 (1.2%) |
| $500,000 to $749,999 | 5 (0.3%) | 0 (0.0%) |
| $750,000 to $999,999 | 25 (1.5%) | 23 (1.2%) |
| $1,000,000 or more | 0 (0.0%) | 18 (1.0%) |
| Total | 1,701 (100.0%) | 1,883 (100.0%) |
Household Income by Mortgage Status in Harvey
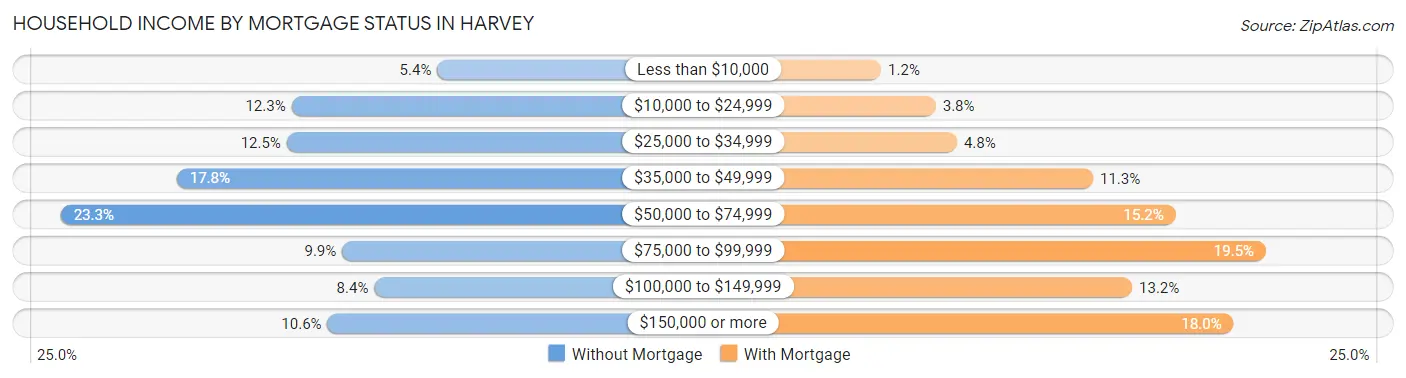
| Household Income | Without Mortgage | With Mortgage |
| Less than $10,000 | 91 (5.3%) | 23 (1.2%) |
| $10,000 to $24,999 | 209 (12.3%) | 72 (3.8%) |
| $25,000 to $34,999 | 213 (12.5%) | 91 (4.8%) |
| $35,000 to $49,999 | 302 (17.7%) | 213 (11.3%) |
| $50,000 to $74,999 | 396 (23.3%) | 287 (15.2%) |
| $75,000 to $99,999 | 168 (9.9%) | 368 (19.5%) |
| $100,000 to $149,999 | 142 (8.4%) | 248 (13.2%) |
| $150,000 or more | 180 (10.6%) | 339 (18.0%) |
| Total | 1,701 (100.0%) | 1,883 (100.0%) |
Property Value to Household Income Ratio in Harvey
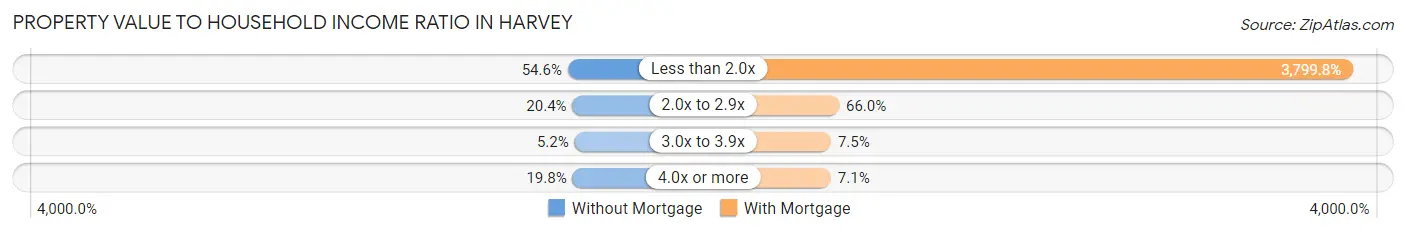
| Value-to-Income Ratio | Without Mortgage | With Mortgage |
| Less than 2.0x | 929 (54.6%) | 71,551 (3,799.8%) |
| 2.0x to 2.9x | 347 (20.4%) | 1,243 (66.0%) |
| 3.0x to 3.9x | 89 (5.2%) | 142 (7.5%) |
| 4.0x or more | 336 (19.8%) | 134 (7.1%) |
| Total | 1,701 (100.0%) | 1,883 (100.0%) |
Real Estate Taxes by Mortgage Status in Harvey
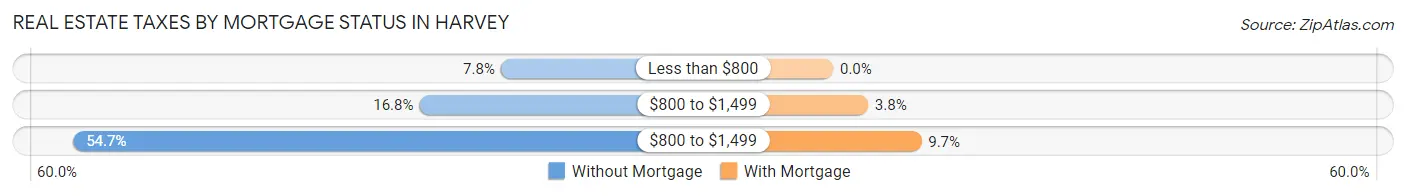
| Property Taxes | Without Mortgage | With Mortgage |
| Less than $800 | 133 (7.8%) | 0 (0.0%) |
| $800 to $1,499 | 285 (16.8%) | 72 (3.8%) |
| $800 to $1,499 | 930 (54.7%) | 182 (9.7%) |
| Total | 1,701 (100.0%) | 1,883 (100.0%) |
Health & Disability in Harvey
Health Insurance Coverage by Age in Harvey
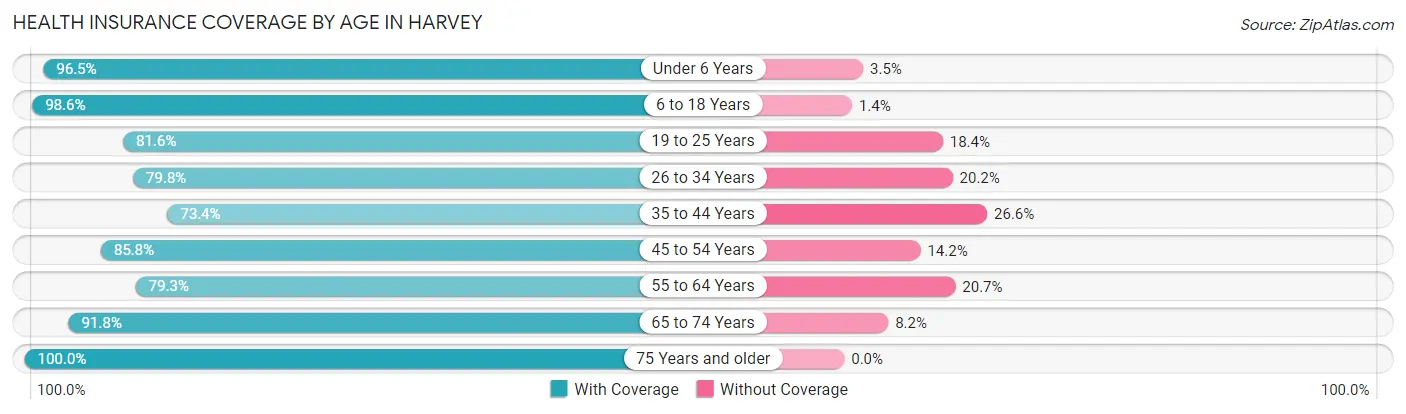
| Age Bracket | With Coverage | Without Coverage |
| Under 6 Years | 1,181 (96.5%) | 43 (3.5%) |
| 6 to 18 Years | 3,782 (98.6%) | 55 (1.4%) |
| 19 to 25 Years | 1,817 (81.6%) | 409 (18.4%) |
| 26 to 34 Years | 2,046 (79.8%) | 518 (20.2%) |
| 35 to 44 Years | 1,584 (73.4%) | 575 (26.6%) |
| 45 to 54 Years | 2,222 (85.8%) | 368 (14.2%) |
| 55 to 64 Years | 1,822 (79.3%) | 476 (20.7%) |
| 65 to 74 Years | 1,447 (91.8%) | 129 (8.2%) |
| 75 Years and older | 1,350 (100.0%) | 0 (0.0%) |
| Total | 17,251 (87.0%) | 2,573 (13.0%) |
Health Insurance Coverage by Citizenship Status in Harvey
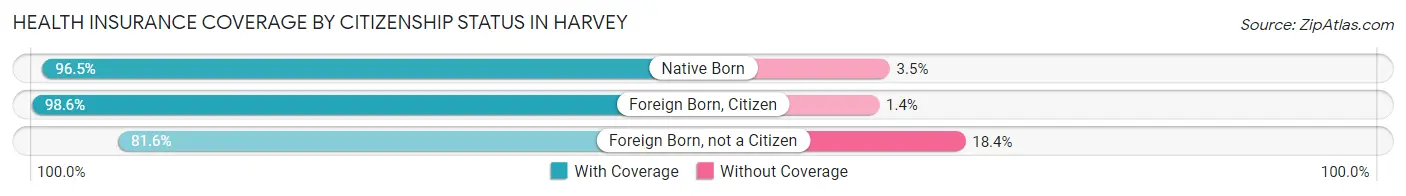
| Citizenship Status | With Coverage | Without Coverage |
| Native Born | 1,181 (96.5%) | 43 (3.5%) |
| Foreign Born, Citizen | 3,782 (98.6%) | 55 (1.4%) |
| Foreign Born, not a Citizen | 1,817 (81.6%) | 409 (18.4%) |
Health Insurance Coverage by Household Income in Harvey
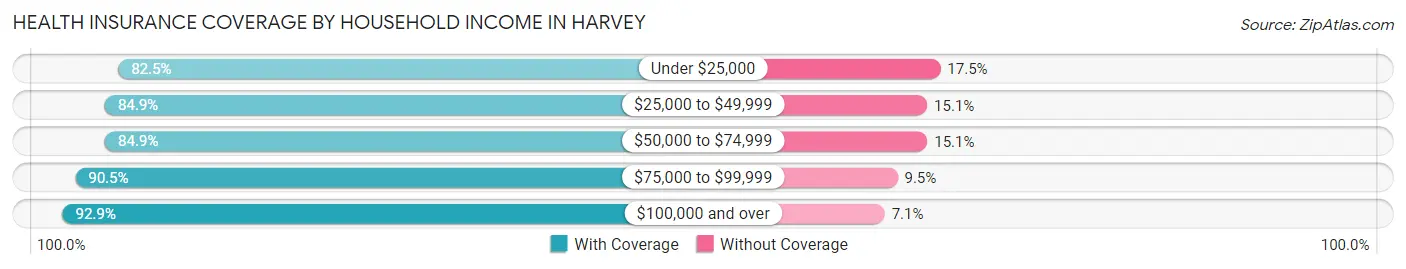
| Household Income | With Coverage | Without Coverage |
| Under $25,000 | 3,459 (82.5%) | 736 (17.5%) |
| $25,000 to $49,999 | 3,597 (84.9%) | 638 (15.1%) |
| $50,000 to $74,999 | 3,551 (84.9%) | 631 (15.1%) |
| $75,000 to $99,999 | 1,933 (90.5%) | 203 (9.5%) |
| $100,000 and over | 4,654 (92.9%) | 356 (7.1%) |
Public vs Private Health Insurance Coverage by Age in Harvey
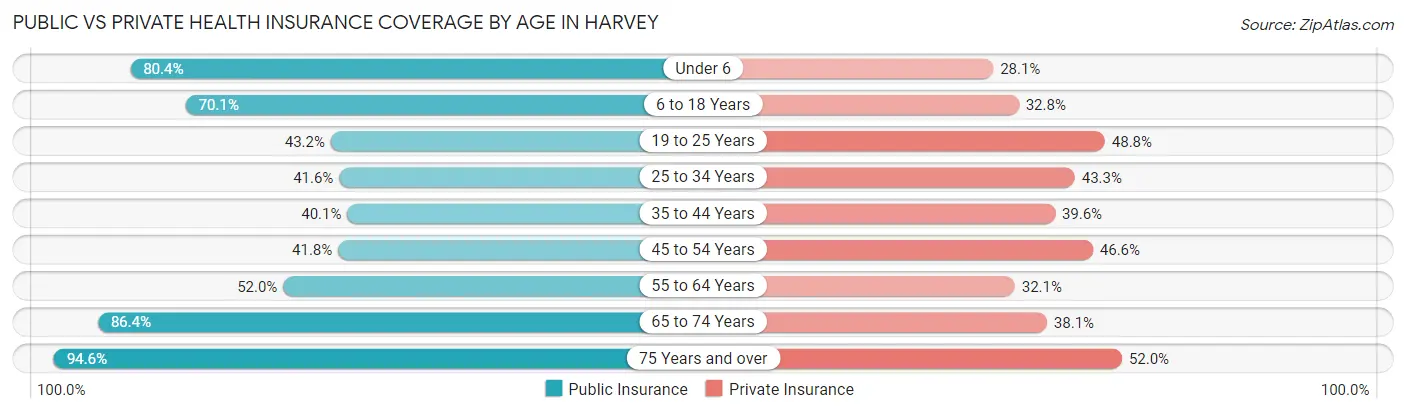
| Age Bracket | Public Insurance | Private Insurance |
| Under 6 | 984 (80.4%) | 344 (28.1%) |
| 6 to 18 Years | 2,691 (70.1%) | 1,260 (32.8%) |
| 19 to 25 Years | 961 (43.2%) | 1,087 (48.8%) |
| 25 to 34 Years | 1,067 (41.6%) | 1,109 (43.2%) |
| 35 to 44 Years | 866 (40.1%) | 854 (39.6%) |
| 45 to 54 Years | 1,083 (41.8%) | 1,207 (46.6%) |
| 55 to 64 Years | 1,195 (52.0%) | 738 (32.1%) |
| 65 to 74 Years | 1,362 (86.4%) | 600 (38.1%) |
| 75 Years and over | 1,277 (94.6%) | 702 (52.0%) |
| Total | 11,486 (57.9%) | 7,901 (39.9%) |
Disability Status by Sex by Age in Harvey
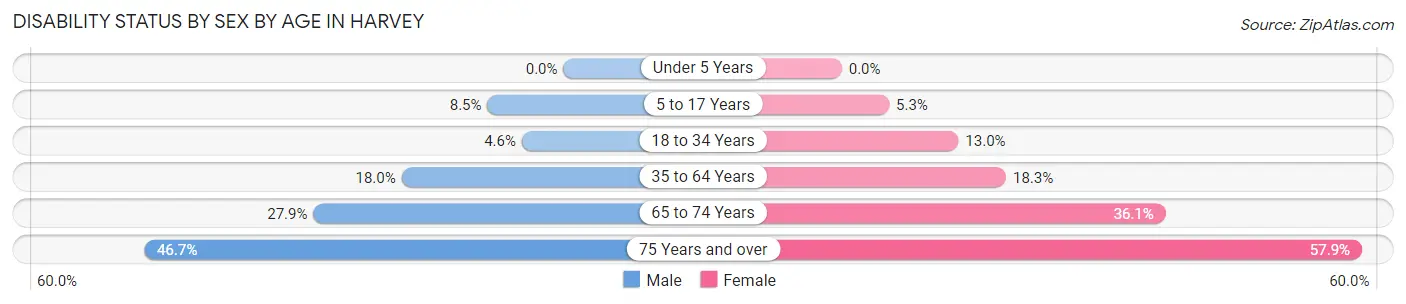
| Age Bracket | Male | Female |
| Under 5 Years | 0 (0.0%) | 0 (0.0%) |
| 5 to 17 Years | 173 (8.5%) | 96 (5.3%) |
| 18 to 34 Years | 109 (4.6%) | 354 (13.0%) |
| 35 to 64 Years | 652 (18.0%) | 627 (18.3%) |
| 65 to 74 Years | 198 (27.9%) | 312 (36.1%) |
| 75 Years and over | 212 (46.7%) | 519 (57.9%) |
Disability Class by Sex by Age in Harvey
Disability Class: Hearing Difficulty
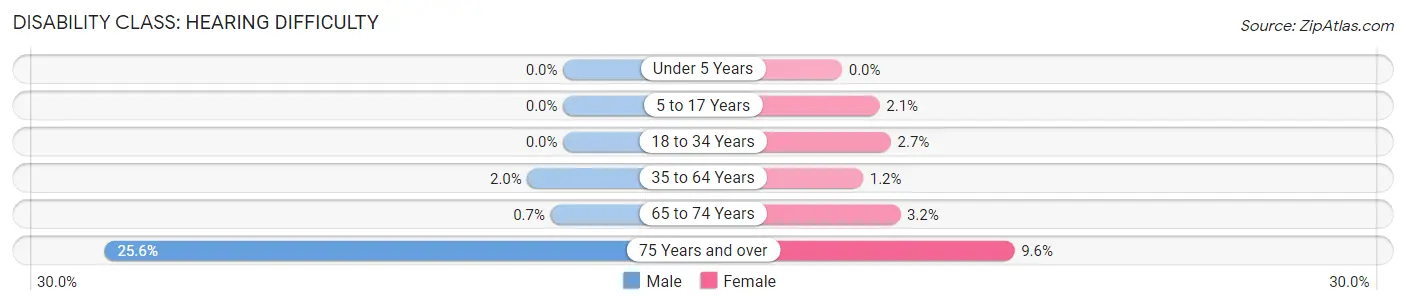
| Age Bracket | Male | Female |
| Under 5 Years | 0 (0.0%) | 0 (0.0%) |
| 5 to 17 Years | 0 (0.0%) | 38 (2.1%) |
| 18 to 34 Years | 0 (0.0%) | 74 (2.7%) |
| 35 to 64 Years | 72 (2.0%) | 40 (1.2%) |
| 65 to 74 Years | 5 (0.7%) | 28 (3.2%) |
| 75 Years and over | 116 (25.6%) | 86 (9.6%) |
Disability Class: Vision Difficulty
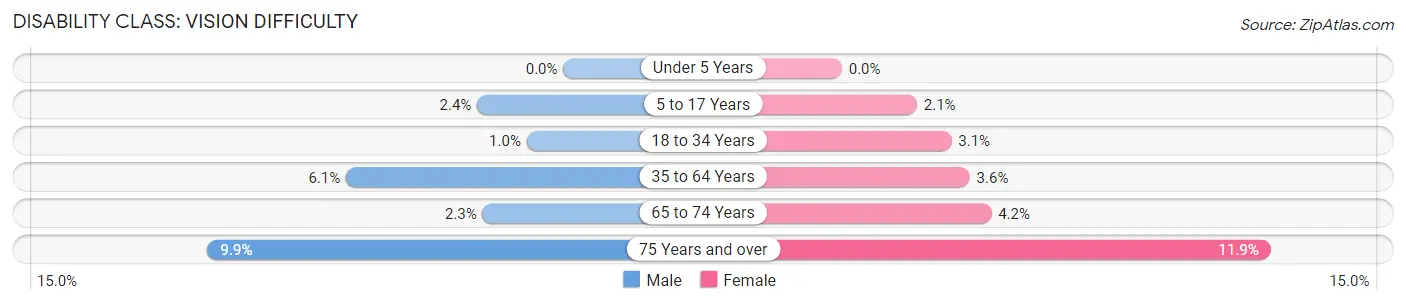
| Age Bracket | Male | Female |
| Under 5 Years | 0 (0.0%) | 0 (0.0%) |
| 5 to 17 Years | 49 (2.4%) | 38 (2.1%) |
| 18 to 34 Years | 24 (1.0%) | 83 (3.0%) |
| 35 to 64 Years | 219 (6.0%) | 122 (3.6%) |
| 65 to 74 Years | 16 (2.2%) | 36 (4.2%) |
| 75 Years and over | 45 (9.9%) | 107 (11.9%) |
Disability Class: Cognitive Difficulty
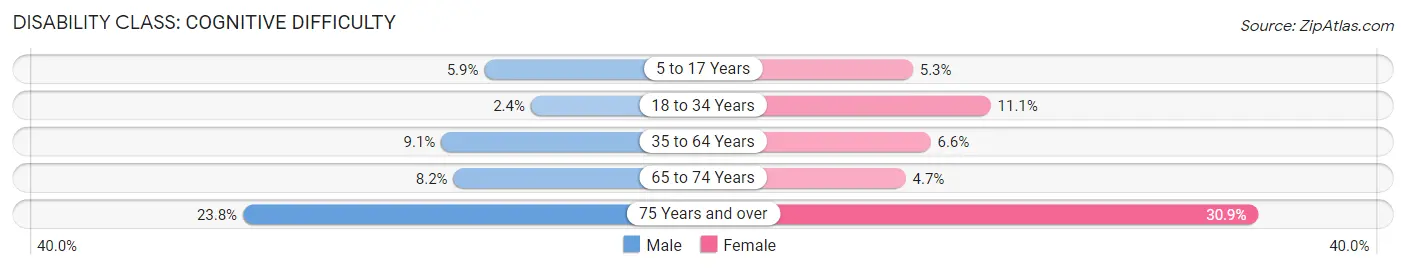
| Age Bracket | Male | Female |
| 5 to 17 Years | 120 (5.9%) | 96 (5.3%) |
| 18 to 34 Years | 57 (2.4%) | 301 (11.1%) |
| 35 to 64 Years | 328 (9.1%) | 226 (6.6%) |
| 65 to 74 Years | 58 (8.2%) | 41 (4.7%) |
| 75 Years and over | 108 (23.8%) | 277 (30.9%) |
Disability Class: Ambulatory Difficulty
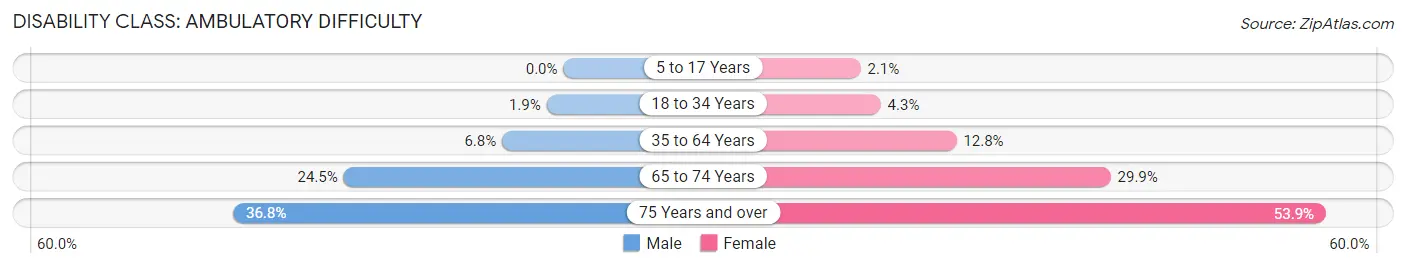
| Age Bracket | Male | Female |
| 5 to 17 Years | 0 (0.0%) | 38 (2.1%) |
| 18 to 34 Years | 44 (1.9%) | 118 (4.3%) |
| 35 to 64 Years | 247 (6.8%) | 438 (12.8%) |
| 65 to 74 Years | 174 (24.5%) | 259 (29.9%) |
| 75 Years and over | 167 (36.8%) | 483 (53.9%) |
Disability Class: Self-Care Difficulty
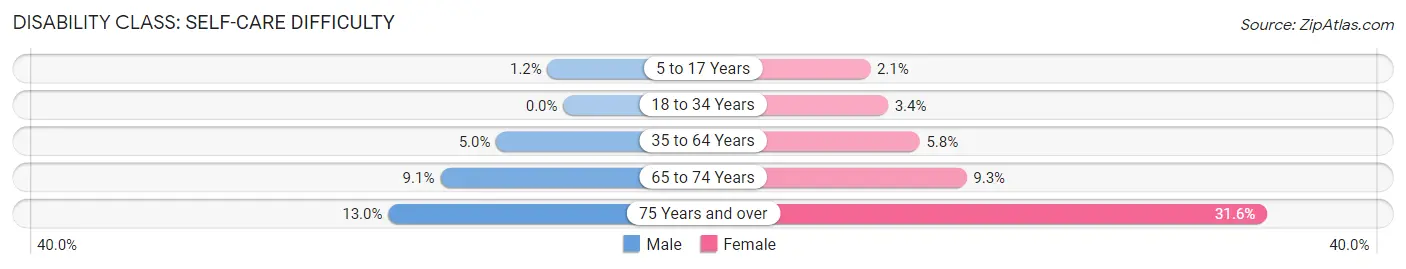
| Age Bracket | Male | Female |
| 5 to 17 Years | 24 (1.2%) | 38 (2.1%) |
| 18 to 34 Years | 0 (0.0%) | 93 (3.4%) |
| 35 to 64 Years | 180 (5.0%) | 198 (5.8%) |
| 65 to 74 Years | 65 (9.1%) | 80 (9.2%) |
| 75 Years and over | 59 (13.0%) | 283 (31.6%) |
Technology Access in Harvey
Computing Device Access in Harvey
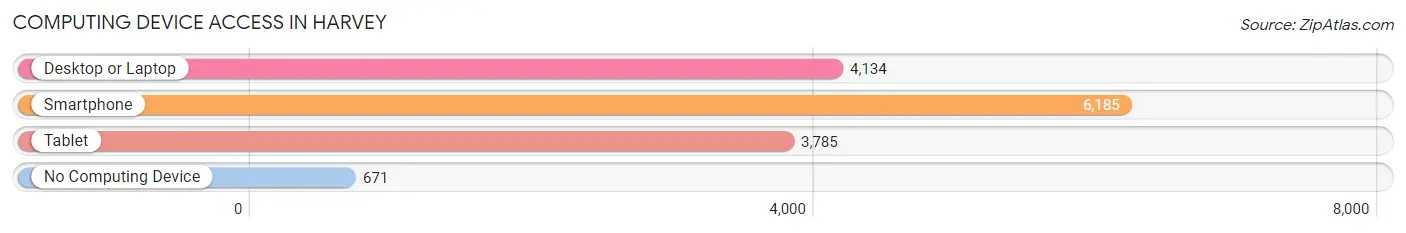
| Device Type | # Households | % Households |
| Desktop or Laptop | 4,134 | 57.3% |
| Smartphone | 6,185 | 85.7% |
| Tablet | 3,785 | 52.4% |
| No Computing Device | 671 | 9.3% |
| Total | 7,217 | 100.0% |
Internet Access in Harvey
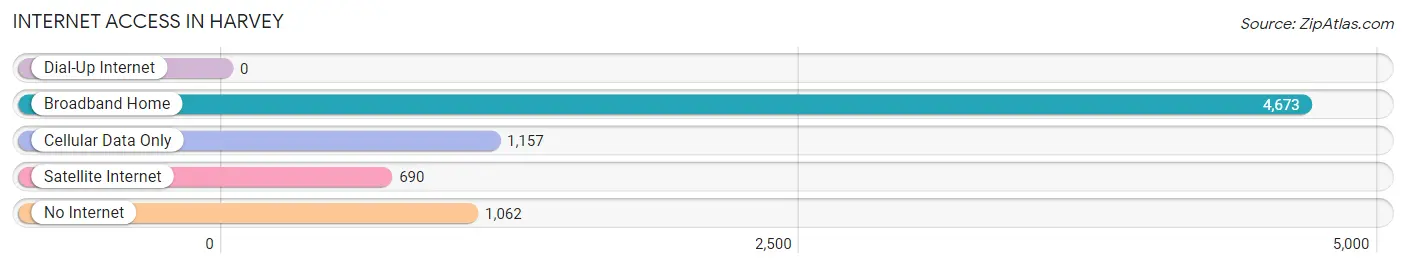
| Internet Type | # Households | % Households |
| Dial-Up Internet | 0 | 0.0% |
| Broadband Home | 4,673 | 64.7% |
| Cellular Data Only | 1,157 | 16.0% |
| Satellite Internet | 690 | 9.6% |
| No Internet | 1,062 | 14.7% |
| Total | 7,217 | 100.0% |
Harvey Summary
Harvey, Illinois is a city located in Cook County, Illinois, United States. It is a suburb of Chicago, located approximately 25 miles south of the city. The population of Harvey was 25,282 at the 2010 census.
History
Harvey was founded in 1891 by Turlington W. Harvey, a real estate developer from Chicago. The city was named after him. The city was incorporated in 1893.
In the early 1900s, Harvey was a small farming community. The city experienced a population boom in the 1950s and 1960s, as many African Americans moved to the city from the South. This influx of people led to the development of many businesses and industries in the city.
Geography
Harvey is located at 41°35'17" North, 87°39'17" West (41.588, -87.655). According to the United States Census Bureau, the city has a total area of 5.2 square miles, all of it land.
Economy
Harvey’s economy is largely based on manufacturing and retail. The city is home to several large manufacturing companies, including the Ford Motor Company, which has a plant in the city. Other major employers in the city include the University of Chicago Medical Center, the University of Chicago Hospitals, and the University of Chicago.
Harvey also has a large retail sector, with several shopping centers and malls located in the city. The largest of these is the River Oaks Shopping Center, which is home to over 100 stores and restaurants.
Demographics
As of the 2010 census, the population of Harvey was 25,282. The racial makeup of the city was 79.3% African American, 15.2% White, 0.7% Asian, 0.3% Native American, 0.1% Pacific Islander, and 4.4% from two or more races.
The median household income in Harvey was $30,945, and the median family income was $37,945. The per capita income for the city was $14,945. About 24.3% of the population was below the poverty line.
Conclusion
Harvey, Illinois is a city located in Cook County, Illinois, United States. It is a suburb of Chicago, located approximately 25 miles south of the city. The population of Harvey was 25,282 at the 2010 census. The city was founded in 1891 by Turlington W. Harvey, a real estate developer from Chicago. The city’s economy is largely based on manufacturing and retail, and the city is home to several large employers, including the Ford Motor Company and the University of Chicago Medical Center. The racial makeup of the city was 79.3% African American, 15.2% White, 0.7% Asian, 0.3% Native American, 0.1% Pacific Islander, and 4.4% from two or more races. The median household income in Harvey was $30,945, and the median family income was $37,945. About 24.3% of the population was below the poverty line.
Common Questions
What is Per Capita Income in Harvey?
Per Capita income in Harvey is $23,472.
What is the Median Family Income in Harvey?
Median Family Income in Harvey is $57,624.
What is the Median Household income in Harvey?
Median Household Income in Harvey is $40,898.
What is Income or Wage Gap in Harvey?
Income or Wage Gap in Harvey is 22.9%.
Women in Harvey earn 77.1 cents for every dollar earned by a man.
What is Family Income Deficit in Harvey?
Family Income Deficit in Harvey is $10,249.
Families that are below poverty line in Harvey earn $10,249 less on average than the poverty threshold level.
What is Inequality or Gini Index in Harvey?
Inequality or Gini Index in Harvey is 0.51.
What is the Total Population of Harvey?
Total Population of Harvey is 20,035.
What is the Total Male Population of Harvey?
Total Male Population of Harvey is 9,745.
What is the Total Female Population of Harvey?
Total Female Population of Harvey is 10,290.
What is the Ratio of Males per 100 Females in Harvey?
There are 94.70 Males per 100 Females in Harvey.
What is the Ratio of Females per 100 Males in Harvey?
There are 105.59 Females per 100 Males in Harvey.
What is the Median Population Age in Harvey?
Median Population Age in Harvey is 35.5 Years.
What is the Average Family Size in Harvey
Average Family Size in Harvey is 3.6 People.
What is the Average Household Size in Harvey
Average Household Size in Harvey is 2.7 People.
How Large is the Labor Force in Harvey?
There are 9,310 People in the Labor Forcein in Harvey.
What is the Percentage of People in the Labor Force in Harvey?
58.8% of People are in the Labor Force in Harvey.
What is the Unemployment Rate in Harvey?
Unemployment Rate in Harvey is 14.6%.