Cities with the Highest Percentage of Immigrants from Greece in Illinois
RELATED REPORTS & OPTIONS
Greece
Illinois
Compare Cities
Map of Cities with the Highest Percentage of Immigrants from Greece in Illinois
0.00%
1.50%
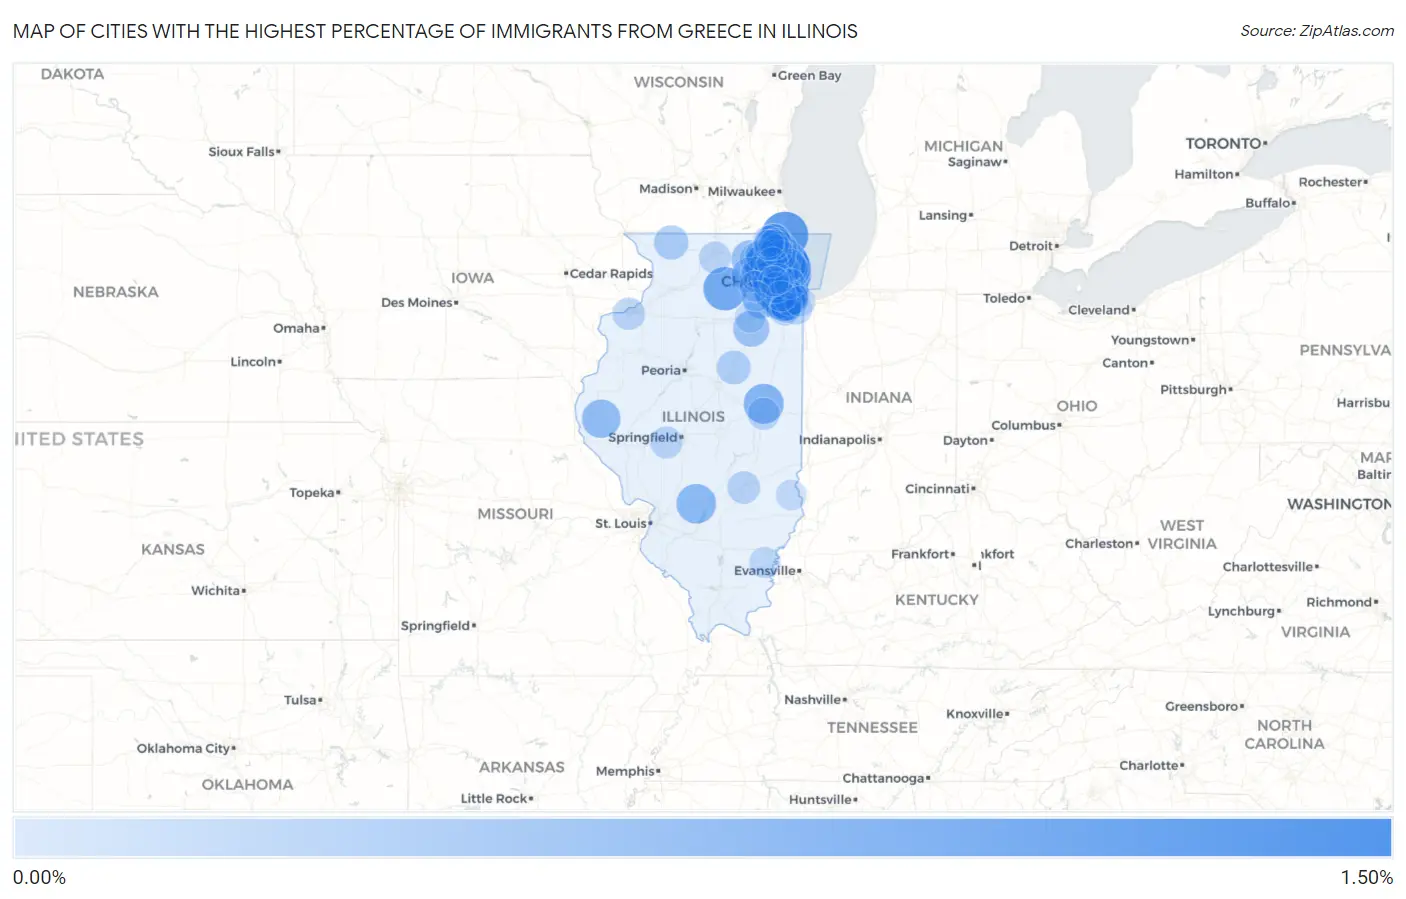
Cities with the Highest Percentage of Immigrants from Greece in Illinois
| City | Greece | vs State | vs National | |
| 1. | Harwood Heights | 1.11% | 0.084%(+1.02)#1 | 0.036%(+1.07)#66 |
| 2. | Morton Grove | 1.08% | 0.084%(+1.000)#2 | 0.036%(+1.05)#69 |
| 3. | Niles | 1.06% | 0.084%(+0.977)#3 | 0.036%(+1.02)#70 |
| 4. | Palos Hills | 1.00% | 0.084%(+0.917)#4 | 0.036%(+0.965)#75 |
| 5. | Addison | 0.96% | 0.084%(+0.872)#5 | 0.036%(+0.920)#83 |
| 6. | Winthrop Harbor | 0.94% | 0.084%(+0.857)#6 | 0.036%(+0.905)#86 |
| 7. | Norridge | 0.88% | 0.084%(+0.792)#7 | 0.036%(+0.840)#102 |
| 8. | Bedford Park | 0.81% | 0.084%(+0.724)#8 | 0.036%(+0.772)#113 |
| 9. | Inverness | 0.79% | 0.084%(+0.706)#9 | 0.036%(+0.754)#116 |
| 10. | Darien | 0.79% | 0.084%(+0.704)#10 | 0.036%(+0.752)#117 |
| 11. | Shabbona | 0.76% | 0.084%(+0.677)#11 | 0.036%(+0.726)#123 |
| 12. | South Barrington | 0.76% | 0.084%(+0.676)#12 | 0.036%(+0.724)#124 |
| 13. | Northfield | 0.75% | 0.084%(+0.669)#13 | 0.036%(+0.718)#125 |
| 14. | River Grove | 0.74% | 0.084%(+0.657)#14 | 0.036%(+0.705)#130 |
| 15. | Northbrook | 0.66% | 0.084%(+0.574)#15 | 0.036%(+0.622)#163 |
| 16. | Elmwood Park | 0.65% | 0.084%(+0.571)#16 | 0.036%(+0.619)#166 |
| 17. | Thomasboro | 0.59% | 0.084%(+0.502)#17 | 0.036%(+0.551)#191 |
| 18. | Glenview | 0.58% | 0.084%(+0.498)#18 | 0.036%(+0.547)#193 |
| 19. | Bannockburn | 0.56% | 0.084%(+0.479)#19 | 0.036%(+0.527)#206 |
| 20. | Greenville | 0.56% | 0.084%(+0.478)#20 | 0.036%(+0.526)#208 |
| 21. | Mount Prospect | 0.56% | 0.084%(+0.477)#21 | 0.036%(+0.525)#209 |
| 22. | Orland Park | 0.55% | 0.084%(+0.466)#22 | 0.036%(+0.514)#214 |
| 23. | Schiller Park | 0.53% | 0.084%(+0.450)#23 | 0.036%(+0.499)#220 |
| 24. | Bloomingdale | 0.53% | 0.084%(+0.442)#24 | 0.036%(+0.490)#223 |
| 25. | Lincolnwood | 0.51% | 0.084%(+0.428)#25 | 0.036%(+0.477)#226 |
| 26. | Westchester | 0.50% | 0.084%(+0.419)#26 | 0.036%(+0.467)#232 |
| 27. | Camp Point | 0.50% | 0.084%(+0.416)#27 | 0.036%(+0.464)#233 |
| 28. | Bensenville | 0.47% | 0.084%(+0.387)#28 | 0.036%(+0.435)#241 |
| 29. | Burr Ridge | 0.46% | 0.084%(+0.374)#29 | 0.036%(+0.422)#251 |
| 30. | Bridgeview | 0.45% | 0.084%(+0.371)#30 | 0.036%(+0.419)#256 |
| 31. | Oak Lawn | 0.44% | 0.084%(+0.355)#31 | 0.036%(+0.403)#270 |
| 32. | Huntley | 0.43% | 0.084%(+0.343)#32 | 0.036%(+0.391)#274 |
| 33. | Third Lake | 0.41% | 0.084%(+0.328)#33 | 0.036%(+0.376)#286 |
| 34. | Orland Hills | 0.41% | 0.084%(+0.325)#34 | 0.036%(+0.373)#289 |
| 35. | Plainfield | 0.41% | 0.084%(+0.323)#35 | 0.036%(+0.371)#292 |
| 36. | Forest Park | 0.38% | 0.084%(+0.297)#36 | 0.036%(+0.345)#312 |
| 37. | Mazon | 0.38% | 0.084%(+0.296)#37 | 0.036%(+0.344)#313 |
| 38. | Worth | 0.35% | 0.084%(+0.266)#38 | 0.036%(+0.314)#354 |
| 39. | Skokie | 0.35% | 0.084%(+0.263)#39 | 0.036%(+0.311)#359 |
| 40. | Deerfield | 0.33% | 0.084%(+0.250)#40 | 0.036%(+0.298)#378 |
| 41. | Riverwoods | 0.32% | 0.084%(+0.240)#41 | 0.036%(+0.289)#390 |
| 42. | Des Plaines | 0.32% | 0.084%(+0.237)#42 | 0.036%(+0.285)#397 |
| 43. | Alsip | 0.30% | 0.084%(+0.218)#43 | 0.036%(+0.266)#416 |
| 44. | La Grange Park | 0.30% | 0.084%(+0.216)#44 | 0.036%(+0.264)#418 |
| 45. | Lily Lake | 0.29% | 0.084%(+0.204)#45 | 0.036%(+0.252)#438 |
| 46. | Rosemont | 0.28% | 0.084%(+0.201)#46 | 0.036%(+0.249)#443 |
| 47. | Lena | 0.28% | 0.084%(+0.201)#47 | 0.036%(+0.249)#445 |
| 48. | Long Grove | 0.28% | 0.084%(+0.194)#48 | 0.036%(+0.242)#462 |
| 49. | Green Oaks | 0.27% | 0.084%(+0.185)#49 | 0.036%(+0.233)#486 |
| 50. | Chenoa | 0.26% | 0.084%(+0.174)#50 | 0.036%(+0.222)#507 |
| 51. | Robbins | 0.25% | 0.084%(+0.166)#51 | 0.036%(+0.214)#522 |
| 52. | Homer Glen | 0.24% | 0.084%(+0.161)#52 | 0.036%(+0.209)#531 |
| 53. | Wood Dale | 0.24% | 0.084%(+0.161)#53 | 0.036%(+0.209)#532 |
| 54. | Arlington Heights | 0.24% | 0.084%(+0.156)#54 | 0.036%(+0.204)#544 |
| 55. | Wheeling | 0.24% | 0.084%(+0.153)#55 | 0.036%(+0.201)#548 |
| 56. | Algonquin | 0.22% | 0.084%(+0.133)#56 | 0.036%(+0.182)#584 |
| 57. | Elk Grove Village | 0.21% | 0.084%(+0.128)#57 | 0.036%(+0.176)#595 |
| 58. | Park Ridge | 0.20% | 0.084%(+0.117)#58 | 0.036%(+0.165)#614 |
| 59. | Hoffman Estates | 0.20% | 0.084%(+0.111)#59 | 0.036%(+0.159)#627 |
| 60. | Hickory Hills | 0.19% | 0.084%(+0.110)#60 | 0.036%(+0.159)#630 |
| 61. | Lake Zurich | 0.19% | 0.084%(+0.108)#61 | 0.036%(+0.156)#635 |
| 62. | Effingham | 0.19% | 0.084%(+0.104)#62 | 0.036%(+0.152)#646 |
| 63. | Hinsdale | 0.19% | 0.084%(+0.102)#63 | 0.036%(+0.150)#651 |
| 64. | Milan | 0.18% | 0.084%(+0.094)#64 | 0.036%(+0.142)#682 |
| 65. | Wilmette | 0.18% | 0.084%(+0.092)#65 | 0.036%(+0.140)#685 |
| 66. | Lindenhurst | 0.17% | 0.084%(+0.090)#66 | 0.036%(+0.138)#698 |
| 67. | Urbana | 0.17% | 0.084%(+0.084)#67 | 0.036%(+0.132)#713 |
| 68. | New Berlin | 0.16% | 0.084%(+0.076)#68 | 0.036%(+0.124)#727 |
| 69. | New Milford | 0.16% | 0.084%(+0.073)#69 | 0.036%(+0.121)#733 |
| 70. | St Charles | 0.16% | 0.084%(+0.072)#70 | 0.036%(+0.120)#737 |
| 71. | Downers Grove | 0.14% | 0.084%(+0.060)#71 | 0.036%(+0.108)#783 |
| 72. | South Elgin | 0.14% | 0.084%(+0.059)#72 | 0.036%(+0.107)#787 |
| 73. | Chicago Heights | 0.14% | 0.084%(+0.058)#73 | 0.036%(+0.107)#788 |
| 74. | Carol Stream | 0.14% | 0.084%(+0.057)#74 | 0.036%(+0.105)#791 |
| 75. | Wheaton | 0.14% | 0.084%(+0.056)#75 | 0.036%(+0.104)#797 |
| 76. | Lincolnshire | 0.14% | 0.084%(+0.055)#76 | 0.036%(+0.103)#802 |
| 77. | Gages Lake | 0.14% | 0.084%(+0.054)#77 | 0.036%(+0.102)#806 |
| 78. | Schaumburg | 0.13% | 0.084%(+0.044)#78 | 0.036%(+0.092)#847 |
| 79. | Tinley Park | 0.12% | 0.084%(+0.040)#79 | 0.036%(+0.088)#866 |
| 80. | Cary | 0.12% | 0.084%(+0.039)#80 | 0.036%(+0.087)#871 |
| 81. | Midlothian | 0.12% | 0.084%(+0.036)#81 | 0.036%(+0.084)#889 |
| 82. | Carmi | 0.12% | 0.084%(+0.035)#82 | 0.036%(+0.083)#896 |
| 83. | Libertyville | 0.12% | 0.084%(+0.033)#83 | 0.036%(+0.081)#907 |
| 84. | Round Lake Heights | 0.11% | 0.084%(+0.028)#84 | 0.036%(+0.076)#931 |
| 85. | Oak Brook | 0.11% | 0.084%(+0.028)#85 | 0.036%(+0.076)#932 |
| 86. | Frankfort | 0.11% | 0.084%(+0.025)#86 | 0.036%(+0.073)#949 |
| 87. | North Aurora | 0.10% | 0.084%(+0.017)#87 | 0.036%(+0.065)#979 |
| 88. | Westmont | 0.099% | 0.084%(+0.015)#88 | 0.036%(+0.063)#994 |
| 89. | Frankfort Square | 0.096% | 0.084%(+0.012)#89 | 0.036%(+0.060)#1,013 |
| 90. | Elmhurst | 0.088% | 0.084%(+0.004)#90 | 0.036%(+0.052)#1,071 |
| 91. | Chicago | 0.087% | 0.084%(+0.003)#91 | 0.036%(+0.051)#1,077 |
| 92. | Grayslake | 0.087% | 0.084%(+0.003)#92 | 0.036%(+0.051)#1,079 |
| 93. | Robinson | 0.085% | 0.084%(+0.001)#93 | 0.036%(+0.049)#1,087 |
| 94. | Calumet City | 0.084% | 0.084%(-0.000)#94 | 0.036%(+0.048)#1,092 |
| 95. | Palos Park | 0.083% | 0.084%(-0.001)#95 | 0.036%(+0.047)#1,103 |
| 96. | Palatine | 0.077% | 0.084%(-0.007)#96 | 0.036%(+0.041)#1,123 |
| 97. | Morris | 0.076% | 0.084%(-0.008)#97 | 0.036%(+0.040)#1,134 |
| 98. | Lombard | 0.075% | 0.084%(-0.009)#98 | 0.036%(+0.039)#1,137 |
| 99. | Oswego | 0.075% | 0.084%(-0.009)#99 | 0.036%(+0.039)#1,140 |
| 100. | Round Lake | 0.070% | 0.084%(-0.014)#100 | 0.036%(+0.034)#1,176 |
Common Questions
What are the Top 10 Cities with the Highest Percentage of Immigrants from Greece in Illinois?
Top 10 Cities with the Highest Percentage of Immigrants from Greece in Illinois are:
#1
1.11%
#2
1.08%
#3
1.06%
#4
1.00%
#5
0.96%
#6
0.94%
#7
0.88%
#8
0.81%
#9
0.79%
#10
0.79%
What city has the Highest Percentage of Immigrants from Greece in Illinois?
Harwood Heights has the Highest Percentage of Immigrants from Greece in Illinois with 1.11%.
What is the Percentage of Immigrants from Greece in the State of Illinois?
Percentage of Immigrants from Greece in Illinois is 0.084%.
What is the Percentage of Immigrants from Greece in the United States?
Percentage of Immigrants from Greece in the United States is 0.036%.