Gurnee, IL Map & Demographics
Gurnee Map
Gurnee Overview
$55,625
PER CAPITA INCOME
$148,347
AVG FAMILY INCOME
$112,633
AVG HOUSEHOLD INCOME
32.6%
WAGE / INCOME GAP [ % ]
67.4¢/ $1
WAGE / INCOME GAP [ $ ]
0.42
INEQUALITY / GINI INDEX
30,629
TOTAL POPULATION
14,903
MALE POPULATION
15,726
FEMALE POPULATION
94.77
MALES / 100 FEMALES
105.52
FEMALES / 100 MALES
40.2
MEDIAN AGE
3.2
AVG FAMILY SIZE
2.6
AVG HOUSEHOLD SIZE
17,623
LABOR FORCE [ PEOPLE ]
69.7%
PERCENT IN LABOR FORCE
4.1%
UNEMPLOYMENT RATE
Gurnee Zip Codes
Gurnee Area Codes
Income in Gurnee
Income Overview in Gurnee
Per Capita Income in Gurnee is $55,625, while median incomes of families and households are $148,347 and $112,633 respectively.
| Characteristic | Number | Measure |
| Per Capita Income | 30,629 | $55,625 |
| Median Family Income | 8,088 | $148,347 |
| Mean Family Income | 8,088 | $171,421 |
| Median Household Income | 11,743 | $112,633 |
| Mean Household Income | 11,743 | $143,586 |
| Income Deficit | 8,088 | $0 |
| Wage / Income Gap (%) | 30,629 | 32.60% |
| Wage / Income Gap ($) | 30,629 | 67.40¢ per $1 |
| Gini / Inequality Index | 30,629 | 0.42 |
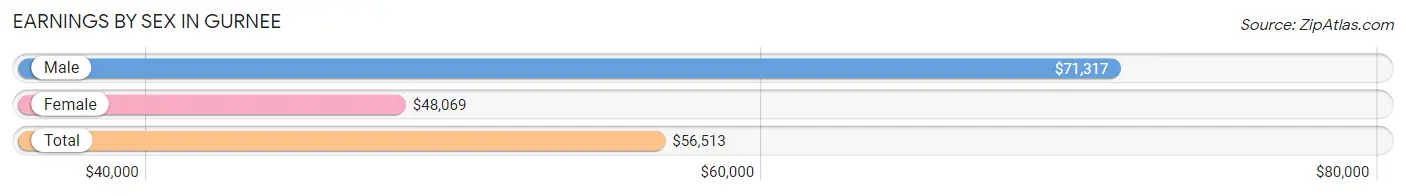
Earnings by Sex in Gurnee
Average Earnings in Gurnee are $56,513, $71,317 for men and $48,069 for women, a difference of 32.6%.
| Sex | Number | Average Earnings |
| Male | 9,336 (50.6%) | $71,317 |
| Female | 9,109 (49.4%) | $48,069 |
| Total | 18,445 (100.0%) | $56,513 |
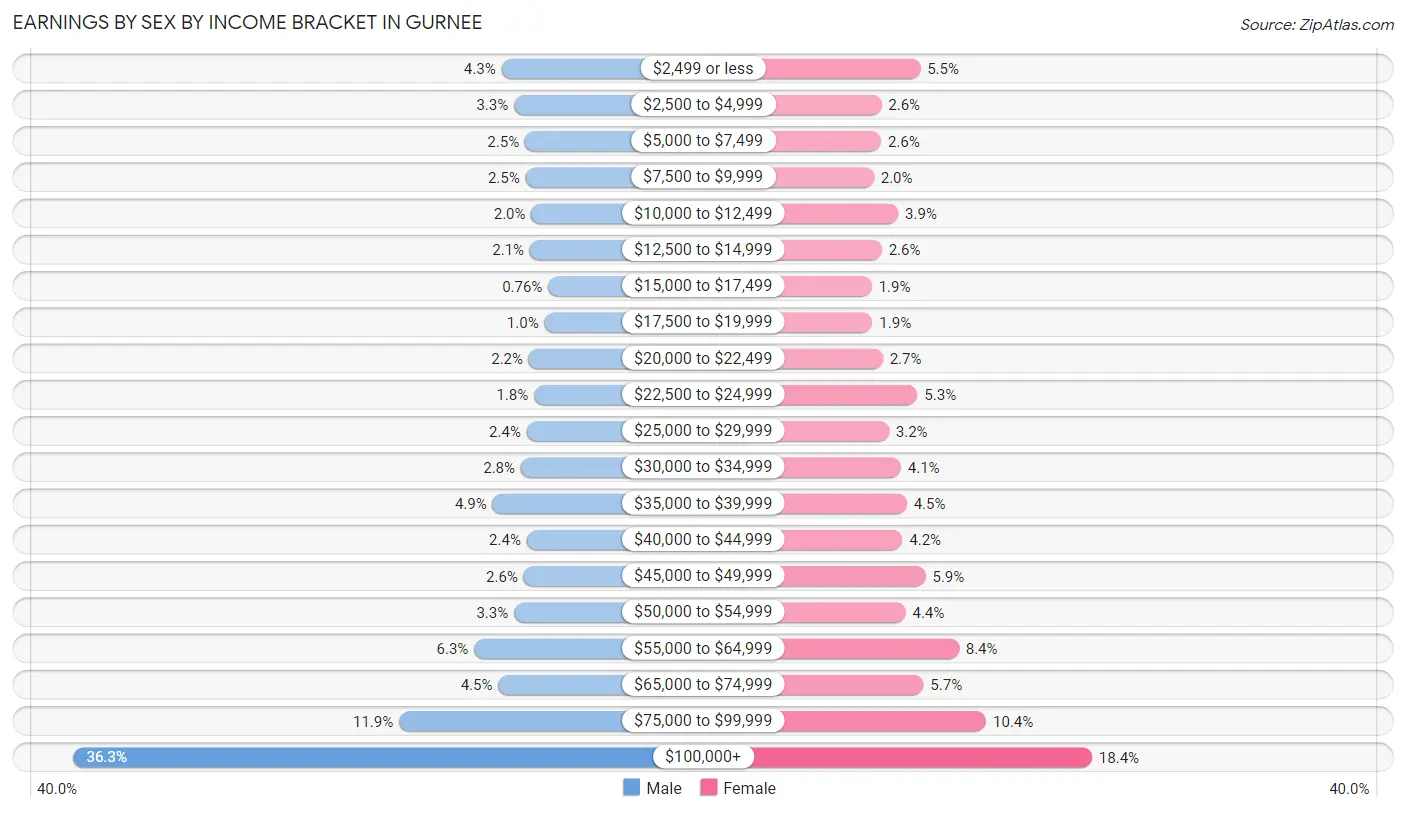
Earnings by Sex by Income Bracket in Gurnee
The most common earnings brackets in Gurnee are $100,000+ for men (3,392 | 36.3%) and $100,000+ for women (1,673 | 18.4%).
| Income | Male | Female |
| $2,499 or less | 398 (4.3%) | 501 (5.5%) |
| $2,500 to $4,999 | 310 (3.3%) | 236 (2.6%) |
| $5,000 to $7,499 | 233 (2.5%) | 233 (2.6%) |
| $7,500 to $9,999 | 230 (2.5%) | 184 (2.0%) |
| $10,000 to $12,499 | 189 (2.0%) | 351 (3.8%) |
| $12,500 to $14,999 | 199 (2.1%) | 239 (2.6%) |
| $15,000 to $17,499 | 71 (0.8%) | 170 (1.9%) |
| $17,500 to $19,999 | 97 (1.0%) | 175 (1.9%) |
| $20,000 to $22,499 | 206 (2.2%) | 245 (2.7%) |
| $22,500 to $24,999 | 170 (1.8%) | 482 (5.3%) |
| $25,000 to $29,999 | 221 (2.4%) | 287 (3.2%) |
| $30,000 to $34,999 | 262 (2.8%) | 369 (4.1%) |
| $35,000 to $39,999 | 460 (4.9%) | 409 (4.5%) |
| $40,000 to $44,999 | 221 (2.4%) | 379 (4.2%) |
| $45,000 to $49,999 | 243 (2.6%) | 537 (5.9%) |
| $50,000 to $54,999 | 310 (3.3%) | 401 (4.4%) |
| $55,000 to $64,999 | 589 (6.3%) | 764 (8.4%) |
| $65,000 to $74,999 | 420 (4.5%) | 523 (5.7%) |
| $75,000 to $99,999 | 1,115 (11.9%) | 951 (10.4%) |
| $100,000+ | 3,392 (36.3%) | 1,673 (18.4%) |
| Total | 9,336 (100.0%) | 9,109 (100.0%) |
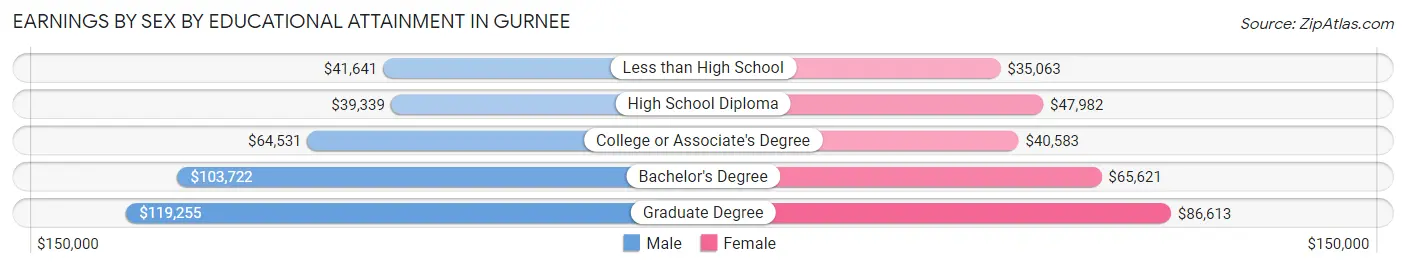
Earnings by Sex by Educational Attainment in Gurnee
Average earnings in Gurnee are $82,879 for men and $55,322 for women, a difference of 33.3%. Men with an educational attainment of graduate degree enjoy the highest average annual earnings of $119,255, while those with high school diploma education earn the least with $39,339. Women with an educational attainment of graduate degree earn the most with the average annual earnings of $86,613, while those with less than high school education have the smallest earnings of $35,063.
| Educational Attainment | Male Income | Female Income |
| Less than High School | $41,641 | $35,063 |
| High School Diploma | $39,339 | $47,982 |
| College or Associate's Degree | $64,531 | $40,583 |
| Bachelor's Degree | $103,722 | $65,621 |
| Graduate Degree | $119,255 | $86,613 |
| Total | $82,879 | $55,322 |
Family Income in Gurnee
Family Income Brackets in Gurnee
According to the Gurnee family income data, there are 2,337 families falling into the $200,000+ income range, which is the most common income bracket and makes up 28.9% of all families. Conversely, the $10,000 to $14,999 income bracket is the least frequent group with only 16 families (0.2%) belonging to this category.
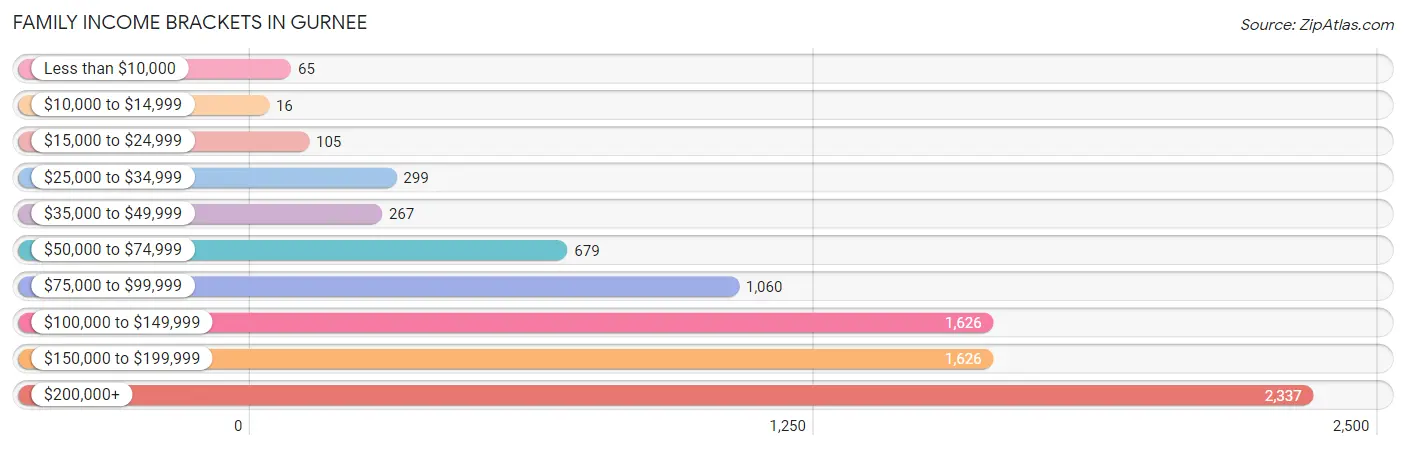
| Income Bracket | # Families | % Families |
| Less than $10,000 | 65 | 0.8% |
| $10,000 to $14,999 | 16 | 0.2% |
| $15,000 to $24,999 | 105 | 1.3% |
| $25,000 to $34,999 | 299 | 3.7% |
| $35,000 to $49,999 | 267 | 3.3% |
| $50,000 to $74,999 | 679 | 8.4% |
| $75,000 to $99,999 | 1,060 | 13.1% |
| $100,000 to $149,999 | 1,626 | 20.1% |
| $150,000 to $199,999 | 1,626 | 20.1% |
| $200,000+ | 2,337 | 28.9% |
Family Income by Famaliy Size in Gurnee
5-person families (550 | 6.8%) account for the highest median family income in Gurnee with $197,798 per family, while 2-person families (3,519 | 43.5%) have the highest median income of $63,954 per family member.
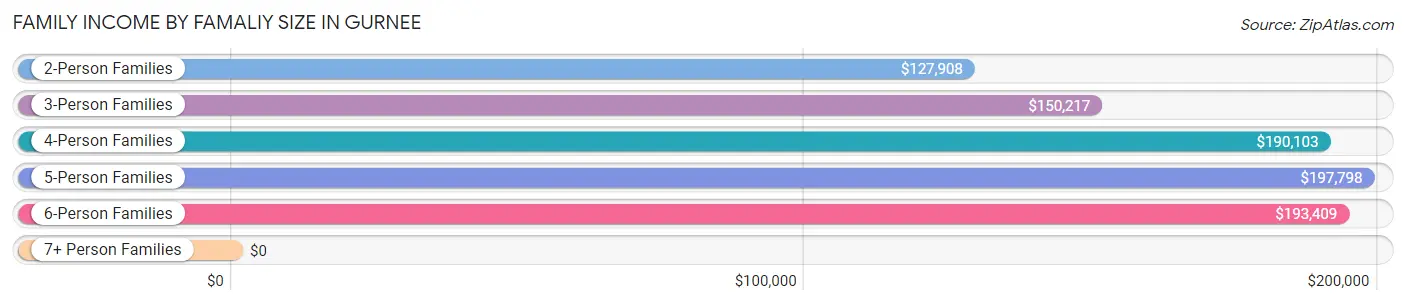
| Income Bracket | # Families | Median Income |
| 2-Person Families | 3,519 (43.5%) | $127,908 |
| 3-Person Families | 1,854 (22.9%) | $150,217 |
| 4-Person Families | 1,880 (23.2%) | $190,103 |
| 5-Person Families | 550 (6.8%) | $197,798 |
| 6-Person Families | 250 (3.1%) | $193,409 |
| 7+ Person Families | 35 (0.4%) | $0 |
| Total | 8,088 (100.0%) | $148,347 |
Family Income by Number of Earners in Gurnee
The median family income in Gurnee is $148,347, with families comprising 3+ earners (1,294) having the highest median family income of $190,926, while families with no earners (702) have the lowest median family income of $64,559, accounting for 16.0% and 8.7% of families, respectively.
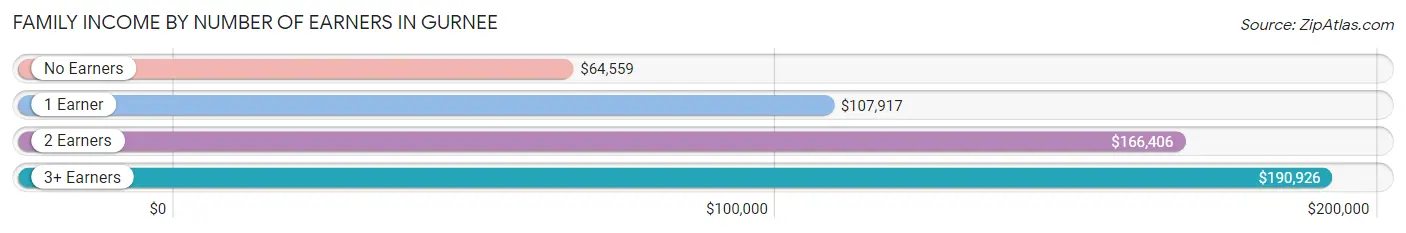
| Number of Earners | # Families | Median Income |
| No Earners | 702 (8.7%) | $64,559 |
| 1 Earner | 1,953 (24.1%) | $107,917 |
| 2 Earners | 4,139 (51.2%) | $166,406 |
| 3+ Earners | 1,294 (16.0%) | $190,926 |
| Total | 8,088 (100.0%) | $148,347 |
Household Income in Gurnee
Household Income Brackets in Gurnee
With 2,572 households falling in the category, the $200,000+ income range is the most frequent in Gurnee, accounting for 21.9% of all households. In contrast, only 223 households (1.9%) fall into the less than $10,000 income bracket, making it the least populous group.
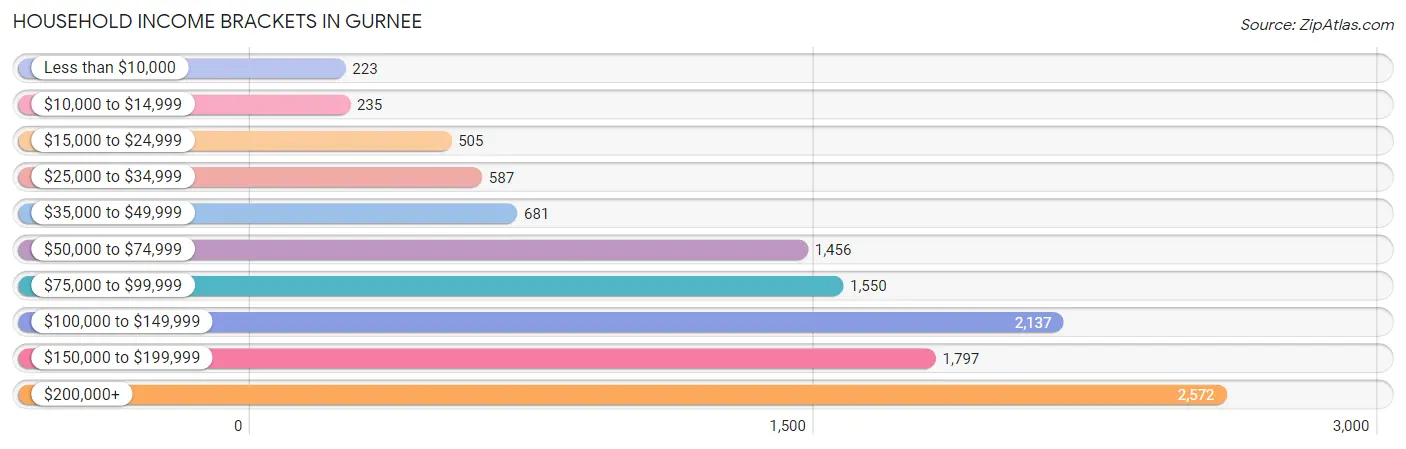
| Income Bracket | # Households | % Households |
| Less than $10,000 | 223 | 1.9% |
| $10,000 to $14,999 | 235 | 2.0% |
| $15,000 to $24,999 | 505 | 4.3% |
| $25,000 to $34,999 | 587 | 5.0% |
| $35,000 to $49,999 | 681 | 5.8% |
| $50,000 to $74,999 | 1,456 | 12.4% |
| $75,000 to $99,999 | 1,550 | 13.2% |
| $100,000 to $149,999 | 2,137 | 18.2% |
| $150,000 to $199,999 | 1,797 | 15.3% |
| $200,000+ | 2,572 | 21.9% |
Household Income by Householder Age in Gurnee
The median household income in Gurnee is $112,633, with the highest median household income of $152,489 found in the 45 to 64 years age bracket for the primary householder. A total of 4,997 households (42.5%) fall into this category. Meanwhile, the 65+ years age bracket for the primary householder has the lowest median household income of $66,087, with 2,677 households (22.8%) in this group.
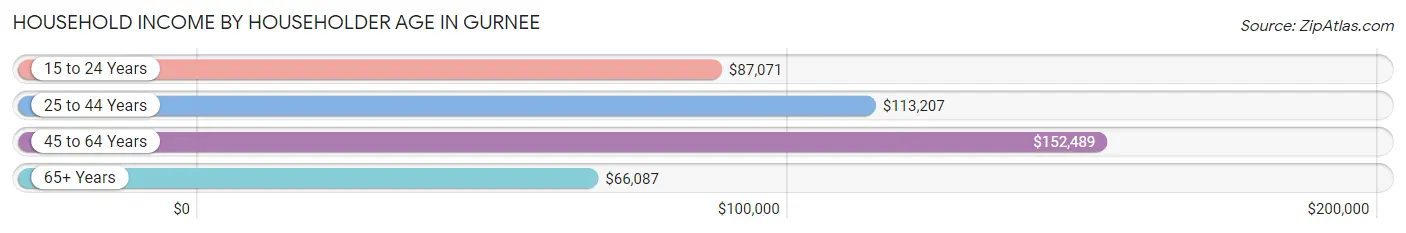
| Income Bracket | # Households | Median Income |
| 15 to 24 Years | 258 (2.2%) | $87,071 |
| 25 to 44 Years | 3,811 (32.5%) | $113,207 |
| 45 to 64 Years | 4,997 (42.5%) | $152,489 |
| 65+ Years | 2,677 (22.8%) | $66,087 |
| Total | 11,743 (100.0%) | $112,633 |
Poverty in Gurnee
Income Below Poverty by Sex and Age in Gurnee
With 3.7% poverty level for males and 4.9% for females among the residents of Gurnee, under 5 year old males and 25 to 34 year old females are the most vulnerable to poverty, with 87 males (13.1%) and 168 females (9.0%) in their respective age groups living below the poverty level.
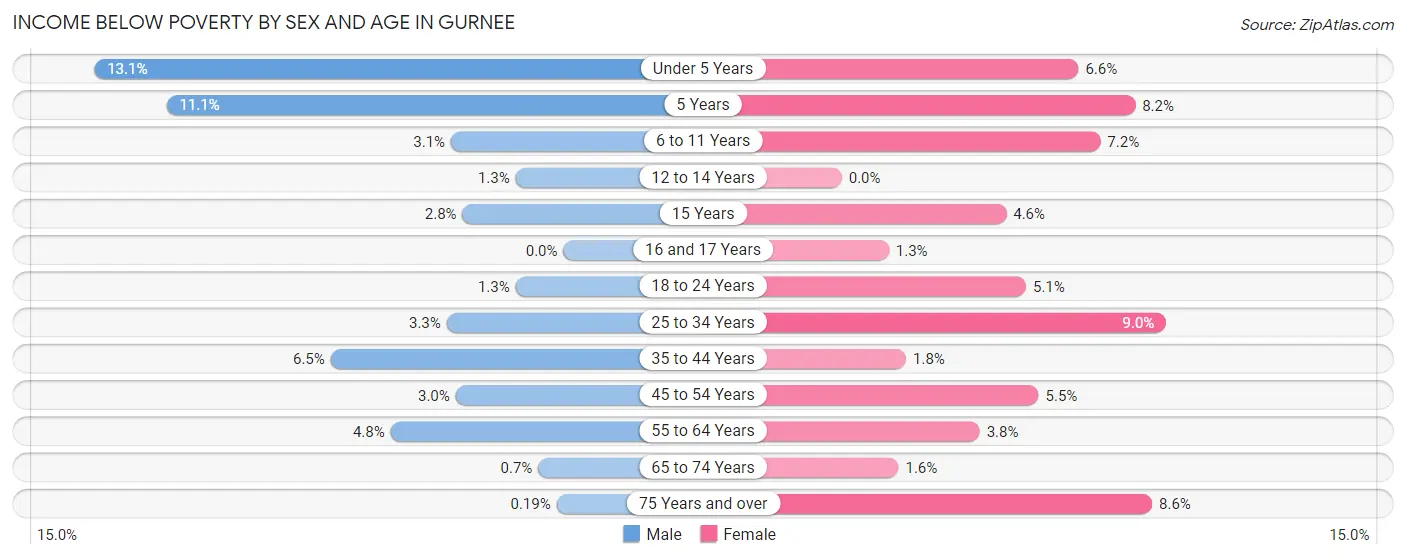
| Age Bracket | Male | Female |
| Under 5 Years | 87 (13.1%) | 29 (6.6%) |
| 5 Years | 19 (11.1%) | 21 (8.2%) |
| 6 to 11 Years | 36 (3.1%) | 75 (7.2%) |
| 12 to 14 Years | 9 (1.3%) | 0 (0.0%) |
| 15 Years | 5 (2.8%) | 7 (4.6%) |
| 16 and 17 Years | 0 (0.0%) | 7 (1.3%) |
| 18 to 24 Years | 21 (1.3%) | 95 (5.1%) |
| 25 to 34 Years | 64 (3.3%) | 168 (9.0%) |
| 35 to 44 Years | 122 (6.5%) | 34 (1.8%) |
| 45 to 54 Years | 64 (3.0%) | 140 (5.5%) |
| 55 to 64 Years | 109 (4.8%) | 83 (3.8%) |
| 65 to 74 Years | 9 (0.7%) | 22 (1.6%) |
| 75 Years and over | 1 (0.2%) | 84 (8.6%) |
| Total | 546 (3.7%) | 765 (4.9%) |
Income Above Poverty by Sex and Age in Gurnee
According to the poverty statistics in Gurnee, males aged 16 and 17 years and females aged 12 to 14 years are the age groups that are most secure financially, with 100.0% of males and 100.0% of females in these age groups living above the poverty line.
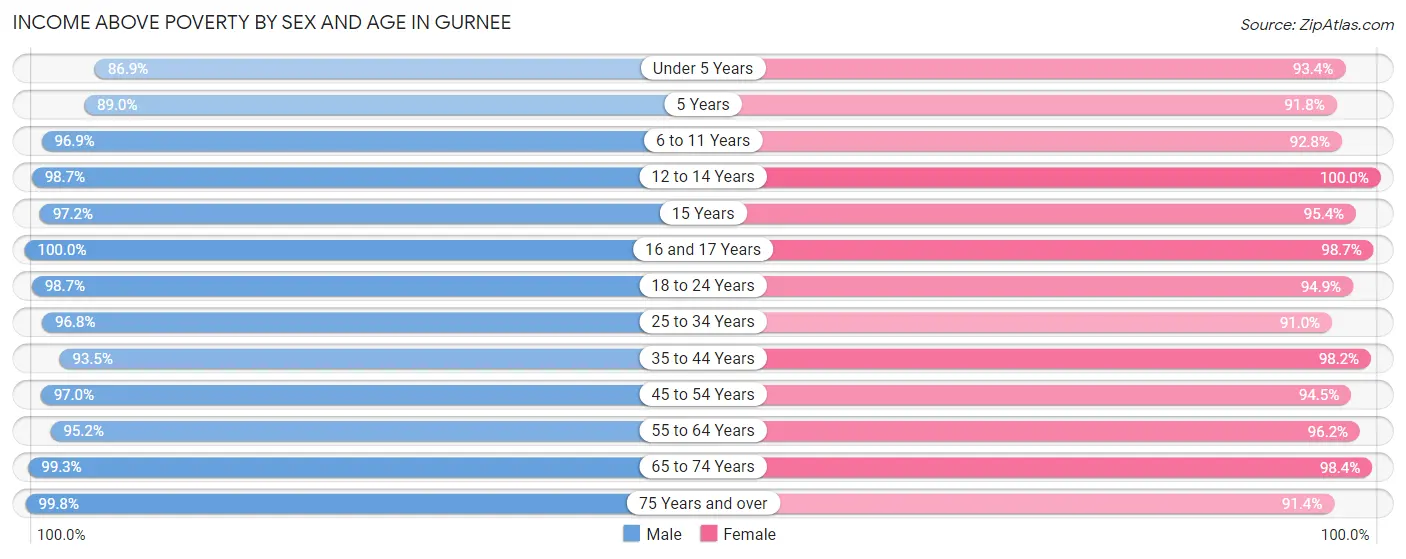
| Age Bracket | Male | Female |
| Under 5 Years | 579 (86.9%) | 411 (93.4%) |
| 5 Years | 153 (88.9%) | 236 (91.8%) |
| 6 to 11 Years | 1,115 (96.9%) | 967 (92.8%) |
| 12 to 14 Years | 668 (98.7%) | 599 (100.0%) |
| 15 Years | 173 (97.2%) | 146 (95.4%) |
| 16 and 17 Years | 399 (100.0%) | 529 (98.7%) |
| 18 to 24 Years | 1,553 (98.7%) | 1,758 (94.9%) |
| 25 to 34 Years | 1,905 (96.8%) | 1,692 (91.0%) |
| 35 to 44 Years | 1,762 (93.5%) | 1,861 (98.2%) |
| 45 to 54 Years | 2,067 (97.0%) | 2,414 (94.5%) |
| 55 to 64 Years | 2,159 (95.2%) | 2,077 (96.2%) |
| 65 to 74 Years | 1,271 (99.3%) | 1,374 (98.4%) |
| 75 Years and over | 534 (99.8%) | 888 (91.4%) |
| Total | 14,338 (96.3%) | 14,952 (95.1%) |
Income Below Poverty Among Married-Couple Families in Gurnee
The poverty statistics for married-couple families in Gurnee show that 0.3% or 21 of the total 6,960 families live below the poverty line. Families with 3 or 4 children have the highest poverty rate of 1.0%, comprising of 4 families. On the other hand, families with 1 or 2 children have the lowest poverty rate of 0.2%, which includes 5 families.
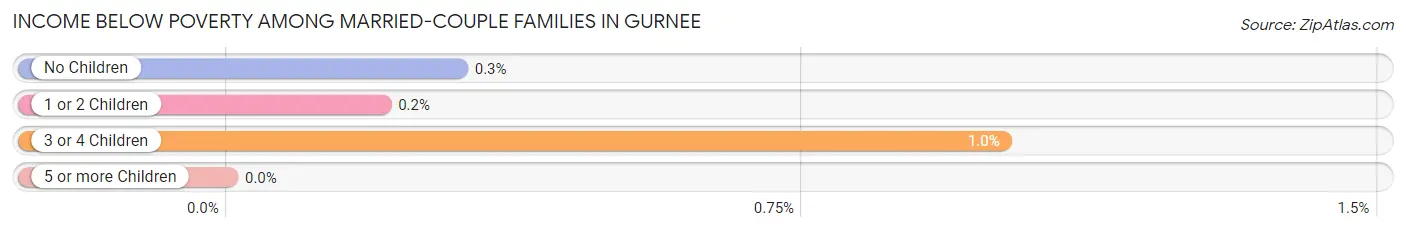
| Children | Above Poverty | Below Poverty |
| No Children | 4,040 (99.7%) | 12 (0.3%) |
| 1 or 2 Children | 2,506 (99.8%) | 5 (0.2%) |
| 3 or 4 Children | 393 (99.0%) | 4 (1.0%) |
| 5 or more Children | 0 (0.0%) | 0 (0.0%) |
| Total | 6,939 (99.7%) | 21 (0.3%) |
Income Below Poverty Among Single-Parent Households in Gurnee
According to the poverty data in Gurnee, 4.3% or 15 single-father households and 12.0% or 94 single-mother households are living below the poverty line. Among single-father households, those with 5 or more children have the highest poverty rate, with 15 households (100.0%) experiencing poverty. Likewise, among single-mother households, those with 3 or 4 children have the highest poverty rate, with 52 households (70.3%) falling below the poverty line.
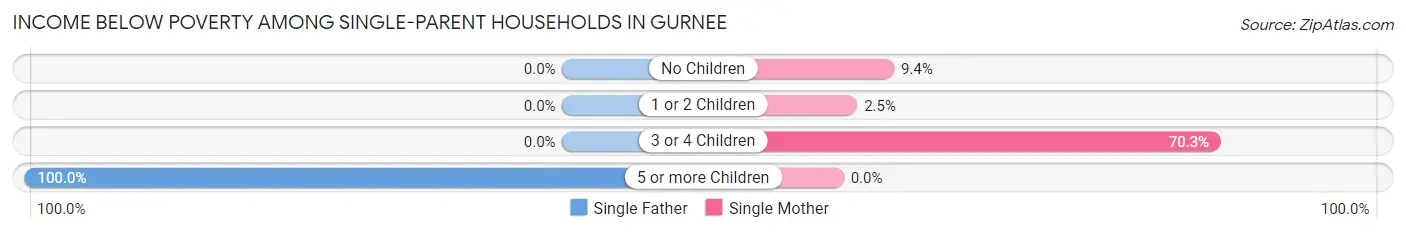
| Children | Single Father | Single Mother |
| No Children | 0 (0.0%) | 33 (9.4%) |
| 1 or 2 Children | 0 (0.0%) | 9 (2.5%) |
| 3 or 4 Children | 0 (0.0%) | 52 (70.3%) |
| 5 or more Children | 15 (100.0%) | 0 (0.0%) |
| Total | 15 (4.3%) | 94 (12.0%) |
Income Below Poverty Among Married-Couple vs Single-Parent Households in Gurnee
The poverty data for Gurnee shows that 21 of the married-couple family households (0.3%) and 109 of the single-parent households (9.7%) are living below the poverty level. Within the married-couple family households, those with 3 or 4 children have the highest poverty rate, with 4 households (1.0%) falling below the poverty line. Among the single-parent households, those with 5 or more children have the highest poverty rate, with 15 household (100.0%) living below poverty.
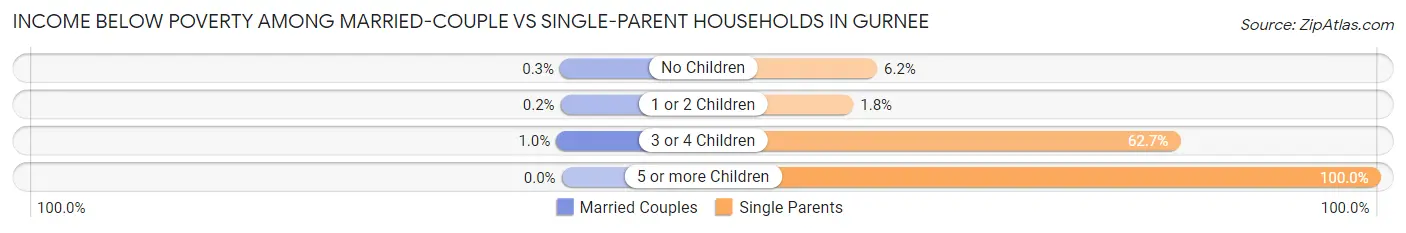
| Children | Married-Couple Families | Single-Parent Households |
| No Children | 12 (0.3%) | 33 (6.2%) |
| 1 or 2 Children | 5 (0.2%) | 9 (1.8%) |
| 3 or 4 Children | 4 (1.0%) | 52 (62.6%) |
| 5 or more Children | 0 (0.0%) | 15 (100.0%) |
| Total | 21 (0.3%) | 109 (9.7%) |
Race in Gurnee
The most populous races in Gurnee are White / Caucasian (20,165 | 65.8%), Hispanic or Latino (4,440 | 14.5%), and Asian (4,046 | 13.2%).
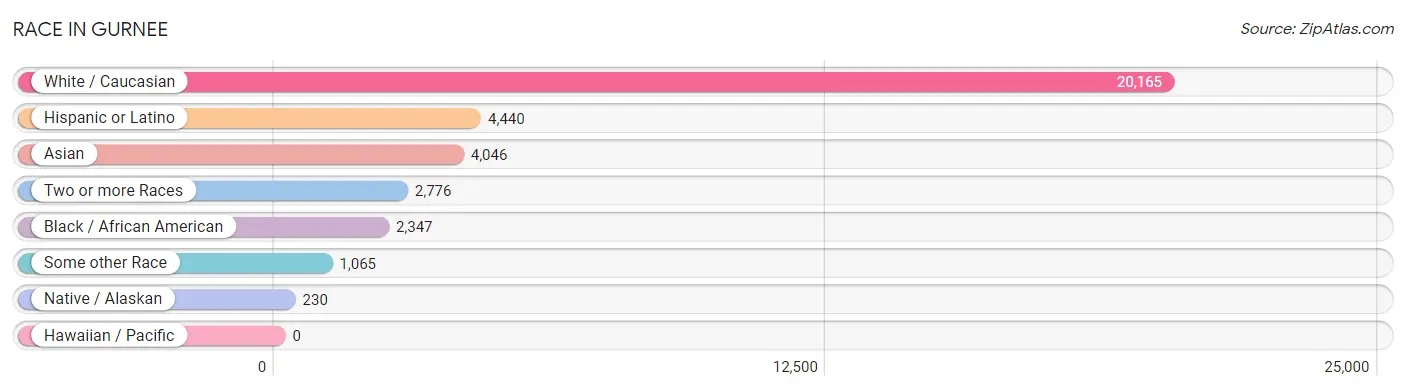
| Race | # Population | % Population |
| Asian | 4,046 | 13.2% |
| Black / African American | 2,347 | 7.7% |
| Hawaiian / Pacific | 0 | 0.0% |
| Hispanic or Latino | 4,440 | 14.5% |
| Native / Alaskan | 230 | 0.7% |
| White / Caucasian | 20,165 | 65.8% |
| Two or more Races | 2,776 | 9.1% |
| Some other Race | 1,065 | 3.5% |
| Total | 30,629 | 100.0% |
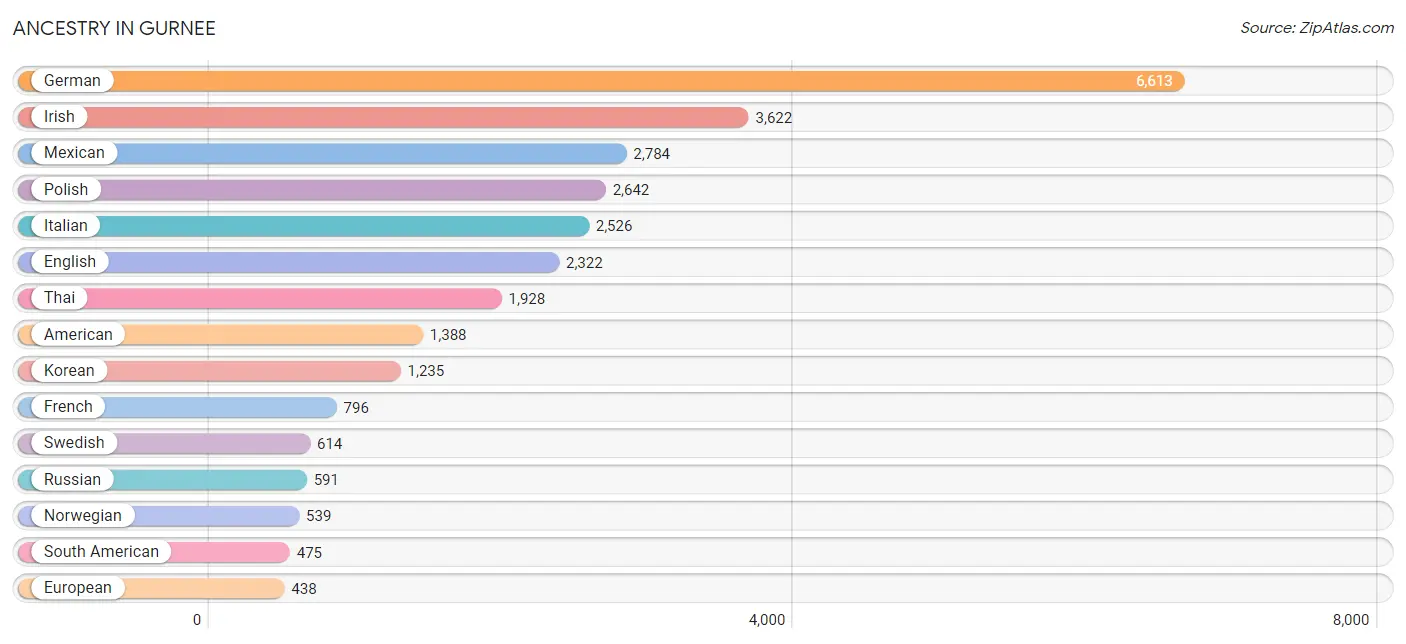
Ancestry in Gurnee
The most populous ancestries reported in Gurnee are German (6,613 | 21.6%), Irish (3,622 | 11.8%), Mexican (2,784 | 9.1%), Polish (2,642 | 8.6%), and Italian (2,526 | 8.3%), together accounting for 59.4% of all Gurnee residents.
| Ancestry | # Population | % Population |
| African | 128 | 0.4% |
| American | 1,388 | 4.5% |
| Arab | 225 | 0.7% |
| Armenian | 20 | 0.1% |
| Australian | 10 | 0.0% |
| Austrian | 108 | 0.4% |
| Belgian | 35 | 0.1% |
| Belizean | 55 | 0.2% |
| Bermudan | 6 | 0.0% |
| Bhutanese | 43 | 0.1% |
| Blackfeet | 19 | 0.1% |
| Brazilian | 31 | 0.1% |
| British | 346 | 1.1% |
| Burmese | 368 | 1.2% |
| Canadian | 22 | 0.1% |
| Central American | 250 | 0.8% |
| Central American Indian | 99 | 0.3% |
| Cherokee | 26 | 0.1% |
| Colombian | 191 | 0.6% |
| Croatian | 180 | 0.6% |
| Cuban | 369 | 1.2% |
| Czech | 192 | 0.6% |
| Czechoslovakian | 23 | 0.1% |
| Danish | 152 | 0.5% |
| Dutch | 317 | 1.0% |
| Eastern European | 91 | 0.3% |
| Ecuadorian | 194 | 0.6% |
| English | 2,322 | 7.6% |
| Ethiopian | 25 | 0.1% |
| European | 438 | 1.4% |
| Filipino | 31 | 0.1% |
| Finnish | 126 | 0.4% |
| French | 796 | 2.6% |
| French Canadian | 145 | 0.5% |
| German | 6,613 | 21.6% |
| Greek | 195 | 0.6% |
| Guatemalan | 44 | 0.1% |
| Honduran | 174 | 0.6% |
| Hungarian | 85 | 0.3% |
| Indian (Asian) | 202 | 0.7% |
| Iranian | 83 | 0.3% |
| Irish | 3,622 | 11.8% |
| Italian | 2,526 | 8.3% |
| Jamaican | 12 | 0.0% |
| Japanese | 34 | 0.1% |
| Korean | 1,235 | 4.0% |
| Lebanese | 26 | 0.1% |
| Lithuanian | 130 | 0.4% |
| Luxembourger | 12 | 0.0% |
| Malaysian | 16 | 0.1% |
| Mexican | 2,784 | 9.1% |
| Mexican American Indian | 121 | 0.4% |
| Mongolian | 19 | 0.1% |
| Nicaraguan | 7 | 0.0% |
| Northern European | 48 | 0.2% |
| Norwegian | 539 | 1.8% |
| Palestinian | 28 | 0.1% |
| Peruvian | 42 | 0.1% |
| Polish | 2,642 | 8.6% |
| Portuguese | 6 | 0.0% |
| Puerto Rican | 434 | 1.4% |
| Romanian | 136 | 0.4% |
| Russian | 591 | 1.9% |
| Salvadoran | 25 | 0.1% |
| Scandinavian | 94 | 0.3% |
| Scotch-Irish | 50 | 0.2% |
| Scottish | 261 | 0.9% |
| Serbian | 66 | 0.2% |
| Sioux | 7 | 0.0% |
| Slavic | 34 | 0.1% |
| Slovak | 53 | 0.2% |
| Slovene | 50 | 0.2% |
| South American | 475 | 1.5% |
| Spaniard | 33 | 0.1% |
| Spanish | 51 | 0.2% |
| Sri Lankan | 225 | 0.7% |
| Subsaharan African | 184 | 0.6% |
| Swedish | 614 | 2.0% |
| Swiss | 40 | 0.1% |
| Thai | 1,928 | 6.3% |
| Ukrainian | 102 | 0.3% |
| Venezuelan | 48 | 0.2% |
| Welsh | 154 | 0.5% |
| Yugoslavian | 23 | 0.1% | View All 84 Rows |
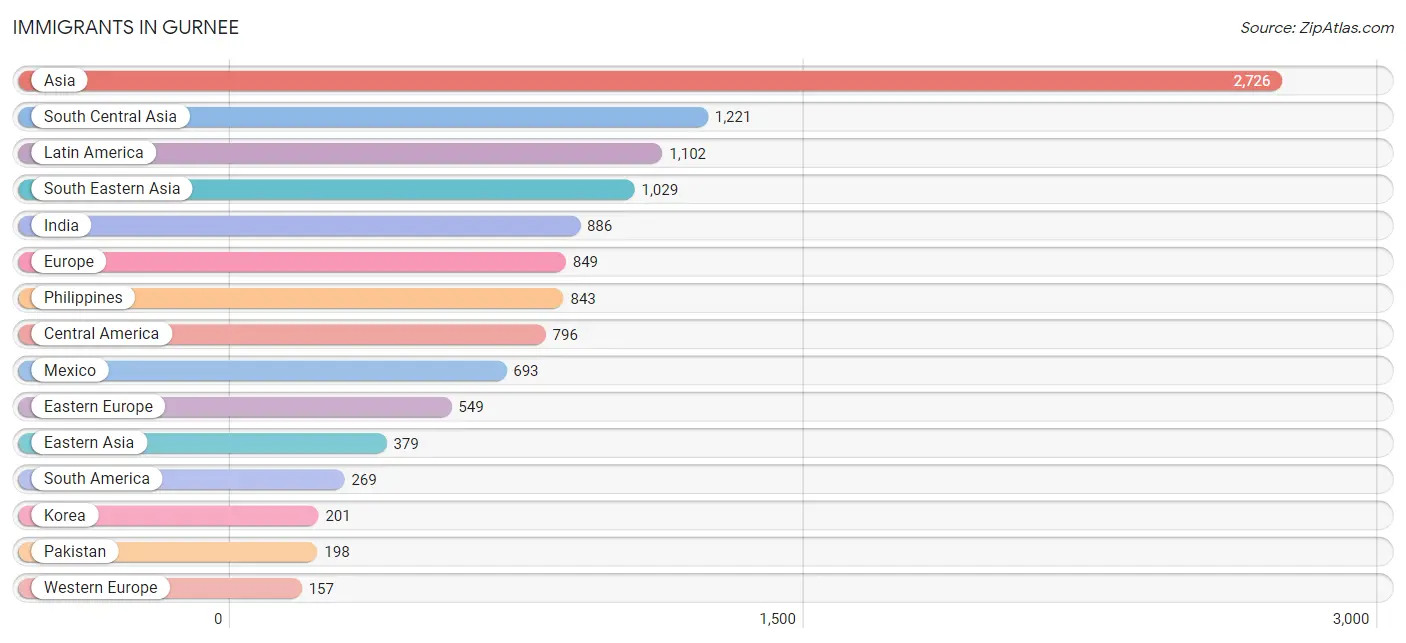
Immigrants in Gurnee
The most numerous immigrant groups reported in Gurnee came from Asia (2,726 | 8.9%), South Central Asia (1,221 | 4.0%), Latin America (1,102 | 3.6%), South Eastern Asia (1,029 | 3.4%), and India (886 | 2.9%), together accounting for 22.7% of all Gurnee residents.
| Immigration Origin | # Population | % Population |
| Africa | 140 | 0.5% |
| Asia | 2,726 | 8.9% |
| Bangladesh | 84 | 0.3% |
| Belarus | 6 | 0.0% |
| Belize | 75 | 0.2% |
| Brazil | 31 | 0.1% |
| Cambodia | 24 | 0.1% |
| Canada | 88 | 0.3% |
| Caribbean | 37 | 0.1% |
| Central America | 796 | 2.6% |
| China | 114 | 0.4% |
| Colombia | 144 | 0.5% |
| Cuba | 16 | 0.1% |
| Eastern Africa | 53 | 0.2% |
| Eastern Asia | 379 | 1.2% |
| Eastern Europe | 549 | 1.8% |
| Ecuador | 9 | 0.0% |
| El Salvador | 11 | 0.0% |
| England | 76 | 0.3% |
| Ethiopia | 25 | 0.1% |
| Europe | 849 | 2.8% |
| Germany | 126 | 0.4% |
| Greece | 15 | 0.1% |
| Guyana | 11 | 0.0% |
| Honduras | 10 | 0.0% |
| Hong Kong | 9 | 0.0% |
| Hungary | 2 | 0.0% |
| India | 886 | 2.9% |
| Iran | 53 | 0.2% |
| Iraq | 26 | 0.1% |
| Ireland | 10 | 0.0% |
| Italy | 8 | 0.0% |
| Jamaica | 21 | 0.1% |
| Japan | 64 | 0.2% |
| Kenya | 10 | 0.0% |
| Korea | 201 | 0.7% |
| Laos | 6 | 0.0% |
| Latin America | 1,102 | 3.6% |
| Lebanon | 8 | 0.0% |
| Malaysia | 5 | 0.0% |
| Mexico | 693 | 2.3% |
| Moldova | 7 | 0.0% |
| Netherlands | 31 | 0.1% |
| Nicaragua | 7 | 0.0% |
| Northern Europe | 120 | 0.4% |
| Pakistan | 198 | 0.6% |
| Peru | 26 | 0.1% |
| Philippines | 843 | 2.8% |
| Poland | 146 | 0.5% |
| Romania | 83 | 0.3% |
| Russia | 87 | 0.3% |
| Serbia | 62 | 0.2% |
| South Africa | 14 | 0.1% |
| South America | 269 | 0.9% |
| South Central Asia | 1,221 | 4.0% |
| South Eastern Asia | 1,029 | 3.4% |
| Southern Europe | 23 | 0.1% |
| Sweden | 26 | 0.1% |
| Taiwan | 14 | 0.1% |
| Thailand | 31 | 0.1% |
| Ukraine | 137 | 0.4% |
| Venezuela | 48 | 0.2% |
| Vietnam | 120 | 0.4% |
| Western Africa | 31 | 0.1% |
| Western Asia | 34 | 0.1% |
| Western Europe | 157 | 0.5% | View All 66 Rows |
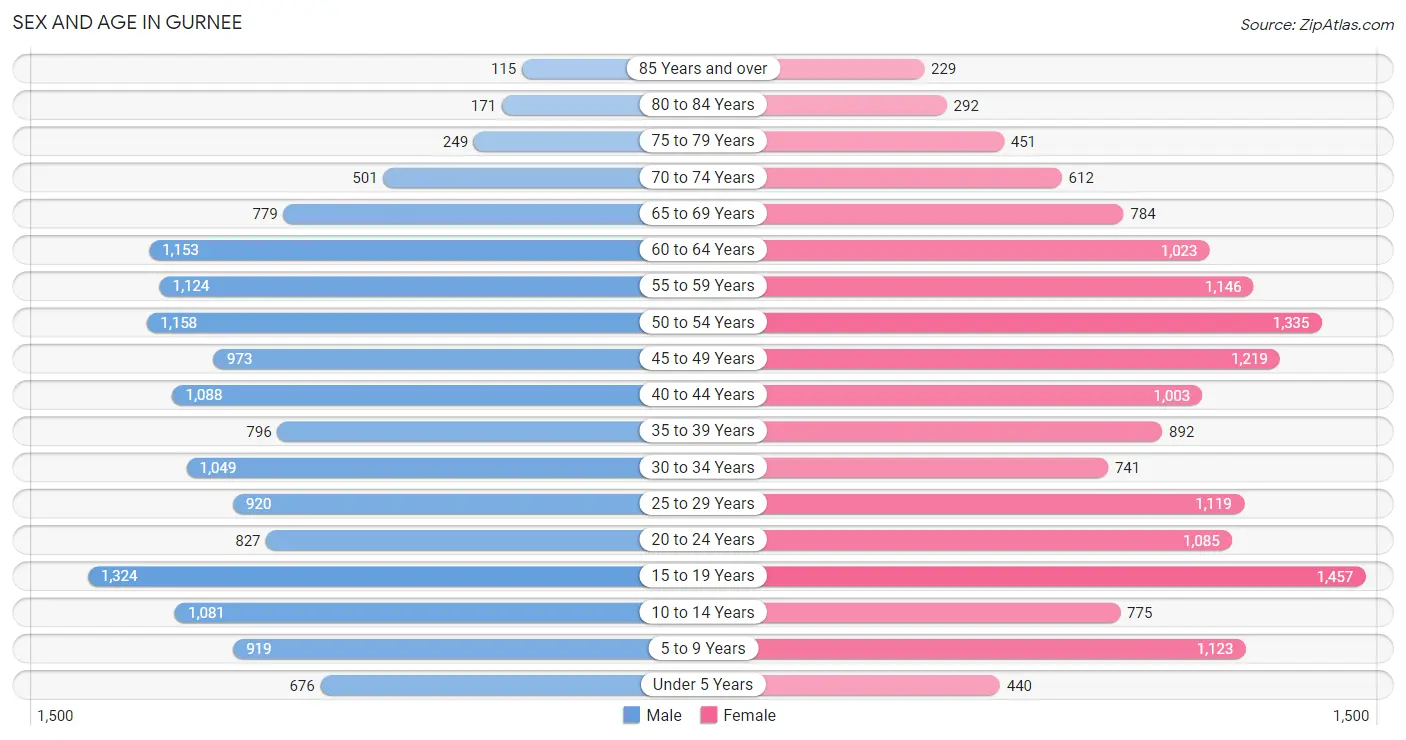
Sex and Age in Gurnee
Sex and Age in Gurnee
The most populous age groups in Gurnee are 15 to 19 Years (1,324 | 8.9%) for men and 15 to 19 Years (1,457 | 9.3%) for women.
| Age Bracket | Male | Female |
| Under 5 Years | 676 (4.5%) | 440 (2.8%) |
| 5 to 9 Years | 919 (6.2%) | 1,123 (7.1%) |
| 10 to 14 Years | 1,081 (7.2%) | 775 (4.9%) |
| 15 to 19 Years | 1,324 (8.9%) | 1,457 (9.3%) |
| 20 to 24 Years | 827 (5.6%) | 1,085 (6.9%) |
| 25 to 29 Years | 920 (6.2%) | 1,119 (7.1%) |
| 30 to 34 Years | 1,049 (7.0%) | 741 (4.7%) |
| 35 to 39 Years | 796 (5.3%) | 892 (5.7%) |
| 40 to 44 Years | 1,088 (7.3%) | 1,003 (6.4%) |
| 45 to 49 Years | 973 (6.5%) | 1,219 (7.7%) |
| 50 to 54 Years | 1,158 (7.8%) | 1,335 (8.5%) |
| 55 to 59 Years | 1,124 (7.5%) | 1,146 (7.3%) |
| 60 to 64 Years | 1,153 (7.7%) | 1,023 (6.5%) |
| 65 to 69 Years | 779 (5.2%) | 784 (5.0%) |
| 70 to 74 Years | 501 (3.4%) | 612 (3.9%) |
| 75 to 79 Years | 249 (1.7%) | 451 (2.9%) |
| 80 to 84 Years | 171 (1.1%) | 292 (1.9%) |
| 85 Years and over | 115 (0.8%) | 229 (1.5%) |
| Total | 14,903 (100.0%) | 15,726 (100.0%) |
Families and Households in Gurnee
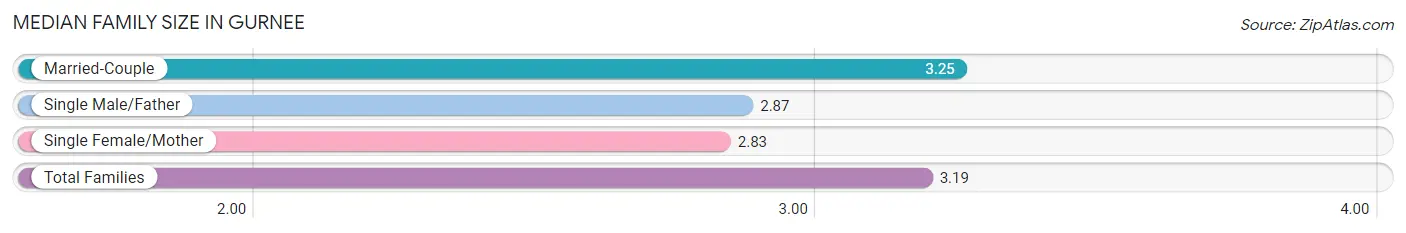
Median Family Size in Gurnee
The median family size in Gurnee is 3.19 persons per family, with married-couple families (6,960 | 86.1%) accounting for the largest median family size of 3.25 persons per family. On the other hand, single female/mother families (783 | 9.7%) represent the smallest median family size with 2.83 persons per family.
| Family Type | # Families | Family Size |
| Married-Couple | 6,960 (86.1%) | 3.25 |
| Single Male/Father | 345 (4.3%) | 2.87 |
| Single Female/Mother | 783 (9.7%) | 2.83 |
| Total Families | 8,088 (100.0%) | 3.19 |
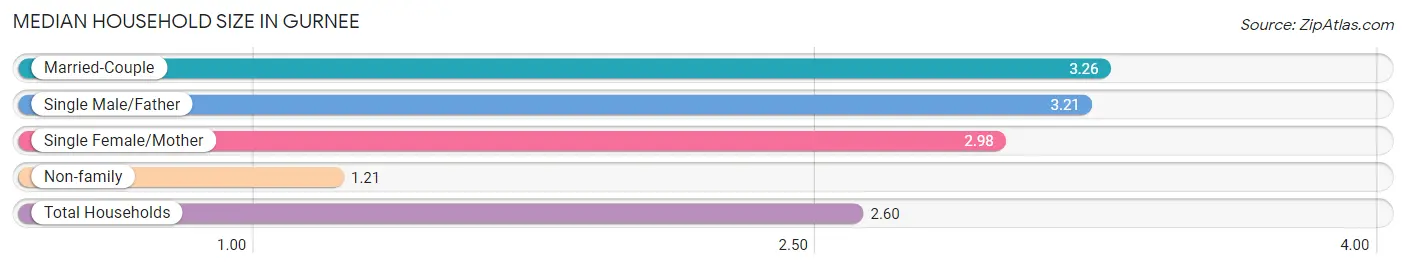
Median Household Size in Gurnee
The median household size in Gurnee is 2.60 persons per household, with married-couple households (6,960 | 59.3%) accounting for the largest median household size of 3.26 persons per household. non-family households (3,655 | 31.1%) represent the smallest median household size with 1.21 persons per household.
| Household Type | # Households | Household Size |
| Married-Couple | 6,960 (59.3%) | 3.26 |
| Single Male/Father | 345 (2.9%) | 3.21 |
| Single Female/Mother | 783 (6.7%) | 2.98 |
| Non-family | 3,655 (31.1%) | 1.21 |
| Total Households | 11,743 (100.0%) | 2.60 |
Household Size by Marriage Status in Gurnee
Out of a total of 11,743 households in Gurnee, 8,088 (68.9%) are family households, while 3,655 (31.1%) are nonfamily households. The most numerous type of family households are 2-person households, comprising 3,386, and the most common type of nonfamily households are 1-person households, comprising 2,928.
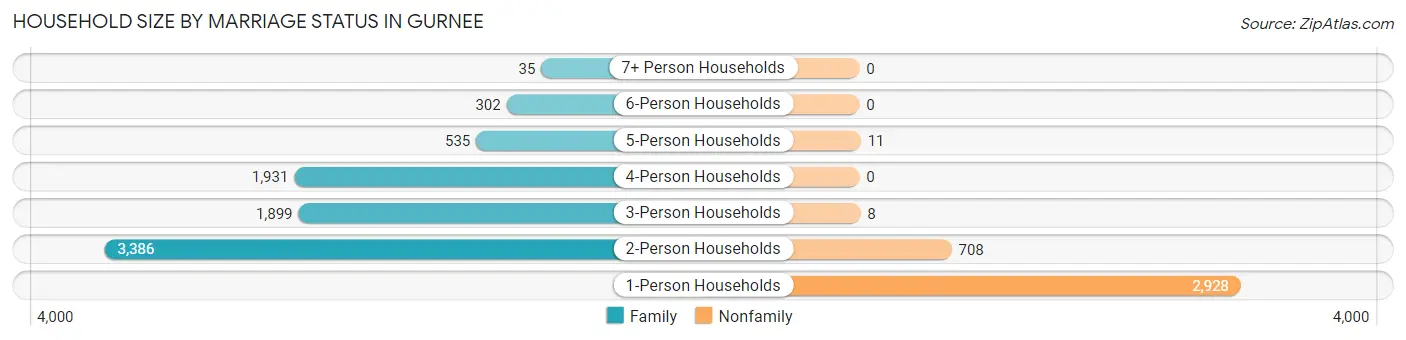
| Household Size | Family Households | Nonfamily Households |
| 1-Person Households | - | 2,928 (24.9%) |
| 2-Person Households | 3,386 (28.8%) | 708 (6.0%) |
| 3-Person Households | 1,899 (16.2%) | 8 (0.1%) |
| 4-Person Households | 1,931 (16.4%) | 0 (0.0%) |
| 5-Person Households | 535 (4.6%) | 11 (0.1%) |
| 6-Person Households | 302 (2.6%) | 0 (0.0%) |
| 7+ Person Households | 35 (0.3%) | 0 (0.0%) |
| Total | 8,088 (68.9%) | 3,655 (31.1%) |
Female Fertility in Gurnee
Fertility by Age in Gurnee
Average fertility rate in Gurnee is 22.0 births per 1,000 women. Women in the age bracket of 20 to 34 years have the highest fertility rate with 45.0 births per 1,000 women. Women in the age bracket of 20 to 34 years acount for 78.7% of all women with births.
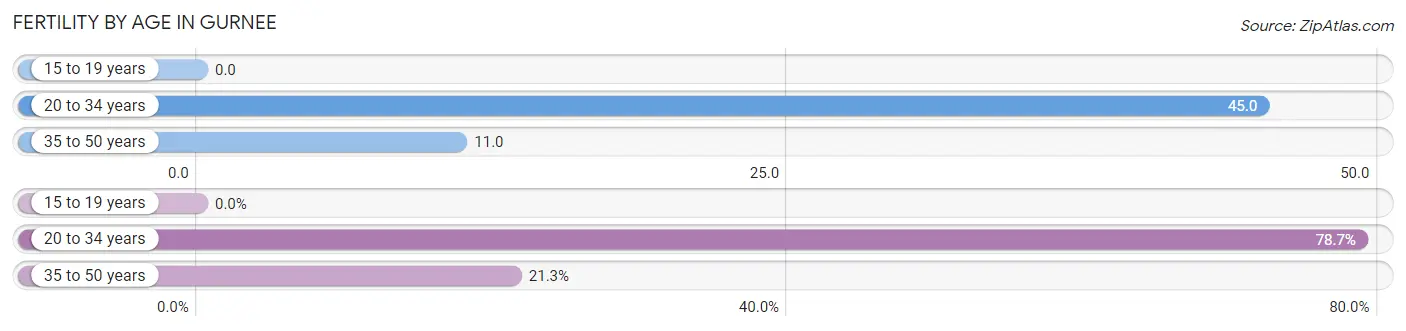
| Age Bracket | Women with Births | Births / 1,000 Women |
| 15 to 19 years | 0 (0.0%) | 0.0 |
| 20 to 34 years | 133 (78.7%) | 45.0 |
| 35 to 50 years | 36 (21.3%) | 11.0 |
| Total | 169 (100.0%) | 22.0 |
Fertility by Age by Marriage Status in Gurnee
57.4% of women with births (169) in Gurnee are married. The highest percentage of unmarried women with births falls into 20 to 34 years age bracket with 54.1% of them unmarried at the time of birth, while the lowest percentage of unmarried women with births belong to 35 to 50 years age bracket with 0.0% of them unmarried.
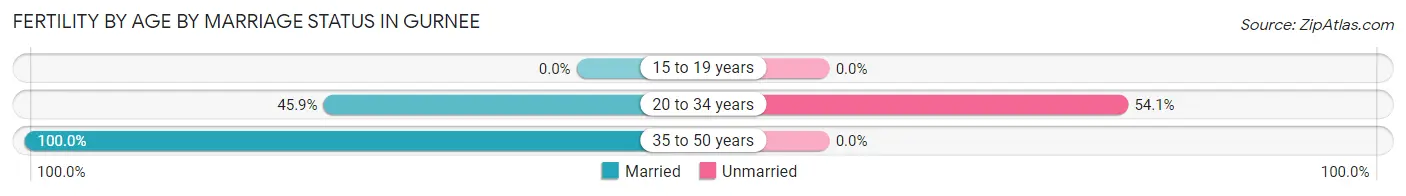
| Age Bracket | Married | Unmarried |
| 15 to 19 years | 0 (0.0%) | 0 (0.0%) |
| 20 to 34 years | 61 (45.9%) | 72 (54.1%) |
| 35 to 50 years | 36 (100.0%) | 0 (0.0%) |
| Total | 97 (57.4%) | 72 (42.6%) |
Fertility by Education in Gurnee
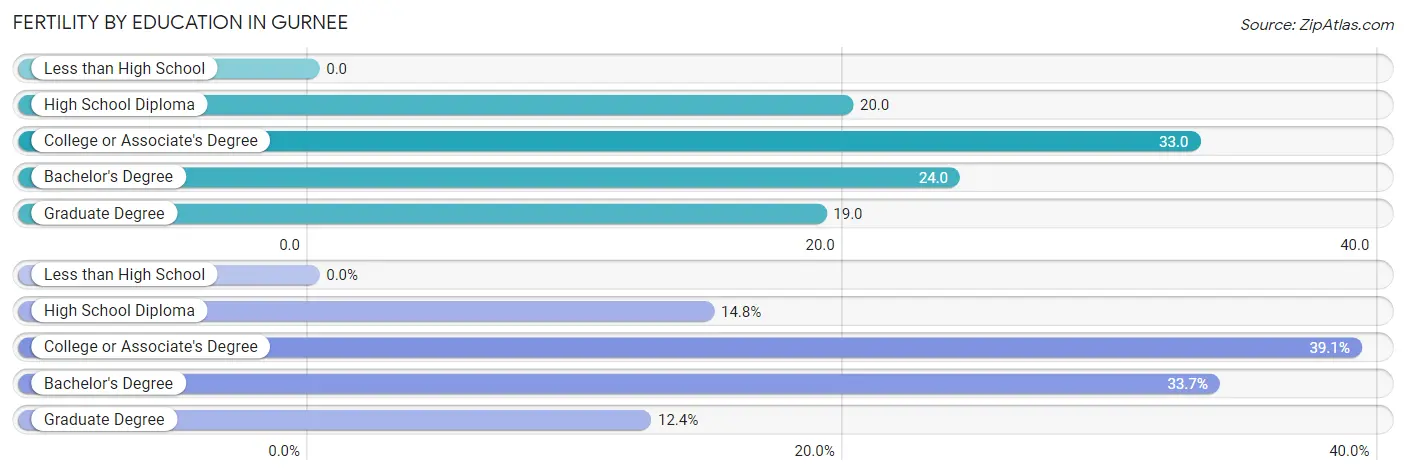
| Educational Attainment | Women with Births | Births / 1,000 Women |
| Less than High School | 0 (0.0%) | 0.0 |
| High School Diploma | 25 (14.8%) | 20.0 |
| College or Associate's Degree | 66 (39.1%) | 33.0 |
| Bachelor's Degree | 57 (33.7%) | 24.0 |
| Graduate Degree | 21 (12.4%) | 19.0 |
| Total | 169 (100.0%) | 22.0 |
Fertility by Education by Marriage Status in Gurnee
42.6% of women with births in Gurnee are unmarried. Women with the educational attainment of bachelor's degree are most likely to be married with 100.0% of them married at childbirth, while women with the educational attainment of high school diploma are least likely to be married with 100.0% of them unmarried at childbirth.
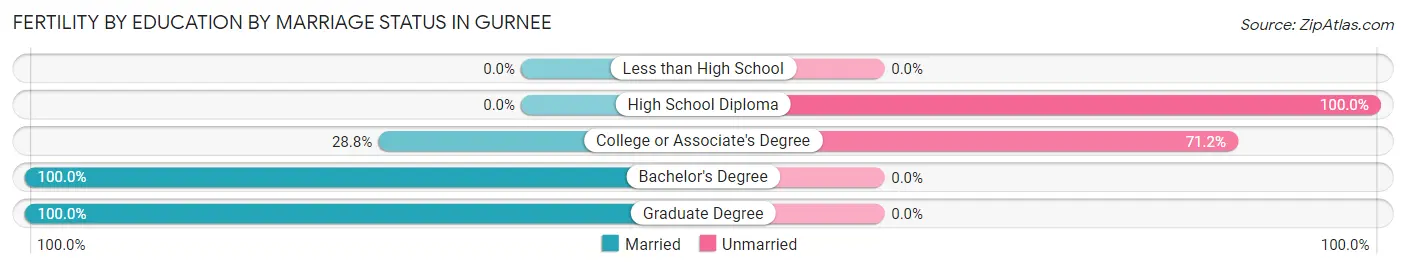
| Educational Attainment | Married | Unmarried |
| Less than High School | 0 (0.0%) | 0 (0.0%) |
| High School Diploma | 0 (0.0%) | 25 (100.0%) |
| College or Associate's Degree | 19 (28.8%) | 47 (71.2%) |
| Bachelor's Degree | 57 (100.0%) | 0 (0.0%) |
| Graduate Degree | 21 (100.0%) | 0 (0.0%) |
| Total | 97 (57.4%) | 72 (42.6%) |
Employment Characteristics in Gurnee
Employment by Class of Employer in Gurnee
Among the 16,611 employed individuals in Gurnee, private company employees (10,933 | 65.8%), not-for-profit organizations (1,486 | 8.9%), and local government employees (1,403 | 8.5%) make up the most common classes of employment.
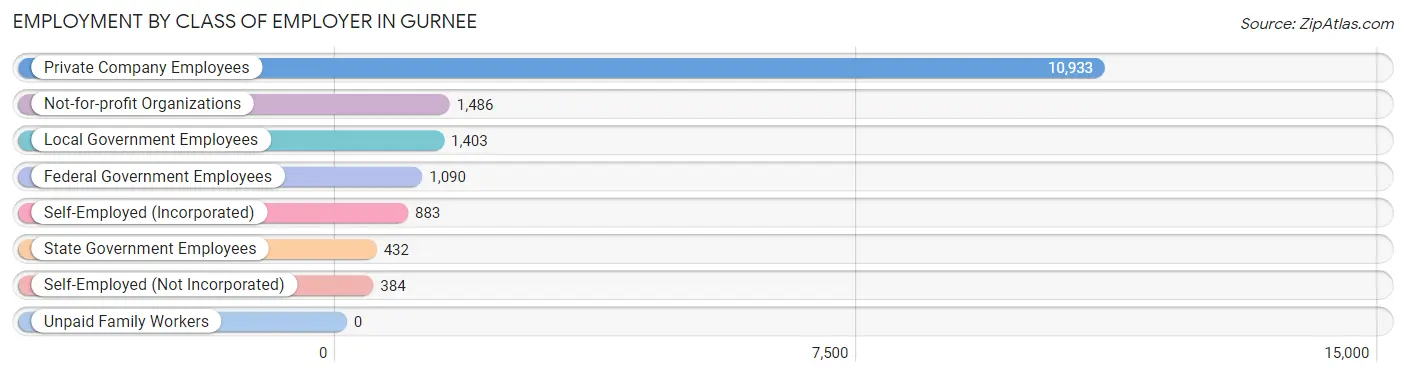
| Employer Class | # Employees | % Employees |
| Private Company Employees | 10,933 | 65.8% |
| Self-Employed (Incorporated) | 883 | 5.3% |
| Self-Employed (Not Incorporated) | 384 | 2.3% |
| Not-for-profit Organizations | 1,486 | 8.9% |
| Local Government Employees | 1,403 | 8.5% |
| State Government Employees | 432 | 2.6% |
| Federal Government Employees | 1,090 | 6.6% |
| Unpaid Family Workers | 0 | 0.0% |
| Total | 16,611 | 100.0% |
Employment Status by Age in Gurnee
According to the labor force statistics for Gurnee, out of the total population over 16 years of age (25,284), 69.7% or 17,623 individuals are in the labor force, with 4.1% or 723 of them unemployed. The age group with the highest labor force participation rate is 30 to 34 years, with 88.8% or 1,590 individuals in the labor force. Within the labor force, the 16 to 19 years age range has the highest percentage of unemployed individuals, with 26.4% or 301 of them being unemployed.
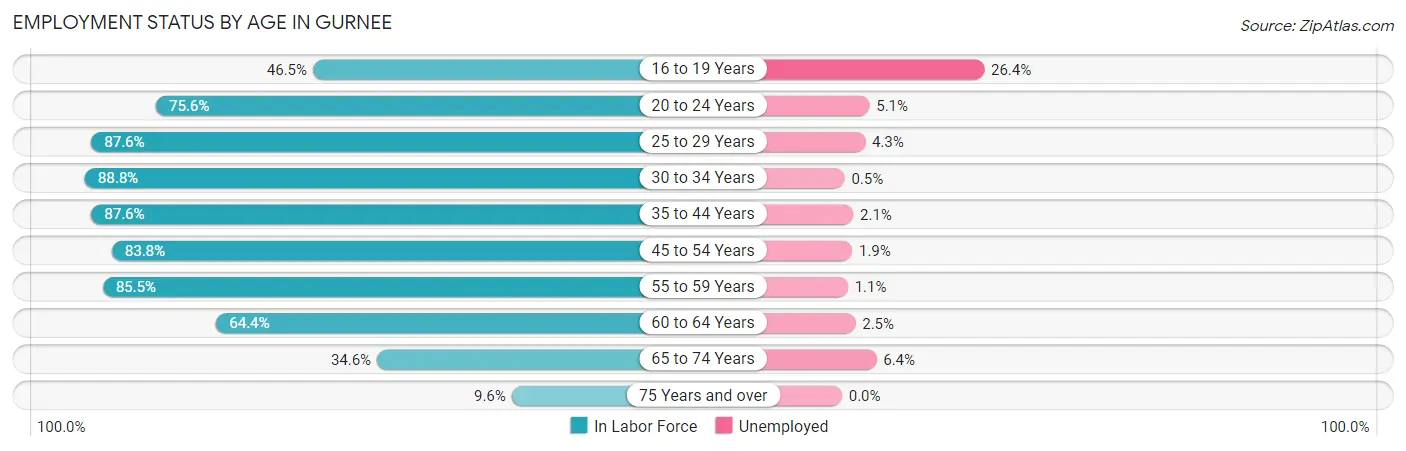
| Age Bracket | In Labor Force | Unemployed |
| 16 to 19 Years | 1,139 (46.5%) | 301 (26.4%) |
| 20 to 24 Years | 1,445 (75.6%) | 74 (5.1%) |
| 25 to 29 Years | 1,786 (87.6%) | 77 (4.3%) |
| 30 to 34 Years | 1,590 (88.8%) | 8 (0.5%) |
| 35 to 44 Years | 3,310 (87.6%) | 70 (2.1%) |
| 45 to 54 Years | 3,926 (83.8%) | 75 (1.9%) |
| 55 to 59 Years | 1,941 (85.5%) | 21 (1.1%) |
| 60 to 64 Years | 1,401 (64.4%) | 35 (2.5%) |
| 65 to 74 Years | 926 (34.6%) | 59 (6.4%) |
| 75 Years and over | 145 (9.6%) | 0 (0.0%) |
| Total | 17,623 (69.7%) | 723 (4.1%) |
Employment Status by Educational Attainment in Gurnee
According to labor force statistics for Gurnee, 83.4% of individuals (13,960) out of the total population between 25 and 64 years of age (16,739) are in the labor force, with 2.0% or 279 of them being unemployed. The group with the highest labor force participation rate are those with the educational attainment of bachelor's degree or higher, with 86.4% or 8,391 individuals in the labor force. Within the labor force, individuals with high school diploma education have the highest percentage of unemployment, with 5.9% or 99 of them being unemployed.
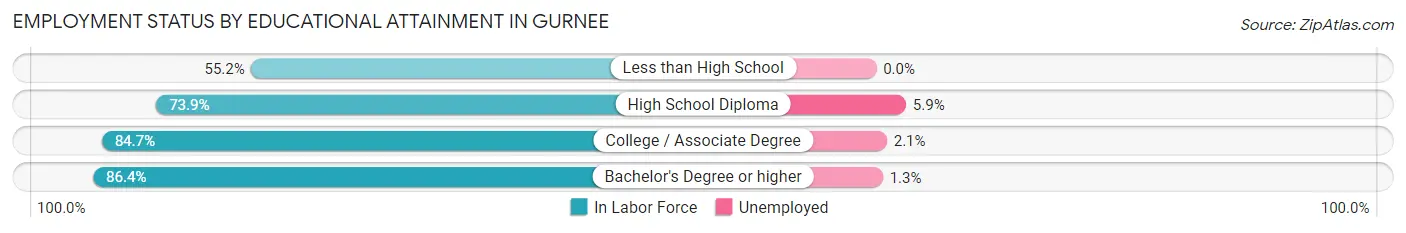
| Educational Attainment | In Labor Force | Unemployed |
| Less than High School | 266 (55.2%) | 0 (0.0%) |
| High School Diploma | 1,686 (73.9%) | 135 (5.9%) |
| College / Associate Degree | 3,611 (84.7%) | 90 (2.1%) |
| Bachelor's Degree or higher | 8,391 (86.4%) | 126 (1.3%) |
| Total | 13,960 (83.4%) | 335 (2.0%) |
Employment Occupations by Sex in Gurnee
Management, Business, Science and Arts Occupations
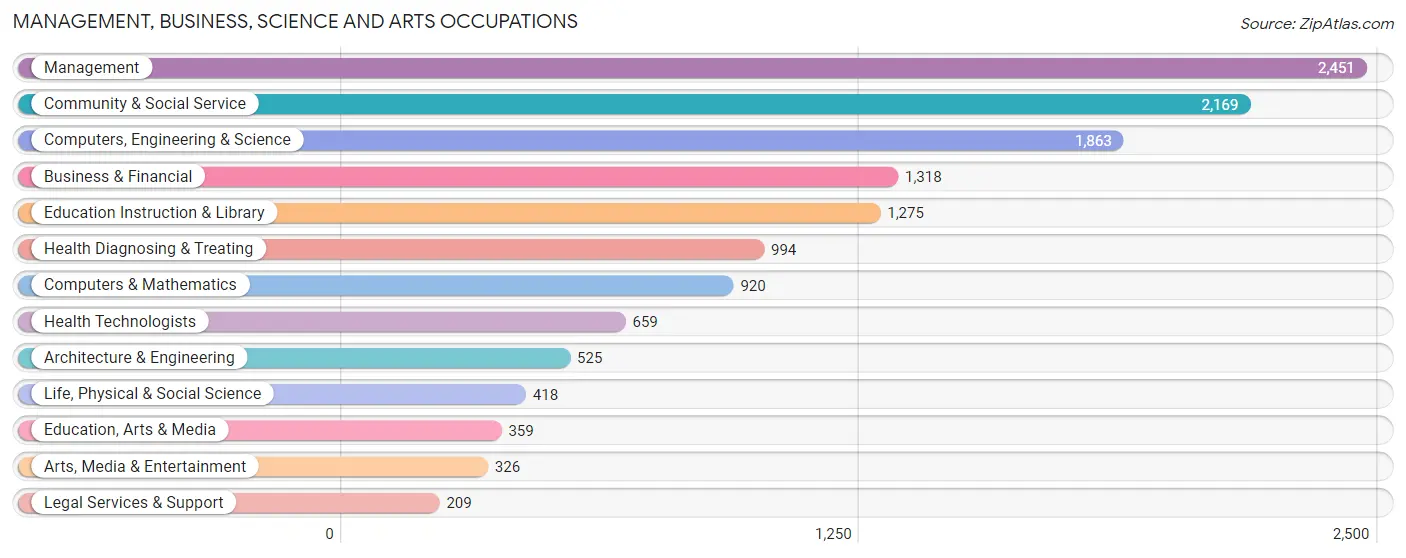
The most common Management, Business, Science and Arts occupations in Gurnee are Management (2,451 | 14.8%), Community & Social Service (2,169 | 13.1%), Computers, Engineering & Science (1,863 | 11.2%), Business & Financial (1,318 | 8.0%), and Education Instruction & Library (1,275 | 7.7%).
Management, Business, Science and Arts Occupations by Sex
Within the Management, Business, Science and Arts occupations in Gurnee, the most male-oriented occupations are Architecture & Engineering (83.6%), Computers & Mathematics (74.7%), and Computers, Engineering & Science (68.9%), while the most female-oriented occupations are Education Instruction & Library (78.2%), Health Diagnosing & Treating (77.8%), and Health Technologists (75.1%).
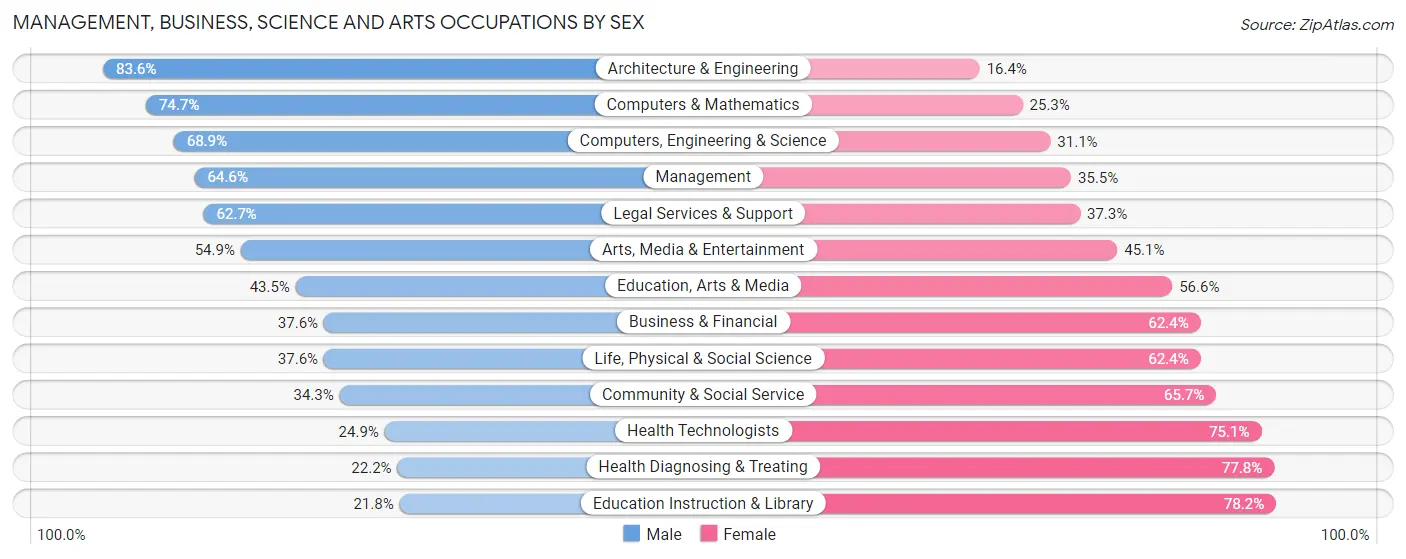
| Occupation | Male | Female |
| Management | 1,582 (64.5%) | 869 (35.4%) |
| Business & Financial | 495 (37.6%) | 823 (62.4%) |
| Computers, Engineering & Science | 1,283 (68.9%) | 580 (31.1%) |
| Computers & Mathematics | 687 (74.7%) | 233 (25.3%) |
| Architecture & Engineering | 439 (83.6%) | 86 (16.4%) |
| Life, Physical & Social Science | 157 (37.6%) | 261 (62.4%) |
| Community & Social Service | 744 (34.3%) | 1,425 (65.7%) |
| Education, Arts & Media | 156 (43.4%) | 203 (56.6%) |
| Legal Services & Support | 131 (62.7%) | 78 (37.3%) |
| Education Instruction & Library | 278 (21.8%) | 997 (78.2%) |
| Arts, Media & Entertainment | 179 (54.9%) | 147 (45.1%) |
| Health Diagnosing & Treating | 221 (22.2%) | 773 (77.8%) |
| Health Technologists | 164 (24.9%) | 495 (75.1%) |
| Total (Category) | 4,325 (49.2%) | 4,470 (50.8%) |
| Total (Overall) | 8,277 (49.9%) | 8,303 (50.1%) |
Services Occupations
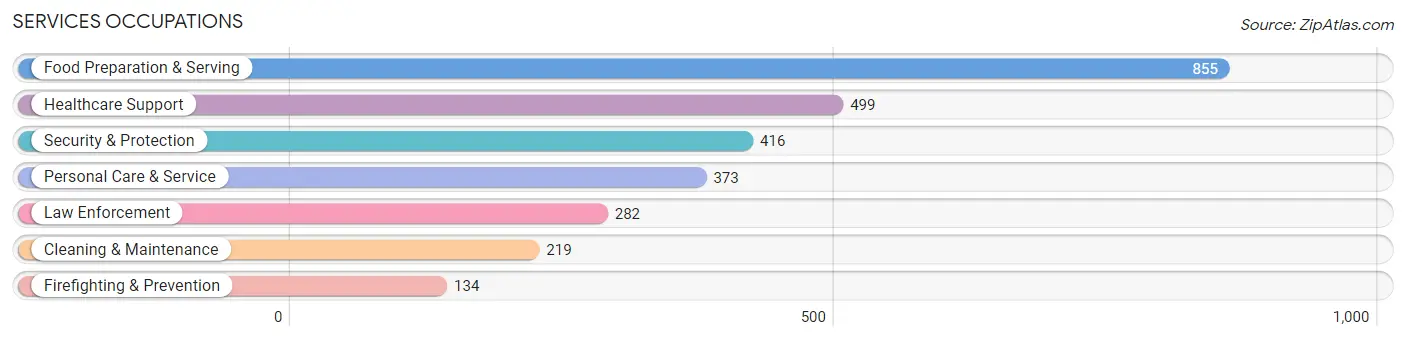
The most common Services occupations in Gurnee are Food Preparation & Serving (855 | 5.2%), Healthcare Support (499 | 3.0%), Security & Protection (416 | 2.5%), Personal Care & Service (373 | 2.2%), and Law Enforcement (282 | 1.7%).
Services Occupations by Sex
Within the Services occupations in Gurnee, the most male-oriented occupations are Cleaning & Maintenance (79.0%), Law Enforcement (77.7%), and Security & Protection (70.0%), while the most female-oriented occupations are Healthcare Support (83.6%), Personal Care & Service (68.4%), and Food Preparation & Serving (62.7%).
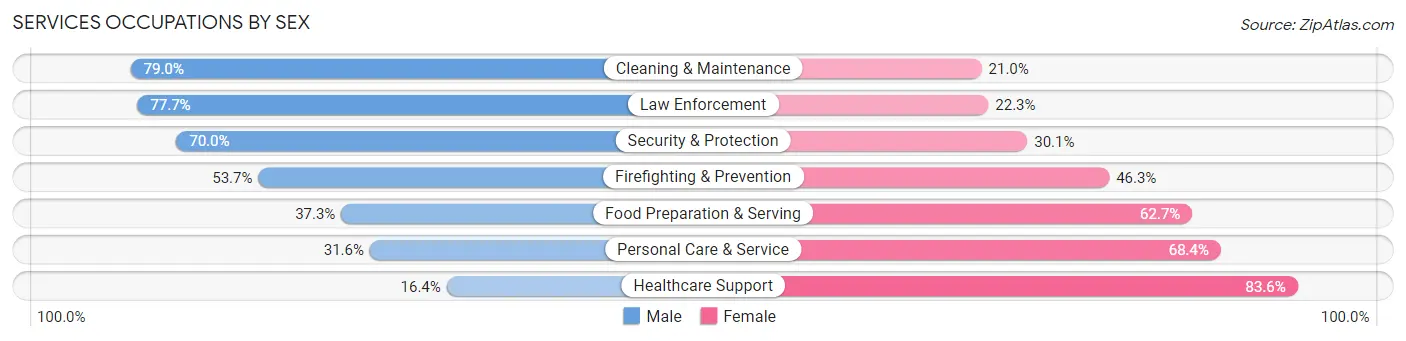
| Occupation | Male | Female |
| Healthcare Support | 82 (16.4%) | 417 (83.6%) |
| Security & Protection | 291 (70.0%) | 125 (30.0%) |
| Firefighting & Prevention | 72 (53.7%) | 62 (46.3%) |
| Law Enforcement | 219 (77.7%) | 63 (22.3%) |
| Food Preparation & Serving | 319 (37.3%) | 536 (62.7%) |
| Cleaning & Maintenance | 173 (79.0%) | 46 (21.0%) |
| Personal Care & Service | 118 (31.6%) | 255 (68.4%) |
| Total (Category) | 983 (41.6%) | 1,379 (58.4%) |
| Total (Overall) | 8,277 (49.9%) | 8,303 (50.1%) |
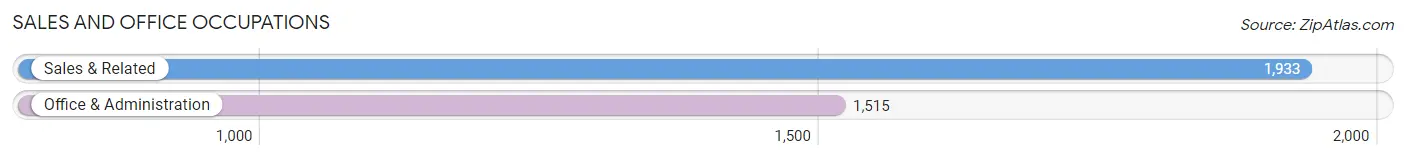
Sales and Office Occupations
The most common Sales and Office occupations in Gurnee are Sales & Related (1,933 | 11.7%), and Office & Administration (1,515 | 9.1%).
Sales and Office Occupations by Sex
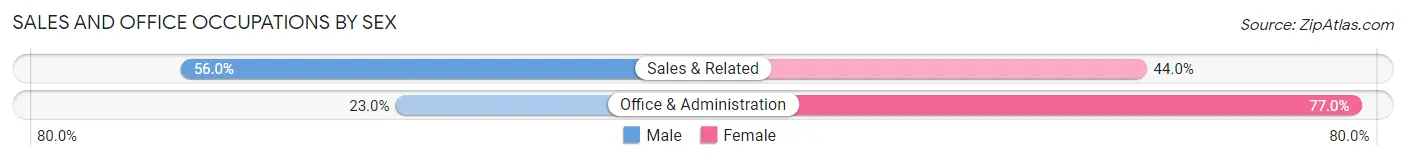
| Occupation | Male | Female |
| Sales & Related | 1,082 (56.0%) | 851 (44.0%) |
| Office & Administration | 348 (23.0%) | 1,167 (77.0%) |
| Total (Category) | 1,430 (41.5%) | 2,018 (58.5%) |
| Total (Overall) | 8,277 (49.9%) | 8,303 (50.1%) |
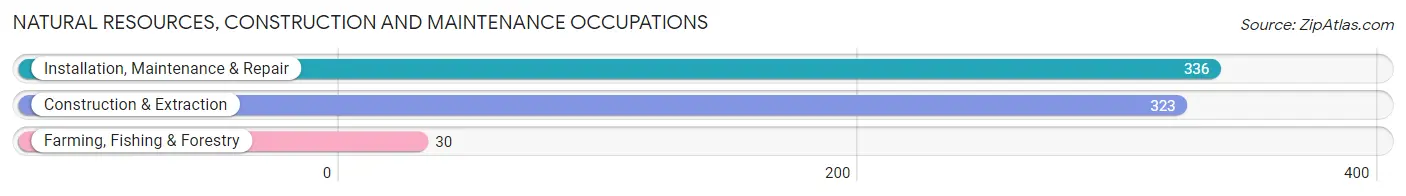
Natural Resources, Construction and Maintenance Occupations
The most common Natural Resources, Construction and Maintenance occupations in Gurnee are Installation, Maintenance & Repair (336 | 2.0%), Construction & Extraction (323 | 1.9%), and Farming, Fishing & Forestry (30 | 0.2%).
Natural Resources, Construction and Maintenance Occupations by Sex
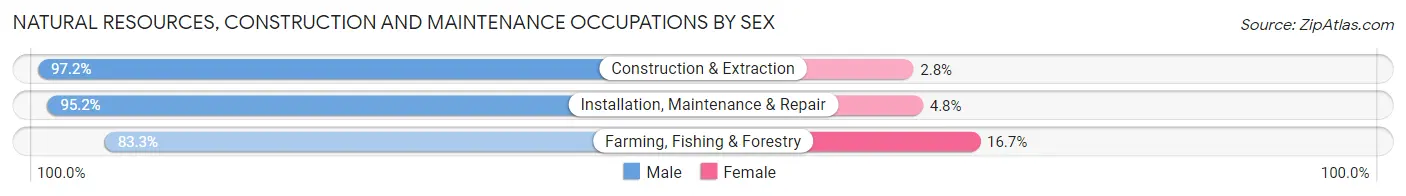
| Occupation | Male | Female |
| Farming, Fishing & Forestry | 25 (83.3%) | 5 (16.7%) |
| Construction & Extraction | 314 (97.2%) | 9 (2.8%) |
| Installation, Maintenance & Repair | 320 (95.2%) | 16 (4.8%) |
| Total (Category) | 659 (95.7%) | 30 (4.3%) |
| Total (Overall) | 8,277 (49.9%) | 8,303 (50.1%) |
Production, Transportation and Moving Occupations
The most common Production, Transportation and Moving occupations in Gurnee are Material Moving (518 | 3.1%), Production (505 | 3.0%), and Transportation (263 | 1.6%).
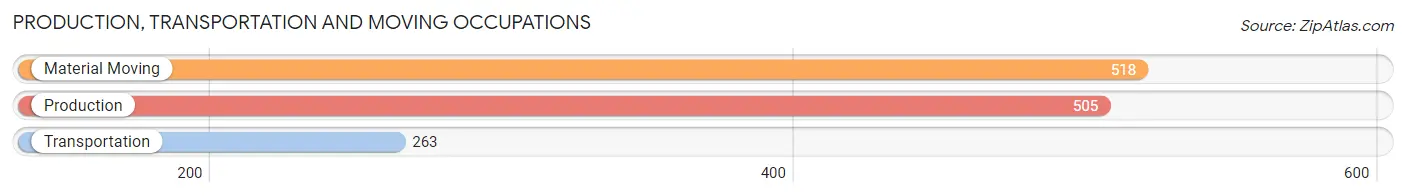
Production, Transportation and Moving Occupations by Sex
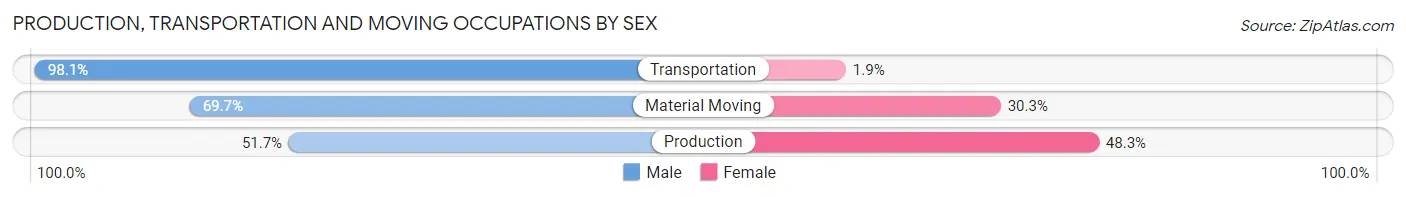
| Occupation | Male | Female |
| Production | 261 (51.7%) | 244 (48.3%) |
| Transportation | 258 (98.1%) | 5 (1.9%) |
| Material Moving | 361 (69.7%) | 157 (30.3%) |
| Total (Category) | 880 (68.4%) | 406 (31.6%) |
| Total (Overall) | 8,277 (49.9%) | 8,303 (50.1%) |
Employment Industries by Sex in Gurnee
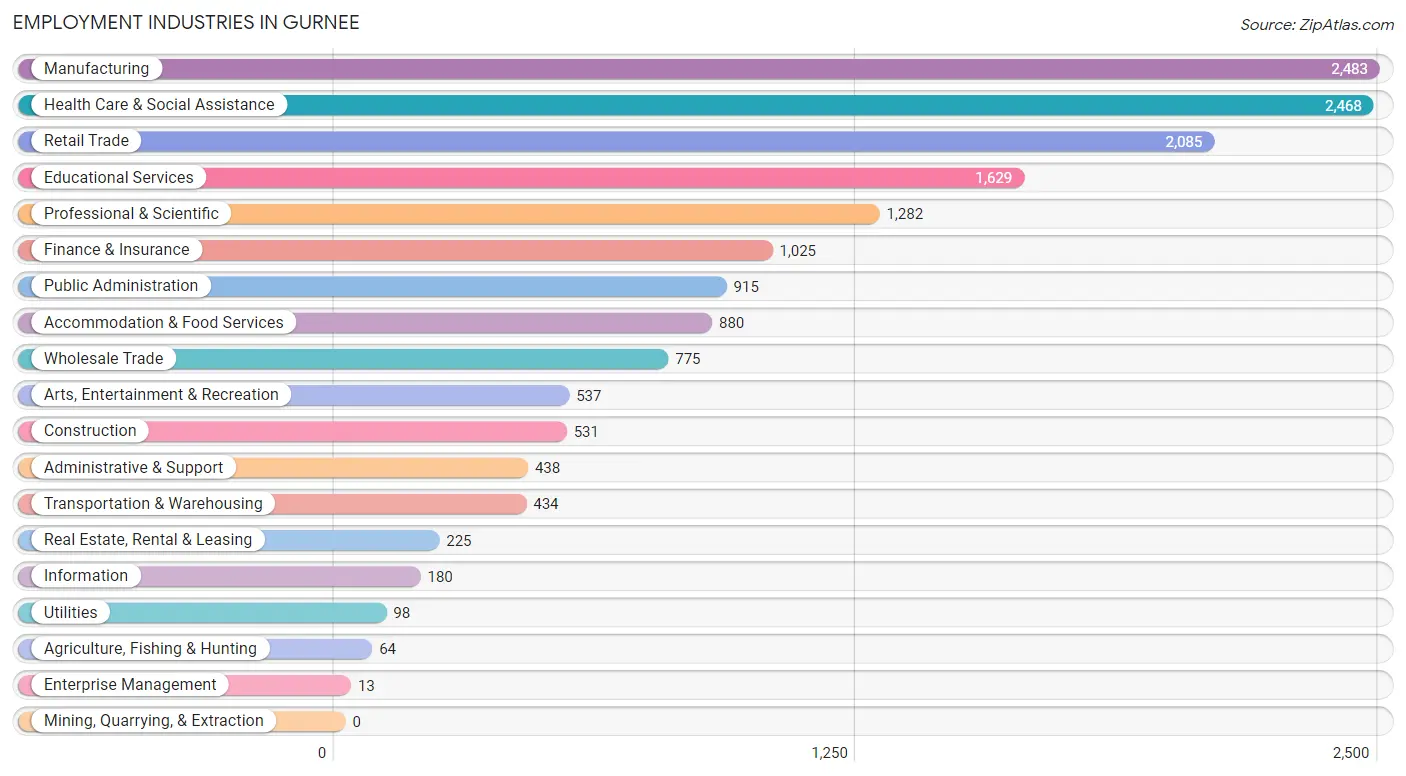
Employment Industries in Gurnee
The major employment industries in Gurnee include Manufacturing (2,483 | 15.0%), Health Care & Social Assistance (2,468 | 14.9%), Retail Trade (2,085 | 12.6%), Educational Services (1,629 | 9.8%), and Professional & Scientific (1,282 | 7.7%).
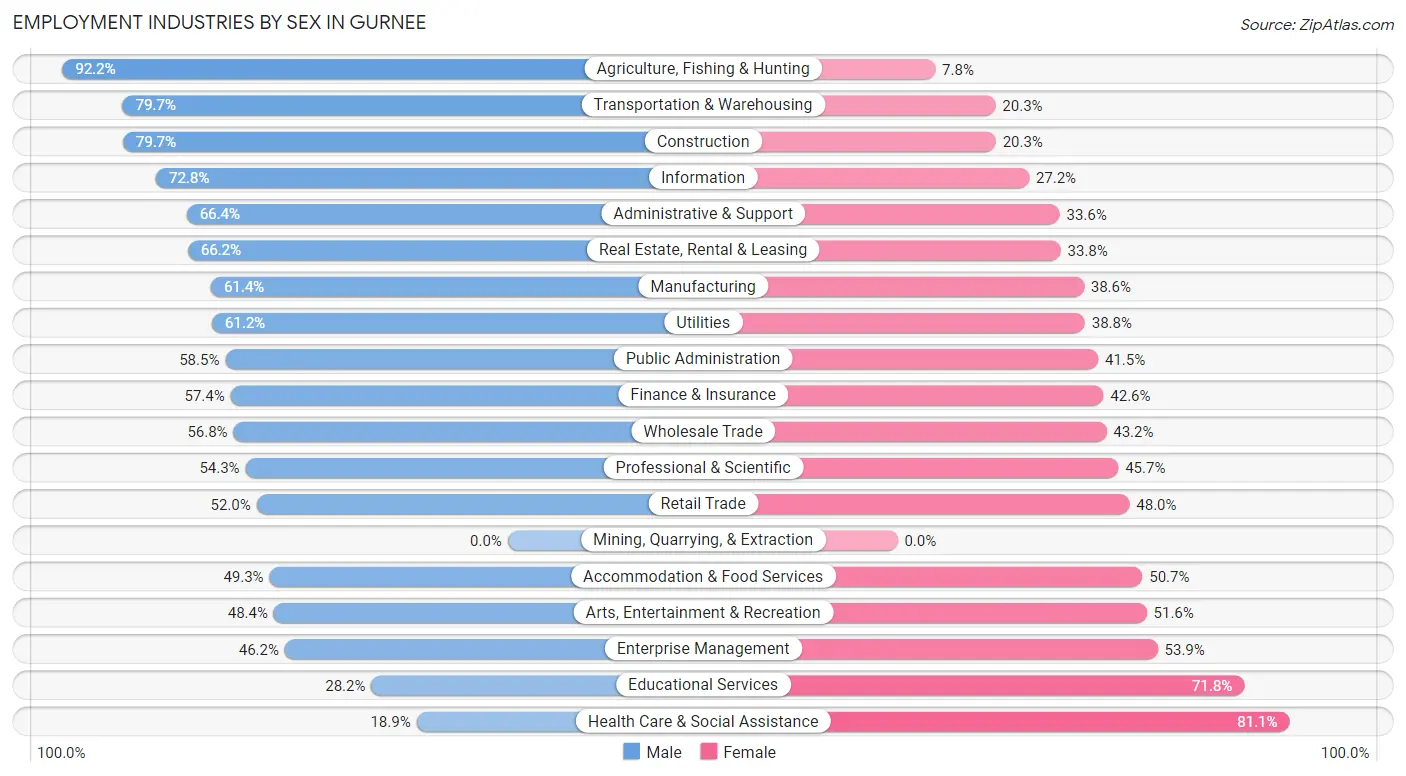
Employment Industries by Sex in Gurnee
The Gurnee industries that see more men than women are Agriculture, Fishing & Hunting (92.2%), Transportation & Warehousing (79.7%), and Construction (79.7%), whereas the industries that tend to have a higher number of women are Health Care & Social Assistance (81.1%), Educational Services (71.8%), and Enterprise Management (53.8%).
| Industry | Male | Female |
| Agriculture, Fishing & Hunting | 59 (92.2%) | 5 (7.8%) |
| Mining, Quarrying, & Extraction | 0 (0.0%) | 0 (0.0%) |
| Construction | 423 (79.7%) | 108 (20.3%) |
| Manufacturing | 1,525 (61.4%) | 958 (38.6%) |
| Wholesale Trade | 440 (56.8%) | 335 (43.2%) |
| Retail Trade | 1,084 (52.0%) | 1,001 (48.0%) |
| Transportation & Warehousing | 346 (79.7%) | 88 (20.3%) |
| Utilities | 60 (61.2%) | 38 (38.8%) |
| Information | 131 (72.8%) | 49 (27.2%) |
| Finance & Insurance | 588 (57.4%) | 437 (42.6%) |
| Real Estate, Rental & Leasing | 149 (66.2%) | 76 (33.8%) |
| Professional & Scientific | 696 (54.3%) | 586 (45.7%) |
| Enterprise Management | 6 (46.2%) | 7 (53.8%) |
| Administrative & Support | 291 (66.4%) | 147 (33.6%) |
| Educational Services | 460 (28.2%) | 1,169 (71.8%) |
| Health Care & Social Assistance | 466 (18.9%) | 2,002 (81.1%) |
| Arts, Entertainment & Recreation | 260 (48.4%) | 277 (51.6%) |
| Accommodation & Food Services | 434 (49.3%) | 446 (50.7%) |
| Public Administration | 535 (58.5%) | 380 (41.5%) |
| Total | 8,277 (49.9%) | 8,303 (50.1%) |
Education in Gurnee
School Enrollment in Gurnee
The most common levels of schooling among the 8,119 students in Gurnee are college / undergraduate (2,093 | 25.8%), high school (1,813 | 22.3%), and middle school (1,606 | 19.8%).
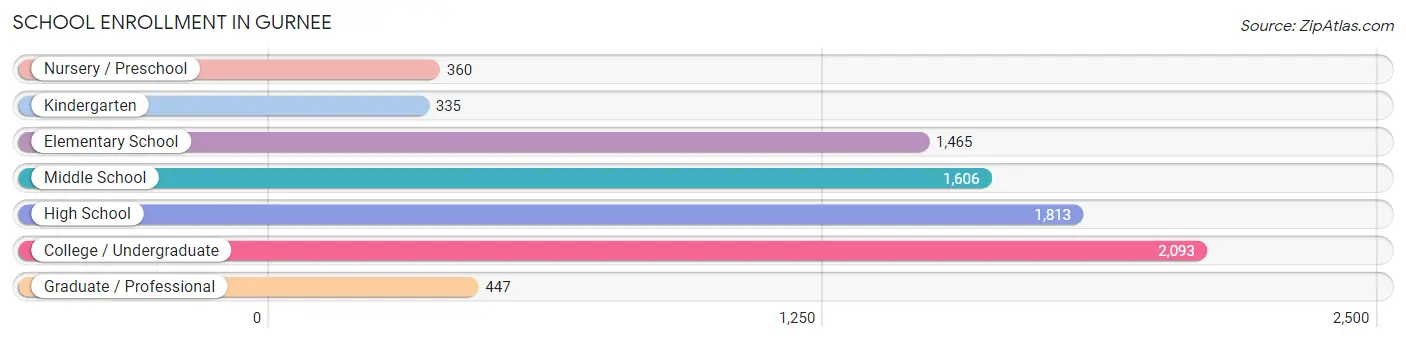
| School Level | # Students | % Students |
| Nursery / Preschool | 360 | 4.4% |
| Kindergarten | 335 | 4.1% |
| Elementary School | 1,465 | 18.0% |
| Middle School | 1,606 | 19.8% |
| High School | 1,813 | 22.3% |
| College / Undergraduate | 2,093 | 25.8% |
| Graduate / Professional | 447 | 5.5% |
| Total | 8,119 | 100.0% |
School Enrollment by Age by Funding Source in Gurnee
Out of a total of 8,119 students who are enrolled in schools in Gurnee, 1,405 (17.3%) attend a private institution, while the remaining 6,714 (82.7%) are enrolled in public schools. The age group of 3 to 4 year olds has the highest likelihood of being enrolled in private schools, with 80 (35.6% in the age bracket) enrolled. Conversely, the age group of 10 to 14 year olds has the lowest likelihood of being enrolled in a private school, with 1,782 (97.3% in the age bracket) attending a public institution.
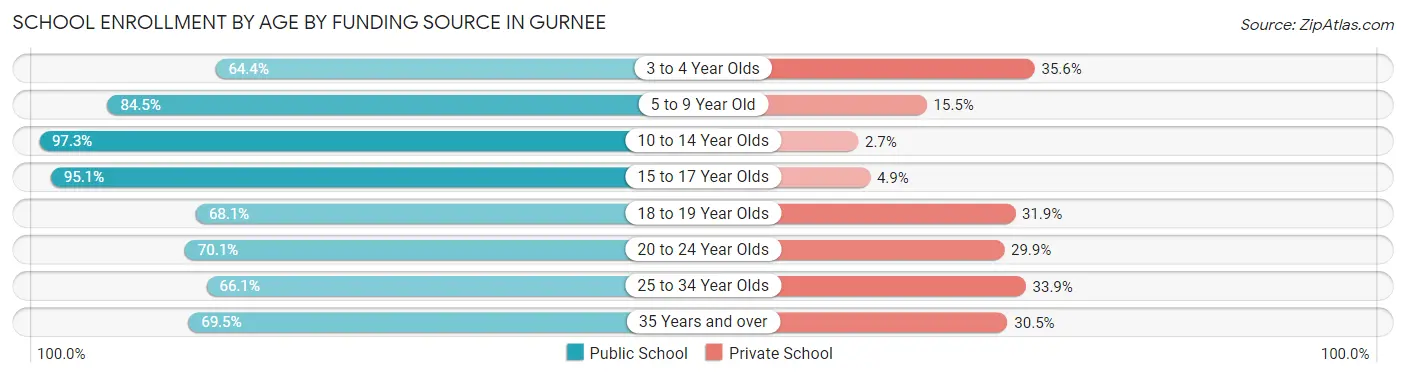
| Age Bracket | Public School | Private School |
| 3 to 4 Year Olds | 145 (64.4%) | 80 (35.6%) |
| 5 to 9 Year Old | 1,575 (84.5%) | 288 (15.5%) |
| 10 to 14 Year Olds | 1,782 (97.3%) | 49 (2.7%) |
| 15 to 17 Year Olds | 1,204 (95.1%) | 62 (4.9%) |
| 18 to 19 Year Olds | 610 (68.1%) | 286 (31.9%) |
| 20 to 24 Year Olds | 533 (70.1%) | 227 (29.9%) |
| 25 to 34 Year Olds | 472 (66.1%) | 242 (33.9%) |
| 35 Years and over | 392 (69.5%) | 172 (30.5%) |
| Total | 6,714 (82.7%) | 1,405 (17.3%) |
Educational Attainment by Field of Study in Gurnee
Business (2,842 | 22.6%), education (1,425 | 11.3%), science & technology (1,159 | 9.2%), bio, nature & agricultural (1,009 | 8.0%), and psychology (954 | 7.6%) are the most common fields of study among 12,581 individuals in Gurnee who have obtained a bachelor's degree or higher.
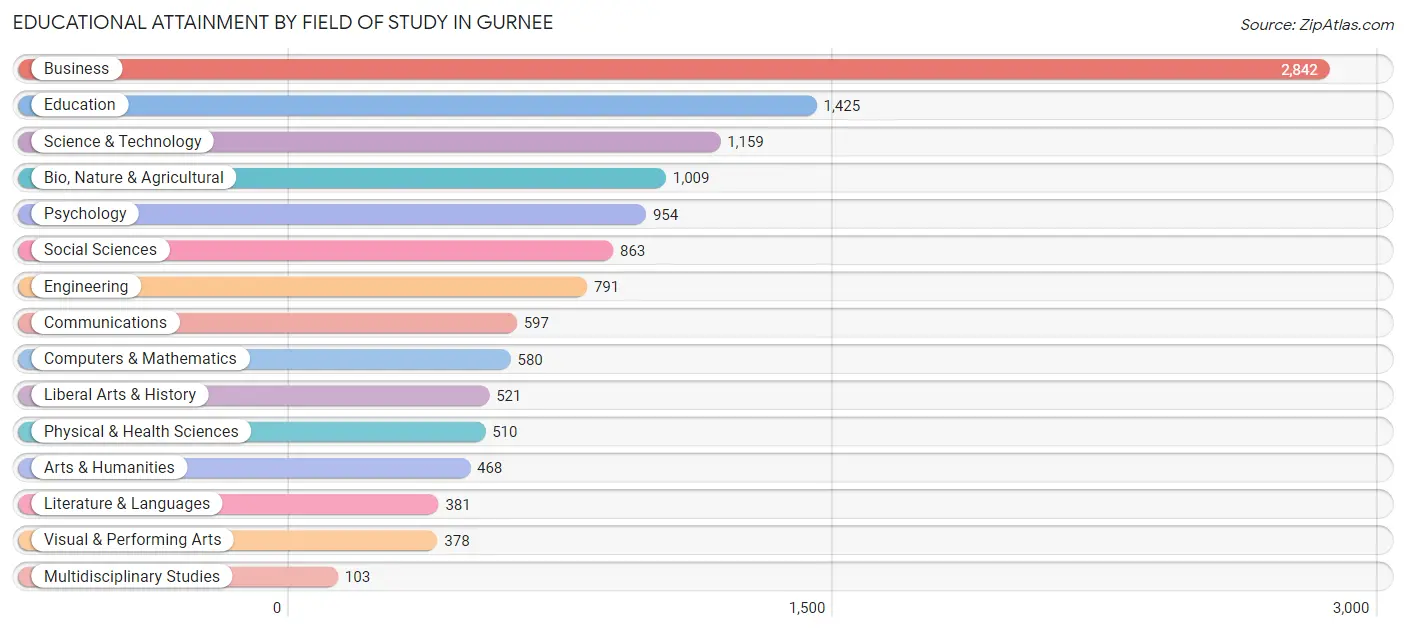
| Field of Study | # Graduates | % Graduates |
| Computers & Mathematics | 580 | 4.6% |
| Bio, Nature & Agricultural | 1,009 | 8.0% |
| Physical & Health Sciences | 510 | 4.1% |
| Psychology | 954 | 7.6% |
| Social Sciences | 863 | 6.9% |
| Engineering | 791 | 6.3% |
| Multidisciplinary Studies | 103 | 0.8% |
| Science & Technology | 1,159 | 9.2% |
| Business | 2,842 | 22.6% |
| Education | 1,425 | 11.3% |
| Literature & Languages | 381 | 3.0% |
| Liberal Arts & History | 521 | 4.1% |
| Visual & Performing Arts | 378 | 3.0% |
| Communications | 597 | 4.8% |
| Arts & Humanities | 468 | 3.7% |
| Total | 12,581 | 100.0% |
Transportation & Commute in Gurnee
Vehicle Availability by Sex in Gurnee
The most prevalent vehicle ownership categories in Gurnee are males with 2 vehicles (4,322, accounting for 51.0%) and females with 2 vehicles (3,590, making up 53.2%).
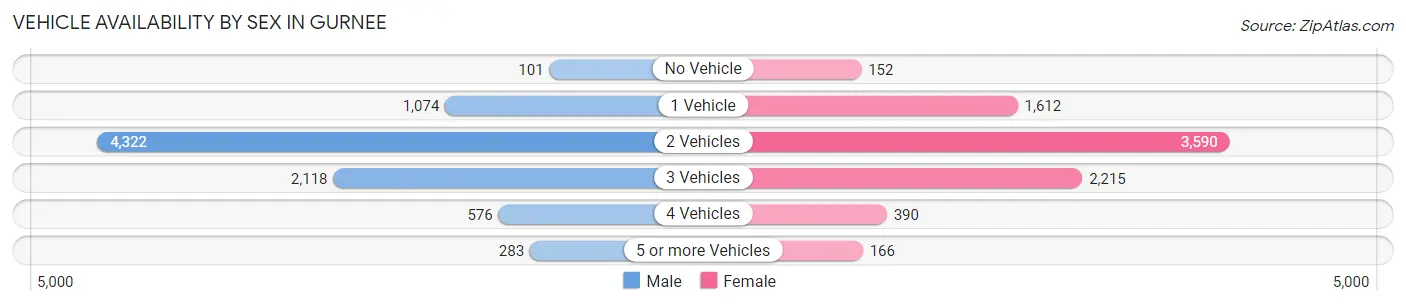
| Vehicles Available | Male | Female |
| No Vehicle | 101 (1.2%) | 152 (1.9%) |
| 1 Vehicle | 1,074 (12.7%) | 1,612 (19.8%) |
| 2 Vehicles | 4,322 (51.0%) | 3,590 (44.2%) |
| 3 Vehicles | 2,118 (25.0%) | 2,215 (27.3%) |
| 4 Vehicles | 576 (6.8%) | 390 (4.8%) |
| 5 or more Vehicles | 283 (3.3%) | 166 (2.0%) |
| Total | 8,474 (100.0%) | 8,125 (100.0%) |
Commute Time in Gurnee
The most frequently occuring commute durations in Gurnee are 20 to 24 minutes (2,148 commuters, 15.1%), 30 to 34 minutes (2,029 commuters, 14.3%), and 15 to 19 minutes (1,925 commuters, 13.6%).
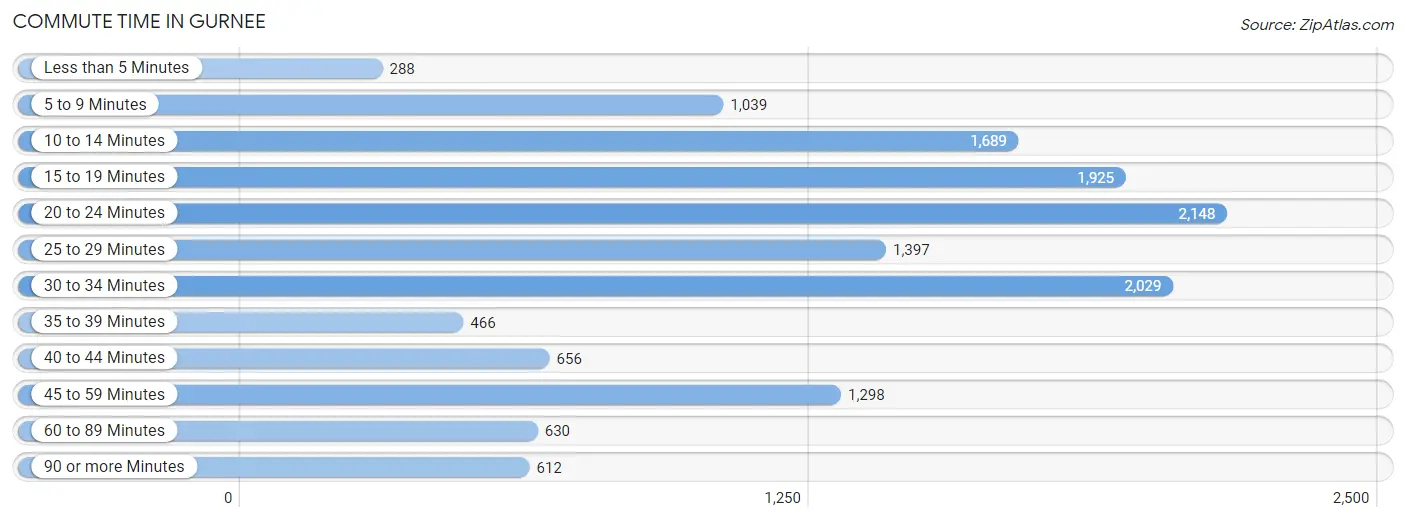
| Commute Time | # Commuters | % Commuters |
| Less than 5 Minutes | 288 | 2.0% |
| 5 to 9 Minutes | 1,039 | 7.3% |
| 10 to 14 Minutes | 1,689 | 11.9% |
| 15 to 19 Minutes | 1,925 | 13.6% |
| 20 to 24 Minutes | 2,148 | 15.1% |
| 25 to 29 Minutes | 1,397 | 9.9% |
| 30 to 34 Minutes | 2,029 | 14.3% |
| 35 to 39 Minutes | 466 | 3.3% |
| 40 to 44 Minutes | 656 | 4.6% |
| 45 to 59 Minutes | 1,298 | 9.2% |
| 60 to 89 Minutes | 630 | 4.4% |
| 90 or more Minutes | 612 | 4.3% |
Commute Time by Sex in Gurnee
The most common commute times in Gurnee are 20 to 24 minutes (1,028 commuters, 14.1%) for males and 20 to 24 minutes (1,120 commuters, 16.3%) for females.
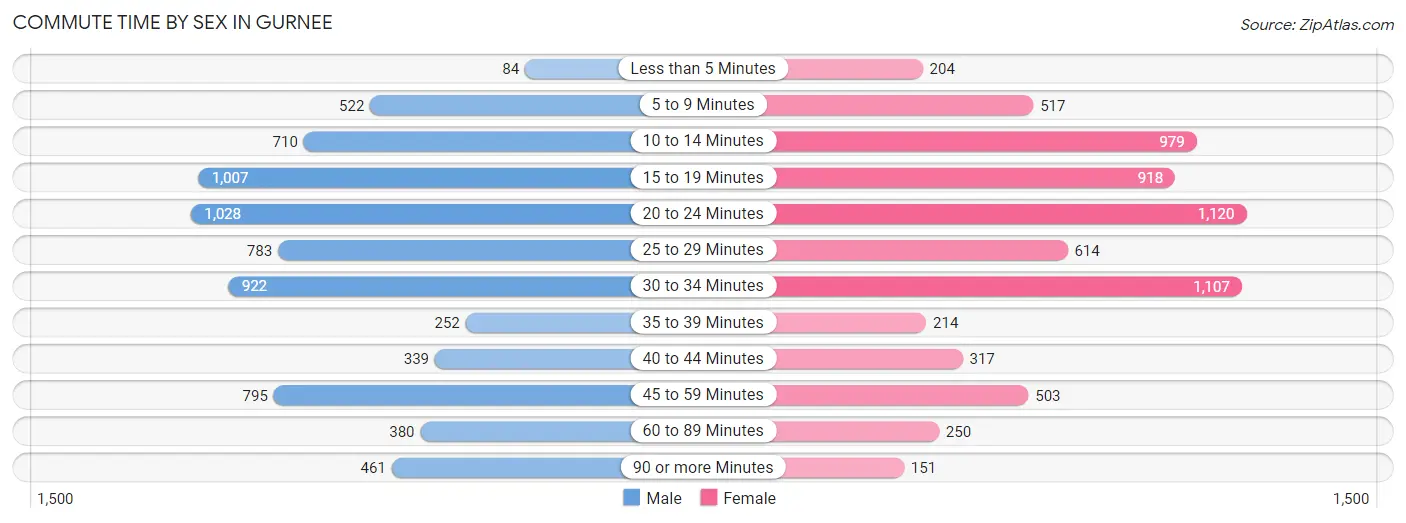
| Commute Time | Male | Female |
| Less than 5 Minutes | 84 (1.1%) | 204 (3.0%) |
| 5 to 9 Minutes | 522 (7.2%) | 517 (7.5%) |
| 10 to 14 Minutes | 710 (9.8%) | 979 (14.2%) |
| 15 to 19 Minutes | 1,007 (13.8%) | 918 (13.3%) |
| 20 to 24 Minutes | 1,028 (14.1%) | 1,120 (16.3%) |
| 25 to 29 Minutes | 783 (10.7%) | 614 (8.9%) |
| 30 to 34 Minutes | 922 (12.7%) | 1,107 (16.1%) |
| 35 to 39 Minutes | 252 (3.5%) | 214 (3.1%) |
| 40 to 44 Minutes | 339 (4.6%) | 317 (4.6%) |
| 45 to 59 Minutes | 795 (10.9%) | 503 (7.3%) |
| 60 to 89 Minutes | 380 (5.2%) | 250 (3.6%) |
| 90 or more Minutes | 461 (6.3%) | 151 (2.2%) |
Time of Departure to Work by Sex in Gurnee
The most frequent times of departure to work in Gurnee are 7:00 AM to 7:29 AM (1,103, 15.1%) for males and 7:00 AM to 7:29 AM (1,239, 18.0%) for females.
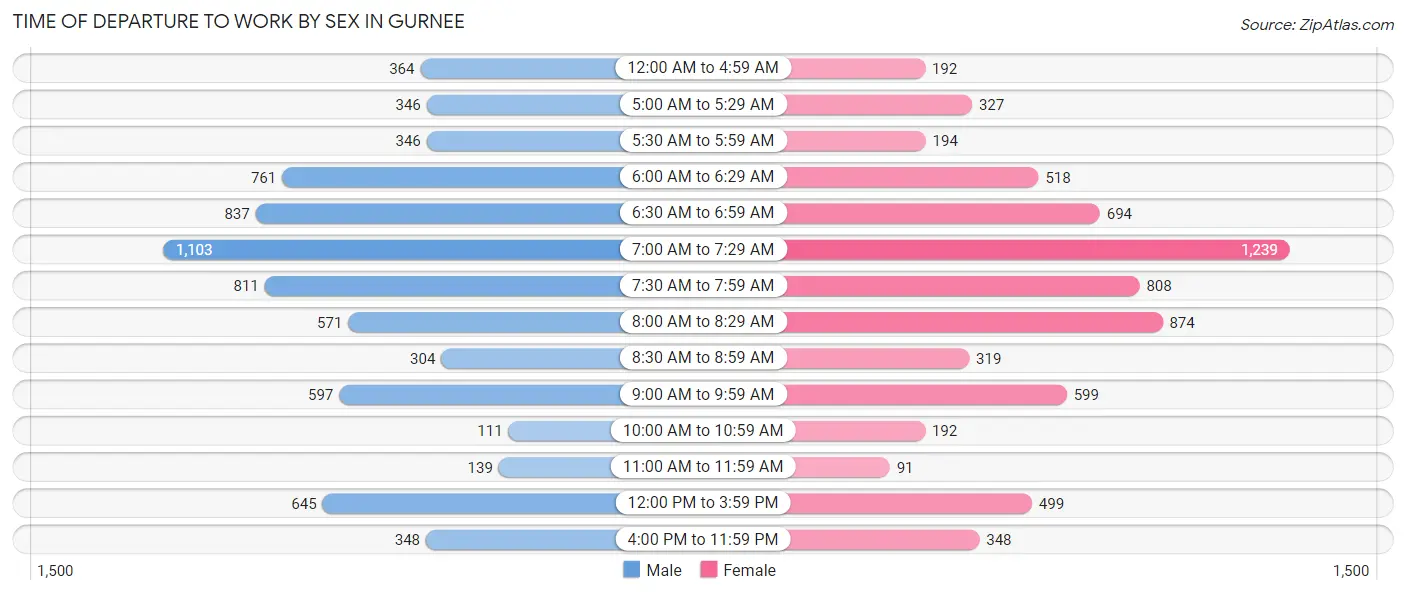
| Time of Departure | Male | Female |
| 12:00 AM to 4:59 AM | 364 (5.0%) | 192 (2.8%) |
| 5:00 AM to 5:29 AM | 346 (4.8%) | 327 (4.7%) |
| 5:30 AM to 5:59 AM | 346 (4.8%) | 194 (2.8%) |
| 6:00 AM to 6:29 AM | 761 (10.4%) | 518 (7.5%) |
| 6:30 AM to 6:59 AM | 837 (11.5%) | 694 (10.1%) |
| 7:00 AM to 7:29 AM | 1,103 (15.1%) | 1,239 (18.0%) |
| 7:30 AM to 7:59 AM | 811 (11.1%) | 808 (11.7%) |
| 8:00 AM to 8:29 AM | 571 (7.8%) | 874 (12.7%) |
| 8:30 AM to 8:59 AM | 304 (4.2%) | 319 (4.6%) |
| 9:00 AM to 9:59 AM | 597 (8.2%) | 599 (8.7%) |
| 10:00 AM to 10:59 AM | 111 (1.5%) | 192 (2.8%) |
| 11:00 AM to 11:59 AM | 139 (1.9%) | 91 (1.3%) |
| 12:00 PM to 3:59 PM | 645 (8.9%) | 499 (7.2%) |
| 4:00 PM to 11:59 PM | 348 (4.8%) | 348 (5.1%) |
| Total | 7,283 (100.0%) | 6,894 (100.0%) |
Housing Occupancy in Gurnee
Occupancy by Ownership in Gurnee
Of the total 11,743 dwellings in Gurnee, owner-occupied units account for 8,553 (72.8%), while renter-occupied units make up 3,190 (27.2%).
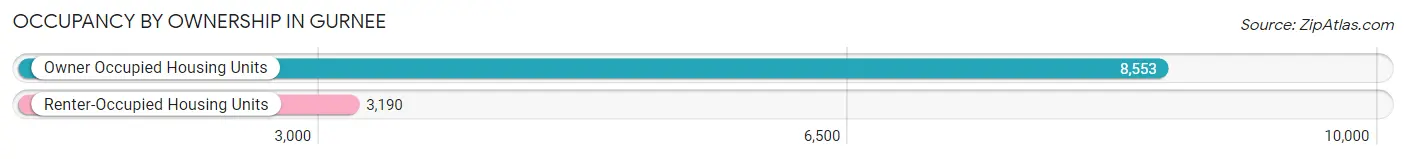
| Occupancy | # Housing Units | % Housing Units |
| Owner Occupied Housing Units | 8,553 | 72.8% |
| Renter-Occupied Housing Units | 3,190 | 27.2% |
| Total Occupied Housing Units | 11,743 | 100.0% |
Occupancy by Household Size in Gurnee
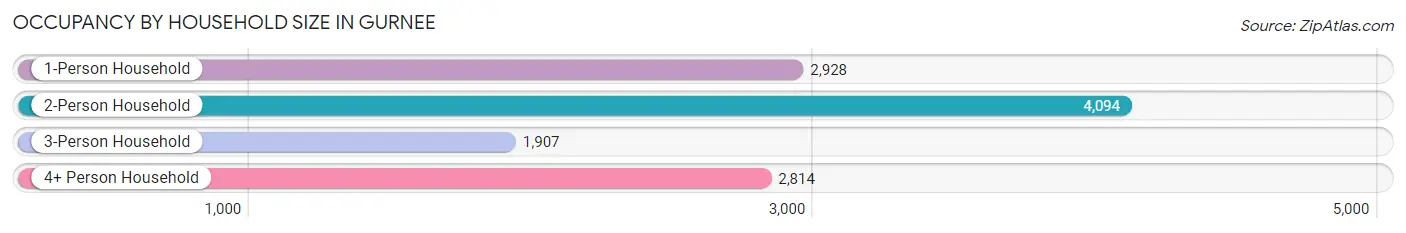
| Household Size | # Housing Units | % Housing Units |
| 1-Person Household | 2,928 | 24.9% |
| 2-Person Household | 4,094 | 34.9% |
| 3-Person Household | 1,907 | 16.2% |
| 4+ Person Household | 2,814 | 24.0% |
| Total Housing Units | 11,743 | 100.0% |
Occupancy by Ownership by Household Size in Gurnee
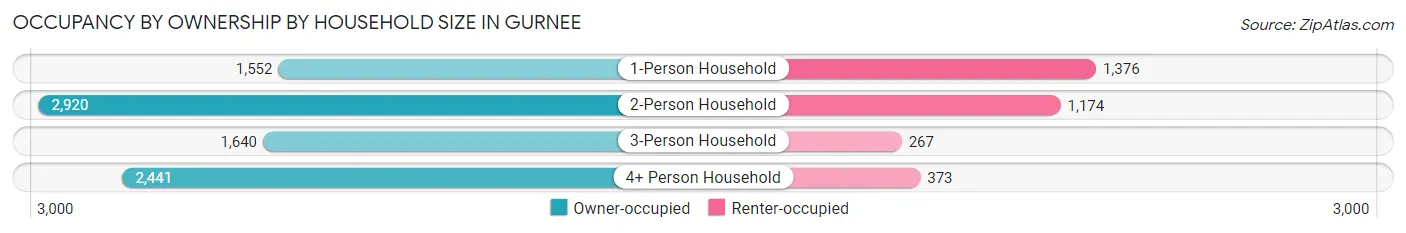
| Household Size | Owner-occupied | Renter-occupied |
| 1-Person Household | 1,552 (53.0%) | 1,376 (47.0%) |
| 2-Person Household | 2,920 (71.3%) | 1,174 (28.7%) |
| 3-Person Household | 1,640 (86.0%) | 267 (14.0%) |
| 4+ Person Household | 2,441 (86.7%) | 373 (13.3%) |
| Total Housing Units | 8,553 (72.8%) | 3,190 (27.2%) |
Occupancy by Educational Attainment in Gurnee
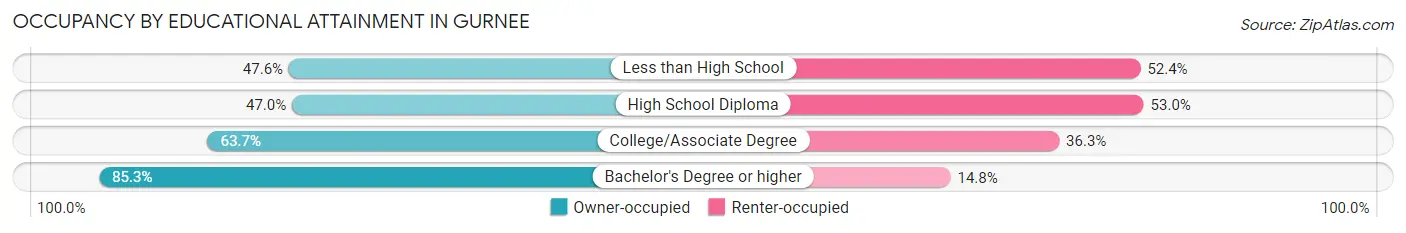
| Household Size | Owner-occupied | Renter-occupied |
| Less than High School | 159 (47.6%) | 175 (52.4%) |
| High School Diploma | 784 (47.0%) | 885 (53.0%) |
| College/Associate Degree | 2,051 (63.7%) | 1,168 (36.3%) |
| Bachelor's Degree or higher | 5,559 (85.3%) | 962 (14.7%) |
Occupancy by Age of Householder in Gurnee
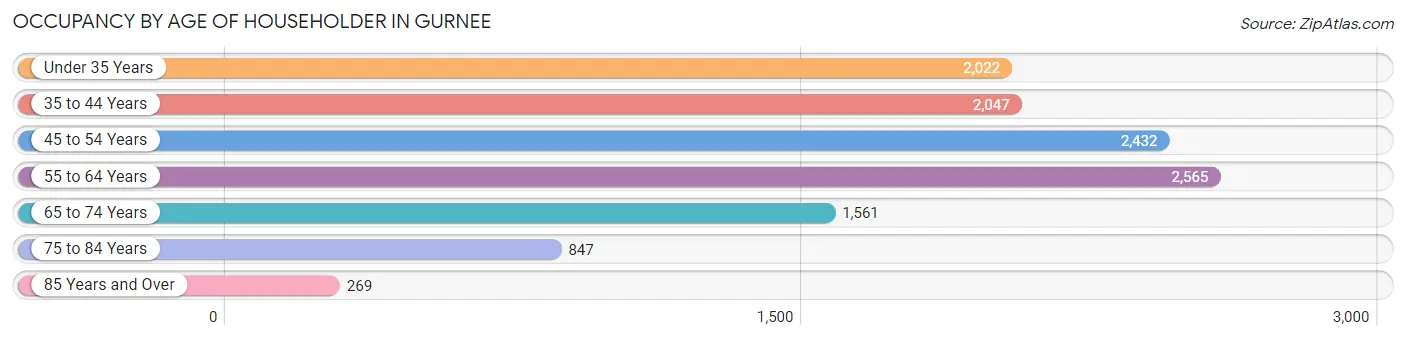
| Age Bracket | # Households | % Households |
| Under 35 Years | 2,022 | 17.2% |
| 35 to 44 Years | 2,047 | 17.4% |
| 45 to 54 Years | 2,432 | 20.7% |
| 55 to 64 Years | 2,565 | 21.8% |
| 65 to 74 Years | 1,561 | 13.3% |
| 75 to 84 Years | 847 | 7.2% |
| 85 Years and Over | 269 | 2.3% |
| Total | 11,743 | 100.0% |
Housing Finances in Gurnee
Median Income by Occupancy in Gurnee
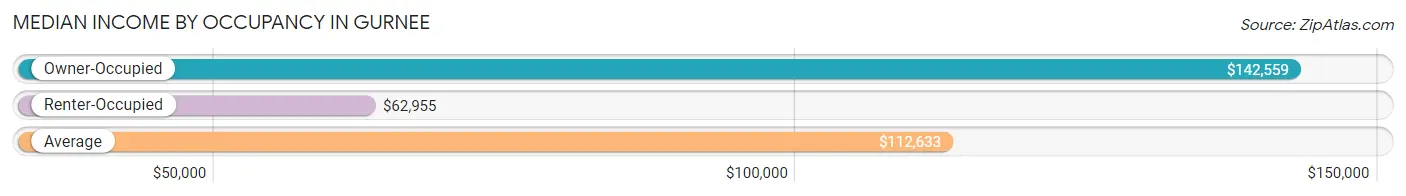
| Occupancy Type | # Households | Median Income |
| Owner-Occupied | 8,553 (72.8%) | $142,559 |
| Renter-Occupied | 3,190 (27.2%) | $62,955 |
| Average | 11,743 (100.0%) | $112,633 |
Occupancy by Householder Income Bracket in Gurnee
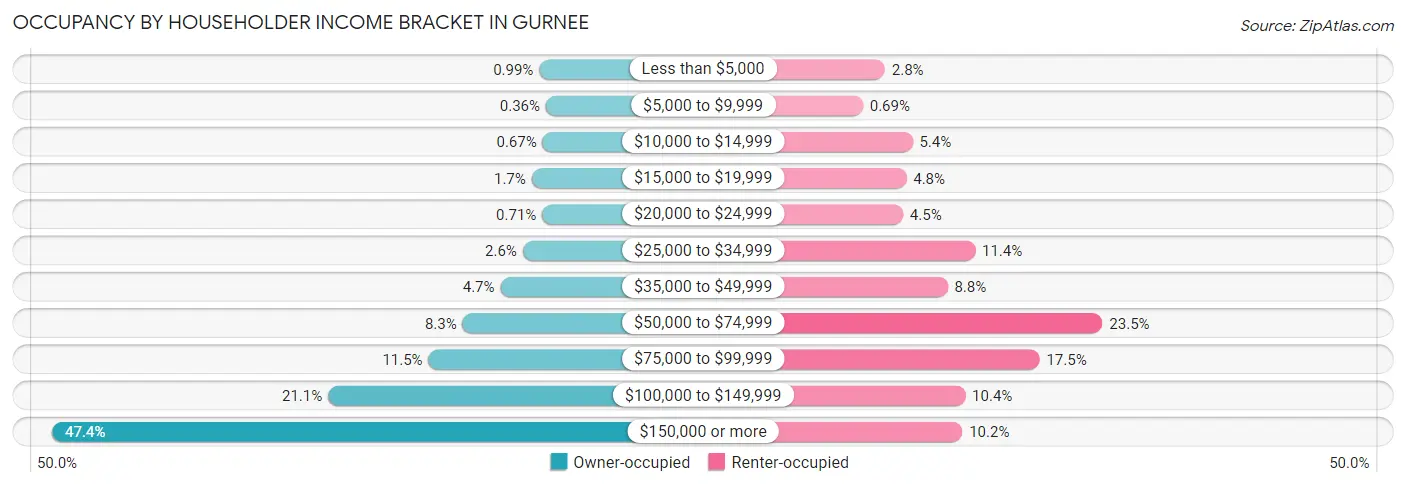
| Income Bracket | Owner-occupied | Renter-occupied |
| Less than $5,000 | 85 (1.0%) | 89 (2.8%) |
| $5,000 to $9,999 | 31 (0.4%) | 22 (0.7%) |
| $10,000 to $14,999 | 57 (0.7%) | 173 (5.4%) |
| $15,000 to $19,999 | 146 (1.7%) | 154 (4.8%) |
| $20,000 to $24,999 | 61 (0.7%) | 144 (4.5%) |
| $25,000 to $34,999 | 219 (2.6%) | 363 (11.4%) |
| $35,000 to $49,999 | 401 (4.7%) | 279 (8.7%) |
| $50,000 to $74,999 | 709 (8.3%) | 750 (23.5%) |
| $75,000 to $99,999 | 987 (11.5%) | 559 (17.5%) |
| $100,000 to $149,999 | 1,805 (21.1%) | 333 (10.4%) |
| $150,000 or more | 4,052 (47.4%) | 324 (10.2%) |
| Total | 8,553 (100.0%) | 3,190 (100.0%) |
Monthly Housing Cost Tiers in Gurnee
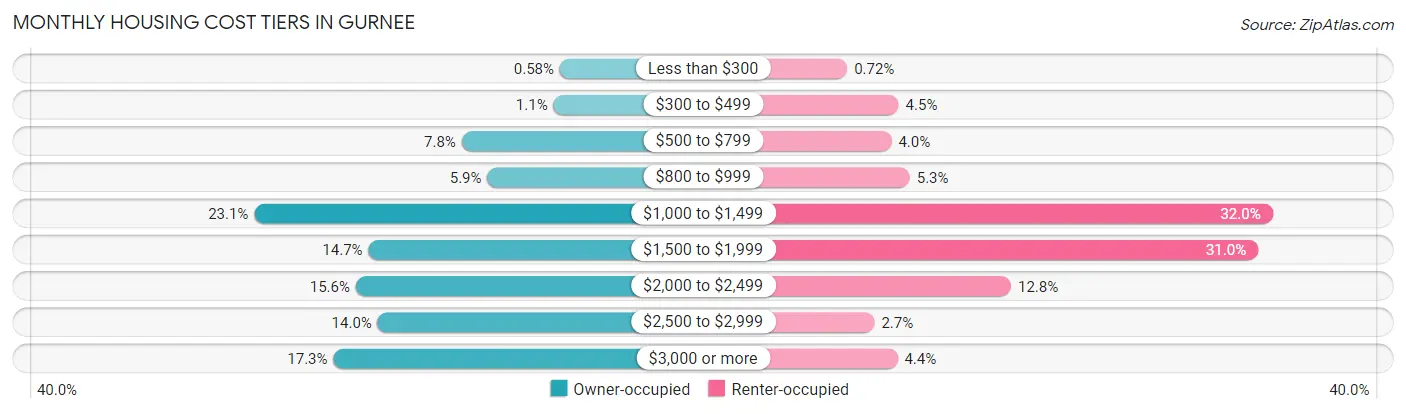
| Monthly Cost | Owner-occupied | Renter-occupied |
| Less than $300 | 50 (0.6%) | 23 (0.7%) |
| $300 to $499 | 90 (1.1%) | 144 (4.5%) |
| $500 to $799 | 668 (7.8%) | 127 (4.0%) |
| $800 to $999 | 506 (5.9%) | 170 (5.3%) |
| $1,000 to $1,499 | 1,975 (23.1%) | 1,022 (32.0%) |
| $1,500 to $1,999 | 1,256 (14.7%) | 988 (31.0%) |
| $2,000 to $2,499 | 1,335 (15.6%) | 408 (12.8%) |
| $2,500 to $2,999 | 1,197 (14.0%) | 87 (2.7%) |
| $3,000 or more | 1,476 (17.3%) | 141 (4.4%) |
| Total | 8,553 (100.0%) | 3,190 (100.0%) |
Physical Housing Characteristics in Gurnee
Housing Structures in Gurnee
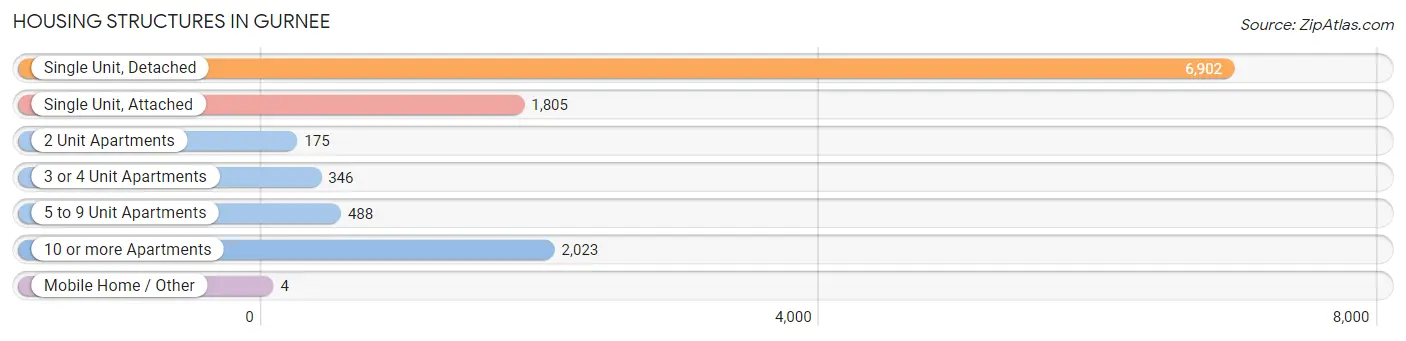
| Structure Type | # Housing Units | % Housing Units |
| Single Unit, Detached | 6,902 | 58.8% |
| Single Unit, Attached | 1,805 | 15.4% |
| 2 Unit Apartments | 175 | 1.5% |
| 3 or 4 Unit Apartments | 346 | 2.9% |
| 5 to 9 Unit Apartments | 488 | 4.2% |
| 10 or more Apartments | 2,023 | 17.2% |
| Mobile Home / Other | 4 | 0.0% |
| Total | 11,743 | 100.0% |
Housing Structures by Occupancy in Gurnee
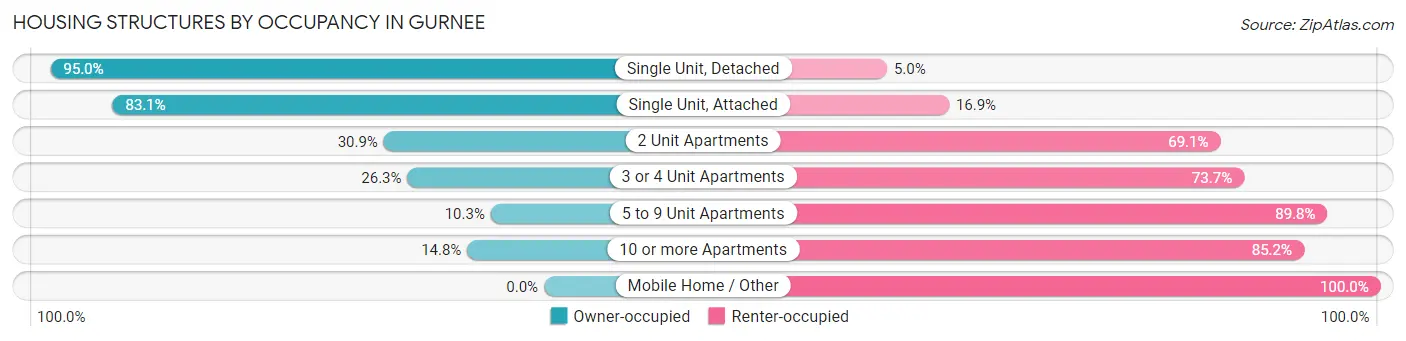
| Structure Type | Owner-occupied | Renter-occupied |
| Single Unit, Detached | 6,559 (95.0%) | 343 (5.0%) |
| Single Unit, Attached | 1,500 (83.1%) | 305 (16.9%) |
| 2 Unit Apartments | 54 (30.9%) | 121 (69.1%) |
| 3 or 4 Unit Apartments | 91 (26.3%) | 255 (73.7%) |
| 5 to 9 Unit Apartments | 50 (10.2%) | 438 (89.7%) |
| 10 or more Apartments | 299 (14.8%) | 1,724 (85.2%) |
| Mobile Home / Other | 0 (0.0%) | 4 (100.0%) |
| Total | 8,553 (72.8%) | 3,190 (27.2%) |
Housing Structures by Number of Rooms in Gurnee
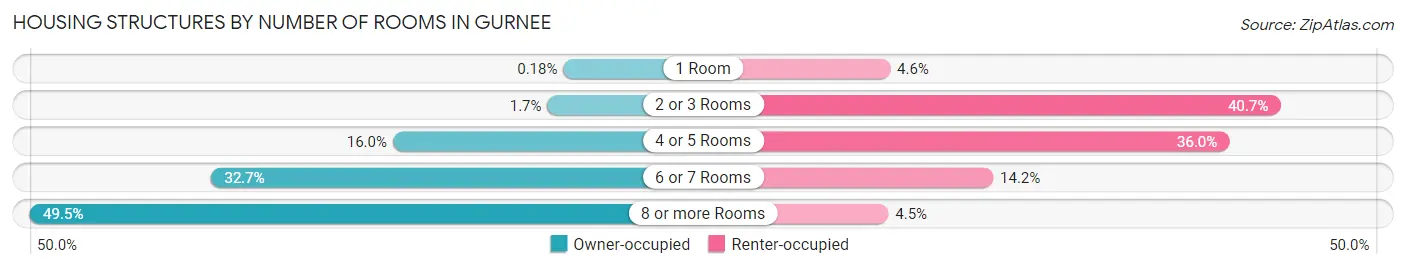
| Number of Rooms | Owner-occupied | Renter-occupied |
| 1 Room | 15 (0.2%) | 148 (4.6%) |
| 2 or 3 Rooms | 141 (1.7%) | 1,299 (40.7%) |
| 4 or 5 Rooms | 1,364 (16.0%) | 1,148 (36.0%) |
| 6 or 7 Rooms | 2,799 (32.7%) | 452 (14.2%) |
| 8 or more Rooms | 4,234 (49.5%) | 143 (4.5%) |
| Total | 8,553 (100.0%) | 3,190 (100.0%) |
Housing Structure by Heating Type in Gurnee
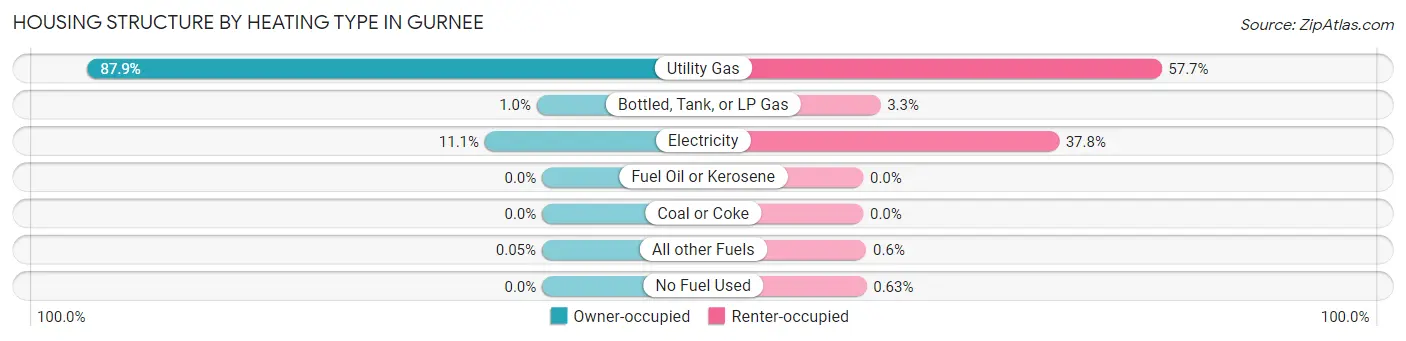
| Heating Type | Owner-occupied | Renter-occupied |
| Utility Gas | 7,515 (87.9%) | 1,839 (57.7%) |
| Bottled, Tank, or LP Gas | 88 (1.0%) | 106 (3.3%) |
| Electricity | 946 (11.1%) | 1,206 (37.8%) |
| Fuel Oil or Kerosene | 0 (0.0%) | 0 (0.0%) |
| Coal or Coke | 0 (0.0%) | 0 (0.0%) |
| All other Fuels | 4 (0.1%) | 19 (0.6%) |
| No Fuel Used | 0 (0.0%) | 20 (0.6%) |
| Total | 8,553 (100.0%) | 3,190 (100.0%) |
Household Vehicle Usage in Gurnee
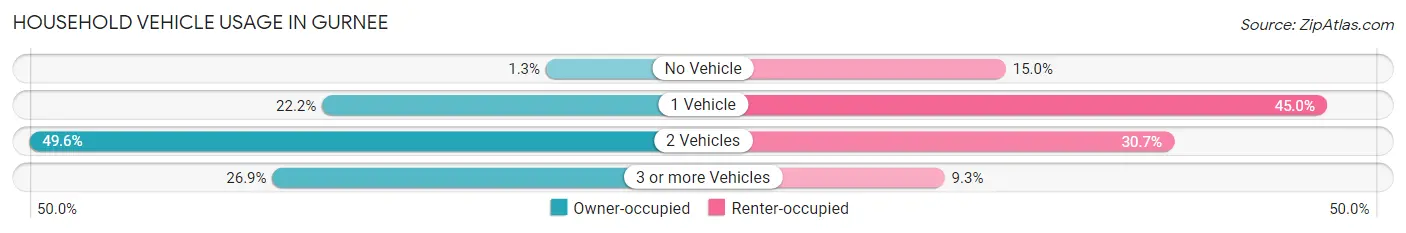
| Vehicles per Household | Owner-occupied | Renter-occupied |
| No Vehicle | 115 (1.3%) | 479 (15.0%) |
| 1 Vehicle | 1,901 (22.2%) | 1,435 (45.0%) |
| 2 Vehicles | 4,239 (49.6%) | 979 (30.7%) |
| 3 or more Vehicles | 2,298 (26.9%) | 297 (9.3%) |
| Total | 8,553 (100.0%) | 3,190 (100.0%) |
Real Estate & Mortgages in Gurnee
Real Estate and Mortgage Overview in Gurnee
| Characteristic | Without Mortgage | With Mortgage |
| Housing Units | 2,603 | 5,950 |
| Median Property Value | $299,900 | $319,600 |
| Median Household Income | $111,888 | $3,011 |
| Monthly Housing Costs | $1,038 | $1,476 |
| Real Estate Taxes | $7,537 | $99 |
Property Value by Mortgage Status in Gurnee
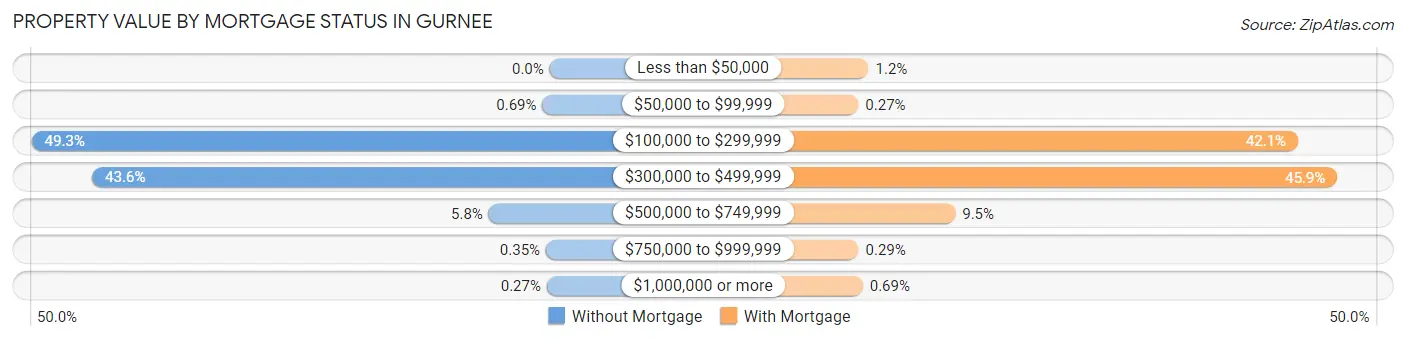
| Property Value | Without Mortgage | With Mortgage |
| Less than $50,000 | 0 (0.0%) | 74 (1.2%) |
| $50,000 to $99,999 | 18 (0.7%) | 16 (0.3%) |
| $100,000 to $299,999 | 1,284 (49.3%) | 2,507 (42.1%) |
| $300,000 to $499,999 | 1,134 (43.6%) | 2,730 (45.9%) |
| $500,000 to $749,999 | 151 (5.8%) | 565 (9.5%) |
| $750,000 to $999,999 | 9 (0.4%) | 17 (0.3%) |
| $1,000,000 or more | 7 (0.3%) | 41 (0.7%) |
| Total | 2,603 (100.0%) | 5,950 (100.0%) |
Household Income by Mortgage Status in Gurnee
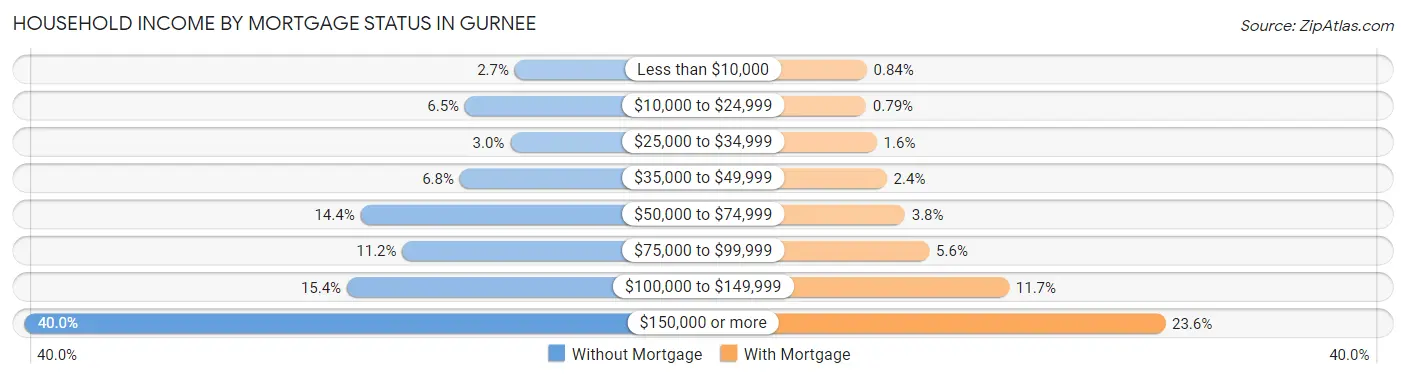
| Household Income | Without Mortgage | With Mortgage |
| Less than $10,000 | 69 (2.6%) | 50 (0.8%) |
| $10,000 to $24,999 | 168 (6.5%) | 47 (0.8%) |
| $25,000 to $34,999 | 78 (3.0%) | 96 (1.6%) |
| $35,000 to $49,999 | 178 (6.8%) | 141 (2.4%) |
| $50,000 to $74,999 | 375 (14.4%) | 223 (3.7%) |
| $75,000 to $99,999 | 292 (11.2%) | 334 (5.6%) |
| $100,000 to $149,999 | 402 (15.4%) | 695 (11.7%) |
| $150,000 or more | 1,041 (40.0%) | 1,403 (23.6%) |
| Total | 2,603 (100.0%) | 5,950 (100.0%) |
Property Value to Household Income Ratio in Gurnee
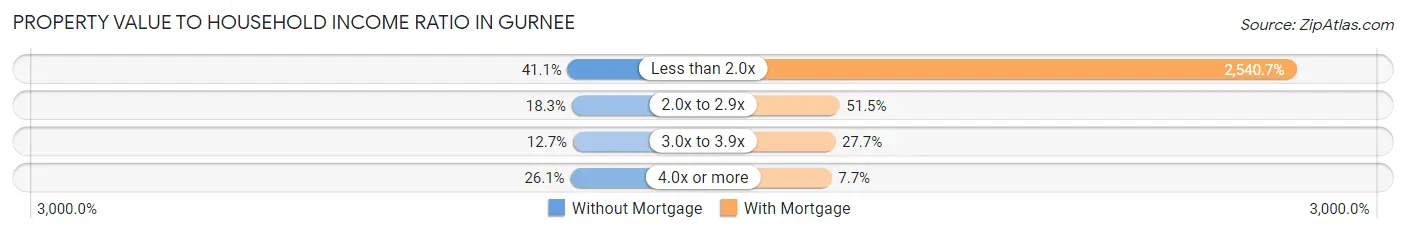
| Value-to-Income Ratio | Without Mortgage | With Mortgage |
| Less than 2.0x | 1,069 (41.1%) | 151,169 (2,540.7%) |
| 2.0x to 2.9x | 477 (18.3%) | 3,063 (51.5%) |
| 3.0x to 3.9x | 330 (12.7%) | 1,646 (27.7%) |
| 4.0x or more | 678 (26.1%) | 455 (7.6%) |
| Total | 2,603 (100.0%) | 5,950 (100.0%) |
Real Estate Taxes by Mortgage Status in Gurnee
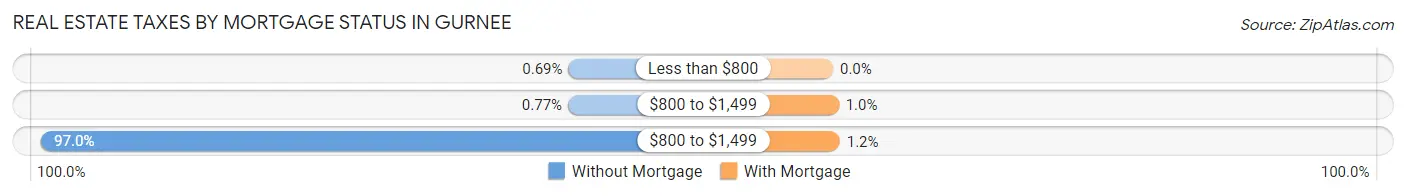
| Property Taxes | Without Mortgage | With Mortgage |
| Less than $800 | 18 (0.7%) | 0 (0.0%) |
| $800 to $1,499 | 20 (0.8%) | 62 (1.0%) |
| $800 to $1,499 | 2,524 (97.0%) | 73 (1.2%) |
| Total | 2,603 (100.0%) | 5,950 (100.0%) |
Health & Disability in Gurnee
Health Insurance Coverage by Age in Gurnee
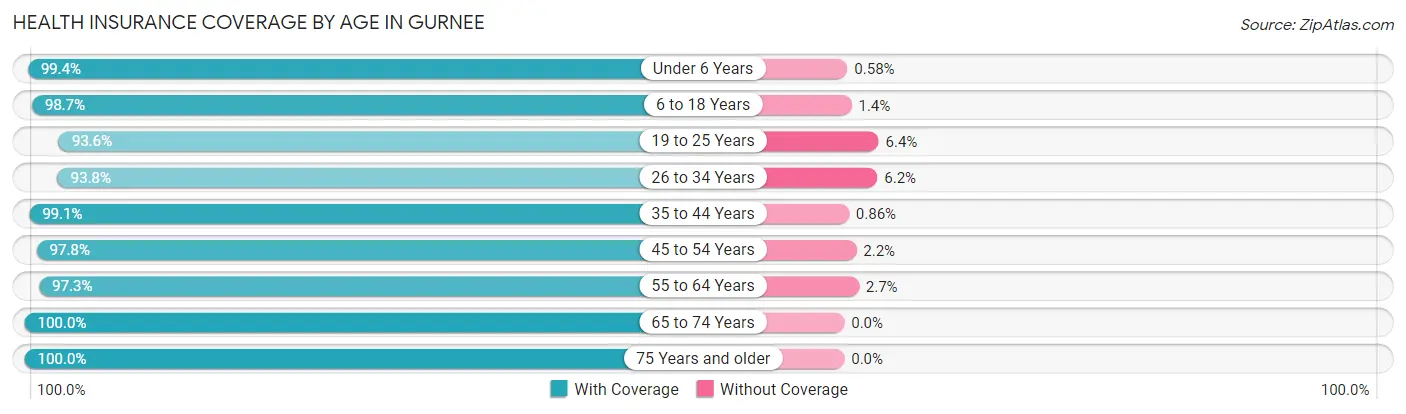
| Age Bracket | With Coverage | Without Coverage |
| Under 6 Years | 1,536 (99.4%) | 9 (0.6%) |
| 6 to 18 Years | 5,200 (98.7%) | 71 (1.3%) |
| 19 to 25 Years | 3,032 (93.6%) | 207 (6.4%) |
| 26 to 34 Years | 3,032 (93.8%) | 199 (6.2%) |
| 35 to 44 Years | 3,669 (99.1%) | 32 (0.9%) |
| 45 to 54 Years | 4,580 (97.8%) | 105 (2.2%) |
| 55 to 64 Years | 4,308 (97.3%) | 120 (2.7%) |
| 65 to 74 Years | 2,676 (100.0%) | 0 (0.0%) |
| 75 Years and older | 1,507 (100.0%) | 0 (0.0%) |
| Total | 29,540 (97.6%) | 743 (2.5%) |
Health Insurance Coverage by Citizenship Status in Gurnee
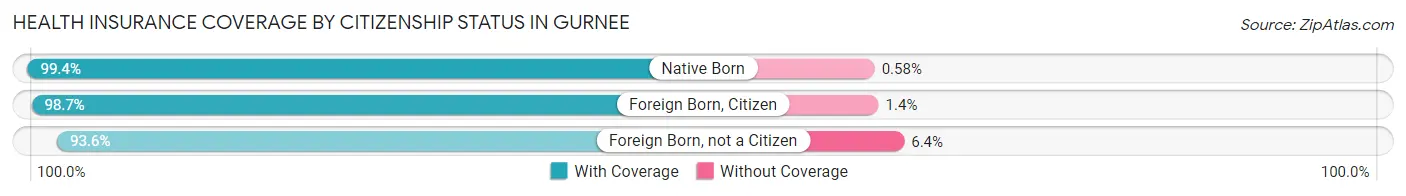
| Citizenship Status | With Coverage | Without Coverage |
| Native Born | 1,536 (99.4%) | 9 (0.6%) |
| Foreign Born, Citizen | 5,200 (98.7%) | 71 (1.3%) |
| Foreign Born, not a Citizen | 3,032 (93.6%) | 207 (6.4%) |
Health Insurance Coverage by Household Income in Gurnee
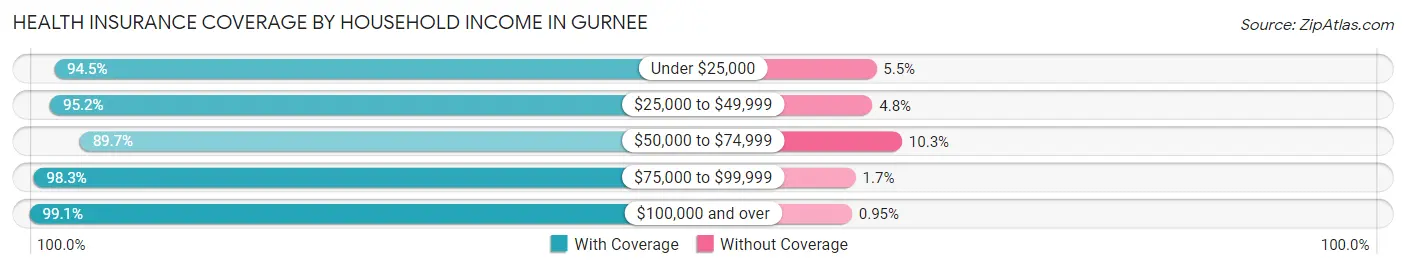
| Household Income | With Coverage | Without Coverage |
| Under $25,000 | 1,264 (94.5%) | 74 (5.5%) |
| $25,000 to $49,999 | 2,820 (95.2%) | 142 (4.8%) |
| $50,000 to $74,999 | 2,431 (89.7%) | 280 (10.3%) |
| $75,000 to $99,999 | 3,251 (98.3%) | 55 (1.7%) |
| $100,000 and over | 19,731 (99.1%) | 190 (0.9%) |
Public vs Private Health Insurance Coverage by Age in Gurnee
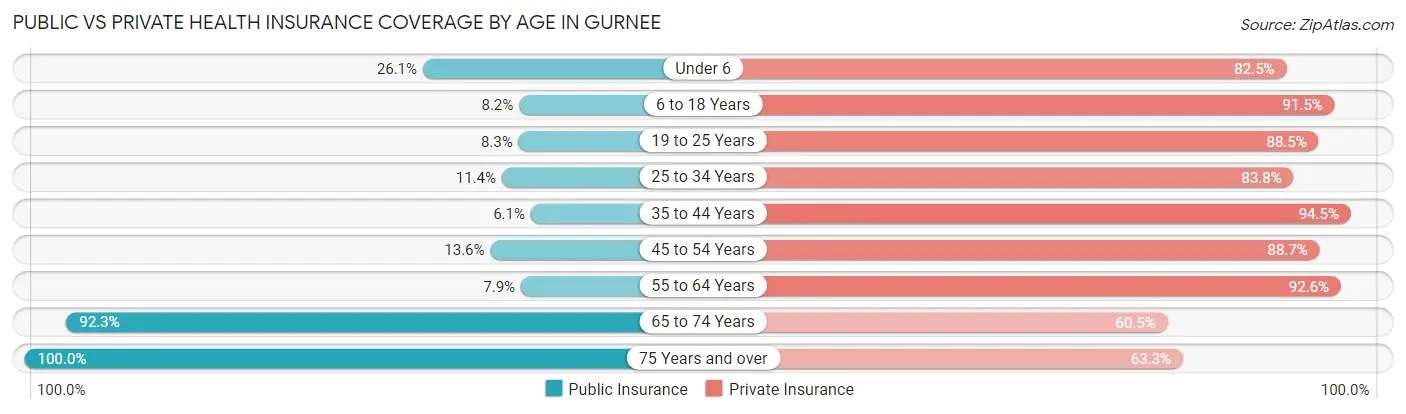
| Age Bracket | Public Insurance | Private Insurance |
| Under 6 | 403 (26.1%) | 1,275 (82.5%) |
| 6 to 18 Years | 433 (8.2%) | 4,822 (91.5%) |
| 19 to 25 Years | 269 (8.3%) | 2,866 (88.5%) |
| 25 to 34 Years | 369 (11.4%) | 2,709 (83.8%) |
| 35 to 44 Years | 224 (6.0%) | 3,496 (94.5%) |
| 45 to 54 Years | 635 (13.6%) | 4,155 (88.7%) |
| 55 to 64 Years | 349 (7.9%) | 4,102 (92.6%) |
| 65 to 74 Years | 2,469 (92.3%) | 1,618 (60.5%) |
| 75 Years and over | 1,507 (100.0%) | 954 (63.3%) |
| Total | 6,658 (22.0%) | 25,997 (85.9%) |
Disability Status by Sex by Age in Gurnee
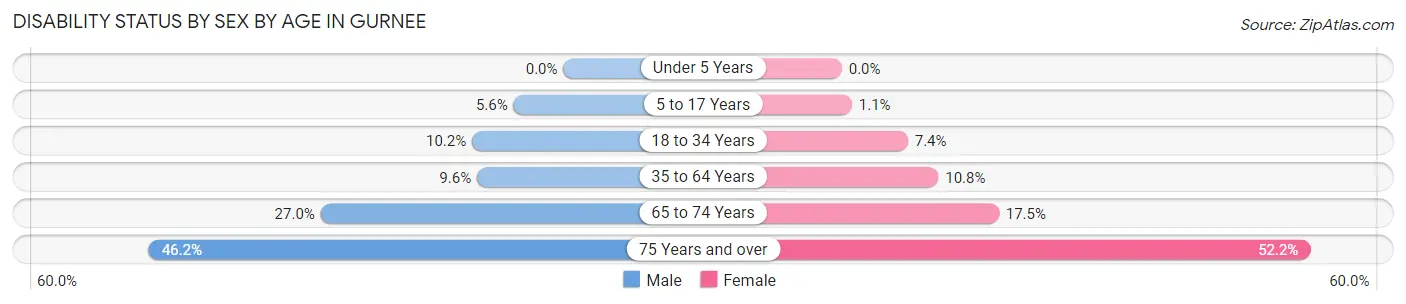
| Age Bracket | Male | Female |
| Under 5 Years | 0 (0.0%) | 0 (0.0%) |
| 5 to 17 Years | 143 (5.6%) | 29 (1.1%) |
| 18 to 34 Years | 335 (10.2%) | 273 (7.3%) |
| 35 to 64 Years | 600 (9.6%) | 707 (10.7%) |
| 65 to 74 Years | 346 (27.0%) | 244 (17.5%) |
| 75 Years and over | 247 (46.2%) | 507 (52.2%) |
Disability Class by Sex by Age in Gurnee
Disability Class: Hearing Difficulty
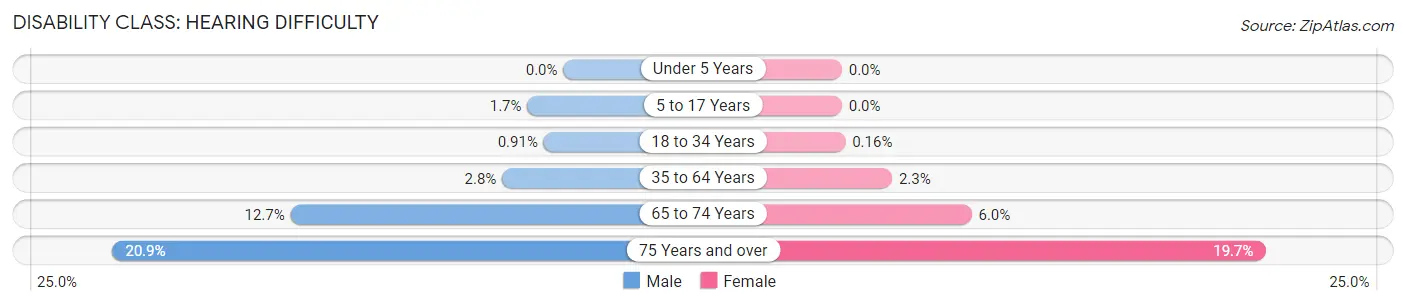
| Age Bracket | Male | Female |
| Under 5 Years | 0 (0.0%) | 0 (0.0%) |
| 5 to 17 Years | 43 (1.7%) | 0 (0.0%) |
| 18 to 34 Years | 30 (0.9%) | 6 (0.2%) |
| 35 to 64 Years | 177 (2.8%) | 153 (2.3%) |
| 65 to 74 Years | 162 (12.7%) | 84 (6.0%) |
| 75 Years and over | 112 (20.9%) | 191 (19.7%) |
Disability Class: Vision Difficulty
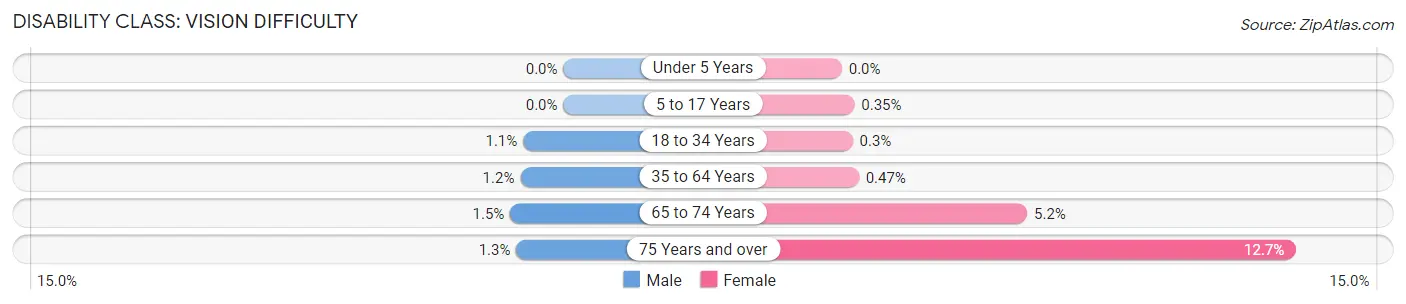
| Age Bracket | Male | Female |
| Under 5 Years | 0 (0.0%) | 0 (0.0%) |
| 5 to 17 Years | 0 (0.0%) | 9 (0.4%) |
| 18 to 34 Years | 37 (1.1%) | 11 (0.3%) |
| 35 to 64 Years | 75 (1.2%) | 31 (0.5%) |
| 65 to 74 Years | 19 (1.5%) | 72 (5.2%) |
| 75 Years and over | 7 (1.3%) | 123 (12.7%) |
Disability Class: Cognitive Difficulty
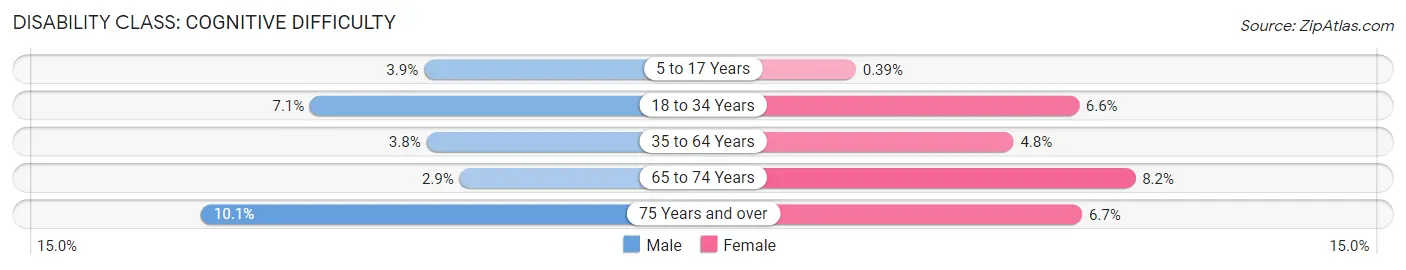
| Age Bracket | Male | Female |
| 5 to 17 Years | 100 (3.9%) | 10 (0.4%) |
| 18 to 34 Years | 232 (7.0%) | 245 (6.6%) |
| 35 to 64 Years | 238 (3.8%) | 314 (4.8%) |
| 65 to 74 Years | 37 (2.9%) | 114 (8.2%) |
| 75 Years and over | 54 (10.1%) | 65 (6.7%) |
Disability Class: Ambulatory Difficulty
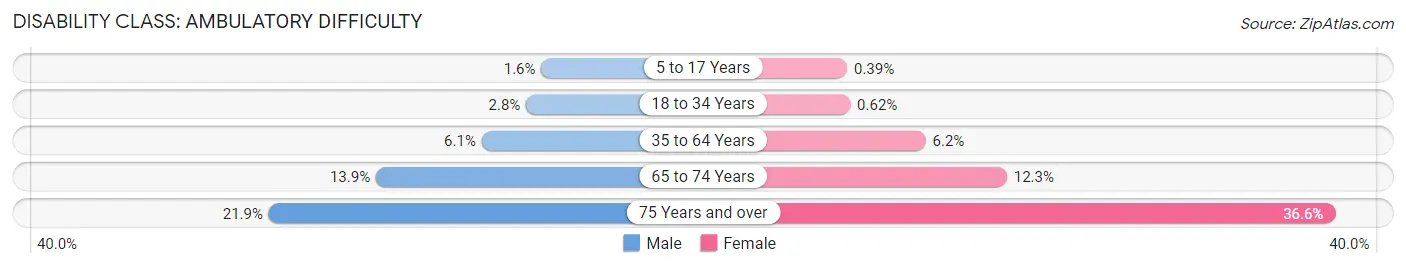
| Age Bracket | Male | Female |
| 5 to 17 Years | 42 (1.6%) | 10 (0.4%) |
| 18 to 34 Years | 91 (2.8%) | 23 (0.6%) |
| 35 to 64 Years | 378 (6.1%) | 409 (6.2%) |
| 65 to 74 Years | 178 (13.9%) | 171 (12.2%) |
| 75 Years and over | 117 (21.9%) | 356 (36.6%) |
Disability Class: Self-Care Difficulty
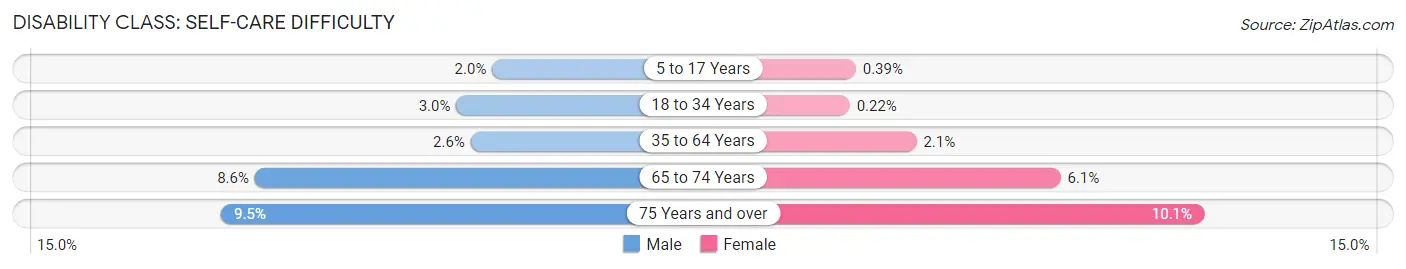
| Age Bracket | Male | Female |
| 5 to 17 Years | 51 (2.0%) | 10 (0.4%) |
| 18 to 34 Years | 98 (3.0%) | 8 (0.2%) |
| 35 to 64 Years | 161 (2.6%) | 137 (2.1%) |
| 65 to 74 Years | 110 (8.6%) | 85 (6.1%) |
| 75 Years and over | 51 (9.5%) | 98 (10.1%) |
Technology Access in Gurnee
Computing Device Access in Gurnee
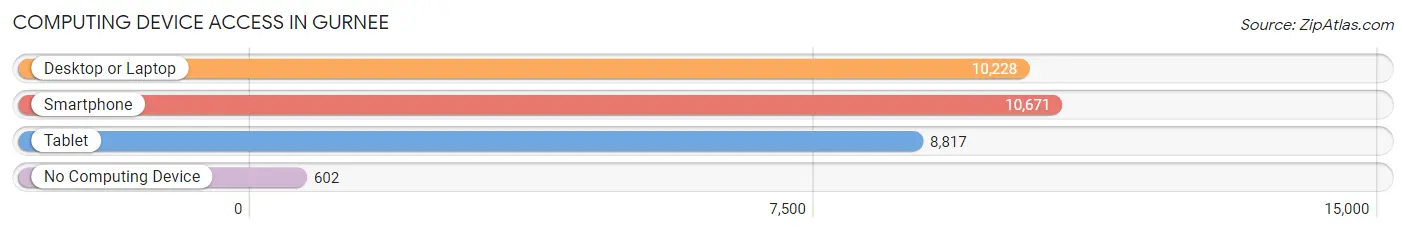
| Device Type | # Households | % Households |
| Desktop or Laptop | 10,228 | 87.1% |
| Smartphone | 10,671 | 90.9% |
| Tablet | 8,817 | 75.1% |
| No Computing Device | 602 | 5.1% |
| Total | 11,743 | 100.0% |
Internet Access in Gurnee
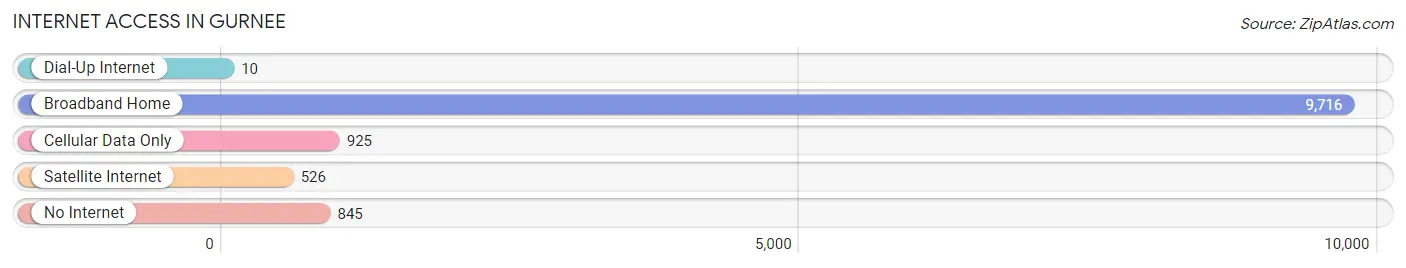
| Internet Type | # Households | % Households |
| Dial-Up Internet | 10 | 0.1% |
| Broadband Home | 9,716 | 82.7% |
| Cellular Data Only | 925 | 7.9% |
| Satellite Internet | 526 | 4.5% |
| No Internet | 845 | 7.2% |
| Total | 11,743 | 100.0% |
Gurnee Summary
Gurnee, Illinois is a village located in Lake County, Illinois, United States. It is a suburb of Chicago, located approximately 40 miles north of the city. The population was 31,295 at the 2010 census.
History
Gurnee was first settled in the 1830s by settlers from New England. The village was originally known as "Waukegan Outlet" and was later renamed "Gurnee" after the first postmaster, Walter Gurnee. The village was incorporated in 1928.
Gurnee was home to the Great Lakes Naval Training Center during World War II. The base was closed in 1993 and is now the site of the Six Flags Great America amusement park.
Geography
Gurnee is located at 42°22′N 87°59′W (42.3667, -87.9833). According to the 2010 census, Gurnee has a total area of 10.9 square miles (28.2 km2), of which 10.8 square miles (28.0 km2) is land and 0.1 square miles (0.2 km2) is water.
Economy
Gurnee is home to several major employers, including Six Flags Great America, Gurnee Mills Mall, and the Great Lakes Naval Training Center. The village is also home to several corporate headquarters, including Abbott Laboratories, Baxter International, and W.W. Grainger.
Demographics
As of the 2010 census, there were 31,295 people, 11,845 households, and 8,717 families residing in the village. The population density was 2,890.3 people per square mile (1,114.2/km2). There were 12,541 housing units at an average density of 1,159.3 per square mile (447.7/km2). The racial makeup of the village was 79.2% White, 5.2% African American, 0.3% Native American, 8.2% Asian, 0.1% Pacific Islander, 4.3% from other races, and 2.7% from two or more races. Hispanic or Latino of any race were 11.2% of the population.
There were 11,845 households, out of which 36.2% had children under the age of 18 living with them, 56.2% were married couples living together, 10.7% had a female householder with no husband present, and 28.7% were non-families. 22.7% of all households were made up of individuals, and 6.2% had someone living alone who was 65 years of age or older. The average household size was 2.63 and the average family size was 3.12.
In the village, the population was spread out, with 26.2% under the age of 18, 7.7% from 18 to 24, 32.2% from 25 to 44, 23.2% from 45 to 64, and 10.7% who were 65 years of age or older. The median age was 36 years. For every 100 females, there were 95.2 males. For every 100 females age 18 and over, there were 92.2 males.
The median income for a household in the village was $68,945, and the median income for a family was $77,941. Males had a median income of $51,945 versus $37,857 for females. The per capita income for the village was $30,945. About 3.2% of families and 4.7% of the population were below the poverty line, including 5.2% of those under age 18 and 4.2% of those age 65 or over.
Common Questions
What is Per Capita Income in Gurnee?
Per Capita income in Gurnee is $55,625.
What is the Median Family Income in Gurnee?
Median Family Income in Gurnee is $148,347.
What is the Median Household income in Gurnee?
Median Household Income in Gurnee is $112,633.
What is Income or Wage Gap in Gurnee?
Income or Wage Gap in Gurnee is 32.6%.
Women in Gurnee earn 67.4 cents for every dollar earned by a man.
What is Inequality or Gini Index in Gurnee?
Inequality or Gini Index in Gurnee is 0.42.
What is the Total Population of Gurnee?
Total Population of Gurnee is 30,629.
What is the Total Male Population of Gurnee?
Total Male Population of Gurnee is 14,903.
What is the Total Female Population of Gurnee?
Total Female Population of Gurnee is 15,726.
What is the Ratio of Males per 100 Females in Gurnee?
There are 94.77 Males per 100 Females in Gurnee.
What is the Ratio of Females per 100 Males in Gurnee?
There are 105.52 Females per 100 Males in Gurnee.
What is the Median Population Age in Gurnee?
Median Population Age in Gurnee is 40.2 Years.
What is the Average Family Size in Gurnee
Average Family Size in Gurnee is 3.2 People.
What is the Average Household Size in Gurnee
Average Household Size in Gurnee is 2.6 People.
How Large is the Labor Force in Gurnee?
There are 17,623 People in the Labor Forcein in Gurnee.
What is the Percentage of People in the Labor Force in Gurnee?
69.7% of People are in the Labor Force in Gurnee.
What is the Unemployment Rate in Gurnee?
Unemployment Rate in Gurnee is 4.1%.