Cities with the Highest Percentage of Blackfeet Population in Illinois
RELATED REPORTS & OPTIONS
Blackfeet
Illinois
Compare Cities
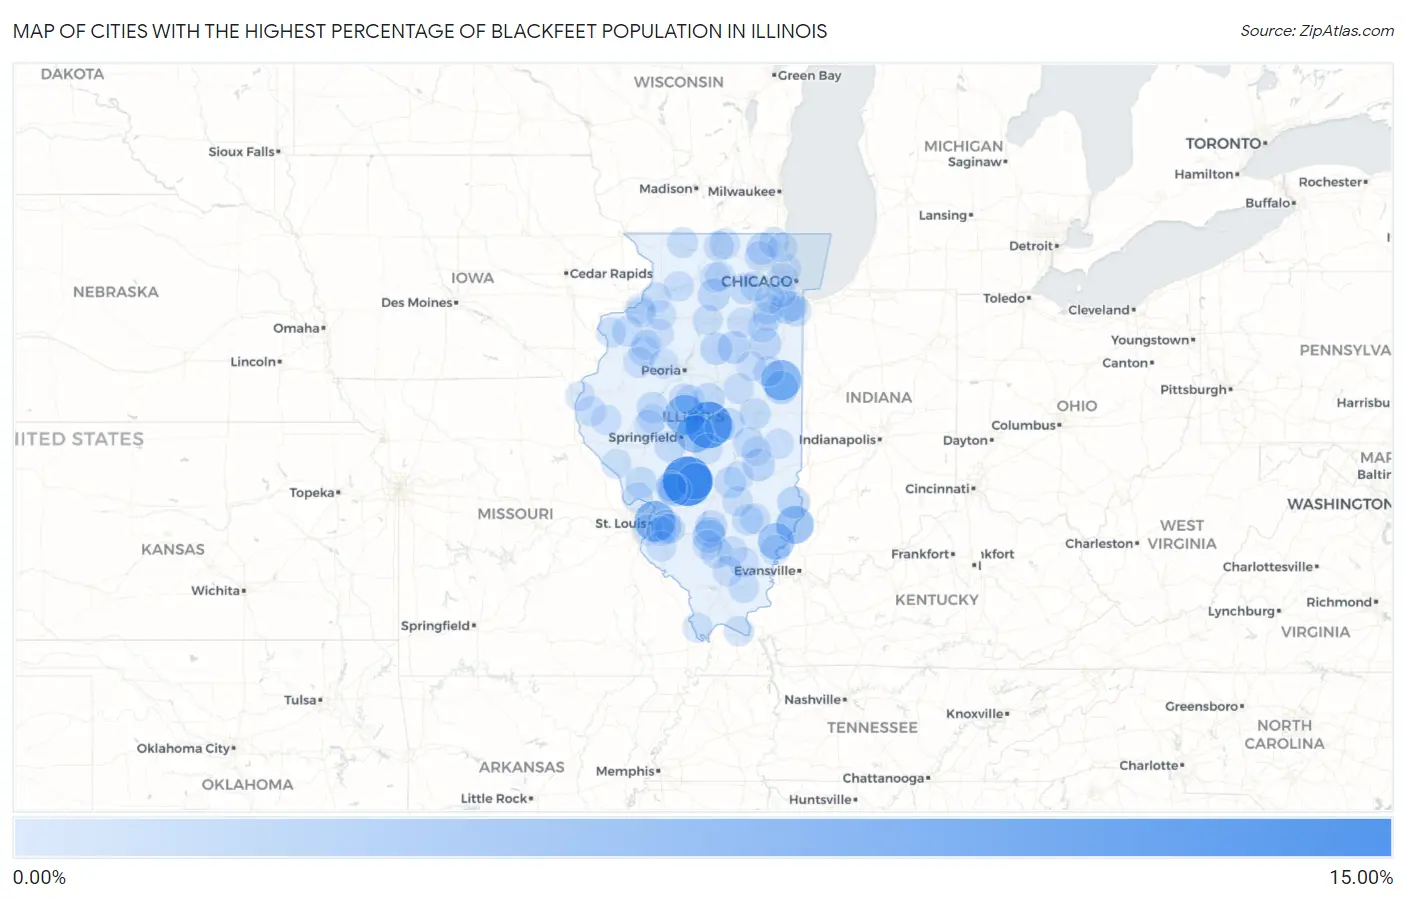
Map of Cities with the Highest Percentage of Blackfeet Population in Illinois
0.00%
15.00%
Cities with the Highest Percentage of Blackfeet Population in Illinois
| City | Blackfeet | vs State | vs National | |
| 1. | Butler | 11.43% | 0.035%(+11.4)#1 | 0.062%(+11.4)#36 |
| 2. | Latham | 9.56% | 0.035%(+9.52)#2 | 0.062%(+9.49)#43 |
| 3. | Fairmont City | 6.26% | 0.035%(+6.22)#3 | 0.062%(+6.20)#67 |
| 4. | Middletown | 5.91% | 0.035%(+5.87)#4 | 0.062%(+5.84)#71 |
| 5. | Cissna Park | 5.78% | 0.035%(+5.75)#5 | 0.062%(+5.72)#75 |
| 6. | Buffalo | 4.53% | 0.035%(+4.50)#6 | 0.062%(+4.47)#93 |
| 7. | St Francisville | 4.48% | 0.035%(+4.45)#7 | 0.062%(+4.42)#97 |
| 8. | Browns | 3.83% | 0.035%(+3.79)#8 | 0.062%(+3.77)#112 |
| 9. | Irving | 3.71% | 0.035%(+3.68)#9 | 0.062%(+3.65)#117 |
| 10. | Rankin | 2.04% | 0.035%(+2.01)#10 | 0.062%(+1.98)#217 |
| 11. | White City | 1.77% | 0.035%(+1.73)#11 | 0.062%(+1.71)#263 |
| 12. | Irvington | 1.65% | 0.035%(+1.62)#12 | 0.062%(+1.59)#289 |
| 13. | Cornell | 1.59% | 0.035%(+1.56)#13 | 0.062%(+1.53)#296 |
| 14. | Flat Rock | 1.54% | 0.035%(+1.50)#14 | 0.062%(+1.48)#315 |
| 15. | Frankfort Square | 1.52% | 0.035%(+1.48)#15 | 0.062%(+1.45)#324 |
| 16. | Rutland | 1.46% | 0.035%(+1.43)#16 | 0.062%(+1.40)#337 |
| 17. | Lerna | 1.36% | 0.035%(+1.33)#17 | 0.062%(+1.30)#364 |
| 18. | Holiday Hills | 1.33% | 0.035%(+1.30)#18 | 0.062%(+1.27)#373 |
| 19. | Buckingham | 1.28% | 0.035%(+1.24)#19 | 0.062%(+1.22)#389 |
| 20. | Compton | 1.21% | 0.035%(+1.18)#20 | 0.062%(+1.15)#414 |
| 21. | Mclean | 1.16% | 0.035%(+1.12)#21 | 0.062%(+1.10)#430 |
| 22. | Argenta | 1.11% | 0.035%(+1.08)#22 | 0.062%(+1.05)#442 |
| 23. | Waltonville | 1.08% | 0.035%(+1.04)#23 | 0.062%(+1.02)#450 |
| 24. | Junction City | 1.04% | 0.035%(+1.01)#24 | 0.062%(+0.983)#469 |
| 25. | Beecher City | 0.93% | 0.035%(+0.893)#25 | 0.062%(+0.867)#527 |
| 26. | Bath | 0.93% | 0.035%(+0.890)#26 | 0.062%(+0.864)#529 |
| 27. | Big Rock | 0.90% | 0.035%(+0.865)#27 | 0.062%(+0.839)#551 |
| 28. | Kane | 0.88% | 0.035%(+0.846)#28 | 0.062%(+0.819)#566 |
| 29. | Mount Clare | 0.88% | 0.035%(+0.844)#29 | 0.062%(+0.818)#568 |
| 30. | Bondville | 0.87% | 0.035%(+0.839)#30 | 0.062%(+0.813)#572 |
| 31. | Loami | 0.87% | 0.035%(+0.834)#31 | 0.062%(+0.808)#576 |
| 32. | Arthur | 0.80% | 0.035%(+0.768)#32 | 0.062%(+0.742)#614 |
| 33. | East Carondelet | 0.75% | 0.035%(+0.714)#33 | 0.062%(+0.687)#661 |
| 34. | Rockdale | 0.74% | 0.035%(+0.700)#34 | 0.062%(+0.674)#674 |
| 35. | Viola | 0.68% | 0.035%(+0.642)#35 | 0.062%(+0.616)#725 |
| 36. | Wamac | 0.67% | 0.035%(+0.634)#36 | 0.062%(+0.608)#739 |
| 37. | Flora | 0.64% | 0.035%(+0.603)#37 | 0.062%(+0.577)#770 |
| 38. | Stone Park | 0.64% | 0.035%(+0.600)#38 | 0.062%(+0.574)#775 |
| 39. | Grafton | 0.53% | 0.035%(+0.491)#39 | 0.062%(+0.465)#910 |
| 40. | Trout Valley | 0.51% | 0.035%(+0.470)#40 | 0.062%(+0.444)#942 |
| 41. | Arrowsmith | 0.50% | 0.035%(+0.467)#41 | 0.062%(+0.441)#947 |
| 42. | Harrisburg | 0.50% | 0.035%(+0.466)#42 | 0.062%(+0.440)#953 |
| 43. | Thawville | 0.49% | 0.035%(+0.450)#43 | 0.062%(+0.424)#983 |
| 44. | Cedarville | 0.48% | 0.035%(+0.448)#44 | 0.062%(+0.422)#986 |
| 45. | South Chicago Heights | 0.48% | 0.035%(+0.441)#45 | 0.062%(+0.415)#996 |
| 46. | Edgewood | 0.47% | 0.035%(+0.431)#46 | 0.062%(+0.405)#1,010 |
| 47. | Clay City | 0.45% | 0.035%(+0.418)#47 | 0.062%(+0.391)#1,028 |
| 48. | Candlewick Lake | 0.45% | 0.035%(+0.417)#48 | 0.062%(+0.391)#1,030 |
| 49. | O Fallon | 0.39% | 0.035%(+0.357)#49 | 0.062%(+0.331)#1,152 |
| 50. | Shiloh | 0.38% | 0.035%(+0.346)#50 | 0.062%(+0.320)#1,178 |
| 51. | Rochelle | 0.37% | 0.035%(+0.336)#51 | 0.062%(+0.310)#1,203 |
| 52. | Loves Park | 0.37% | 0.035%(+0.335)#52 | 0.062%(+0.309)#1,206 |
| 53. | Hecker | 0.37% | 0.035%(+0.335)#53 | 0.062%(+0.309)#1,208 |
| 54. | Mcleansboro | 0.36% | 0.035%(+0.322)#54 | 0.062%(+0.296)#1,233 |
| 55. | Brocton | 0.36% | 0.035%(+0.322)#55 | 0.062%(+0.296)#1,236 |
| 56. | Clayton | 0.35% | 0.035%(+0.319)#56 | 0.062%(+0.293)#1,245 |
| 57. | Abingdon | 0.35% | 0.035%(+0.318)#57 | 0.062%(+0.291)#1,250 |
| 58. | Third Lake | 0.33% | 0.035%(+0.294)#58 | 0.062%(+0.268)#1,332 |
| 59. | San Jose | 0.33% | 0.035%(+0.290)#59 | 0.062%(+0.264)#1,341 |
| 60. | Grayville | 0.32% | 0.035%(+0.289)#60 | 0.062%(+0.263)#1,346 |
| 61. | East Galesburg | 0.32% | 0.035%(+0.288)#61 | 0.062%(+0.262)#1,352 |
| 62. | Galva | 0.32% | 0.035%(+0.288)#62 | 0.062%(+0.262)#1,353 |
| 63. | Sterling | 0.32% | 0.035%(+0.281)#63 | 0.062%(+0.255)#1,372 |
| 64. | Belle Rive | 0.31% | 0.035%(+0.273)#64 | 0.062%(+0.247)#1,398 |
| 65. | North Aurora | 0.30% | 0.035%(+0.269)#65 | 0.062%(+0.243)#1,427 |
| 66. | Forrest | 0.29% | 0.035%(+0.259)#66 | 0.062%(+0.233)#1,460 |
| 67. | Dalzell | 0.29% | 0.035%(+0.258)#67 | 0.062%(+0.232)#1,462 |
| 68. | Loraine | 0.29% | 0.035%(+0.250)#68 | 0.062%(+0.224)#1,486 |
| 69. | Hanaford | 0.28% | 0.035%(+0.249)#69 | 0.062%(+0.223)#1,489 |
| 70. | Gillespie | 0.28% | 0.035%(+0.246)#70 | 0.062%(+0.220)#1,500 |
| 71. | Nebo | 0.28% | 0.035%(+0.246)#71 | 0.062%(+0.220)#1,503 |
| 72. | Flossmoor | 0.28% | 0.035%(+0.241)#72 | 0.062%(+0.215)#1,512 |
| 73. | Stonington | 0.27% | 0.035%(+0.239)#73 | 0.062%(+0.213)#1,516 |
| 74. | Seneca | 0.27% | 0.035%(+0.237)#74 | 0.062%(+0.211)#1,521 |
| 75. | Joy | 0.27% | 0.035%(+0.232)#75 | 0.062%(+0.206)#1,539 |
| 76. | Brookport | 0.27% | 0.035%(+0.231)#76 | 0.062%(+0.204)#1,547 |
| 77. | Wataga | 0.26% | 0.035%(+0.226)#77 | 0.062%(+0.200)#1,567 |
| 78. | Forsyth | 0.26% | 0.035%(+0.224)#78 | 0.062%(+0.198)#1,572 |
| 79. | Emden | 0.26% | 0.035%(+0.221)#79 | 0.062%(+0.195)#1,581 |
| 80. | Humboldt | 0.25% | 0.035%(+0.215)#80 | 0.062%(+0.188)#1,615 |
| 81. | Scott Afb | 0.25% | 0.035%(+0.213)#81 | 0.062%(+0.187)#1,628 |
| 82. | Stewardson | 0.25% | 0.035%(+0.212)#82 | 0.062%(+0.186)#1,634 |
| 83. | Ashley | 0.24% | 0.035%(+0.208)#83 | 0.062%(+0.182)#1,647 |
| 84. | East Moline | 0.24% | 0.035%(+0.203)#84 | 0.062%(+0.177)#1,663 |
| 85. | Erie | 0.23% | 0.035%(+0.199)#85 | 0.062%(+0.173)#1,671 |
| 86. | Morton Grove | 0.23% | 0.035%(+0.193)#86 | 0.062%(+0.167)#1,702 |
| 87. | Elwood | 0.22% | 0.035%(+0.181)#87 | 0.062%(+0.154)#1,754 |
| 88. | Colona | 0.20% | 0.035%(+0.168)#88 | 0.062%(+0.142)#1,804 |
| 89. | Virginia | 0.20% | 0.035%(+0.166)#89 | 0.062%(+0.140)#1,820 |
| 90. | Warsaw | 0.20% | 0.035%(+0.160)#90 | 0.062%(+0.133)#1,857 |
| 91. | Braidwood | 0.19% | 0.035%(+0.159)#91 | 0.062%(+0.133)#1,860 |
| 92. | Belleville | 0.19% | 0.035%(+0.157)#92 | 0.062%(+0.131)#1,875 |
| 93. | North Chicago | 0.19% | 0.035%(+0.152)#93 | 0.062%(+0.126)#1,892 |
| 94. | Willow Springs | 0.19% | 0.035%(+0.152)#94 | 0.062%(+0.126)#1,893 |
| 95. | Atkinson | 0.19% | 0.035%(+0.152)#95 | 0.062%(+0.126)#1,894 |
| 96. | Romeoville | 0.19% | 0.035%(+0.151)#96 | 0.062%(+0.125)#1,900 |
| 97. | Elmwood | 0.19% | 0.035%(+0.150)#97 | 0.062%(+0.124)#1,909 |
| 98. | Creston | 0.18% | 0.035%(+0.145)#98 | 0.062%(+0.119)#1,938 |
| 99. | Olive Branch | 0.17% | 0.035%(+0.138)#99 | 0.062%(+0.111)#1,977 |
| 100. | Chandlerville | 0.17% | 0.035%(+0.130)#100 | 0.062%(+0.104)#2,016 |
Common Questions
What are the Top 10 Cities with the Highest Percentage of Blackfeet Population in Illinois?
Top 10 Cities with the Highest Percentage of Blackfeet Population in Illinois are:
#1
11.43%
#2
9.56%
#3
6.26%
#4
5.91%
#5
5.78%
#6
4.53%
#7
4.48%
#8
3.83%
#9
3.71%
#10
2.04%
What city has the Highest Percentage of Blackfeet Population in Illinois?
Butler has the Highest Percentage of Blackfeet Population in Illinois with 11.43%.
What is the Percentage of Blackfeet Population in the State of Illinois?
Percentage of Blackfeet Population in Illinois is 0.035%.
What is the Percentage of Blackfeet Population in the United States?
Percentage of Blackfeet Population in the United States is 0.062%.