Quincy, IL Map & Demographics
Quincy Map
Quincy Overview
$33,672
PER CAPITA INCOME
$75,854
AVG FAMILY INCOME
$54,199
AVG HOUSEHOLD INCOME
28.8%
WAGE / INCOME GAP [ % ]
71.2¢/ $1
WAGE / INCOME GAP [ $ ]
$10,672
FAMILY INCOME DEFICIT
0.46
INEQUALITY / GINI INDEX
39,441
TOTAL POPULATION
19,005
MALE POPULATION
20,436
FEMALE POPULATION
93.00
MALES / 100 FEMALES
107.53
FEMALES / 100 MALES
40.5
MEDIAN AGE
3.0
AVG FAMILY SIZE
2.2
AVG HOUSEHOLD SIZE
20,608
LABOR FORCE [ PEOPLE ]
64.5%
PERCENT IN LABOR FORCE
4.8%
UNEMPLOYMENT RATE
Quincy Area Codes
Income in Quincy
Income Overview in Quincy
Per Capita Income in Quincy is $33,672, while median incomes of families and households are $75,854 and $54,199 respectively.
| Characteristic | Number | Measure |
| Per Capita Income | 39,441 | $33,672 |
| Median Family Income | 9,529 | $75,854 |
| Mean Family Income | 9,529 | $93,750 |
| Median Household Income | 17,373 | $54,199 |
| Mean Household Income | 17,373 | $74,111 |
| Income Deficit | 9,529 | $10,672 |
| Wage / Income Gap (%) | 39,441 | 28.78% |
| Wage / Income Gap ($) | 39,441 | 71.22¢ per $1 |
| Gini / Inequality Index | 39,441 | 0.46 |
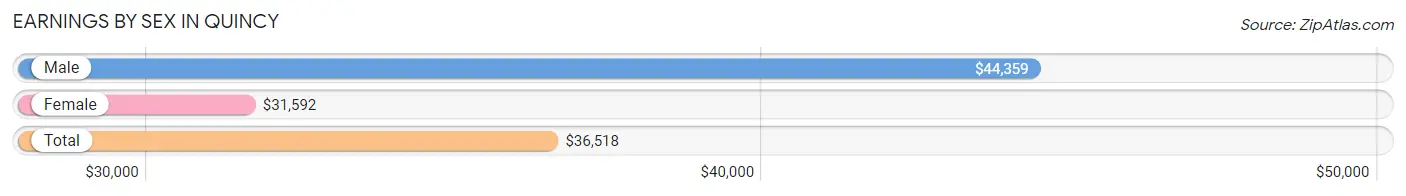
Earnings by Sex in Quincy
Average Earnings in Quincy are $36,518, $44,359 for men and $31,592 for women, a difference of 28.8%.
| Sex | Number | Average Earnings |
| Male | 10,845 (51.1%) | $44,359 |
| Female | 10,371 (48.9%) | $31,592 |
| Total | 21,216 (100.0%) | $36,518 |
Earnings by Sex by Income Bracket in Quincy
The most common earnings brackets in Quincy are $45,000 to $49,999 for men (1,095 | 10.1%) and $30,000 to $34,999 for women (1,147 | 11.1%).
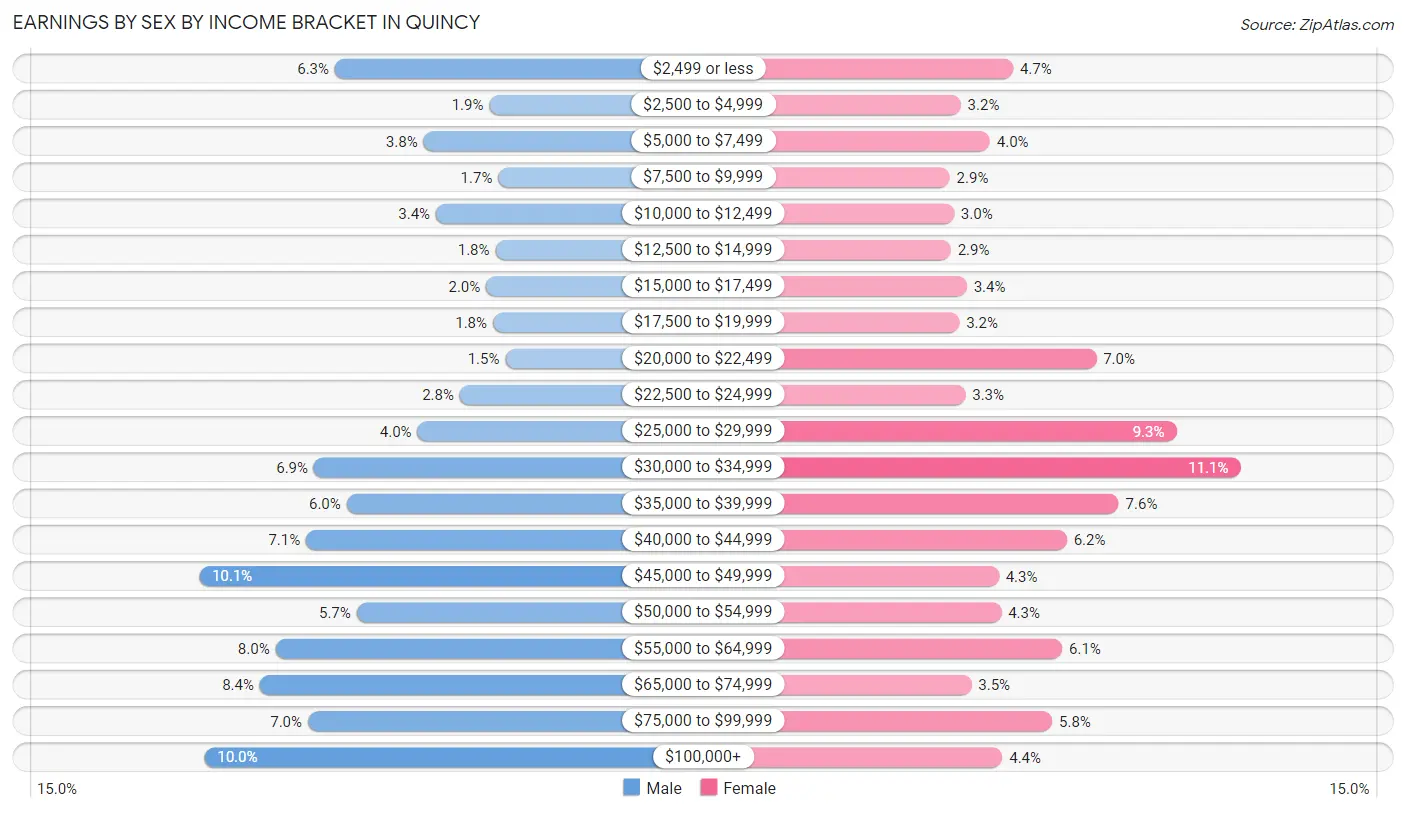
| Income | Male | Female |
| $2,499 or less | 681 (6.3%) | 484 (4.7%) |
| $2,500 to $4,999 | 210 (1.9%) | 332 (3.2%) |
| $5,000 to $7,499 | 411 (3.8%) | 417 (4.0%) |
| $7,500 to $9,999 | 183 (1.7%) | 300 (2.9%) |
| $10,000 to $12,499 | 373 (3.4%) | 312 (3.0%) |
| $12,500 to $14,999 | 192 (1.8%) | 303 (2.9%) |
| $15,000 to $17,499 | 220 (2.0%) | 349 (3.4%) |
| $17,500 to $19,999 | 200 (1.8%) | 328 (3.2%) |
| $20,000 to $22,499 | 162 (1.5%) | 727 (7.0%) |
| $22,500 to $24,999 | 300 (2.8%) | 345 (3.3%) |
| $25,000 to $29,999 | 429 (4.0%) | 960 (9.3%) |
| $30,000 to $34,999 | 745 (6.9%) | 1,147 (11.1%) |
| $35,000 to $39,999 | 645 (5.9%) | 792 (7.6%) |
| $40,000 to $44,999 | 769 (7.1%) | 641 (6.2%) |
| $45,000 to $49,999 | 1,095 (10.1%) | 443 (4.3%) |
| $50,000 to $54,999 | 615 (5.7%) | 450 (4.3%) |
| $55,000 to $64,999 | 862 (8.0%) | 627 (6.0%) |
| $65,000 to $74,999 | 910 (8.4%) | 363 (3.5%) |
| $75,000 to $99,999 | 764 (7.0%) | 598 (5.8%) |
| $100,000+ | 1,079 (10.0%) | 453 (4.4%) |
| Total | 10,845 (100.0%) | 10,371 (100.0%) |
Earnings by Sex by Educational Attainment in Quincy
Average earnings in Quincy are $46,544 for men and $34,156 for women, a difference of 26.6%. Men with an educational attainment of graduate degree enjoy the highest average annual earnings of $78,203, while those with less than high school education earn the least with $42,500. Women with an educational attainment of graduate degree earn the most with the average annual earnings of $54,177, while those with high school diploma education have the smallest earnings of $28,647.
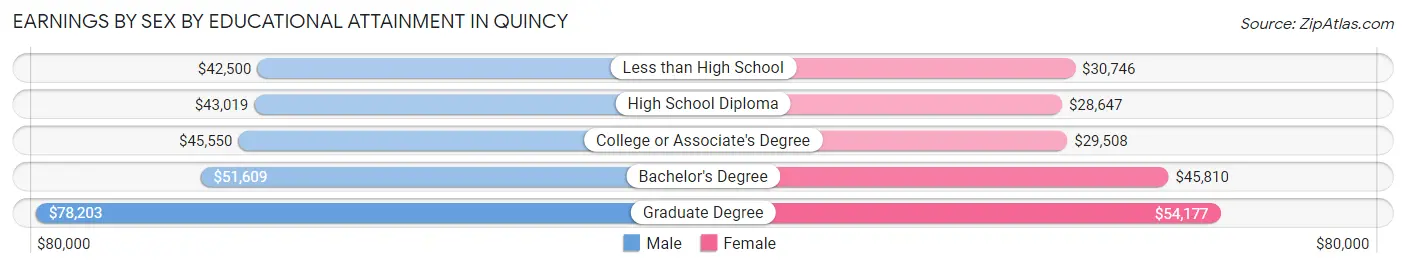
| Educational Attainment | Male Income | Female Income |
| Less than High School | $42,500 | $30,746 |
| High School Diploma | $43,019 | $28,647 |
| College or Associate's Degree | $45,550 | $29,508 |
| Bachelor's Degree | $51,609 | $45,810 |
| Graduate Degree | $78,203 | $54,177 |
| Total | $46,544 | $34,156 |
Family Income in Quincy
Family Income Brackets in Quincy
According to the Quincy family income data, there are 1,858 families falling into the $100,000 to $149,999 income range, which is the most common income bracket and makes up 19.5% of all families. Conversely, the $10,000 to $14,999 income bracket is the least frequent group with only 162 families (1.7%) belonging to this category.
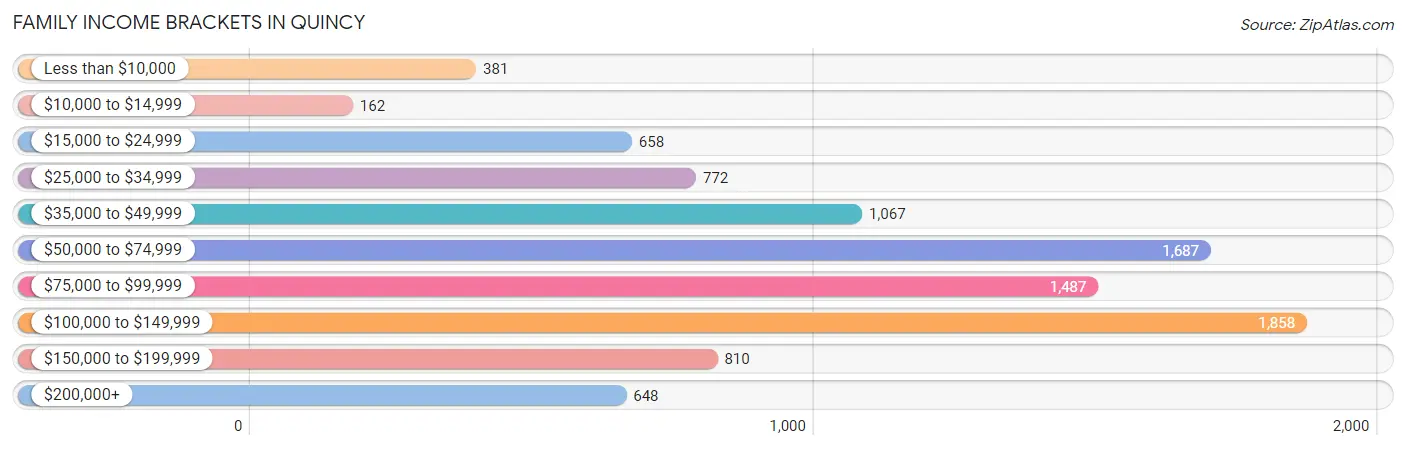
| Income Bracket | # Families | % Families |
| Less than $10,000 | 381 | 4.0% |
| $10,000 to $14,999 | 162 | 1.7% |
| $15,000 to $24,999 | 658 | 6.9% |
| $25,000 to $34,999 | 772 | 8.1% |
| $35,000 to $49,999 | 1,067 | 11.2% |
| $50,000 to $74,999 | 1,687 | 17.7% |
| $75,000 to $99,999 | 1,487 | 15.6% |
| $100,000 to $149,999 | 1,858 | 19.5% |
| $150,000 to $199,999 | 810 | 8.5% |
| $200,000+ | 648 | 6.8% |
Family Income by Famaliy Size in Quincy
4-person families (1,409 | 14.8%) account for the highest median family income in Quincy with $111,635 per family, while 2-person families (5,232 | 54.9%) have the highest median income of $33,718 per family member.
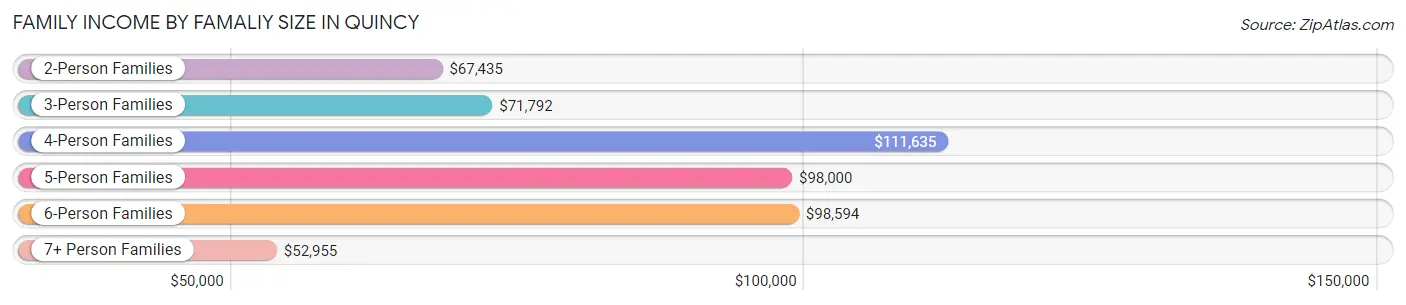
| Income Bracket | # Families | Median Income |
| 2-Person Families | 5,232 (54.9%) | $67,435 |
| 3-Person Families | 1,958 (20.5%) | $71,792 |
| 4-Person Families | 1,409 (14.8%) | $111,635 |
| 5-Person Families | 642 (6.7%) | $98,000 |
| 6-Person Families | 208 (2.2%) | $98,594 |
| 7+ Person Families | 80 (0.8%) | $52,955 |
| Total | 9,529 (100.0%) | $75,854 |
Family Income by Number of Earners in Quincy
The median family income in Quincy is $75,854, with families comprising 3+ earners (1,046) having the highest median family income of $120,244, while families with no earners (1,283) have the lowest median family income of $35,486, accounting for 11.0% and 13.5% of families, respectively.
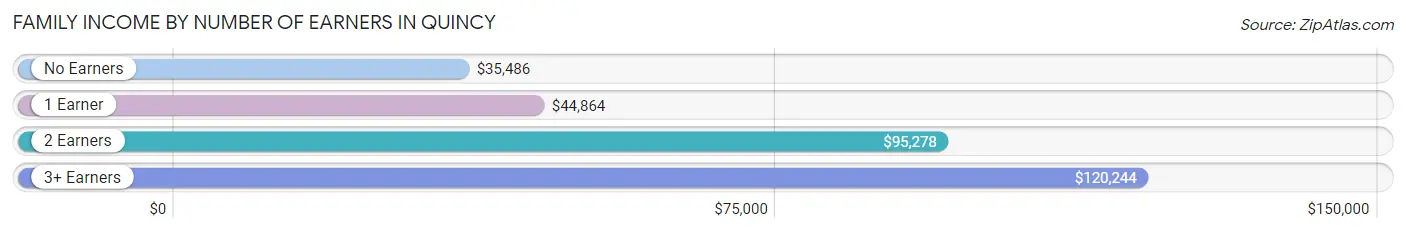
| Number of Earners | # Families | Median Income |
| No Earners | 1,283 (13.5%) | $35,486 |
| 1 Earner | 2,934 (30.8%) | $44,864 |
| 2 Earners | 4,266 (44.8%) | $95,278 |
| 3+ Earners | 1,046 (11.0%) | $120,244 |
| Total | 9,529 (100.0%) | $75,854 |
Household Income in Quincy
Household Income Brackets in Quincy
With 3,336 households falling in the category, the $50,000 to $74,999 income range is the most frequent in Quincy, accounting for 19.2% of all households. In contrast, only 678 households (3.9%) fall into the $10,000 to $14,999 income bracket, making it the least populous group.
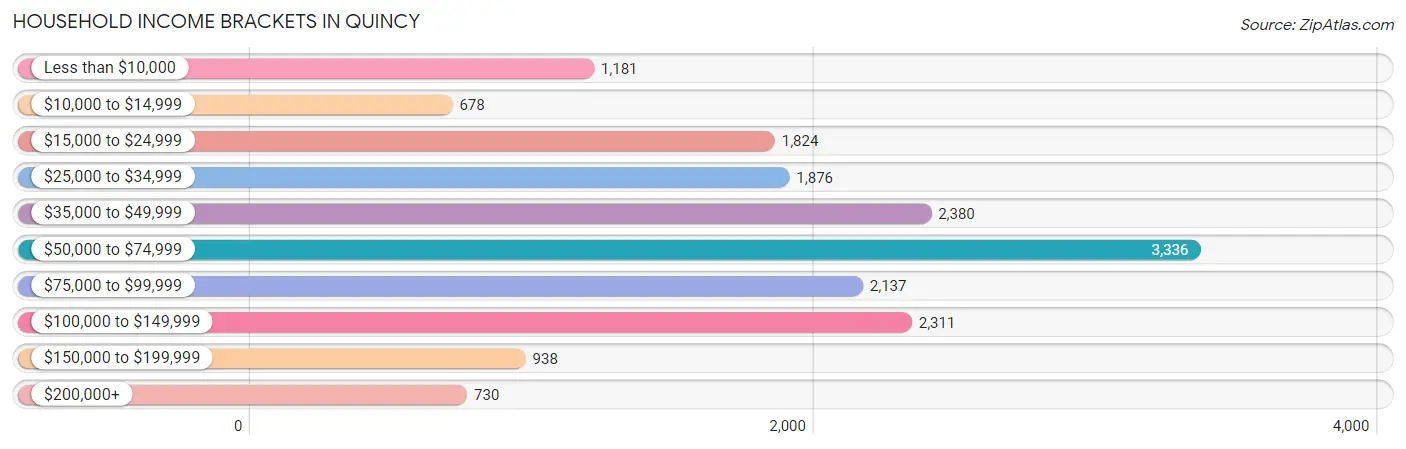
| Income Bracket | # Households | % Households |
| Less than $10,000 | 1,181 | 6.8% |
| $10,000 to $14,999 | 678 | 3.9% |
| $15,000 to $24,999 | 1,824 | 10.5% |
| $25,000 to $34,999 | 1,876 | 10.8% |
| $35,000 to $49,999 | 2,380 | 13.7% |
| $50,000 to $74,999 | 3,336 | 19.2% |
| $75,000 to $99,999 | 2,137 | 12.3% |
| $100,000 to $149,999 | 2,311 | 13.3% |
| $150,000 to $199,999 | 938 | 5.4% |
| $200,000+ | 730 | 4.2% |
Household Income by Householder Age in Quincy
The median household income in Quincy is $54,199, with the highest median household income of $68,328 found in the 45 to 64 years age bracket for the primary householder. A total of 5,941 households (34.2%) fall into this category. Meanwhile, the 65+ years age bracket for the primary householder has the lowest median household income of $39,899, with 5,250 households (30.2%) in this group.
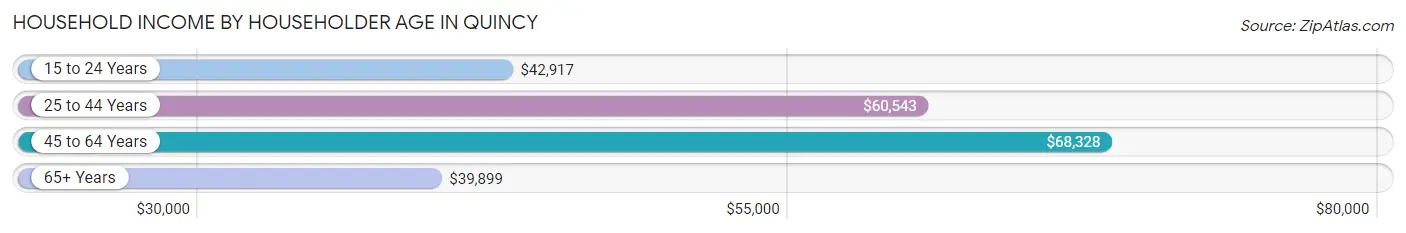
| Income Bracket | # Households | Median Income |
| 15 to 24 Years | 882 (5.1%) | $42,917 |
| 25 to 44 Years | 5,300 (30.5%) | $60,543 |
| 45 to 64 Years | 5,941 (34.2%) | $68,328 |
| 65+ Years | 5,250 (30.2%) | $39,899 |
| Total | 17,373 (100.0%) | $54,199 |
Poverty in Quincy
Income Below Poverty by Sex and Age in Quincy
With 12.2% poverty level for males and 17.5% for females among the residents of Quincy, under 5 year old males and 16 and 17 year old females are the most vulnerable to poverty, with 258 males (24.2%) and 138 females (28.0%) in their respective age groups living below the poverty level.
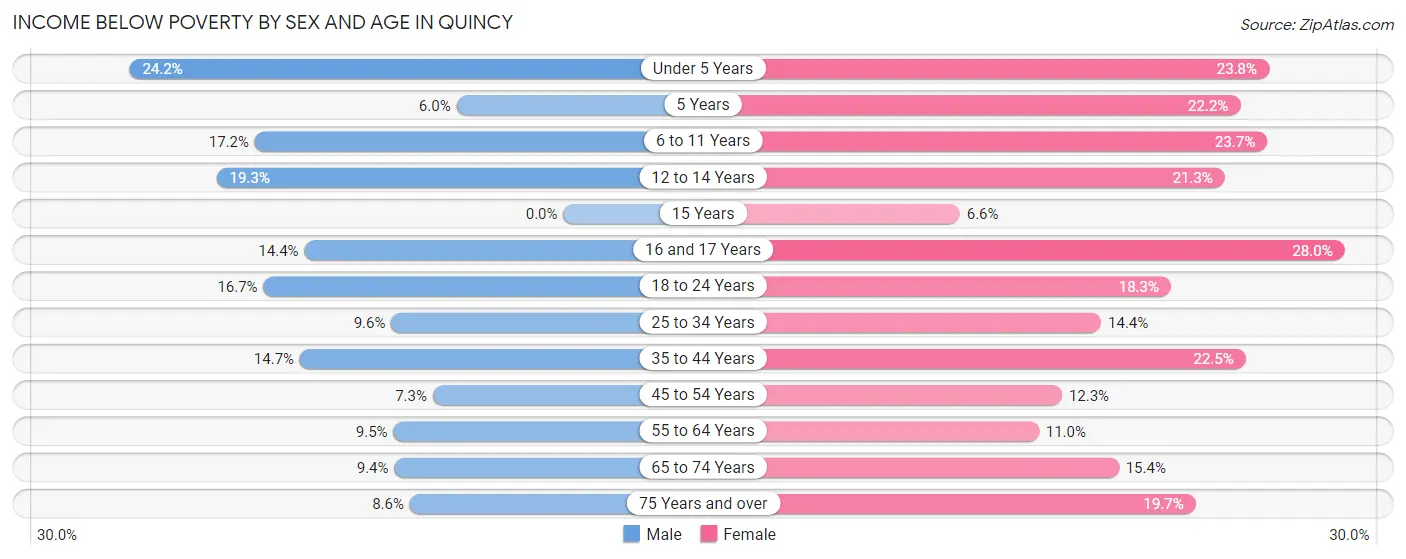
| Age Bracket | Male | Female |
| Under 5 Years | 258 (24.2%) | 303 (23.8%) |
| 5 Years | 10 (5.9%) | 53 (22.2%) |
| 6 to 11 Years | 250 (17.2%) | 324 (23.7%) |
| 12 to 14 Years | 135 (19.3%) | 178 (21.3%) |
| 15 Years | 0 (0.0%) | 9 (6.6%) |
| 16 and 17 Years | 47 (14.4%) | 138 (28.0%) |
| 18 to 24 Years | 256 (16.7%) | 284 (18.3%) |
| 25 to 34 Years | 276 (9.6%) | 368 (14.4%) |
| 35 to 44 Years | 334 (14.7%) | 544 (22.5%) |
| 45 to 54 Years | 152 (7.3%) | 254 (12.3%) |
| 55 to 64 Years | 239 (9.5%) | 306 (11.0%) |
| 65 to 74 Years | 182 (9.4%) | 330 (15.4%) |
| 75 Years and over | 109 (8.6%) | 389 (19.7%) |
| Total | 2,248 (12.2%) | 3,480 (17.5%) |
Income Above Poverty by Sex and Age in Quincy
According to the poverty statistics in Quincy, males aged 15 years and females aged 15 years are the age groups that are most secure financially, with 100.0% of males and 93.4% of females in these age groups living above the poverty line.
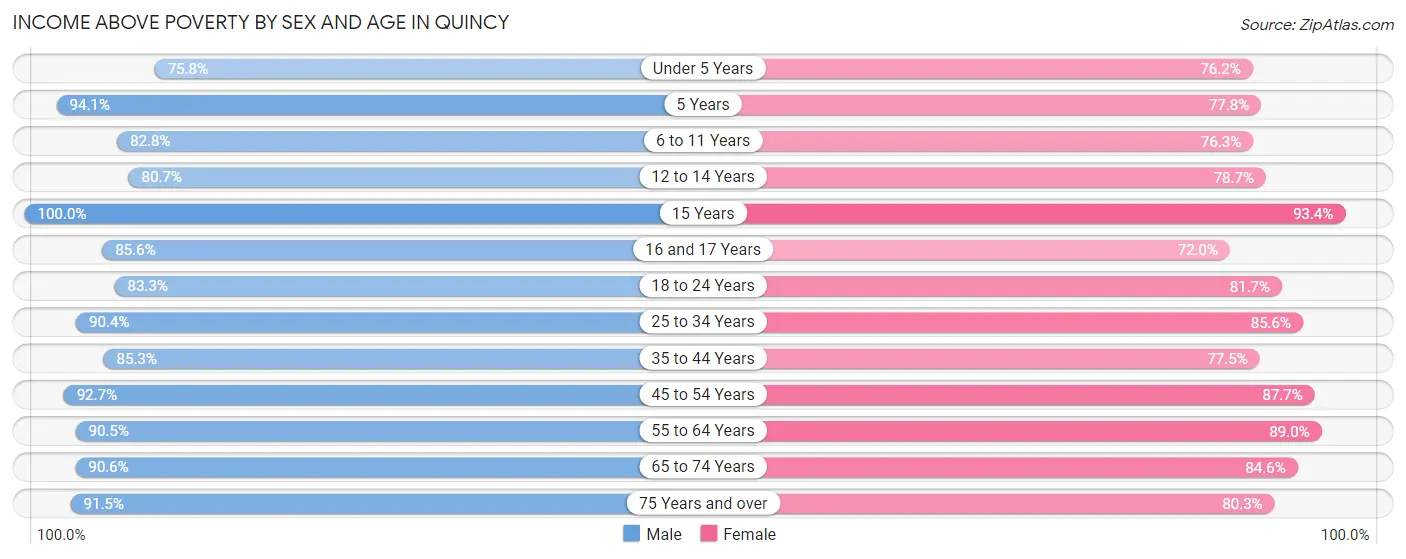
| Age Bracket | Male | Female |
| Under 5 Years | 810 (75.8%) | 971 (76.2%) |
| 5 Years | 158 (94.1%) | 186 (77.8%) |
| 6 to 11 Years | 1,205 (82.8%) | 1,044 (76.3%) |
| 12 to 14 Years | 564 (80.7%) | 657 (78.7%) |
| 15 Years | 130 (100.0%) | 128 (93.4%) |
| 16 and 17 Years | 279 (85.6%) | 355 (72.0%) |
| 18 to 24 Years | 1,277 (83.3%) | 1,266 (81.7%) |
| 25 to 34 Years | 2,606 (90.4%) | 2,181 (85.6%) |
| 35 to 44 Years | 1,943 (85.3%) | 1,876 (77.5%) |
| 45 to 54 Years | 1,939 (92.7%) | 1,817 (87.7%) |
| 55 to 64 Years | 2,287 (90.5%) | 2,483 (89.0%) |
| 65 to 74 Years | 1,752 (90.6%) | 1,810 (84.6%) |
| 75 Years and over | 1,166 (91.4%) | 1,586 (80.3%) |
| Total | 16,116 (87.8%) | 16,360 (82.5%) |
Income Below Poverty Among Married-Couple Families in Quincy
The poverty statistics for married-couple families in Quincy show that 4.9% or 322 of the total 6,609 families live below the poverty line. Families with 5 or more children have the highest poverty rate of 50.0%, comprising of 25 families. On the other hand, families with no children have the lowest poverty rate of 2.4%, which includes 103 families.
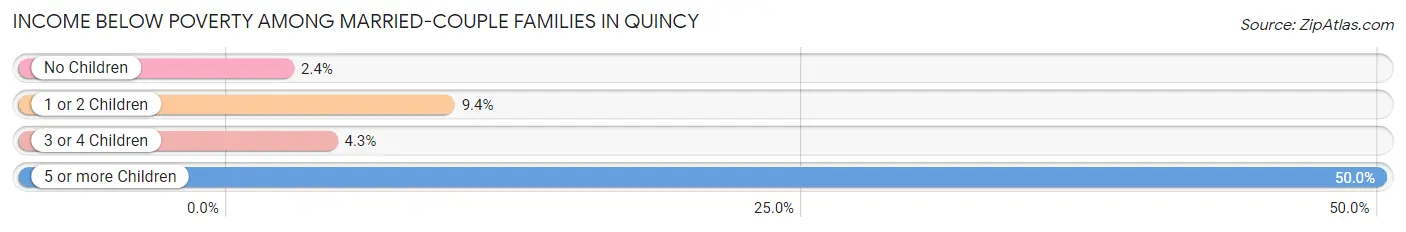
| Children | Above Poverty | Below Poverty |
| No Children | 4,111 (97.6%) | 103 (2.4%) |
| 1 or 2 Children | 1,643 (90.6%) | 171 (9.4%) |
| 3 or 4 Children | 508 (95.7%) | 23 (4.3%) |
| 5 or more Children | 25 (50.0%) | 25 (50.0%) |
| Total | 6,287 (95.1%) | 322 (4.9%) |
Income Below Poverty Among Single-Parent Households in Quincy
According to the poverty data in Quincy, 23.3% or 225 single-father households and 23.6% or 461 single-mother households are living below the poverty line. Among single-father households, those with 5 or more children have the highest poverty rate, with 14 households (100.0%) experiencing poverty. Likewise, among single-mother households, those with 3 or 4 children have the highest poverty rate, with 122 households (57.0%) falling below the poverty line.
| Children | Single Father | Single Mother |
| No Children | 58 (15.3%) | 92 (14.5%) |
| 1 or 2 Children | 120 (24.0%) | 237 (22.1%) |
| 3 or 4 Children | 33 (45.8%) | 122 (57.0%) |
| 5 or more Children | 14 (100.0%) | 10 (30.3%) |
| Total | 225 (23.3%) | 461 (23.6%) |
Income Below Poverty Among Married-Couple vs Single-Parent Households in Quincy
The poverty data for Quincy shows that 322 of the married-couple family households (4.9%) and 686 of the single-parent households (23.5%) are living below the poverty level. Within the married-couple family households, those with 5 or more children have the highest poverty rate, with 25 households (50.0%) falling below the poverty line. Among the single-parent households, those with 3 or 4 children have the highest poverty rate, with 155 household (54.2%) living below poverty.
| Children | Married-Couple Families | Single-Parent Households |
| No Children | 103 (2.4%) | 150 (14.8%) |
| 1 or 2 Children | 171 (9.4%) | 357 (22.7%) |
| 3 or 4 Children | 23 (4.3%) | 155 (54.2%) |
| 5 or more Children | 25 (50.0%) | 24 (51.1%) |
| Total | 322 (4.9%) | 686 (23.5%) |
Race in Quincy
The most populous races in Quincy are White / Caucasian (34,652 | 87.9%), Black / African American (2,448 | 6.2%), and Two or more Races (1,714 | 4.3%).
| Race | # Population | % Population |
| Asian | 415 | 1.1% |
| Black / African American | 2,448 | 6.2% |
| Hawaiian / Pacific | 2 | 0.0% |
| Hispanic or Latino | 750 | 1.9% |
| Native / Alaskan | 17 | 0.0% |
| White / Caucasian | 34,652 | 87.9% |
| Two or more Races | 1,714 | 4.3% |
| Some other Race | 193 | 0.5% |
| Total | 39,441 | 100.0% |
Ancestry in Quincy
The most populous ancestries reported in Quincy are German (13,257 | 33.6%), Irish (4,152 | 10.5%), English (3,173 | 8.0%), American (2,548 | 6.5%), and Scottish (727 | 1.8%), together accounting for 60.5% of all Quincy residents.
| Ancestry | # Population | % Population |
| African | 386 | 1.0% |
| American | 2,548 | 6.5% |
| Arab | 43 | 0.1% |
| Austrian | 40 | 0.1% |
| Belgian | 15 | 0.0% |
| Belizean | 193 | 0.5% |
| Bhutanese | 57 | 0.1% |
| Blackfeet | 23 | 0.1% |
| Brazilian | 24 | 0.1% |
| British | 205 | 0.5% |
| British West Indian | 9 | 0.0% |
| Burmese | 69 | 0.2% |
| Canadian | 5 | 0.0% |
| Celtic | 6 | 0.0% |
| Central American | 21 | 0.1% |
| Cherokee | 53 | 0.1% |
| Chippewa | 5 | 0.0% |
| Choctaw | 69 | 0.2% |
| Colombian | 26 | 0.1% |
| Comanche | 4 | 0.0% |
| Croatian | 24 | 0.1% |
| Cuban | 25 | 0.1% |
| Czech | 25 | 0.1% |
| Czechoslovakian | 12 | 0.0% |
| Danish | 58 | 0.2% |
| Dutch | 460 | 1.2% |
| Eastern European | 30 | 0.1% |
| Ecuadorian | 4 | 0.0% |
| English | 3,173 | 8.0% |
| European | 459 | 1.2% |
| Finnish | 24 | 0.1% |
| French | 540 | 1.4% |
| French Canadian | 72 | 0.2% |
| German | 13,257 | 33.6% |
| Greek | 113 | 0.3% |
| Honduran | 21 | 0.1% |
| Hopi | 15 | 0.0% |
| Hungarian | 112 | 0.3% |
| Indian (Asian) | 31 | 0.1% |
| Iranian | 6 | 0.0% |
| Irish | 4,152 | 10.5% |
| Iroquois | 14 | 0.0% |
| Italian | 689 | 1.8% |
| Jordanian | 21 | 0.1% |
| Korean | 119 | 0.3% |
| Laotian | 20 | 0.1% |
| Lebanese | 22 | 0.1% |
| Lithuanian | 10 | 0.0% |
| Malaysian | 37 | 0.1% |
| Mexican | 583 | 1.5% |
| Native Hawaiian | 9 | 0.0% |
| Northern European | 61 | 0.2% |
| Norwegian | 276 | 0.7% |
| Pakistani | 25 | 0.1% |
| Pennsylvania German | 25 | 0.1% |
| Polish | 372 | 0.9% |
| Portuguese | 63 | 0.2% |
| Puerto Rican | 13 | 0.0% |
| Romanian | 32 | 0.1% |
| Russian | 4 | 0.0% |
| Scandinavian | 77 | 0.2% |
| Scotch-Irish | 372 | 0.9% |
| Scottish | 727 | 1.8% |
| Slovak | 41 | 0.1% |
| South American | 59 | 0.2% |
| Sri Lankan | 127 | 0.3% |
| Subsaharan African | 454 | 1.1% |
| Sudanese | 68 | 0.2% |
| Swedish | 539 | 1.4% |
| Swiss | 117 | 0.3% |
| Thai | 227 | 0.6% |
| Turkish | 9 | 0.0% |
| Venezuelan | 29 | 0.1% |
| Welsh | 256 | 0.6% | View All 74 Rows |
Immigrants in Quincy
The most numerous immigrant groups reported in Quincy came from Asia (322 | 0.8%), Latin America (275 | 0.7%), Central America (195 | 0.5%), South Eastern Asia (166 | 0.4%), and Belize (114 | 0.3%), together accounting for 2.7% of all Quincy residents.
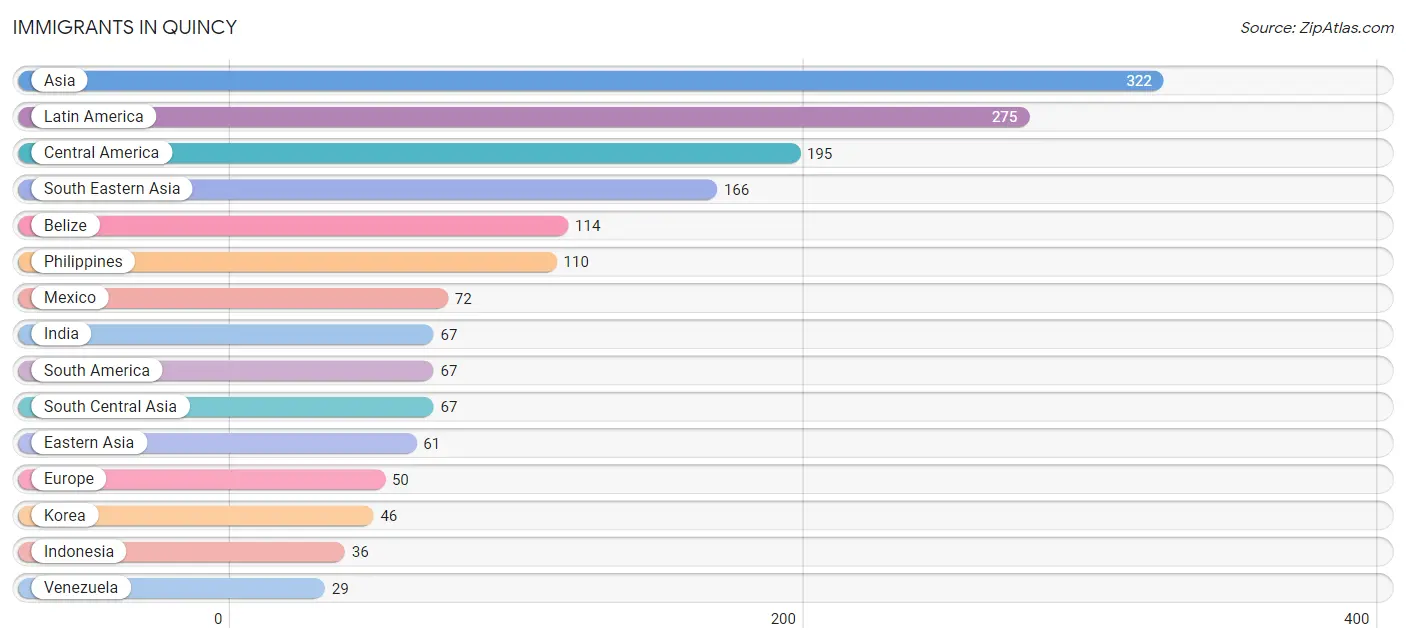
| Immigration Origin | # Population | % Population |
| Africa | 18 | 0.1% |
| Asia | 322 | 0.8% |
| Belize | 114 | 0.3% |
| Brazil | 10 | 0.0% |
| Canada | 17 | 0.0% |
| Caribbean | 13 | 0.0% |
| Central America | 195 | 0.5% |
| China | 15 | 0.0% |
| Colombia | 20 | 0.1% |
| Cuba | 4 | 0.0% |
| Eastern Asia | 61 | 0.2% |
| Eastern Europe | 19 | 0.1% |
| Ecuador | 4 | 0.0% |
| Europe | 50 | 0.1% |
| Germany | 23 | 0.1% |
| Honduras | 9 | 0.0% |
| Hong Kong | 8 | 0.0% |
| India | 67 | 0.2% |
| Indonesia | 36 | 0.1% |
| Jordan | 5 | 0.0% |
| Korea | 46 | 0.1% |
| Kuwait | 23 | 0.1% |
| Latin America | 275 | 0.7% |
| Mexico | 72 | 0.2% |
| Northern Europe | 8 | 0.0% |
| Philippines | 110 | 0.3% |
| Poland | 19 | 0.1% |
| South Africa | 18 | 0.1% |
| South America | 67 | 0.2% |
| South Central Asia | 67 | 0.2% |
| South Eastern Asia | 166 | 0.4% |
| Thailand | 13 | 0.0% |
| Uruguay | 4 | 0.0% |
| Venezuela | 29 | 0.1% |
| Vietnam | 7 | 0.0% |
| Western Asia | 28 | 0.1% |
| Western Europe | 23 | 0.1% | View All 37 Rows |
Sex and Age in Quincy
Sex and Age in Quincy
The most populous age groups in Quincy are 30 to 34 Years (1,630 | 8.6%) for men and 55 to 59 Years (1,538 | 7.5%) for women.
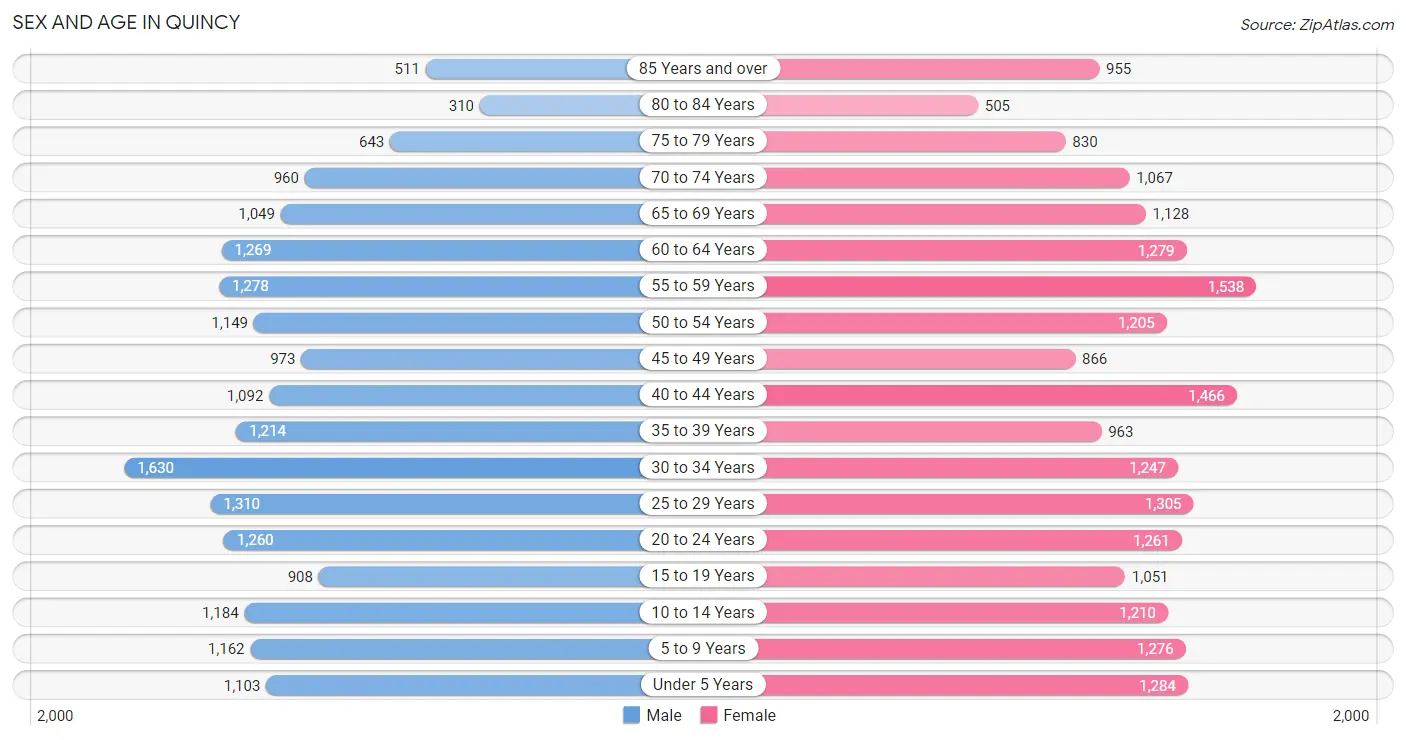
| Age Bracket | Male | Female |
| Under 5 Years | 1,103 (5.8%) | 1,284 (6.3%) |
| 5 to 9 Years | 1,162 (6.1%) | 1,276 (6.2%) |
| 10 to 14 Years | 1,184 (6.2%) | 1,210 (5.9%) |
| 15 to 19 Years | 908 (4.8%) | 1,051 (5.1%) |
| 20 to 24 Years | 1,260 (6.6%) | 1,261 (6.2%) |
| 25 to 29 Years | 1,310 (6.9%) | 1,305 (6.4%) |
| 30 to 34 Years | 1,630 (8.6%) | 1,247 (6.1%) |
| 35 to 39 Years | 1,214 (6.4%) | 963 (4.7%) |
| 40 to 44 Years | 1,092 (5.8%) | 1,466 (7.2%) |
| 45 to 49 Years | 973 (5.1%) | 866 (4.2%) |
| 50 to 54 Years | 1,149 (6.0%) | 1,205 (5.9%) |
| 55 to 59 Years | 1,278 (6.7%) | 1,538 (7.5%) |
| 60 to 64 Years | 1,269 (6.7%) | 1,279 (6.3%) |
| 65 to 69 Years | 1,049 (5.5%) | 1,128 (5.5%) |
| 70 to 74 Years | 960 (5.1%) | 1,067 (5.2%) |
| 75 to 79 Years | 643 (3.4%) | 830 (4.1%) |
| 80 to 84 Years | 310 (1.6%) | 505 (2.5%) |
| 85 Years and over | 511 (2.7%) | 955 (4.7%) |
| Total | 19,005 (100.0%) | 20,436 (100.0%) |
Families and Households in Quincy
Median Family Size in Quincy
The median family size in Quincy is 2.95 persons per family, with married-couple families (6,609 | 69.4%) accounting for the largest median family size of 3 persons per family. On the other hand, single male/father families (965 | 10.1%) represent the smallest median family size with 2.60 persons per family.
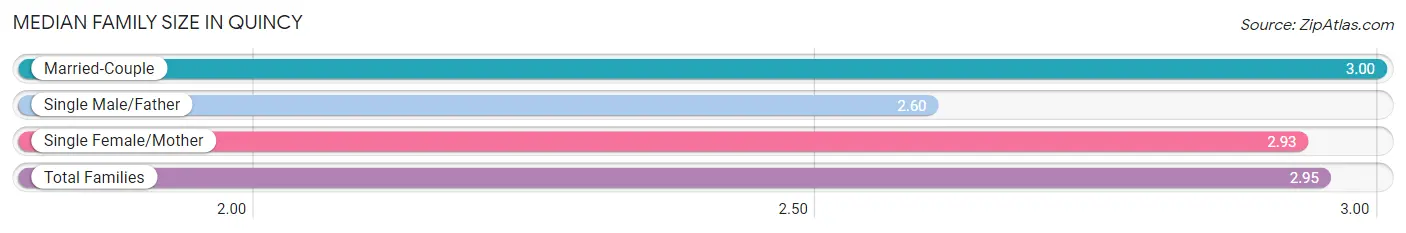
| Family Type | # Families | Family Size |
| Married-Couple | 6,609 (69.4%) | 3.00 |
| Single Male/Father | 965 (10.1%) | 2.60 |
| Single Female/Mother | 1,955 (20.5%) | 2.93 |
| Total Families | 9,529 (100.0%) | 2.95 |
Median Household Size in Quincy
The median household size in Quincy is 2.19 persons per household, with single female/mother households (1,955 | 11.3%) accounting for the largest median household size of 3.09 persons per household. non-family households (7,844 | 45.2%) represent the smallest median household size with 1.17 persons per household.
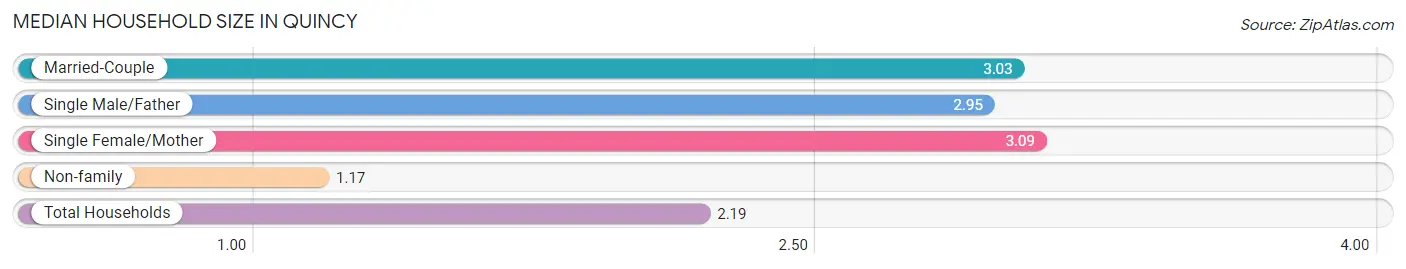
| Household Type | # Households | Household Size |
| Married-Couple | 6,609 (38.0%) | 3.03 |
| Single Male/Father | 965 (5.6%) | 2.95 |
| Single Female/Mother | 1,955 (11.3%) | 3.09 |
| Non-family | 7,844 (45.2%) | 1.17 |
| Total Households | 17,373 (100.0%) | 2.19 |
Household Size by Marriage Status in Quincy
Out of a total of 17,373 households in Quincy, 9,529 (54.8%) are family households, while 7,844 (45.2%) are nonfamily households. The most numerous type of family households are 2-person households, comprising 4,951, and the most common type of nonfamily households are 1-person households, comprising 6,653.
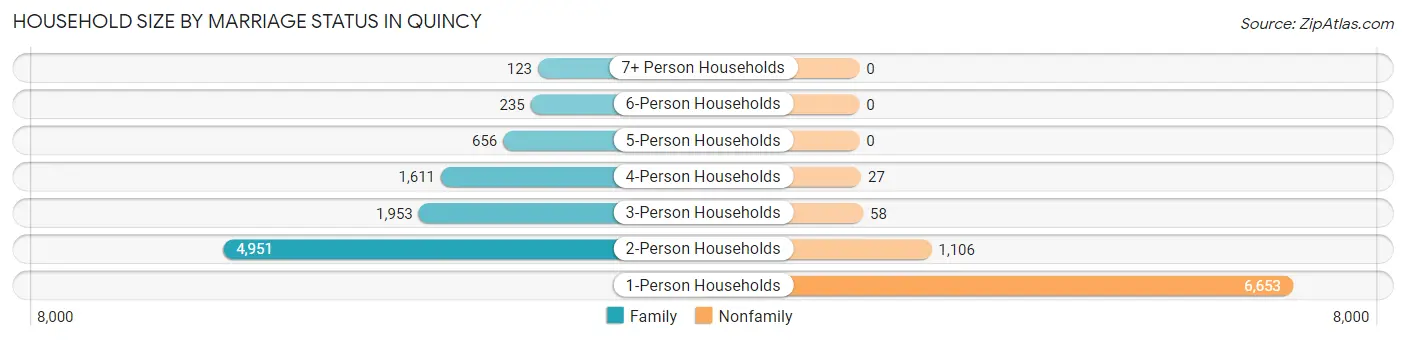
| Household Size | Family Households | Nonfamily Households |
| 1-Person Households | - | 6,653 (38.3%) |
| 2-Person Households | 4,951 (28.5%) | 1,106 (6.4%) |
| 3-Person Households | 1,953 (11.2%) | 58 (0.3%) |
| 4-Person Households | 1,611 (9.3%) | 27 (0.2%) |
| 5-Person Households | 656 (3.8%) | 0 (0.0%) |
| 6-Person Households | 235 (1.3%) | 0 (0.0%) |
| 7+ Person Households | 123 (0.7%) | 0 (0.0%) |
| Total | 9,529 (54.8%) | 7,844 (45.2%) |
Female Fertility in Quincy
Fertility by Age in Quincy
Average fertility rate in Quincy is 61.0 births per 1,000 women. Women in the age bracket of 20 to 34 years have the highest fertility rate with 133.0 births per 1,000 women. Women in the age bracket of 20 to 34 years acount for 99.0% of all women with births.
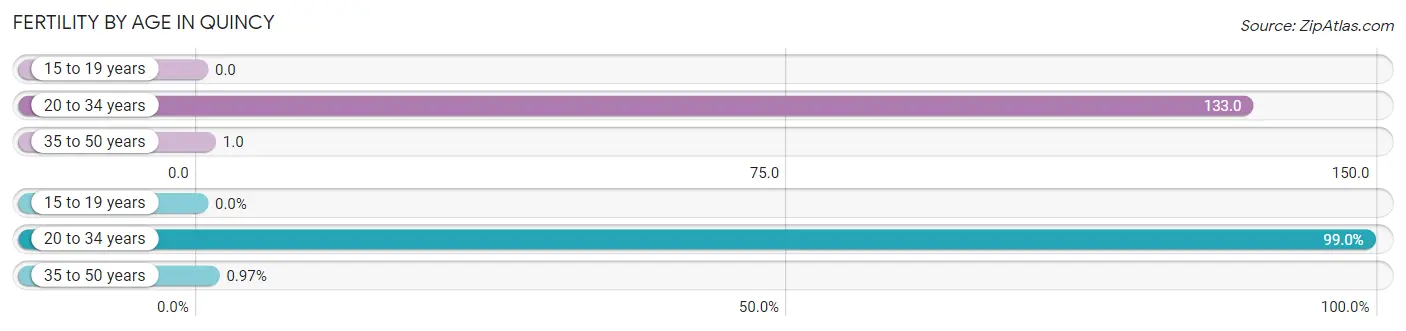
| Age Bracket | Women with Births | Births / 1,000 Women |
| 15 to 19 years | 0 (0.0%) | 0.0 |
| 20 to 34 years | 508 (99.0%) | 133.0 |
| 35 to 50 years | 5 (1.0%) | 1.0 |
| Total | 513 (100.0%) | 61.0 |
Fertility by Age by Marriage Status in Quincy
59.1% of women with births (513) in Quincy are married. The highest percentage of unmarried women with births falls into 20 to 34 years age bracket with 41.3% of them unmarried at the time of birth, while the lowest percentage of unmarried women with births belong to 35 to 50 years age bracket with 0.0% of them unmarried.
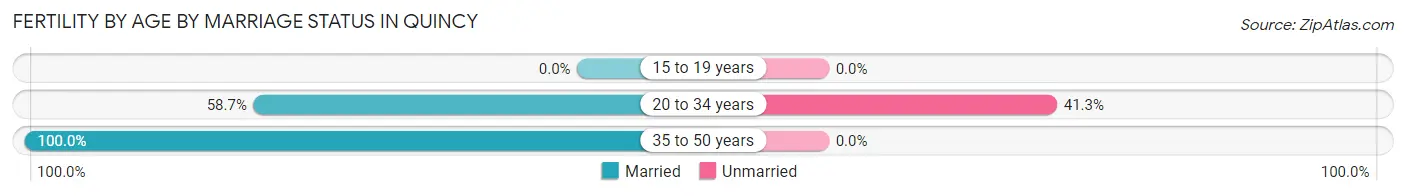
| Age Bracket | Married | Unmarried |
| 15 to 19 years | 0 (0.0%) | 0 (0.0%) |
| 20 to 34 years | 298 (58.7%) | 210 (41.3%) |
| 35 to 50 years | 5 (100.0%) | 0 (0.0%) |
| Total | 303 (59.1%) | 210 (40.9%) |
Fertility by Education in Quincy
Average fertility rate in Quincy is 61.0 births per 1,000 women. Women with the education attainment of college or associate's degree have the highest fertility rate of 81.0 births per 1,000 women, while women with the education attainment of less than high school have the lowest fertility at 15.0 births per 1,000 women. Women with the education attainment of college or associate's degree represent 45.6% of all women with births.
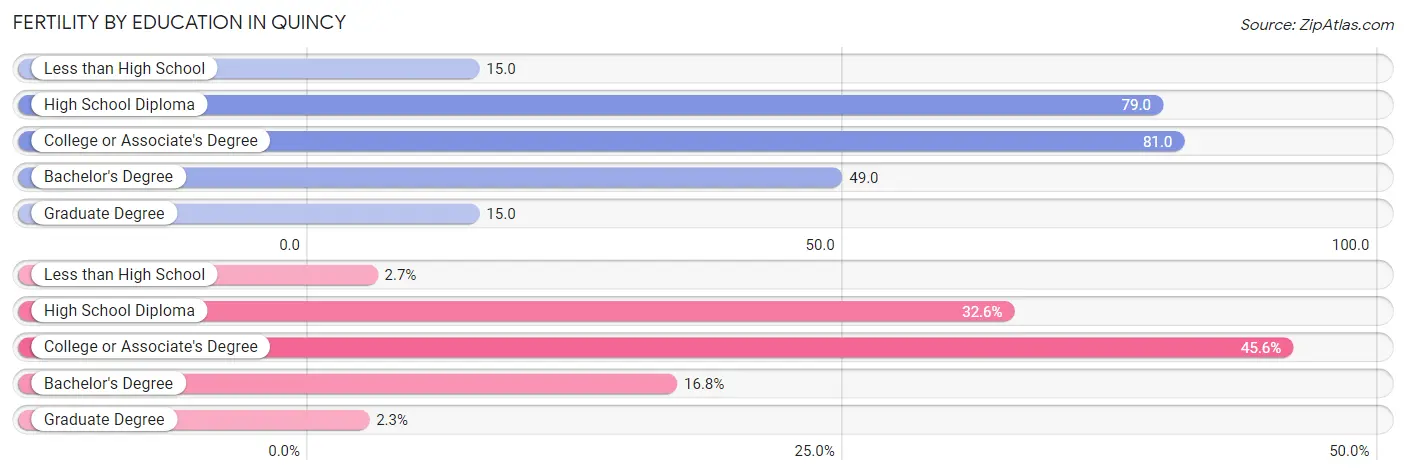
| Educational Attainment | Women with Births | Births / 1,000 Women |
| Less than High School | 14 (2.7%) | 15.0 |
| High School Diploma | 167 (32.6%) | 79.0 |
| College or Associate's Degree | 234 (45.6%) | 81.0 |
| Bachelor's Degree | 86 (16.8%) | 49.0 |
| Graduate Degree | 12 (2.3%) | 15.0 |
| Total | 513 (100.0%) | 61.0 |
Fertility by Education by Marriage Status in Quincy
40.9% of women with births in Quincy are unmarried. Women with the educational attainment of less than high school are most likely to be married with 100.0% of them married at childbirth, while women with the educational attainment of high school diploma are least likely to be married with 100.0% of them unmarried at childbirth.
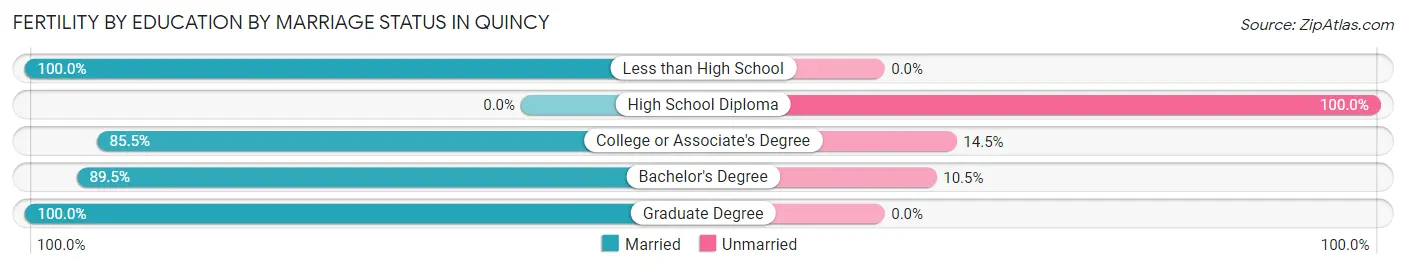
| Educational Attainment | Married | Unmarried |
| Less than High School | 14 (100.0%) | 0 (0.0%) |
| High School Diploma | 0 (0.0%) | 167 (100.0%) |
| College or Associate's Degree | 200 (85.5%) | 34 (14.5%) |
| Bachelor's Degree | 77 (89.5%) | 9 (10.5%) |
| Graduate Degree | 12 (100.0%) | 0 (0.0%) |
| Total | 303 (59.1%) | 210 (40.9%) |
Employment Characteristics in Quincy
Employment by Class of Employer in Quincy
Among the 19,307 employed individuals in Quincy, private company employees (12,839 | 66.5%), not-for-profit organizations (2,925 | 15.1%), and local government employees (1,435 | 7.4%) make up the most common classes of employment.
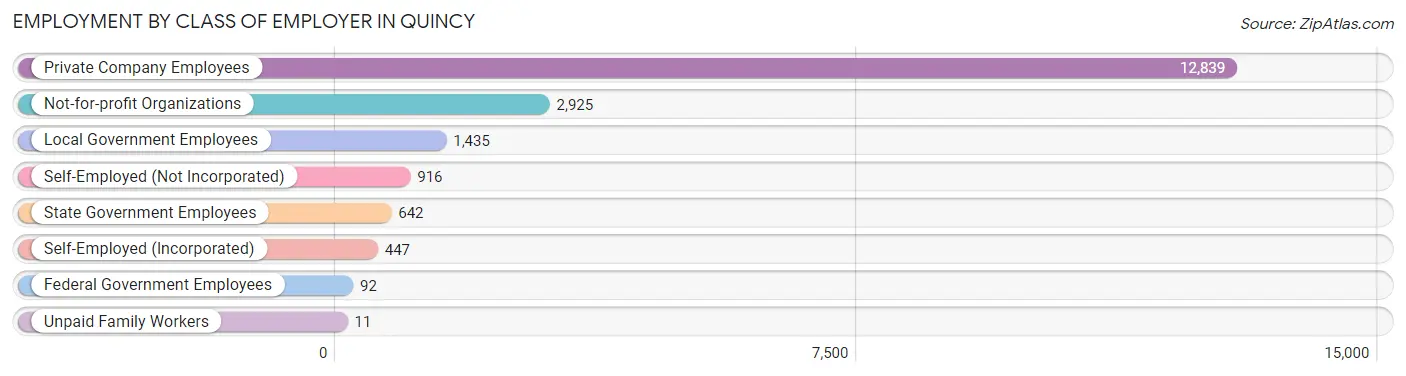
| Employer Class | # Employees | % Employees |
| Private Company Employees | 12,839 | 66.5% |
| Self-Employed (Incorporated) | 447 | 2.3% |
| Self-Employed (Not Incorporated) | 916 | 4.7% |
| Not-for-profit Organizations | 2,925 | 15.1% |
| Local Government Employees | 1,435 | 7.4% |
| State Government Employees | 642 | 3.3% |
| Federal Government Employees | 92 | 0.5% |
| Unpaid Family Workers | 11 | 0.1% |
| Total | 19,307 | 100.0% |
Employment Status by Age in Quincy
According to the labor force statistics for Quincy, out of the total population over 16 years of age (31,951), 64.5% or 20,608 individuals are in the labor force, with 4.8% or 989 of them unemployed. The age group with the highest labor force participation rate is 30 to 34 years, with 89.0% or 2,561 individuals in the labor force. Within the labor force, the 16 to 19 years age range has the highest percentage of unemployed individuals, with 23.6% or 222 of them being unemployed.
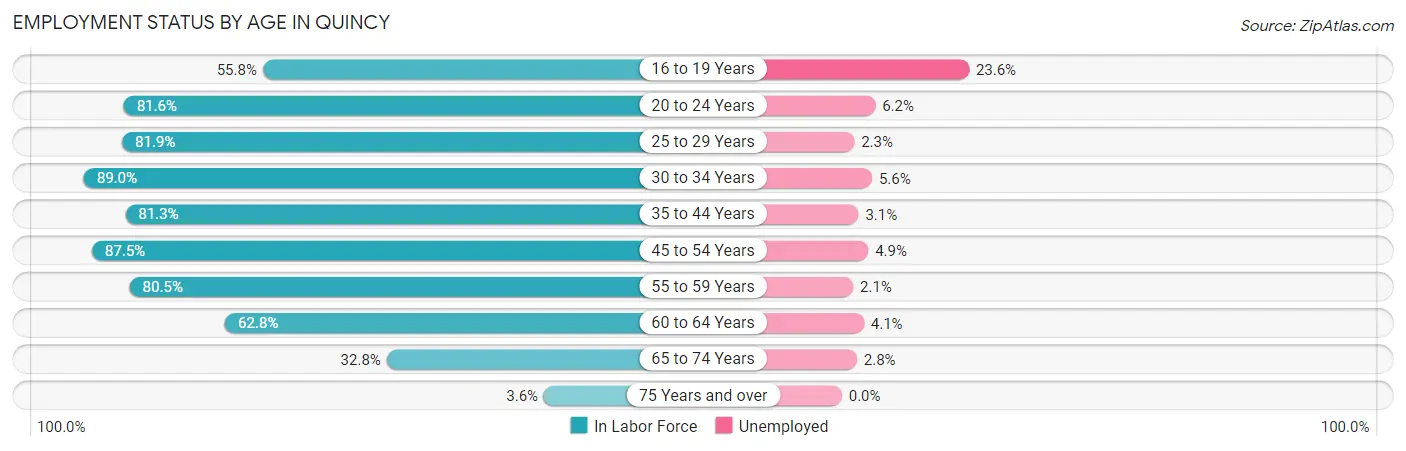
| Age Bracket | In Labor Force | Unemployed |
| 16 to 19 Years | 942 (55.8%) | 222 (23.6%) |
| 20 to 24 Years | 2,057 (81.6%) | 128 (6.2%) |
| 25 to 29 Years | 2,142 (81.9%) | 49 (2.3%) |
| 30 to 34 Years | 2,561 (89.0%) | 143 (5.6%) |
| 35 to 44 Years | 3,850 (81.3%) | 119 (3.1%) |
| 45 to 54 Years | 3,669 (87.5%) | 180 (4.9%) |
| 55 to 59 Years | 2,267 (80.5%) | 48 (2.1%) |
| 60 to 64 Years | 1,600 (62.8%) | 66 (4.1%) |
| 65 to 74 Years | 1,379 (32.8%) | 39 (2.8%) |
| 75 Years and over | 135 (3.6%) | 0 (0.0%) |
| Total | 20,608 (64.5%) | 989 (4.8%) |
Employment Status by Educational Attainment in Quincy
According to labor force statistics for Quincy, 81.3% of individuals (16,084) out of the total population between 25 and 64 years of age (19,784) are in the labor force, with 3.8% or 611 of them being unemployed. The group with the highest labor force participation rate are those with the educational attainment of bachelor's degree or higher, with 90.3% or 5,305 individuals in the labor force. Within the labor force, individuals with less than high school education have the highest percentage of unemployment, with 17.4% or 165 of them being unemployed.
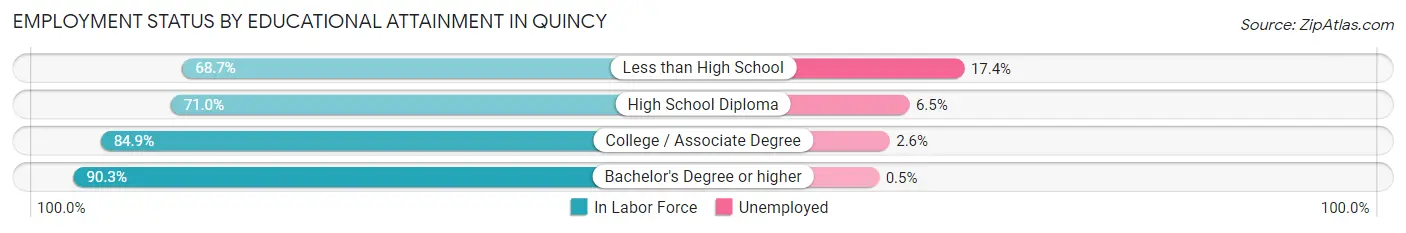
| Educational Attainment | In Labor Force | Unemployed |
| Less than High School | 949 (68.7%) | 240 (17.4%) |
| High School Diploma | 4,121 (71.0%) | 377 (6.5%) |
| College / Associate Degree | 5,708 (84.9%) | 175 (2.6%) |
| Bachelor's Degree or higher | 5,305 (90.3%) | 29 (0.5%) |
| Total | 16,084 (81.3%) | 752 (3.8%) |
Employment Occupations by Sex in Quincy
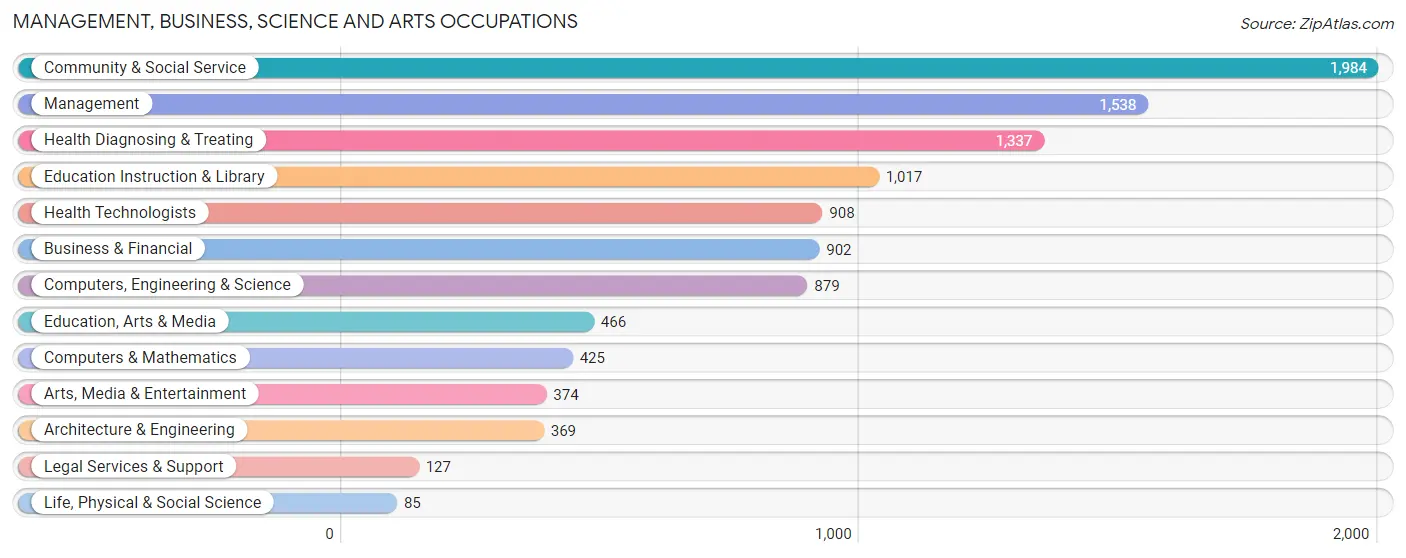
Management, Business, Science and Arts Occupations
The most common Management, Business, Science and Arts occupations in Quincy are Community & Social Service (1,984 | 10.1%), Management (1,538 | 7.8%), Health Diagnosing & Treating (1,337 | 6.8%), Education Instruction & Library (1,017 | 5.2%), and Health Technologists (908 | 4.6%).
Management, Business, Science and Arts Occupations by Sex
Within the Management, Business, Science and Arts occupations in Quincy, the most male-oriented occupations are Architecture & Engineering (94.6%), Legal Services & Support (81.1%), and Life, Physical & Social Science (80.0%), while the most female-oriented occupations are Health Diagnosing & Treating (83.6%), Health Technologists (78.8%), and Education Instruction & Library (71.3%).
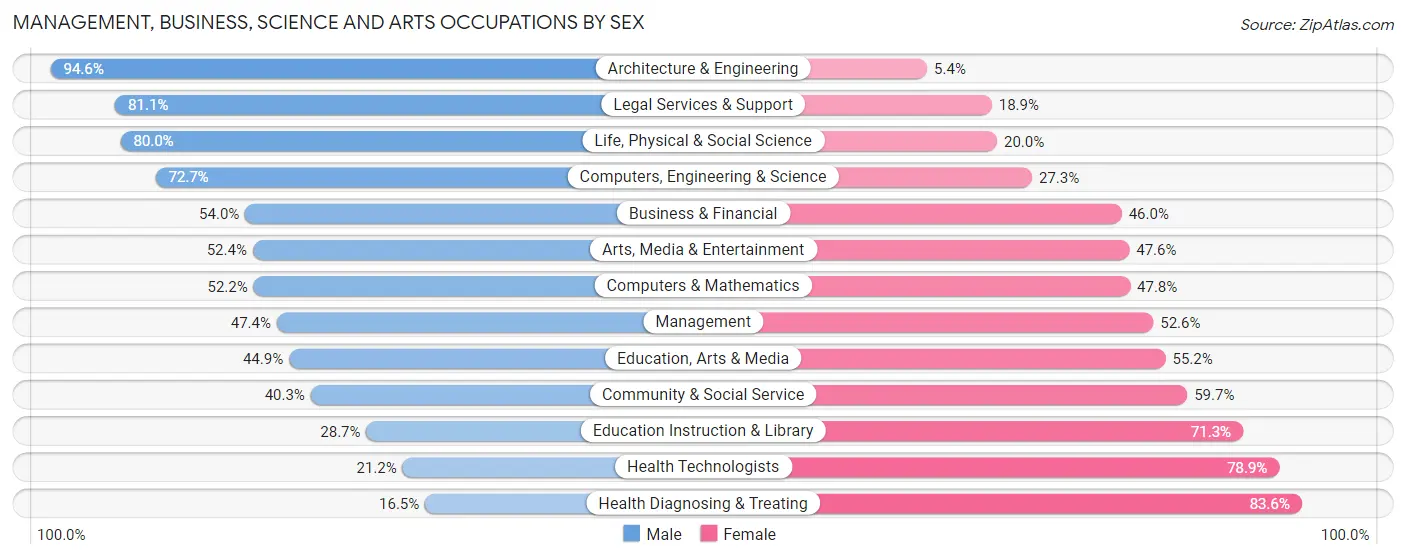
| Occupation | Male | Female |
| Management | 729 (47.4%) | 809 (52.6%) |
| Business & Financial | 487 (54.0%) | 415 (46.0%) |
| Computers, Engineering & Science | 639 (72.7%) | 240 (27.3%) |
| Computers & Mathematics | 222 (52.2%) | 203 (47.8%) |
| Architecture & Engineering | 349 (94.6%) | 20 (5.4%) |
| Life, Physical & Social Science | 68 (80.0%) | 17 (20.0%) |
| Community & Social Service | 800 (40.3%) | 1,184 (59.7%) |
| Education, Arts & Media | 209 (44.9%) | 257 (55.1%) |
| Legal Services & Support | 103 (81.1%) | 24 (18.9%) |
| Education Instruction & Library | 292 (28.7%) | 725 (71.3%) |
| Arts, Media & Entertainment | 196 (52.4%) | 178 (47.6%) |
| Health Diagnosing & Treating | 220 (16.5%) | 1,117 (83.6%) |
| Health Technologists | 192 (21.1%) | 716 (78.8%) |
| Total (Category) | 2,875 (43.3%) | 3,765 (56.7%) |
| Total (Overall) | 9,805 (50.0%) | 9,803 (50.0%) |
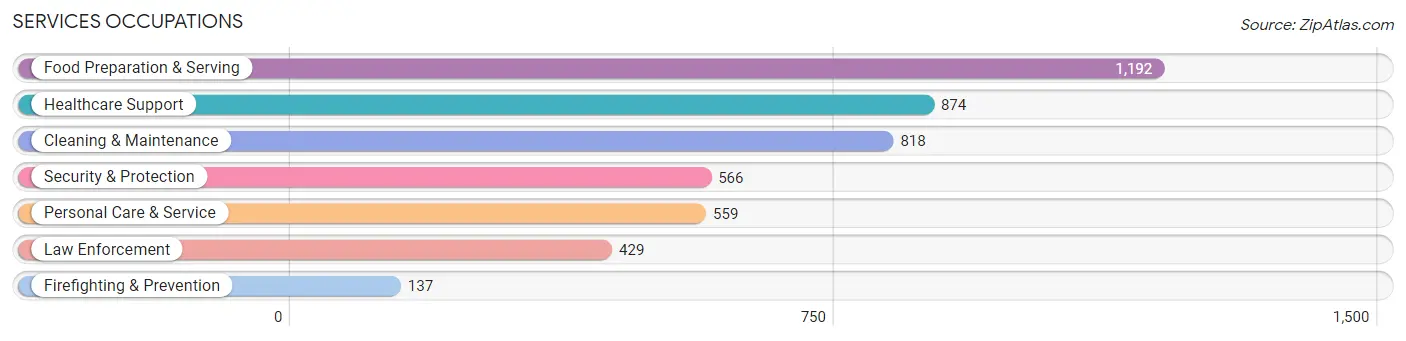
Services Occupations
The most common Services occupations in Quincy are Food Preparation & Serving (1,192 | 6.1%), Healthcare Support (874 | 4.5%), Cleaning & Maintenance (818 | 4.2%), Security & Protection (566 | 2.9%), and Personal Care & Service (559 | 2.9%).
Services Occupations by Sex
Within the Services occupations in Quincy, the most male-oriented occupations are Law Enforcement (91.8%), Security & Protection (89.0%), and Firefighting & Prevention (80.3%), while the most female-oriented occupations are Healthcare Support (94.5%), Personal Care & Service (88.7%), and Food Preparation & Serving (65.3%).
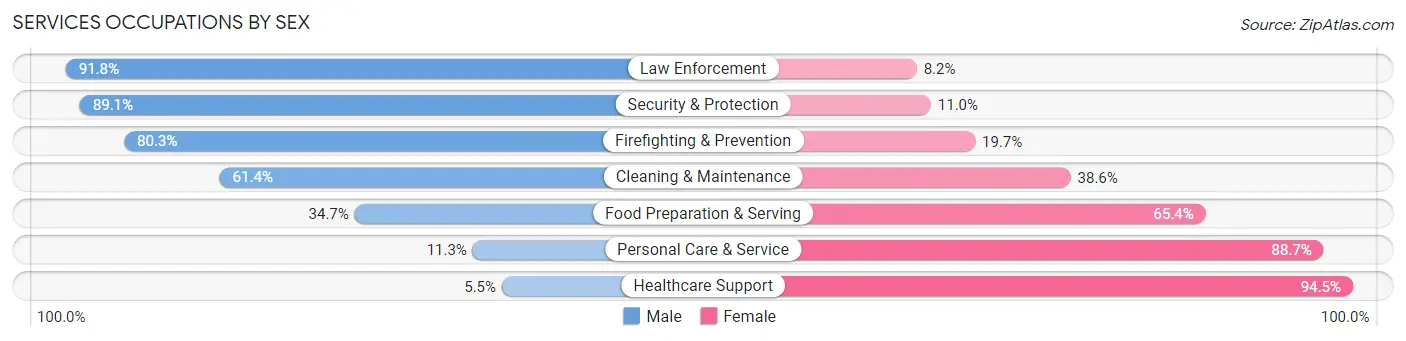
| Occupation | Male | Female |
| Healthcare Support | 48 (5.5%) | 826 (94.5%) |
| Security & Protection | 504 (89.0%) | 62 (11.0%) |
| Firefighting & Prevention | 110 (80.3%) | 27 (19.7%) |
| Law Enforcement | 394 (91.8%) | 35 (8.2%) |
| Food Preparation & Serving | 413 (34.6%) | 779 (65.3%) |
| Cleaning & Maintenance | 502 (61.4%) | 316 (38.6%) |
| Personal Care & Service | 63 (11.3%) | 496 (88.7%) |
| Total (Category) | 1,530 (38.2%) | 2,479 (61.8%) |
| Total (Overall) | 9,805 (50.0%) | 9,803 (50.0%) |
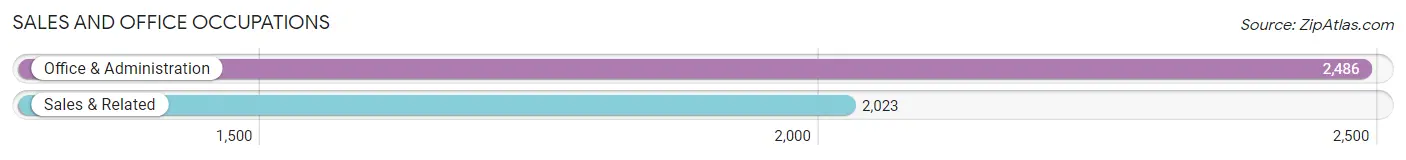
Sales and Office Occupations
The most common Sales and Office occupations in Quincy are Office & Administration (2,486 | 12.7%), and Sales & Related (2,023 | 10.3%).
Sales and Office Occupations by Sex
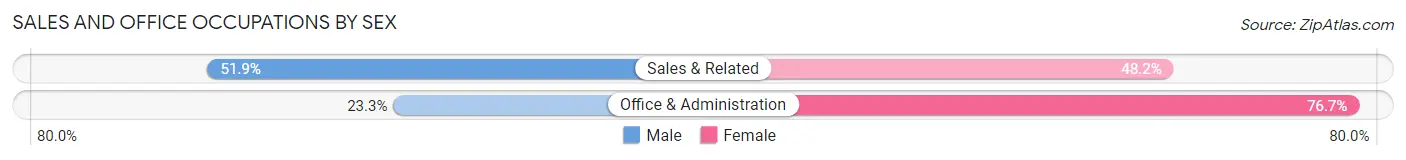
| Occupation | Male | Female |
| Sales & Related | 1,049 (51.8%) | 974 (48.1%) |
| Office & Administration | 579 (23.3%) | 1,907 (76.7%) |
| Total (Category) | 1,628 (36.1%) | 2,881 (63.9%) |
| Total (Overall) | 9,805 (50.0%) | 9,803 (50.0%) |
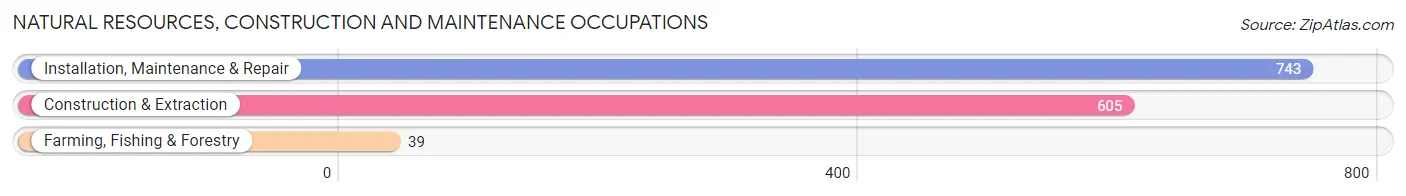
Natural Resources, Construction and Maintenance Occupations
The most common Natural Resources, Construction and Maintenance occupations in Quincy are Installation, Maintenance & Repair (743 | 3.8%), Construction & Extraction (605 | 3.1%), and Farming, Fishing & Forestry (39 | 0.2%).
Natural Resources, Construction and Maintenance Occupations by Sex
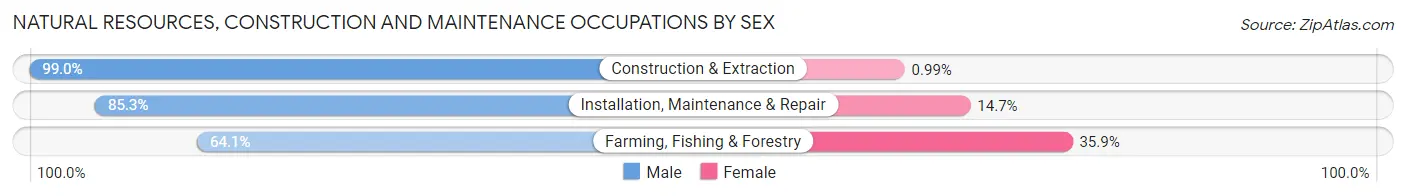
| Occupation | Male | Female |
| Farming, Fishing & Forestry | 25 (64.1%) | 14 (35.9%) |
| Construction & Extraction | 599 (99.0%) | 6 (1.0%) |
| Installation, Maintenance & Repair | 634 (85.3%) | 109 (14.7%) |
| Total (Category) | 1,258 (90.7%) | 129 (9.3%) |
| Total (Overall) | 9,805 (50.0%) | 9,803 (50.0%) |
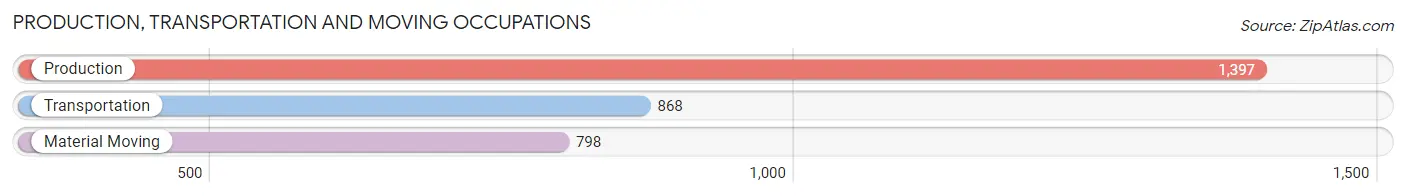
Production, Transportation and Moving Occupations
The most common Production, Transportation and Moving occupations in Quincy are Production (1,397 | 7.1%), Transportation (868 | 4.4%), and Material Moving (798 | 4.1%).
Production, Transportation and Moving Occupations by Sex
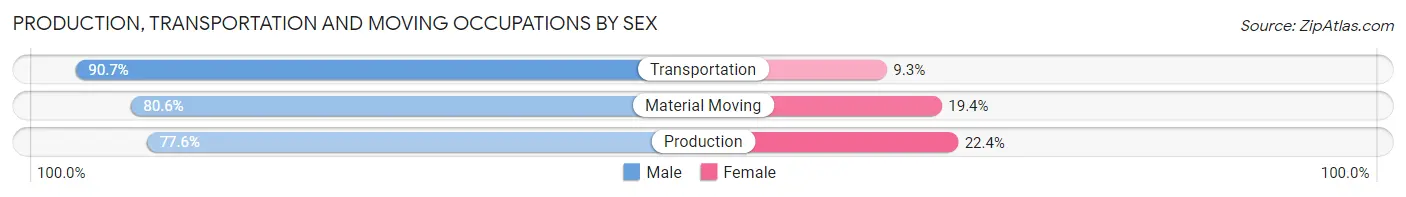
| Occupation | Male | Female |
| Production | 1,084 (77.6%) | 313 (22.4%) |
| Transportation | 787 (90.7%) | 81 (9.3%) |
| Material Moving | 643 (80.6%) | 155 (19.4%) |
| Total (Category) | 2,514 (82.1%) | 549 (17.9%) |
| Total (Overall) | 9,805 (50.0%) | 9,803 (50.0%) |
Employment Industries by Sex in Quincy
Employment Industries in Quincy
The major employment industries in Quincy include Health Care & Social Assistance (3,898 | 19.9%), Manufacturing (2,824 | 14.4%), Retail Trade (2,738 | 14.0%), Educational Services (1,718 | 8.8%), and Accommodation & Food Services (1,461 | 7.4%).
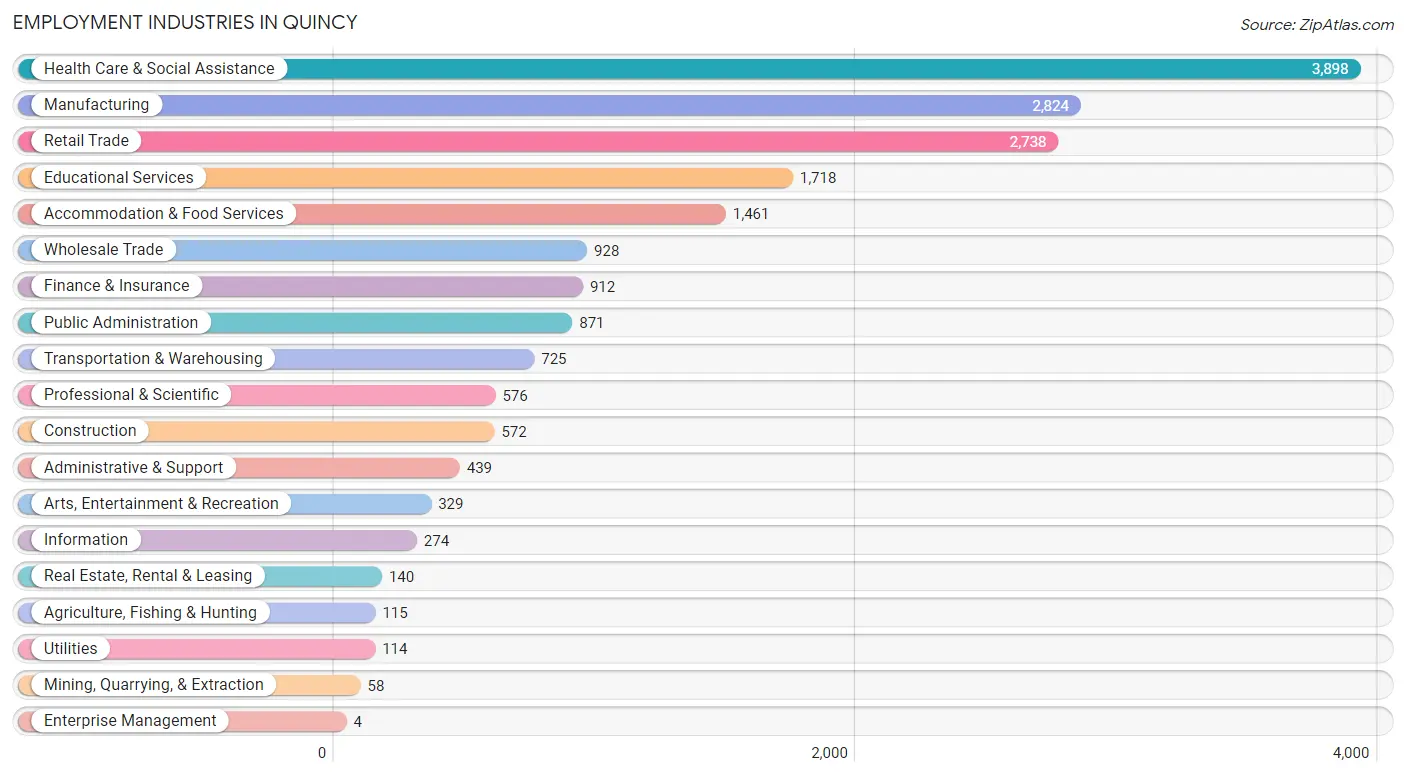
Employment Industries by Sex in Quincy
The Quincy industries that see more men than women are Construction (93.4%), Agriculture, Fishing & Hunting (91.3%), and Mining, Quarrying, & Extraction (89.7%), whereas the industries that tend to have a higher number of women are Enterprise Management (100.0%), Health Care & Social Assistance (84.0%), and Finance & Insurance (76.1%).
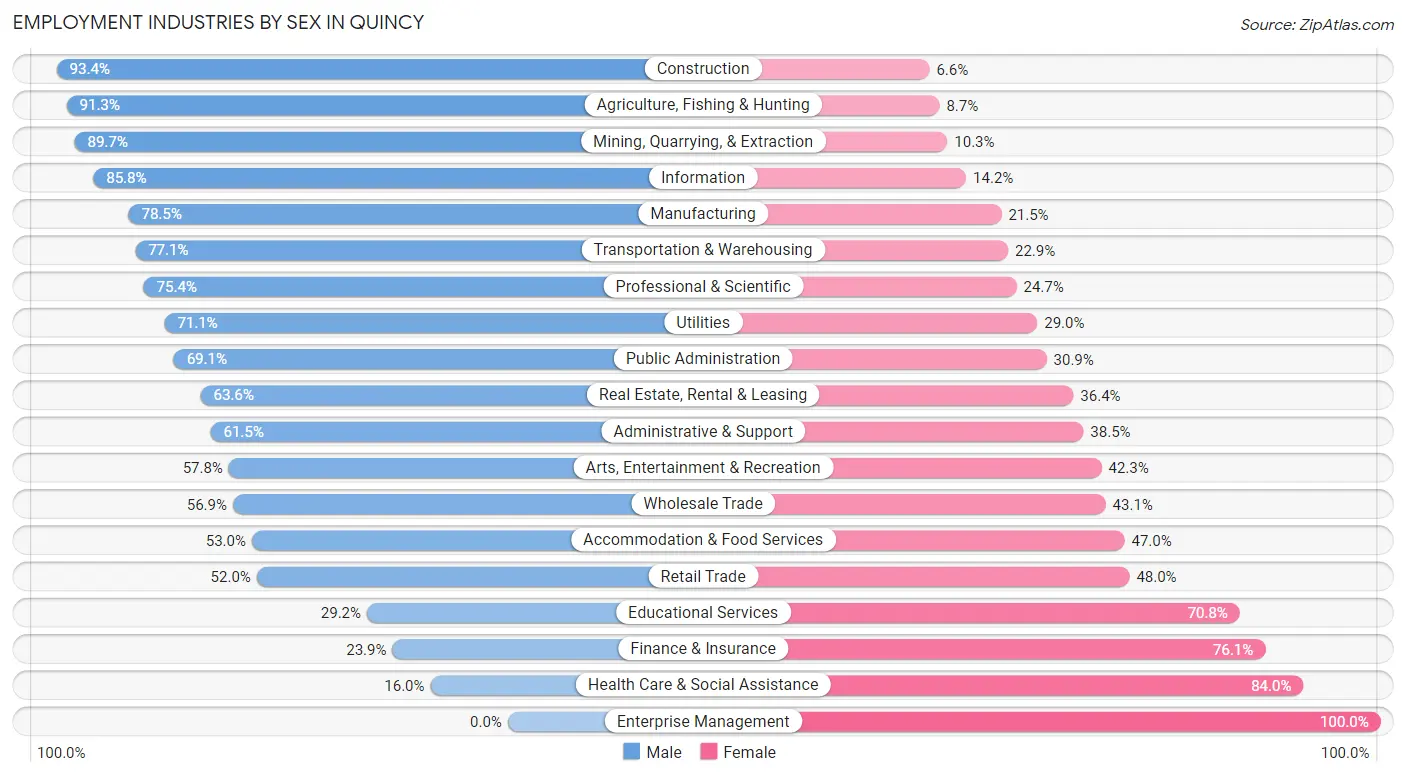
| Industry | Male | Female |
| Agriculture, Fishing & Hunting | 105 (91.3%) | 10 (8.7%) |
| Mining, Quarrying, & Extraction | 52 (89.7%) | 6 (10.3%) |
| Construction | 534 (93.4%) | 38 (6.6%) |
| Manufacturing | 2,216 (78.5%) | 608 (21.5%) |
| Wholesale Trade | 528 (56.9%) | 400 (43.1%) |
| Retail Trade | 1,423 (52.0%) | 1,315 (48.0%) |
| Transportation & Warehousing | 559 (77.1%) | 166 (22.9%) |
| Utilities | 81 (71.1%) | 33 (28.9%) |
| Information | 235 (85.8%) | 39 (14.2%) |
| Finance & Insurance | 218 (23.9%) | 694 (76.1%) |
| Real Estate, Rental & Leasing | 89 (63.6%) | 51 (36.4%) |
| Professional & Scientific | 434 (75.3%) | 142 (24.6%) |
| Enterprise Management | 0 (0.0%) | 4 (100.0%) |
| Administrative & Support | 270 (61.5%) | 169 (38.5%) |
| Educational Services | 501 (29.2%) | 1,217 (70.8%) |
| Health Care & Social Assistance | 624 (16.0%) | 3,274 (84.0%) |
| Arts, Entertainment & Recreation | 190 (57.8%) | 139 (42.2%) |
| Accommodation & Food Services | 774 (53.0%) | 687 (47.0%) |
| Public Administration | 602 (69.1%) | 269 (30.9%) |
| Total | 9,805 (50.0%) | 9,803 (50.0%) |
Education in Quincy
School Enrollment in Quincy
The most common levels of schooling among the 8,361 students in Quincy are elementary school (1,932 | 23.1%), middle school (1,874 | 22.4%), and high school (1,688 | 20.2%).
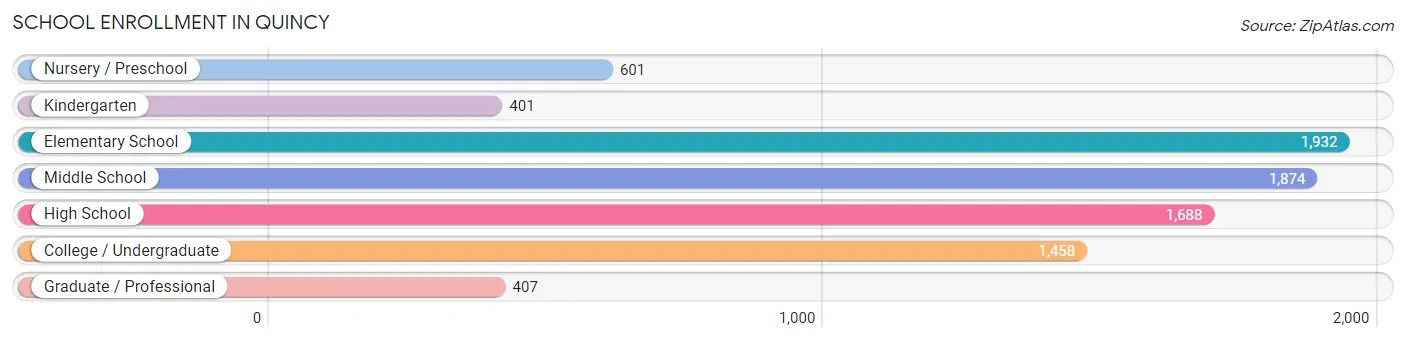
| School Level | # Students | % Students |
| Nursery / Preschool | 601 | 7.2% |
| Kindergarten | 401 | 4.8% |
| Elementary School | 1,932 | 23.1% |
| Middle School | 1,874 | 22.4% |
| High School | 1,688 | 20.2% |
| College / Undergraduate | 1,458 | 17.4% |
| Graduate / Professional | 407 | 4.9% |
| Total | 8,361 | 100.0% |
School Enrollment by Age by Funding Source in Quincy
Out of a total of 8,361 students who are enrolled in schools in Quincy, 1,890 (22.6%) attend a private institution, while the remaining 6,471 (77.4%) are enrolled in public schools. The age group of 20 to 24 year olds has the highest likelihood of being enrolled in private schools, with 291 (42.9% in the age bracket) enrolled. Conversely, the age group of 15 to 17 year olds has the lowest likelihood of being enrolled in a private school, with 932 (87.1% in the age bracket) attending a public institution.
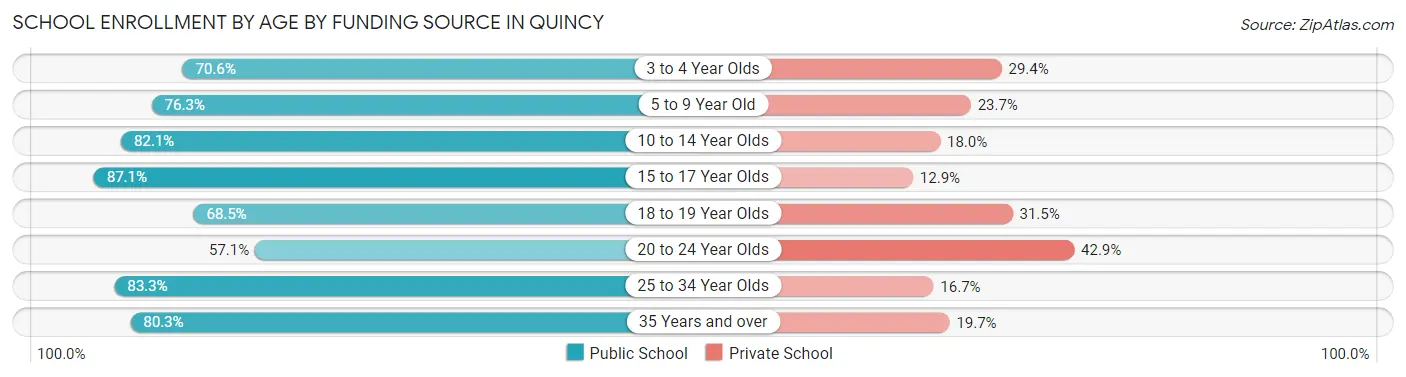
| Age Bracket | Public School | Private School |
| 3 to 4 Year Olds | 288 (70.6%) | 120 (29.4%) |
| 5 to 9 Year Old | 1,826 (76.3%) | 566 (23.7%) |
| 10 to 14 Year Olds | 1,911 (82.1%) | 418 (17.9%) |
| 15 to 17 Year Olds | 932 (87.1%) | 138 (12.9%) |
| 18 to 19 Year Olds | 451 (68.5%) | 207 (31.5%) |
| 20 to 24 Year Olds | 387 (57.1%) | 291 (42.9%) |
| 25 to 34 Year Olds | 354 (83.3%) | 71 (16.7%) |
| 35 Years and over | 322 (80.3%) | 79 (19.7%) |
| Total | 6,471 (77.4%) | 1,890 (22.6%) |
Educational Attainment by Field of Study in Quincy
Business (1,534 | 19.2%), education (1,165 | 14.6%), science & technology (1,089 | 13.7%), arts & humanities (625 | 7.8%), and liberal arts & history (592 | 7.4%) are the most common fields of study among 7,974 individuals in Quincy who have obtained a bachelor's degree or higher.
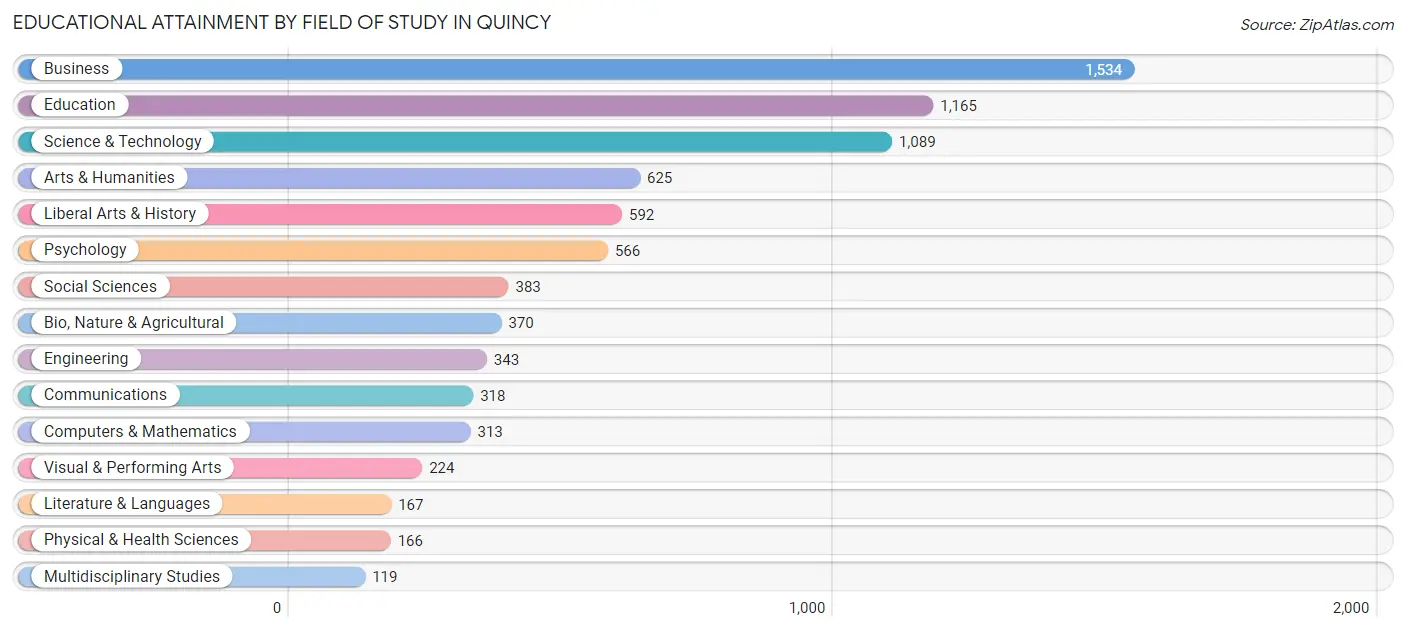
| Field of Study | # Graduates | % Graduates |
| Computers & Mathematics | 313 | 3.9% |
| Bio, Nature & Agricultural | 370 | 4.6% |
| Physical & Health Sciences | 166 | 2.1% |
| Psychology | 566 | 7.1% |
| Social Sciences | 383 | 4.8% |
| Engineering | 343 | 4.3% |
| Multidisciplinary Studies | 119 | 1.5% |
| Science & Technology | 1,089 | 13.7% |
| Business | 1,534 | 19.2% |
| Education | 1,165 | 14.6% |
| Literature & Languages | 167 | 2.1% |
| Liberal Arts & History | 592 | 7.4% |
| Visual & Performing Arts | 224 | 2.8% |
| Communications | 318 | 4.0% |
| Arts & Humanities | 625 | 7.8% |
| Total | 7,974 | 100.0% |
Transportation & Commute in Quincy
Vehicle Availability by Sex in Quincy
The most prevalent vehicle ownership categories in Quincy are males with 2 vehicles (4,252, accounting for 43.7%) and females with 2 vehicles (4,012, making up 44.8%).
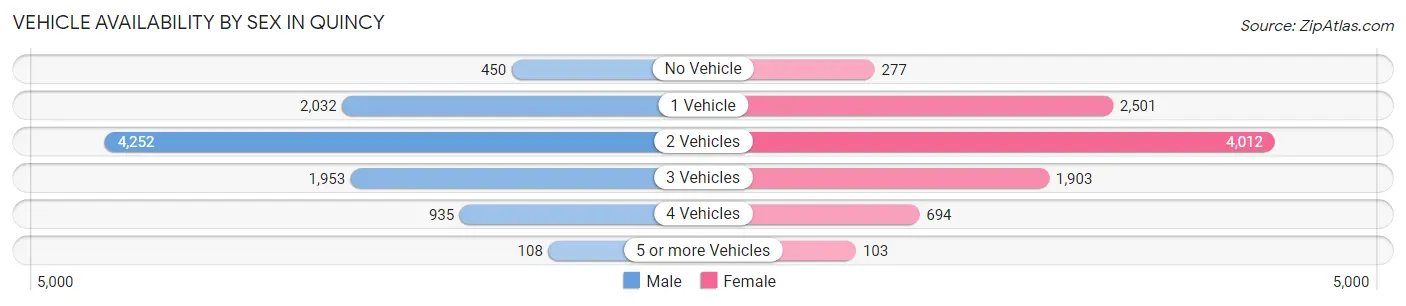
| Vehicles Available | Male | Female |
| No Vehicle | 450 (4.6%) | 277 (2.9%) |
| 1 Vehicle | 2,032 (20.9%) | 2,501 (26.4%) |
| 2 Vehicles | 4,252 (43.7%) | 4,012 (42.3%) |
| 3 Vehicles | 1,953 (20.1%) | 1,903 (20.1%) |
| 4 Vehicles | 935 (9.6%) | 694 (7.3%) |
| 5 or more Vehicles | 108 (1.1%) | 103 (1.1%) |
| Total | 9,730 (100.0%) | 9,490 (100.0%) |
Commute Time in Quincy
The most frequently occuring commute durations in Quincy are 10 to 14 minutes (5,977 commuters, 32.9%), 5 to 9 minutes (5,182 commuters, 28.6%), and 15 to 19 minutes (2,944 commuters, 16.2%).
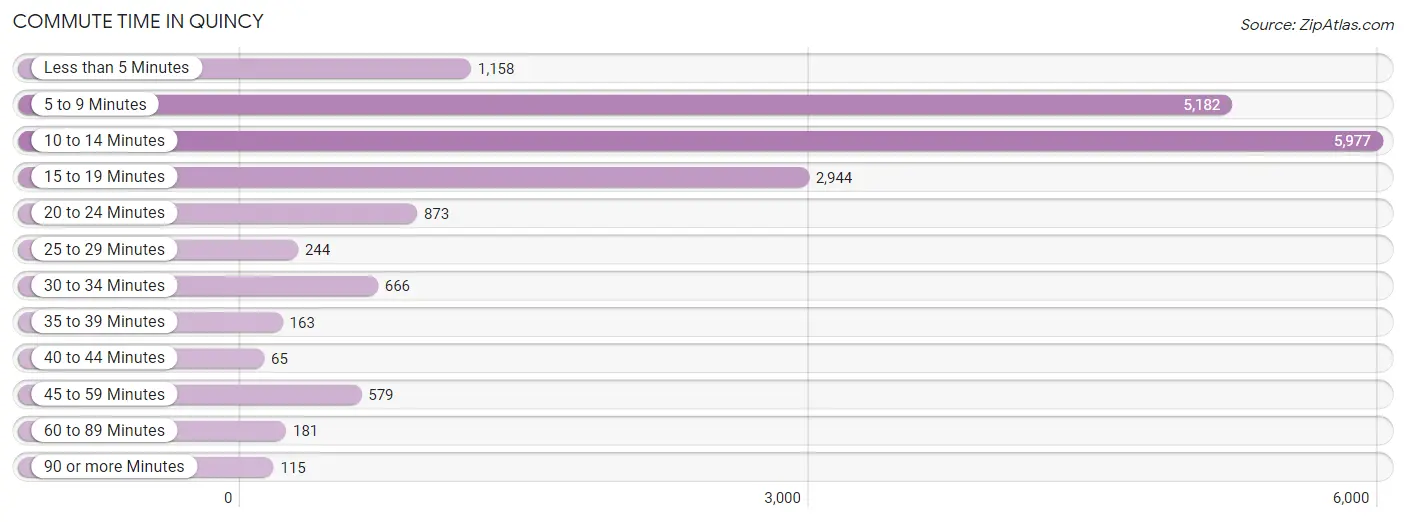
| Commute Time | # Commuters | % Commuters |
| Less than 5 Minutes | 1,158 | 6.4% |
| 5 to 9 Minutes | 5,182 | 28.6% |
| 10 to 14 Minutes | 5,977 | 32.9% |
| 15 to 19 Minutes | 2,944 | 16.2% |
| 20 to 24 Minutes | 873 | 4.8% |
| 25 to 29 Minutes | 244 | 1.3% |
| 30 to 34 Minutes | 666 | 3.7% |
| 35 to 39 Minutes | 163 | 0.9% |
| 40 to 44 Minutes | 65 | 0.4% |
| 45 to 59 Minutes | 579 | 3.2% |
| 60 to 89 Minutes | 181 | 1.0% |
| 90 or more Minutes | 115 | 0.6% |
Commute Time by Sex in Quincy
The most common commute times in Quincy are 10 to 14 minutes (3,173 commuters, 33.5%) for males and 10 to 14 minutes (2,804 commuters, 32.3%) for females.
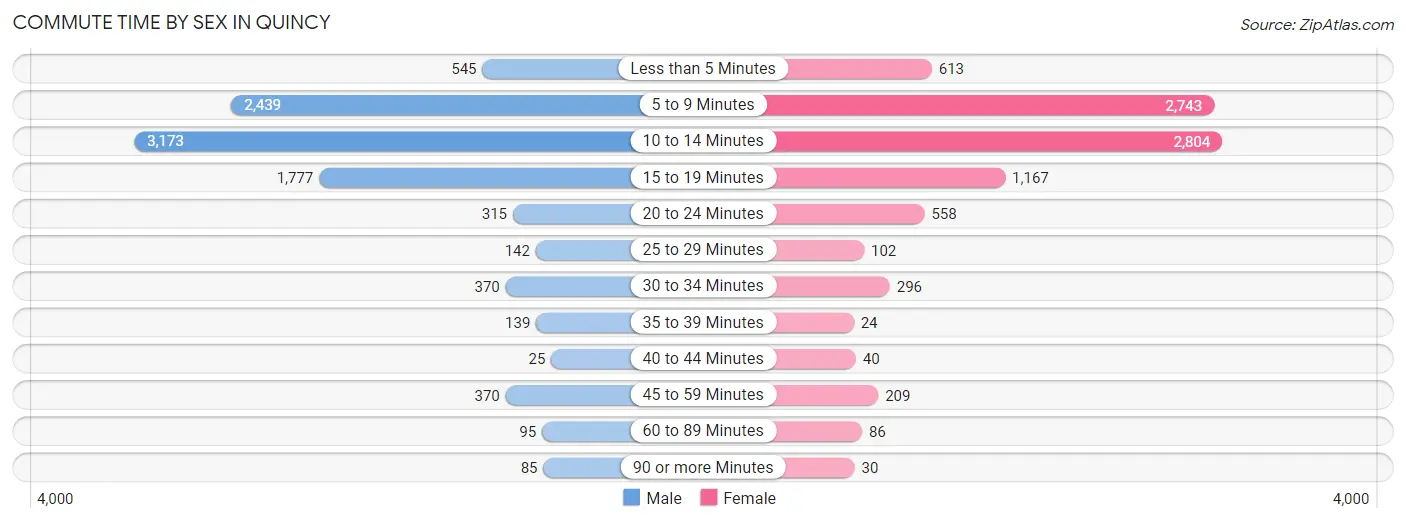
| Commute Time | Male | Female |
| Less than 5 Minutes | 545 (5.8%) | 613 (7.1%) |
| 5 to 9 Minutes | 2,439 (25.7%) | 2,743 (31.6%) |
| 10 to 14 Minutes | 3,173 (33.5%) | 2,804 (32.3%) |
| 15 to 19 Minutes | 1,777 (18.8%) | 1,167 (13.5%) |
| 20 to 24 Minutes | 315 (3.3%) | 558 (6.4%) |
| 25 to 29 Minutes | 142 (1.5%) | 102 (1.2%) |
| 30 to 34 Minutes | 370 (3.9%) | 296 (3.4%) |
| 35 to 39 Minutes | 139 (1.5%) | 24 (0.3%) |
| 40 to 44 Minutes | 25 (0.3%) | 40 (0.5%) |
| 45 to 59 Minutes | 370 (3.9%) | 209 (2.4%) |
| 60 to 89 Minutes | 95 (1.0%) | 86 (1.0%) |
| 90 or more Minutes | 85 (0.9%) | 30 (0.4%) |
Time of Departure to Work by Sex in Quincy
The most frequent times of departure to work in Quincy are 7:30 AM to 7:59 AM (1,284, 13.6%) for males and 7:30 AM to 7:59 AM (1,845, 21.3%) for females.
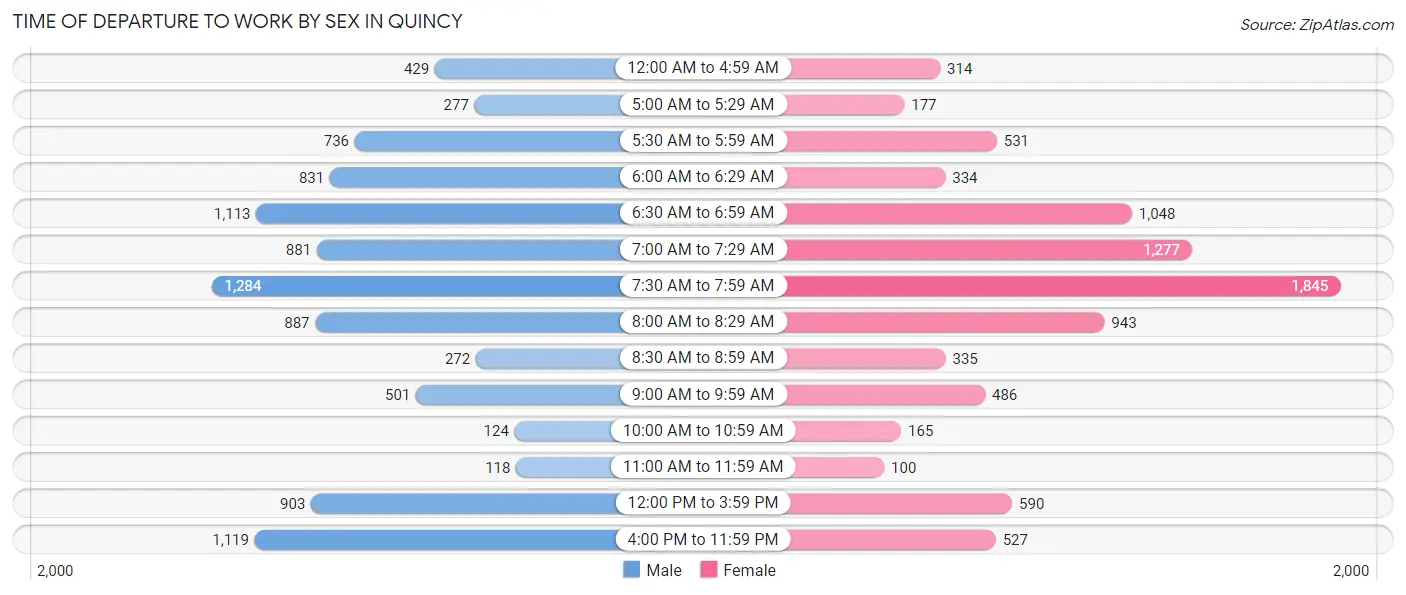
| Time of Departure | Male | Female |
| 12:00 AM to 4:59 AM | 429 (4.5%) | 314 (3.6%) |
| 5:00 AM to 5:29 AM | 277 (2.9%) | 177 (2.0%) |
| 5:30 AM to 5:59 AM | 736 (7.8%) | 531 (6.1%) |
| 6:00 AM to 6:29 AM | 831 (8.8%) | 334 (3.8%) |
| 6:30 AM to 6:59 AM | 1,113 (11.7%) | 1,048 (12.1%) |
| 7:00 AM to 7:29 AM | 881 (9.3%) | 1,277 (14.7%) |
| 7:30 AM to 7:59 AM | 1,284 (13.6%) | 1,845 (21.3%) |
| 8:00 AM to 8:29 AM | 887 (9.4%) | 943 (10.9%) |
| 8:30 AM to 8:59 AM | 272 (2.9%) | 335 (3.9%) |
| 9:00 AM to 9:59 AM | 501 (5.3%) | 486 (5.6%) |
| 10:00 AM to 10:59 AM | 124 (1.3%) | 165 (1.9%) |
| 11:00 AM to 11:59 AM | 118 (1.3%) | 100 (1.1%) |
| 12:00 PM to 3:59 PM | 903 (9.5%) | 590 (6.8%) |
| 4:00 PM to 11:59 PM | 1,119 (11.8%) | 527 (6.1%) |
| Total | 9,475 (100.0%) | 8,672 (100.0%) |
Housing Occupancy in Quincy
Occupancy by Ownership in Quincy
Of the total 17,373 dwellings in Quincy, owner-occupied units account for 11,287 (65.0%), while renter-occupied units make up 6,086 (35.0%).
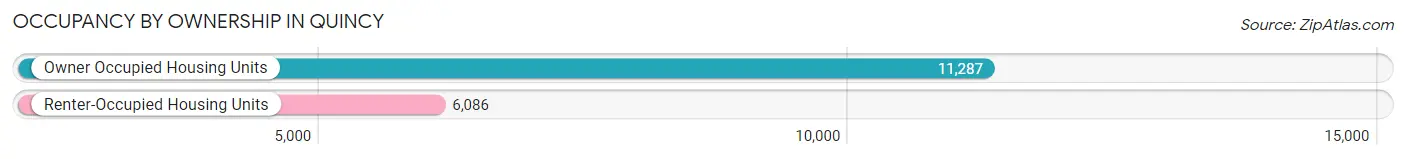
| Occupancy | # Housing Units | % Housing Units |
| Owner Occupied Housing Units | 11,287 | 65.0% |
| Renter-Occupied Housing Units | 6,086 | 35.0% |
| Total Occupied Housing Units | 17,373 | 100.0% |
Occupancy by Household Size in Quincy
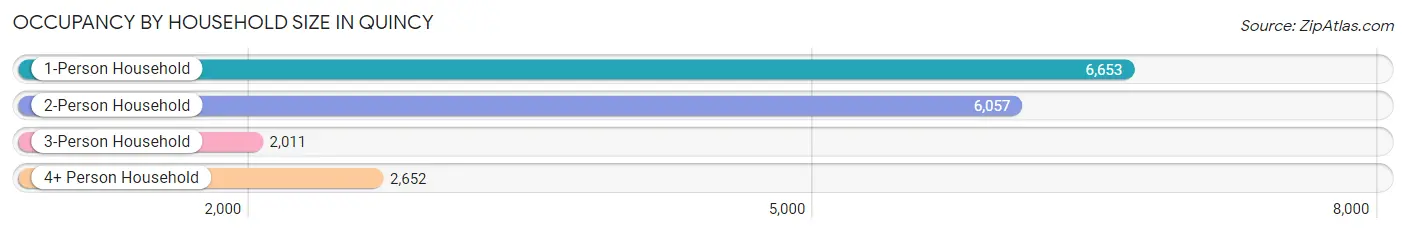
| Household Size | # Housing Units | % Housing Units |
| 1-Person Household | 6,653 | 38.3% |
| 2-Person Household | 6,057 | 34.9% |
| 3-Person Household | 2,011 | 11.6% |
| 4+ Person Household | 2,652 | 15.3% |
| Total Housing Units | 17,373 | 100.0% |
Occupancy by Ownership by Household Size in Quincy
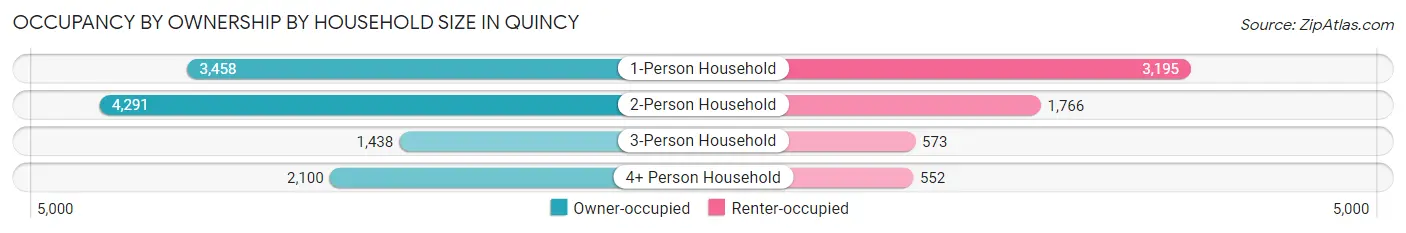
| Household Size | Owner-occupied | Renter-occupied |
| 1-Person Household | 3,458 (52.0%) | 3,195 (48.0%) |
| 2-Person Household | 4,291 (70.8%) | 1,766 (29.2%) |
| 3-Person Household | 1,438 (71.5%) | 573 (28.5%) |
| 4+ Person Household | 2,100 (79.2%) | 552 (20.8%) |
| Total Housing Units | 11,287 (65.0%) | 6,086 (35.0%) |
Occupancy by Educational Attainment in Quincy
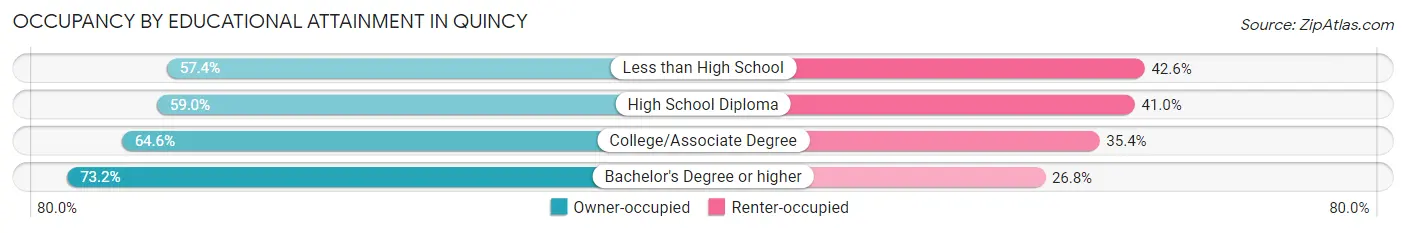
| Household Size | Owner-occupied | Renter-occupied |
| Less than High School | 683 (57.4%) | 506 (42.6%) |
| High School Diploma | 2,912 (59.0%) | 2,022 (41.0%) |
| College/Associate Degree | 4,082 (64.6%) | 2,238 (35.4%) |
| Bachelor's Degree or higher | 3,610 (73.2%) | 1,320 (26.8%) |
Occupancy by Age of Householder in Quincy
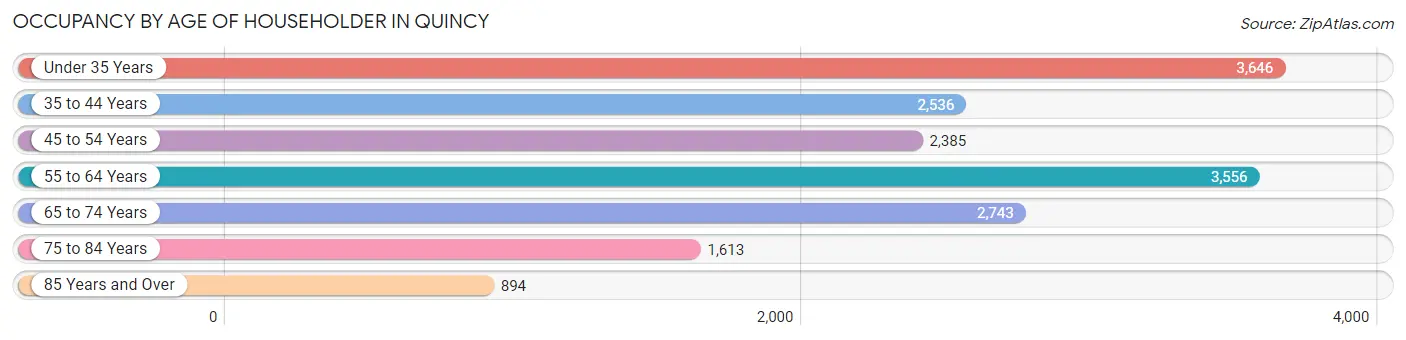
| Age Bracket | # Households | % Households |
| Under 35 Years | 3,646 | 21.0% |
| 35 to 44 Years | 2,536 | 14.6% |
| 45 to 54 Years | 2,385 | 13.7% |
| 55 to 64 Years | 3,556 | 20.5% |
| 65 to 74 Years | 2,743 | 15.8% |
| 75 to 84 Years | 1,613 | 9.3% |
| 85 Years and Over | 894 | 5.1% |
| Total | 17,373 | 100.0% |
Housing Finances in Quincy
Median Income by Occupancy in Quincy
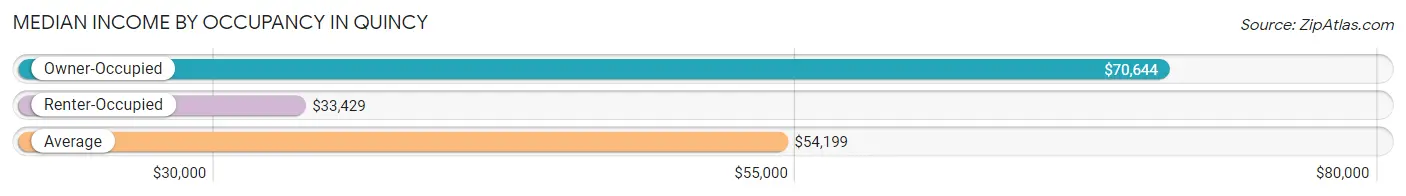
| Occupancy Type | # Households | Median Income |
| Owner-Occupied | 11,287 (65.0%) | $70,644 |
| Renter-Occupied | 6,086 (35.0%) | $33,429 |
| Average | 17,373 (100.0%) | $54,199 |
Occupancy by Householder Income Bracket in Quincy
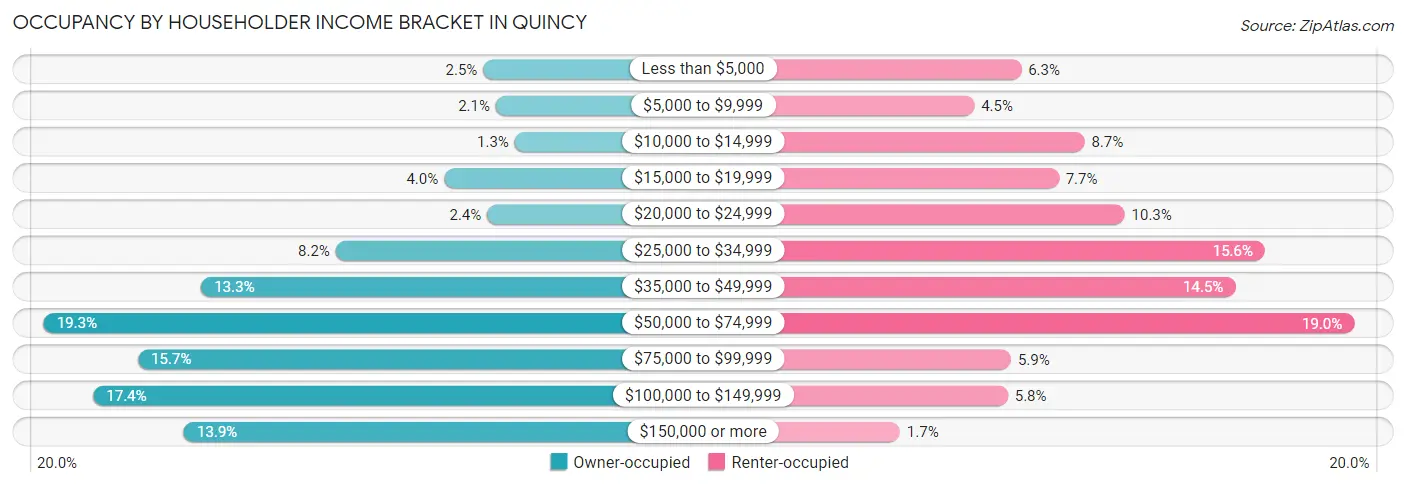
| Income Bracket | Owner-occupied | Renter-occupied |
| Less than $5,000 | 286 (2.5%) | 384 (6.3%) |
| $5,000 to $9,999 | 231 (2.1%) | 275 (4.5%) |
| $10,000 to $14,999 | 150 (1.3%) | 531 (8.7%) |
| $15,000 to $19,999 | 454 (4.0%) | 471 (7.7%) |
| $20,000 to $24,999 | 269 (2.4%) | 624 (10.2%) |
| $25,000 to $34,999 | 920 (8.2%) | 949 (15.6%) |
| $35,000 to $49,999 | 1,498 (13.3%) | 880 (14.5%) |
| $50,000 to $74,999 | 2,175 (19.3%) | 1,156 (19.0%) |
| $75,000 to $99,999 | 1,770 (15.7%) | 360 (5.9%) |
| $100,000 to $149,999 | 1,962 (17.4%) | 353 (5.8%) |
| $150,000 or more | 1,572 (13.9%) | 103 (1.7%) |
| Total | 11,287 (100.0%) | 6,086 (100.0%) |
Monthly Housing Cost Tiers in Quincy
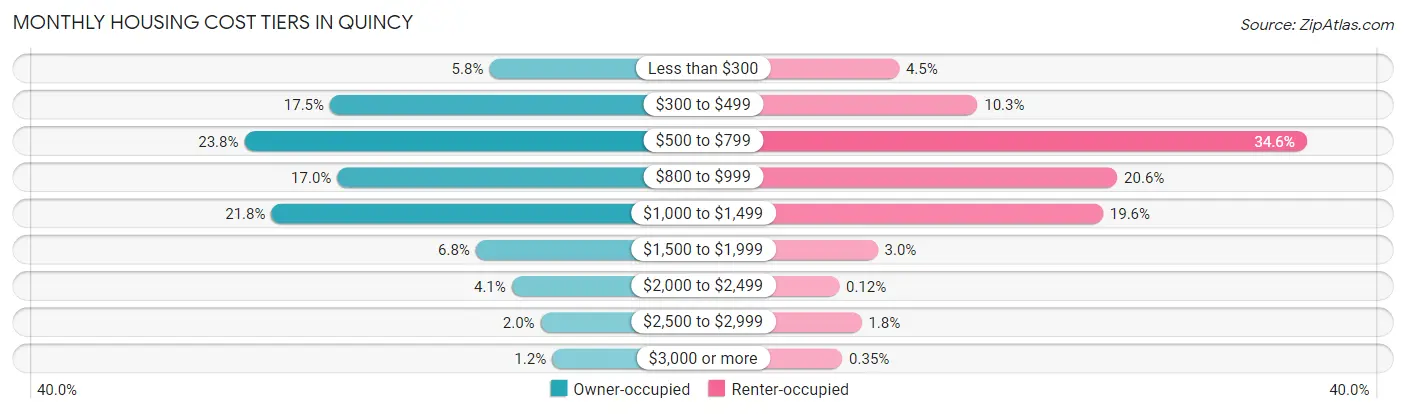
| Monthly Cost | Owner-occupied | Renter-occupied |
| Less than $300 | 652 (5.8%) | 276 (4.5%) |
| $300 to $499 | 1,978 (17.5%) | 627 (10.3%) |
| $500 to $799 | 2,688 (23.8%) | 2,103 (34.5%) |
| $800 to $999 | 1,916 (17.0%) | 1,254 (20.6%) |
| $1,000 to $1,499 | 2,464 (21.8%) | 1,190 (19.6%) |
| $1,500 to $1,999 | 765 (6.8%) | 180 (3.0%) |
| $2,000 to $2,499 | 466 (4.1%) | 7 (0.1%) |
| $2,500 to $2,999 | 227 (2.0%) | 108 (1.8%) |
| $3,000 or more | 131 (1.2%) | 21 (0.4%) |
| Total | 11,287 (100.0%) | 6,086 (100.0%) |
Physical Housing Characteristics in Quincy
Housing Structures in Quincy
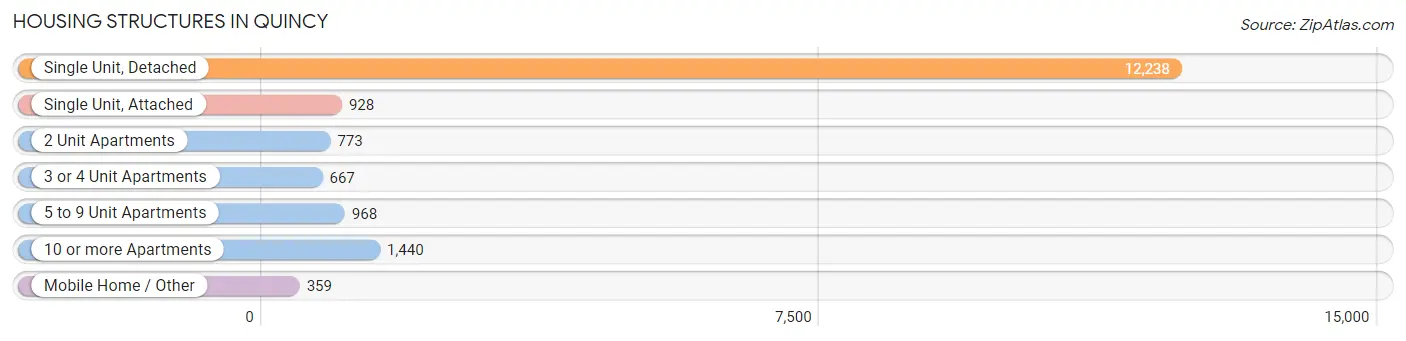
| Structure Type | # Housing Units | % Housing Units |
| Single Unit, Detached | 12,238 | 70.4% |
| Single Unit, Attached | 928 | 5.3% |
| 2 Unit Apartments | 773 | 4.4% |
| 3 or 4 Unit Apartments | 667 | 3.8% |
| 5 to 9 Unit Apartments | 968 | 5.6% |
| 10 or more Apartments | 1,440 | 8.3% |
| Mobile Home / Other | 359 | 2.1% |
| Total | 17,373 | 100.0% |
Housing Structures by Occupancy in Quincy
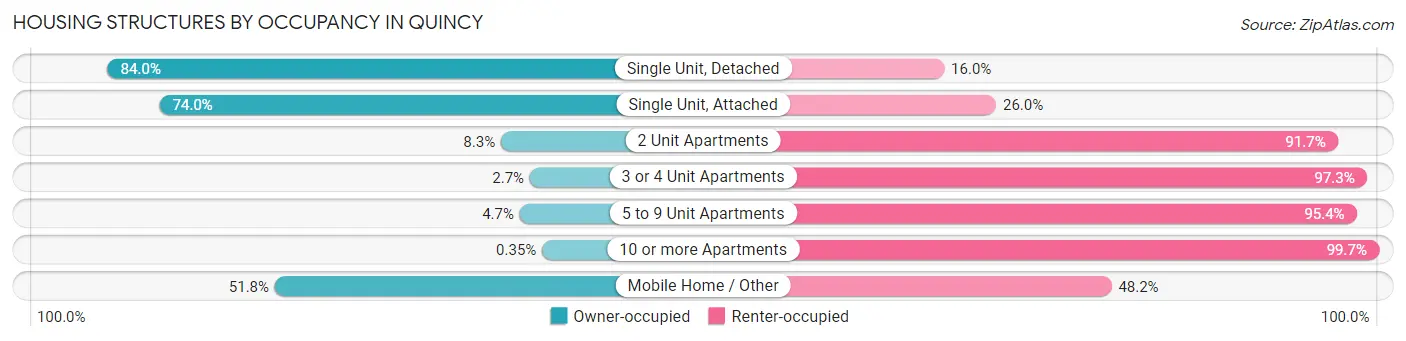
| Structure Type | Owner-occupied | Renter-occupied |
| Single Unit, Detached | 10,282 (84.0%) | 1,956 (16.0%) |
| Single Unit, Attached | 687 (74.0%) | 241 (26.0%) |
| 2 Unit Apartments | 64 (8.3%) | 709 (91.7%) |
| 3 or 4 Unit Apartments | 18 (2.7%) | 649 (97.3%) |
| 5 to 9 Unit Apartments | 45 (4.6%) | 923 (95.4%) |
| 10 or more Apartments | 5 (0.4%) | 1,435 (99.7%) |
| Mobile Home / Other | 186 (51.8%) | 173 (48.2%) |
| Total | 11,287 (65.0%) | 6,086 (35.0%) |
Housing Structures by Number of Rooms in Quincy
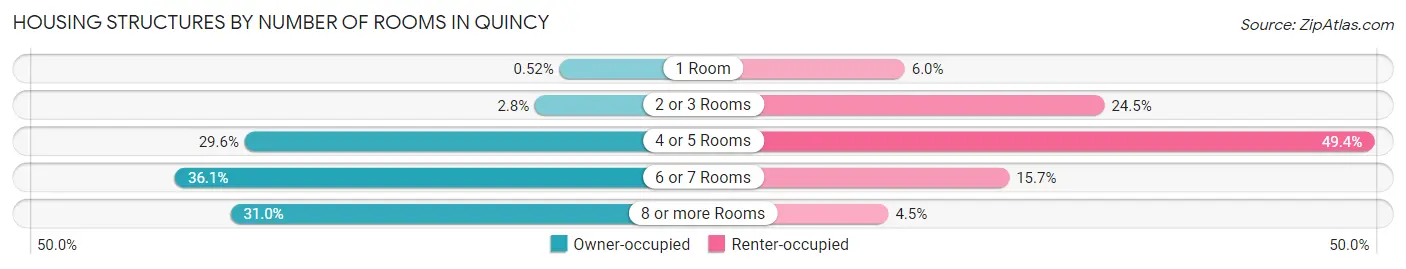
| Number of Rooms | Owner-occupied | Renter-occupied |
| 1 Room | 59 (0.5%) | 365 (6.0%) |
| 2 or 3 Rooms | 315 (2.8%) | 1,489 (24.5%) |
| 4 or 5 Rooms | 3,346 (29.6%) | 3,006 (49.4%) |
| 6 or 7 Rooms | 4,072 (36.1%) | 953 (15.7%) |
| 8 or more Rooms | 3,495 (31.0%) | 273 (4.5%) |
| Total | 11,287 (100.0%) | 6,086 (100.0%) |
Housing Structure by Heating Type in Quincy
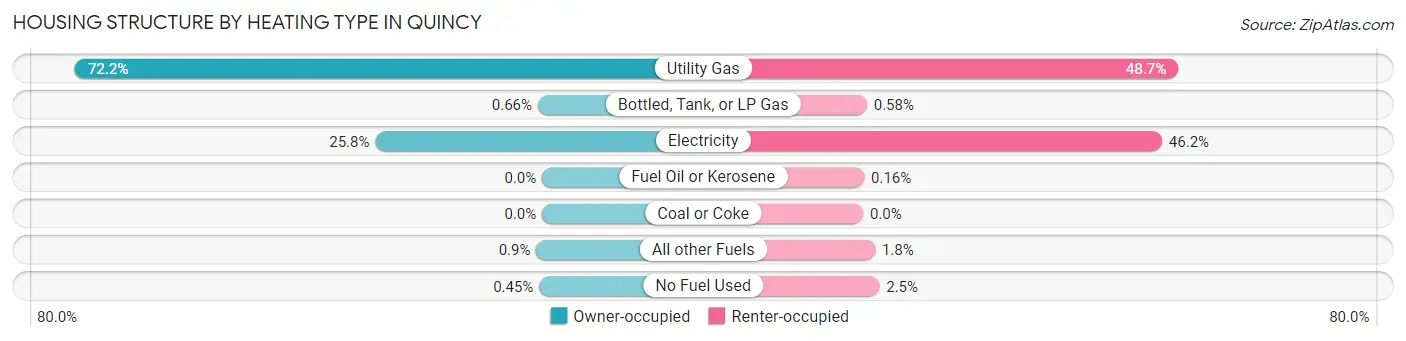
| Heating Type | Owner-occupied | Renter-occupied |
| Utility Gas | 8,150 (72.2%) | 2,964 (48.7%) |
| Bottled, Tank, or LP Gas | 74 (0.7%) | 35 (0.6%) |
| Electricity | 2,910 (25.8%) | 2,812 (46.2%) |
| Fuel Oil or Kerosene | 0 (0.0%) | 10 (0.2%) |
| Coal or Coke | 0 (0.0%) | 0 (0.0%) |
| All other Fuels | 102 (0.9%) | 112 (1.8%) |
| No Fuel Used | 51 (0.4%) | 153 (2.5%) |
| Total | 11,287 (100.0%) | 6,086 (100.0%) |
Household Vehicle Usage in Quincy
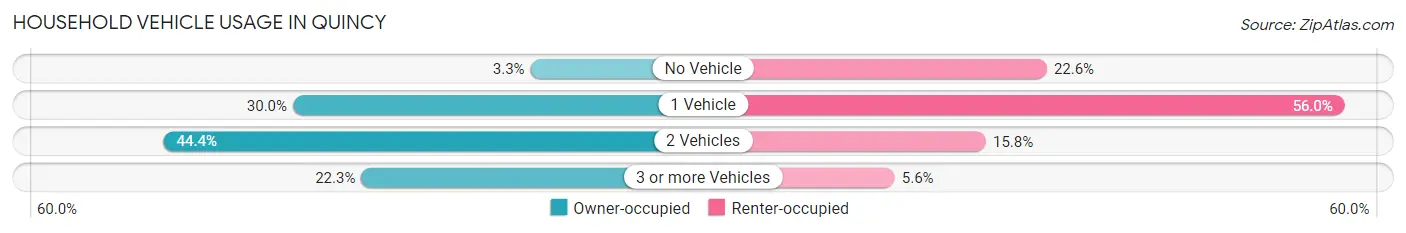
| Vehicles per Household | Owner-occupied | Renter-occupied |
| No Vehicle | 377 (3.3%) | 1,377 (22.6%) |
| 1 Vehicle | 3,380 (29.9%) | 3,407 (56.0%) |
| 2 Vehicles | 5,014 (44.4%) | 962 (15.8%) |
| 3 or more Vehicles | 2,516 (22.3%) | 340 (5.6%) |
| Total | 11,287 (100.0%) | 6,086 (100.0%) |
Real Estate & Mortgages in Quincy
Real Estate and Mortgage Overview in Quincy
| Characteristic | Without Mortgage | With Mortgage |
| Housing Units | 5,016 | 6,271 |
| Median Property Value | $140,400 | $141,800 |
| Median Household Income | $53,415 | $930 |
| Monthly Housing Costs | $507 | $131 |
| Real Estate Taxes | $2,296 | $79 |
Property Value by Mortgage Status in Quincy
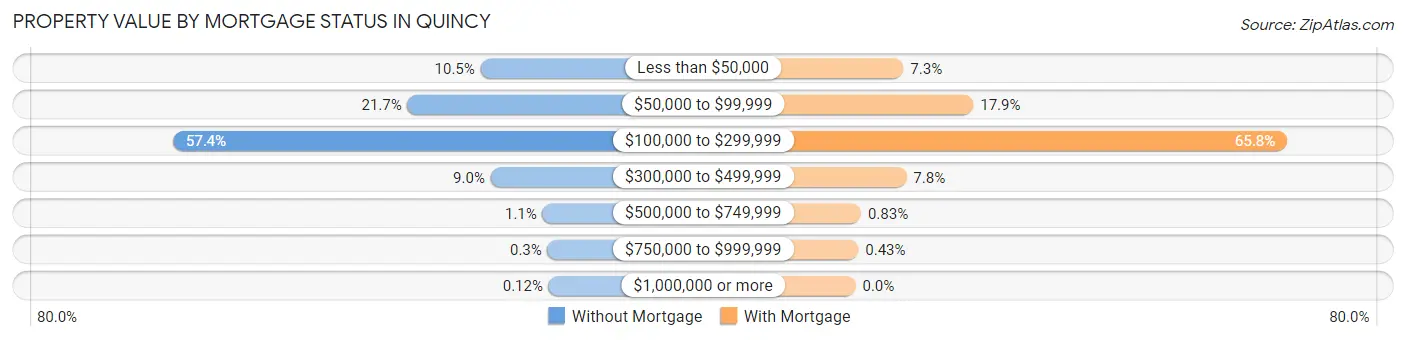
| Property Value | Without Mortgage | With Mortgage |
| Less than $50,000 | 527 (10.5%) | 457 (7.3%) |
| $50,000 to $99,999 | 1,086 (21.6%) | 1,125 (17.9%) |
| $100,000 to $299,999 | 2,879 (57.4%) | 4,124 (65.8%) |
| $300,000 to $499,999 | 450 (9.0%) | 486 (7.7%) |
| $500,000 to $749,999 | 53 (1.1%) | 52 (0.8%) |
| $750,000 to $999,999 | 15 (0.3%) | 27 (0.4%) |
| $1,000,000 or more | 6 (0.1%) | 0 (0.0%) |
| Total | 5,016 (100.0%) | 6,271 (100.0%) |
Household Income by Mortgage Status in Quincy
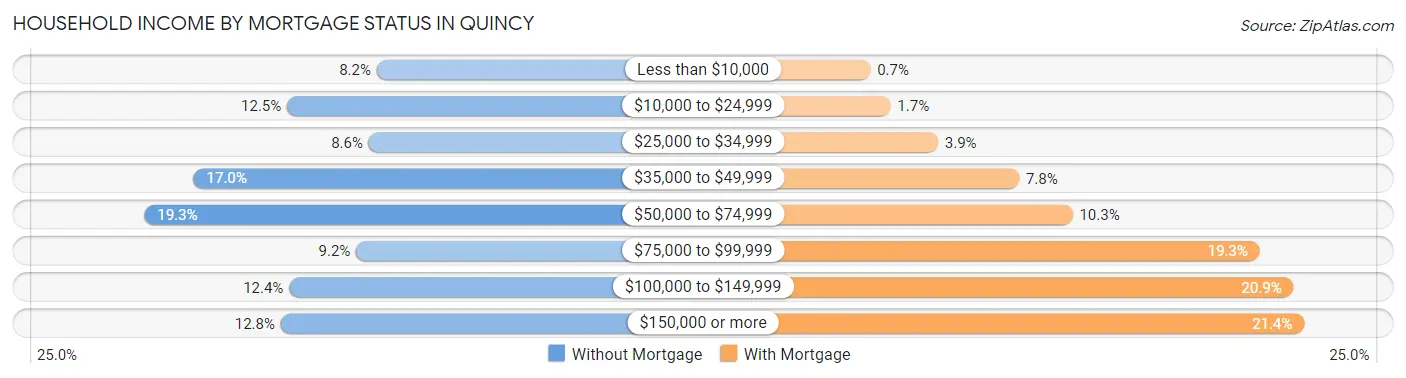
| Household Income | Without Mortgage | With Mortgage |
| Less than $10,000 | 413 (8.2%) | 44 (0.7%) |
| $10,000 to $24,999 | 627 (12.5%) | 104 (1.7%) |
| $25,000 to $34,999 | 432 (8.6%) | 246 (3.9%) |
| $35,000 to $49,999 | 850 (17.0%) | 488 (7.8%) |
| $50,000 to $74,999 | 968 (19.3%) | 648 (10.3%) |
| $75,000 to $99,999 | 462 (9.2%) | 1,207 (19.3%) |
| $100,000 to $149,999 | 622 (12.4%) | 1,308 (20.9%) |
| $150,000 or more | 642 (12.8%) | 1,340 (21.4%) |
| Total | 5,016 (100.0%) | 6,271 (100.0%) |
Property Value to Household Income Ratio in Quincy
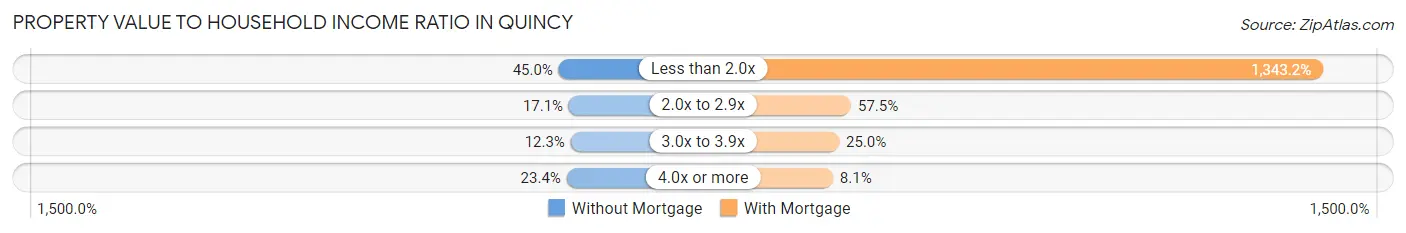
| Value-to-Income Ratio | Without Mortgage | With Mortgage |
| Less than 2.0x | 2,255 (45.0%) | 84,234 (1,343.2%) |
| 2.0x to 2.9x | 857 (17.1%) | 3,606 (57.5%) |
| 3.0x to 3.9x | 617 (12.3%) | 1,568 (25.0%) |
| 4.0x or more | 1,173 (23.4%) | 510 (8.1%) |
| Total | 5,016 (100.0%) | 6,271 (100.0%) |
Real Estate Taxes by Mortgage Status in Quincy
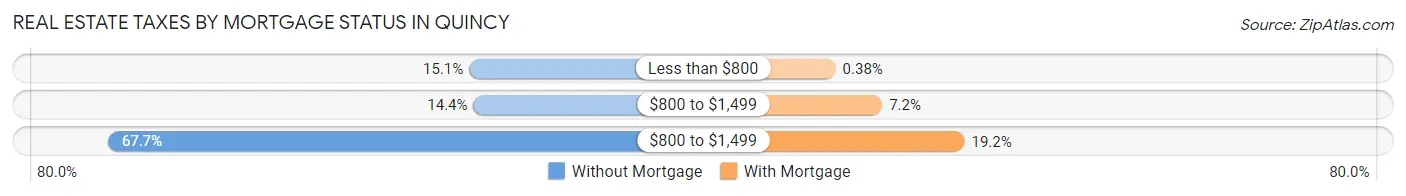
| Property Taxes | Without Mortgage | With Mortgage |
| Less than $800 | 755 (15.0%) | 24 (0.4%) |
| $800 to $1,499 | 724 (14.4%) | 451 (7.2%) |
| $800 to $1,499 | 3,395 (67.7%) | 1,205 (19.2%) |
| Total | 5,016 (100.0%) | 6,271 (100.0%) |
Health & Disability in Quincy
Health Insurance Coverage by Age in Quincy
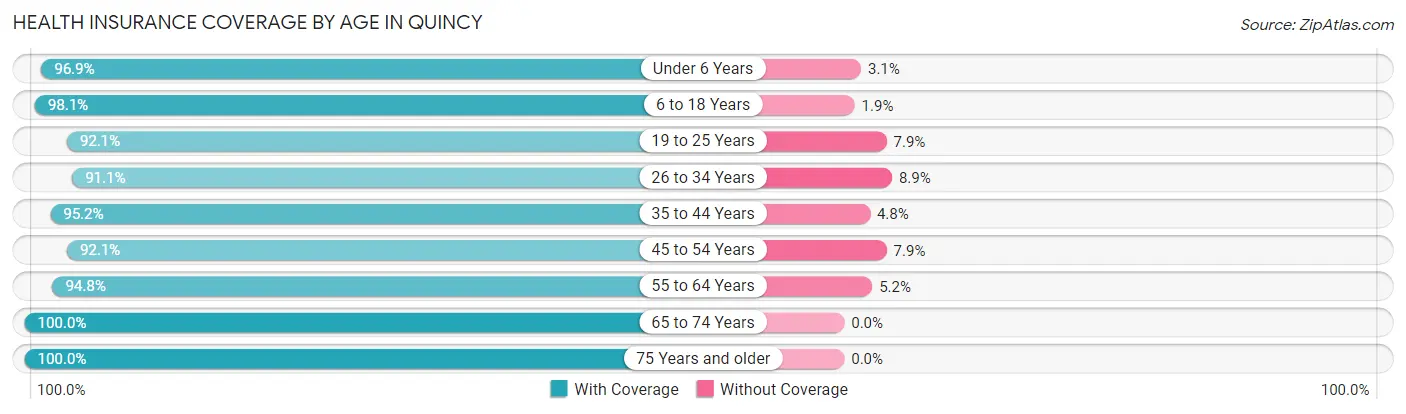
| Age Bracket | With Coverage | Without Coverage |
| Under 6 Years | 2,733 (96.9%) | 88 (3.1%) |
| 6 to 18 Years | 5,851 (98.1%) | 115 (1.9%) |
| 19 to 25 Years | 3,188 (92.1%) | 273 (7.9%) |
| 26 to 34 Years | 4,378 (91.1%) | 427 (8.9%) |
| 35 to 44 Years | 4,472 (95.2%) | 225 (4.8%) |
| 45 to 54 Years | 3,833 (92.1%) | 329 (7.9%) |
| 55 to 64 Years | 5,038 (94.8%) | 277 (5.2%) |
| 65 to 74 Years | 4,074 (100.0%) | 0 (0.0%) |
| 75 Years and older | 3,250 (100.0%) | 0 (0.0%) |
| Total | 36,817 (95.5%) | 1,734 (4.5%) |
Health Insurance Coverage by Citizenship Status in Quincy
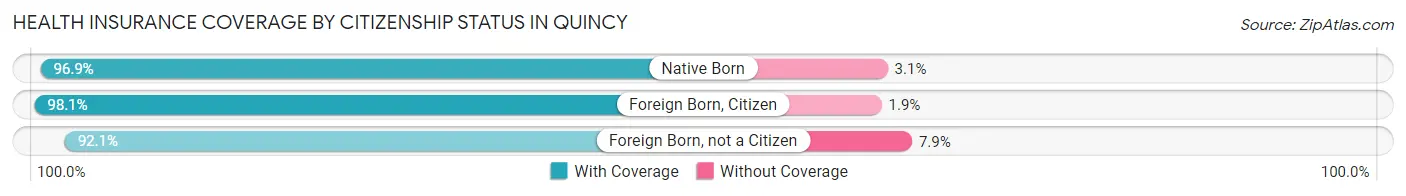
| Citizenship Status | With Coverage | Without Coverage |
| Native Born | 2,733 (96.9%) | 88 (3.1%) |
| Foreign Born, Citizen | 5,851 (98.1%) | 115 (1.9%) |
| Foreign Born, not a Citizen | 3,188 (92.1%) | 273 (7.9%) |
Health Insurance Coverage by Household Income in Quincy
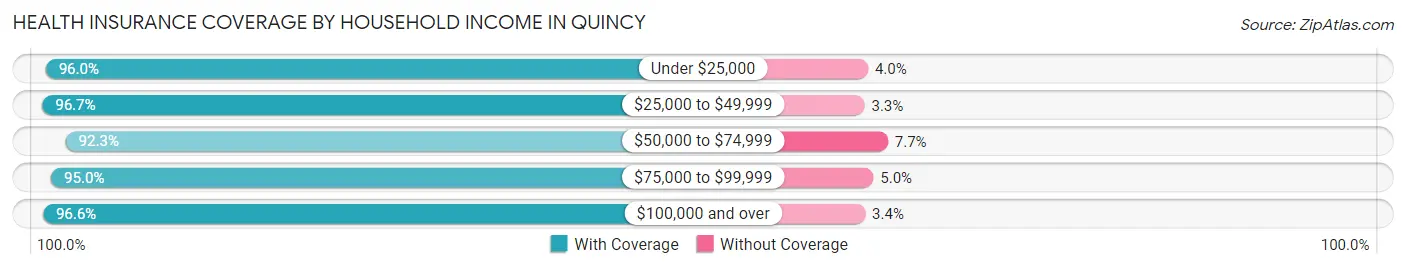
| Household Income | With Coverage | Without Coverage |
| Under $25,000 | 5,380 (96.0%) | 222 (4.0%) |
| $25,000 to $49,999 | 7,592 (96.7%) | 261 (3.3%) |
| $50,000 to $74,999 | 6,364 (92.3%) | 530 (7.7%) |
| $75,000 to $99,999 | 5,380 (95.0%) | 282 (5.0%) |
| $100,000 and over | 11,692 (96.6%) | 417 (3.4%) |
Public vs Private Health Insurance Coverage by Age in Quincy
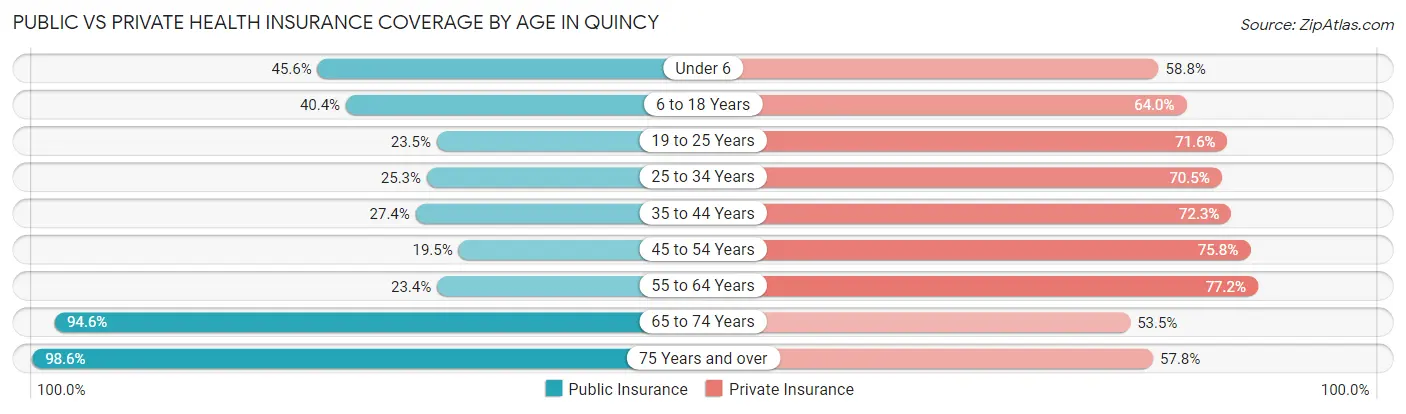
| Age Bracket | Public Insurance | Private Insurance |
| Under 6 | 1,287 (45.6%) | 1,659 (58.8%) |
| 6 to 18 Years | 2,407 (40.4%) | 3,815 (63.9%) |
| 19 to 25 Years | 813 (23.5%) | 2,477 (71.6%) |
| 25 to 34 Years | 1,217 (25.3%) | 3,386 (70.5%) |
| 35 to 44 Years | 1,288 (27.4%) | 3,394 (72.3%) |
| 45 to 54 Years | 810 (19.5%) | 3,153 (75.8%) |
| 55 to 64 Years | 1,246 (23.4%) | 4,103 (77.2%) |
| 65 to 74 Years | 3,852 (94.6%) | 2,181 (53.5%) |
| 75 Years and over | 3,204 (98.6%) | 1,878 (57.8%) |
| Total | 16,124 (41.8%) | 26,046 (67.6%) |
Disability Status by Sex by Age in Quincy
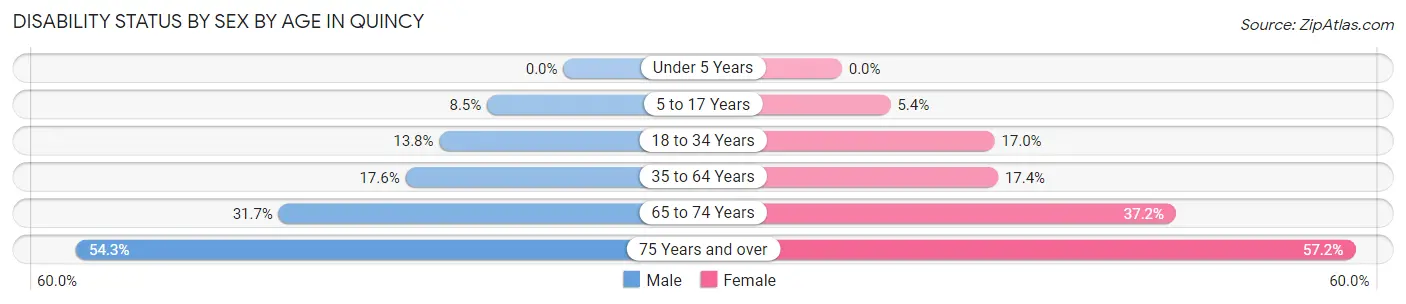
| Age Bracket | Male | Female |
| Under 5 Years | 0 (0.0%) | 0 (0.0%) |
| 5 to 17 Years | 237 (8.5%) | 169 (5.4%) |
| 18 to 34 Years | 628 (13.8%) | 716 (17.0%) |
| 35 to 64 Years | 1,212 (17.6%) | 1,266 (17.4%) |
| 65 to 74 Years | 613 (31.7%) | 796 (37.2%) |
| 75 Years and over | 692 (54.3%) | 1,129 (57.2%) |
Disability Class by Sex by Age in Quincy
Disability Class: Hearing Difficulty
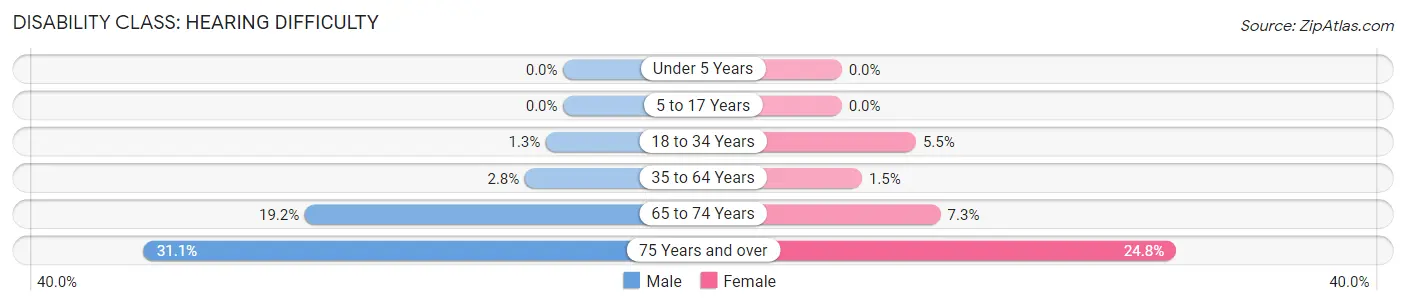
| Age Bracket | Male | Female |
| Under 5 Years | 0 (0.0%) | 0 (0.0%) |
| 5 to 17 Years | 0 (0.0%) | 0 (0.0%) |
| 18 to 34 Years | 58 (1.3%) | 232 (5.5%) |
| 35 to 64 Years | 196 (2.8%) | 109 (1.5%) |
| 65 to 74 Years | 371 (19.2%) | 157 (7.3%) |
| 75 Years and over | 397 (31.1%) | 490 (24.8%) |
Disability Class: Vision Difficulty
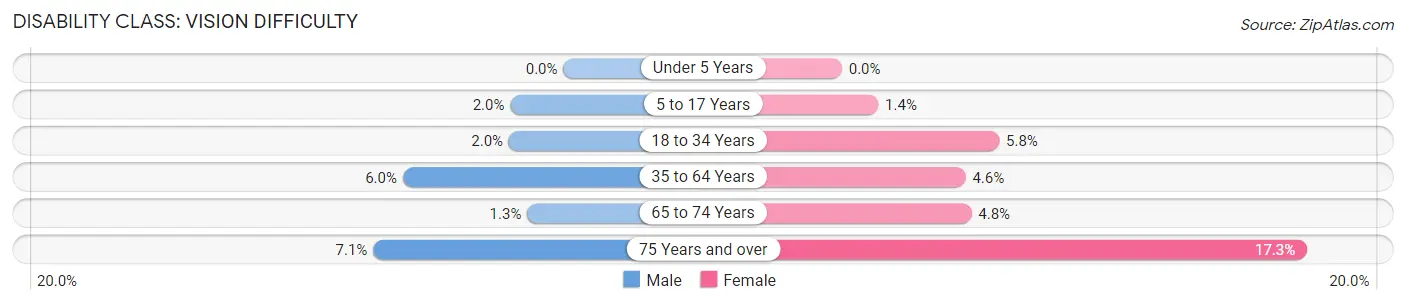
| Age Bracket | Male | Female |
| Under 5 Years | 0 (0.0%) | 0 (0.0%) |
| 5 to 17 Years | 55 (2.0%) | 42 (1.3%) |
| 18 to 34 Years | 92 (2.0%) | 246 (5.8%) |
| 35 to 64 Years | 411 (6.0%) | 334 (4.6%) |
| 65 to 74 Years | 26 (1.3%) | 103 (4.8%) |
| 75 Years and over | 90 (7.1%) | 341 (17.3%) |
Disability Class: Cognitive Difficulty
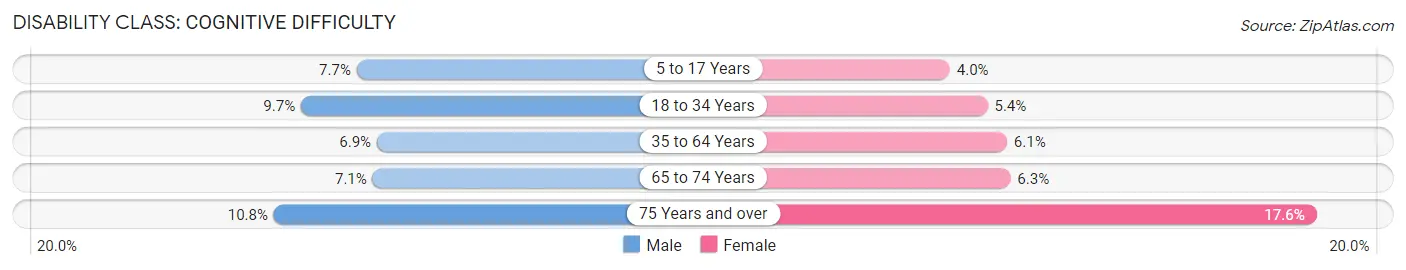
| Age Bracket | Male | Female |
| 5 to 17 Years | 214 (7.7%) | 125 (4.0%) |
| 18 to 34 Years | 443 (9.7%) | 228 (5.4%) |
| 35 to 64 Years | 477 (6.9%) | 446 (6.1%) |
| 65 to 74 Years | 137 (7.1%) | 134 (6.3%) |
| 75 Years and over | 137 (10.7%) | 348 (17.6%) |
Disability Class: Ambulatory Difficulty
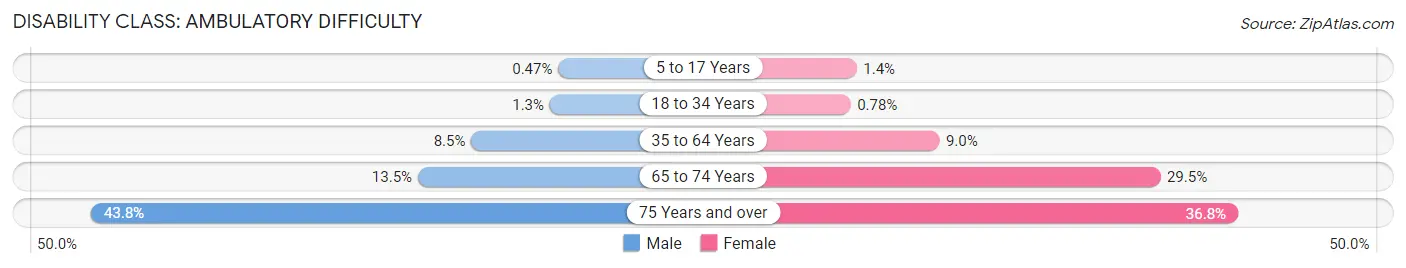
| Age Bracket | Male | Female |
| 5 to 17 Years | 13 (0.5%) | 42 (1.3%) |
| 18 to 34 Years | 57 (1.3%) | 33 (0.8%) |
| 35 to 64 Years | 589 (8.5%) | 657 (9.0%) |
| 65 to 74 Years | 261 (13.5%) | 632 (29.5%) |
| 75 Years and over | 559 (43.8%) | 726 (36.8%) |
Disability Class: Self-Care Difficulty
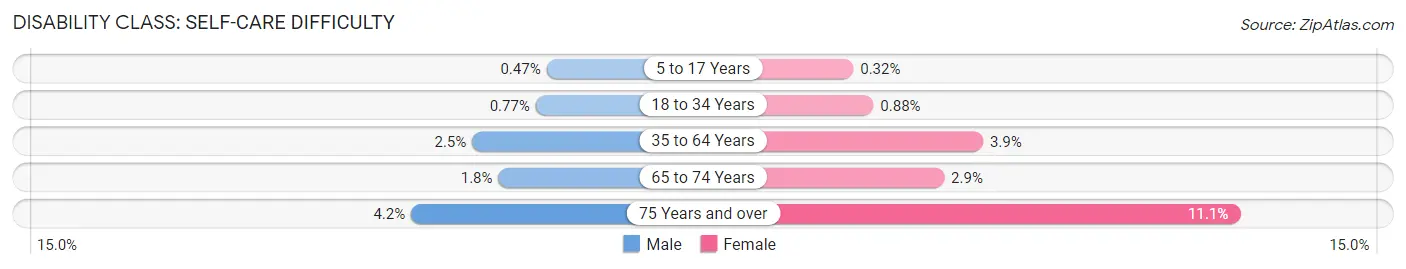
| Age Bracket | Male | Female |
| 5 to 17 Years | 13 (0.5%) | 10 (0.3%) |
| 18 to 34 Years | 35 (0.8%) | 37 (0.9%) |
| 35 to 64 Years | 175 (2.5%) | 286 (3.9%) |
| 65 to 74 Years | 35 (1.8%) | 61 (2.9%) |
| 75 Years and over | 54 (4.2%) | 219 (11.1%) |
Technology Access in Quincy
Computing Device Access in Quincy
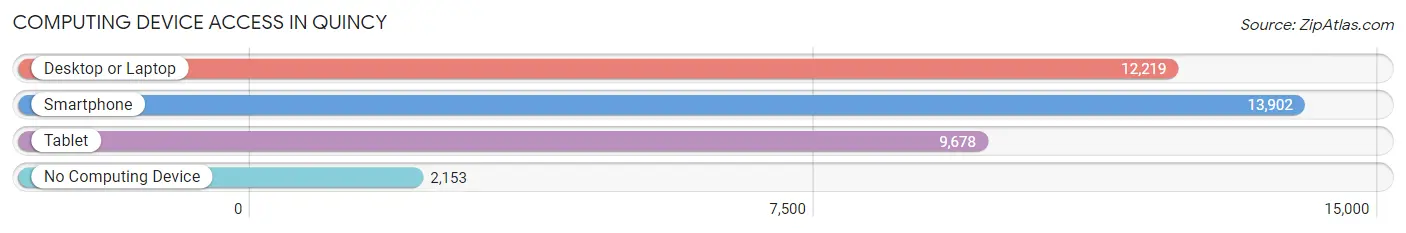
| Device Type | # Households | % Households |
| Desktop or Laptop | 12,219 | 70.3% |
| Smartphone | 13,902 | 80.0% |
| Tablet | 9,678 | 55.7% |
| No Computing Device | 2,153 | 12.4% |
| Total | 17,373 | 100.0% |
Internet Access in Quincy
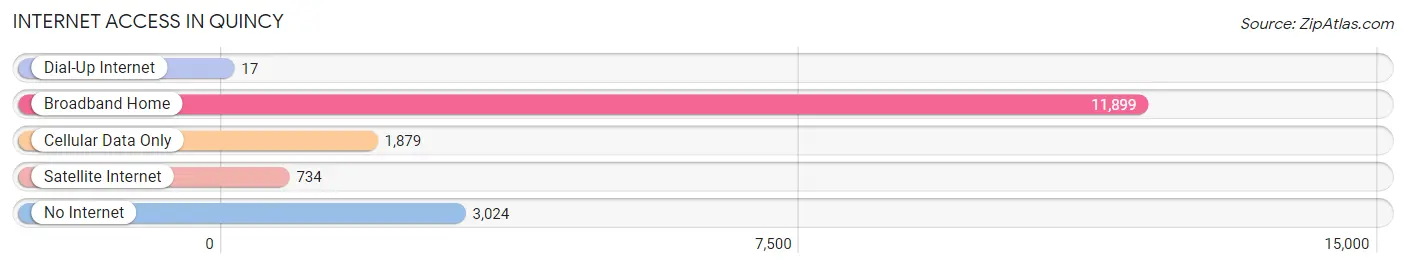
| Internet Type | # Households | % Households |
| Dial-Up Internet | 17 | 0.1% |
| Broadband Home | 11,899 | 68.5% |
| Cellular Data Only | 1,879 | 10.8% |
| Satellite Internet | 734 | 4.2% |
| No Internet | 3,024 | 17.4% |
| Total | 17,373 | 100.0% |
Quincy Summary
Quincy, Illinois is a city located in Adams County, Illinois, United States. It is the county seat of Adams County and is located on the Mississippi River. The population of Quincy was 40,366 at the 2010 census, making it the largest city in the county.
History
Quincy was founded in 1825 by John Wood, a settler from Kentucky. The city was named after John Quincy Adams, the sixth President of the United States. Quincy was incorporated as a city in 1840.
During the 19th century, Quincy was a major transportation hub, with the Mississippi River, the Illinois and Michigan Canal, and the Quincy and Toledo Railroad all passing through the city. This made Quincy a major center for trade and commerce.
In the late 19th century, Quincy was home to a large number of German immigrants, who established a number of businesses and churches in the city.
In the early 20th century, Quincy was a major center for the manufacturing industry, with a number of factories producing a variety of products.
Geography
Quincy is located at 40°4′N 91°24′W (40.067, -91.400). According to the 2010 census, the city has a total area of 16.2 square miles (41.8 km2), of which 15.9 square miles (41.2 km2) is land and 0.3 square miles (0.8 km2) is water.
Quincy is located on the Mississippi River, and is bordered by the cities of Hannibal, Missouri to the west, and Keokuk, Iowa to the east.
Economy
Quincy has a diverse economy, with a number of industries represented in the city. The largest employers in Quincy are Blessing Hospital, the Quincy Public School District, and the Quincy Medical Group.
Other major employers in Quincy include the Quincy University, the Adams County government, and the Quincy Park District.
Quincy is also home to a number of manufacturing companies, including the Quincy Compressor Company, the Quincy Foundry, and the Quincy Machine Works.
Demographics
As of the 2010 census, there were 40,366 people, 16,845 households, and 10,072 families residing in the city. The population density was 2,527.2 people per square mile (976.2/km2). There were 18,845 housing units at an average density of 1,179.3 per square mile (455.7/km2).
The racial makeup of the city was 87.2% White, 8.2% African American, 0.3% Native American, 1.2% Asian, 0.1% Pacific Islander, 1.2% from other races, and 1.9% from two or more races. Hispanic or Latino of any race were 3.3% of the population.
The median income for a household in the city was $37,945, and the median income for a family was $48,945. Males had a median income of $35,945 versus $25,945 for females. The per capita income for the city was $20,945. About 8.2% of families and 11.2% of the population were below the poverty line, including 15.2% of those under age 18 and 8.2% of those age 65 or over.
Conclusion
Quincy, Illinois is a city located in Adams County, Illinois, United States. It is the county seat of Adams County and is located on the Mississippi River. The population of Quincy was 40,366 at the 2010 census, making it the largest city in the county. Quincy has a diverse economy, with a number of industries represented in the city. The largest employers in Quincy are Blessing Hospital, the Quincy Public School District, and the Quincy Medical Group. The racial makeup of the city was 87.2% White, 8.2% African American, 0.3% Native American, 1.2% Asian, 0.1% Pacific Islander, 1.2% from other races, and 1.9% from two or more races. The median income for a household in the city was $37,945, and the median income for a family was $48,945. Quincy is a major transportation hub, with the Mississippi River, the Illinois and Michigan Canal, and the Quincy and Toledo Railroad all passing through the city. This makes Quincy a major center for trade and commerce.
Common Questions
What is Per Capita Income in Quincy?
Per Capita income in Quincy is $33,672.
What is the Median Family Income in Quincy?
Median Family Income in Quincy is $75,854.
What is the Median Household income in Quincy?
Median Household Income in Quincy is $54,199.
What is Income or Wage Gap in Quincy?
Income or Wage Gap in Quincy is 28.8%.
Women in Quincy earn 71.2 cents for every dollar earned by a man.
What is Family Income Deficit in Quincy?
Family Income Deficit in Quincy is $10,672.
Families that are below poverty line in Quincy earn $10,672 less on average than the poverty threshold level.
What is Inequality or Gini Index in Quincy?
Inequality or Gini Index in Quincy is 0.46.
What is the Total Population of Quincy?
Total Population of Quincy is 39,441.
What is the Total Male Population of Quincy?
Total Male Population of Quincy is 19,005.
What is the Total Female Population of Quincy?
Total Female Population of Quincy is 20,436.
What is the Ratio of Males per 100 Females in Quincy?
There are 93.00 Males per 100 Females in Quincy.
What is the Ratio of Females per 100 Males in Quincy?
There are 107.53 Females per 100 Males in Quincy.
What is the Median Population Age in Quincy?
Median Population Age in Quincy is 40.5 Years.
What is the Average Family Size in Quincy
Average Family Size in Quincy is 3.0 People.
What is the Average Household Size in Quincy
Average Household Size in Quincy is 2.2 People.
How Large is the Labor Force in Quincy?
There are 20,608 People in the Labor Forcein in Quincy.
What is the Percentage of People in the Labor Force in Quincy?
64.5% of People are in the Labor Force in Quincy.
What is the Unemployment Rate in Quincy?
Unemployment Rate in Quincy is 4.8%.