Kankakee, IL Map & Demographics
Kankakee Map
Kankakee Overview
$22,151
PER CAPITA INCOME
$47,819
AVG FAMILY INCOME
$42,180
AVG HOUSEHOLD INCOME
18.3%
WAGE / INCOME GAP [ % ]
81.7¢/ $1
WAGE / INCOME GAP [ $ ]
0.47
INEQUALITY / GINI INDEX
24,795
TOTAL POPULATION
12,121
MALE POPULATION
12,674
FEMALE POPULATION
95.64
MALES / 100 FEMALES
104.56
FEMALES / 100 MALES
36.3
MEDIAN AGE
3.3
AVG FAMILY SIZE
2.5
AVG HOUSEHOLD SIZE
10,763
LABOR FORCE [ PEOPLE ]
56.5%
PERCENT IN LABOR FORCE
7.4%
UNEMPLOYMENT RATE
Kankakee Zip Codes
Income in Kankakee
Income Overview in Kankakee
Per Capita Income in Kankakee is $22,151, while median incomes of families and households are $47,819 and $42,180 respectively.
| Characteristic | Number | Measure |
| Per Capita Income | 24,795 | $22,151 |
| Median Family Income | 5,652 | $47,819 |
| Mean Family Income | 5,652 | $66,258 |
| Median Household Income | 9,349 | $42,180 |
| Mean Household Income | 9,349 | $56,334 |
| Income Deficit | 5,652 | $0 |
| Wage / Income Gap (%) | 24,795 | 18.30% |
| Wage / Income Gap ($) | 24,795 | 81.70¢ per $1 |
| Gini / Inequality Index | 24,795 | 0.47 |
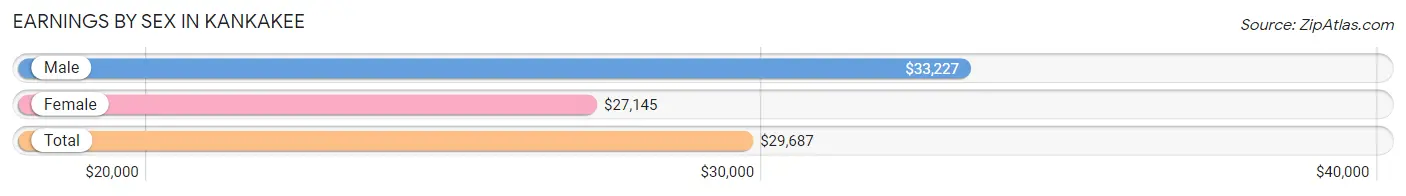
Earnings by Sex in Kankakee
Average Earnings in Kankakee are $29,687, $33,227 for men and $27,145 for women, a difference of 18.3%.
| Sex | Number | Average Earnings |
| Male | 5,743 (52.5%) | $33,227 |
| Female | 5,192 (47.5%) | $27,145 |
| Total | 10,935 (100.0%) | $29,687 |
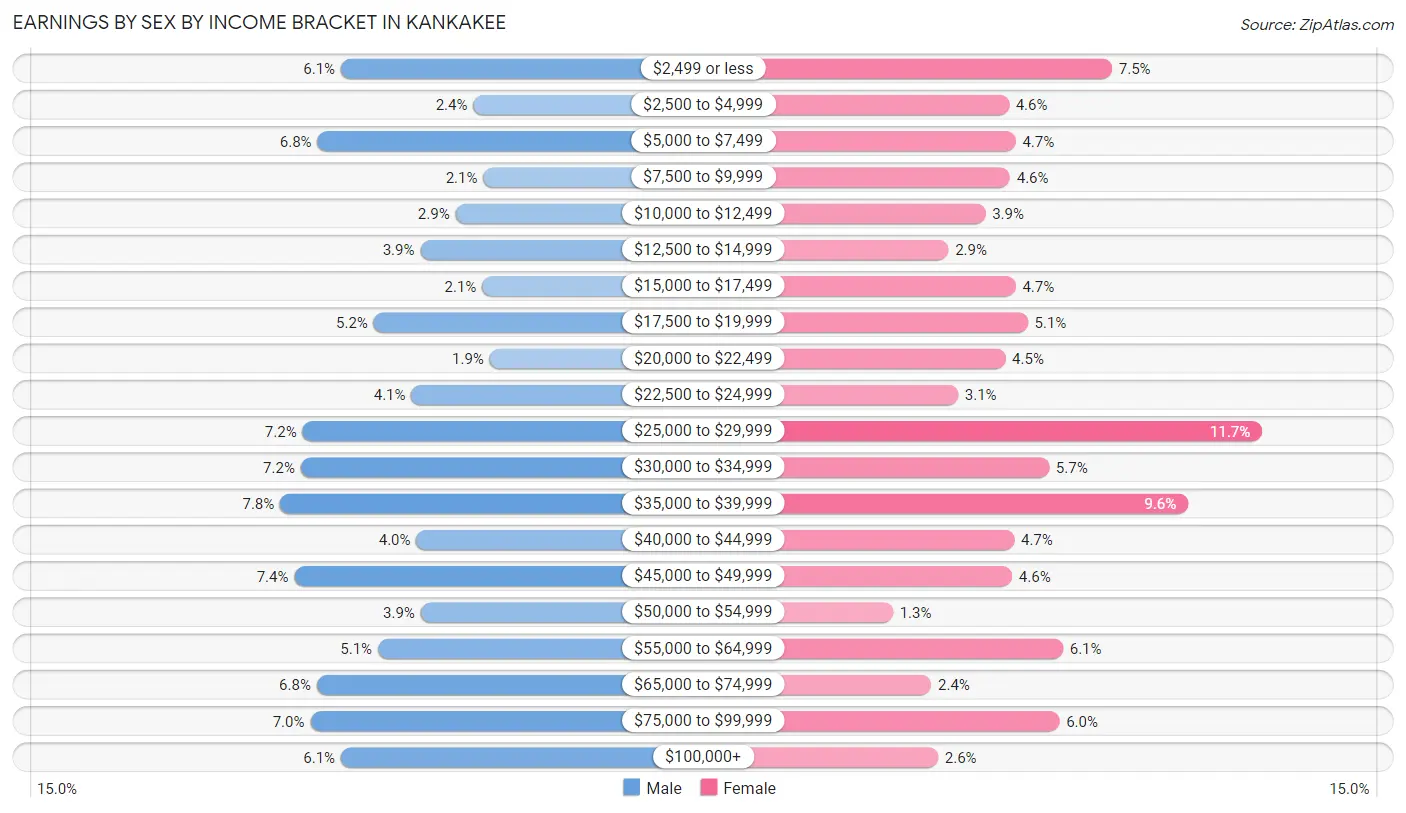
Earnings by Sex by Income Bracket in Kankakee
The most common earnings brackets in Kankakee are $35,000 to $39,999 for men (449 | 7.8%) and $25,000 to $29,999 for women (606 | 11.7%).
| Income | Male | Female |
| $2,499 or less | 351 (6.1%) | 387 (7.4%) |
| $2,500 to $4,999 | 137 (2.4%) | 236 (4.5%) |
| $5,000 to $7,499 | 389 (6.8%) | 246 (4.7%) |
| $7,500 to $9,999 | 121 (2.1%) | 238 (4.6%) |
| $10,000 to $12,499 | 166 (2.9%) | 202 (3.9%) |
| $12,500 to $14,999 | 223 (3.9%) | 148 (2.9%) |
| $15,000 to $17,499 | 123 (2.1%) | 246 (4.7%) |
| $17,500 to $19,999 | 298 (5.2%) | 264 (5.1%) |
| $20,000 to $22,499 | 111 (1.9%) | 231 (4.4%) |
| $22,500 to $24,999 | 237 (4.1%) | 162 (3.1%) |
| $25,000 to $29,999 | 413 (7.2%) | 606 (11.7%) |
| $30,000 to $34,999 | 416 (7.2%) | 295 (5.7%) |
| $35,000 to $39,999 | 449 (7.8%) | 498 (9.6%) |
| $40,000 to $44,999 | 229 (4.0%) | 244 (4.7%) |
| $45,000 to $49,999 | 426 (7.4%) | 241 (4.6%) |
| $50,000 to $54,999 | 222 (3.9%) | 67 (1.3%) |
| $55,000 to $64,999 | 291 (5.1%) | 315 (6.1%) |
| $65,000 to $74,999 | 390 (6.8%) | 123 (2.4%) |
| $75,000 to $99,999 | 400 (7.0%) | 310 (6.0%) |
| $100,000+ | 351 (6.1%) | 133 (2.6%) |
| Total | 5,743 (100.0%) | 5,192 (100.0%) |
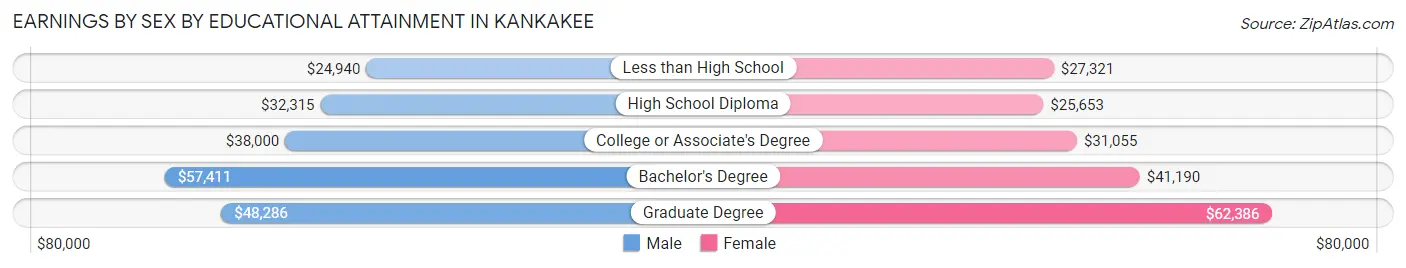
Earnings by Sex by Educational Attainment in Kankakee
Average earnings in Kankakee are $36,766 for men and $29,476 for women, a difference of 19.8%. Men with an educational attainment of bachelor's degree enjoy the highest average annual earnings of $57,411, while those with less than high school education earn the least with $24,940. Women with an educational attainment of graduate degree earn the most with the average annual earnings of $62,386, while those with high school diploma education have the smallest earnings of $25,653.
| Educational Attainment | Male Income | Female Income |
| Less than High School | $24,940 | $27,321 |
| High School Diploma | $32,315 | $25,653 |
| College or Associate's Degree | $38,000 | $31,055 |
| Bachelor's Degree | $57,411 | $41,190 |
| Graduate Degree | $48,286 | $62,386 |
| Total | $36,766 | $29,476 |
Family Income in Kankakee
Family Income Brackets in Kankakee
According to the Kankakee family income data, there are 1,113 families falling into the $35,000 to $49,999 income range, which is the most common income bracket and makes up 19.7% of all families. Conversely, the $200,000+ income bracket is the least frequent group with only 119 families (2.1%) belonging to this category.
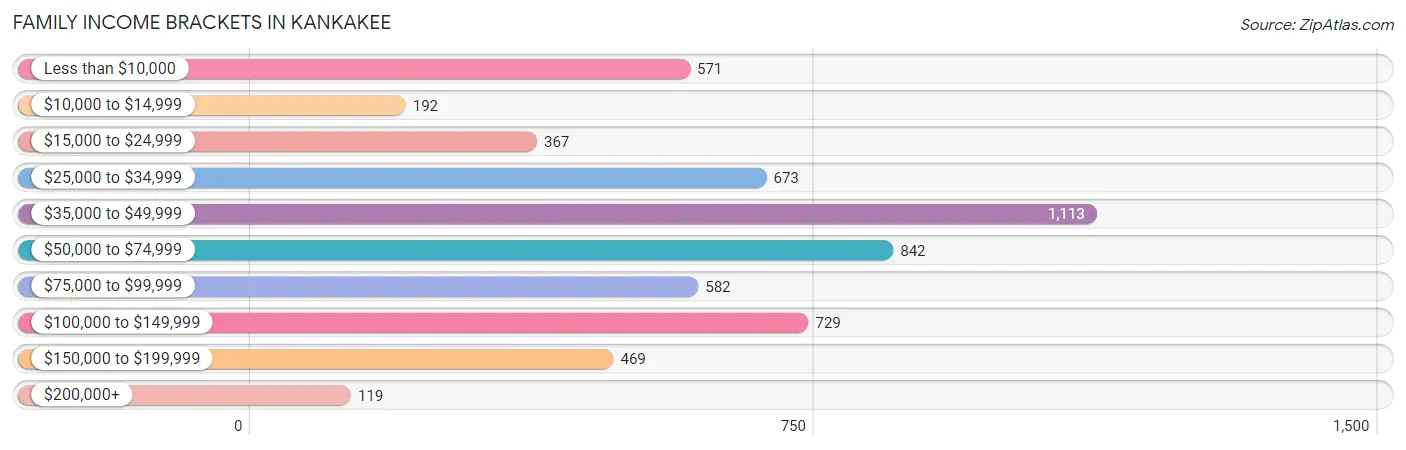
| Income Bracket | # Families | % Families |
| Less than $10,000 | 571 | 10.1% |
| $10,000 to $14,999 | 192 | 3.4% |
| $15,000 to $24,999 | 367 | 6.5% |
| $25,000 to $34,999 | 673 | 11.9% |
| $35,000 to $49,999 | 1,113 | 19.7% |
| $50,000 to $74,999 | 842 | 14.9% |
| $75,000 to $99,999 | 582 | 10.3% |
| $100,000 to $149,999 | 729 | 12.9% |
| $150,000 to $199,999 | 469 | 8.3% |
| $200,000+ | 119 | 2.1% |
Family Income by Famaliy Size in Kankakee
6-person families (249 | 4.4%) account for the highest median family income in Kankakee with $71,375 per family, while 2-person families (2,460 | 43.5%) have the highest median income of $23,282 per family member.
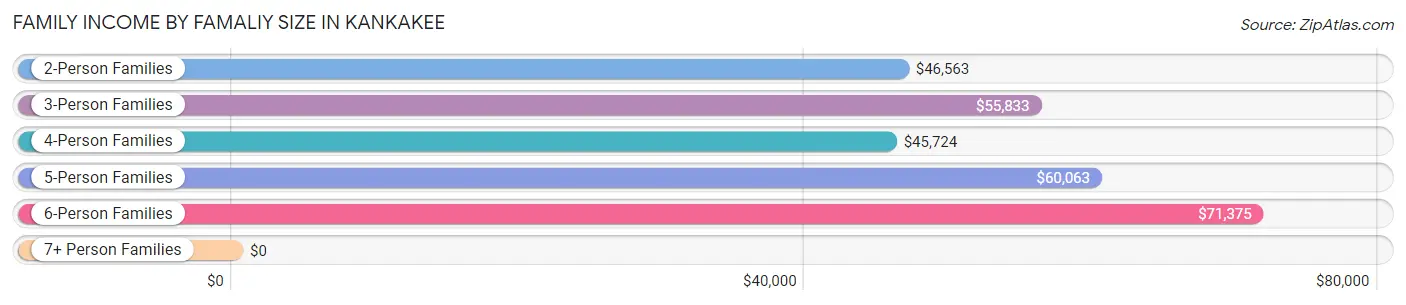
| Income Bracket | # Families | Median Income |
| 2-Person Families | 2,460 (43.5%) | $46,563 |
| 3-Person Families | 1,308 (23.1%) | $55,833 |
| 4-Person Families | 1,051 (18.6%) | $45,724 |
| 5-Person Families | 551 (9.8%) | $60,063 |
| 6-Person Families | 249 (4.4%) | $71,375 |
| 7+ Person Families | 33 (0.6%) | $0 |
| Total | 5,652 (100.0%) | $47,819 |
Family Income by Number of Earners in Kankakee
The median family income in Kankakee is $47,819, with families comprising 3+ earners (671) having the highest median family income of $122,303, while families with no earners (770) have the lowest median family income of $26,250, accounting for 11.9% and 13.6% of families, respectively.
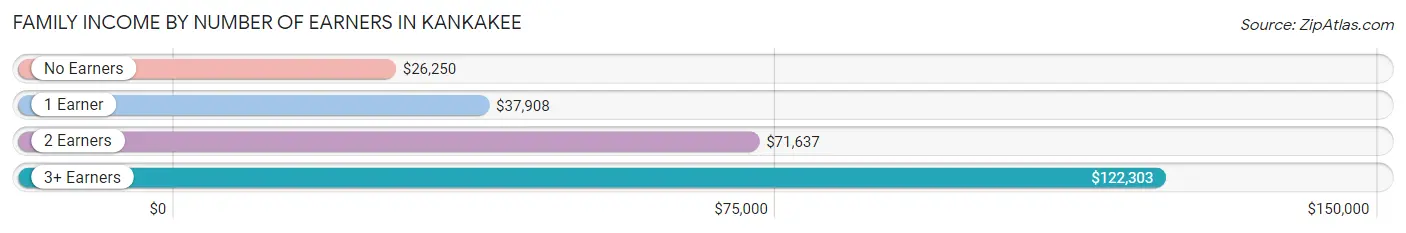
| Number of Earners | # Families | Median Income |
| No Earners | 770 (13.6%) | $26,250 |
| 1 Earner | 2,552 (45.2%) | $37,908 |
| 2 Earners | 1,659 (29.3%) | $71,637 |
| 3+ Earners | 671 (11.9%) | $122,303 |
| Total | 5,652 (100.0%) | $47,819 |
Household Income in Kankakee
Household Income Brackets in Kankakee
With 1,655 households falling in the category, the $50,000 to $74,999 income range is the most frequent in Kankakee, accounting for 17.7% of all households. In contrast, only 140 households (1.5%) fall into the $200,000+ income bracket, making it the least populous group.
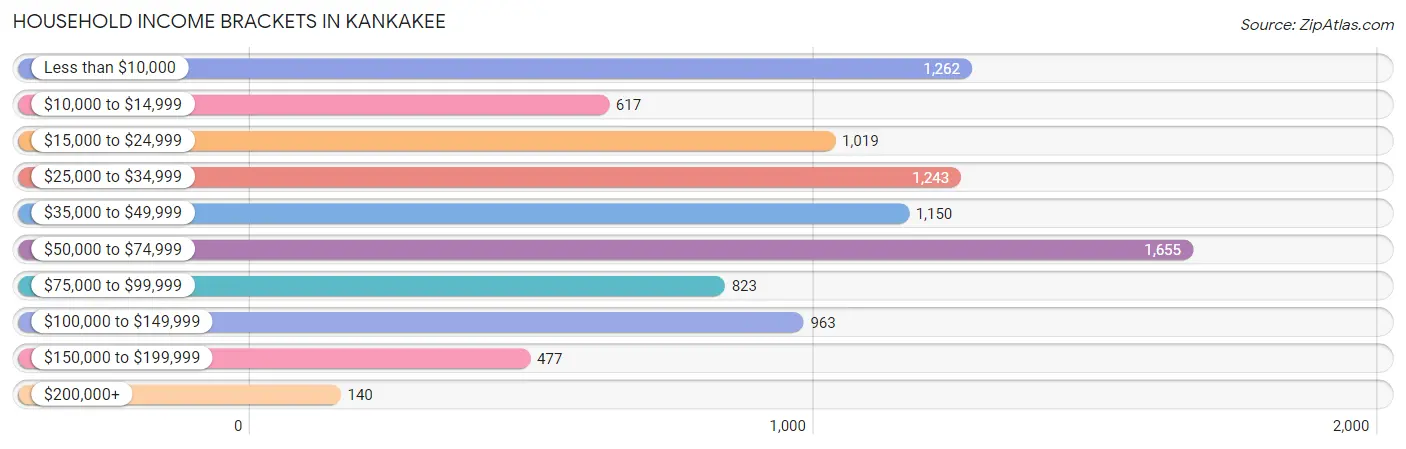
| Income Bracket | # Households | % Households |
| Less than $10,000 | 1,262 | 13.5% |
| $10,000 to $14,999 | 617 | 6.6% |
| $15,000 to $24,999 | 1,019 | 10.9% |
| $25,000 to $34,999 | 1,243 | 13.3% |
| $35,000 to $49,999 | 1,150 | 12.3% |
| $50,000 to $74,999 | 1,655 | 17.7% |
| $75,000 to $99,999 | 823 | 8.8% |
| $100,000 to $149,999 | 963 | 10.3% |
| $150,000 to $199,999 | 477 | 5.1% |
| $200,000+ | 140 | 1.5% |
Household Income by Householder Age in Kankakee
The median household income in Kankakee is $42,180, with the highest median household income of $52,095 found in the 45 to 64 years age bracket for the primary householder. A total of 3,366 households (36.0%) fall into this category. Meanwhile, the 65+ years age bracket for the primary householder has the lowest median household income of $31,681, with 2,290 households (24.5%) in this group.
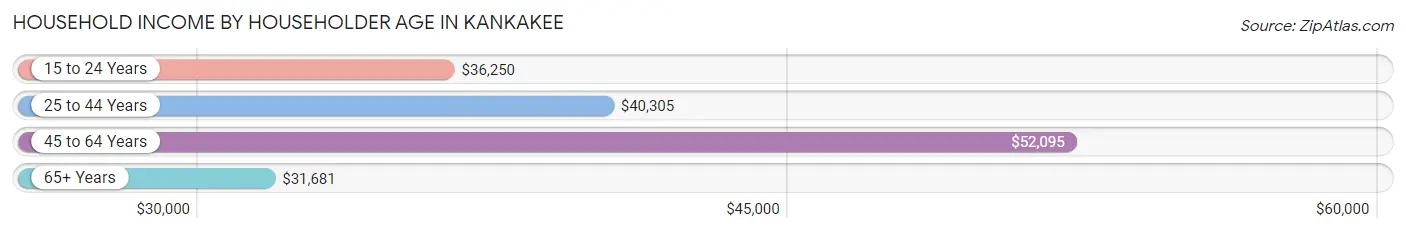
| Income Bracket | # Households | Median Income |
| 15 to 24 Years | 345 (3.7%) | $36,250 |
| 25 to 44 Years | 3,348 (35.8%) | $40,305 |
| 45 to 64 Years | 3,366 (36.0%) | $52,095 |
| 65+ Years | 2,290 (24.5%) | $31,681 |
| Total | 9,349 (100.0%) | $42,180 |
Poverty in Kankakee
Income Below Poverty by Sex and Age in Kankakee
With 24.7% poverty level for males and 32.3% for females among the residents of Kankakee, under 5 year old males and 12 to 14 year old females are the most vulnerable to poverty, with 399 males (50.2%) and 375 females (48.1%) in their respective age groups living below the poverty level.
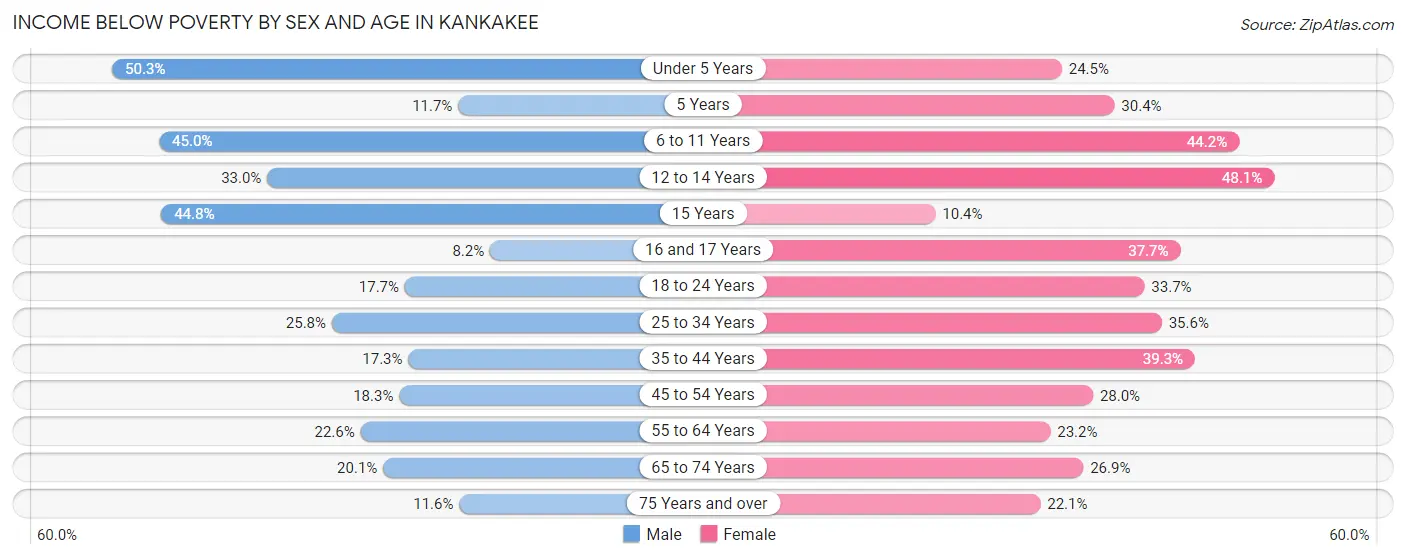
| Age Bracket | Male | Female |
| Under 5 Years | 399 (50.2%) | 196 (24.5%) |
| 5 Years | 13 (11.7%) | 17 (30.4%) |
| 6 to 11 Years | 437 (45.0%) | 514 (44.2%) |
| 12 to 14 Years | 220 (33.0%) | 375 (48.1%) |
| 15 Years | 60 (44.8%) | 15 (10.4%) |
| 16 and 17 Years | 28 (8.2%) | 118 (37.7%) |
| 18 to 24 Years | 176 (17.6%) | 370 (33.7%) |
| 25 to 34 Years | 431 (25.8%) | 542 (35.6%) |
| 35 to 44 Years | 297 (17.3%) | 617 (39.3%) |
| 45 to 54 Years | 260 (18.3%) | 421 (28.0%) |
| 55 to 64 Years | 317 (22.6%) | 326 (23.2%) |
| 65 to 74 Years | 175 (20.1%) | 292 (26.9%) |
| 75 Years and over | 56 (11.6%) | 247 (22.1%) |
| Total | 2,869 (24.7%) | 4,050 (32.3%) |
Income Above Poverty by Sex and Age in Kankakee
According to the poverty statistics in Kankakee, males aged 16 and 17 years and females aged 15 years are the age groups that are most secure financially, with 91.8% of males and 89.6% of females in these age groups living above the poverty line.
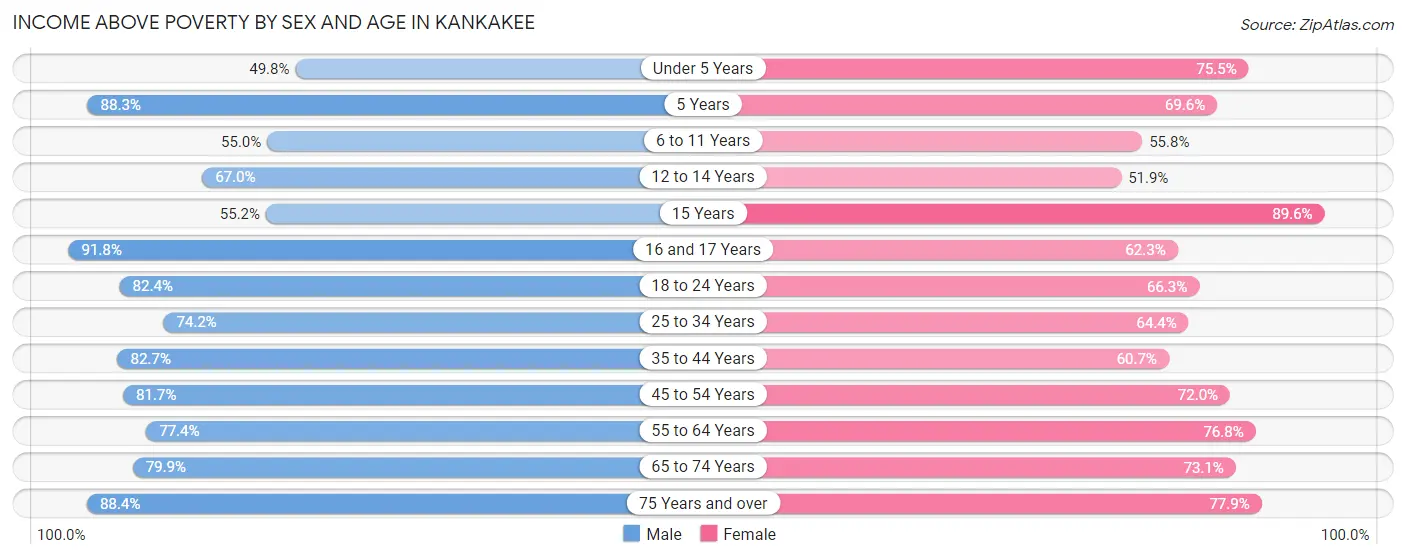
| Age Bracket | Male | Female |
| Under 5 Years | 395 (49.7%) | 604 (75.5%) |
| 5 Years | 98 (88.3%) | 39 (69.6%) |
| 6 to 11 Years | 534 (55.0%) | 648 (55.8%) |
| 12 to 14 Years | 447 (67.0%) | 404 (51.9%) |
| 15 Years | 74 (55.2%) | 129 (89.6%) |
| 16 and 17 Years | 315 (91.8%) | 195 (62.3%) |
| 18 to 24 Years | 821 (82.4%) | 728 (66.3%) |
| 25 to 34 Years | 1,241 (74.2%) | 979 (64.4%) |
| 35 to 44 Years | 1,424 (82.7%) | 952 (60.7%) |
| 45 to 54 Years | 1,162 (81.7%) | 1,084 (72.0%) |
| 55 to 64 Years | 1,086 (77.4%) | 1,078 (76.8%) |
| 65 to 74 Years | 697 (79.9%) | 794 (73.1%) |
| 75 Years and over | 427 (88.4%) | 870 (77.9%) |
| Total | 8,721 (75.2%) | 8,504 (67.7%) |
Income Below Poverty Among Married-Couple Families in Kankakee
The poverty statistics for married-couple families in Kankakee show that 14.8% or 466 of the total 3,156 families live below the poverty line. Families with 5 or more children have the highest poverty rate of 100.0%, comprising of 8 families. On the other hand, families with no children have the lowest poverty rate of 11.2%, which includes 226 families.
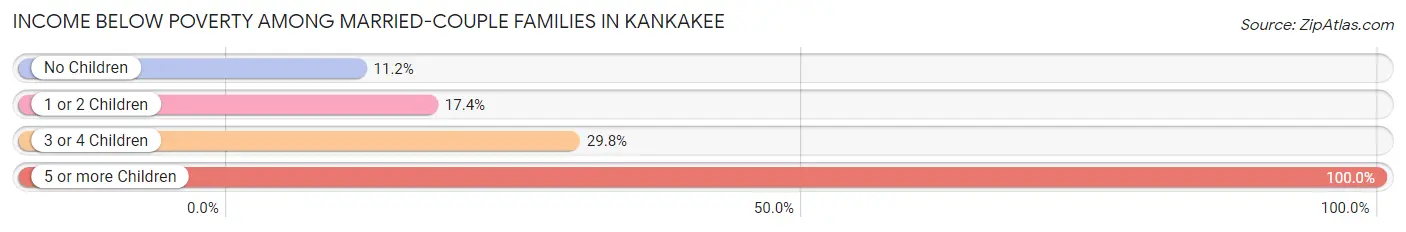
| Children | Above Poverty | Below Poverty |
| No Children | 1,794 (88.8%) | 226 (11.2%) |
| 1 or 2 Children | 693 (82.6%) | 146 (17.4%) |
| 3 or 4 Children | 203 (70.2%) | 86 (29.8%) |
| 5 or more Children | 0 (0.0%) | 8 (100.0%) |
| Total | 2,690 (85.2%) | 466 (14.8%) |
Income Below Poverty Among Single-Parent Households in Kankakee
According to the poverty data in Kankakee, 1.1% or 7 single-father households and 41.1% or 765 single-mother households are living below the poverty line. Among single-father households, those with 3 or 4 children have the highest poverty rate, with 7 households (8.6%) experiencing poverty. Likewise, among single-mother households, those with 5 or more children have the highest poverty rate, with 2 households (100.0%) falling below the poverty line.
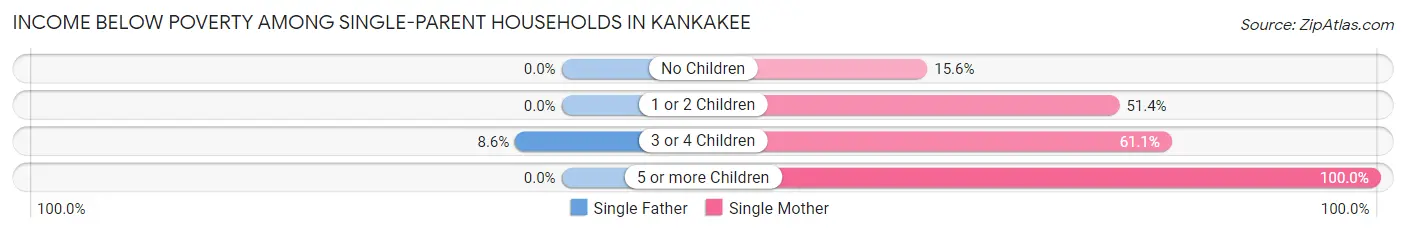
| Children | Single Father | Single Mother |
| No Children | 0 (0.0%) | 96 (15.6%) |
| 1 or 2 Children | 0 (0.0%) | 488 (51.4%) |
| 3 or 4 Children | 7 (8.6%) | 179 (61.1%) |
| 5 or more Children | 0 (0.0%) | 2 (100.0%) |
| Total | 7 (1.1%) | 765 (41.1%) |
Income Below Poverty Among Married-Couple vs Single-Parent Households in Kankakee
The poverty data for Kankakee shows that 466 of the married-couple family households (14.8%) and 772 of the single-parent households (30.9%) are living below the poverty level. Within the married-couple family households, those with 5 or more children have the highest poverty rate, with 8 households (100.0%) falling below the poverty line. Among the single-parent households, those with 5 or more children have the highest poverty rate, with 2 household (100.0%) living below poverty.
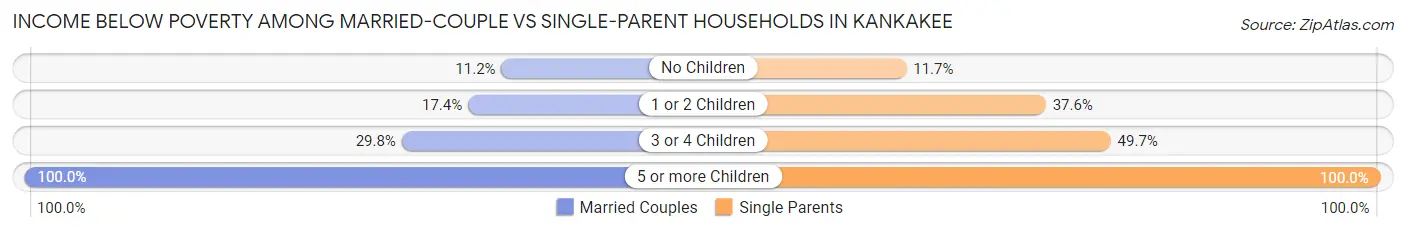
| Children | Married-Couple Families | Single-Parent Households |
| No Children | 226 (11.2%) | 96 (11.7%) |
| 1 or 2 Children | 146 (17.4%) | 488 (37.6%) |
| 3 or 4 Children | 86 (29.8%) | 186 (49.7%) |
| 5 or more Children | 8 (100.0%) | 2 (100.0%) |
| Total | 466 (14.8%) | 772 (30.9%) |
Race in Kankakee
The most populous races in Kankakee are White / Caucasian (11,306 | 45.6%), Black / African American (10,213 | 41.2%), and Hispanic or Latino (5,134 | 20.7%).
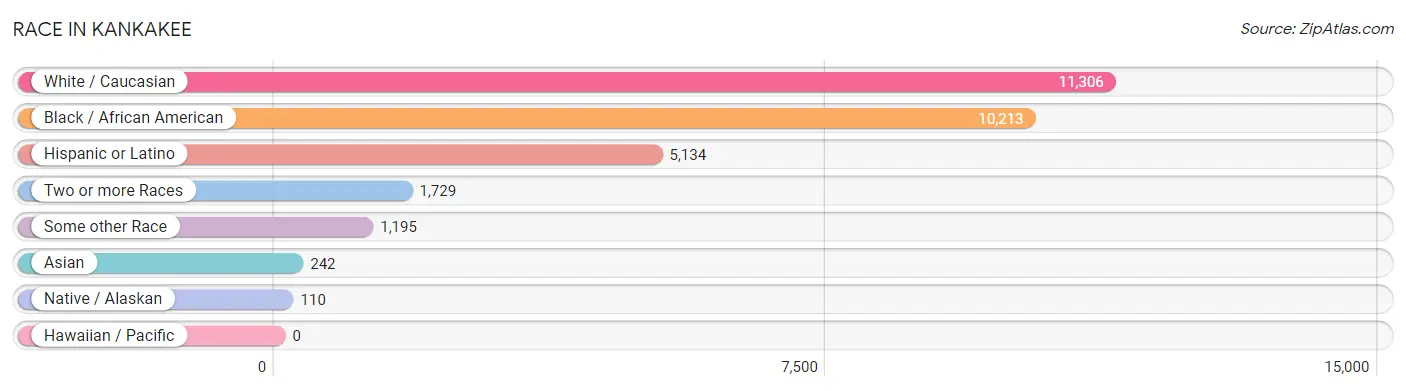
| Race | # Population | % Population |
| Asian | 242 | 1.0% |
| Black / African American | 10,213 | 41.2% |
| Hawaiian / Pacific | 0 | 0.0% |
| Hispanic or Latino | 5,134 | 20.7% |
| Native / Alaskan | 110 | 0.4% |
| White / Caucasian | 11,306 | 45.6% |
| Two or more Races | 1,729 | 7.0% |
| Some other Race | 1,195 | 4.8% |
| Total | 24,795 | 100.0% |
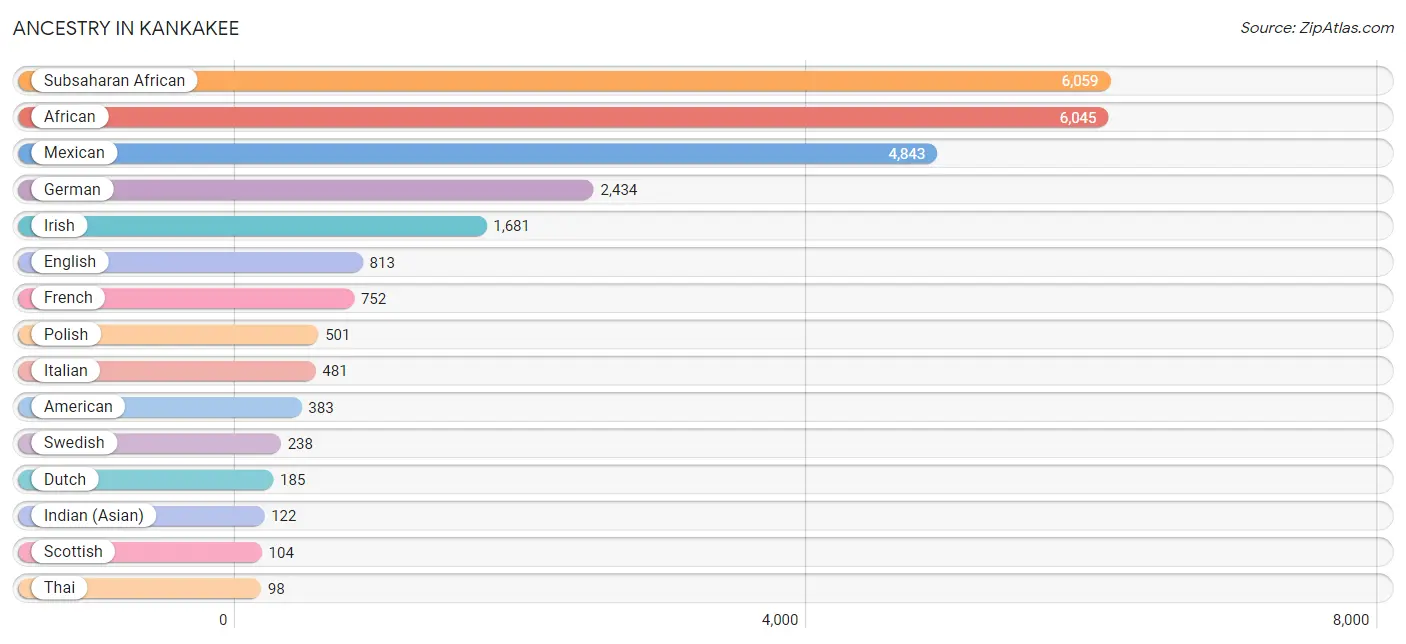
Ancestry in Kankakee
The most populous ancestries reported in Kankakee are Subsaharan African (6,059 | 24.4%), African (6,045 | 24.4%), Mexican (4,843 | 19.5%), German (2,434 | 9.8%), and Irish (1,681 | 6.8%), together accounting for 84.9% of all Kankakee residents.
| Ancestry | # Population | % Population |
| African | 6,045 | 24.4% |
| American | 383 | 1.5% |
| Apache | 31 | 0.1% |
| Armenian | 3 | 0.0% |
| Bahamian | 7 | 0.0% |
| Belgian | 30 | 0.1% |
| British | 29 | 0.1% |
| Bulgarian | 55 | 0.2% |
| Burmese | 7 | 0.0% |
| Canadian | 12 | 0.1% |
| Central American | 88 | 0.4% |
| Cherokee | 23 | 0.1% |
| Colombian | 1 | 0.0% |
| Cuban | 3 | 0.0% |
| Czech | 45 | 0.2% |
| Czechoslovakian | 27 | 0.1% |
| Danish | 21 | 0.1% |
| Dutch | 185 | 0.7% |
| Eastern European | 13 | 0.1% |
| Ecuadorian | 13 | 0.1% |
| English | 813 | 3.3% |
| European | 81 | 0.3% |
| Finnish | 9 | 0.0% |
| French | 752 | 3.0% |
| French Canadian | 81 | 0.3% |
| German | 2,434 | 9.8% |
| Greek | 39 | 0.2% |
| Honduran | 88 | 0.4% |
| Hungarian | 40 | 0.2% |
| Indian (Asian) | 122 | 0.5% |
| Irish | 1,681 | 6.8% |
| Israeli | 31 | 0.1% |
| Italian | 481 | 1.9% |
| Jamaican | 23 | 0.1% |
| Korean | 15 | 0.1% |
| Lithuanian | 30 | 0.1% |
| Mexican | 4,843 | 19.5% |
| Mexican American Indian | 97 | 0.4% |
| Nigerian | 13 | 0.1% |
| Norwegian | 81 | 0.3% |
| Polish | 501 | 2.0% |
| Portuguese | 10 | 0.0% |
| Puerto Rican | 35 | 0.1% |
| Russian | 7 | 0.0% |
| Scandinavian | 11 | 0.0% |
| Scotch-Irish | 67 | 0.3% |
| Scottish | 104 | 0.4% |
| Serbian | 10 | 0.0% |
| Slovak | 5 | 0.0% |
| South American | 66 | 0.3% |
| Spaniard | 35 | 0.1% |
| Subsaharan African | 6,059 | 24.4% |
| Swedish | 238 | 1.0% |
| Swiss | 16 | 0.1% |
| Thai | 98 | 0.4% |
| Venezuelan | 52 | 0.2% |
| Welsh | 20 | 0.1% | View All 57 Rows |
Immigrants in Kankakee
The most numerous immigrant groups reported in Kankakee came from Latin America (2,400 | 9.7%), Central America (2,326 | 9.4%), Mexico (2,296 | 9.3%), Asia (223 | 0.9%), and China (122 | 0.5%), together accounting for 29.7% of all Kankakee residents.
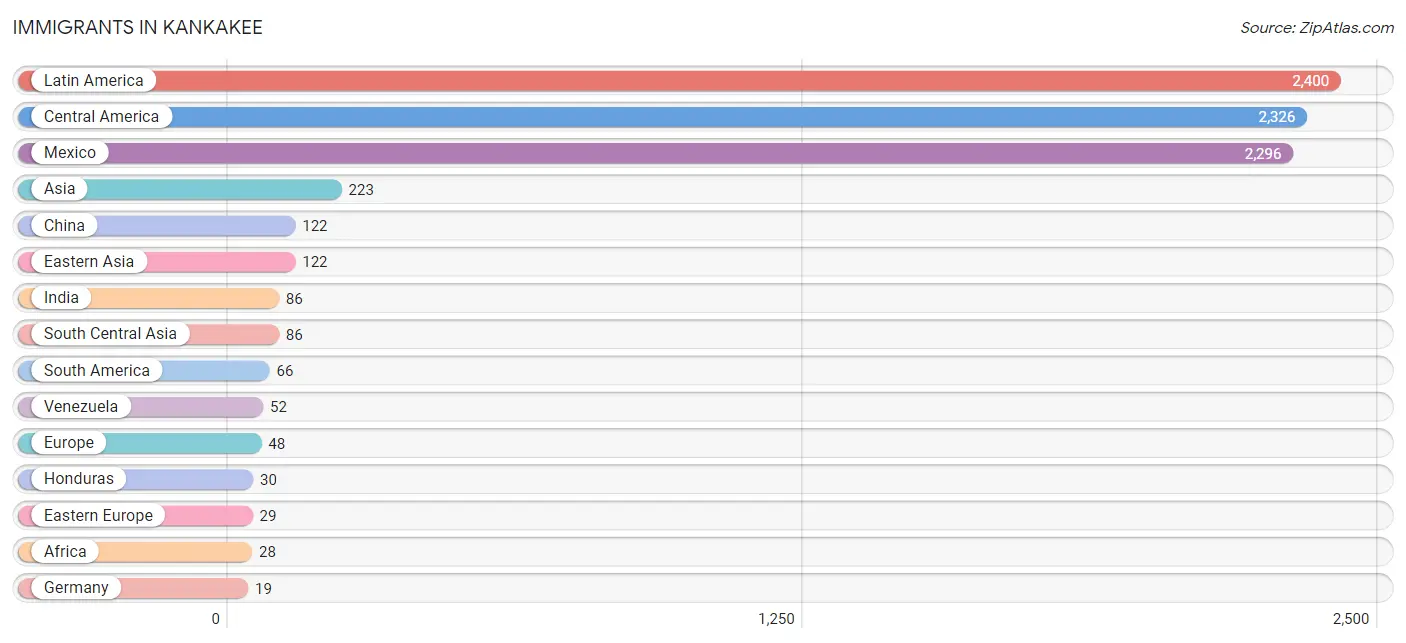
| Immigration Origin | # Population | % Population |
| Africa | 28 | 0.1% |
| Asia | 223 | 0.9% |
| Bulgaria | 17 | 0.1% |
| Caribbean | 8 | 0.0% |
| Central America | 2,326 | 9.4% |
| China | 122 | 0.5% |
| Colombia | 1 | 0.0% |
| Cuba | 8 | 0.0% |
| Eastern Asia | 122 | 0.5% |
| Eastern Europe | 29 | 0.1% |
| Ecuador | 13 | 0.1% |
| Europe | 48 | 0.2% |
| Germany | 19 | 0.1% |
| Honduras | 30 | 0.1% |
| India | 86 | 0.4% |
| Latin America | 2,400 | 9.7% |
| Mexico | 2,296 | 9.3% |
| Middle Africa | 15 | 0.1% |
| Nigeria | 13 | 0.1% |
| Philippines | 15 | 0.1% |
| Poland | 5 | 0.0% |
| Russia | 7 | 0.0% |
| South America | 66 | 0.3% |
| South Central Asia | 86 | 0.4% |
| South Eastern Asia | 15 | 0.1% |
| Venezuela | 52 | 0.2% |
| Western Africa | 13 | 0.1% |
| Western Europe | 19 | 0.1% |
| Zaire | 15 | 0.1% | View All 29 Rows |
Sex and Age in Kankakee
Sex and Age in Kankakee
The most populous age groups in Kankakee are 35 to 39 Years (1,215 | 10.0%) for men and 10 to 14 Years (1,156 | 9.1%) for women.
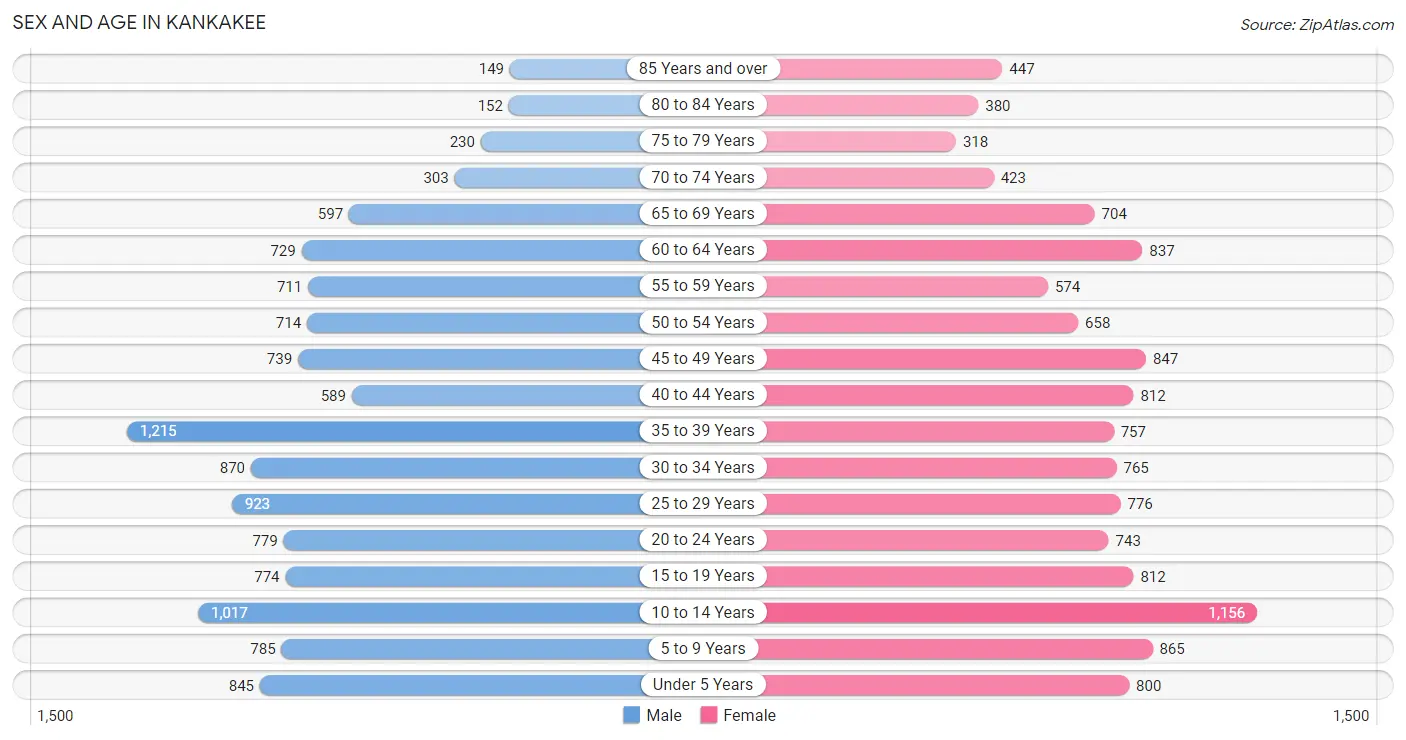
| Age Bracket | Male | Female |
| Under 5 Years | 845 (7.0%) | 800 (6.3%) |
| 5 to 9 Years | 785 (6.5%) | 865 (6.8%) |
| 10 to 14 Years | 1,017 (8.4%) | 1,156 (9.1%) |
| 15 to 19 Years | 774 (6.4%) | 812 (6.4%) |
| 20 to 24 Years | 779 (6.4%) | 743 (5.9%) |
| 25 to 29 Years | 923 (7.6%) | 776 (6.1%) |
| 30 to 34 Years | 870 (7.2%) | 765 (6.0%) |
| 35 to 39 Years | 1,215 (10.0%) | 757 (6.0%) |
| 40 to 44 Years | 589 (4.9%) | 812 (6.4%) |
| 45 to 49 Years | 739 (6.1%) | 847 (6.7%) |
| 50 to 54 Years | 714 (5.9%) | 658 (5.2%) |
| 55 to 59 Years | 711 (5.9%) | 574 (4.5%) |
| 60 to 64 Years | 729 (6.0%) | 837 (6.6%) |
| 65 to 69 Years | 597 (4.9%) | 704 (5.6%) |
| 70 to 74 Years | 303 (2.5%) | 423 (3.3%) |
| 75 to 79 Years | 230 (1.9%) | 318 (2.5%) |
| 80 to 84 Years | 152 (1.3%) | 380 (3.0%) |
| 85 Years and over | 149 (1.2%) | 447 (3.5%) |
| Total | 12,121 (100.0%) | 12,674 (100.0%) |
Families and Households in Kankakee
Median Family Size in Kankakee
The median family size in Kankakee is 3.26 persons per family, with single female/mother families (1,861 | 32.9%) accounting for the largest median family size of 3.61 persons per family. On the other hand, single male/father families (635 | 11.2%) represent the smallest median family size with 2.67 persons per family.
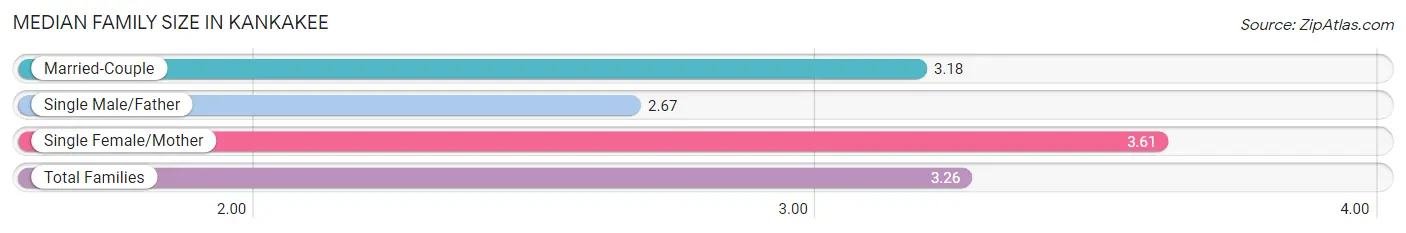
| Family Type | # Families | Family Size |
| Married-Couple | 3,156 (55.8%) | 3.18 |
| Single Male/Father | 635 (11.2%) | 2.67 |
| Single Female/Mother | 1,861 (32.9%) | 3.61 |
| Total Families | 5,652 (100.0%) | 3.26 |
Median Household Size in Kankakee
The median household size in Kankakee is 2.50 persons per household, with single female/mother households (1,861 | 19.9%) accounting for the largest median household size of 3.8 persons per household. non-family households (3,697 | 39.5%) represent the smallest median household size with 1.16 persons per household.
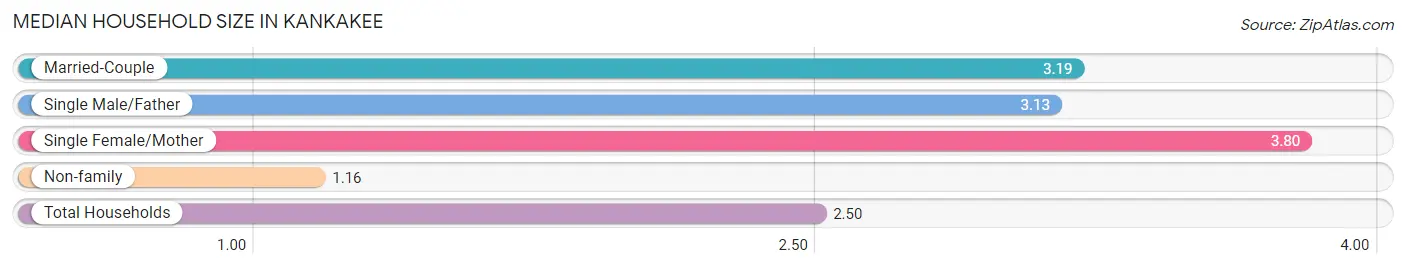
| Household Type | # Households | Household Size |
| Married-Couple | 3,156 (33.8%) | 3.19 |
| Single Male/Father | 635 (6.8%) | 3.13 |
| Single Female/Mother | 1,861 (19.9%) | 3.80 |
| Non-family | 3,697 (39.5%) | 1.16 |
| Total Households | 9,349 (100.0%) | 2.50 |
Household Size by Marriage Status in Kankakee
Out of a total of 9,349 households in Kankakee, 5,652 (60.5%) are family households, while 3,697 (39.5%) are nonfamily households. The most numerous type of family households are 2-person households, comprising 2,204, and the most common type of nonfamily households are 1-person households, comprising 3,270.
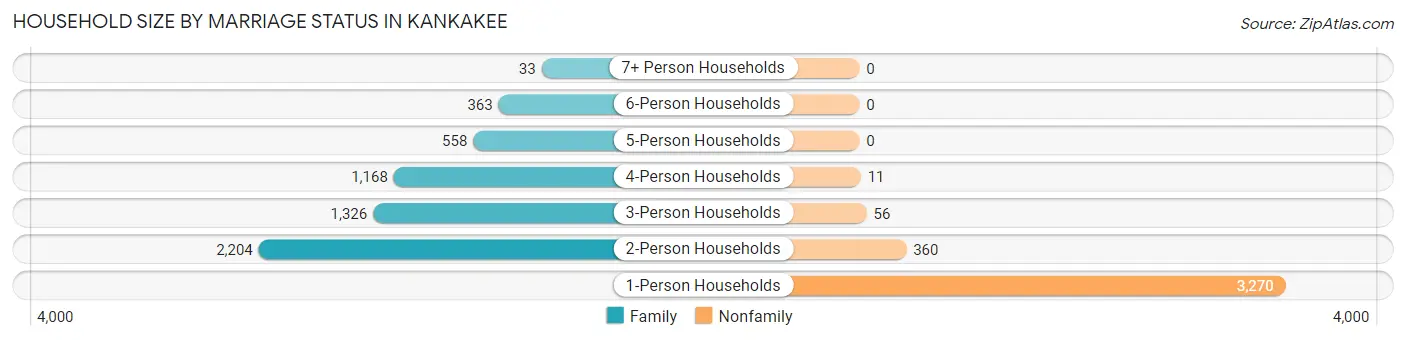
| Household Size | Family Households | Nonfamily Households |
| 1-Person Households | - | 3,270 (35.0%) |
| 2-Person Households | 2,204 (23.6%) | 360 (3.8%) |
| 3-Person Households | 1,326 (14.2%) | 56 (0.6%) |
| 4-Person Households | 1,168 (12.5%) | 11 (0.1%) |
| 5-Person Households | 558 (6.0%) | 0 (0.0%) |
| 6-Person Households | 363 (3.9%) | 0 (0.0%) |
| 7+ Person Households | 33 (0.4%) | 0 (0.0%) |
| Total | 5,652 (60.5%) | 3,697 (39.5%) |
Female Fertility in Kankakee
Fertility by Age in Kankakee
Average fertility rate in Kankakee is 92.0 births per 1,000 women. Women in the age bracket of 20 to 34 years have the highest fertility rate with 201.0 births per 1,000 women. Women in the age bracket of 20 to 34 years acount for 88.2% of all women with births.
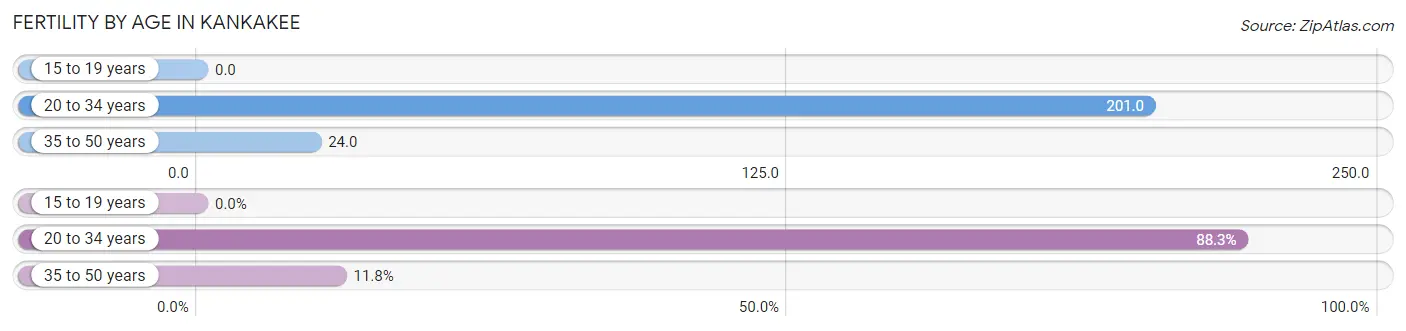
| Age Bracket | Women with Births | Births / 1,000 Women |
| 15 to 19 years | 0 (0.0%) | 0.0 |
| 20 to 34 years | 458 (88.2%) | 201.0 |
| 35 to 50 years | 61 (11.7%) | 24.0 |
| Total | 519 (100.0%) | 92.0 |
Fertility by Age by Marriage Status in Kankakee
20.0% of women with births (519) in Kankakee are married. The highest percentage of unmarried women with births falls into 20 to 34 years age bracket with 81.2% of them unmarried at the time of birth, while the lowest percentage of unmarried women with births belong to 35 to 50 years age bracket with 70.5% of them unmarried.
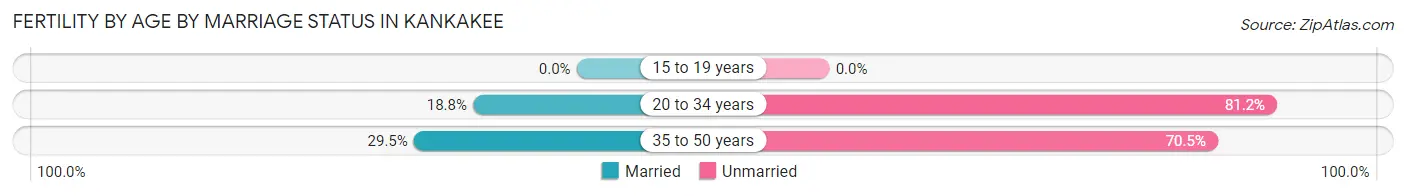
| Age Bracket | Married | Unmarried |
| 15 to 19 years | 0 (0.0%) | 0 (0.0%) |
| 20 to 34 years | 86 (18.8%) | 372 (81.2%) |
| 35 to 50 years | 18 (29.5%) | 43 (70.5%) |
| Total | 104 (20.0%) | 415 (80.0%) |
Fertility by Education in Kankakee
Average fertility rate in Kankakee is 92.0 births per 1,000 women. Women with the education attainment of high school diploma have the highest fertility rate of 152.0 births per 1,000 women, while women with the education attainment of graduate degree have the lowest fertility at 24.0 births per 1,000 women. Women with the education attainment of high school diploma represent 59.5% of all women with births.
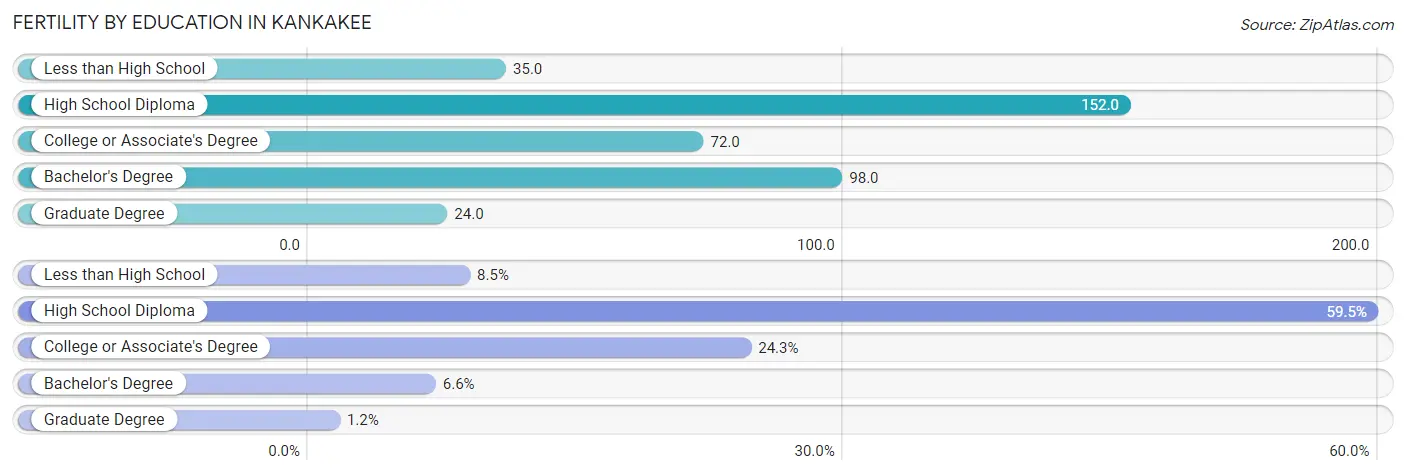
| Educational Attainment | Women with Births | Births / 1,000 Women |
| Less than High School | 44 (8.5%) | 35.0 |
| High School Diploma | 309 (59.5%) | 152.0 |
| College or Associate's Degree | 126 (24.3%) | 72.0 |
| Bachelor's Degree | 34 (6.6%) | 98.0 |
| Graduate Degree | 6 (1.2%) | 24.0 |
| Total | 519 (100.0%) | 92.0 |
Fertility by Education by Marriage Status in Kankakee
80.0% of women with births in Kankakee are unmarried. Women with the educational attainment of graduate degree are most likely to be married with 100.0% of them married at childbirth, while women with the educational attainment of high school diploma are least likely to be married with 88.7% of them unmarried at childbirth.
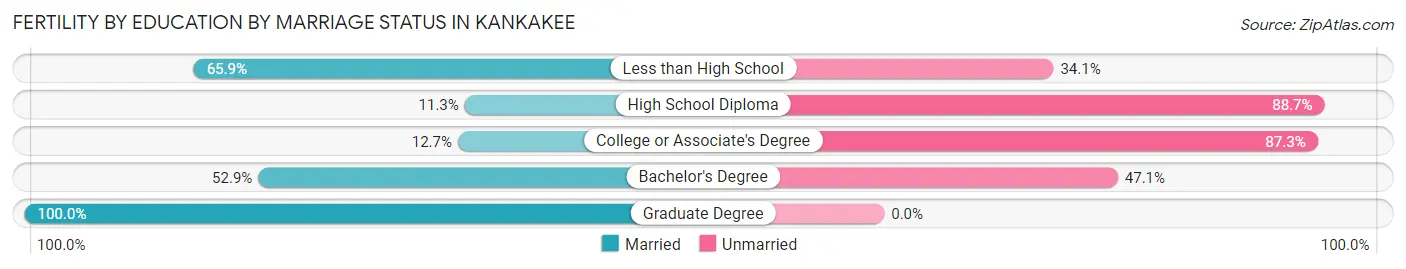
| Educational Attainment | Married | Unmarried |
| Less than High School | 29 (65.9%) | 15 (34.1%) |
| High School Diploma | 35 (11.3%) | 274 (88.7%) |
| College or Associate's Degree | 16 (12.7%) | 110 (87.3%) |
| Bachelor's Degree | 18 (52.9%) | 16 (47.1%) |
| Graduate Degree | 6 (100.0%) | 0 (0.0%) |
| Total | 104 (20.0%) | 415 (80.0%) |
Employment Characteristics in Kankakee
Employment by Class of Employer in Kankakee
Among the 9,745 employed individuals in Kankakee, private company employees (6,851 | 70.3%), not-for-profit organizations (887 | 9.1%), and local government employees (729 | 7.5%) make up the most common classes of employment.
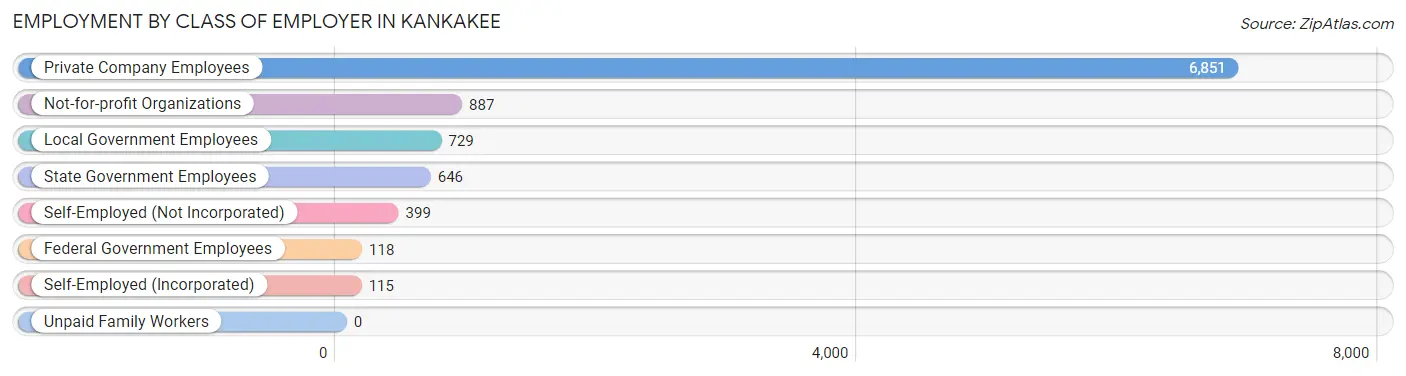
| Employer Class | # Employees | % Employees |
| Private Company Employees | 6,851 | 70.3% |
| Self-Employed (Incorporated) | 115 | 1.2% |
| Self-Employed (Not Incorporated) | 399 | 4.1% |
| Not-for-profit Organizations | 887 | 9.1% |
| Local Government Employees | 729 | 7.5% |
| State Government Employees | 646 | 6.6% |
| Federal Government Employees | 118 | 1.2% |
| Unpaid Family Workers | 0 | 0.0% |
| Total | 9,745 | 100.0% |
Employment Status by Age in Kankakee
According to the labor force statistics for Kankakee, out of the total population over 16 years of age (19,049), 56.5% or 10,763 individuals are in the labor force, with 7.4% or 796 of them unemployed. The age group with the highest labor force participation rate is 35 to 44 years, with 75.5% or 2,547 individuals in the labor force. Within the labor force, the 45 to 54 years age range has the highest percentage of unemployed individuals, with 13.4% or 291 of them being unemployed.
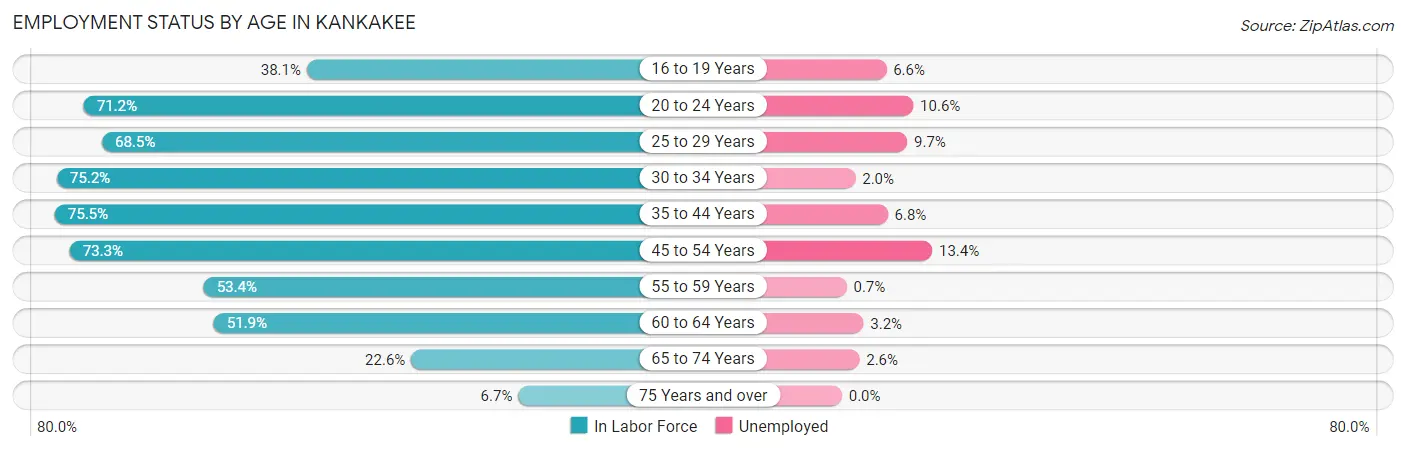
| Age Bracket | In Labor Force | Unemployed |
| 16 to 19 Years | 498 (38.1%) | 33 (6.6%) |
| 20 to 24 Years | 1,084 (71.2%) | 115 (10.6%) |
| 25 to 29 Years | 1,164 (68.5%) | 113 (9.7%) |
| 30 to 34 Years | 1,230 (75.2%) | 25 (2.0%) |
| 35 to 44 Years | 2,547 (75.5%) | 173 (6.8%) |
| 45 to 54 Years | 2,168 (73.3%) | 291 (13.4%) |
| 55 to 59 Years | 686 (53.4%) | 5 (0.7%) |
| 60 to 64 Years | 813 (51.9%) | 26 (3.2%) |
| 65 to 74 Years | 458 (22.6%) | 12 (2.6%) |
| 75 Years and over | 112 (6.7%) | 0 (0.0%) |
| Total | 10,763 (56.5%) | 796 (7.4%) |
Employment Status by Educational Attainment in Kankakee
According to labor force statistics for Kankakee, 68.7% of individuals (8,598) out of the total population between 25 and 64 years of age (12,516) are in the labor force, with 7.3% or 628 of them being unemployed. The group with the highest labor force participation rate are those with the educational attainment of bachelor's degree or higher, with 89.9% or 1,348 individuals in the labor force. Within the labor force, individuals with less than high school education have the highest percentage of unemployment, with 14.7% or 139 of them being unemployed.
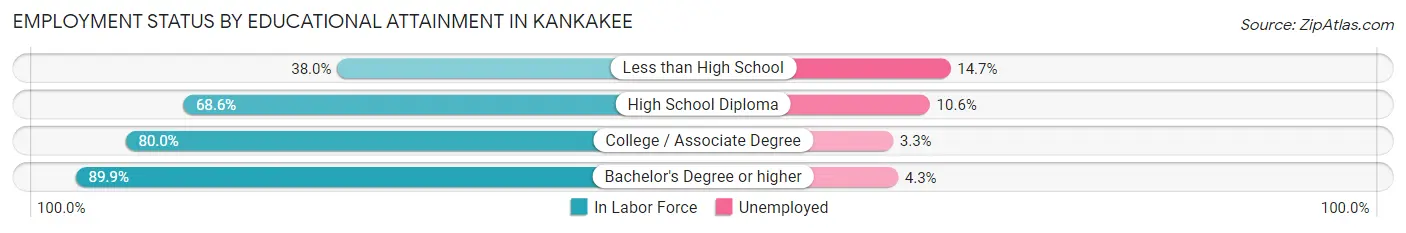
| Educational Attainment | In Labor Force | Unemployed |
| Less than High School | 943 (38.0%) | 365 (14.7%) |
| High School Diploma | 3,103 (68.6%) | 480 (10.6%) |
| College / Associate Degree | 3,208 (80.0%) | 132 (3.3%) |
| Bachelor's Degree or higher | 1,348 (89.9%) | 64 (4.3%) |
| Total | 8,598 (68.7%) | 914 (7.3%) |
Employment Occupations by Sex in Kankakee
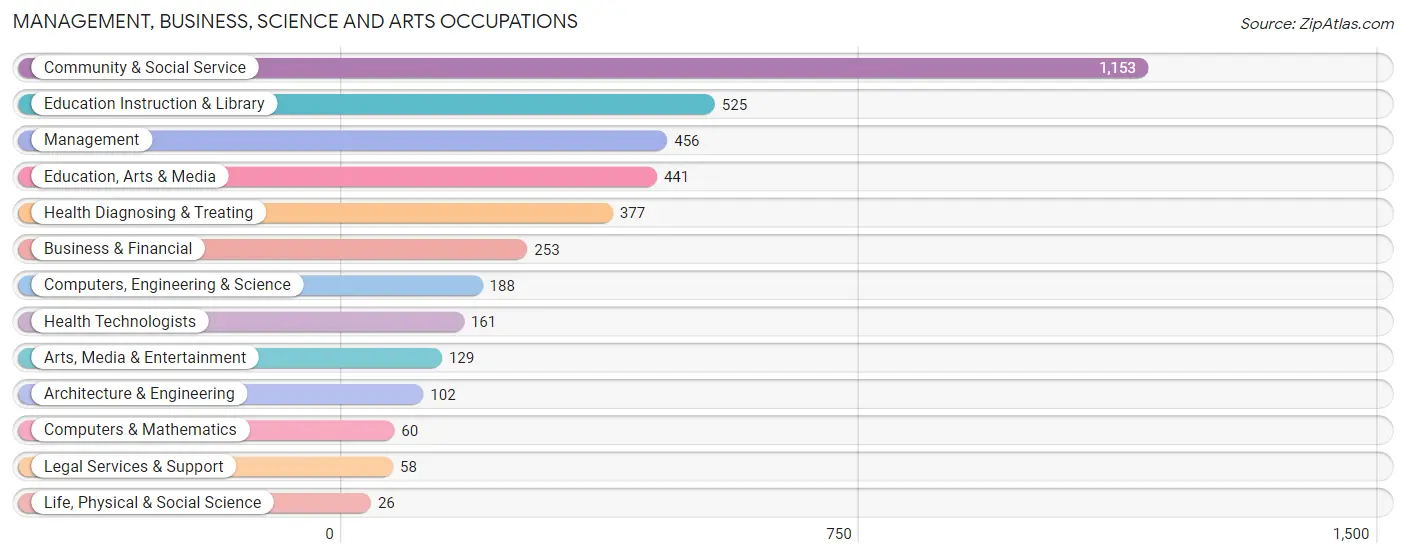
Management, Business, Science and Arts Occupations
The most common Management, Business, Science and Arts occupations in Kankakee are Community & Social Service (1,153 | 11.6%), Education Instruction & Library (525 | 5.3%), Management (456 | 4.6%), Education, Arts & Media (441 | 4.4%), and Health Diagnosing & Treating (377 | 3.8%).
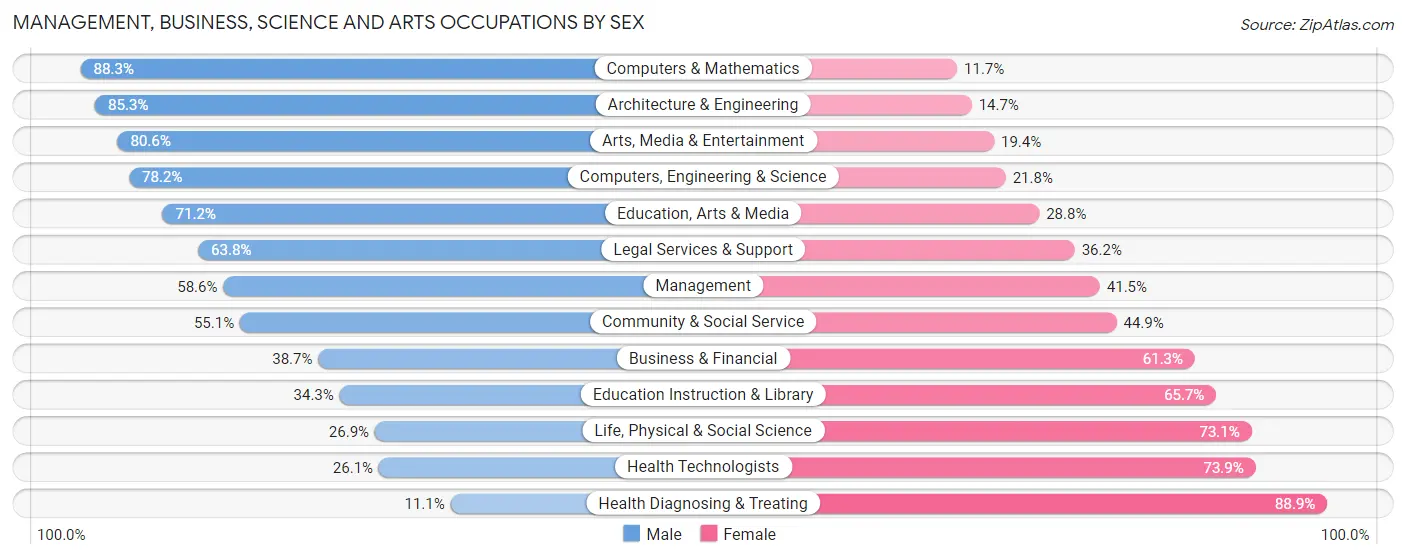
Management, Business, Science and Arts Occupations by Sex
Within the Management, Business, Science and Arts occupations in Kankakee, the most male-oriented occupations are Computers & Mathematics (88.3%), Architecture & Engineering (85.3%), and Arts, Media & Entertainment (80.6%), while the most female-oriented occupations are Health Diagnosing & Treating (88.9%), Health Technologists (73.9%), and Life, Physical & Social Science (73.1%).
| Occupation | Male | Female |
| Management | 267 (58.6%) | 189 (41.4%) |
| Business & Financial | 98 (38.7%) | 155 (61.3%) |
| Computers, Engineering & Science | 147 (78.2%) | 41 (21.8%) |
| Computers & Mathematics | 53 (88.3%) | 7 (11.7%) |
| Architecture & Engineering | 87 (85.3%) | 15 (14.7%) |
| Life, Physical & Social Science | 7 (26.9%) | 19 (73.1%) |
| Community & Social Service | 635 (55.1%) | 518 (44.9%) |
| Education, Arts & Media | 314 (71.2%) | 127 (28.8%) |
| Legal Services & Support | 37 (63.8%) | 21 (36.2%) |
| Education Instruction & Library | 180 (34.3%) | 345 (65.7%) |
| Arts, Media & Entertainment | 104 (80.6%) | 25 (19.4%) |
| Health Diagnosing & Treating | 42 (11.1%) | 335 (88.9%) |
| Health Technologists | 42 (26.1%) | 119 (73.9%) |
| Total (Category) | 1,189 (49.0%) | 1,238 (51.0%) |
| Total (Overall) | 5,290 (53.1%) | 4,674 (46.9%) |
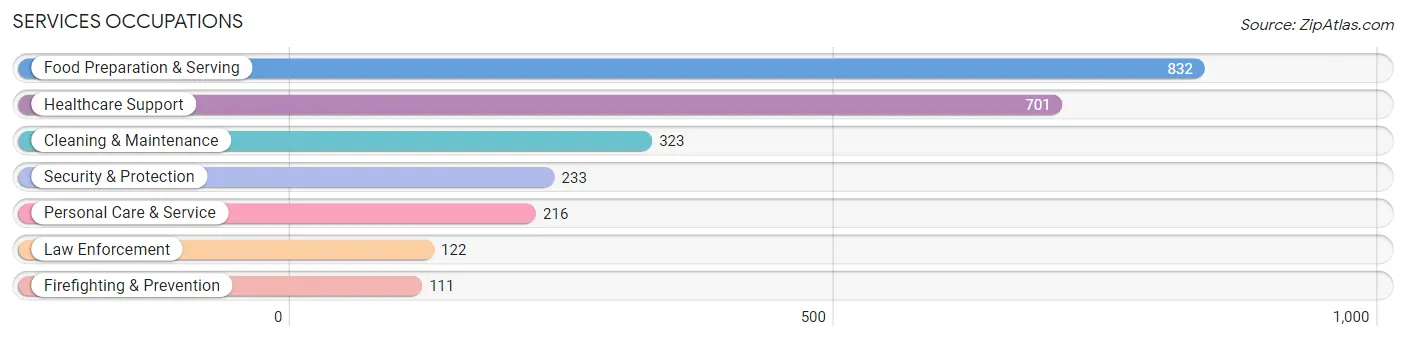
Services Occupations
The most common Services occupations in Kankakee are Food Preparation & Serving (832 | 8.4%), Healthcare Support (701 | 7.0%), Cleaning & Maintenance (323 | 3.2%), Security & Protection (233 | 2.3%), and Personal Care & Service (216 | 2.2%).
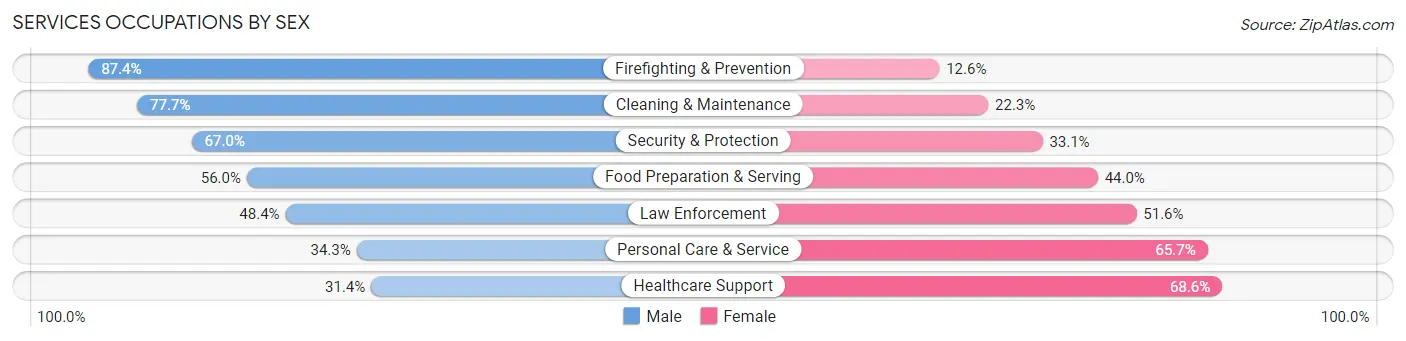
Services Occupations by Sex
Within the Services occupations in Kankakee, the most male-oriented occupations are Firefighting & Prevention (87.4%), Cleaning & Maintenance (77.7%), and Security & Protection (66.9%), while the most female-oriented occupations are Healthcare Support (68.6%), Personal Care & Service (65.7%), and Law Enforcement (51.6%).
| Occupation | Male | Female |
| Healthcare Support | 220 (31.4%) | 481 (68.6%) |
| Security & Protection | 156 (66.9%) | 77 (33.1%) |
| Firefighting & Prevention | 97 (87.4%) | 14 (12.6%) |
| Law Enforcement | 59 (48.4%) | 63 (51.6%) |
| Food Preparation & Serving | 466 (56.0%) | 366 (44.0%) |
| Cleaning & Maintenance | 251 (77.7%) | 72 (22.3%) |
| Personal Care & Service | 74 (34.3%) | 142 (65.7%) |
| Total (Category) | 1,167 (50.6%) | 1,138 (49.4%) |
| Total (Overall) | 5,290 (53.1%) | 4,674 (46.9%) |
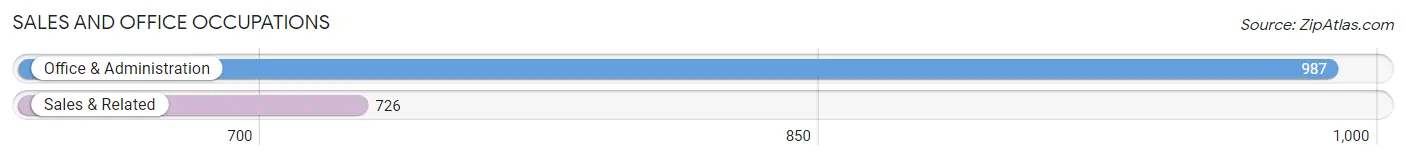
Sales and Office Occupations
The most common Sales and Office occupations in Kankakee are Office & Administration (987 | 9.9%), and Sales & Related (726 | 7.3%).
Sales and Office Occupations by Sex
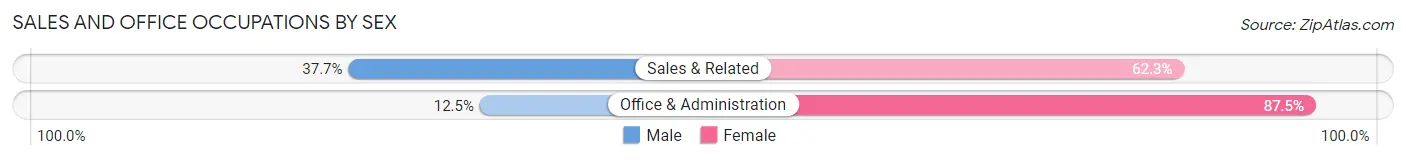
| Occupation | Male | Female |
| Sales & Related | 274 (37.7%) | 452 (62.3%) |
| Office & Administration | 123 (12.5%) | 864 (87.5%) |
| Total (Category) | 397 (23.2%) | 1,316 (76.8%) |
| Total (Overall) | 5,290 (53.1%) | 4,674 (46.9%) |
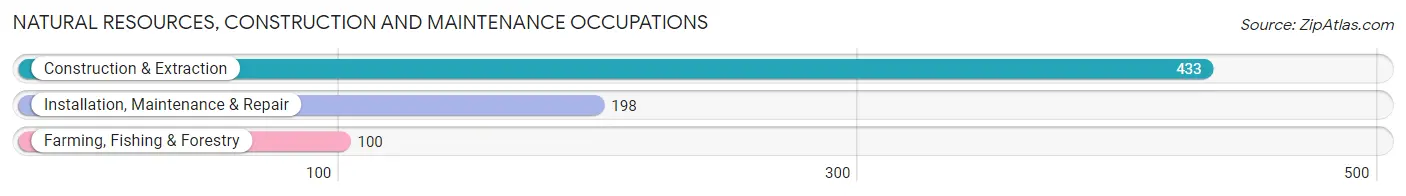
Natural Resources, Construction and Maintenance Occupations
The most common Natural Resources, Construction and Maintenance occupations in Kankakee are Construction & Extraction (433 | 4.3%), Installation, Maintenance & Repair (198 | 2.0%), and Farming, Fishing & Forestry (100 | 1.0%).
Natural Resources, Construction and Maintenance Occupations by Sex
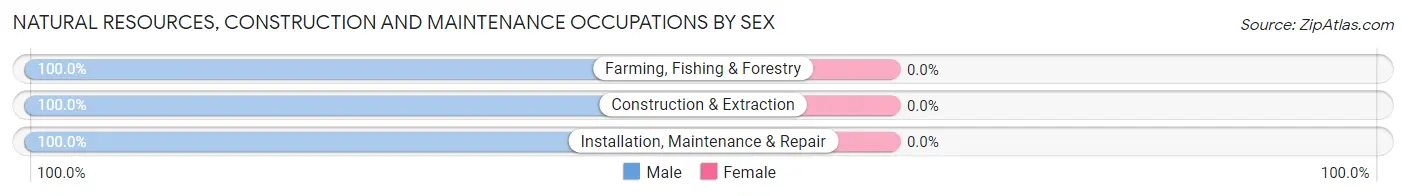
| Occupation | Male | Female |
| Farming, Fishing & Forestry | 100 (100.0%) | 0 (0.0%) |
| Construction & Extraction | 433 (100.0%) | 0 (0.0%) |
| Installation, Maintenance & Repair | 198 (100.0%) | 0 (0.0%) |
| Total (Category) | 731 (100.0%) | 0 (0.0%) |
| Total (Overall) | 5,290 (53.1%) | 4,674 (46.9%) |
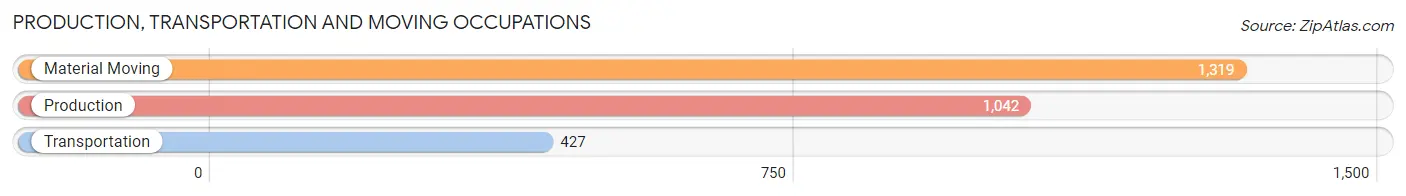
Production, Transportation and Moving Occupations
The most common Production, Transportation and Moving occupations in Kankakee are Material Moving (1,319 | 13.2%), Production (1,042 | 10.5%), and Transportation (427 | 4.3%).
Production, Transportation and Moving Occupations by Sex
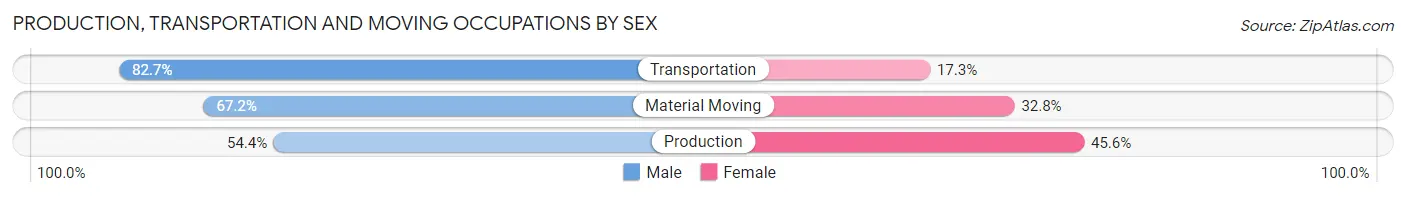
| Occupation | Male | Female |
| Production | 567 (54.4%) | 475 (45.6%) |
| Transportation | 353 (82.7%) | 74 (17.3%) |
| Material Moving | 886 (67.2%) | 433 (32.8%) |
| Total (Category) | 1,806 (64.8%) | 982 (35.2%) |
| Total (Overall) | 5,290 (53.1%) | 4,674 (46.9%) |
Employment Industries by Sex in Kankakee
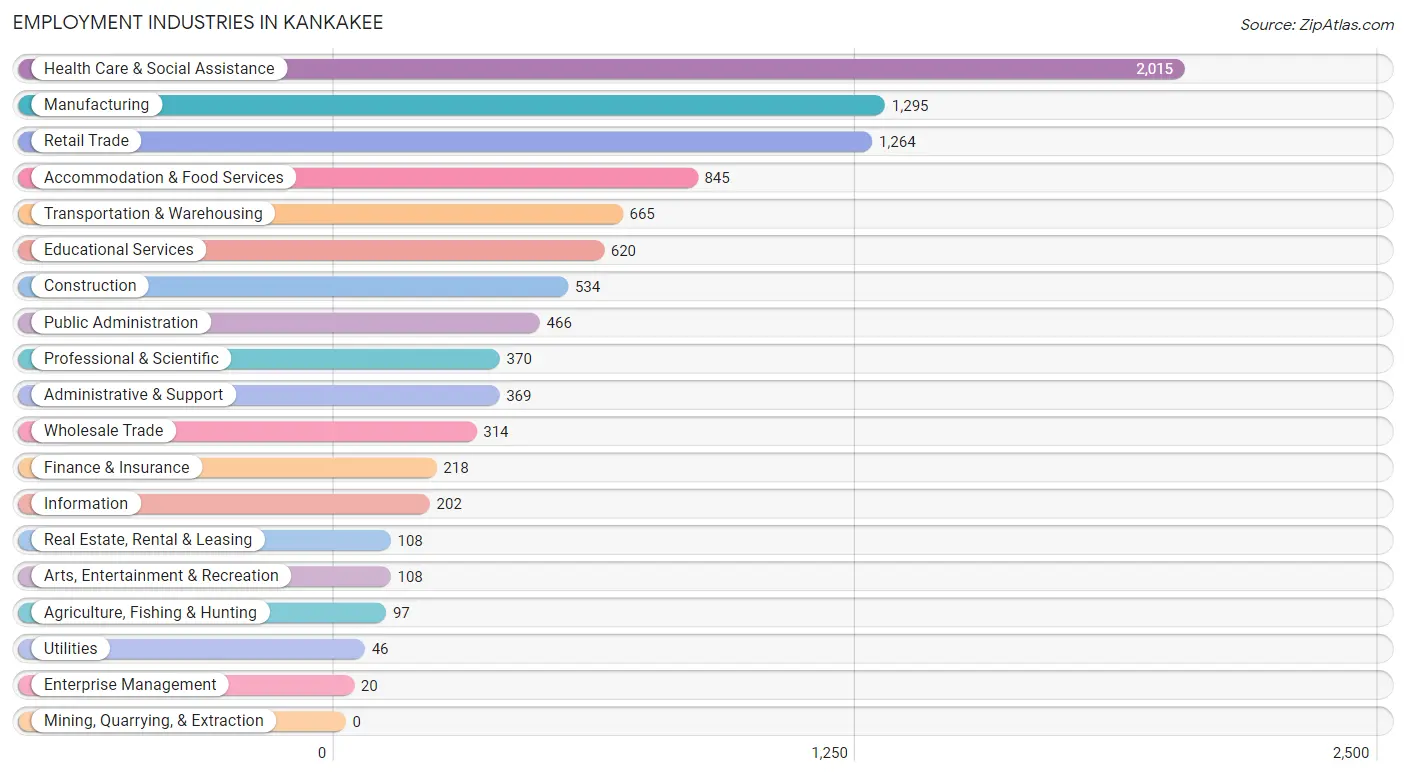
Employment Industries in Kankakee
The major employment industries in Kankakee include Health Care & Social Assistance (2,015 | 20.2%), Manufacturing (1,295 | 13.0%), Retail Trade (1,264 | 12.7%), Accommodation & Food Services (845 | 8.5%), and Transportation & Warehousing (665 | 6.7%).
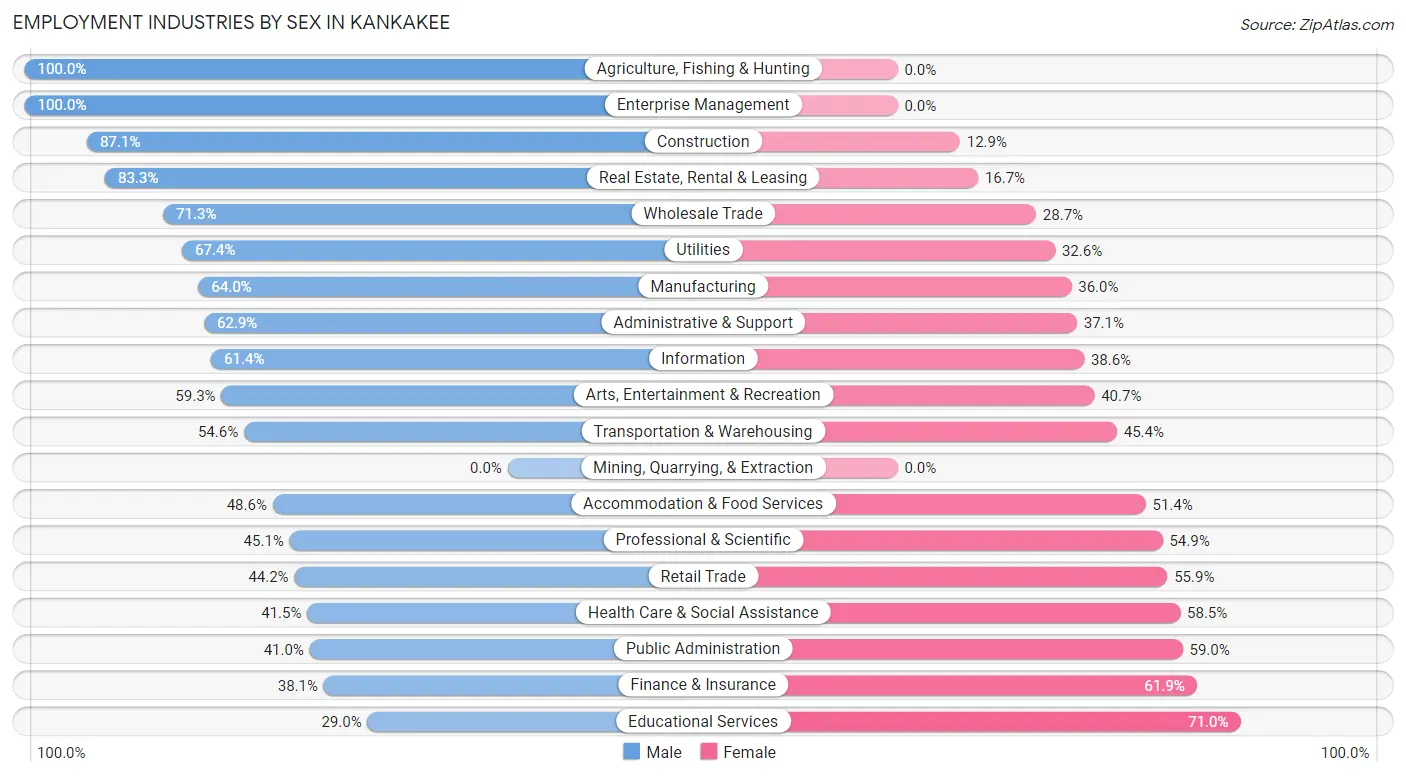
Employment Industries by Sex in Kankakee
The Kankakee industries that see more men than women are Agriculture, Fishing & Hunting (100.0%), Enterprise Management (100.0%), and Construction (87.1%), whereas the industries that tend to have a higher number of women are Educational Services (71.0%), Finance & Insurance (61.9%), and Public Administration (59.0%).
| Industry | Male | Female |
| Agriculture, Fishing & Hunting | 97 (100.0%) | 0 (0.0%) |
| Mining, Quarrying, & Extraction | 0 (0.0%) | 0 (0.0%) |
| Construction | 465 (87.1%) | 69 (12.9%) |
| Manufacturing | 829 (64.0%) | 466 (36.0%) |
| Wholesale Trade | 224 (71.3%) | 90 (28.7%) |
| Retail Trade | 558 (44.2%) | 706 (55.8%) |
| Transportation & Warehousing | 363 (54.6%) | 302 (45.4%) |
| Utilities | 31 (67.4%) | 15 (32.6%) |
| Information | 124 (61.4%) | 78 (38.6%) |
| Finance & Insurance | 83 (38.1%) | 135 (61.9%) |
| Real Estate, Rental & Leasing | 90 (83.3%) | 18 (16.7%) |
| Professional & Scientific | 167 (45.1%) | 203 (54.9%) |
| Enterprise Management | 20 (100.0%) | 0 (0.0%) |
| Administrative & Support | 232 (62.9%) | 137 (37.1%) |
| Educational Services | 180 (29.0%) | 440 (71.0%) |
| Health Care & Social Assistance | 836 (41.5%) | 1,179 (58.5%) |
| Arts, Entertainment & Recreation | 64 (59.3%) | 44 (40.7%) |
| Accommodation & Food Services | 411 (48.6%) | 434 (51.4%) |
| Public Administration | 191 (41.0%) | 275 (59.0%) |
| Total | 5,290 (53.1%) | 4,674 (46.9%) |
Education in Kankakee
School Enrollment in Kankakee
The most common levels of schooling among the 5,790 students in Kankakee are middle school (1,506 | 26.0%), high school (1,260 | 21.8%), and elementary school (1,184 | 20.4%).
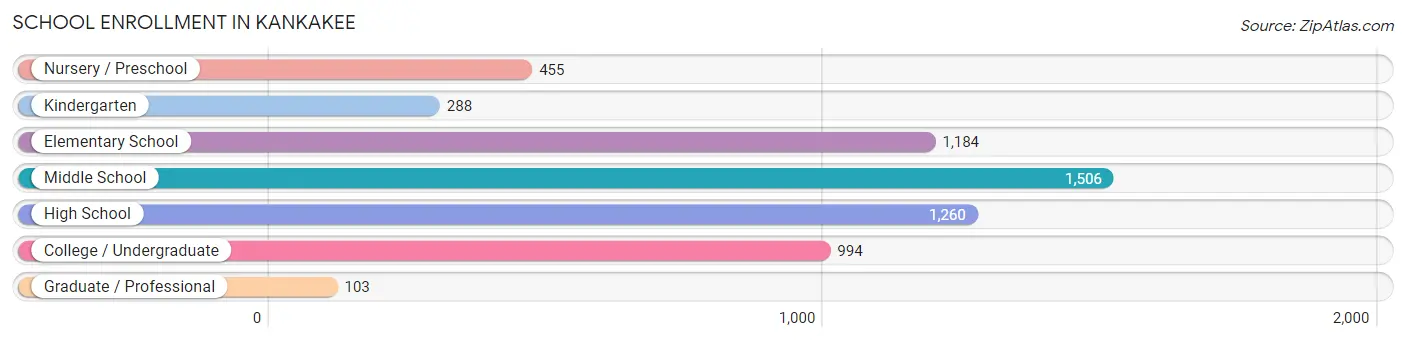
| School Level | # Students | % Students |
| Nursery / Preschool | 455 | 7.9% |
| Kindergarten | 288 | 5.0% |
| Elementary School | 1,184 | 20.4% |
| Middle School | 1,506 | 26.0% |
| High School | 1,260 | 21.8% |
| College / Undergraduate | 994 | 17.2% |
| Graduate / Professional | 103 | 1.8% |
| Total | 5,790 | 100.0% |
School Enrollment by Age by Funding Source in Kankakee
Out of a total of 5,790 students who are enrolled in schools in Kankakee, 336 (5.8%) attend a private institution, while the remaining 5,454 (94.2%) are enrolled in public schools. The age group of 35 years and over has the highest likelihood of being enrolled in private schools, with 66 (21.2% in the age bracket) enrolled. Conversely, the age group of 3 to 4 year olds has the lowest likelihood of being enrolled in a private school, with 378 (100.0% in the age bracket) attending a public institution.
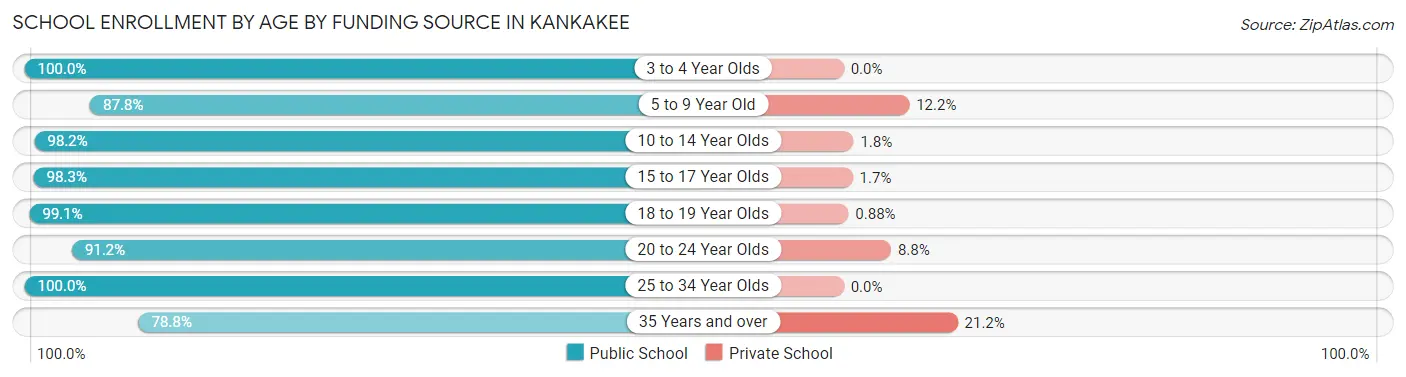
| Age Bracket | Public School | Private School |
| 3 to 4 Year Olds | 378 (100.0%) | 0 (0.0%) |
| 5 to 9 Year Old | 1,287 (87.8%) | 179 (12.2%) |
| 10 to 14 Year Olds | 1,729 (98.2%) | 32 (1.8%) |
| 15 to 17 Year Olds | 766 (98.3%) | 13 (1.7%) |
| 18 to 19 Year Olds | 450 (99.1%) | 4 (0.9%) |
| 20 to 24 Year Olds | 445 (91.2%) | 43 (8.8%) |
| 25 to 34 Year Olds | 153 (100.0%) | 0 (0.0%) |
| 35 Years and over | 245 (78.8%) | 66 (21.2%) |
| Total | 5,454 (94.2%) | 336 (5.8%) |
Educational Attainment by Field of Study in Kankakee
Education (429 | 18.7%), psychology (306 | 13.3%), business (291 | 12.7%), arts & humanities (200 | 8.7%), and communications (181 | 7.9%) are the most common fields of study among 2,296 individuals in Kankakee who have obtained a bachelor's degree or higher.
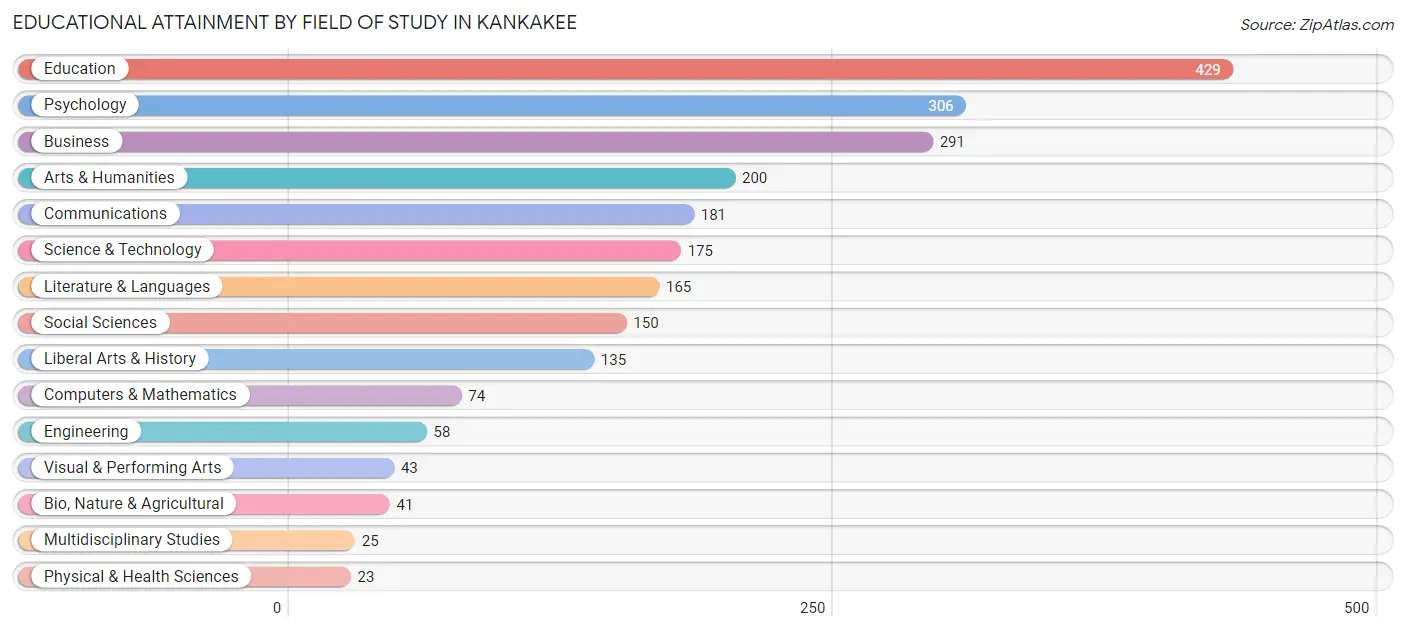
| Field of Study | # Graduates | % Graduates |
| Computers & Mathematics | 74 | 3.2% |
| Bio, Nature & Agricultural | 41 | 1.8% |
| Physical & Health Sciences | 23 | 1.0% |
| Psychology | 306 | 13.3% |
| Social Sciences | 150 | 6.5% |
| Engineering | 58 | 2.5% |
| Multidisciplinary Studies | 25 | 1.1% |
| Science & Technology | 175 | 7.6% |
| Business | 291 | 12.7% |
| Education | 429 | 18.7% |
| Literature & Languages | 165 | 7.2% |
| Liberal Arts & History | 135 | 5.9% |
| Visual & Performing Arts | 43 | 1.9% |
| Communications | 181 | 7.9% |
| Arts & Humanities | 200 | 8.7% |
| Total | 2,296 | 100.0% |
Transportation & Commute in Kankakee
Vehicle Availability by Sex in Kankakee
The most prevalent vehicle ownership categories in Kankakee are males with 2 vehicles (2,069, accounting for 40.8%) and females with 2 vehicles (1,492, making up 46.1%).
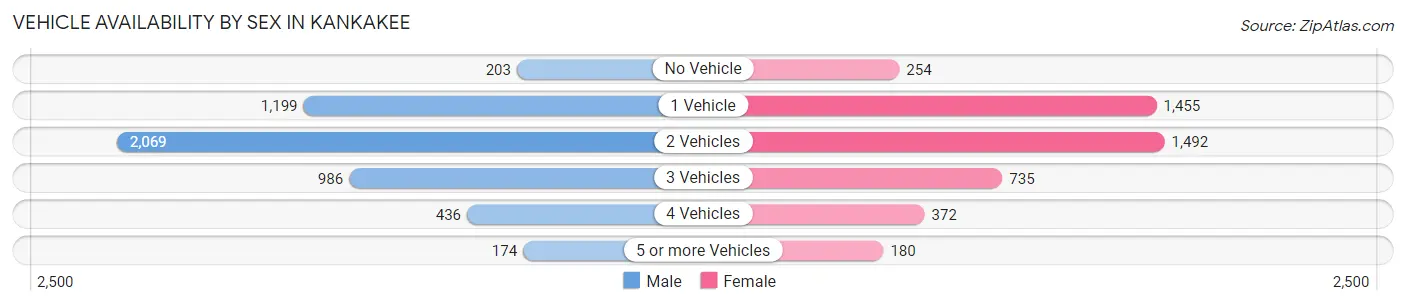
| Vehicles Available | Male | Female |
| No Vehicle | 203 (4.0%) | 254 (5.7%) |
| 1 Vehicle | 1,199 (23.7%) | 1,455 (32.4%) |
| 2 Vehicles | 2,069 (40.8%) | 1,492 (33.2%) |
| 3 Vehicles | 986 (19.5%) | 735 (16.4%) |
| 4 Vehicles | 436 (8.6%) | 372 (8.3%) |
| 5 or more Vehicles | 174 (3.4%) | 180 (4.0%) |
| Total | 5,067 (100.0%) | 4,488 (100.0%) |
Commute Time in Kankakee
The most frequently occuring commute durations in Kankakee are 10 to 14 minutes (1,903 commuters, 20.1%), 5 to 9 minutes (1,666 commuters, 17.6%), and 20 to 24 minutes (1,364 commuters, 14.4%).
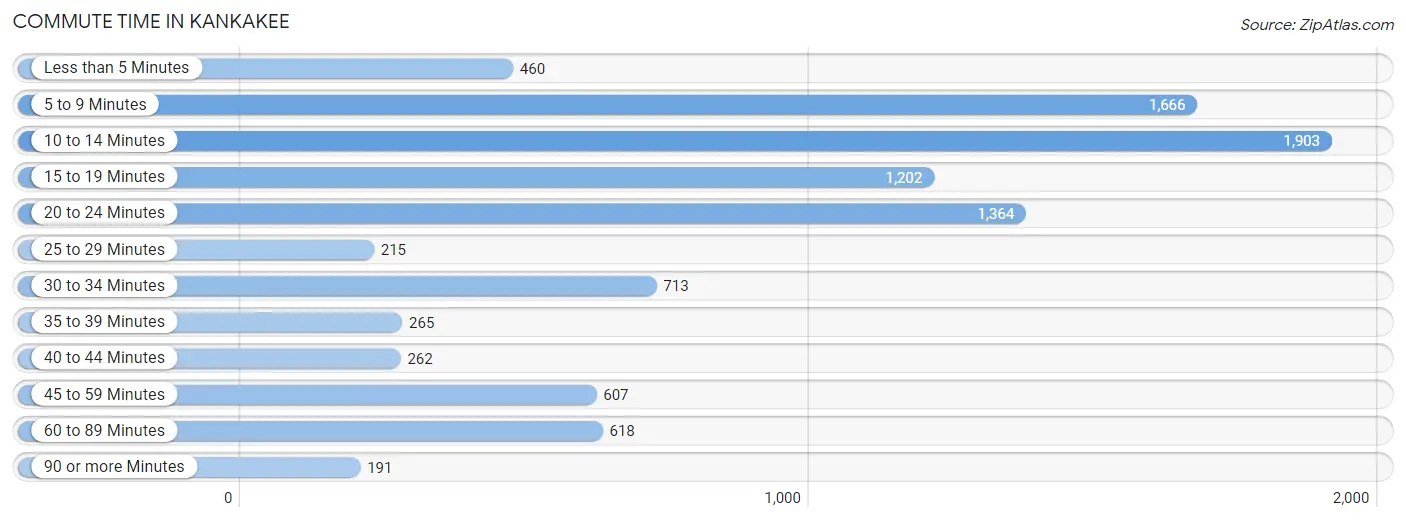
| Commute Time | # Commuters | % Commuters |
| Less than 5 Minutes | 460 | 4.9% |
| 5 to 9 Minutes | 1,666 | 17.6% |
| 10 to 14 Minutes | 1,903 | 20.1% |
| 15 to 19 Minutes | 1,202 | 12.7% |
| 20 to 24 Minutes | 1,364 | 14.4% |
| 25 to 29 Minutes | 215 | 2.3% |
| 30 to 34 Minutes | 713 | 7.5% |
| 35 to 39 Minutes | 265 | 2.8% |
| 40 to 44 Minutes | 262 | 2.8% |
| 45 to 59 Minutes | 607 | 6.4% |
| 60 to 89 Minutes | 618 | 6.5% |
| 90 or more Minutes | 191 | 2.0% |
Commute Time by Sex in Kankakee
The most common commute times in Kankakee are 10 to 14 minutes (902 commuters, 17.7%) for males and 10 to 14 minutes (1,001 commuters, 22.9%) for females.
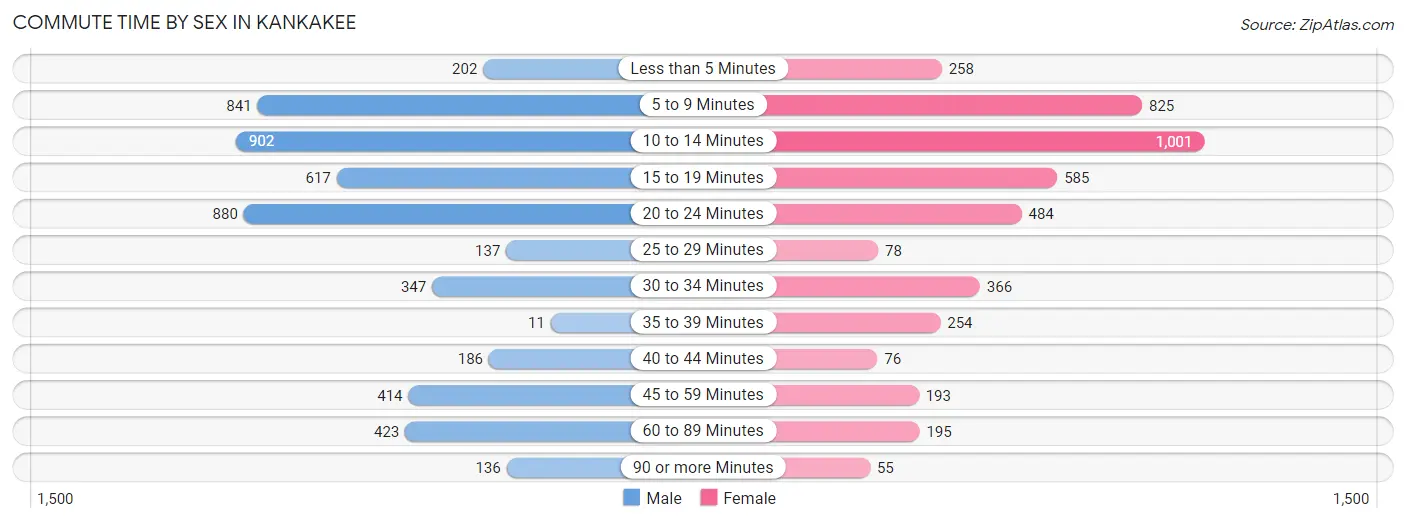
| Commute Time | Male | Female |
| Less than 5 Minutes | 202 (4.0%) | 258 (5.9%) |
| 5 to 9 Minutes | 841 (16.5%) | 825 (18.9%) |
| 10 to 14 Minutes | 902 (17.7%) | 1,001 (22.9%) |
| 15 to 19 Minutes | 617 (12.1%) | 585 (13.4%) |
| 20 to 24 Minutes | 880 (17.3%) | 484 (11.1%) |
| 25 to 29 Minutes | 137 (2.7%) | 78 (1.8%) |
| 30 to 34 Minutes | 347 (6.8%) | 366 (8.4%) |
| 35 to 39 Minutes | 11 (0.2%) | 254 (5.8%) |
| 40 to 44 Minutes | 186 (3.6%) | 76 (1.7%) |
| 45 to 59 Minutes | 414 (8.1%) | 193 (4.4%) |
| 60 to 89 Minutes | 423 (8.3%) | 195 (4.5%) |
| 90 or more Minutes | 136 (2.7%) | 55 (1.3%) |
Time of Departure to Work by Sex in Kankakee
The most frequent times of departure to work in Kankakee are 6:00 AM to 6:29 AM (630, 12.4%) for males and 6:00 AM to 6:29 AM (558, 12.8%) for females.
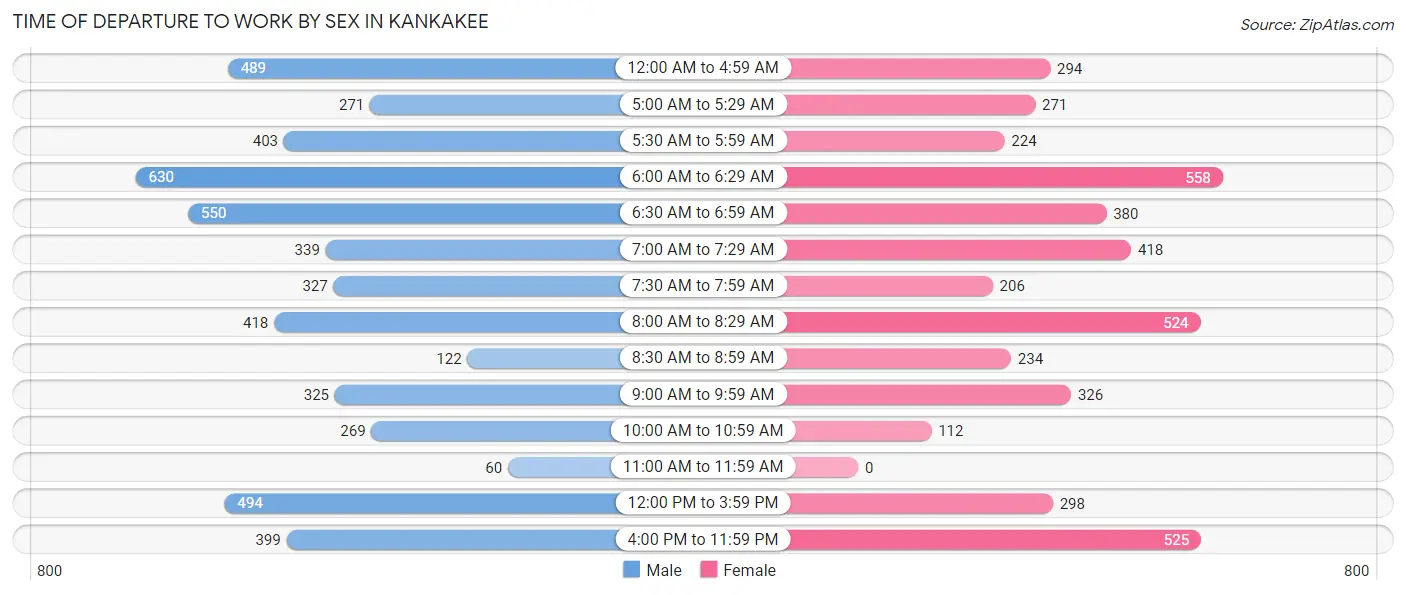
| Time of Departure | Male | Female |
| 12:00 AM to 4:59 AM | 489 (9.6%) | 294 (6.7%) |
| 5:00 AM to 5:29 AM | 271 (5.3%) | 271 (6.2%) |
| 5:30 AM to 5:59 AM | 403 (7.9%) | 224 (5.1%) |
| 6:00 AM to 6:29 AM | 630 (12.4%) | 558 (12.8%) |
| 6:30 AM to 6:59 AM | 550 (10.8%) | 380 (8.7%) |
| 7:00 AM to 7:29 AM | 339 (6.7%) | 418 (9.6%) |
| 7:30 AM to 7:59 AM | 327 (6.4%) | 206 (4.7%) |
| 8:00 AM to 8:29 AM | 418 (8.2%) | 524 (12.0%) |
| 8:30 AM to 8:59 AM | 122 (2.4%) | 234 (5.3%) |
| 9:00 AM to 9:59 AM | 325 (6.4%) | 326 (7.5%) |
| 10:00 AM to 10:59 AM | 269 (5.3%) | 112 (2.6%) |
| 11:00 AM to 11:59 AM | 60 (1.2%) | 0 (0.0%) |
| 12:00 PM to 3:59 PM | 494 (9.7%) | 298 (6.8%) |
| 4:00 PM to 11:59 PM | 399 (7.8%) | 525 (12.0%) |
| Total | 5,096 (100.0%) | 4,370 (100.0%) |
Housing Occupancy in Kankakee
Occupancy by Ownership in Kankakee
Of the total 9,349 dwellings in Kankakee, owner-occupied units account for 4,573 (48.9%), while renter-occupied units make up 4,776 (51.1%).
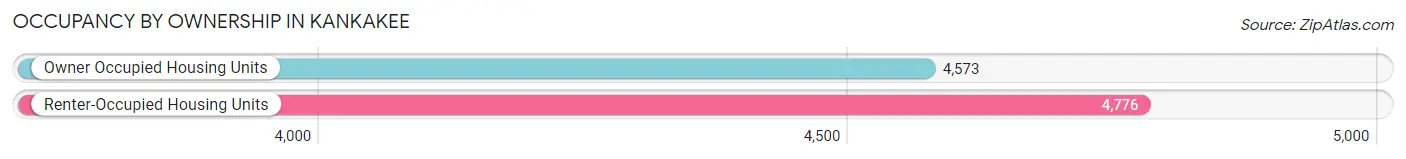
| Occupancy | # Housing Units | % Housing Units |
| Owner Occupied Housing Units | 4,573 | 48.9% |
| Renter-Occupied Housing Units | 4,776 | 51.1% |
| Total Occupied Housing Units | 9,349 | 100.0% |
Occupancy by Household Size in Kankakee
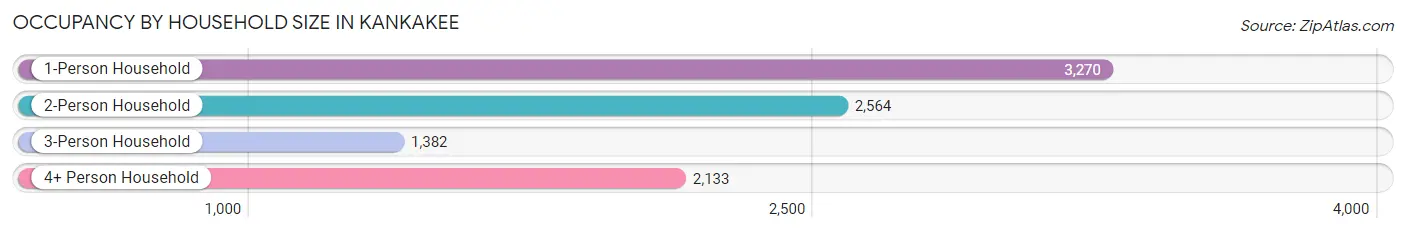
| Household Size | # Housing Units | % Housing Units |
| 1-Person Household | 3,270 | 35.0% |
| 2-Person Household | 2,564 | 27.4% |
| 3-Person Household | 1,382 | 14.8% |
| 4+ Person Household | 2,133 | 22.8% |
| Total Housing Units | 9,349 | 100.0% |
Occupancy by Ownership by Household Size in Kankakee
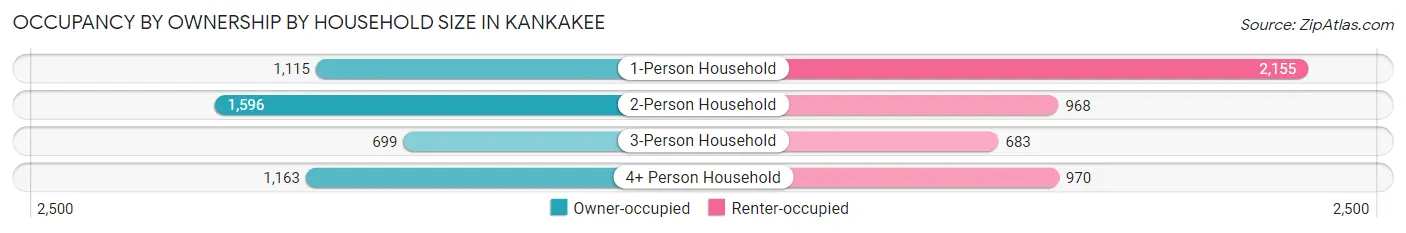
| Household Size | Owner-occupied | Renter-occupied |
| 1-Person Household | 1,115 (34.1%) | 2,155 (65.9%) |
| 2-Person Household | 1,596 (62.3%) | 968 (37.8%) |
| 3-Person Household | 699 (50.6%) | 683 (49.4%) |
| 4+ Person Household | 1,163 (54.5%) | 970 (45.5%) |
| Total Housing Units | 4,573 (48.9%) | 4,776 (51.1%) |
Occupancy by Educational Attainment in Kankakee
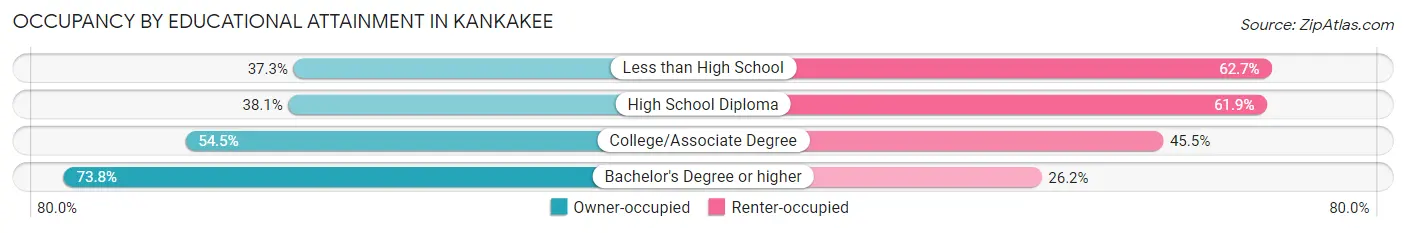
| Household Size | Owner-occupied | Renter-occupied |
| Less than High School | 550 (37.3%) | 924 (62.7%) |
| High School Diploma | 1,208 (38.1%) | 1,959 (61.9%) |
| College/Associate Degree | 1,863 (54.5%) | 1,555 (45.5%) |
| Bachelor's Degree or higher | 952 (73.8%) | 338 (26.2%) |
Occupancy by Age of Householder in Kankakee
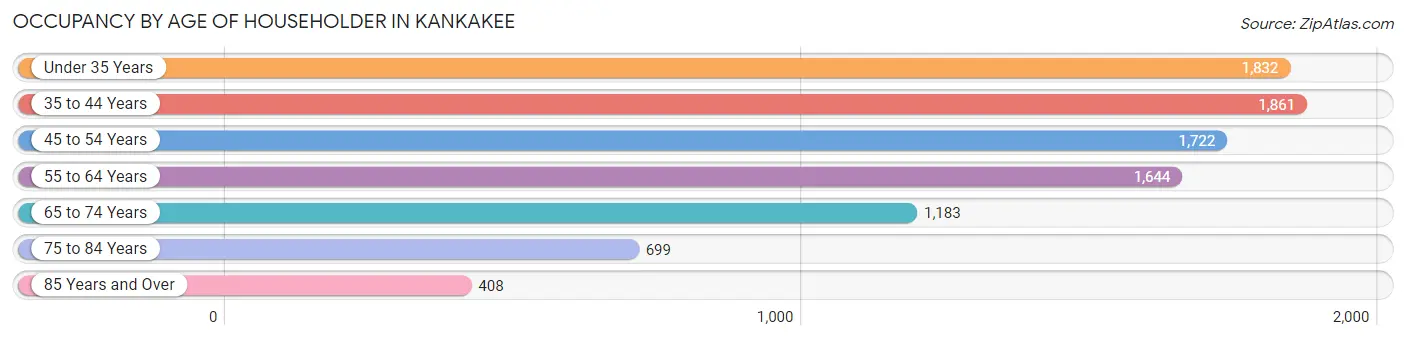
| Age Bracket | # Households | % Households |
| Under 35 Years | 1,832 | 19.6% |
| 35 to 44 Years | 1,861 | 19.9% |
| 45 to 54 Years | 1,722 | 18.4% |
| 55 to 64 Years | 1,644 | 17.6% |
| 65 to 74 Years | 1,183 | 12.7% |
| 75 to 84 Years | 699 | 7.5% |
| 85 Years and Over | 408 | 4.4% |
| Total | 9,349 | 100.0% |
Housing Finances in Kankakee
Median Income by Occupancy in Kankakee
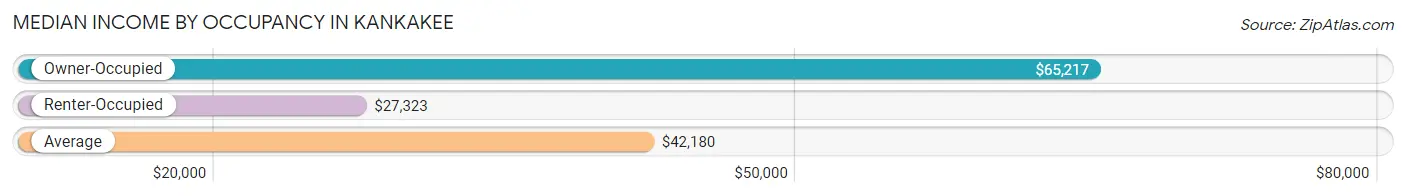
| Occupancy Type | # Households | Median Income |
| Owner-Occupied | 4,573 (48.9%) | $65,217 |
| Renter-Occupied | 4,776 (51.1%) | $27,323 |
| Average | 9,349 (100.0%) | $42,180 |
Occupancy by Householder Income Bracket in Kankakee
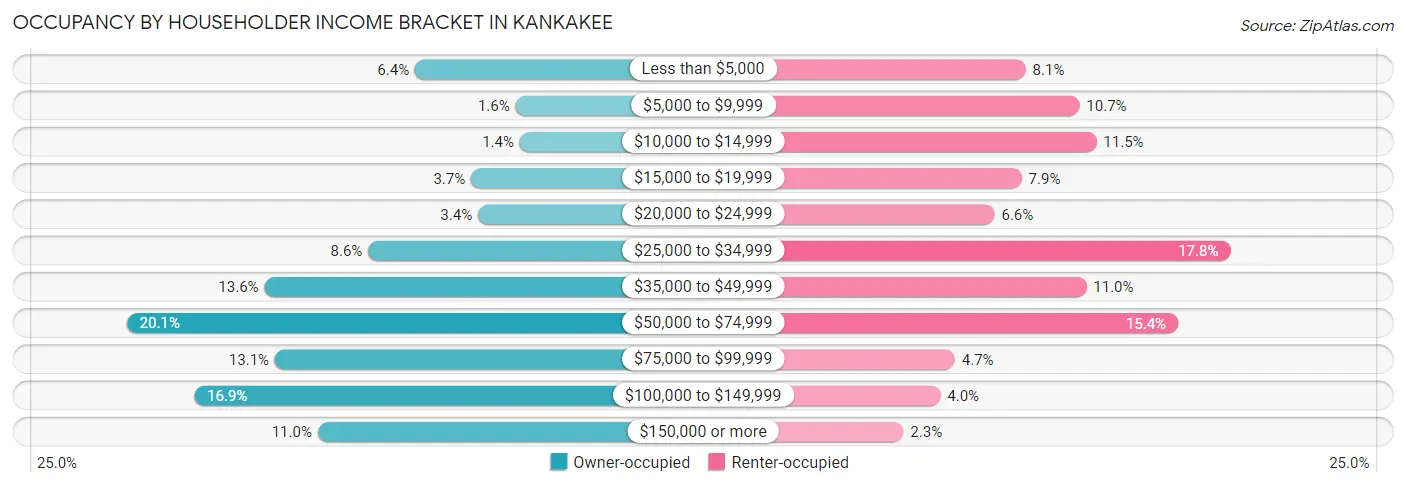
| Income Bracket | Owner-occupied | Renter-occupied |
| Less than $5,000 | 293 (6.4%) | 387 (8.1%) |
| $5,000 to $9,999 | 74 (1.6%) | 509 (10.7%) |
| $10,000 to $14,999 | 65 (1.4%) | 548 (11.5%) |
| $15,000 to $19,999 | 171 (3.7%) | 378 (7.9%) |
| $20,000 to $24,999 | 156 (3.4%) | 316 (6.6%) |
| $25,000 to $34,999 | 395 (8.6%) | 852 (17.8%) |
| $35,000 to $49,999 | 621 (13.6%) | 525 (11.0%) |
| $50,000 to $74,999 | 921 (20.1%) | 733 (15.3%) |
| $75,000 to $99,999 | 598 (13.1%) | 226 (4.7%) |
| $100,000 to $149,999 | 774 (16.9%) | 193 (4.0%) |
| $150,000 or more | 505 (11.0%) | 109 (2.3%) |
| Total | 4,573 (100.0%) | 4,776 (100.0%) |
Monthly Housing Cost Tiers in Kankakee
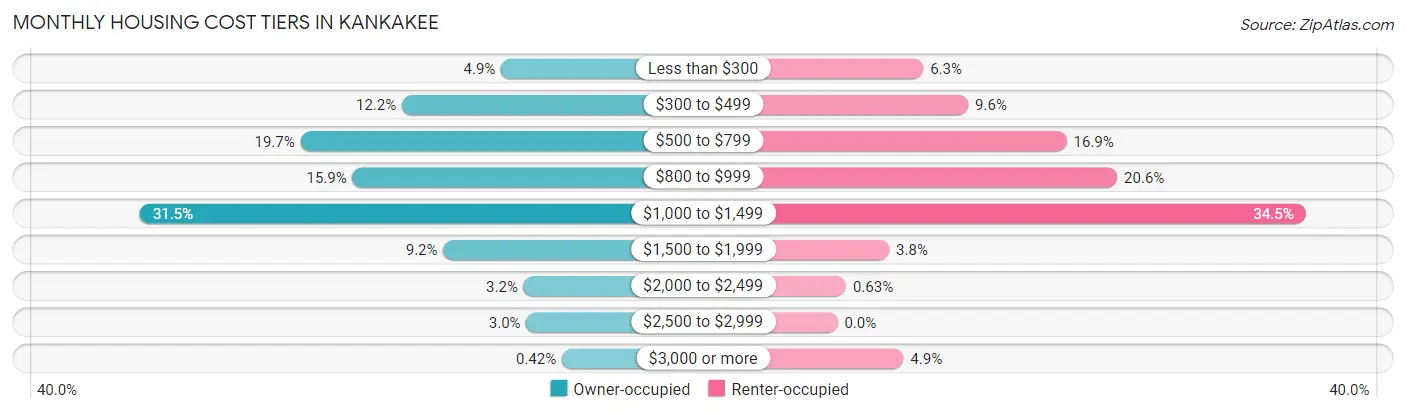
| Monthly Cost | Owner-occupied | Renter-occupied |
| Less than $300 | 224 (4.9%) | 302 (6.3%) |
| $300 to $499 | 558 (12.2%) | 460 (9.6%) |
| $500 to $799 | 900 (19.7%) | 806 (16.9%) |
| $800 to $999 | 725 (15.9%) | 984 (20.6%) |
| $1,000 to $1,499 | 1,441 (31.5%) | 1,647 (34.5%) |
| $1,500 to $1,999 | 419 (9.2%) | 182 (3.8%) |
| $2,000 to $2,499 | 148 (3.2%) | 30 (0.6%) |
| $2,500 to $2,999 | 139 (3.0%) | 0 (0.0%) |
| $3,000 or more | 19 (0.4%) | 232 (4.9%) |
| Total | 4,573 (100.0%) | 4,776 (100.0%) |
Physical Housing Characteristics in Kankakee
Housing Structures in Kankakee
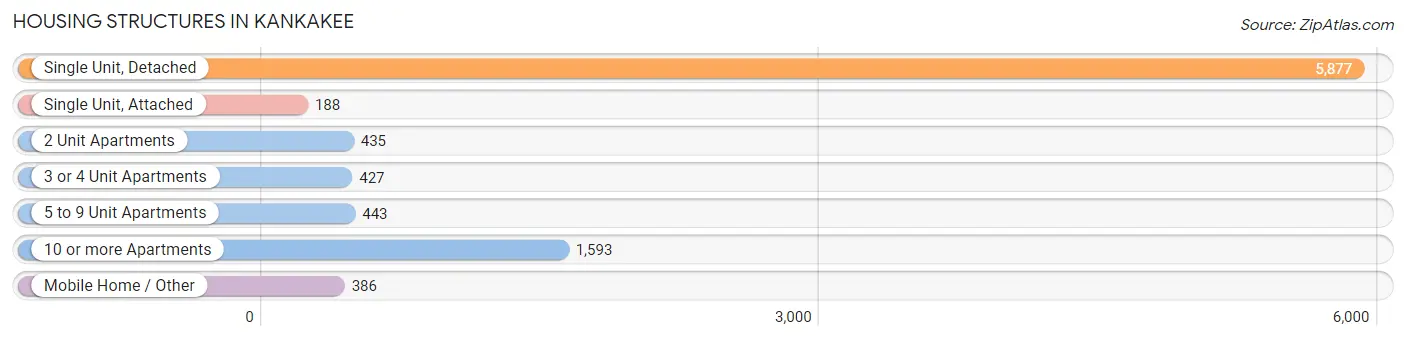
| Structure Type | # Housing Units | % Housing Units |
| Single Unit, Detached | 5,877 | 62.9% |
| Single Unit, Attached | 188 | 2.0% |
| 2 Unit Apartments | 435 | 4.6% |
| 3 or 4 Unit Apartments | 427 | 4.6% |
| 5 to 9 Unit Apartments | 443 | 4.7% |
| 10 or more Apartments | 1,593 | 17.0% |
| Mobile Home / Other | 386 | 4.1% |
| Total | 9,349 | 100.0% |
Housing Structures by Occupancy in Kankakee
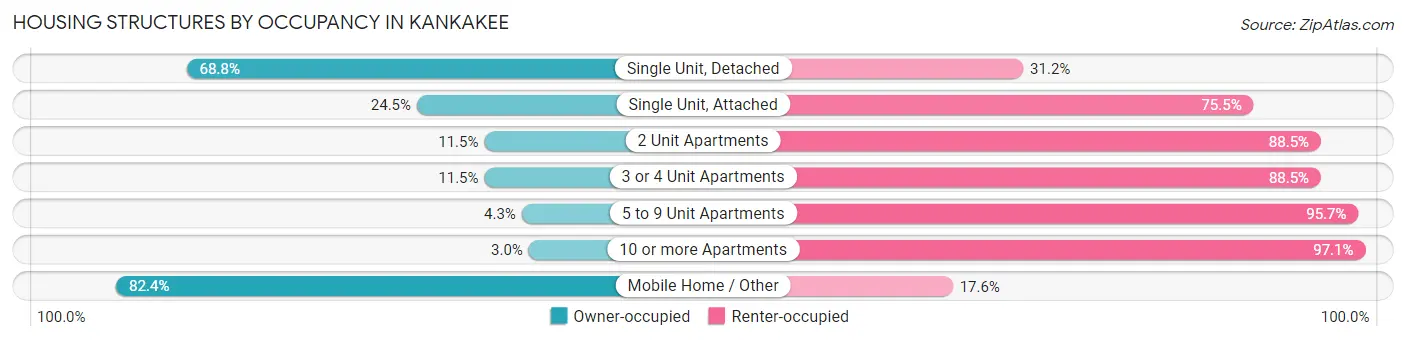
| Structure Type | Owner-occupied | Renter-occupied |
| Single Unit, Detached | 4,044 (68.8%) | 1,833 (31.2%) |
| Single Unit, Attached | 46 (24.5%) | 142 (75.5%) |
| 2 Unit Apartments | 50 (11.5%) | 385 (88.5%) |
| 3 or 4 Unit Apartments | 49 (11.5%) | 378 (88.5%) |
| 5 to 9 Unit Apartments | 19 (4.3%) | 424 (95.7%) |
| 10 or more Apartments | 47 (2.9%) | 1,546 (97.1%) |
| Mobile Home / Other | 318 (82.4%) | 68 (17.6%) |
| Total | 4,573 (48.9%) | 4,776 (51.1%) |
Housing Structures by Number of Rooms in Kankakee
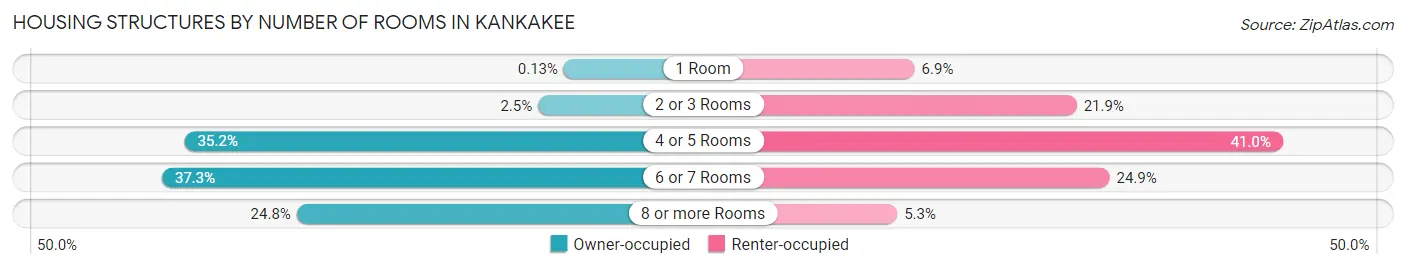
| Number of Rooms | Owner-occupied | Renter-occupied |
| 1 Room | 6 (0.1%) | 330 (6.9%) |
| 2 or 3 Rooms | 115 (2.5%) | 1,046 (21.9%) |
| 4 or 5 Rooms | 1,610 (35.2%) | 1,956 (40.9%) |
| 6 or 7 Rooms | 1,706 (37.3%) | 1,191 (24.9%) |
| 8 or more Rooms | 1,136 (24.8%) | 253 (5.3%) |
| Total | 4,573 (100.0%) | 4,776 (100.0%) |
Housing Structure by Heating Type in Kankakee
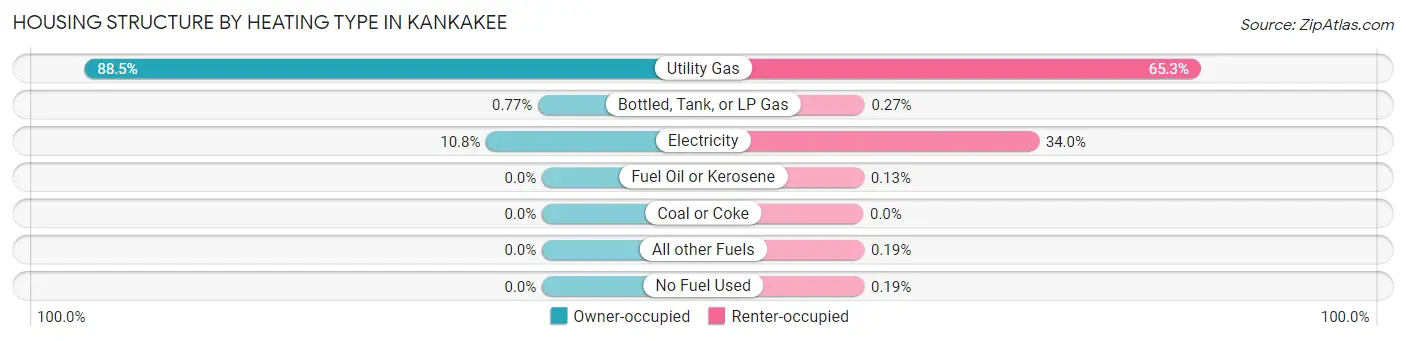
| Heating Type | Owner-occupied | Renter-occupied |
| Utility Gas | 4,045 (88.4%) | 3,117 (65.3%) |
| Bottled, Tank, or LP Gas | 35 (0.8%) | 13 (0.3%) |
| Electricity | 493 (10.8%) | 1,622 (34.0%) |
| Fuel Oil or Kerosene | 0 (0.0%) | 6 (0.1%) |
| Coal or Coke | 0 (0.0%) | 0 (0.0%) |
| All other Fuels | 0 (0.0%) | 9 (0.2%) |
| No Fuel Used | 0 (0.0%) | 9 (0.2%) |
| Total | 4,573 (100.0%) | 4,776 (100.0%) |
Household Vehicle Usage in Kankakee
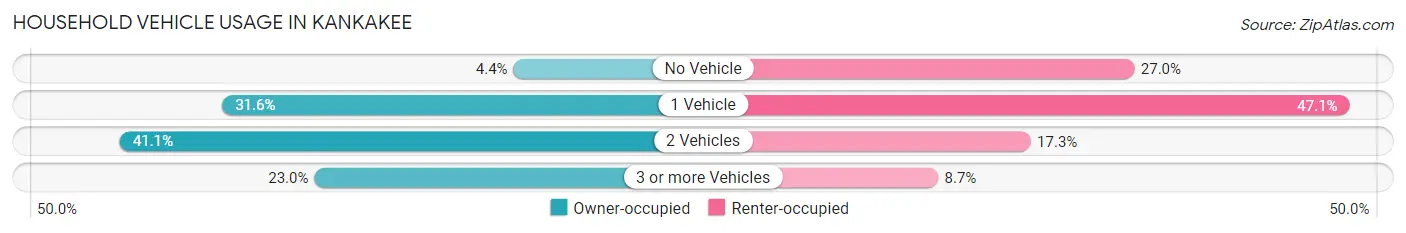
| Vehicles per Household | Owner-occupied | Renter-occupied |
| No Vehicle | 200 (4.4%) | 1,288 (27.0%) |
| 1 Vehicle | 1,443 (31.6%) | 2,249 (47.1%) |
| 2 Vehicles | 1,880 (41.1%) | 826 (17.3%) |
| 3 or more Vehicles | 1,050 (23.0%) | 413 (8.6%) |
| Total | 4,573 (100.0%) | 4,776 (100.0%) |
Real Estate & Mortgages in Kankakee
Real Estate and Mortgage Overview in Kankakee
| Characteristic | Without Mortgage | With Mortgage |
| Housing Units | 2,022 | 2,551 |
| Median Property Value | $80,900 | $110,400 |
| Median Household Income | $56,725 | $334 |
| Monthly Housing Costs | $571 | $19 |
| Real Estate Taxes | $2,252 | $94 |
Property Value by Mortgage Status in Kankakee
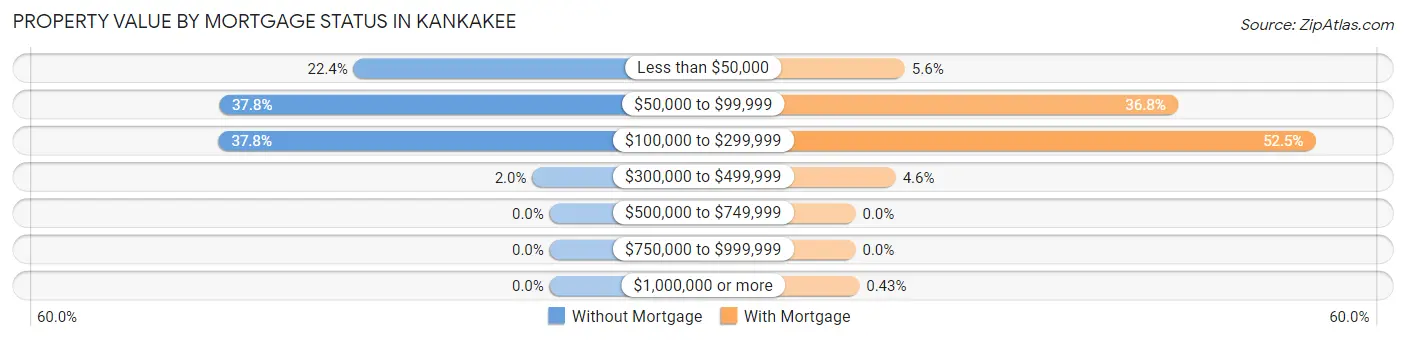
| Property Value | Without Mortgage | With Mortgage |
| Less than $50,000 | 453 (22.4%) | 144 (5.6%) |
| $50,000 to $99,999 | 764 (37.8%) | 939 (36.8%) |
| $100,000 to $299,999 | 765 (37.8%) | 1,340 (52.5%) |
| $300,000 to $499,999 | 40 (2.0%) | 117 (4.6%) |
| $500,000 to $749,999 | 0 (0.0%) | 0 (0.0%) |
| $750,000 to $999,999 | 0 (0.0%) | 0 (0.0%) |
| $1,000,000 or more | 0 (0.0%) | 11 (0.4%) |
| Total | 2,022 (100.0%) | 2,551 (100.0%) |
Household Income by Mortgage Status in Kankakee
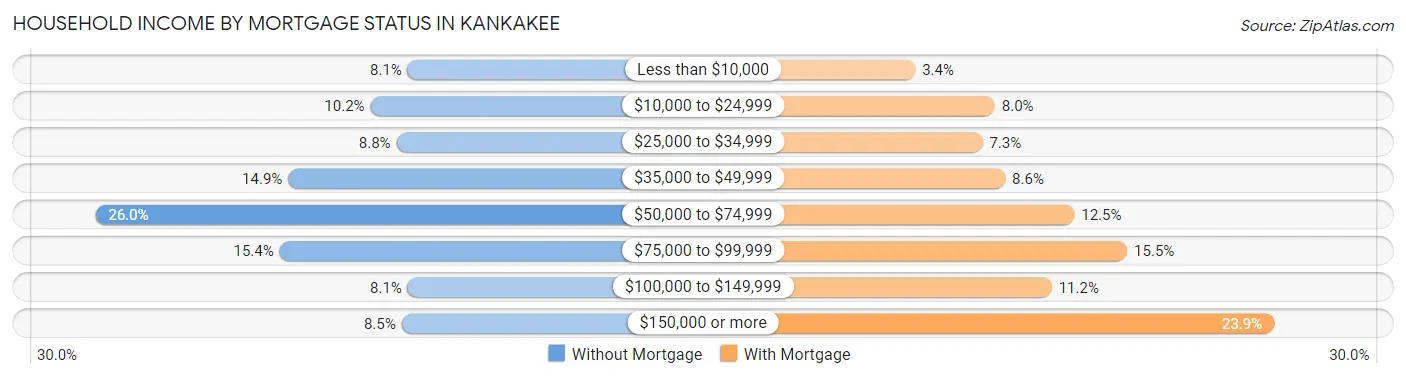
| Household Income | Without Mortgage | With Mortgage |
| Less than $10,000 | 164 (8.1%) | 87 (3.4%) |
| $10,000 to $24,999 | 207 (10.2%) | 203 (8.0%) |
| $25,000 to $34,999 | 177 (8.7%) | 185 (7.2%) |
| $35,000 to $49,999 | 302 (14.9%) | 218 (8.6%) |
| $50,000 to $74,999 | 525 (26.0%) | 319 (12.5%) |
| $75,000 to $99,999 | 312 (15.4%) | 396 (15.5%) |
| $100,000 to $149,999 | 164 (8.1%) | 286 (11.2%) |
| $150,000 or more | 171 (8.5%) | 610 (23.9%) |
| Total | 2,022 (100.0%) | 2,551 (100.0%) |
Property Value to Household Income Ratio in Kankakee
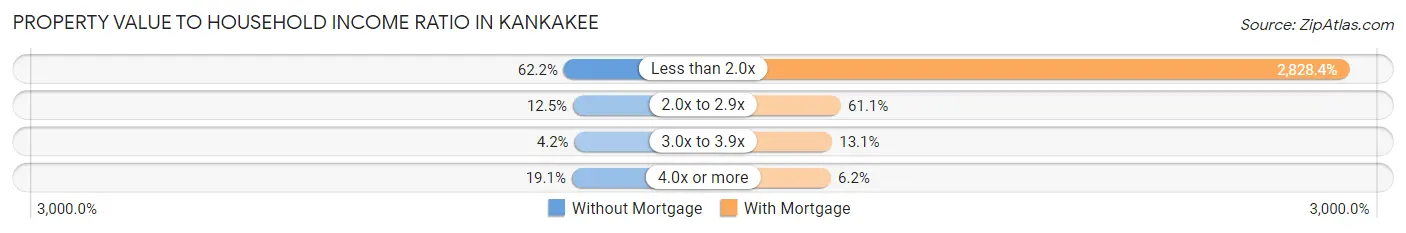
| Value-to-Income Ratio | Without Mortgage | With Mortgage |
| Less than 2.0x | 1,258 (62.2%) | 72,153 (2,828.4%) |
| 2.0x to 2.9x | 252 (12.5%) | 1,558 (61.1%) |
| 3.0x to 3.9x | 85 (4.2%) | 333 (13.1%) |
| 4.0x or more | 387 (19.1%) | 159 (6.2%) |
| Total | 2,022 (100.0%) | 2,551 (100.0%) |
Real Estate Taxes by Mortgage Status in Kankakee
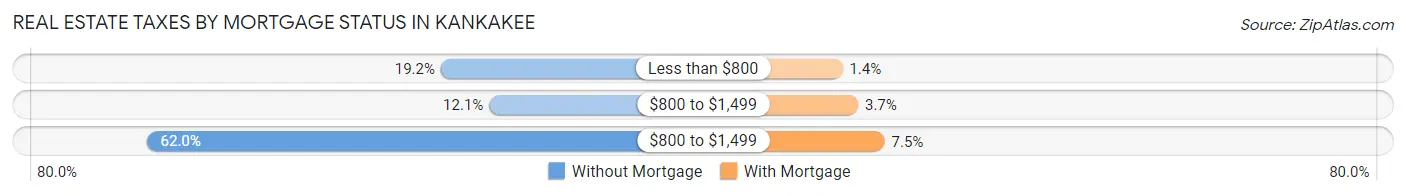
| Property Taxes | Without Mortgage | With Mortgage |
| Less than $800 | 388 (19.2%) | 35 (1.4%) |
| $800 to $1,499 | 245 (12.1%) | 93 (3.6%) |
| $800 to $1,499 | 1,254 (62.0%) | 192 (7.5%) |
| Total | 2,022 (100.0%) | 2,551 (100.0%) |
Health & Disability in Kankakee
Health Insurance Coverage by Age in Kankakee
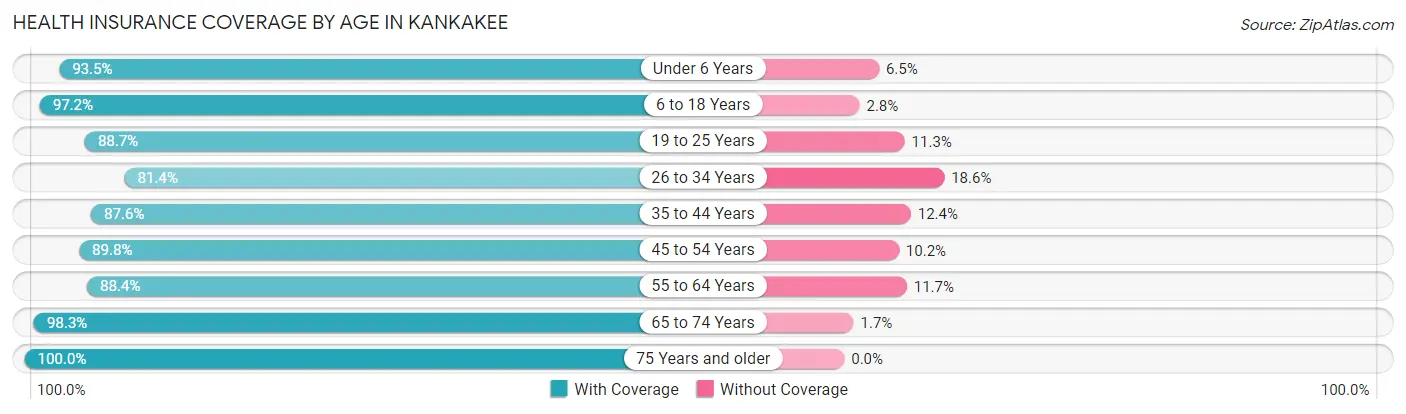
| Age Bracket | With Coverage | Without Coverage |
| Under 6 Years | 1,695 (93.5%) | 117 (6.5%) |
| 6 to 18 Years | 4,832 (97.2%) | 141 (2.8%) |
| 19 to 25 Years | 1,796 (88.7%) | 228 (11.3%) |
| 26 to 34 Years | 2,344 (81.4%) | 537 (18.6%) |
| 35 to 44 Years | 2,882 (87.6%) | 408 (12.4%) |
| 45 to 54 Years | 2,629 (89.8%) | 298 (10.2%) |
| 55 to 64 Years | 2,480 (88.3%) | 327 (11.7%) |
| 65 to 74 Years | 1,924 (98.3%) | 34 (1.7%) |
| 75 Years and older | 1,600 (100.0%) | 0 (0.0%) |
| Total | 22,182 (91.4%) | 2,090 (8.6%) |
Health Insurance Coverage by Citizenship Status in Kankakee
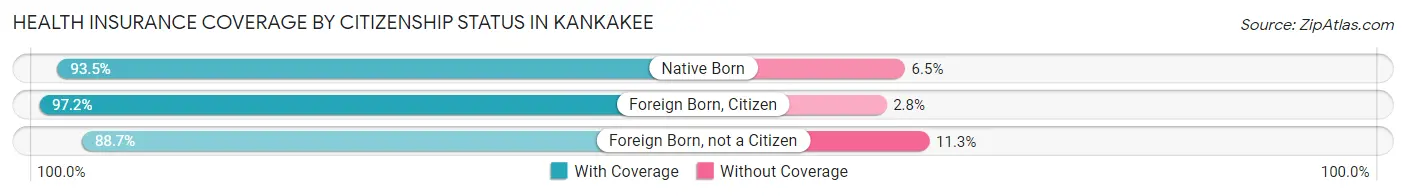
| Citizenship Status | With Coverage | Without Coverage |
| Native Born | 1,695 (93.5%) | 117 (6.5%) |
| Foreign Born, Citizen | 4,832 (97.2%) | 141 (2.8%) |
| Foreign Born, not a Citizen | 1,796 (88.7%) | 228 (11.3%) |
Health Insurance Coverage by Household Income in Kankakee
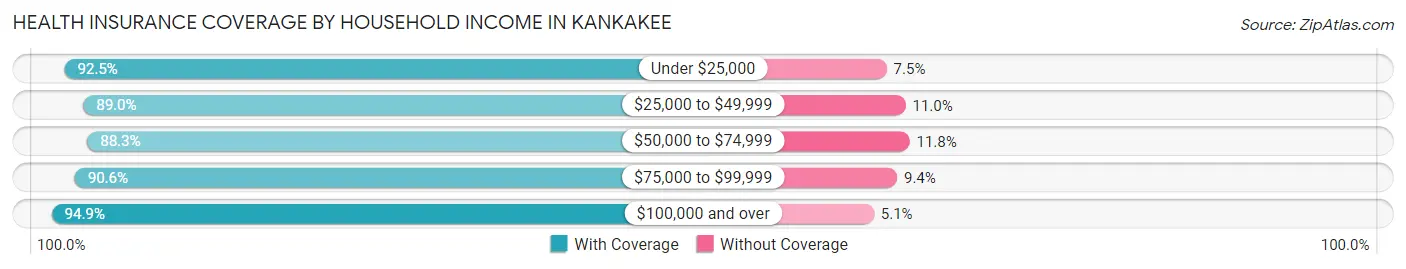
| Household Income | With Coverage | Without Coverage |
| Under $25,000 | 5,313 (92.5%) | 429 (7.5%) |
| $25,000 to $49,999 | 5,348 (89.0%) | 662 (11.0%) |
| $50,000 to $74,999 | 3,807 (88.2%) | 507 (11.7%) |
| $75,000 to $99,999 | 2,071 (90.6%) | 215 (9.4%) |
| $100,000 and over | 4,798 (94.9%) | 256 (5.1%) |
Public vs Private Health Insurance Coverage by Age in Kankakee
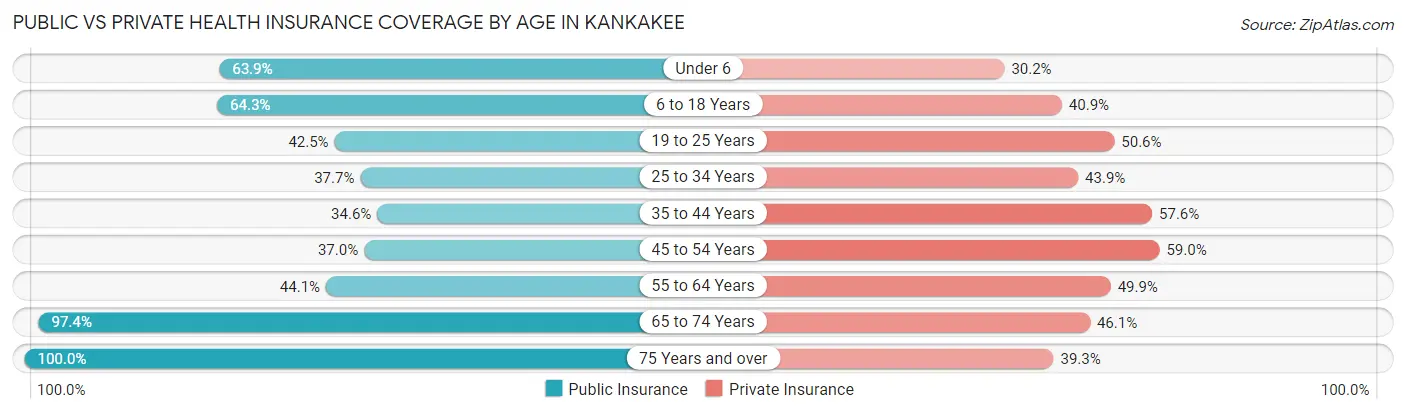
| Age Bracket | Public Insurance | Private Insurance |
| Under 6 | 1,157 (63.8%) | 547 (30.2%) |
| 6 to 18 Years | 3,195 (64.2%) | 2,032 (40.9%) |
| 19 to 25 Years | 860 (42.5%) | 1,024 (50.6%) |
| 25 to 34 Years | 1,086 (37.7%) | 1,264 (43.9%) |
| 35 to 44 Years | 1,137 (34.6%) | 1,895 (57.6%) |
| 45 to 54 Years | 1,083 (37.0%) | 1,726 (59.0%) |
| 55 to 64 Years | 1,237 (44.1%) | 1,401 (49.9%) |
| 65 to 74 Years | 1,907 (97.4%) | 902 (46.1%) |
| 75 Years and over | 1,600 (100.0%) | 629 (39.3%) |
| Total | 13,262 (54.6%) | 11,420 (47.0%) |
Disability Status by Sex by Age in Kankakee
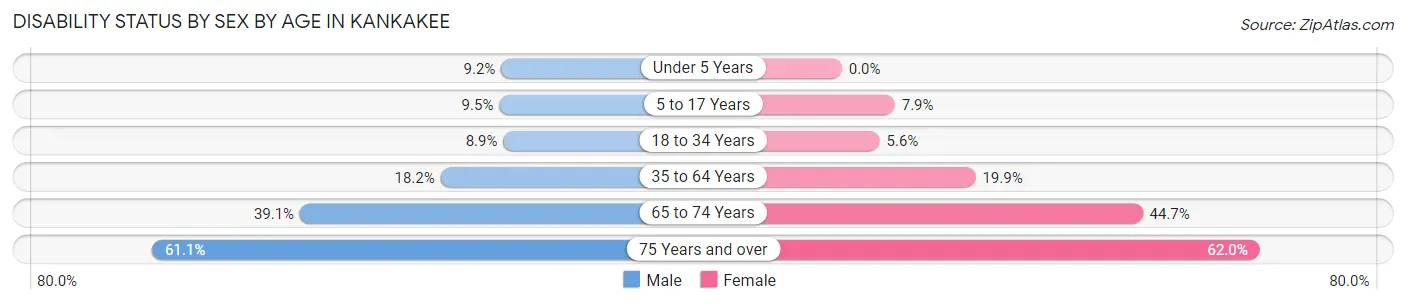
| Age Bracket | Male | Female |
| Under 5 Years | 78 (9.2%) | 0 (0.0%) |
| 5 to 17 Years | 217 (9.5%) | 195 (7.9%) |
| 18 to 34 Years | 238 (8.9%) | 147 (5.6%) |
| 35 to 64 Years | 829 (18.2%) | 889 (19.9%) |
| 65 to 74 Years | 341 (39.1%) | 485 (44.7%) |
| 75 Years and over | 295 (61.1%) | 693 (62.0%) |
Disability Class by Sex by Age in Kankakee
Disability Class: Hearing Difficulty
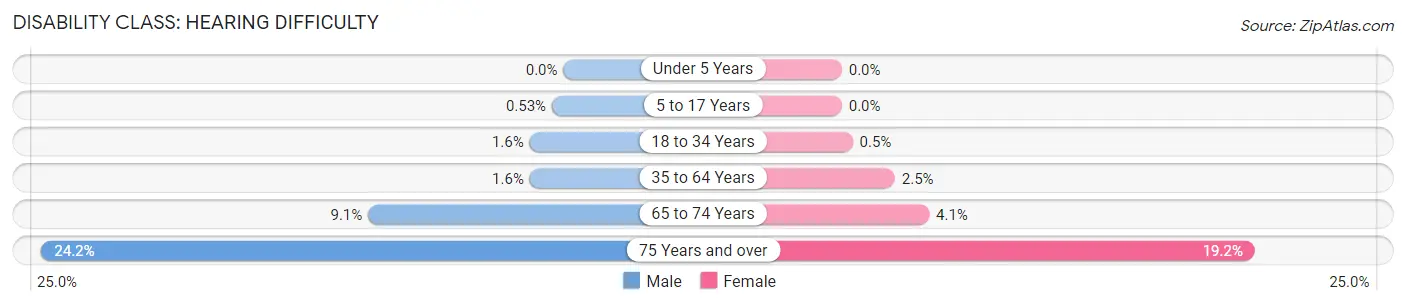
| Age Bracket | Male | Female |
| Under 5 Years | 0 (0.0%) | 0 (0.0%) |
| 5 to 17 Years | 12 (0.5%) | 0 (0.0%) |
| 18 to 34 Years | 42 (1.6%) | 13 (0.5%) |
| 35 to 64 Years | 71 (1.6%) | 110 (2.5%) |
| 65 to 74 Years | 79 (9.1%) | 44 (4.1%) |
| 75 Years and over | 117 (24.2%) | 214 (19.2%) |
Disability Class: Vision Difficulty
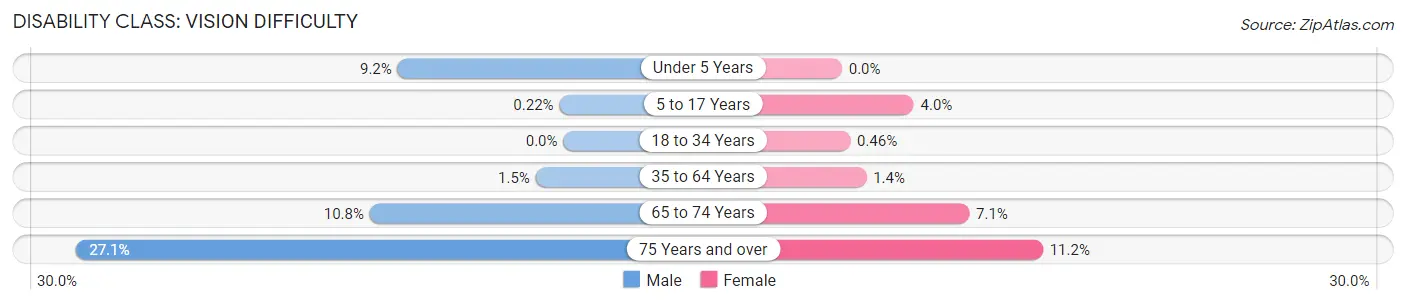
| Age Bracket | Male | Female |
| Under 5 Years | 78 (9.2%) | 0 (0.0%) |
| 5 to 17 Years | 5 (0.2%) | 99 (4.0%) |
| 18 to 34 Years | 0 (0.0%) | 12 (0.5%) |
| 35 to 64 Years | 70 (1.5%) | 61 (1.4%) |
| 65 to 74 Years | 94 (10.8%) | 77 (7.1%) |
| 75 Years and over | 131 (27.1%) | 125 (11.2%) |
Disability Class: Cognitive Difficulty
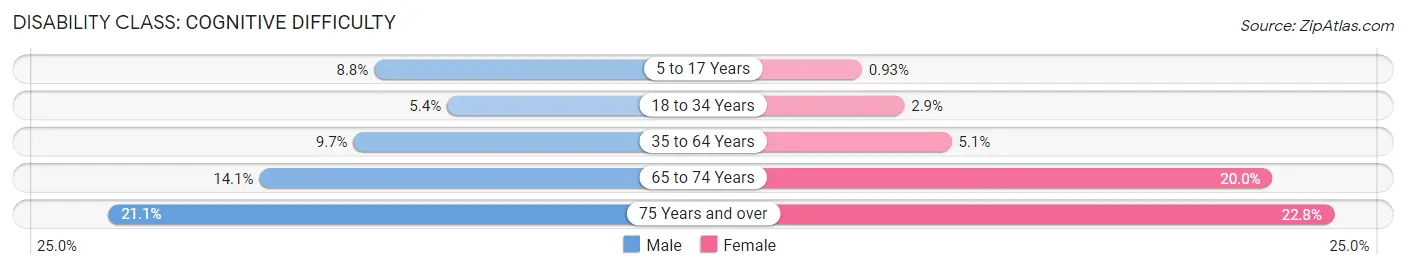
| Age Bracket | Male | Female |
| 5 to 17 Years | 200 (8.8%) | 23 (0.9%) |
| 18 to 34 Years | 144 (5.4%) | 76 (2.9%) |
| 35 to 64 Years | 443 (9.7%) | 228 (5.1%) |
| 65 to 74 Years | 123 (14.1%) | 217 (20.0%) |
| 75 Years and over | 102 (21.1%) | 255 (22.8%) |
Disability Class: Ambulatory Difficulty
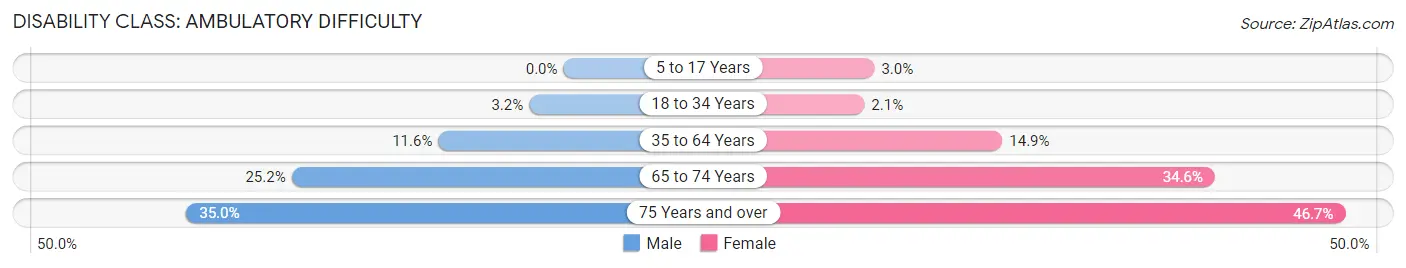
| Age Bracket | Male | Female |
| 5 to 17 Years | 0 (0.0%) | 75 (3.0%) |
| 18 to 34 Years | 85 (3.2%) | 55 (2.1%) |
| 35 to 64 Years | 528 (11.6%) | 667 (14.9%) |
| 65 to 74 Years | 220 (25.2%) | 376 (34.6%) |
| 75 Years and over | 169 (35.0%) | 522 (46.7%) |
Disability Class: Self-Care Difficulty
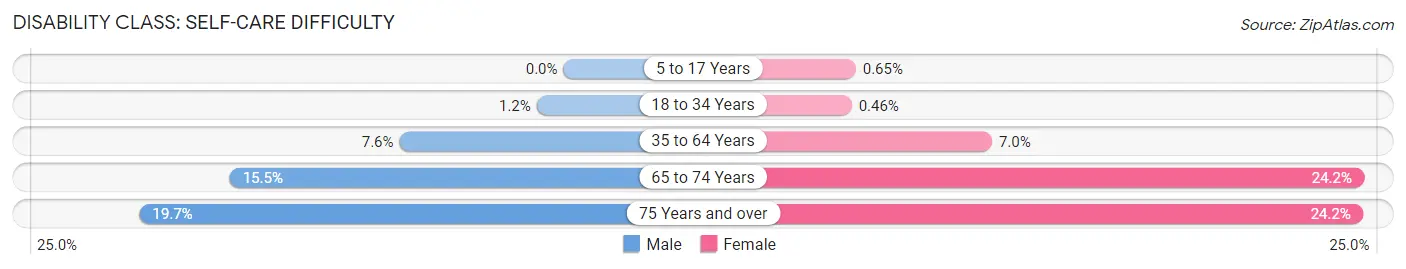
| Age Bracket | Male | Female |
| 5 to 17 Years | 0 (0.0%) | 16 (0.6%) |
| 18 to 34 Years | 33 (1.2%) | 12 (0.5%) |
| 35 to 64 Years | 346 (7.6%) | 312 (7.0%) |
| 65 to 74 Years | 135 (15.5%) | 263 (24.2%) |
| 75 Years and over | 95 (19.7%) | 270 (24.2%) |
Technology Access in Kankakee
Computing Device Access in Kankakee
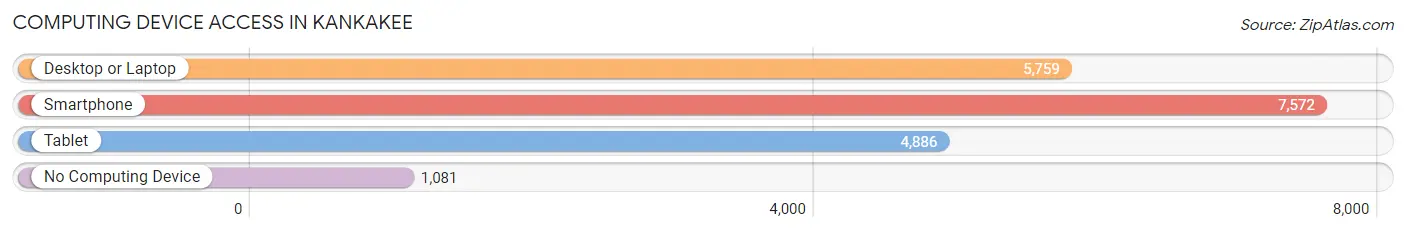
| Device Type | # Households | % Households |
| Desktop or Laptop | 5,759 | 61.6% |
| Smartphone | 7,572 | 81.0% |
| Tablet | 4,886 | 52.3% |
| No Computing Device | 1,081 | 11.6% |
| Total | 9,349 | 100.0% |
Internet Access in Kankakee
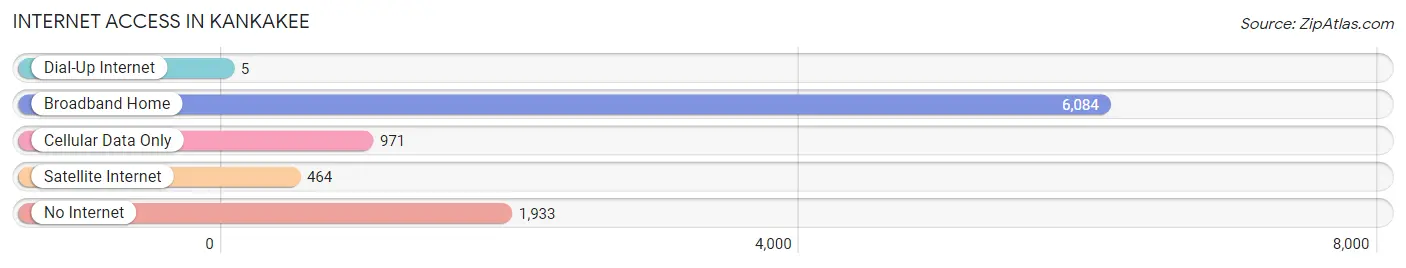
| Internet Type | # Households | % Households |
| Dial-Up Internet | 5 | 0.1% |
| Broadband Home | 6,084 | 65.1% |
| Cellular Data Only | 971 | 10.4% |
| Satellite Internet | 464 | 5.0% |
| No Internet | 1,933 | 20.7% |
| Total | 9,349 | 100.0% |
Kankakee Summary
Kankakee, Illinois is a city located in Kankakee County, Illinois, United States. It is situated along the Kankakee River, approximately 50 miles south of Chicago. The city is the county seat of Kankakee County and is the largest city in the county. As of the 2010 census, the city had a population of 27,537.
History
Kankakee was first settled in 1854 by a group of settlers from New York. The city was named after the Kankakee River, which was named after the Potawatomi word for "open country." The city was incorporated in 1855 and was designated as the county seat of Kankakee County in 1856.
In the late 19th century, Kankakee was a major stop on the Chicago and Alton Railroad. The city was also home to several manufacturing companies, including the Kankakee Iron Works, which produced agricultural implements, and the Kankakee Wagon Works, which produced wagons and carriages.
In the early 20th century, Kankakee was a major center for the production of bricks. The city was also home to several large factories, including the Kankakee Manufacturing Company, which produced farm equipment, and the Kankakee Foundry, which produced cast iron products.
Geography
Kankakee is located in northeastern Illinois, approximately 50 miles south of Chicago. The city is situated along the Kankakee River, which flows through the city from east to west. The city is located in a flat, low-lying area, with an elevation of approximately 600 feet above sea level.
The city has a total area of 11.2 square miles, of which 11.1 square miles is land and 0.1 square miles is water. The city is located in the Kankakee River Valley, which is part of the larger Illinois River Valley.
Economy
Kankakee is a major center for manufacturing and agriculture. The city is home to several large factories, including the Kankakee Manufacturing Company, which produces farm equipment, and the Kankakee Foundry, which produces cast iron products. The city is also home to several agricultural businesses, including the Kankakee Grain Company, which produces grain products, and the Kankakee Dairy, which produces dairy products.
The city is also home to several retail businesses, including several large shopping malls and several smaller retail stores. The city is also home to several restaurants, bars, and entertainment venues.
Demographics
As of the 2010 census, the city had a population of 27,537. The racial makeup of the city was 68.2% White, 25.3% African American, 0.4% Native American, 0.7% Asian, 0.1% Pacific Islander, 3.2% from other races, and 2.1% from two or more races. Hispanic or Latino of any race were 8.2% of the population.
The median income for a household in the city was $37,945, and the median income for a family was $45,945. The per capita income for the city was $19,845. About 17.2% of families and 20.7% of the population were below the poverty line, including 28.3% of those under age 18 and 11.2% of those age 65 or over.
Common Questions
What is Per Capita Income in Kankakee?
Per Capita income in Kankakee is $22,151.
What is the Median Family Income in Kankakee?
Median Family Income in Kankakee is $47,819.
What is the Median Household income in Kankakee?
Median Household Income in Kankakee is $42,180.
What is Income or Wage Gap in Kankakee?
Income or Wage Gap in Kankakee is 18.3%.
Women in Kankakee earn 81.7 cents for every dollar earned by a man.
What is Inequality or Gini Index in Kankakee?
Inequality or Gini Index in Kankakee is 0.47.
What is the Total Population of Kankakee?
Total Population of Kankakee is 24,795.
What is the Total Male Population of Kankakee?
Total Male Population of Kankakee is 12,121.
What is the Total Female Population of Kankakee?
Total Female Population of Kankakee is 12,674.
What is the Ratio of Males per 100 Females in Kankakee?
There are 95.64 Males per 100 Females in Kankakee.
What is the Ratio of Females per 100 Males in Kankakee?
There are 104.56 Females per 100 Males in Kankakee.
What is the Median Population Age in Kankakee?
Median Population Age in Kankakee is 36.3 Years.
What is the Average Family Size in Kankakee
Average Family Size in Kankakee is 3.3 People.
What is the Average Household Size in Kankakee
Average Household Size in Kankakee is 2.5 People.
How Large is the Labor Force in Kankakee?
There are 10,763 People in the Labor Forcein in Kankakee.
What is the Percentage of People in the Labor Force in Kankakee?
56.5% of People are in the Labor Force in Kankakee.
What is the Unemployment Rate in Kankakee?
Unemployment Rate in Kankakee is 7.4%.