Cities with the Most Immigrants from Indonesia in Illinois
RELATED REPORTS & OPTIONS
Indonesia
Illinois
Compare Cities
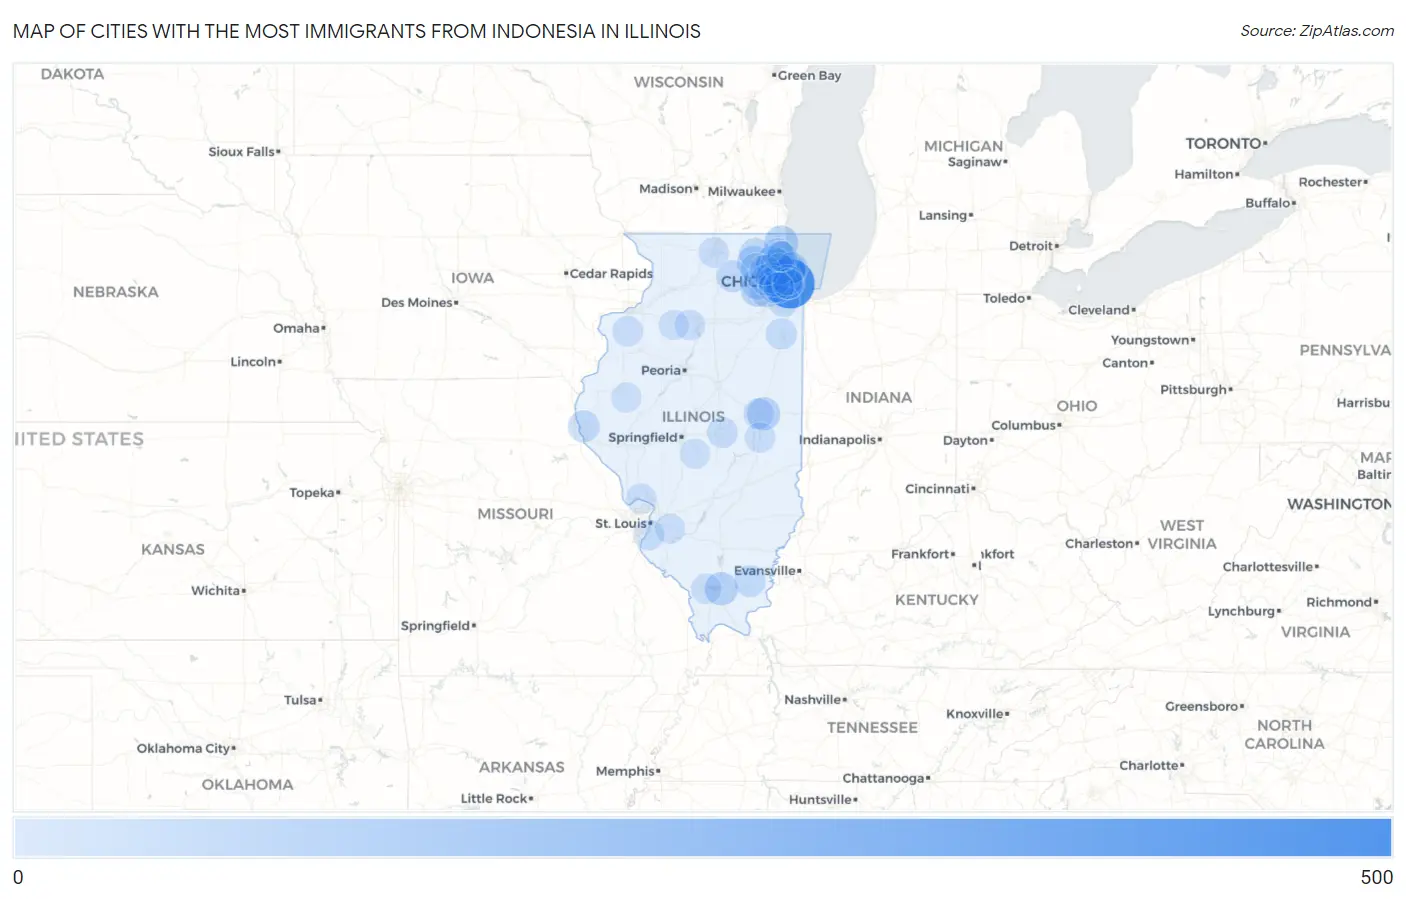
Map of Cities with the Most Immigrants from Indonesia in Illinois
0
500
Cities with the Most Immigrants from Indonesia in Illinois
| City | Indonesia | vs State | vs National | |
| 1. | Chicago | 448 | 1,780(25.17%)#1 | 99,615(0.45%)#27 |
| 2. | Waukegan | 81 | 1,780(4.55%)#2 | 99,615(0.08%)#237 |
| 3. | Aurora | 69 | 1,780(3.88%)#3 | 99,615(0.07%)#274 |
| 4. | Gilberts | 69 | 1,780(3.88%)#4 | 99,615(0.07%)#276 |
| 5. | Marion | 65 | 1,780(3.65%)#5 | 99,615(0.07%)#298 |
| 6. | Urbana | 64 | 1,780(3.60%)#6 | 99,615(0.06%)#306 |
| 7. | Palatine | 59 | 1,780(3.31%)#7 | 99,615(0.06%)#323 |
| 8. | Skokie | 41 | 1,780(2.30%)#8 | 99,615(0.04%)#459 |
| 9. | Dekalb | 41 | 1,780(2.30%)#9 | 99,615(0.04%)#462 |
| 10. | Itasca | 41 | 1,780(2.30%)#10 | 99,615(0.04%)#465 |
| 11. | Naperville | 40 | 1,780(2.25%)#11 | 99,615(0.04%)#468 |
| 12. | Batavia | 39 | 1,780(2.19%)#12 | 99,615(0.04%)#477 |
| 13. | Quincy | 36 | 1,780(2.02%)#13 | 99,615(0.04%)#501 |
| 14. | Crystal Lake | 32 | 1,780(1.80%)#14 | 99,615(0.03%)#542 |
| 15. | Eldorado | 28 | 1,780(1.57%)#15 | 99,615(0.03%)#596 |
| 16. | Schaumburg | 27 | 1,780(1.52%)#16 | 99,615(0.03%)#598 |
| 17. | Orland Park | 26 | 1,780(1.46%)#17 | 99,615(0.03%)#615 |
| 18. | Elgin | 25 | 1,780(1.40%)#18 | 99,615(0.03%)#634 |
| 19. | Vernon Hills | 23 | 1,780(1.29%)#19 | 99,615(0.02%)#682 |
| 20. | Bourbonnais | 22 | 1,780(1.24%)#20 | 99,615(0.02%)#699 |
| 21. | Lincolnwood | 22 | 1,780(1.24%)#21 | 99,615(0.02%)#702 |
| 22. | Winfield | 20 | 1,780(1.12%)#22 | 99,615(0.02%)#746 |
| 23. | Arlington Heights | 15 | 1,780(0.84%)#23 | 99,615(0.02%)#862 |
| 24. | Decatur | 15 | 1,780(0.84%)#24 | 99,615(0.02%)#863 |
| 25. | Glendale Heights | 15 | 1,780(0.84%)#25 | 99,615(0.02%)#867 |
| 26. | Evanston | 14 | 1,780(0.79%)#26 | 99,615(0.01%)#898 |
| 27. | Westchester | 14 | 1,780(0.79%)#27 | 99,615(0.01%)#912 |
| 28. | Champaign | 13 | 1,780(0.73%)#28 | 99,615(0.01%)#927 |
| 29. | Downers Grove | 13 | 1,780(0.73%)#29 | 99,615(0.01%)#935 |
| 30. | Columbia | 13 | 1,780(0.73%)#30 | 99,615(0.01%)#950 |
| 31. | Cicero | 11 | 1,780(0.62%)#31 | 99,615(0.01%)#995 |
| 32. | Des Plaines | 11 | 1,780(0.62%)#32 | 99,615(0.01%)#1,001 |
| 33. | Lombard | 10 | 1,780(0.56%)#33 | 99,615(0.01%)#1,049 |
| 34. | Berwyn | 8 | 1,780(0.45%)#34 | 99,615(0.01%)#1,159 |
| 35. | Streamwood | 8 | 1,780(0.45%)#35 | 99,615(0.01%)#1,166 |
| 36. | Tiskilwa | 8 | 1,780(0.45%)#36 | 99,615(0.01%)#1,198 |
| 37. | Rockford | 7 | 1,780(0.39%)#37 | 99,615(0.01%)#1,201 |
| 38. | Tuscola | 7 | 1,780(0.39%)#38 | 99,615(0.01%)#1,239 |
| 39. | Oak Park | 6 | 1,780(0.34%)#39 | 99,615(0.01%)#1,253 |
| 40. | Lincolnshire | 6 | 1,780(0.34%)#40 | 99,615(0.01%)#1,278 |
| 41. | Viola | 6 | 1,780(0.34%)#41 | 99,615(0.01%)#1,290 |
| 42. | Carbondale | 5 | 1,780(0.28%)#42 | 99,615(0.01%)#1,315 |
| 43. | Elsah | 5 | 1,780(0.28%)#43 | 99,615(0.01%)#1,342 |
| 44. | Hinsdale | 4 | 1,780(0.22%)#44 | 99,615(0.00%)#1,355 |
| 45. | Bannockburn | 4 | 1,780(0.22%)#45 | 99,615(0.00%)#1,379 |
| 46. | Scott Afb | 3 | 1,780(0.17%)#46 | 99,615(0.00%)#1,398 |
| 47. | Neponset | 3 | 1,780(0.17%)#47 | 99,615(0.00%)#1,419 |
| 48. | Industry | 1 | 1,780(0.06%)#48 | 99,615(0.00%)#1,485 |
| 49. | Jeisyville | 1 | 1,780(0.06%)#49 | 99,615(0.00%)#1,492 |
Common Questions
What are the Top 10 Cities with the Most Immigrants from Indonesia in Illinois?
Top 10 Cities with the Most Immigrants from Indonesia in Illinois are:
What city has the Most Immigrants from Indonesia in Illinois?
Chicago has the Most Immigrants from Indonesia in Illinois with 448.
What is the Total Immigrants from Indonesia in the State of Illinois?
Total Immigrants from Indonesia in Illinois is 1,780.
What is the Total Immigrants from Indonesia in the United States?
Total Immigrants from Indonesia in the United States is 99,615.