Maryville, IL Map & Demographics
Maryville Map
Maryville Overview
$49,346
PER CAPITA INCOME
$143,114
AVG FAMILY INCOME
$96,373
AVG HOUSEHOLD INCOME
21.9%
WAGE / INCOME GAP [ % ]
78.1¢/ $1
WAGE / INCOME GAP [ $ ]
0.35
INEQUALITY / GINI INDEX
8,219
TOTAL POPULATION
3,865
MALE POPULATION
4,354
FEMALE POPULATION
88.77
MALES / 100 FEMALES
112.65
FEMALES / 100 MALES
48.3
MEDIAN AGE
3.0
AVG FAMILY SIZE
2.4
AVG HOUSEHOLD SIZE
4,465
LABOR FORCE [ PEOPLE ]
65.2%
PERCENT IN LABOR FORCE
6.3%
UNEMPLOYMENT RATE
Maryville Zip Codes
Maryville Area Codes
Income in Maryville
Income Overview in Maryville
Per Capita Income in Maryville is $49,346, while median incomes of families and households are $143,114 and $96,373 respectively.
| Characteristic | Number | Measure |
| Per Capita Income | 8,219 | $49,346 |
| Median Family Income | 2,191 | $143,114 |
| Mean Family Income | 2,191 | $141,950 |
| Median Household Income | 3,315 | $96,373 |
| Mean Household Income | 3,315 | $117,141 |
| Income Deficit | 2,191 | $0 |
| Wage / Income Gap (%) | 8,219 | 21.91% |
| Wage / Income Gap ($) | 8,219 | 78.09¢ per $1 |
| Gini / Inequality Index | 8,219 | 0.35 |
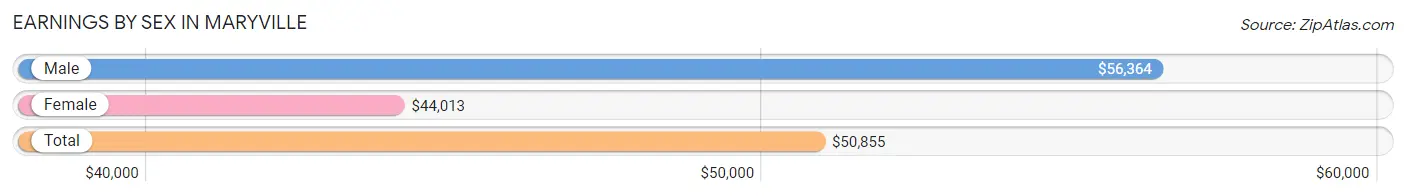
Earnings by Sex in Maryville
Average Earnings in Maryville are $50,855, $56,364 for men and $44,013 for women, a difference of 21.9%.
| Sex | Number | Average Earnings |
| Male | 2,312 (50.5%) | $56,364 |
| Female | 2,267 (49.5%) | $44,013 |
| Total | 4,579 (100.0%) | $50,855 |
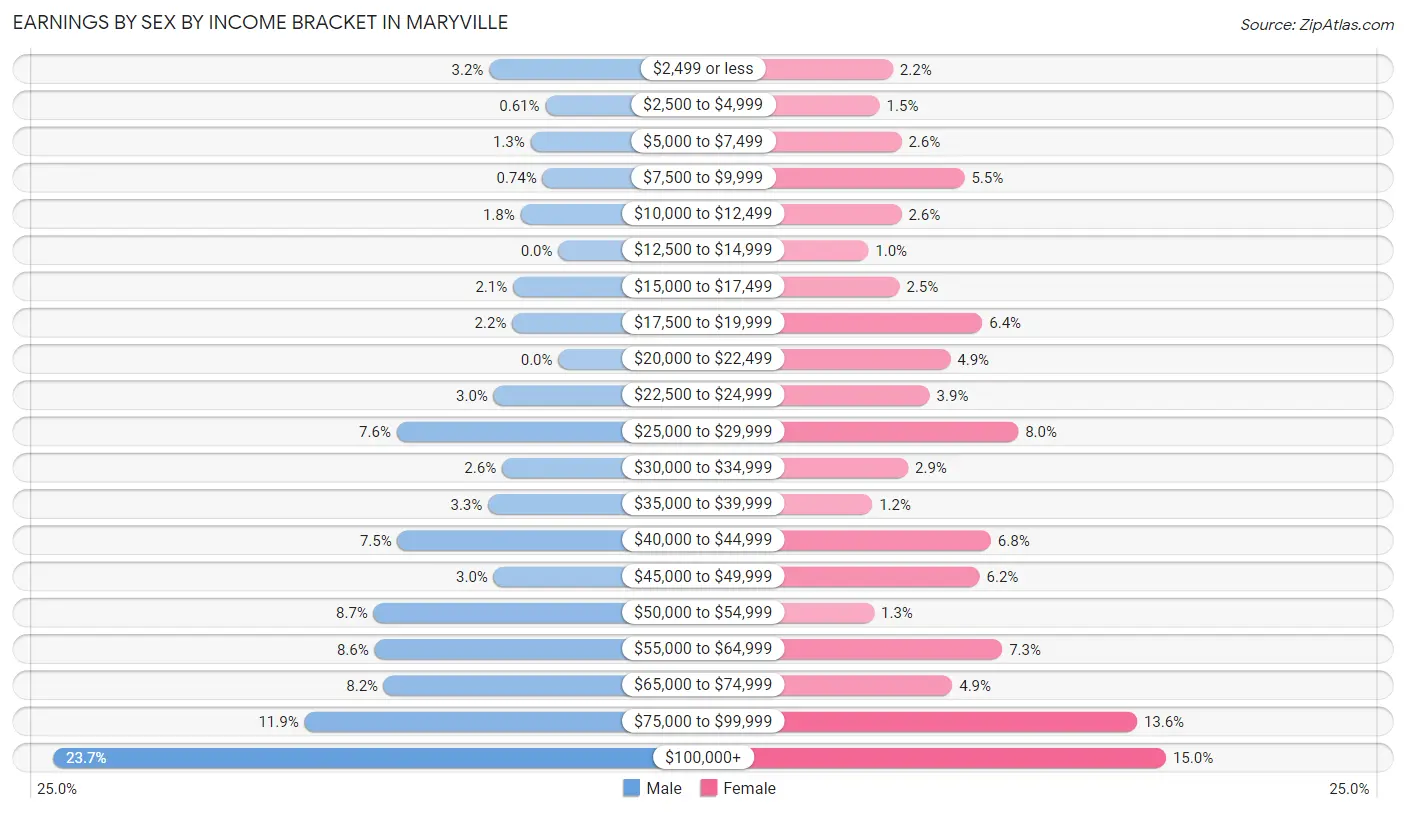
Earnings by Sex by Income Bracket in Maryville
The most common earnings brackets in Maryville are $100,000+ for men (547 | 23.7%) and $100,000+ for women (339 | 14.9%).
| Income | Male | Female |
| $2,499 or less | 75 (3.2%) | 49 (2.2%) |
| $2,500 to $4,999 | 14 (0.6%) | 35 (1.5%) |
| $5,000 to $7,499 | 30 (1.3%) | 58 (2.6%) |
| $7,500 to $9,999 | 17 (0.7%) | 125 (5.5%) |
| $10,000 to $12,499 | 41 (1.8%) | 58 (2.6%) |
| $12,500 to $14,999 | 0 (0.0%) | 23 (1.0%) |
| $15,000 to $17,499 | 49 (2.1%) | 56 (2.5%) |
| $17,500 to $19,999 | 50 (2.2%) | 144 (6.4%) |
| $20,000 to $22,499 | 0 (0.0%) | 110 (4.9%) |
| $22,500 to $24,999 | 70 (3.0%) | 88 (3.9%) |
| $25,000 to $29,999 | 175 (7.6%) | 182 (8.0%) |
| $30,000 to $34,999 | 61 (2.6%) | 65 (2.9%) |
| $35,000 to $39,999 | 76 (3.3%) | 27 (1.2%) |
| $40,000 to $44,999 | 174 (7.5%) | 153 (6.8%) |
| $45,000 to $49,999 | 70 (3.0%) | 141 (6.2%) |
| $50,000 to $54,999 | 200 (8.6%) | 29 (1.3%) |
| $55,000 to $64,999 | 199 (8.6%) | 165 (7.3%) |
| $65,000 to $74,999 | 189 (8.2%) | 112 (4.9%) |
| $75,000 to $99,999 | 275 (11.9%) | 308 (13.6%) |
| $100,000+ | 547 (23.7%) | 339 (14.9%) |
| Total | 2,312 (100.0%) | 2,267 (100.0%) |
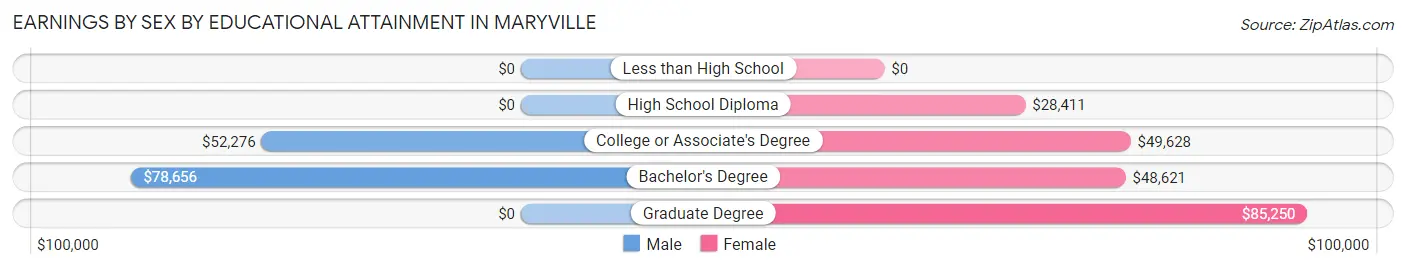
Earnings by Sex by Educational Attainment in Maryville
Average earnings in Maryville are $60,442 for men and $48,214 for women, a difference of 20.2%. Men with an educational attainment of bachelor's degree enjoy the highest average annual earnings of $78,656, while those with college or associate's degree education earn the least with $52,276. Women with an educational attainment of graduate degree earn the most with the average annual earnings of $85,250, while those with high school diploma education have the smallest earnings of $28,411.
| Educational Attainment | Male Income | Female Income |
| Less than High School | - | - |
| High School Diploma | - | - |
| College or Associate's Degree | $52,276 | $49,628 |
| Bachelor's Degree | $78,656 | $48,621 |
| Graduate Degree | - | - |
| Total | $60,442 | $48,214 |
Family Income in Maryville
Family Income Brackets in Maryville
According to the Maryville family income data, there are 541 families falling into the $75,000 to $99,999 income range, which is the most common income bracket and makes up 24.7% of all families.
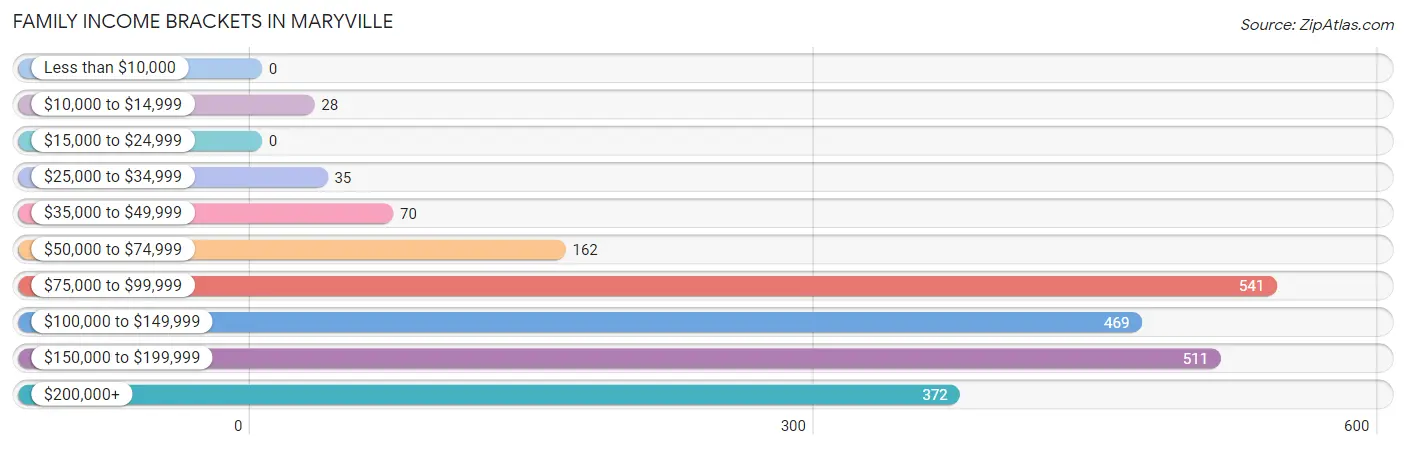
| Income Bracket | # Families | % Families |
| Less than $10,000 | 0 | 0.0% |
| $10,000 to $14,999 | 28 | 1.3% |
| $15,000 to $24,999 | 0 | 0.0% |
| $25,000 to $34,999 | 35 | 1.6% |
| $35,000 to $49,999 | 70 | 3.2% |
| $50,000 to $74,999 | 162 | 7.4% |
| $75,000 to $99,999 | 541 | 24.7% |
| $100,000 to $149,999 | 469 | 21.4% |
| $150,000 to $199,999 | 511 | 23.3% |
| $200,000+ | 372 | 17.0% |
Family Income by Famaliy Size in Maryville
5-person families (253 | 11.6%) account for the highest median family income in Maryville with $239,155 per family, while 3-person families (490 | 22.4%) have the highest median income of $53,391 per family member.
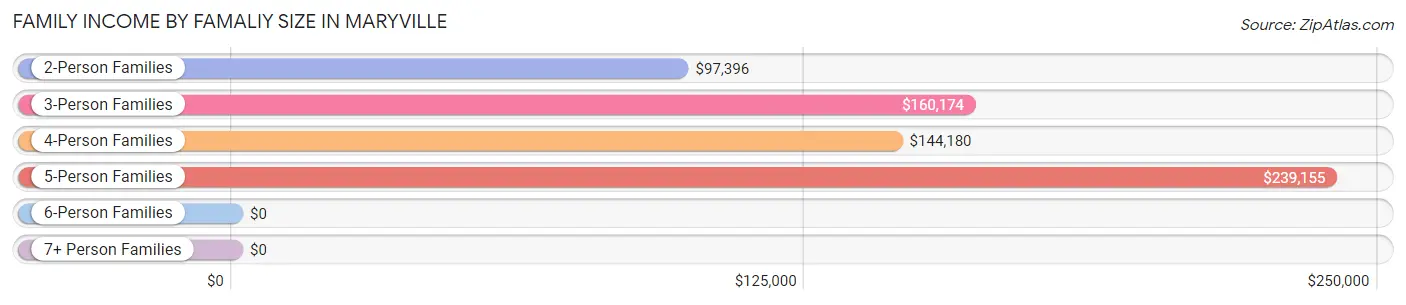
| Income Bracket | # Families | Median Income |
| 2-Person Families | 1,135 (51.8%) | $97,396 |
| 3-Person Families | 490 (22.4%) | $160,174 |
| 4-Person Families | 266 (12.1%) | $144,180 |
| 5-Person Families | 253 (11.6%) | $239,155 |
| 6-Person Families | 47 (2.1%) | $0 |
| 7+ Person Families | 0 (0.0%) | $0 |
| Total | 2,191 (100.0%) | $143,114 |
Family Income by Number of Earners in Maryville
The median family income in Maryville is $143,114, with families comprising 3+ earners (231) having the highest median family income of $153,412, while families with no earners (365) have the lowest median family income of $92,022, accounting for 10.5% and 16.7% of families, respectively.
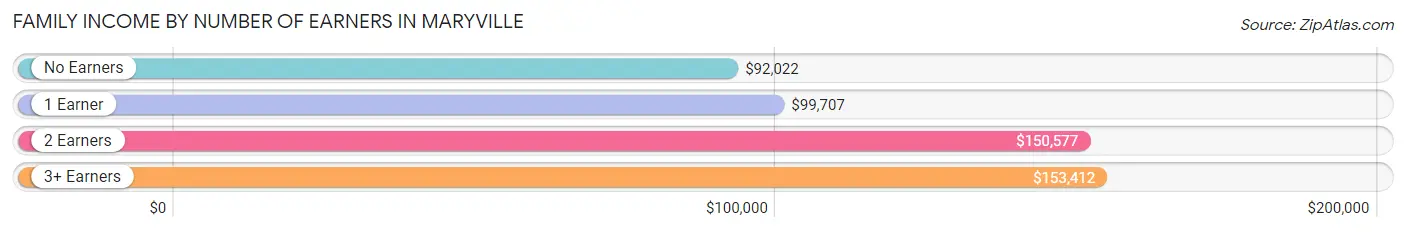
| Number of Earners | # Families | Median Income |
| No Earners | 365 (16.7%) | $92,022 |
| 1 Earner | 483 (22.0%) | $99,707 |
| 2 Earners | 1,112 (50.7%) | $150,577 |
| 3+ Earners | 231 (10.5%) | $153,412 |
| Total | 2,191 (100.0%) | $143,114 |
Household Income in Maryville
Household Income Brackets in Maryville
With 607 households falling in the category, the $100,000 to $149,999 income range is the most frequent in Maryville, accounting for 18.3% of all households. In contrast, only 10 households (0.3%) fall into the less than $10,000 income bracket, making it the least populous group.
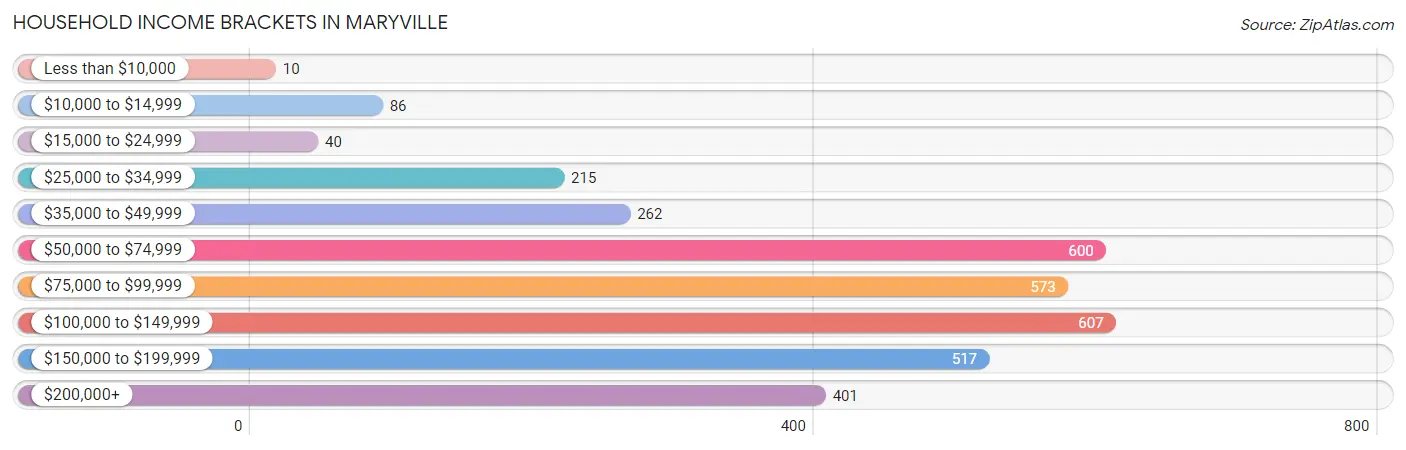
| Income Bracket | # Households | % Households |
| Less than $10,000 | 10 | 0.3% |
| $10,000 to $14,999 | 86 | 2.6% |
| $15,000 to $24,999 | 40 | 1.2% |
| $25,000 to $34,999 | 215 | 6.5% |
| $35,000 to $49,999 | 262 | 7.9% |
| $50,000 to $74,999 | 600 | 18.1% |
| $75,000 to $99,999 | 573 | 17.3% |
| $100,000 to $149,999 | 607 | 18.3% |
| $150,000 to $199,999 | 517 | 15.6% |
| $200,000+ | 401 | 12.1% |
Household Income by Householder Age in Maryville
The median household income in Maryville is $96,373, with the highest median household income of $132,139 found in the 45 to 64 years age bracket for the primary householder. A total of 1,325 households (40.0%) fall into this category. Meanwhile, the 15 to 24 years age bracket for the primary householder has the lowest median household income of $0, with 86 households (2.6%) in this group.
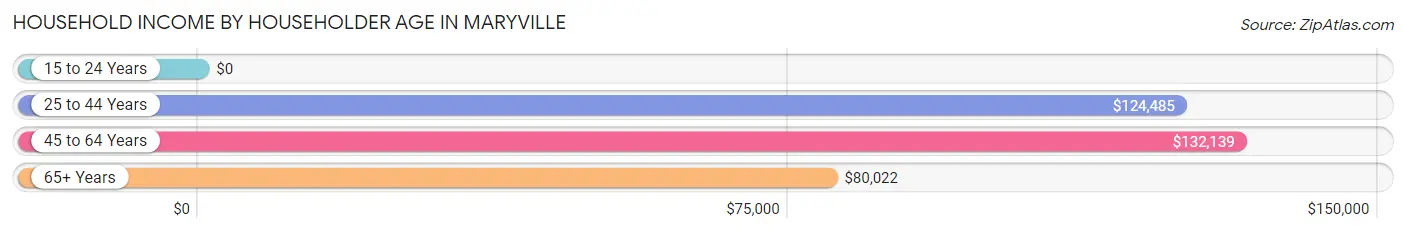
| Income Bracket | # Households | Median Income |
| 15 to 24 Years | 86 (2.6%) | $0 |
| 25 to 44 Years | 937 (28.3%) | $124,485 |
| 45 to 64 Years | 1,325 (40.0%) | $132,139 |
| 65+ Years | 967 (29.2%) | $80,022 |
| Total | 3,315 (100.0%) | $96,373 |
Poverty in Maryville
Income Below Poverty by Sex and Age in Maryville
With 2.1% poverty level for males and 4.8% for females among the residents of Maryville, 75 year old and over males and 18 to 24 year old females are the most vulnerable to poverty, with 28 males (13.2%) and 75 females (29.0%) in their respective age groups living below the poverty level.
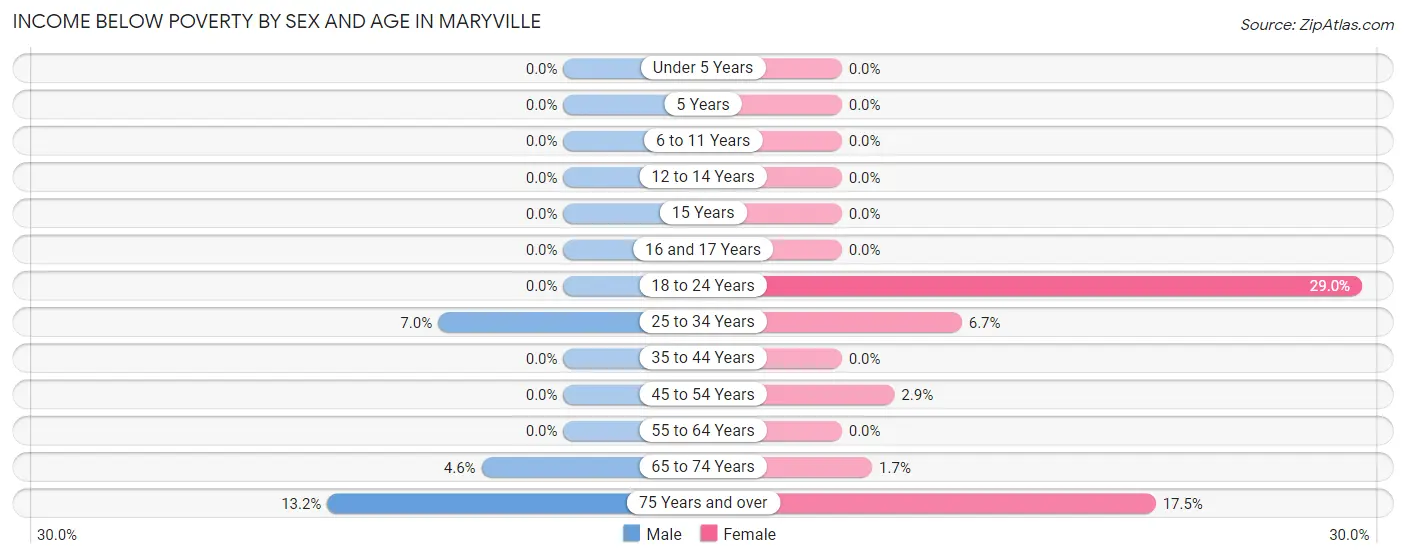
| Age Bracket | Male | Female |
| Under 5 Years | 0 (0.0%) | 0 (0.0%) |
| 5 Years | 0 (0.0%) | 0 (0.0%) |
| 6 to 11 Years | 0 (0.0%) | 0 (0.0%) |
| 12 to 14 Years | 0 (0.0%) | 0 (0.0%) |
| 15 Years | 0 (0.0%) | 0 (0.0%) |
| 16 and 17 Years | 0 (0.0%) | 0 (0.0%) |
| 18 to 24 Years | 0 (0.0%) | 75 (29.0%) |
| 25 to 34 Years | 31 (7.0%) | 38 (6.7%) |
| 35 to 44 Years | 0 (0.0%) | 0 (0.0%) |
| 45 to 54 Years | 0 (0.0%) | 22 (2.9%) |
| 55 to 64 Years | 0 (0.0%) | 0 (0.0%) |
| 65 to 74 Years | 19 (4.6%) | 10 (1.7%) |
| 75 Years and over | 28 (13.2%) | 57 (17.5%) |
| Total | 78 (2.1%) | 202 (4.8%) |
Income Above Poverty by Sex and Age in Maryville
According to the poverty statistics in Maryville, males aged under 5 years and females aged under 5 years are the age groups that are most secure financially, with 100.0% of males and 100.0% of females in these age groups living above the poverty line.
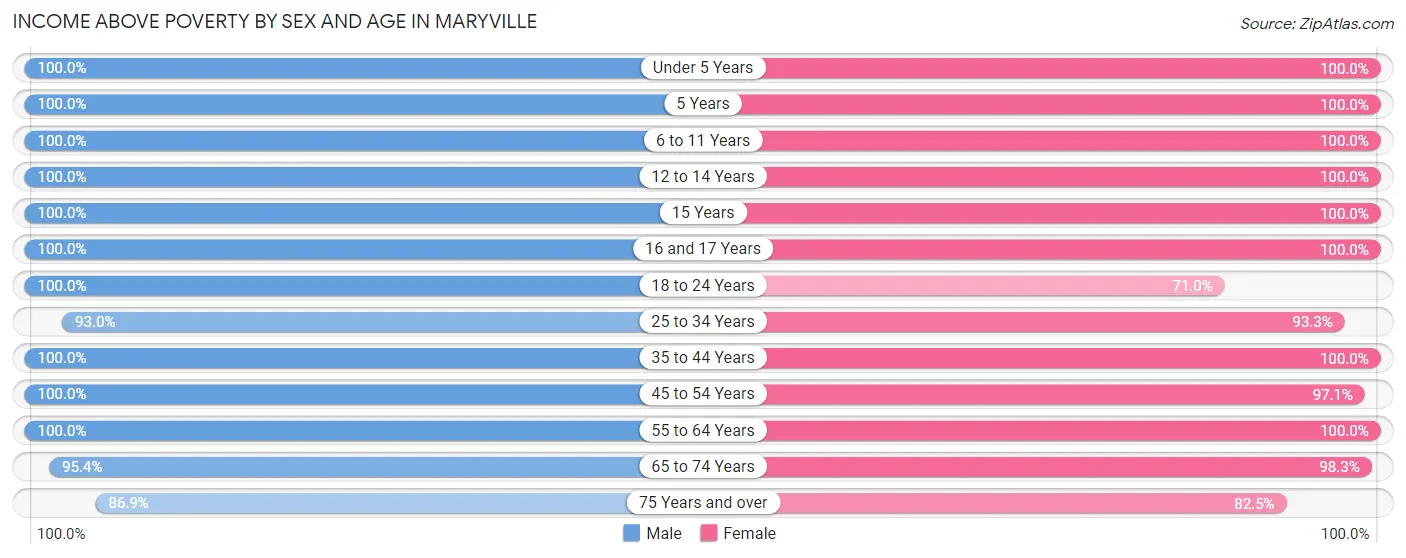
| Age Bracket | Male | Female |
| Under 5 Years | 137 (100.0%) | 172 (100.0%) |
| 5 Years | 36 (100.0%) | 93 (100.0%) |
| 6 to 11 Years | 255 (100.0%) | 288 (100.0%) |
| 12 to 14 Years | 105 (100.0%) | 121 (100.0%) |
| 15 Years | 89 (100.0%) | 75 (100.0%) |
| 16 and 17 Years | 57 (100.0%) | 29 (100.0%) |
| 18 to 24 Years | 245 (100.0%) | 184 (71.0%) |
| 25 to 34 Years | 413 (93.0%) | 531 (93.3%) |
| 35 to 44 Years | 517 (100.0%) | 372 (100.0%) |
| 45 to 54 Years | 423 (100.0%) | 728 (97.1%) |
| 55 to 64 Years | 868 (100.0%) | 573 (100.0%) |
| 65 to 74 Years | 398 (95.4%) | 582 (98.3%) |
| 75 Years and over | 185 (86.9%) | 269 (82.5%) |
| Total | 3,728 (98.0%) | 4,017 (95.2%) |
Income Below Poverty Among Married-Couple Families in Maryville
The poverty statistics for married-couple families in Maryville show that 1.5% or 28 of the total 1,833 families live below the poverty line. Families with no children have the highest poverty rate of 2.5%, comprising of 28 families. On the other hand, families with 1 or 2 children have the lowest poverty rate of 0.0%, which includes 0 families.
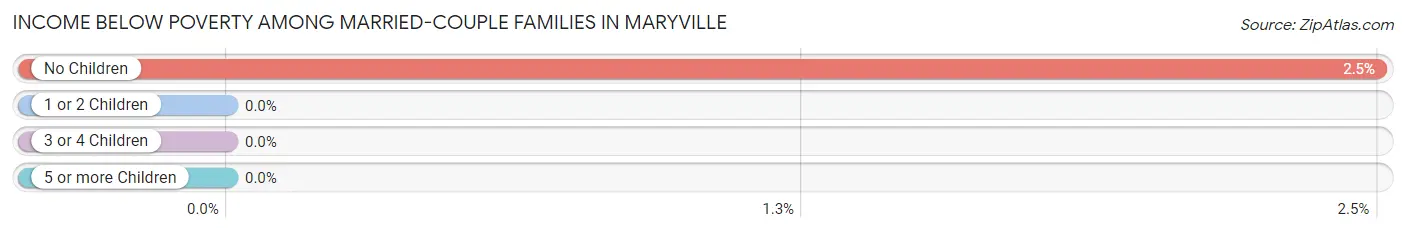
| Children | Above Poverty | Below Poverty |
| No Children | 1,094 (97.5%) | 28 (2.5%) |
| 1 or 2 Children | 488 (100.0%) | 0 (0.0%) |
| 3 or 4 Children | 223 (100.0%) | 0 (0.0%) |
| 5 or more Children | 0 (0.0%) | 0 (0.0%) |
| Total | 1,805 (98.5%) | 28 (1.5%) |
Income Below Poverty Among Single-Parent Households in Maryville
| Children | Single Father | Single Mother |
| No Children | 0 (0.0%) | 0 (0.0%) |
| 1 or 2 Children | 0 (0.0%) | 0 (0.0%) |
| 3 or 4 Children | 0 (0.0%) | 0 (0.0%) |
| 5 or more Children | 0 (0.0%) | 0 (0.0%) |
| Total | 0 (0.0%) | 0 (0.0%) |
Income Below Poverty Among Married-Couple vs Single-Parent Households in Maryville
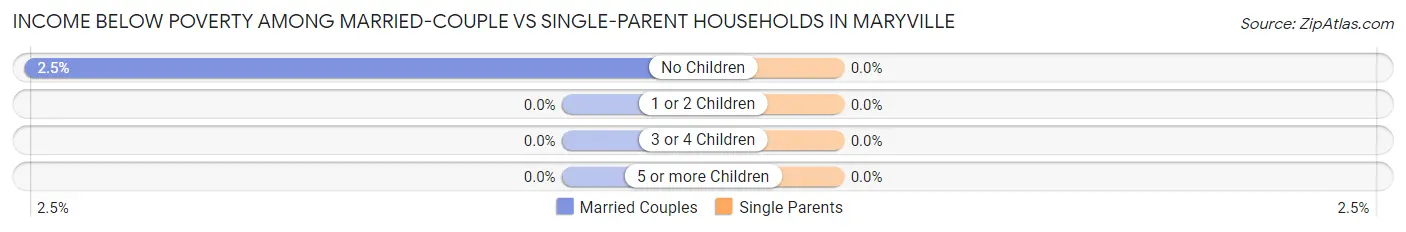
| Children | Married-Couple Families | Single-Parent Households |
| No Children | 28 (2.5%) | 0 (0.0%) |
| 1 or 2 Children | 0 (0.0%) | 0 (0.0%) |
| 3 or 4 Children | 0 (0.0%) | 0 (0.0%) |
| 5 or more Children | 0 (0.0%) | 0 (0.0%) |
| Total | 28 (1.5%) | 0 (0.0%) |
Race in Maryville
The most populous races in Maryville are White / Caucasian (7,117 | 86.6%), Black / African American (529 | 6.4%), and Two or more Races (336 | 4.1%).
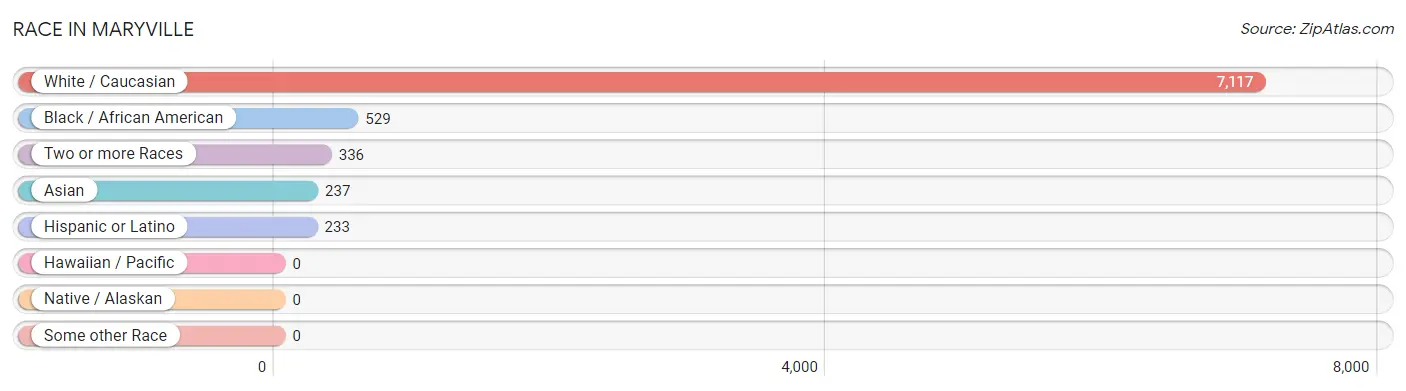
| Race | # Population | % Population |
| Asian | 237 | 2.9% |
| Black / African American | 529 | 6.4% |
| Hawaiian / Pacific | 0 | 0.0% |
| Hispanic or Latino | 233 | 2.8% |
| Native / Alaskan | 0 | 0.0% |
| White / Caucasian | 7,117 | 86.6% |
| Two or more Races | 336 | 4.1% |
| Some other Race | 0 | 0.0% |
| Total | 8,219 | 100.0% |
Ancestry in Maryville
The most populous ancestries reported in Maryville are German (2,355 | 28.6%), English (1,174 | 14.3%), Irish (804 | 9.8%), European (531 | 6.5%), and American (436 | 5.3%), together accounting for 64.5% of all Maryville residents.
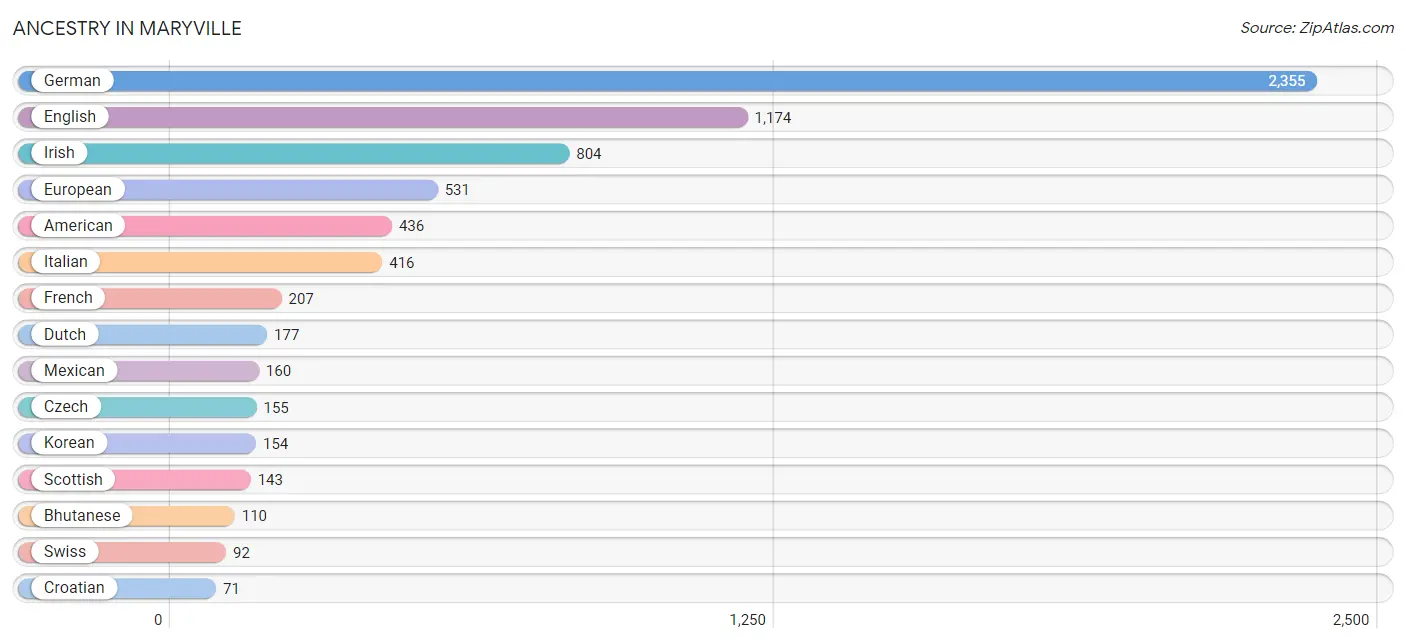
| Ancestry | # Population | % Population |
| American | 436 | 5.3% |
| Bhutanese | 110 | 1.3% |
| Cherokee | 17 | 0.2% |
| Croatian | 71 | 0.9% |
| Cuban | 30 | 0.4% |
| Czech | 155 | 1.9% |
| Czechoslovakian | 22 | 0.3% |
| Danish | 9 | 0.1% |
| Dutch | 177 | 2.1% |
| Eastern European | 30 | 0.4% |
| English | 1,174 | 14.3% |
| European | 531 | 6.5% |
| French | 207 | 2.5% |
| German | 2,355 | 28.6% |
| Greek | 65 | 0.8% |
| Indian (Asian) | 40 | 0.5% |
| Irish | 804 | 9.8% |
| Italian | 416 | 5.1% |
| Korean | 154 | 1.9% |
| Lithuanian | 52 | 0.6% |
| Macedonian | 69 | 0.8% |
| Malaysian | 62 | 0.7% |
| Mexican | 160 | 1.9% |
| Norwegian | 3 | 0.0% |
| Polish | 59 | 0.7% |
| Potawatomi | 6 | 0.1% |
| Puerto Rican | 43 | 0.5% |
| Scotch-Irish | 11 | 0.1% |
| Scottish | 143 | 1.7% |
| Serbian | 10 | 0.1% |
| Slovak | 43 | 0.5% |
| Slovene | 10 | 0.1% |
| Swedish | 11 | 0.1% |
| Swiss | 92 | 1.1% |
| Thai | 31 | 0.4% | View All 35 Rows |
Immigrants in Maryville
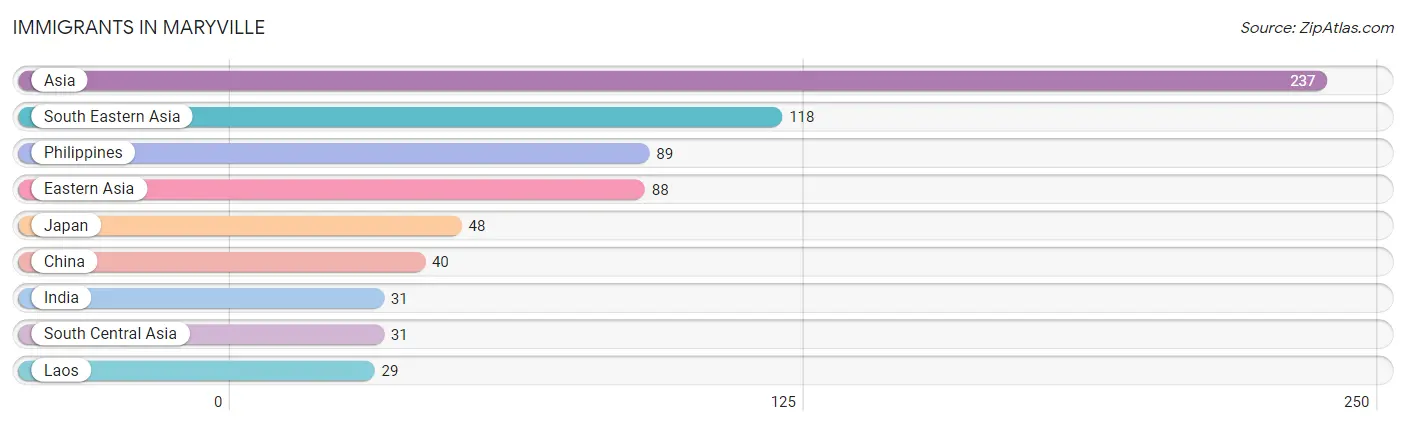
The most numerous immigrant groups reported in Maryville came from Asia (237 | 2.9%), South Eastern Asia (118 | 1.4%), Philippines (89 | 1.1%), Eastern Asia (88 | 1.1%), and Japan (48 | 0.6%), together accounting for 7.1% of all Maryville residents.
| Immigration Origin | # Population | % Population |
| Asia | 237 | 2.9% |
| China | 40 | 0.5% |
| Eastern Asia | 88 | 1.1% |
| India | 31 | 0.4% |
| Japan | 48 | 0.6% |
| Laos | 29 | 0.4% |
| Philippines | 89 | 1.1% |
| South Central Asia | 31 | 0.4% |
| South Eastern Asia | 118 | 1.4% | View All 9 Rows |
Sex and Age in Maryville
Sex and Age in Maryville
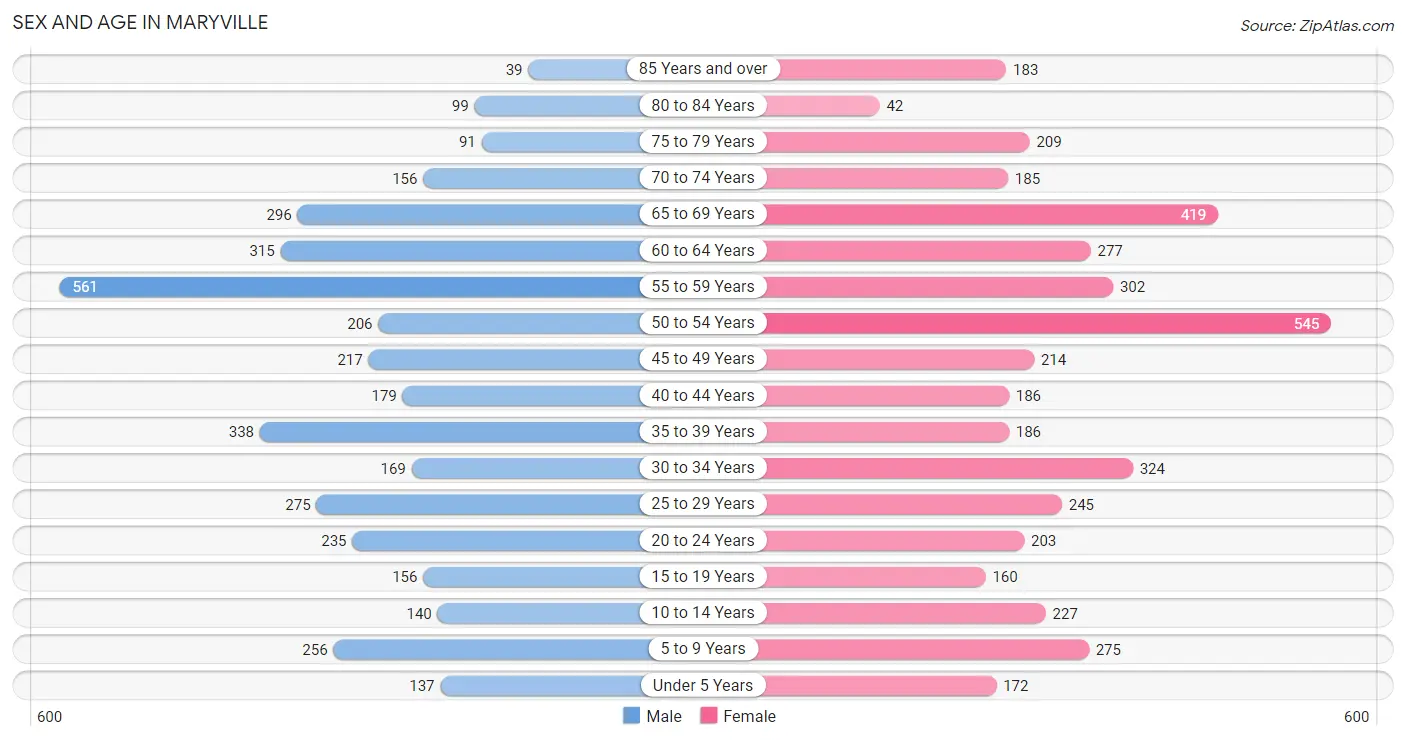
The most populous age groups in Maryville are 55 to 59 Years (561 | 14.5%) for men and 50 to 54 Years (545 | 12.5%) for women.
| Age Bracket | Male | Female |
| Under 5 Years | 137 (3.5%) | 172 (4.0%) |
| 5 to 9 Years | 256 (6.6%) | 275 (6.3%) |
| 10 to 14 Years | 140 (3.6%) | 227 (5.2%) |
| 15 to 19 Years | 156 (4.0%) | 160 (3.7%) |
| 20 to 24 Years | 235 (6.1%) | 203 (4.7%) |
| 25 to 29 Years | 275 (7.1%) | 245 (5.6%) |
| 30 to 34 Years | 169 (4.4%) | 324 (7.4%) |
| 35 to 39 Years | 338 (8.7%) | 186 (4.3%) |
| 40 to 44 Years | 179 (4.6%) | 186 (4.3%) |
| 45 to 49 Years | 217 (5.6%) | 214 (4.9%) |
| 50 to 54 Years | 206 (5.3%) | 545 (12.5%) |
| 55 to 59 Years | 561 (14.5%) | 302 (6.9%) |
| 60 to 64 Years | 315 (8.2%) | 277 (6.4%) |
| 65 to 69 Years | 296 (7.7%) | 419 (9.6%) |
| 70 to 74 Years | 156 (4.0%) | 185 (4.3%) |
| 75 to 79 Years | 91 (2.4%) | 209 (4.8%) |
| 80 to 84 Years | 99 (2.6%) | 42 (1.0%) |
| 85 Years and over | 39 (1.0%) | 183 (4.2%) |
| Total | 3,865 (100.0%) | 4,354 (100.0%) |
Families and Households in Maryville
Median Family Size in Maryville
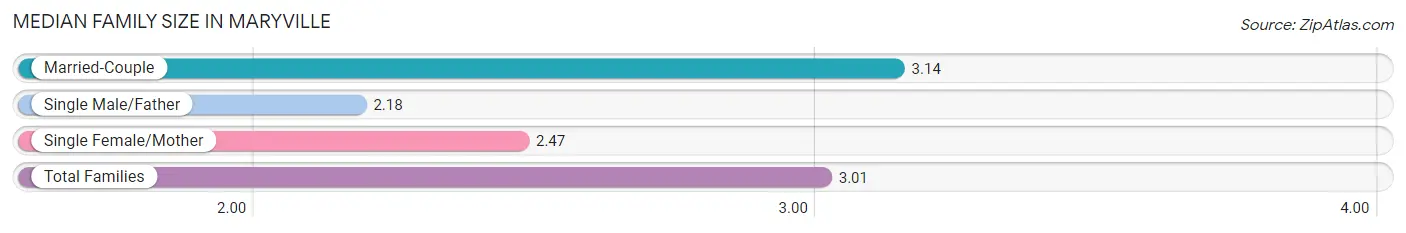
The median family size in Maryville is 3.01 persons per family, with married-couple families (1,833 | 83.7%) accounting for the largest median family size of 3.14 persons per family. On the other hand, single male/father families (110 | 5.0%) represent the smallest median family size with 2.18 persons per family.
| Family Type | # Families | Family Size |
| Married-Couple | 1,833 (83.7%) | 3.14 |
| Single Male/Father | 110 (5.0%) | 2.18 |
| Single Female/Mother | 248 (11.3%) | 2.47 |
| Total Families | 2,191 (100.0%) | 3.01 |
Median Household Size in Maryville
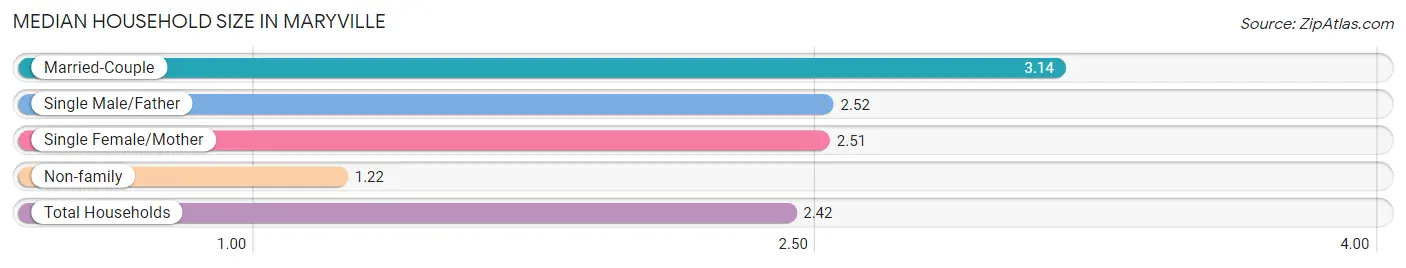
The median household size in Maryville is 2.42 persons per household, with married-couple households (1,833 | 55.3%) accounting for the largest median household size of 3.14 persons per household. non-family households (1,124 | 33.9%) represent the smallest median household size with 1.22 persons per household.
| Household Type | # Households | Household Size |
| Married-Couple | 1,833 (55.3%) | 3.14 |
| Single Male/Father | 110 (3.3%) | 2.52 |
| Single Female/Mother | 248 (7.5%) | 2.51 |
| Non-family | 1,124 (33.9%) | 1.22 |
| Total Households | 3,315 (100.0%) | 2.42 |
Household Size by Marriage Status in Maryville
Out of a total of 3,315 households in Maryville, 2,191 (66.1%) are family households, while 1,124 (33.9%) are nonfamily households. The most numerous type of family households are 2-person households, comprising 1,100, and the most common type of nonfamily households are 1-person households, comprising 877.
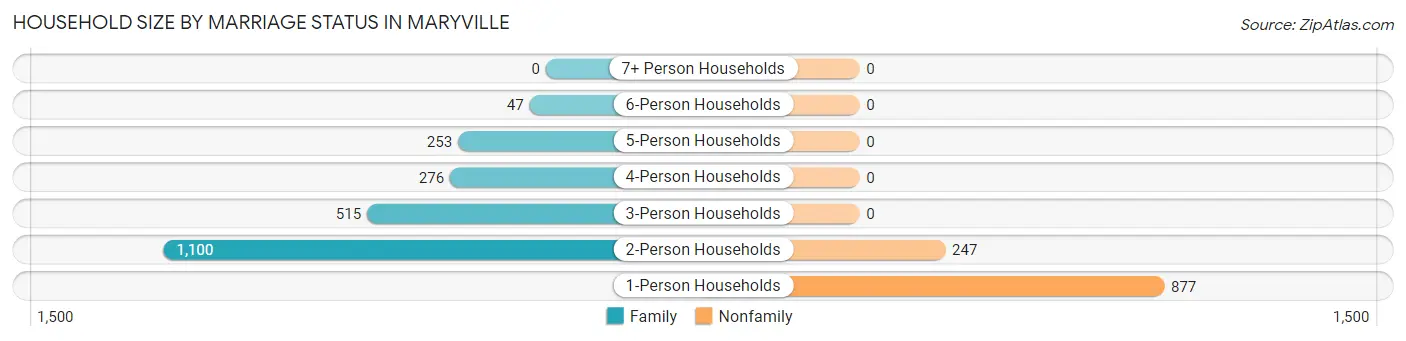
| Household Size | Family Households | Nonfamily Households |
| 1-Person Households | - | 877 (26.5%) |
| 2-Person Households | 1,100 (33.2%) | 247 (7.4%) |
| 3-Person Households | 515 (15.5%) | 0 (0.0%) |
| 4-Person Households | 276 (8.3%) | 0 (0.0%) |
| 5-Person Households | 253 (7.6%) | 0 (0.0%) |
| 6-Person Households | 47 (1.4%) | 0 (0.0%) |
| 7+ Person Households | 0 (0.0%) | 0 (0.0%) |
| Total | 2,191 (66.1%) | 1,124 (33.9%) |
Female Fertility in Maryville
Fertility by Age in Maryville
Average fertility rate in Maryville is 64.0 births per 1,000 women. Women in the age bracket of 20 to 34 years have the highest fertility rate with 98.0 births per 1,000 women. Women in the age bracket of 20 to 34 years acount for 75.2% of all women with births.
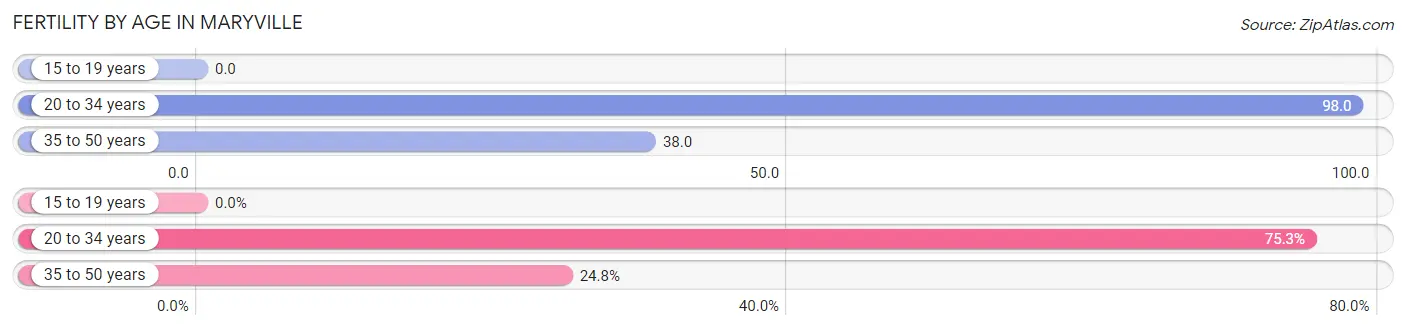
| Age Bracket | Women with Births | Births / 1,000 Women |
| 15 to 19 years | 0 (0.0%) | 0.0 |
| 20 to 34 years | 76 (75.2%) | 98.0 |
| 35 to 50 years | 25 (24.7%) | 38.0 |
| Total | 101 (100.0%) | 64.0 |
Fertility by Age by Marriage Status in Maryville
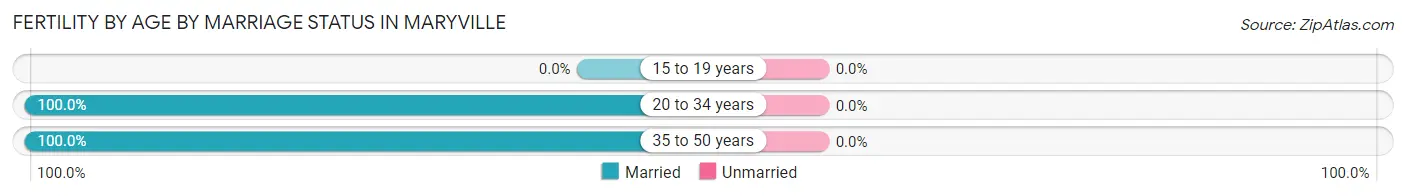
| Age Bracket | Married | Unmarried |
| 15 to 19 years | 0 (0.0%) | 0 (0.0%) |
| 20 to 34 years | 76 (100.0%) | 0 (0.0%) |
| 35 to 50 years | 25 (100.0%) | 0 (0.0%) |
| Total | 101 (100.0%) | 0 (0.0%) |
Fertility by Education in Maryville
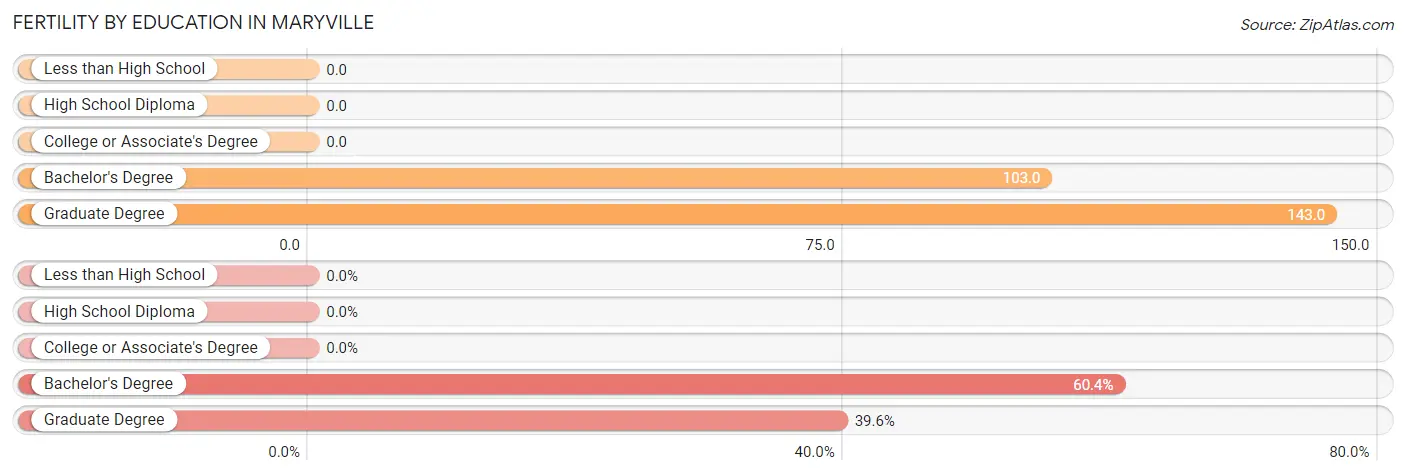
| Educational Attainment | Women with Births | Births / 1,000 Women |
| Less than High School | 0 (0.0%) | 0.0 |
| High School Diploma | 0 (0.0%) | 0.0 |
| College or Associate's Degree | 0 (0.0%) | 0.0 |
| Bachelor's Degree | 61 (60.4%) | 103.0 |
| Graduate Degree | 40 (39.6%) | 143.0 |
| Total | 101 (100.0%) | 64.0 |
Fertility by Education by Marriage Status in Maryville
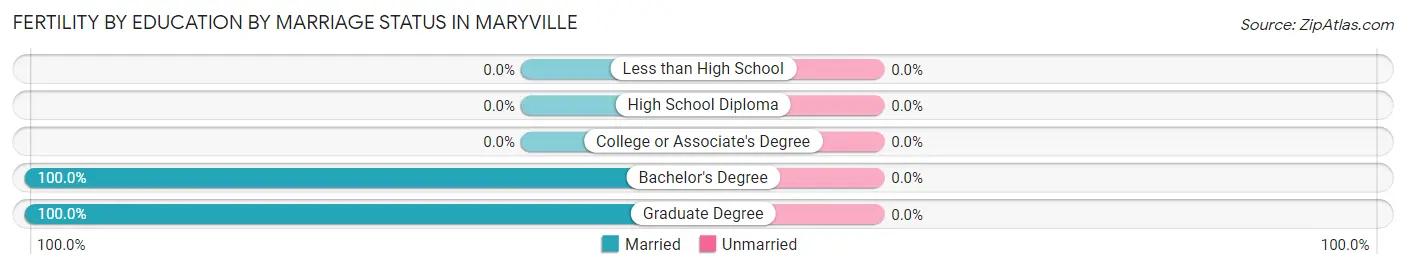
| Educational Attainment | Married | Unmarried |
| Less than High School | 0 (0.0%) | 0 (0.0%) |
| High School Diploma | 0 (0.0%) | 0 (0.0%) |
| College or Associate's Degree | 0 (0.0%) | 0 (0.0%) |
| Bachelor's Degree | 61 (100.0%) | 0 (0.0%) |
| Graduate Degree | 40 (100.0%) | 0 (0.0%) |
| Total | 101 (100.0%) | 0 (0.0%) |
Employment Characteristics in Maryville
Employment by Class of Employer in Maryville
Among the 4,111 employed individuals in Maryville, private company employees (2,918 | 71.0%), not-for-profit organizations (576 | 14.0%), and local government employees (227 | 5.5%) make up the most common classes of employment.
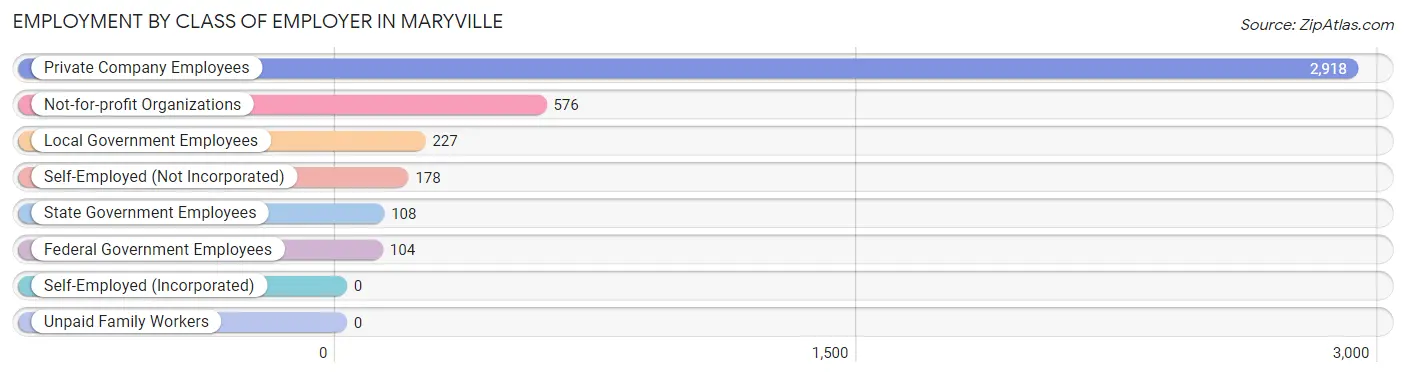
| Employer Class | # Employees | % Employees |
| Private Company Employees | 2,918 | 71.0% |
| Self-Employed (Incorporated) | 0 | 0.0% |
| Self-Employed (Not Incorporated) | 178 | 4.3% |
| Not-for-profit Organizations | 576 | 14.0% |
| Local Government Employees | 227 | 5.5% |
| State Government Employees | 108 | 2.6% |
| Federal Government Employees | 104 | 2.5% |
| Unpaid Family Workers | 0 | 0.0% |
| Total | 4,111 | 100.0% |
Employment Status by Age in Maryville
According to the labor force statistics for Maryville, out of the total population over 16 years of age (6,848), 65.2% or 4,465 individuals are in the labor force, with 6.3% or 281 of them unemployed. The age group with the highest labor force participation rate is 20 to 24 years, with 94.3% or 413 individuals in the labor force. Within the labor force, the 25 to 29 years age range has the highest percentage of unemployed individuals, with 31.6% or 150 of them being unemployed.
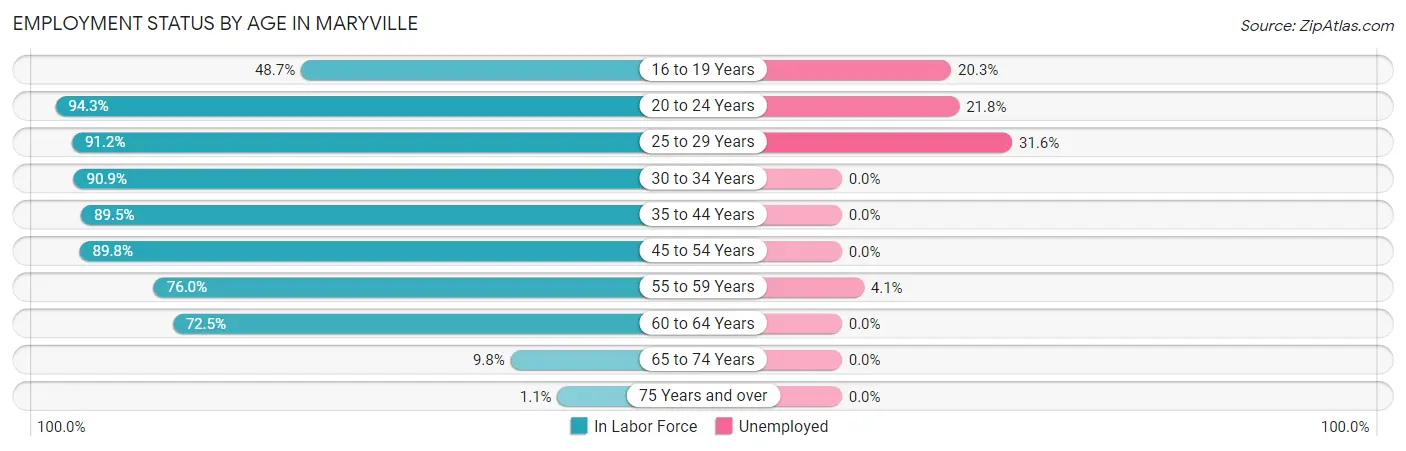
| Age Bracket | In Labor Force | Unemployed |
| 16 to 19 Years | 74 (48.7%) | 15 (20.3%) |
| 20 to 24 Years | 413 (94.3%) | 90 (21.8%) |
| 25 to 29 Years | 474 (91.2%) | 150 (31.6%) |
| 30 to 34 Years | 448 (90.9%) | 0 (0.0%) |
| 35 to 44 Years | 796 (89.5%) | 0 (0.0%) |
| 45 to 54 Years | 1,061 (89.8%) | 0 (0.0%) |
| 55 to 59 Years | 656 (76.0%) | 27 (4.1%) |
| 60 to 64 Years | 429 (72.5%) | 0 (0.0%) |
| 65 to 74 Years | 103 (9.8%) | 0 (0.0%) |
| 75 Years and over | 7 (1.1%) | 0 (0.0%) |
| Total | 4,465 (65.2%) | 281 (6.3%) |
Employment Status by Educational Attainment in Maryville
According to labor force statistics for Maryville, 85.2% of individuals (3,867) out of the total population between 25 and 64 years of age (4,539) are in the labor force, with 4.6% or 178 of them being unemployed. The group with the highest labor force participation rate are those with the educational attainment of less than high school, with 96.4% or 108 individuals in the labor force. Within the labor force, individuals with high school diploma education have the highest percentage of unemployment, with 6.3% or 28 of them being unemployed.
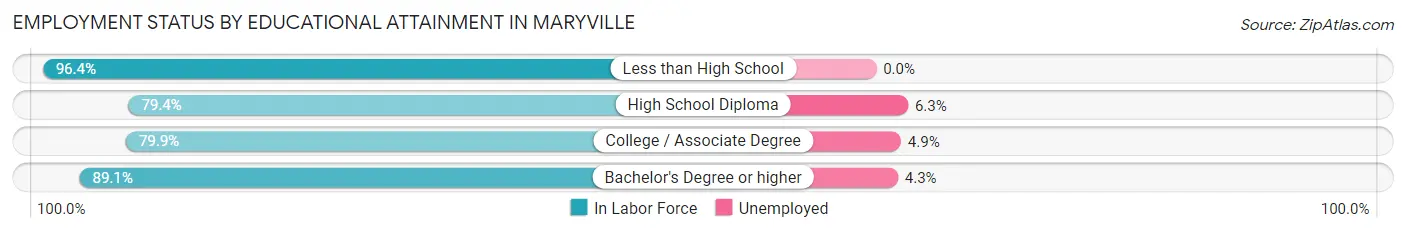
| Educational Attainment | In Labor Force | Unemployed |
| Less than High School | 108 (96.4%) | 0 (0.0%) |
| High School Diploma | 447 (79.4%) | 35 (6.3%) |
| College / Associate Degree | 1,154 (79.9%) | 71 (4.9%) |
| Bachelor's Degree or higher | 2,156 (89.1%) | 104 (4.3%) |
| Total | 3,867 (85.2%) | 209 (4.6%) |
Employment Occupations by Sex in Maryville
Management, Business, Science and Arts Occupations
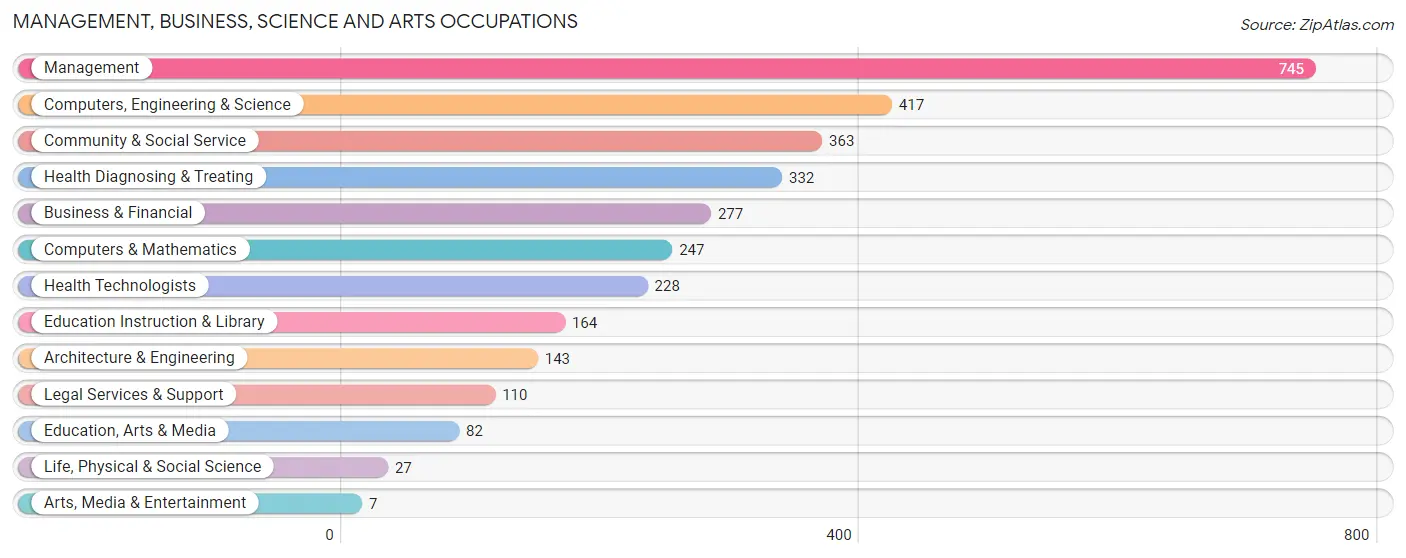
The most common Management, Business, Science and Arts occupations in Maryville are Management (745 | 17.8%), Computers, Engineering & Science (417 | 10.0%), Community & Social Service (363 | 8.7%), Health Diagnosing & Treating (332 | 7.9%), and Business & Financial (277 | 6.6%).
Management, Business, Science and Arts Occupations by Sex
Within the Management, Business, Science and Arts occupations in Maryville, the most male-oriented occupations are Arts, Media & Entertainment (100.0%), Architecture & Engineering (85.3%), and Education, Arts & Media (68.3%), while the most female-oriented occupations are Education Instruction & Library (100.0%), Legal Services & Support (90.9%), and Community & Social Service (79.9%).
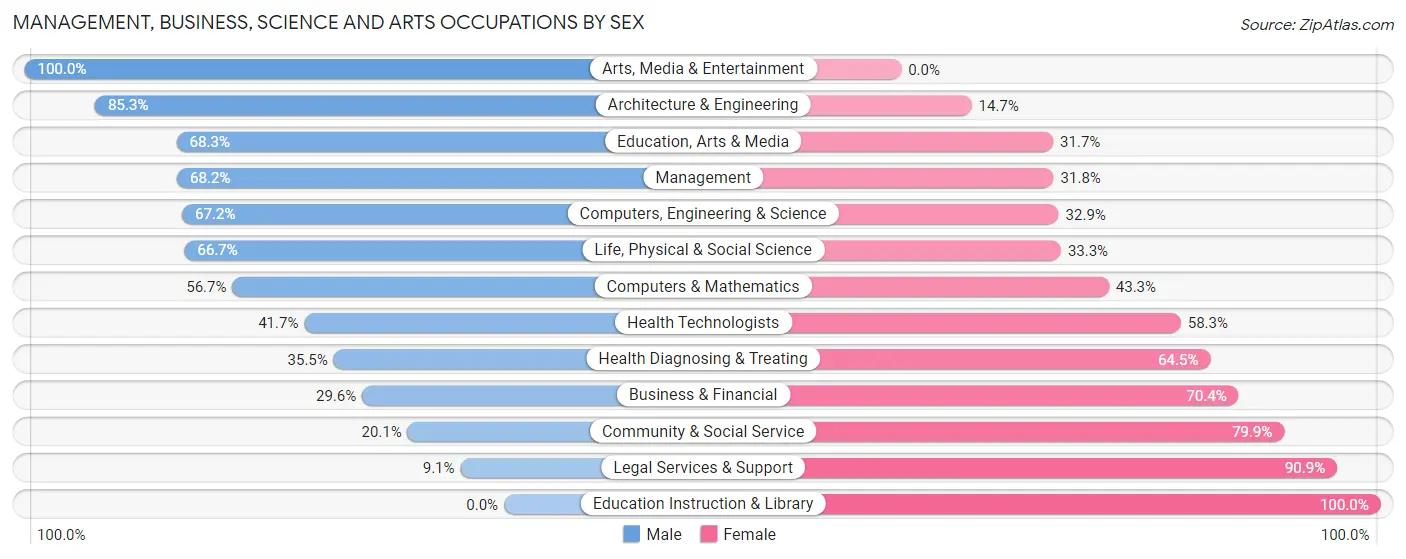
| Occupation | Male | Female |
| Management | 508 (68.2%) | 237 (31.8%) |
| Business & Financial | 82 (29.6%) | 195 (70.4%) |
| Computers, Engineering & Science | 280 (67.1%) | 137 (32.9%) |
| Computers & Mathematics | 140 (56.7%) | 107 (43.3%) |
| Architecture & Engineering | 122 (85.3%) | 21 (14.7%) |
| Life, Physical & Social Science | 18 (66.7%) | 9 (33.3%) |
| Community & Social Service | 73 (20.1%) | 290 (79.9%) |
| Education, Arts & Media | 56 (68.3%) | 26 (31.7%) |
| Legal Services & Support | 10 (9.1%) | 100 (90.9%) |
| Education Instruction & Library | 0 (0.0%) | 164 (100.0%) |
| Arts, Media & Entertainment | 7 (100.0%) | 0 (0.0%) |
| Health Diagnosing & Treating | 118 (35.5%) | 214 (64.5%) |
| Health Technologists | 95 (41.7%) | 133 (58.3%) |
| Total (Category) | 1,061 (49.7%) | 1,073 (50.3%) |
| Total (Overall) | 2,092 (50.0%) | 2,089 (50.0%) |
Services Occupations
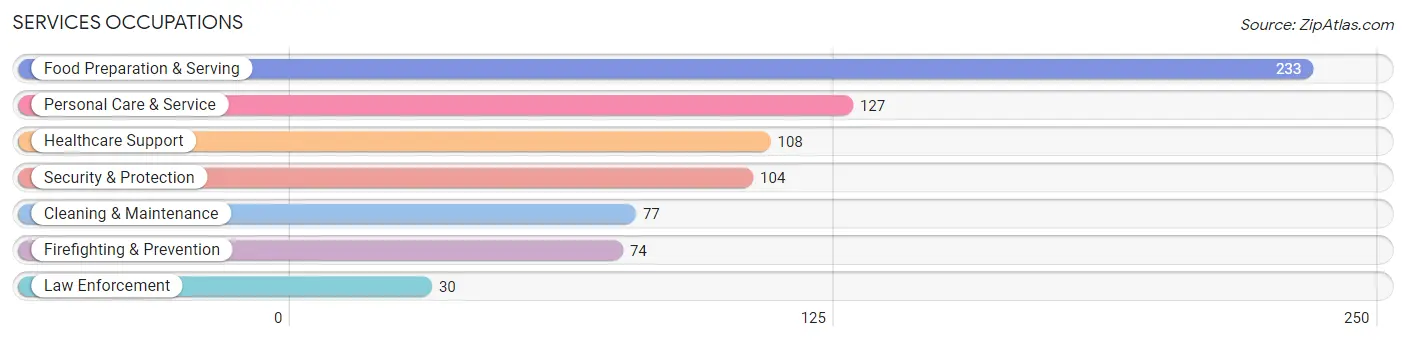
The most common Services occupations in Maryville are Food Preparation & Serving (233 | 5.6%), Personal Care & Service (127 | 3.0%), Healthcare Support (108 | 2.6%), Security & Protection (104 | 2.5%), and Cleaning & Maintenance (77 | 1.8%).
Services Occupations by Sex
Within the Services occupations in Maryville, the most male-oriented occupations are Security & Protection (100.0%), Firefighting & Prevention (100.0%), and Law Enforcement (100.0%), while the most female-oriented occupations are Healthcare Support (100.0%), Personal Care & Service (100.0%), and Food Preparation & Serving (70.4%).
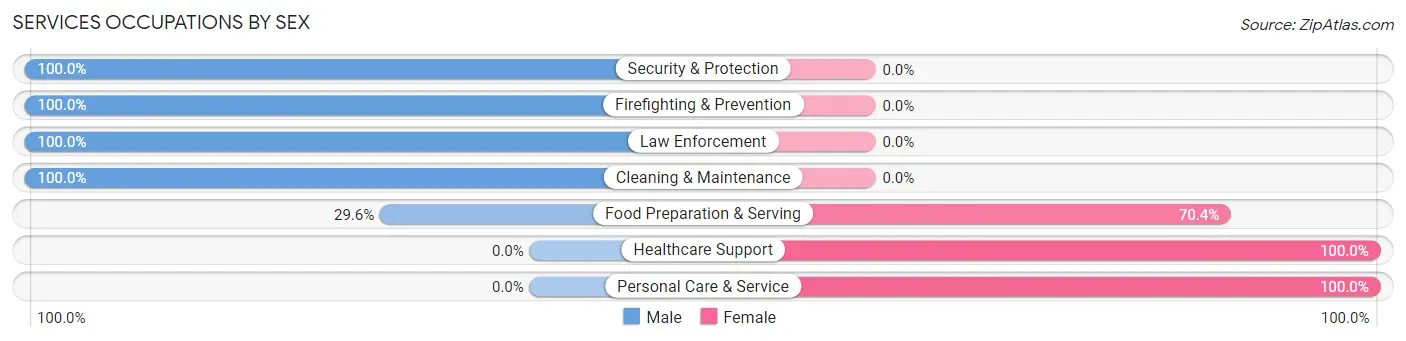
| Occupation | Male | Female |
| Healthcare Support | 0 (0.0%) | 108 (100.0%) |
| Security & Protection | 104 (100.0%) | 0 (0.0%) |
| Firefighting & Prevention | 74 (100.0%) | 0 (0.0%) |
| Law Enforcement | 30 (100.0%) | 0 (0.0%) |
| Food Preparation & Serving | 69 (29.6%) | 164 (70.4%) |
| Cleaning & Maintenance | 77 (100.0%) | 0 (0.0%) |
| Personal Care & Service | 0 (0.0%) | 127 (100.0%) |
| Total (Category) | 250 (38.5%) | 399 (61.5%) |
| Total (Overall) | 2,092 (50.0%) | 2,089 (50.0%) |
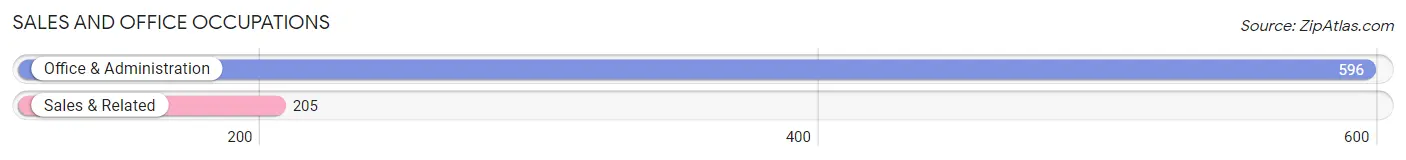
Sales and Office Occupations
The most common Sales and Office occupations in Maryville are Office & Administration (596 | 14.2%), and Sales & Related (205 | 4.9%).
Sales and Office Occupations by Sex
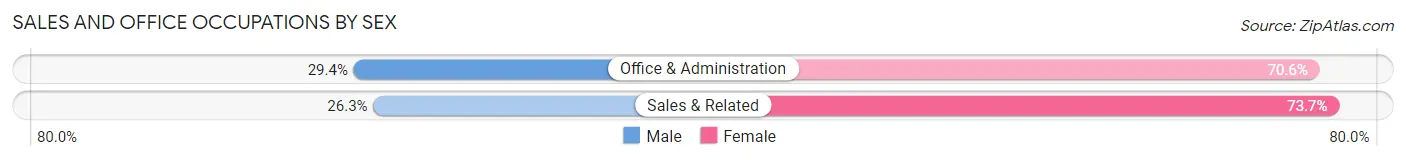
| Occupation | Male | Female |
| Sales & Related | 54 (26.3%) | 151 (73.7%) |
| Office & Administration | 175 (29.4%) | 421 (70.6%) |
| Total (Category) | 229 (28.6%) | 572 (71.4%) |
| Total (Overall) | 2,092 (50.0%) | 2,089 (50.0%) |
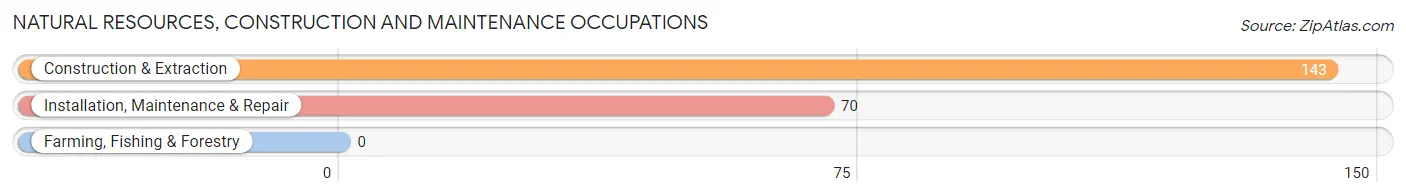
Natural Resources, Construction and Maintenance Occupations
The most common Natural Resources, Construction and Maintenance occupations in Maryville are Construction & Extraction (143 | 3.4%), and Installation, Maintenance & Repair (70 | 1.7%).
Natural Resources, Construction and Maintenance Occupations by Sex
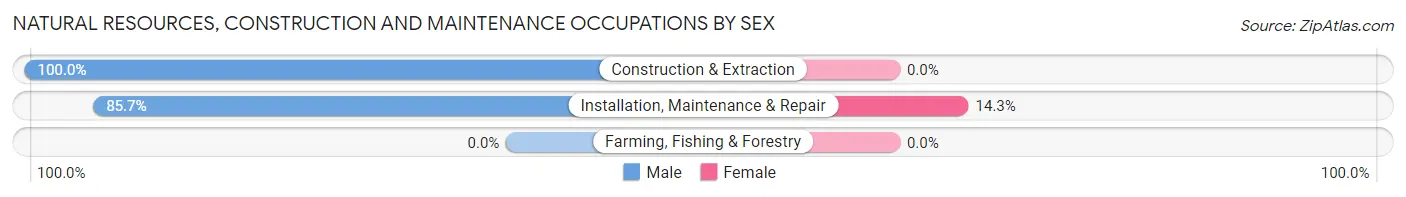
| Occupation | Male | Female |
| Farming, Fishing & Forestry | 0 (0.0%) | 0 (0.0%) |
| Construction & Extraction | 143 (100.0%) | 0 (0.0%) |
| Installation, Maintenance & Repair | 60 (85.7%) | 10 (14.3%) |
| Total (Category) | 203 (95.3%) | 10 (4.7%) |
| Total (Overall) | 2,092 (50.0%) | 2,089 (50.0%) |
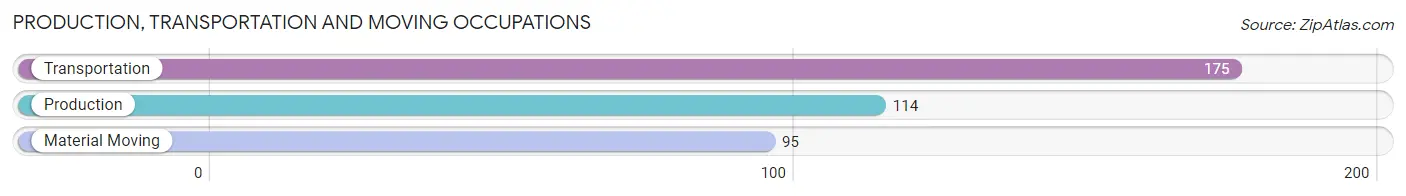
Production, Transportation and Moving Occupations
The most common Production, Transportation and Moving occupations in Maryville are Transportation (175 | 4.2%), Production (114 | 2.7%), and Material Moving (95 | 2.3%).
Production, Transportation and Moving Occupations by Sex
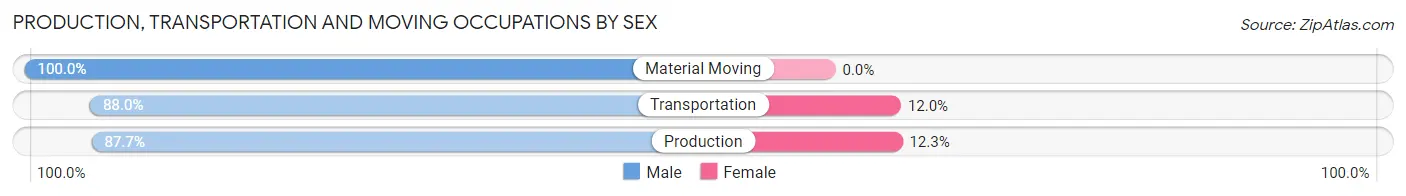
| Occupation | Male | Female |
| Production | 100 (87.7%) | 14 (12.3%) |
| Transportation | 154 (88.0%) | 21 (12.0%) |
| Material Moving | 95 (100.0%) | 0 (0.0%) |
| Total (Category) | 349 (90.9%) | 35 (9.1%) |
| Total (Overall) | 2,092 (50.0%) | 2,089 (50.0%) |
Employment Industries by Sex in Maryville
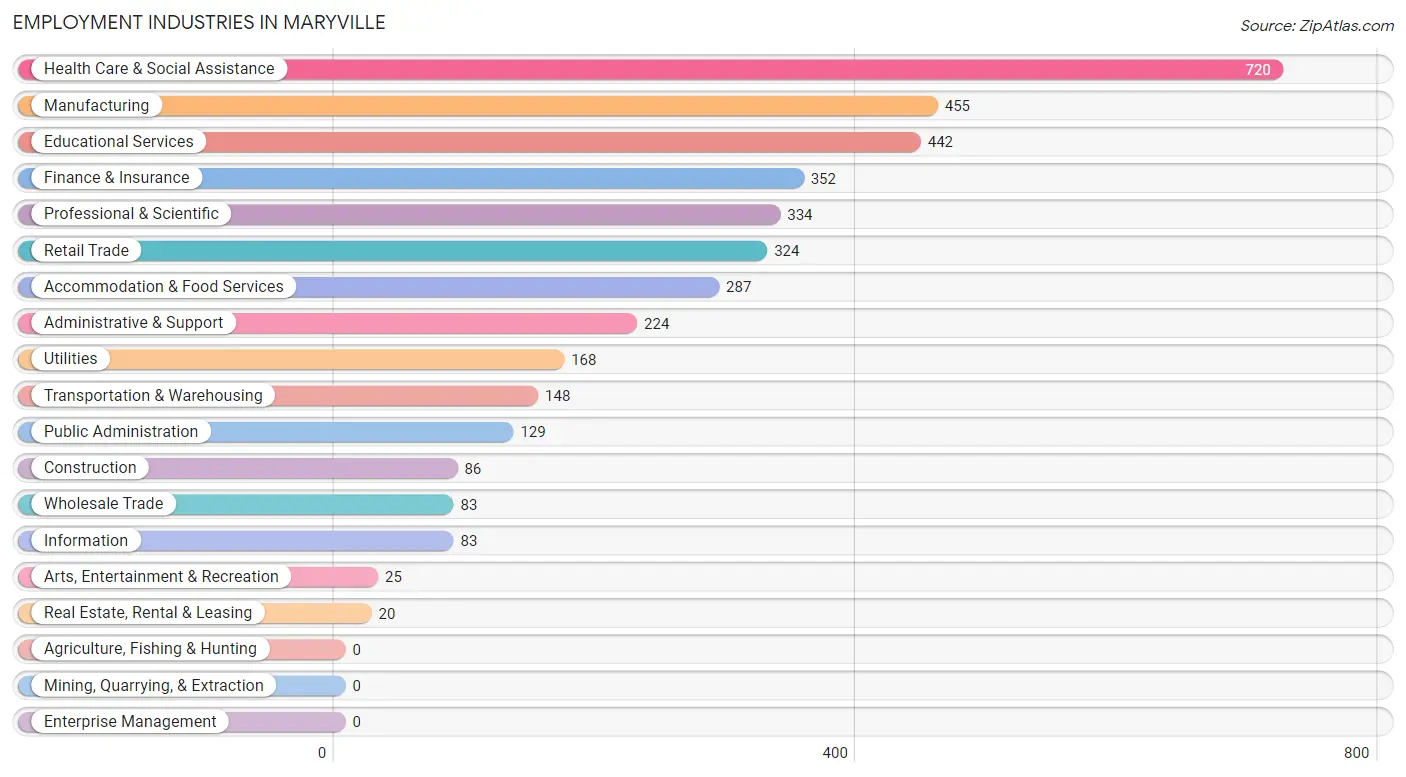
Employment Industries in Maryville
The major employment industries in Maryville include Health Care & Social Assistance (720 | 17.2%), Manufacturing (455 | 10.9%), Educational Services (442 | 10.6%), Finance & Insurance (352 | 8.4%), and Professional & Scientific (334 | 8.0%).
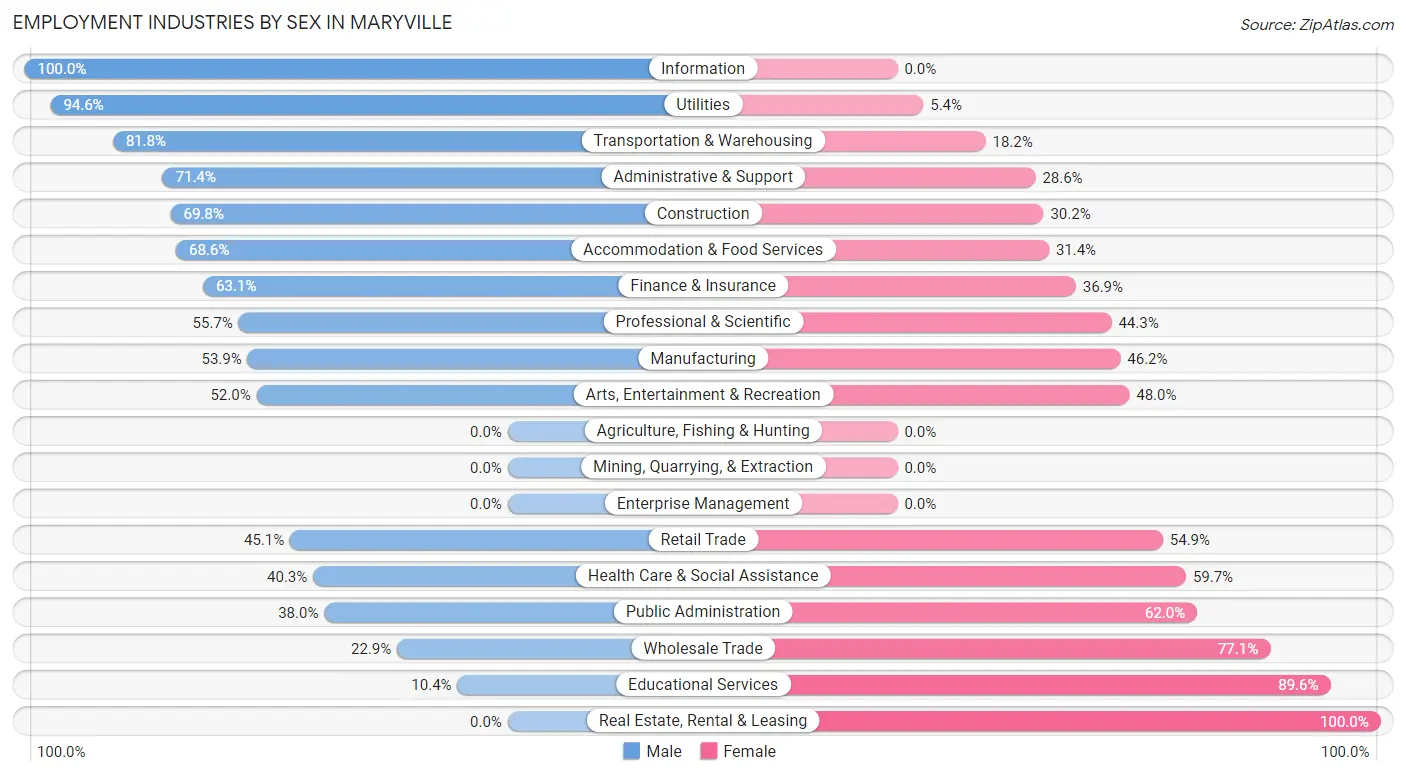
Employment Industries by Sex in Maryville
The Maryville industries that see more men than women are Information (100.0%), Utilities (94.6%), and Transportation & Warehousing (81.8%), whereas the industries that tend to have a higher number of women are Real Estate, Rental & Leasing (100.0%), Educational Services (89.6%), and Wholesale Trade (77.1%).
| Industry | Male | Female |
| Agriculture, Fishing & Hunting | 0 (0.0%) | 0 (0.0%) |
| Mining, Quarrying, & Extraction | 0 (0.0%) | 0 (0.0%) |
| Construction | 60 (69.8%) | 26 (30.2%) |
| Manufacturing | 245 (53.8%) | 210 (46.2%) |
| Wholesale Trade | 19 (22.9%) | 64 (77.1%) |
| Retail Trade | 146 (45.1%) | 178 (54.9%) |
| Transportation & Warehousing | 121 (81.8%) | 27 (18.2%) |
| Utilities | 159 (94.6%) | 9 (5.4%) |
| Information | 83 (100.0%) | 0 (0.0%) |
| Finance & Insurance | 222 (63.1%) | 130 (36.9%) |
| Real Estate, Rental & Leasing | 0 (0.0%) | 20 (100.0%) |
| Professional & Scientific | 186 (55.7%) | 148 (44.3%) |
| Enterprise Management | 0 (0.0%) | 0 (0.0%) |
| Administrative & Support | 160 (71.4%) | 64 (28.6%) |
| Educational Services | 46 (10.4%) | 396 (89.6%) |
| Health Care & Social Assistance | 290 (40.3%) | 430 (59.7%) |
| Arts, Entertainment & Recreation | 13 (52.0%) | 12 (48.0%) |
| Accommodation & Food Services | 197 (68.6%) | 90 (31.4%) |
| Public Administration | 49 (38.0%) | 80 (62.0%) |
| Total | 2,092 (50.0%) | 2,089 (50.0%) |
Education in Maryville
School Enrollment in Maryville
The most common levels of schooling among the 1,870 students in Maryville are college / undergraduate (474 | 25.4%), elementary school (392 | 21.0%), and high school (329 | 17.6%).
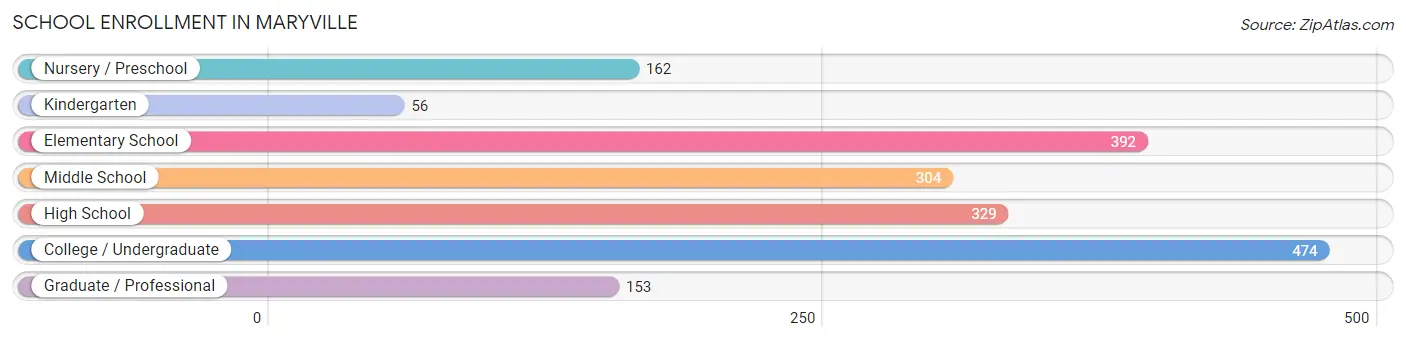
| School Level | # Students | % Students |
| Nursery / Preschool | 162 | 8.7% |
| Kindergarten | 56 | 3.0% |
| Elementary School | 392 | 21.0% |
| Middle School | 304 | 16.3% |
| High School | 329 | 17.6% |
| College / Undergraduate | 474 | 25.4% |
| Graduate / Professional | 153 | 8.2% |
| Total | 1,870 | 100.0% |
School Enrollment by Age by Funding Source in Maryville
Out of a total of 1,870 students who are enrolled in schools in Maryville, 699 (37.4%) attend a private institution, while the remaining 1,171 (62.6%) are enrolled in public schools. The age group of 5 to 9 year old has the highest likelihood of being enrolled in private schools, with 382 (73.3% in the age bracket) enrolled. Conversely, the age group of 3 to 4 year olds has the lowest likelihood of being enrolled in a private school, with 89 (100.0% in the age bracket) attending a public institution.
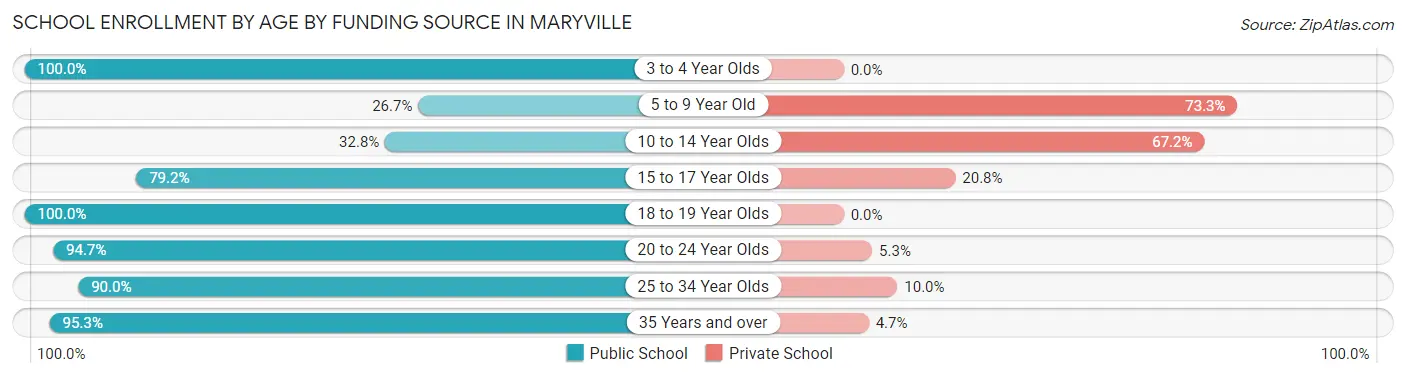
| Age Bracket | Public School | Private School |
| 3 to 4 Year Olds | 89 (100.0%) | 0 (0.0%) |
| 5 to 9 Year Old | 139 (26.7%) | 382 (73.3%) |
| 10 to 14 Year Olds | 112 (32.8%) | 229 (67.2%) |
| 15 to 17 Year Olds | 198 (79.2%) | 52 (20.8%) |
| 18 to 19 Year Olds | 56 (100.0%) | 0 (0.0%) |
| 20 to 24 Year Olds | 303 (94.7%) | 17 (5.3%) |
| 25 to 34 Year Olds | 90 (90.0%) | 10 (10.0%) |
| 35 Years and over | 184 (95.3%) | 9 (4.7%) |
| Total | 1,171 (62.6%) | 699 (37.4%) |
Educational Attainment by Field of Study in Maryville
Science & technology (759 | 23.1%), business (617 | 18.8%), education (297 | 9.0%), communications (261 | 7.9%), and engineering (183 | 5.6%) are the most common fields of study among 3,286 individuals in Maryville who have obtained a bachelor's degree or higher.
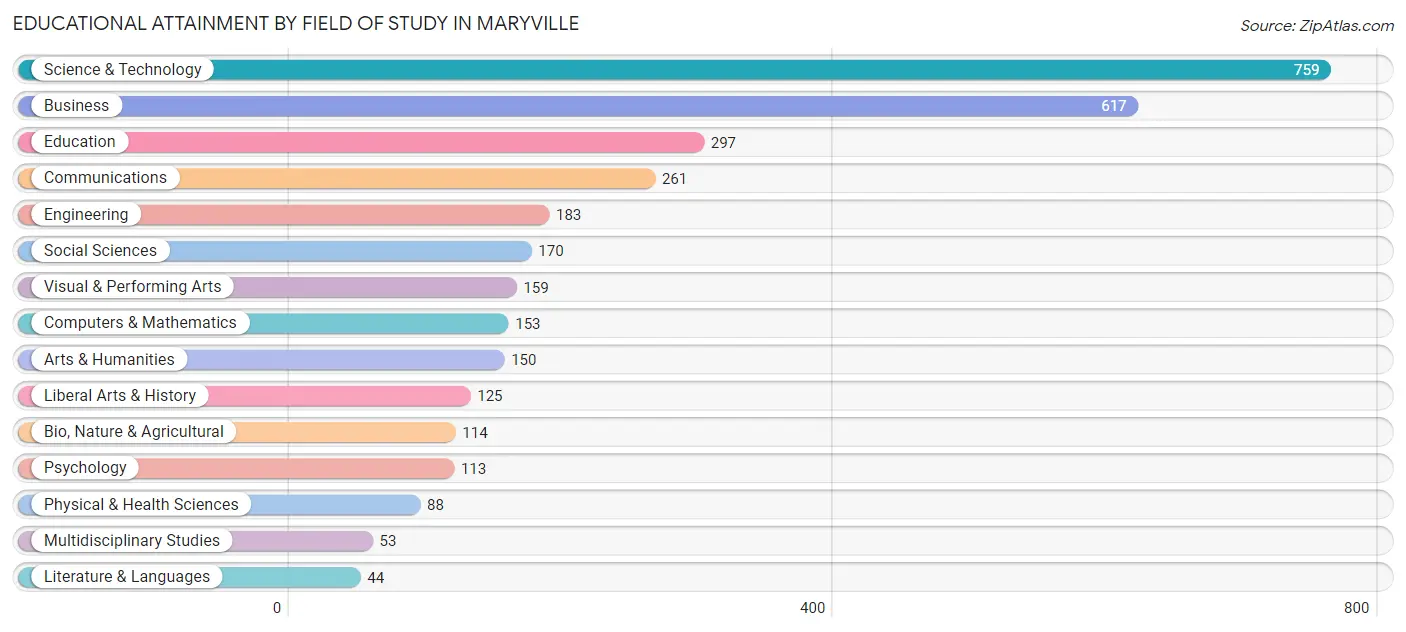
| Field of Study | # Graduates | % Graduates |
| Computers & Mathematics | 153 | 4.7% |
| Bio, Nature & Agricultural | 114 | 3.5% |
| Physical & Health Sciences | 88 | 2.7% |
| Psychology | 113 | 3.4% |
| Social Sciences | 170 | 5.2% |
| Engineering | 183 | 5.6% |
| Multidisciplinary Studies | 53 | 1.6% |
| Science & Technology | 759 | 23.1% |
| Business | 617 | 18.8% |
| Education | 297 | 9.0% |
| Literature & Languages | 44 | 1.3% |
| Liberal Arts & History | 125 | 3.8% |
| Visual & Performing Arts | 159 | 4.8% |
| Communications | 261 | 7.9% |
| Arts & Humanities | 150 | 4.6% |
| Total | 3,286 | 100.0% |
Transportation & Commute in Maryville
Vehicle Availability by Sex in Maryville
The most prevalent vehicle ownership categories in Maryville are males with 2 vehicles (1,106, accounting for 52.9%) and females with 2 vehicles (1,056, making up 54.8%).
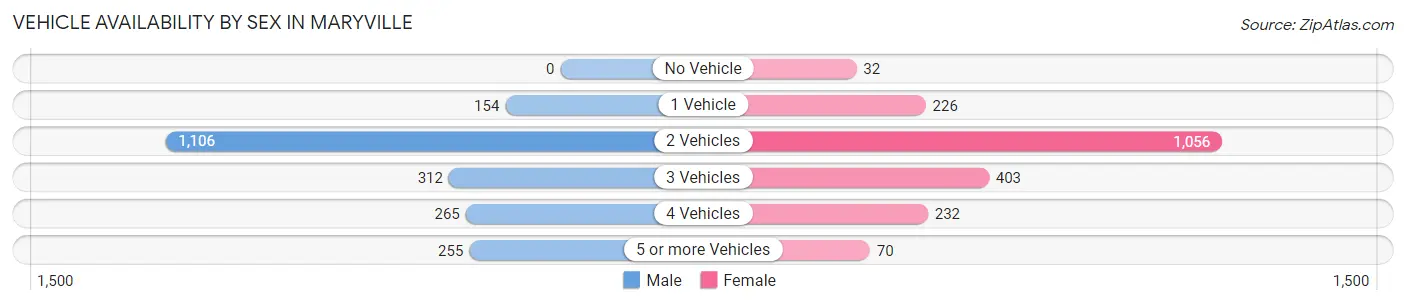
| Vehicles Available | Male | Female |
| No Vehicle | 0 (0.0%) | 32 (1.6%) |
| 1 Vehicle | 154 (7.4%) | 226 (11.2%) |
| 2 Vehicles | 1,106 (52.9%) | 1,056 (52.3%) |
| 3 Vehicles | 312 (14.9%) | 403 (20.0%) |
| 4 Vehicles | 265 (12.7%) | 232 (11.5%) |
| 5 or more Vehicles | 255 (12.2%) | 70 (3.5%) |
| Total | 2,092 (100.0%) | 2,019 (100.0%) |
Commute Time in Maryville
The most frequently occuring commute durations in Maryville are 30 to 34 minutes (582 commuters, 17.8%), 20 to 24 minutes (471 commuters, 14.4%), and 15 to 19 minutes (457 commuters, 14.0%).
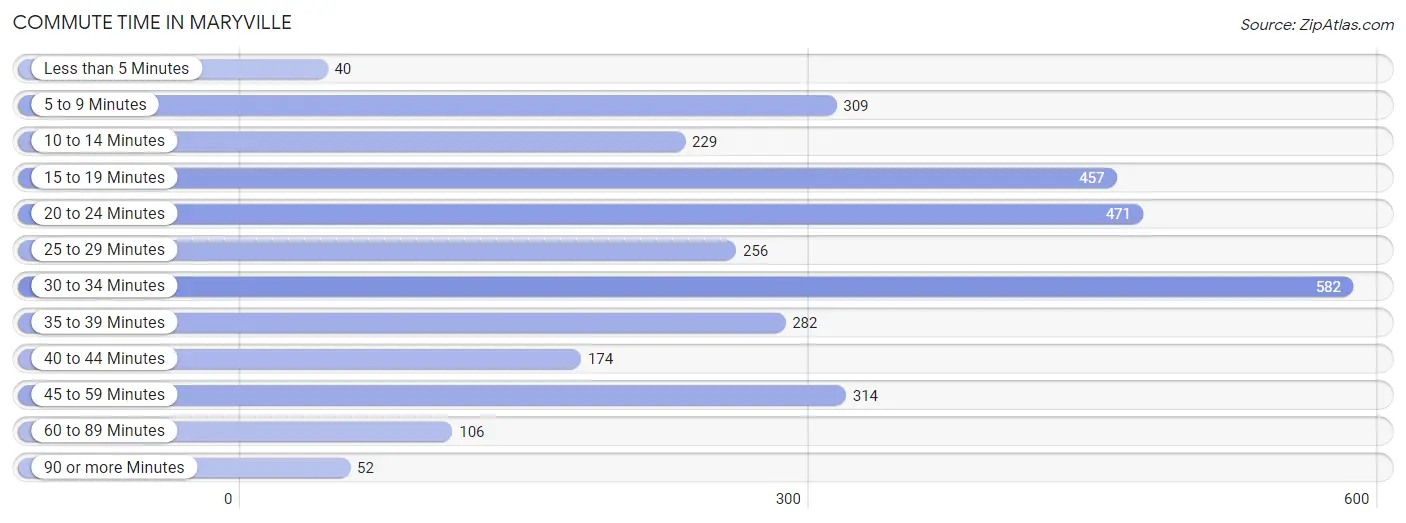
| Commute Time | # Commuters | % Commuters |
| Less than 5 Minutes | 40 | 1.2% |
| 5 to 9 Minutes | 309 | 9.4% |
| 10 to 14 Minutes | 229 | 7.0% |
| 15 to 19 Minutes | 457 | 14.0% |
| 20 to 24 Minutes | 471 | 14.4% |
| 25 to 29 Minutes | 256 | 7.8% |
| 30 to 34 Minutes | 582 | 17.8% |
| 35 to 39 Minutes | 282 | 8.6% |
| 40 to 44 Minutes | 174 | 5.3% |
| 45 to 59 Minutes | 314 | 9.6% |
| 60 to 89 Minutes | 106 | 3.2% |
| 90 or more Minutes | 52 | 1.6% |
Commute Time by Sex in Maryville
The most common commute times in Maryville are 30 to 34 minutes (358 commuters, 22.8%) for males and 20 to 24 minutes (294 commuters, 17.3%) for females.
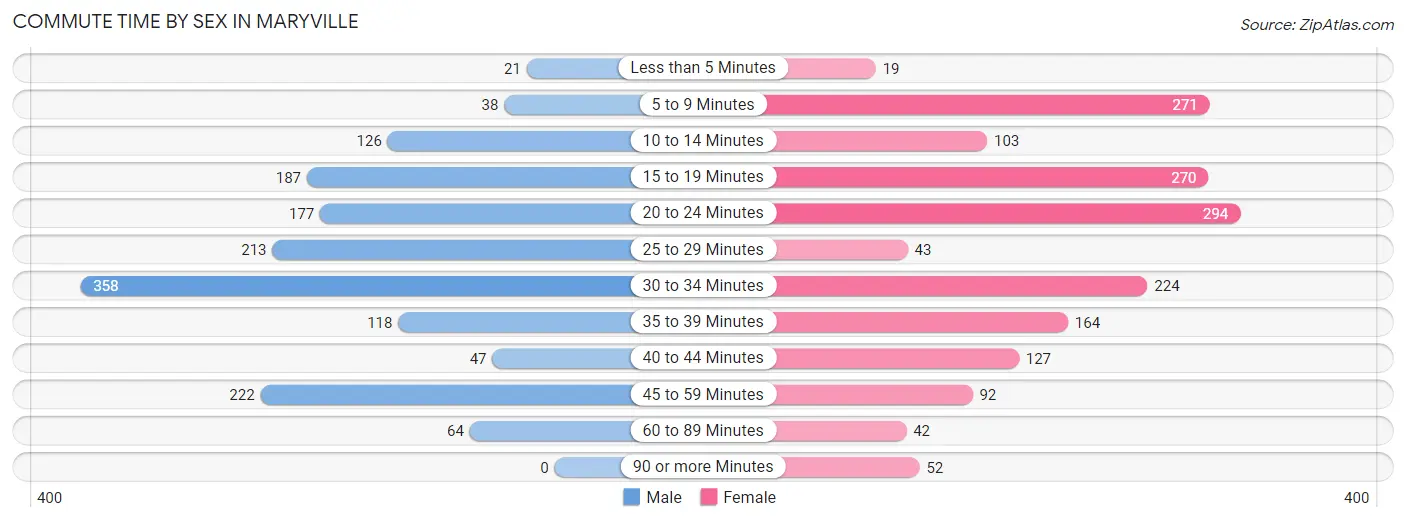
| Commute Time | Male | Female |
| Less than 5 Minutes | 21 (1.3%) | 19 (1.1%) |
| 5 to 9 Minutes | 38 (2.4%) | 271 (15.9%) |
| 10 to 14 Minutes | 126 (8.0%) | 103 (6.1%) |
| 15 to 19 Minutes | 187 (11.9%) | 270 (15.9%) |
| 20 to 24 Minutes | 177 (11.3%) | 294 (17.3%) |
| 25 to 29 Minutes | 213 (13.6%) | 43 (2.5%) |
| 30 to 34 Minutes | 358 (22.8%) | 224 (13.2%) |
| 35 to 39 Minutes | 118 (7.5%) | 164 (9.6%) |
| 40 to 44 Minutes | 47 (3.0%) | 127 (7.5%) |
| 45 to 59 Minutes | 222 (14.1%) | 92 (5.4%) |
| 60 to 89 Minutes | 64 (4.1%) | 42 (2.5%) |
| 90 or more Minutes | 0 (0.0%) | 52 (3.1%) |
Time of Departure to Work by Sex in Maryville
The most frequent times of departure to work in Maryville are 12:00 PM to 3:59 PM (334, 21.3%) for males and 12:00 PM to 3:59 PM (324, 19.1%) for females.
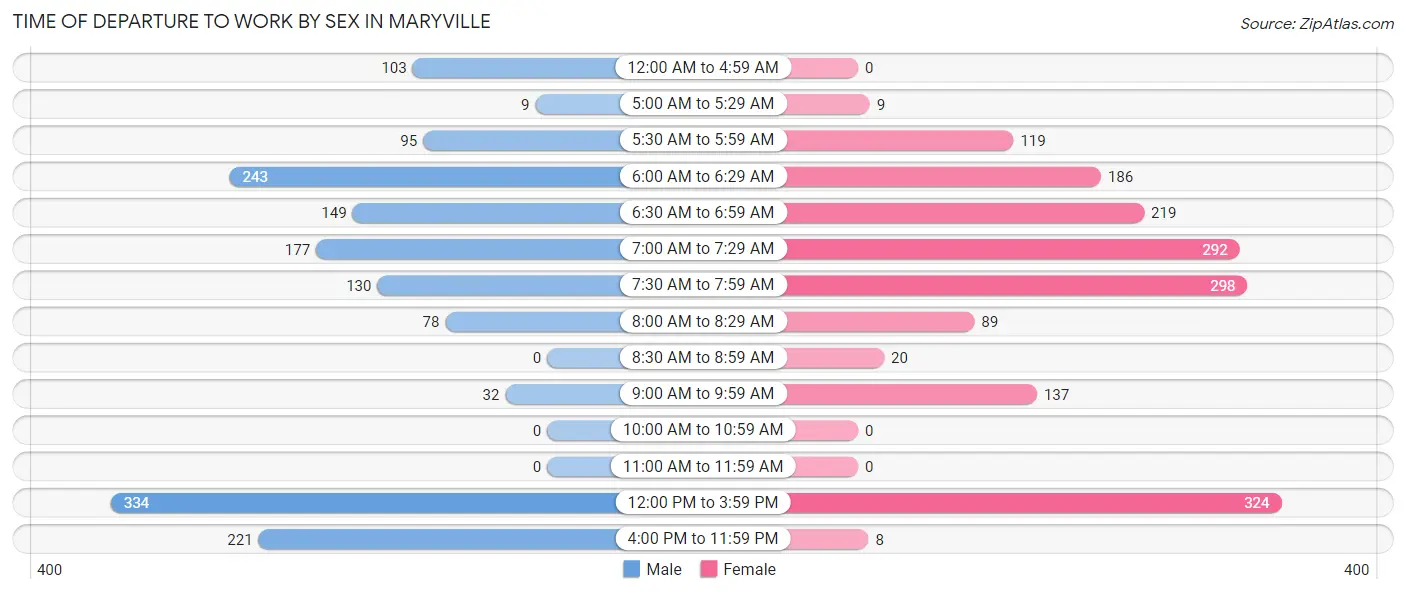
| Time of Departure | Male | Female |
| 12:00 AM to 4:59 AM | 103 (6.6%) | 0 (0.0%) |
| 5:00 AM to 5:29 AM | 9 (0.6%) | 9 (0.5%) |
| 5:30 AM to 5:59 AM | 95 (6.0%) | 119 (7.0%) |
| 6:00 AM to 6:29 AM | 243 (15.5%) | 186 (10.9%) |
| 6:30 AM to 6:59 AM | 149 (9.5%) | 219 (12.9%) |
| 7:00 AM to 7:29 AM | 177 (11.3%) | 292 (17.2%) |
| 7:30 AM to 7:59 AM | 130 (8.3%) | 298 (17.5%) |
| 8:00 AM to 8:29 AM | 78 (5.0%) | 89 (5.2%) |
| 8:30 AM to 8:59 AM | 0 (0.0%) | 20 (1.2%) |
| 9:00 AM to 9:59 AM | 32 (2.0%) | 137 (8.1%) |
| 10:00 AM to 10:59 AM | 0 (0.0%) | 0 (0.0%) |
| 11:00 AM to 11:59 AM | 0 (0.0%) | 0 (0.0%) |
| 12:00 PM to 3:59 PM | 334 (21.3%) | 324 (19.1%) |
| 4:00 PM to 11:59 PM | 221 (14.1%) | 8 (0.5%) |
| Total | 1,571 (100.0%) | 1,701 (100.0%) |
Housing Occupancy in Maryville
Occupancy by Ownership in Maryville
Of the total 3,315 dwellings in Maryville, owner-occupied units account for 2,850 (86.0%), while renter-occupied units make up 465 (14.0%).
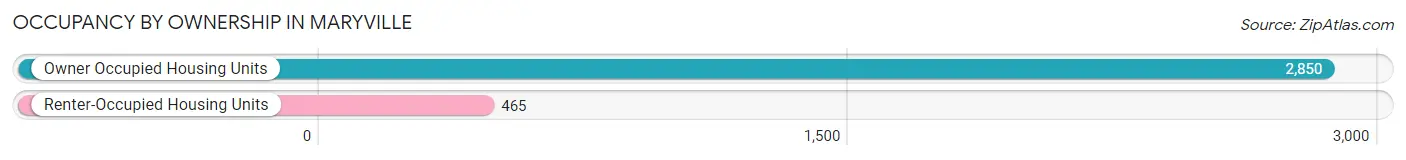
| Occupancy | # Housing Units | % Housing Units |
| Owner Occupied Housing Units | 2,850 | 86.0% |
| Renter-Occupied Housing Units | 465 | 14.0% |
| Total Occupied Housing Units | 3,315 | 100.0% |
Occupancy by Household Size in Maryville
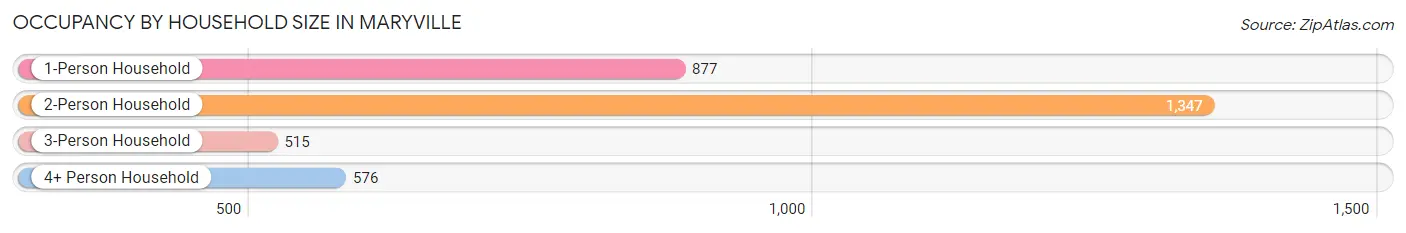
| Household Size | # Housing Units | % Housing Units |
| 1-Person Household | 877 | 26.5% |
| 2-Person Household | 1,347 | 40.6% |
| 3-Person Household | 515 | 15.5% |
| 4+ Person Household | 576 | 17.4% |
| Total Housing Units | 3,315 | 100.0% |
Occupancy by Ownership by Household Size in Maryville
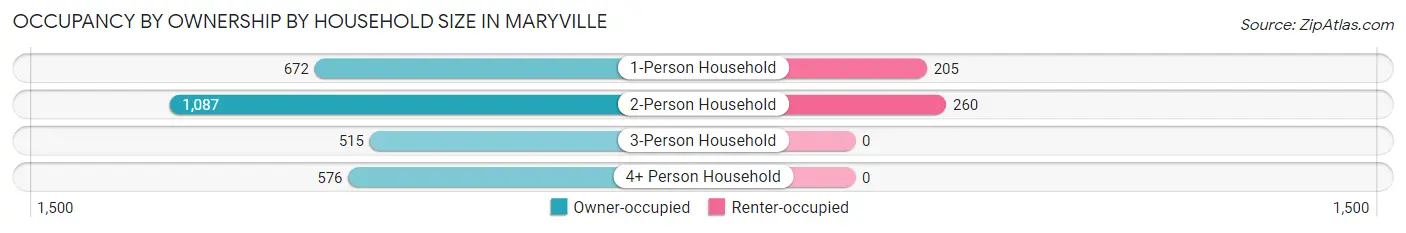
| Household Size | Owner-occupied | Renter-occupied |
| 1-Person Household | 672 (76.6%) | 205 (23.4%) |
| 2-Person Household | 1,087 (80.7%) | 260 (19.3%) |
| 3-Person Household | 515 (100.0%) | 0 (0.0%) |
| 4+ Person Household | 576 (100.0%) | 0 (0.0%) |
| Total Housing Units | 2,850 (86.0%) | 465 (14.0%) |
Occupancy by Educational Attainment in Maryville
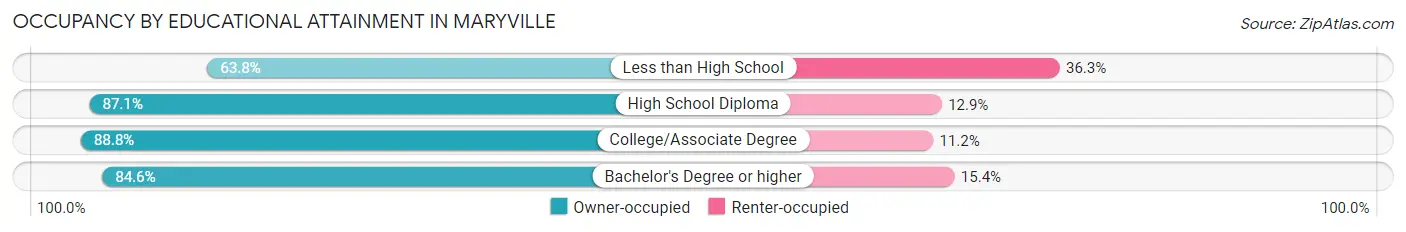
| Household Size | Owner-occupied | Renter-occupied |
| Less than High School | 51 (63.7%) | 29 (36.2%) |
| High School Diploma | 365 (87.1%) | 54 (12.9%) |
| College/Associate Degree | 1,089 (88.8%) | 137 (11.2%) |
| Bachelor's Degree or higher | 1,345 (84.6%) | 245 (15.4%) |
Occupancy by Age of Householder in Maryville
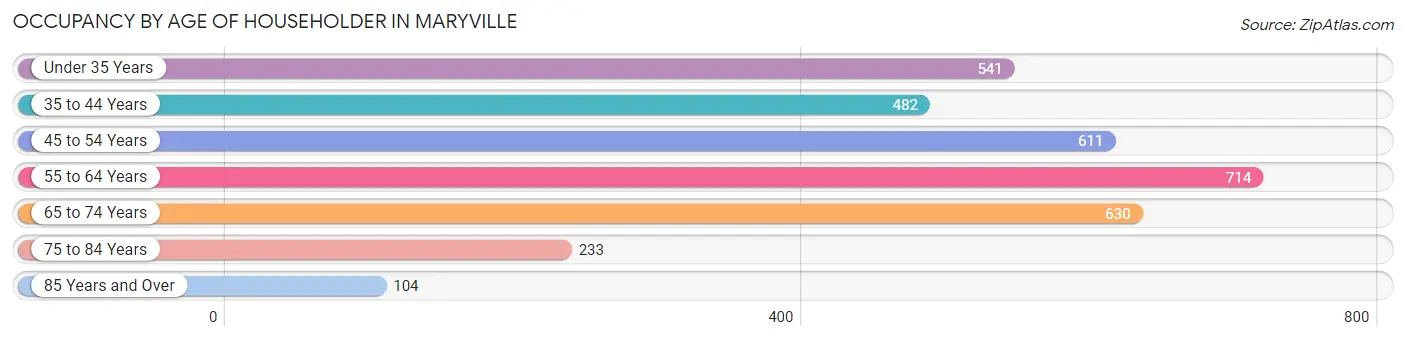
| Age Bracket | # Households | % Households |
| Under 35 Years | 541 | 16.3% |
| 35 to 44 Years | 482 | 14.5% |
| 45 to 54 Years | 611 | 18.4% |
| 55 to 64 Years | 714 | 21.5% |
| 65 to 74 Years | 630 | 19.0% |
| 75 to 84 Years | 233 | 7.0% |
| 85 Years and Over | 104 | 3.1% |
| Total | 3,315 | 100.0% |
Housing Finances in Maryville
Median Income by Occupancy in Maryville
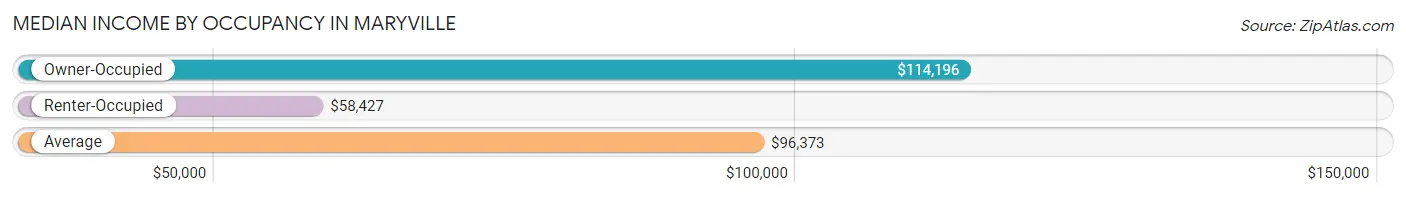
| Occupancy Type | # Households | Median Income |
| Owner-Occupied | 2,850 (86.0%) | $114,196 |
| Renter-Occupied | 465 (14.0%) | $58,427 |
| Average | 3,315 (100.0%) | $96,373 |
Occupancy by Householder Income Bracket in Maryville
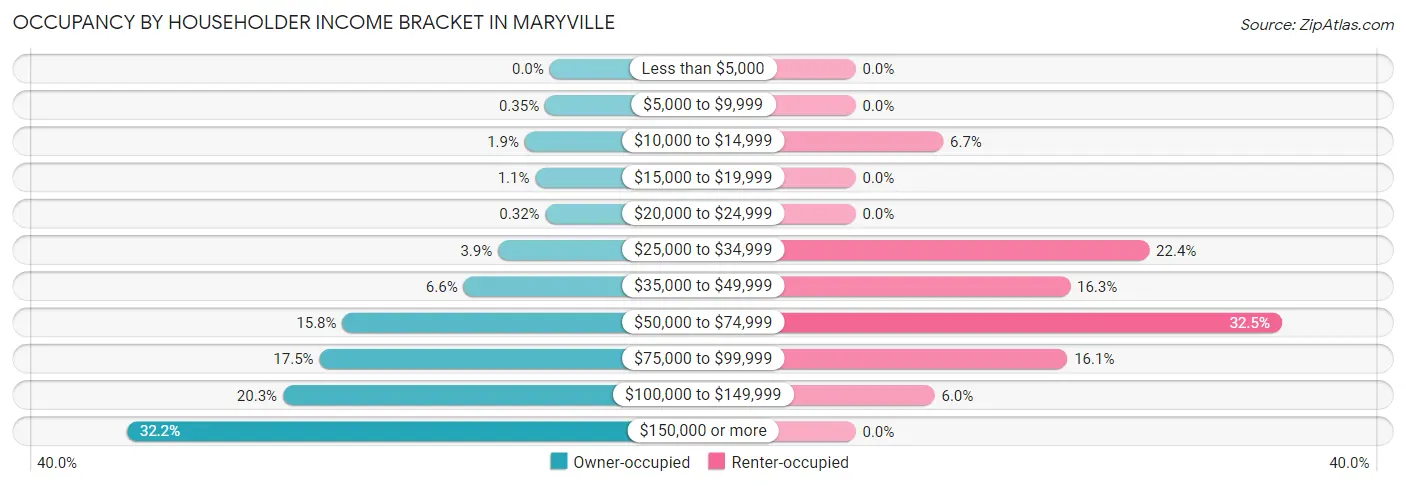
| Income Bracket | Owner-occupied | Renter-occupied |
| Less than $5,000 | 0 (0.0%) | 0 (0.0%) |
| $5,000 to $9,999 | 10 (0.4%) | 0 (0.0%) |
| $10,000 to $14,999 | 54 (1.9%) | 31 (6.7%) |
| $15,000 to $19,999 | 31 (1.1%) | 0 (0.0%) |
| $20,000 to $24,999 | 9 (0.3%) | 0 (0.0%) |
| $25,000 to $34,999 | 112 (3.9%) | 104 (22.4%) |
| $35,000 to $49,999 | 187 (6.6%) | 76 (16.3%) |
| $50,000 to $74,999 | 450 (15.8%) | 151 (32.5%) |
| $75,000 to $99,999 | 500 (17.5%) | 75 (16.1%) |
| $100,000 to $149,999 | 579 (20.3%) | 28 (6.0%) |
| $150,000 or more | 918 (32.2%) | 0 (0.0%) |
| Total | 2,850 (100.0%) | 465 (100.0%) |
Monthly Housing Cost Tiers in Maryville
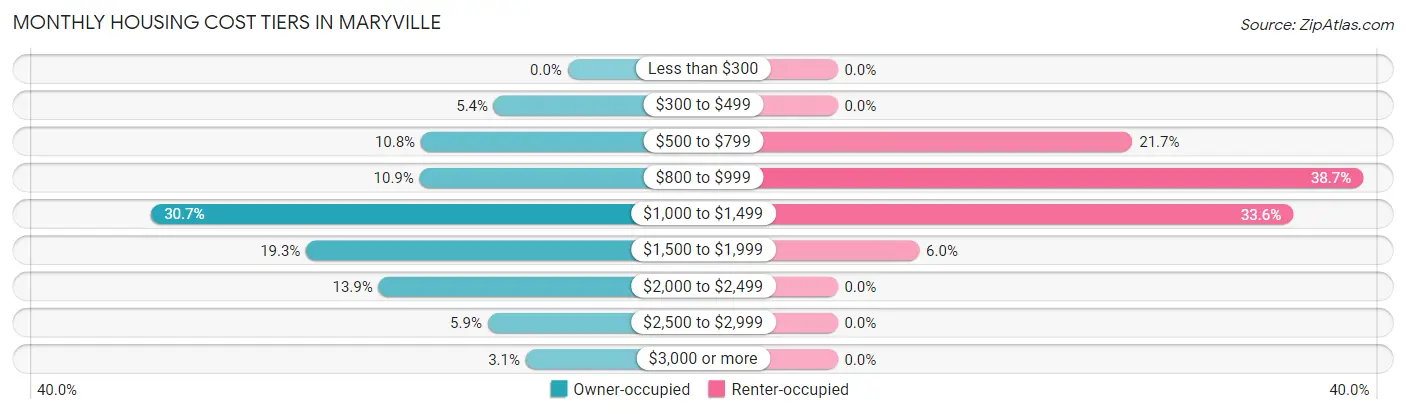
| Monthly Cost | Owner-occupied | Renter-occupied |
| Less than $300 | 0 (0.0%) | 0 (0.0%) |
| $300 to $499 | 155 (5.4%) | 0 (0.0%) |
| $500 to $799 | 308 (10.8%) | 101 (21.7%) |
| $800 to $999 | 311 (10.9%) | 180 (38.7%) |
| $1,000 to $1,499 | 874 (30.7%) | 156 (33.6%) |
| $1,500 to $1,999 | 549 (19.3%) | 28 (6.0%) |
| $2,000 to $2,499 | 397 (13.9%) | 0 (0.0%) |
| $2,500 to $2,999 | 168 (5.9%) | 0 (0.0%) |
| $3,000 or more | 88 (3.1%) | 0 (0.0%) |
| Total | 2,850 (100.0%) | 465 (100.0%) |
Physical Housing Characteristics in Maryville
Housing Structures in Maryville
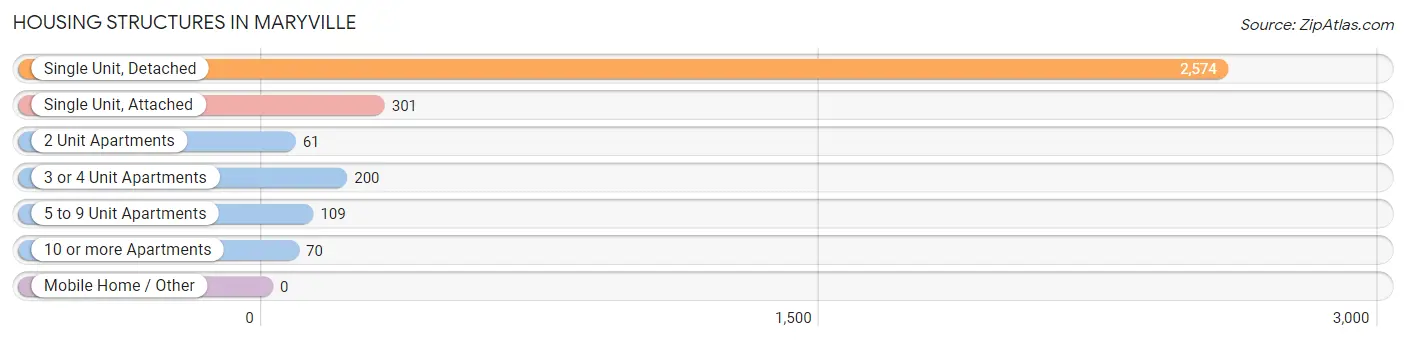
| Structure Type | # Housing Units | % Housing Units |
| Single Unit, Detached | 2,574 | 77.6% |
| Single Unit, Attached | 301 | 9.1% |
| 2 Unit Apartments | 61 | 1.8% |
| 3 or 4 Unit Apartments | 200 | 6.0% |
| 5 to 9 Unit Apartments | 109 | 3.3% |
| 10 or more Apartments | 70 | 2.1% |
| Mobile Home / Other | 0 | 0.0% |
| Total | 3,315 | 100.0% |
Housing Structures by Occupancy in Maryville
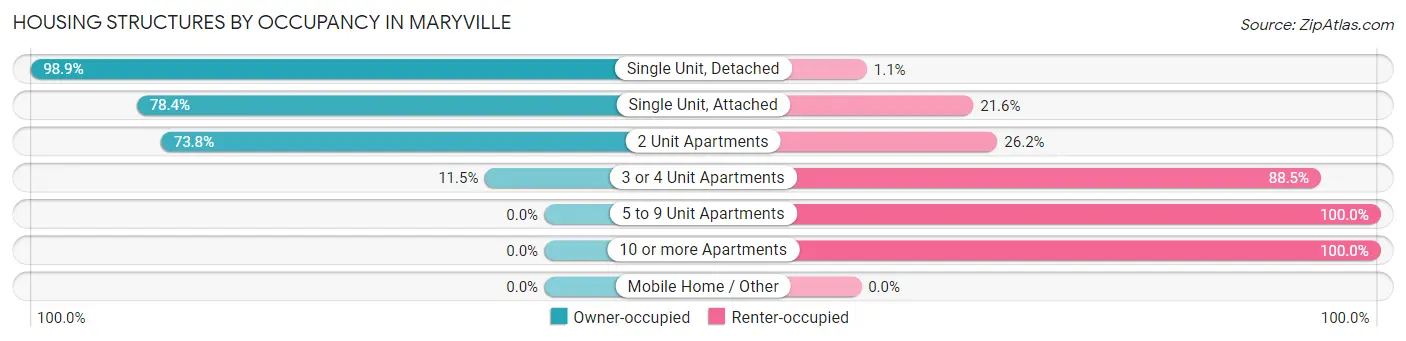
| Structure Type | Owner-occupied | Renter-occupied |
| Single Unit, Detached | 2,546 (98.9%) | 28 (1.1%) |
| Single Unit, Attached | 236 (78.4%) | 65 (21.6%) |
| 2 Unit Apartments | 45 (73.8%) | 16 (26.2%) |
| 3 or 4 Unit Apartments | 23 (11.5%) | 177 (88.5%) |
| 5 to 9 Unit Apartments | 0 (0.0%) | 109 (100.0%) |
| 10 or more Apartments | 0 (0.0%) | 70 (100.0%) |
| Mobile Home / Other | 0 (0.0%) | 0 (0.0%) |
| Total | 2,850 (86.0%) | 465 (14.0%) |
Housing Structures by Number of Rooms in Maryville
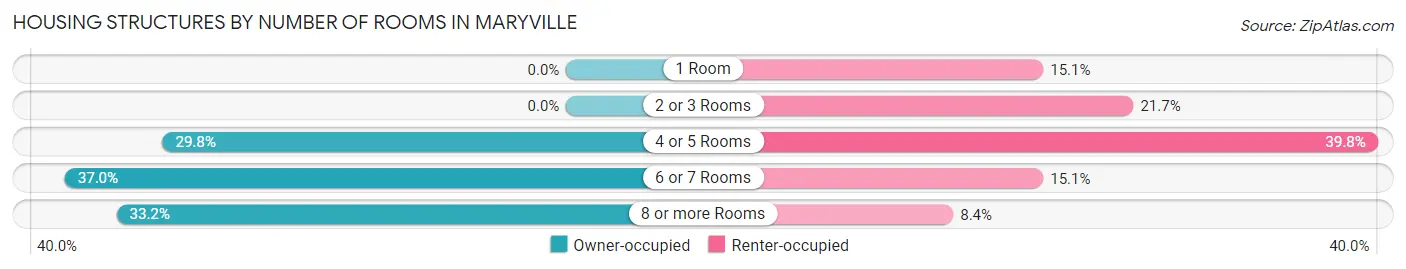
| Number of Rooms | Owner-occupied | Renter-occupied |
| 1 Room | 0 (0.0%) | 70 (15.0%) |
| 2 or 3 Rooms | 0 (0.0%) | 101 (21.7%) |
| 4 or 5 Rooms | 849 (29.8%) | 185 (39.8%) |
| 6 or 7 Rooms | 1,055 (37.0%) | 70 (15.0%) |
| 8 or more Rooms | 946 (33.2%) | 39 (8.4%) |
| Total | 2,850 (100.0%) | 465 (100.0%) |
Housing Structure by Heating Type in Maryville
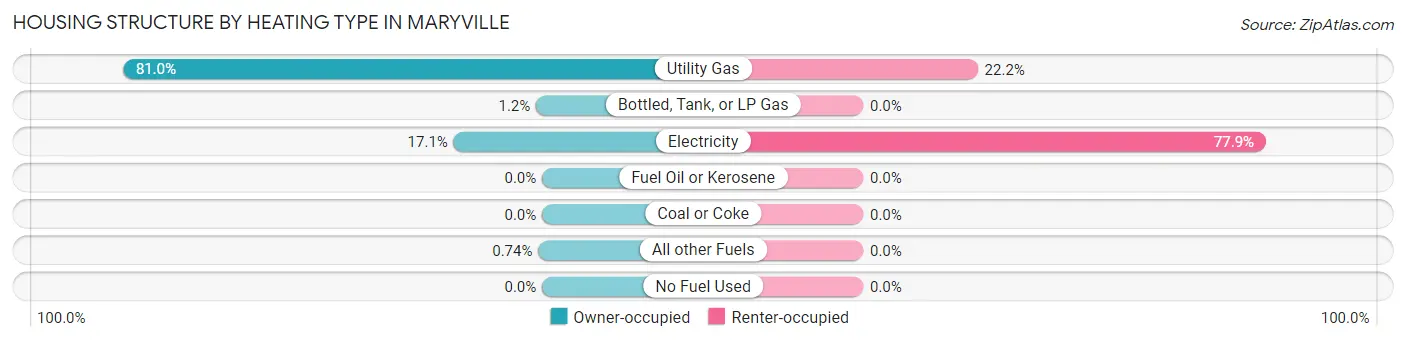
| Heating Type | Owner-occupied | Renter-occupied |
| Utility Gas | 2,309 (81.0%) | 103 (22.2%) |
| Bottled, Tank, or LP Gas | 33 (1.2%) | 0 (0.0%) |
| Electricity | 487 (17.1%) | 362 (77.8%) |
| Fuel Oil or Kerosene | 0 (0.0%) | 0 (0.0%) |
| Coal or Coke | 0 (0.0%) | 0 (0.0%) |
| All other Fuels | 21 (0.7%) | 0 (0.0%) |
| No Fuel Used | 0 (0.0%) | 0 (0.0%) |
| Total | 2,850 (100.0%) | 465 (100.0%) |
Household Vehicle Usage in Maryville
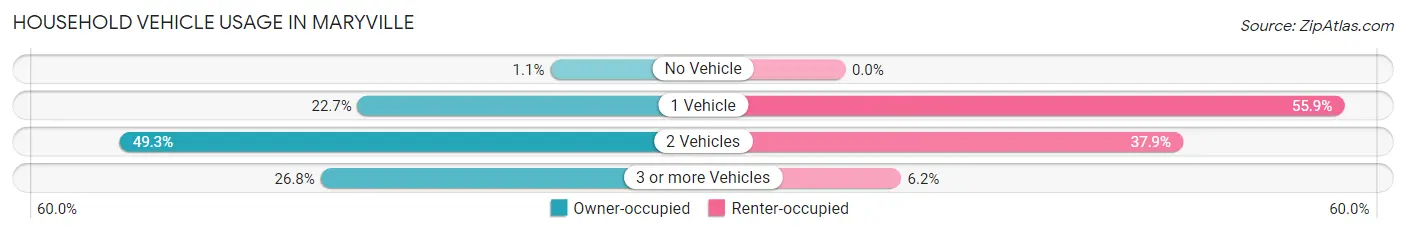
| Vehicles per Household | Owner-occupied | Renter-occupied |
| No Vehicle | 32 (1.1%) | 0 (0.0%) |
| 1 Vehicle | 647 (22.7%) | 260 (55.9%) |
| 2 Vehicles | 1,406 (49.3%) | 176 (37.9%) |
| 3 or more Vehicles | 765 (26.8%) | 29 (6.2%) |
| Total | 2,850 (100.0%) | 465 (100.0%) |
Real Estate & Mortgages in Maryville
Real Estate and Mortgage Overview in Maryville
| Characteristic | Without Mortgage | With Mortgage |
| Housing Units | 699 | 2,151 |
| Median Property Value | $233,300 | $242,200 |
| Median Household Income | $80,504 | $831 |
| Monthly Housing Costs | $723 | $88 |
| Real Estate Taxes | $4,855 | $0 |
Property Value by Mortgage Status in Maryville
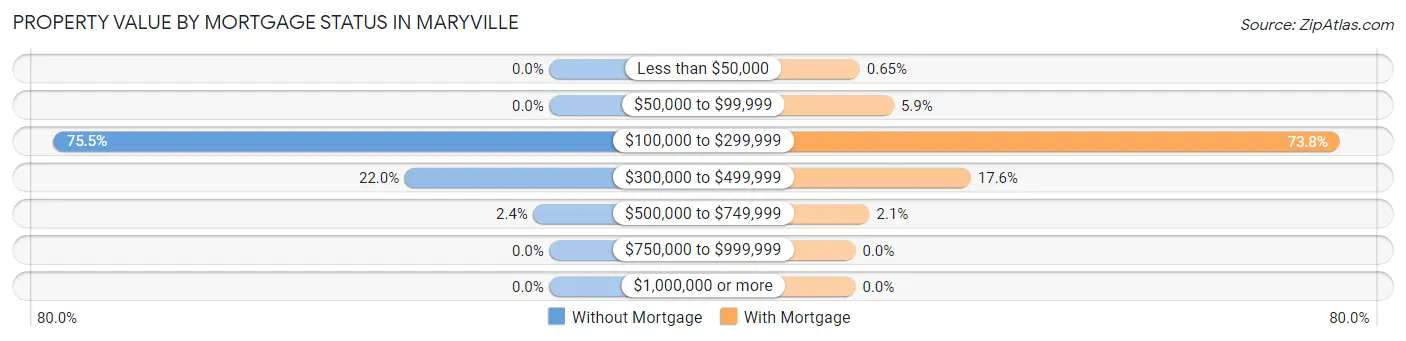
| Property Value | Without Mortgage | With Mortgage |
| Less than $50,000 | 0 (0.0%) | 14 (0.6%) |
| $50,000 to $99,999 | 0 (0.0%) | 126 (5.9%) |
| $100,000 to $299,999 | 528 (75.5%) | 1,587 (73.8%) |
| $300,000 to $499,999 | 154 (22.0%) | 378 (17.6%) |
| $500,000 to $749,999 | 17 (2.4%) | 46 (2.1%) |
| $750,000 to $999,999 | 0 (0.0%) | 0 (0.0%) |
| $1,000,000 or more | 0 (0.0%) | 0 (0.0%) |
| Total | 699 (100.0%) | 2,151 (100.0%) |
Household Income by Mortgage Status in Maryville
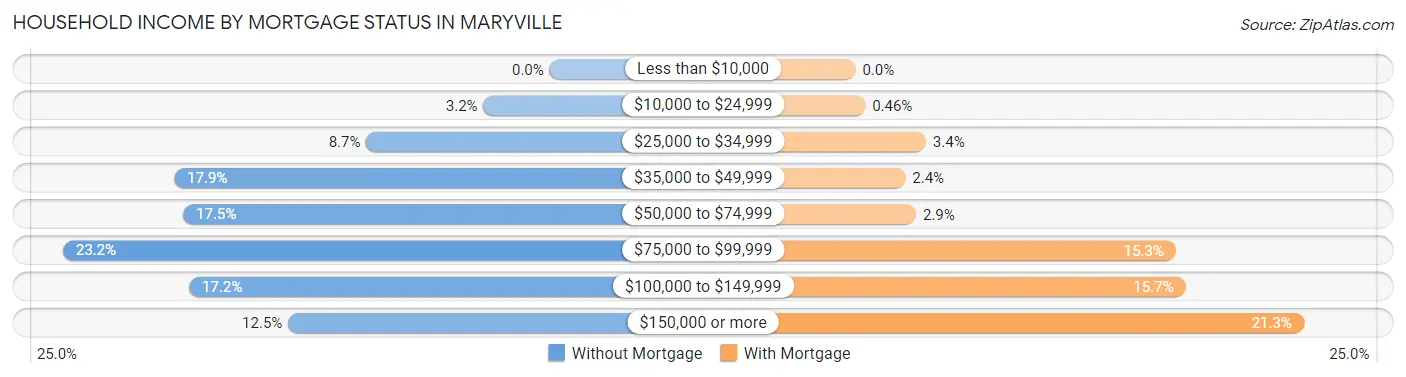
| Household Income | Without Mortgage | With Mortgage |
| Less than $10,000 | 0 (0.0%) | 0 (0.0%) |
| $10,000 to $24,999 | 22 (3.2%) | 10 (0.5%) |
| $25,000 to $34,999 | 61 (8.7%) | 72 (3.4%) |
| $35,000 to $49,999 | 125 (17.9%) | 51 (2.4%) |
| $50,000 to $74,999 | 122 (17.4%) | 62 (2.9%) |
| $75,000 to $99,999 | 162 (23.2%) | 328 (15.2%) |
| $100,000 to $149,999 | 120 (17.2%) | 338 (15.7%) |
| $150,000 or more | 87 (12.4%) | 459 (21.3%) |
| Total | 699 (100.0%) | 2,151 (100.0%) |
Property Value to Household Income Ratio in Maryville
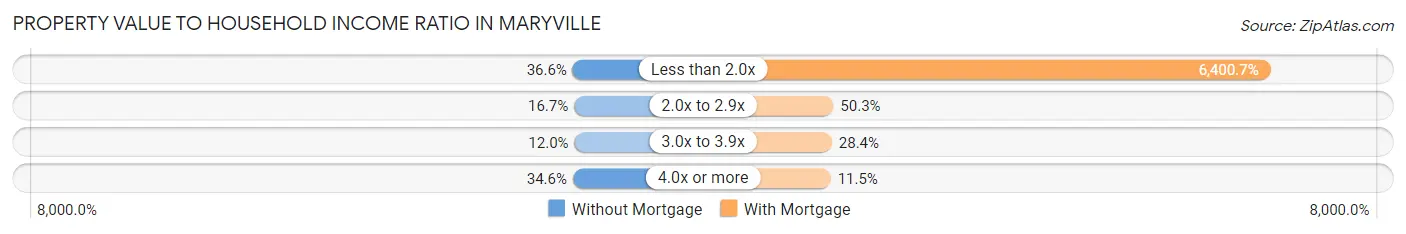
| Value-to-Income Ratio | Without Mortgage | With Mortgage |
| Less than 2.0x | 256 (36.6%) | 137,679 (6,400.7%) |
| 2.0x to 2.9x | 117 (16.7%) | 1,081 (50.3%) |
| 3.0x to 3.9x | 84 (12.0%) | 610 (28.4%) |
| 4.0x or more | 242 (34.6%) | 248 (11.5%) |
| Total | 699 (100.0%) | 2,151 (100.0%) |
Real Estate Taxes by Mortgage Status in Maryville
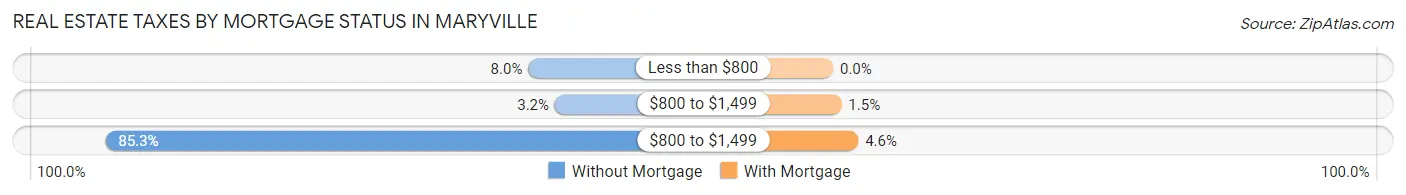
| Property Taxes | Without Mortgage | With Mortgage |
| Less than $800 | 56 (8.0%) | 0 (0.0%) |
| $800 to $1,499 | 22 (3.2%) | 33 (1.5%) |
| $800 to $1,499 | 596 (85.3%) | 99 (4.6%) |
| Total | 699 (100.0%) | 2,151 (100.0%) |
Health & Disability in Maryville
Health Insurance Coverage by Age in Maryville
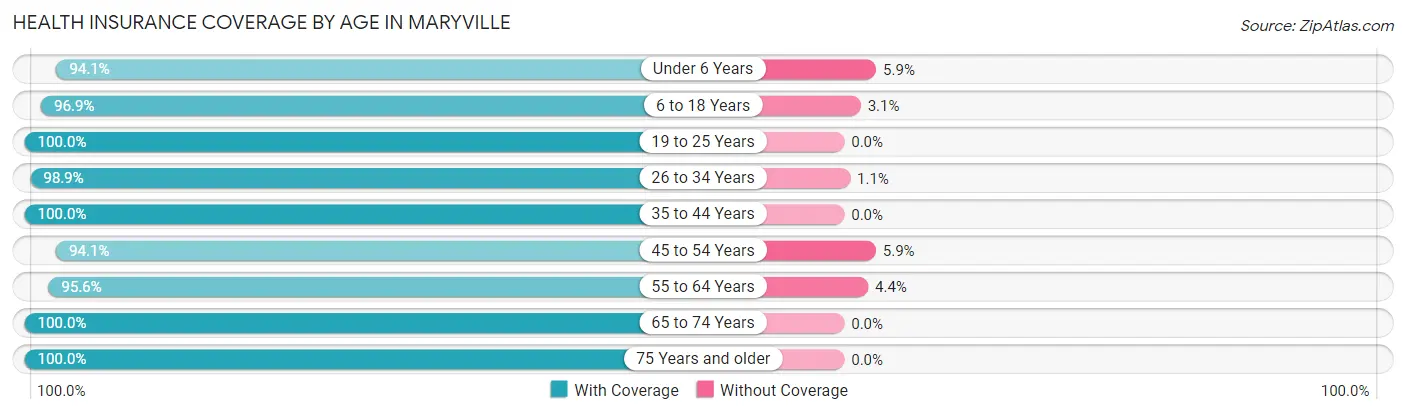
| Age Bracket | With Coverage | Without Coverage |
| Under 6 Years | 412 (94.1%) | 26 (5.9%) |
| 6 to 18 Years | 1,042 (96.9%) | 33 (3.1%) |
| 19 to 25 Years | 539 (100.0%) | 0 (0.0%) |
| 26 to 34 Years | 912 (98.9%) | 10 (1.1%) |
| 35 to 44 Years | 889 (100.0%) | 0 (0.0%) |
| 45 to 54 Years | 1,104 (94.1%) | 69 (5.9%) |
| 55 to 64 Years | 1,377 (95.6%) | 64 (4.4%) |
| 65 to 74 Years | 1,009 (100.0%) | 0 (0.0%) |
| 75 Years and older | 539 (100.0%) | 0 (0.0%) |
| Total | 7,823 (97.5%) | 202 (2.5%) |
Health Insurance Coverage by Citizenship Status in Maryville
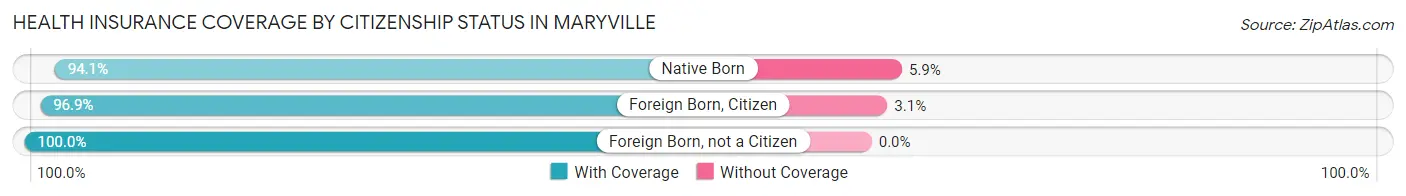
| Citizenship Status | With Coverage | Without Coverage |
| Native Born | 412 (94.1%) | 26 (5.9%) |
| Foreign Born, Citizen | 1,042 (96.9%) | 33 (3.1%) |
| Foreign Born, not a Citizen | 539 (100.0%) | 0 (0.0%) |
Health Insurance Coverage by Household Income in Maryville
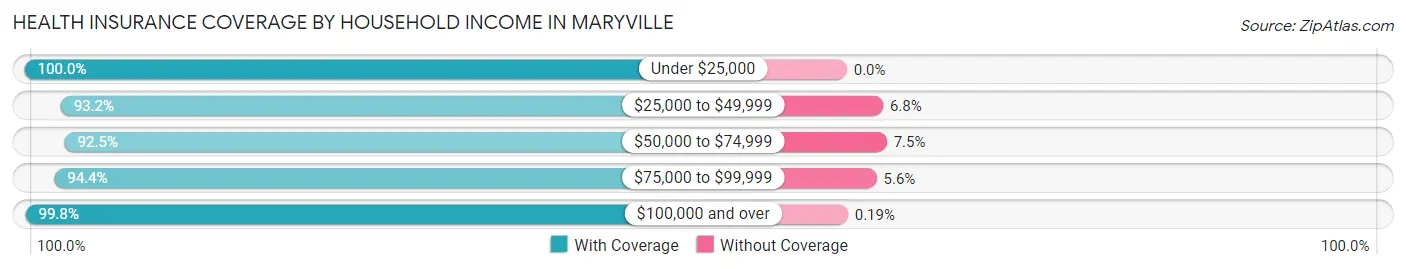
| Household Income | With Coverage | Without Coverage |
| Under $25,000 | 166 (100.0%) | 0 (0.0%) |
| $25,000 to $49,999 | 689 (93.2%) | 50 (6.8%) |
| $50,000 to $74,999 | 792 (92.5%) | 64 (7.5%) |
| $75,000 to $99,999 | 1,337 (94.4%) | 79 (5.6%) |
| $100,000 and over | 4,839 (99.8%) | 9 (0.2%) |
Public vs Private Health Insurance Coverage by Age in Maryville
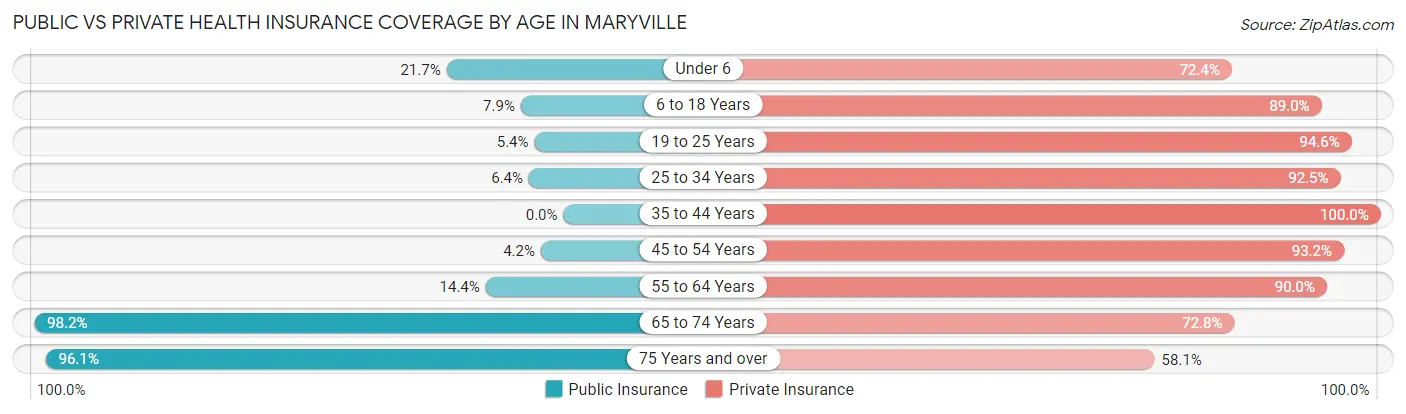
| Age Bracket | Public Insurance | Private Insurance |
| Under 6 | 95 (21.7%) | 317 (72.4%) |
| 6 to 18 Years | 85 (7.9%) | 957 (89.0%) |
| 19 to 25 Years | 29 (5.4%) | 510 (94.6%) |
| 25 to 34 Years | 59 (6.4%) | 853 (92.5%) |
| 35 to 44 Years | 0 (0.0%) | 889 (100.0%) |
| 45 to 54 Years | 49 (4.2%) | 1,093 (93.2%) |
| 55 to 64 Years | 208 (14.4%) | 1,297 (90.0%) |
| 65 to 74 Years | 991 (98.2%) | 735 (72.8%) |
| 75 Years and over | 518 (96.1%) | 313 (58.1%) |
| Total | 2,034 (25.4%) | 6,964 (86.8%) |
Disability Status by Sex by Age in Maryville
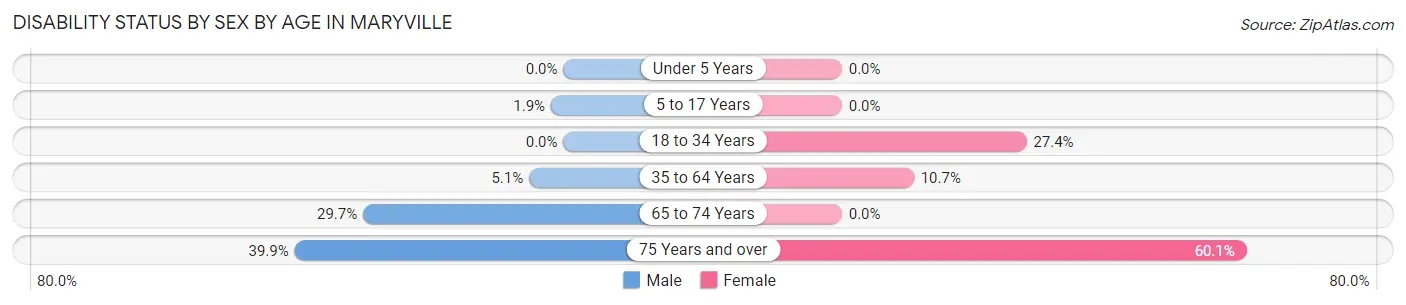
| Age Bracket | Male | Female |
| Under 5 Years | 0 (0.0%) | 0 (0.0%) |
| 5 to 17 Years | 10 (1.8%) | 0 (0.0%) |
| 18 to 34 Years | 0 (0.0%) | 227 (27.4%) |
| 35 to 64 Years | 92 (5.1%) | 181 (10.7%) |
| 65 to 74 Years | 124 (29.7%) | 0 (0.0%) |
| 75 Years and over | 85 (39.9%) | 196 (60.1%) |
Disability Class by Sex by Age in Maryville
Disability Class: Hearing Difficulty
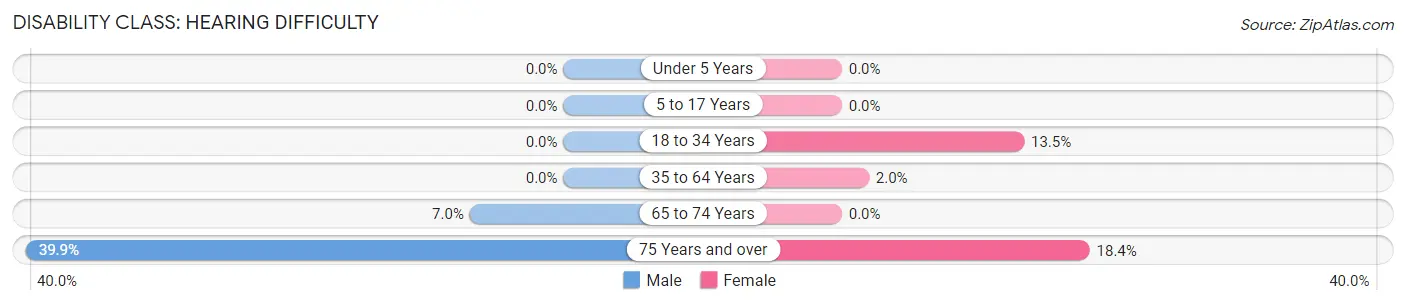
| Age Bracket | Male | Female |
| Under 5 Years | 0 (0.0%) | 0 (0.0%) |
| 5 to 17 Years | 0 (0.0%) | 0 (0.0%) |
| 18 to 34 Years | 0 (0.0%) | 112 (13.5%) |
| 35 to 64 Years | 0 (0.0%) | 34 (2.0%) |
| 65 to 74 Years | 29 (7.0%) | 0 (0.0%) |
| 75 Years and over | 85 (39.9%) | 60 (18.4%) |
Disability Class: Vision Difficulty
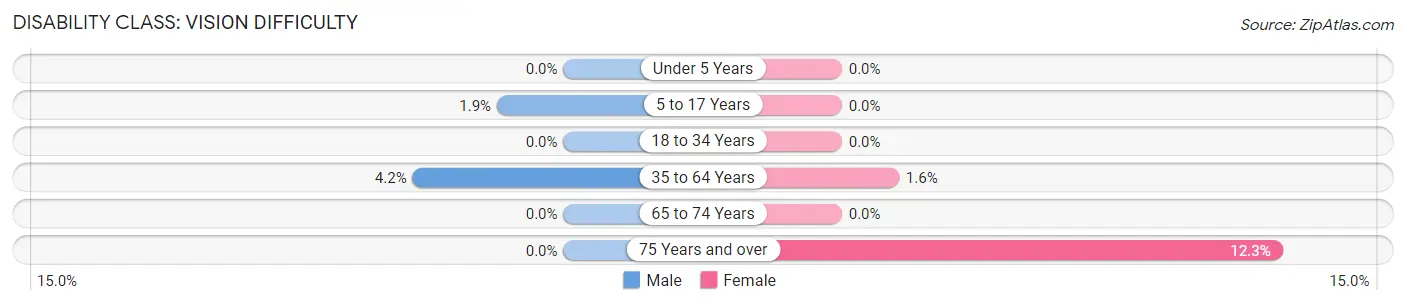
| Age Bracket | Male | Female |
| Under 5 Years | 0 (0.0%) | 0 (0.0%) |
| 5 to 17 Years | 10 (1.8%) | 0 (0.0%) |
| 18 to 34 Years | 0 (0.0%) | 0 (0.0%) |
| 35 to 64 Years | 76 (4.2%) | 27 (1.6%) |
| 65 to 74 Years | 0 (0.0%) | 0 (0.0%) |
| 75 Years and over | 0 (0.0%) | 40 (12.3%) |
Disability Class: Cognitive Difficulty
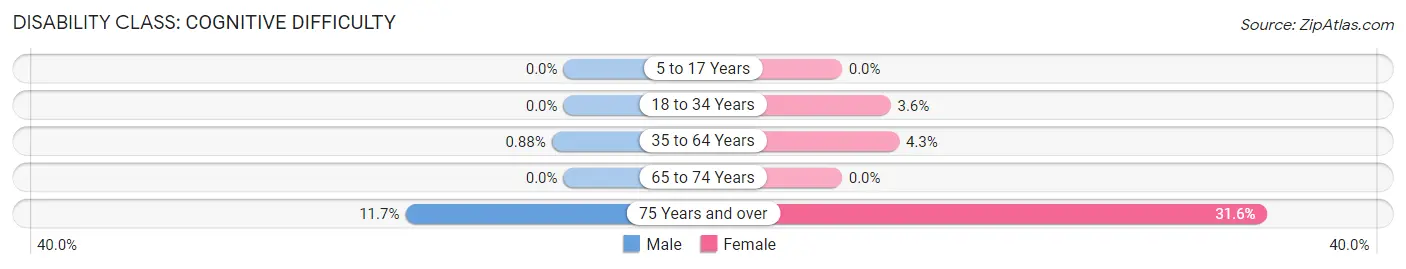
| Age Bracket | Male | Female |
| 5 to 17 Years | 0 (0.0%) | 0 (0.0%) |
| 18 to 34 Years | 0 (0.0%) | 30 (3.6%) |
| 35 to 64 Years | 16 (0.9%) | 72 (4.3%) |
| 65 to 74 Years | 0 (0.0%) | 0 (0.0%) |
| 75 Years and over | 25 (11.7%) | 103 (31.6%) |
Disability Class: Ambulatory Difficulty
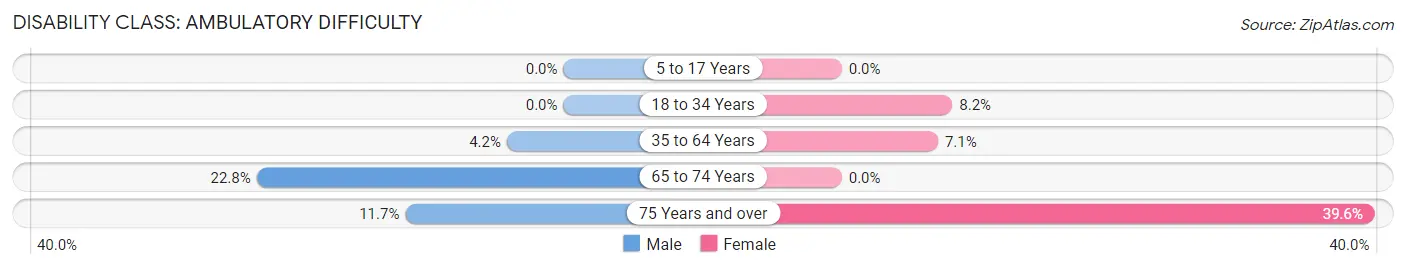
| Age Bracket | Male | Female |
| 5 to 17 Years | 0 (0.0%) | 0 (0.0%) |
| 18 to 34 Years | 0 (0.0%) | 68 (8.2%) |
| 35 to 64 Years | 76 (4.2%) | 121 (7.1%) |
| 65 to 74 Years | 95 (22.8%) | 0 (0.0%) |
| 75 Years and over | 25 (11.7%) | 129 (39.6%) |
Disability Class: Self-Care Difficulty
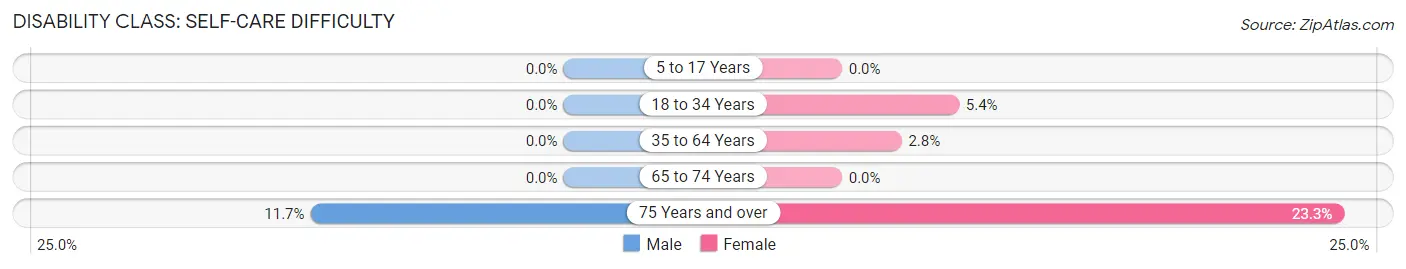
| Age Bracket | Male | Female |
| 5 to 17 Years | 0 (0.0%) | 0 (0.0%) |
| 18 to 34 Years | 0 (0.0%) | 45 (5.4%) |
| 35 to 64 Years | 0 (0.0%) | 47 (2.8%) |
| 65 to 74 Years | 0 (0.0%) | 0 (0.0%) |
| 75 Years and over | 25 (11.7%) | 76 (23.3%) |
Technology Access in Maryville
Computing Device Access in Maryville
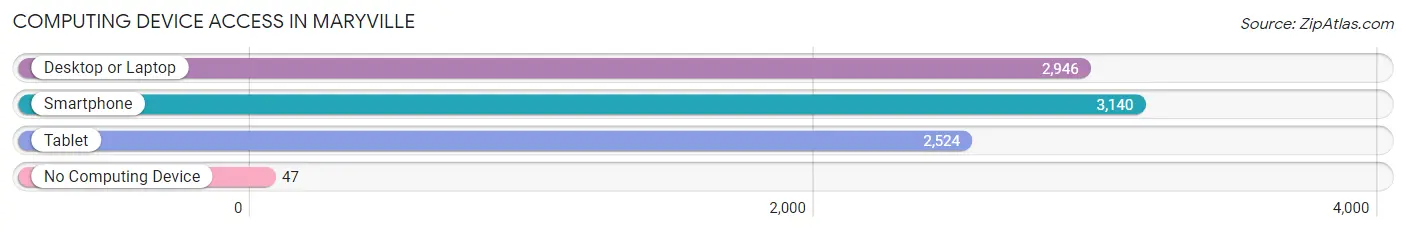
| Device Type | # Households | % Households |
| Desktop or Laptop | 2,946 | 88.9% |
| Smartphone | 3,140 | 94.7% |
| Tablet | 2,524 | 76.1% |
| No Computing Device | 47 | 1.4% |
| Total | 3,315 | 100.0% |
Internet Access in Maryville
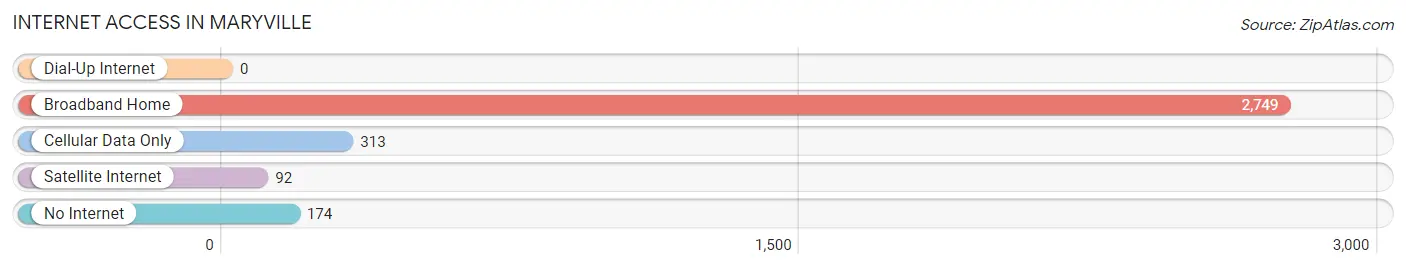
| Internet Type | # Households | % Households |
| Dial-Up Internet | 0 | 0.0% |
| Broadband Home | 2,749 | 82.9% |
| Cellular Data Only | 313 | 9.4% |
| Satellite Internet | 92 | 2.8% |
| No Internet | 174 | 5.2% |
| Total | 3,315 | 100.0% |
Maryville Summary
Maryville, Illinois is a small village located in Madison County, Illinois. It is situated on the banks of the Mississippi River, just north of St. Louis, Missouri. The village has a population of 8,717 as of the 2010 census.
History
Maryville was founded in 1818 by a group of settlers from Kentucky. The village was named after Mary, the mother of Jesus, and was originally known as Mary's Town. The village was incorporated in 1872.
In the late 19th century, Maryville was a thriving agricultural community. The village was home to several large farms, as well as a number of small businesses. The village was also home to a number of churches, including the First Presbyterian Church, which was founded in 1845.
In the early 20th century, Maryville began to experience a period of growth and development. The village was home to a number of factories, including a brickyard, a canning factory, and a flour mill. The village also had a number of stores, including a grocery store, a hardware store, and a drug store.
Geography
Maryville is located in Madison County, Illinois. The village is situated on the banks of the Mississippi River, just north of St. Louis, Missouri. The village is located in the Central Lowland region of the United States.
The village has a total area of 2.2 square miles, all of which is land. The village is located at an elevation of 590 feet above sea level.
Economy
The economy of Maryville is largely based on agriculture. The village is home to several large farms, as well as a number of small businesses. The village is also home to a number of factories, including a brickyard, a canning factory, and a flour mill.
The village is also home to a number of stores, including a grocery store, a hardware store, and a drug store. The village is also home to a number of restaurants, including a pizza parlor, a Chinese restaurant, and a Mexican restaurant.
Demographics
As of the 2010 census, Maryville had a population of 8,717. The racial makeup of the village was 97.3% White, 0.7% African American, 0.2% Native American, 0.4% Asian, 0.1% Pacific Islander, 0.4% from other races, and 0.9% from two or more races. Hispanic or Latino of any race were 1.7% of the population.
The median income for a household in the village was $50,945, and the median income for a family was $60,945. The per capita income for the village was $24,945. About 4.3% of families and 5.7% of the population were below the poverty line, including 7.2% of those under age 18 and 4.3% of those age 65 or over.
Common Questions
What is Per Capita Income in Maryville?
Per Capita income in Maryville is $49,346.
What is the Median Family Income in Maryville?
Median Family Income in Maryville is $143,114.
What is the Median Household income in Maryville?
Median Household Income in Maryville is $96,373.
What is Income or Wage Gap in Maryville?
Income or Wage Gap in Maryville is 21.9%.
Women in Maryville earn 78.1 cents for every dollar earned by a man.
What is Inequality or Gini Index in Maryville?
Inequality or Gini Index in Maryville is 0.35.
What is the Total Population of Maryville?
Total Population of Maryville is 8,219.
What is the Total Male Population of Maryville?
Total Male Population of Maryville is 3,865.
What is the Total Female Population of Maryville?
Total Female Population of Maryville is 4,354.
What is the Ratio of Males per 100 Females in Maryville?
There are 88.77 Males per 100 Females in Maryville.
What is the Ratio of Females per 100 Males in Maryville?
There are 112.65 Females per 100 Males in Maryville.
What is the Median Population Age in Maryville?
Median Population Age in Maryville is 48.3 Years.
What is the Average Family Size in Maryville
Average Family Size in Maryville is 3.0 People.
What is the Average Household Size in Maryville
Average Household Size in Maryville is 2.4 People.
How Large is the Labor Force in Maryville?
There are 4,465 People in the Labor Forcein in Maryville.
What is the Percentage of People in the Labor Force in Maryville?
65.2% of People are in the Labor Force in Maryville.
What is the Unemployment Rate in Maryville?
Unemployment Rate in Maryville is 6.3%.